1. Introduction
Natural ventilation through residential attics helps dissipating moisture and heat gains from roofs during summer time, and has been widely used in the United States [
1,
2,
3,
4]. In residential building construction and retrofitting, attic ventilation is usually measured by ventilation ratio, which refers to the net free vent area (unobstructed area where air can freely flow from outside to inside to outside) divided by the deck area of the attic space being ventilated. The building codes typically require a ventilation ratio of 1/150 for residential buildings, with a minimum of 1/300 in special cases [
3]. In these ventilation ratio requirements or recommendations, it is assumed that the intake and exhaust vent sizes are balanced,
i.e., roughly equal areas for intake vents and exhaust vents. Unbalanced ventilation occurs when the area of one type vent is significantly larger or smaller than that of the other type vent. In reality, constructed ventilation ratios can be quite different from the designed values, and designed vent balance often cannot be guaranteed, due to different construction methods and quality control issues in building construction or retrofitting. Therefore, it is important to know how these quality issues eventually affect the ventilation and energy performance of residential attics.
Although attic ventilation has been a long-term traditional practice, research on evaluating how variations in ventilation ratio and vent balance affect attic ventilation and energy performance is hardly found. The answer to these questions is important for practical applications in attic design and construction, including both new construction and retrofitting of energy efficient residential buildings.
In this study, a wide range of ventilation ratios combined with both balanced and unbalanced vent configurations is investigated to facilitate a parametric study. In addition, a sealed attic, as an extreme case of vanishing ventilation ratio, is simulated for the purpose of comparison. The simulation is based on buoyancy-driven turbulent ventilation with no wind factor considered, which can be considered as a worst-case scenario, because real attic ventilation is generally enhanced by winds.
The existing research on air flow and heat transfer in attic spaces can be divided into two categories. In the first category, sealed attic configuration is considered, and the problem is usually represented by natural convection in triangular enclosures. As reviewed by Kamiyo
et al. [
5] and by Saha and Khan [
6], a considerable number of experimental and numerical studies in this category (e.g., [
7,
8,
9,
10,
11,
12,
13,
14,
15,
16]) have been devoted to the analysis of flow and heat transfer under laminar conditions, while only a few studies (e.g., [
17,
18]) investigated turbulent flow and heat transfer, although the air flow in real residential attics is almost always turbulent.
The second category of attic air flow and heat transfer research concerned with vented attic configuration, which is more relevant to the realistic attic design and construction. Published studies in this category are quite limited in the literature. For example, Medina
et al. [
19,
20] proposed a correlation-based mathematical model for vented residential attics and compared model predictions with experimental data, and Moujaes and Alsaiegh [
21] employed a finite element model to simulate the thermal effects of placing a radiant barrier system inside a vented residential attic for a case study under summer weather conditions. Recently, we reported CFD modeling results of buoyancy-driven turbulent attic ventilation under winter conditions [
22].
In this paper, in order to account for a wide range of ventilation ratios, the buoyancy-driven air flow and natural convection heat transfer are modeled by the
k-kl-ω model [
23], which is a physics-based transitional turbulence model capable of modeling turbulent flows from laminar-turbulent transitional regime to fully turbulent regime. Since the steady solutions could not always converge, even after carefully adjusting the various under-relaxation factors, an unsteady numerical formulation is adopted in the study. Previous studies for natural convection flows in enclosures [
24,
25,
26,
27] have shown the effectiveness of the unsteady Reynolds-averaged Navier-Stokes (URANS) modeling as an approach to overcome numerical stiffness and improve solution convergence. The URANS approach is also a recommended strategy in commercial CFD manuals [
28] for solving natural convection problems. In the following sections, the numerical model will be introduced first, followed by detailed presentation and discussion of the modeling results.
2. Numerical Model
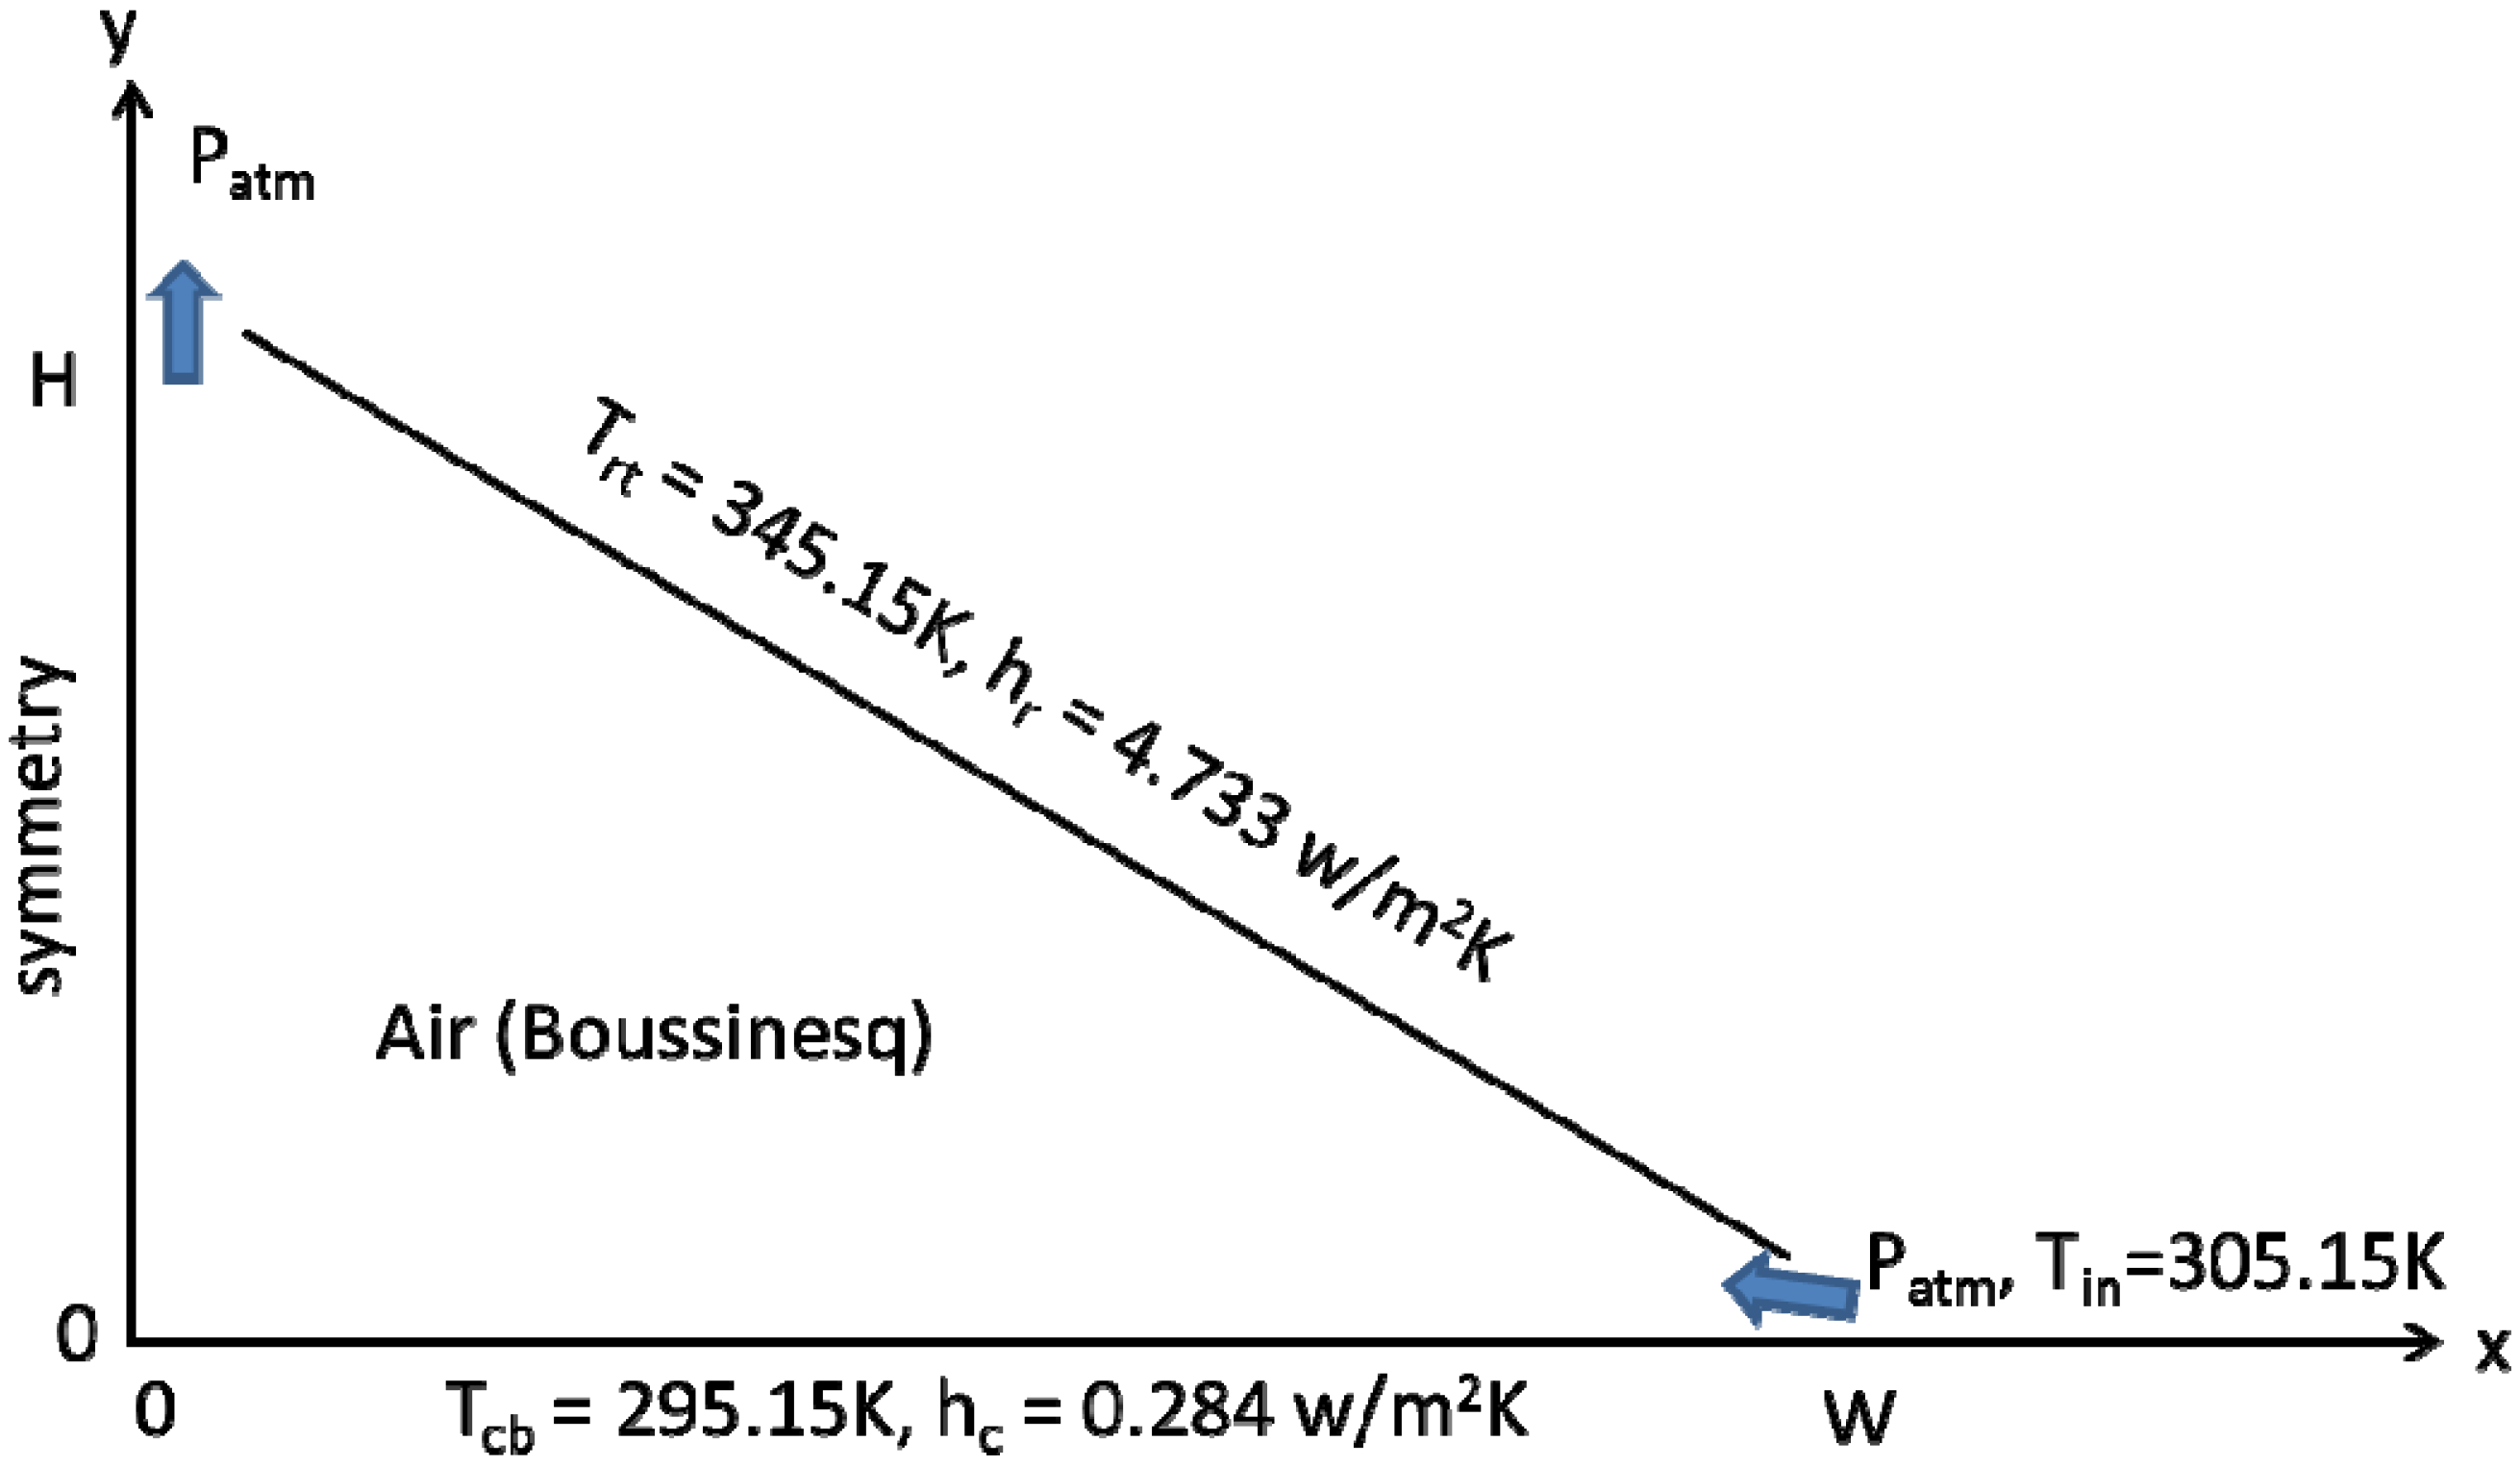
Figure 1 shows a schematic diagram of a cross-section plan of the physical model adopted in this study. In the direction perpendicular to the cross-sectional shown in
Figure 1, it is assumed that the building is long enough to ignore the effects of the gable-end walls, and thus the problem may be reasonably simplified to be two-dimensional. The modeled attic space is in a shape of an isosceles triangle, with a ceiling width of 2
W and a height of
H, resulting in a pitch of
H/
W. Due to the buoyancy stableness of the summertime attic ventilation as well as the symmetry in both geometry and boundary conditions, only the right half of attic is included in the computational domain.
In this study, the modeled attic is assumed to have a fixed ceiling half-width of W = 4 m and a height of H = 1.67 m, corresponding to a roof pitch of 5/12 and a pitch angle of 22.62°. For simplicity, neither roof nor ceiling trusses are included in the model, and the computational domain is only occupied by air, which is assumed to be a Boussinesq fluid with a reference temperature T0 specified to the outside ambient air temperature to correctly calculate the buoyancy effects. In all the cases reported in this study, T0 = 305.15 K is assumed, and the pressures at the soffit and ridge vents are specified to be zero gauge pressure. Therefore, the obtained air flow is purely driven by the thermally induced buoyancy forces, i.e., the stack effect. At the soffit vent, the inlet air is assumed to enter at an ambient temperature of 305.15 K and a turbulent intensity of 1%.
Figure 1.
Schematic of the computational domain and boundary conditions [
29].
Figure 1.
Schematic of the computational domain and boundary conditions [
29].
Convection-type boundary conditions are applied to both the ceiling and roof boundaries, in order to correctly account for the thermal resistances of the ceiling and roof, which are excluded from the computational domain. For example, energy balance across the ceiling thickness gives:
where
Tcb and
Tct are the temperatures at the ceiling-bottom and ceiling-top, respectively; and the heat transfer coefficient
hc is determined by the thermal conductivity of ceiling material
λc divided by ceiling thickness
tc. In this study, the ceiling-bottom temperature is kept at
Tcb = 295.15 K, while
hc = 0.284 W/m
2K is adopted to approximate a ceiling insulation level of R-20. Similarly, a roof-top temperature of
Trt = 345.15 K and a heat transfer coefficient of
hr = 4.733 W/m
2K (equivalent to an insulation level of R-1.2) are specified to the roof boundary to simulate a condition of a 3 cm plywood roof. The roof-top temperature of
Trt = 345.15 K specified in this study is corresponding to a typical peak roof temperature in summer days at several geographical regions in the United States, as evident in field measurements [
4,
30,
31] and modeling predictions [
21]. More discussions on the bases for the parameters chosen in the simulation can be found in [
22], while the impacts of roof pitch and ceiling insulation on attic cooling load were reported in [
29].
Following the URANS approach to turbulence, the time-averaged air velocity (
ui), pressure (
p), and temperature (
T) distributions in the attic space shown in
Figure 1 are governed by the following continuity, momentum, and energy equations:
where density
ρ; kinetic viscosity
ν; thermal expansion coefficient
β; and thermal diffusivity
α are air properties; while fluctuating kinetic energy
k, eddy viscosity
vT, and eddy thermal diffusivity
αθ are determined by the employed turbulence model. In Equations (3,4), the substantial derivative terms include unsteady terms (partial derivative with respective to time) that account for all unsteadiness that does not belong to the turbulence,
i.e., the unsteadiness that is not represented by the turbulence model [
25].
The turbulence model employed in this study is the
k-kl-ω transition model [
23], which is an eddy-viscosity turbulence model based on the
k-ω framework and includes laminar kinetic energy to represent the pretransitional fluctuations in boundary layers. Additional information about the
k-kl-ω transition model can be found in [
23].
The governing equations formulated above are solved by the commercial CFD software Ansys Fluent 13.0 [
28], with the space variables being discretized by the finite volume method and time domain discretized by the fully implicit scheme. The pressure and velocity coupling is solved by the coupled algorithm with the second order scheme for pressure. The third-order MUSCL scheme [
28] is adopted for the discretization of all the variables other than pressure. Non-uniform triangular grids are employed, and the boundaries are inflated with nodes tightly clustered near the walls to ensure that the
y+ value for the first grid close to the walls is everywhere less than 1, in order to best capture the details of boundary layers, including the viscous sublayer which typically has a thickness of
y+ ~ 10. The numerical model employed in this paper is validated through grid and time step dependence tests as well as detailed comparison to previous experimental and large eddy simulation results of a benchmark problem of mixed turbulent convection in a square cavity [
32,
33,
34], as reported in [
29], where the same numerical model is employed to investigate the effects of roof pitch and ceiling insulation on attic cooling load and air flow.
The modeling results presented in this paper are based on grids consisting of about 30,000 nodes and a time step size of 1 s. All the calculations start from initial conditions of zero velocity and uniform temperature. Within each time step, 20 iterations are executed. Numerical experiments show that decreasing the time step to 0.5 s or requiring 40 iterations in each time step generate negligible difference in solutions. In addition, it is shown that refinement of the grids by doubling the node numbers results in less than 2% difference in the total mass flow rate and wall heat transfer rate results. Therefore, the obtained numerical results are grid independent with a discretization error estimated to be around 2%.
3. Results and Discussion
In order to facilitate a parametric study of the effects of ventilation ratio and vent balance on the ventilating air flow rate and cooling load, a total of 21 vented attic cases are investigated, covering seven ventilation ratios: 1/400, 1/200, 1/133, 1/100, 1/67, 1/50, and 1/25. For each ventilation ratio, three cases are simulated. In the first case, balanced vent areas are assumed,
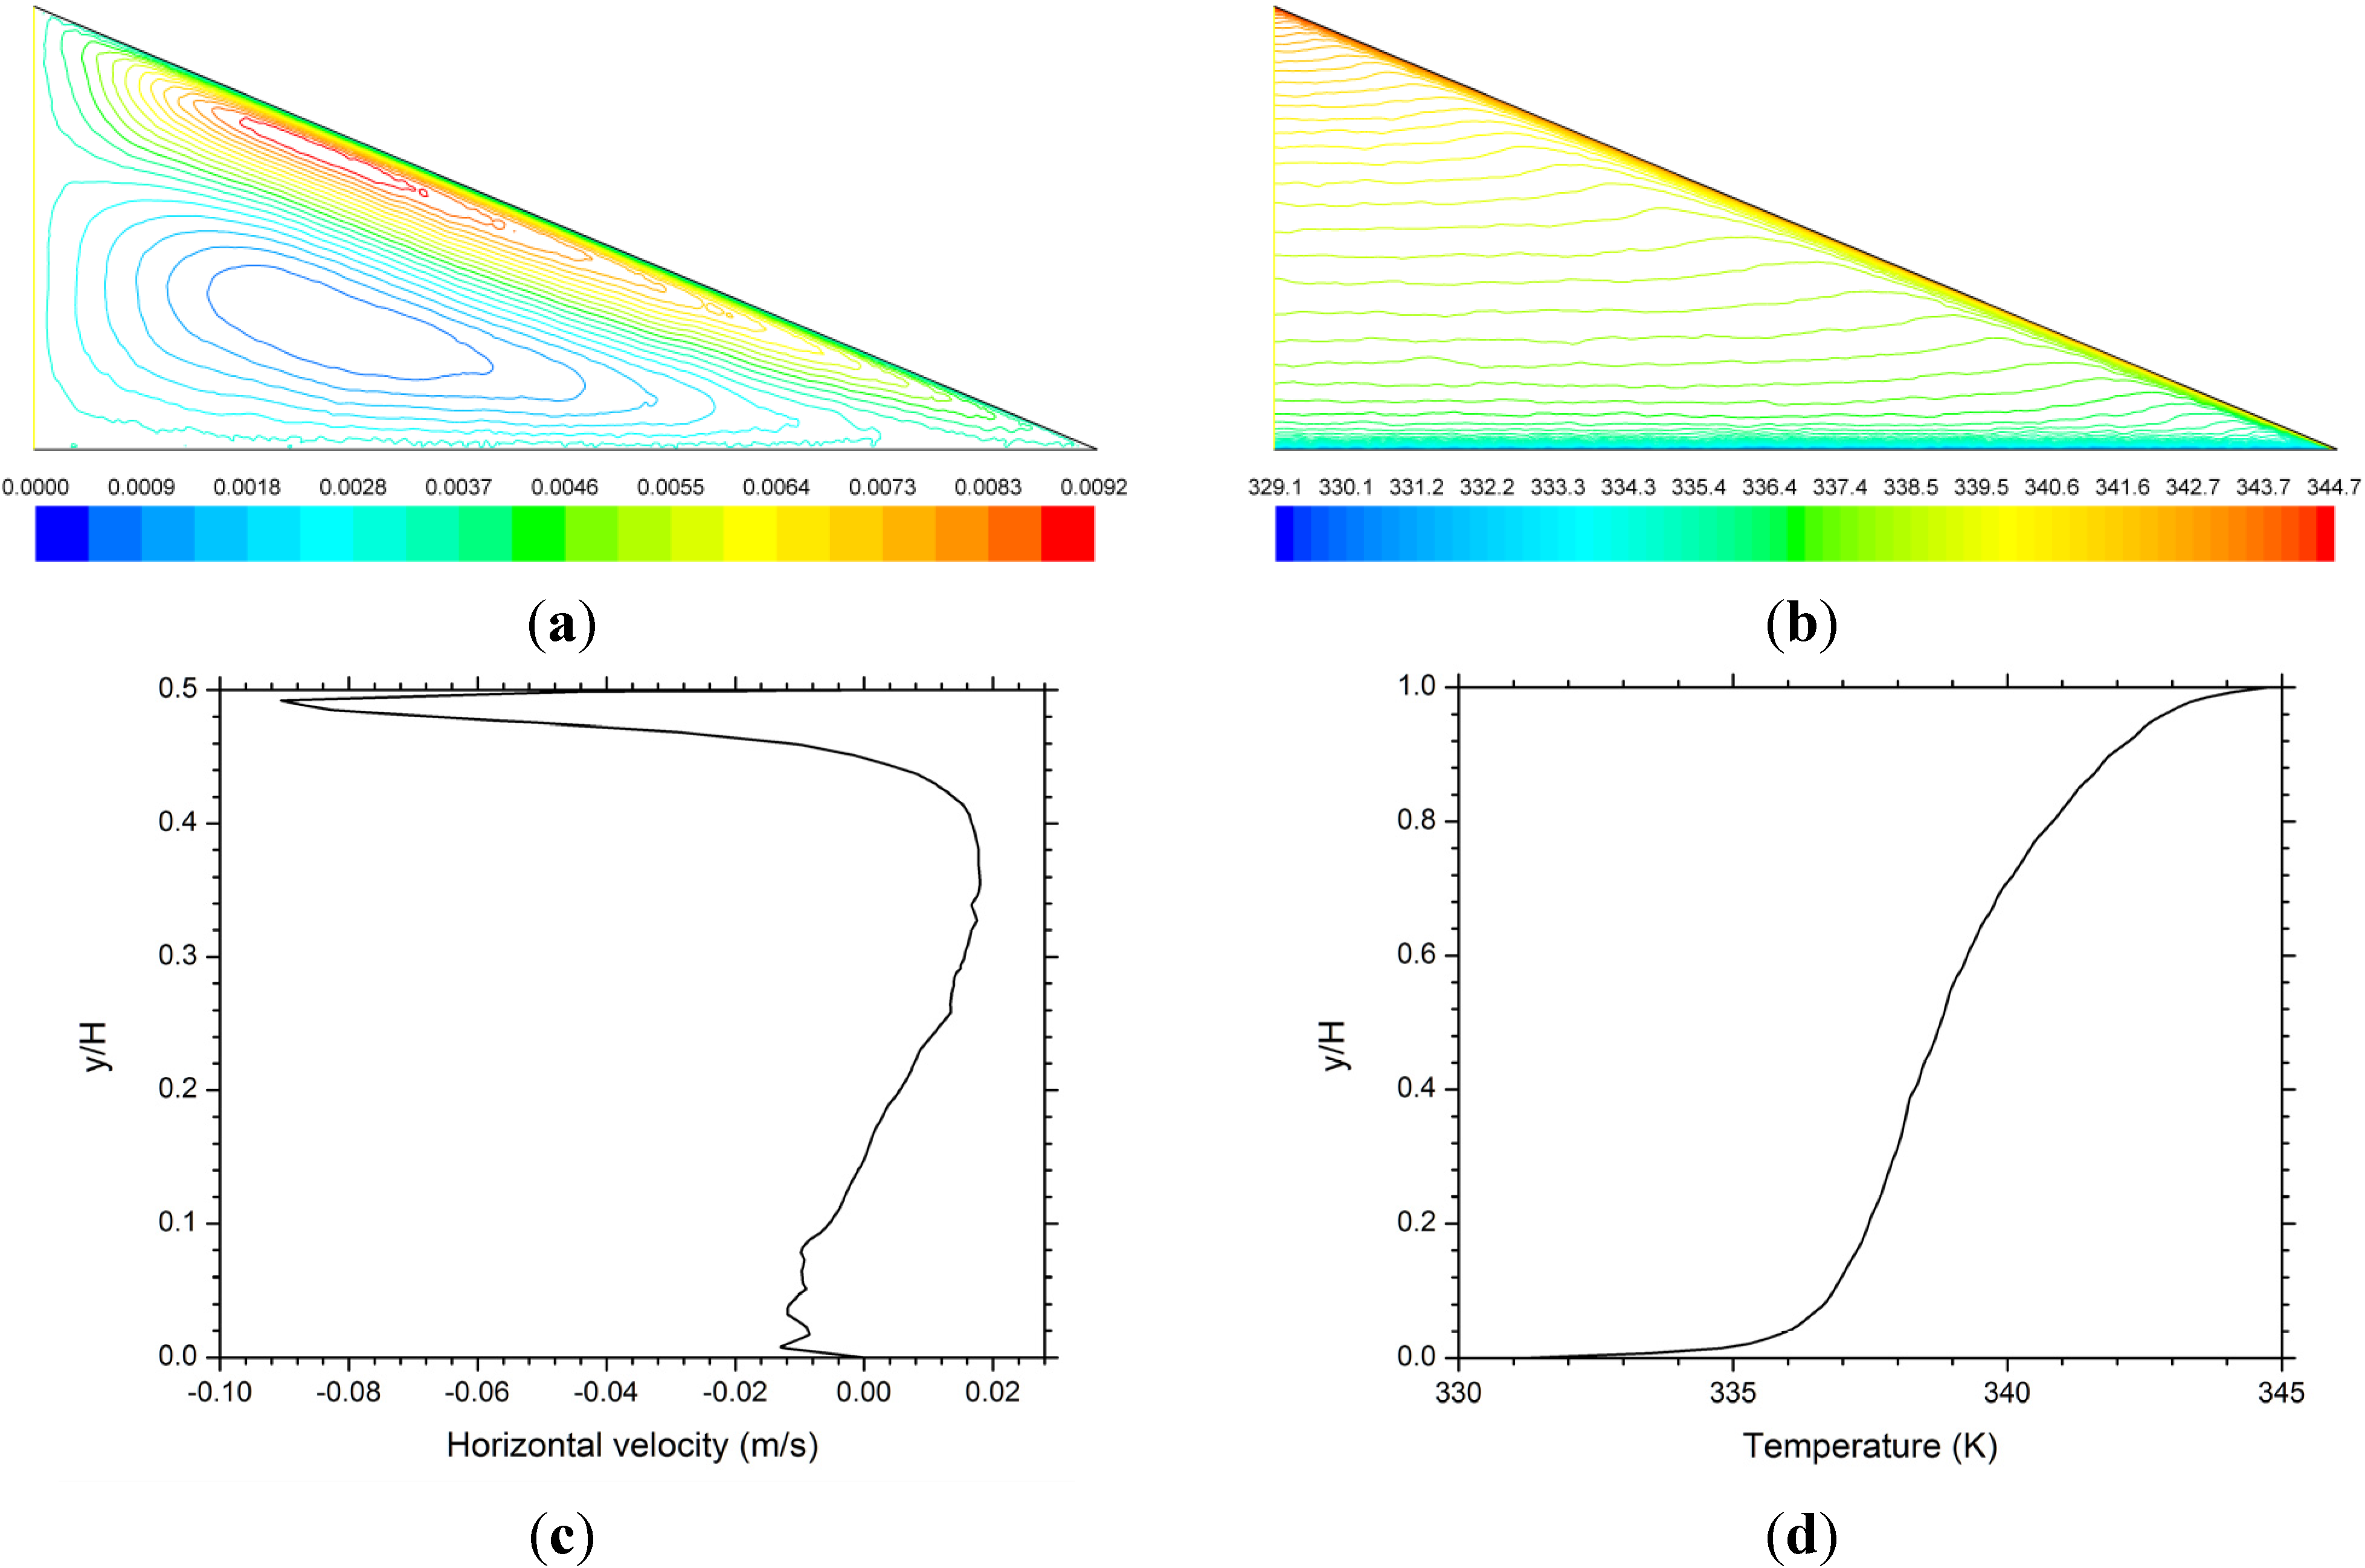
i.e., the ridge vent has a same size as the soffit vent. In the second and third cases, unbalanced vent configurations are considered by specifying the ridge vent to be half or double, respectively, the size of the soffit vent. In addition, a sealed attic, as an extreme case of vanishing ventilation ratio, is simulated so that a direct comparison between the sealed attic case and a vented attic case readily shows the importance of attic ventilation. For all the cases investigated, the simulation converges to a steady solution after ~3500 time steps. The numerical results for the sealed attic case are shown in
Figure 2.
Figure 2.
Numerical results for the sealed attic case: (a) streamlines (in kg/m s); (b) isotherms (in K); (c) horizontal velocity profile along the vertical line x = 2 m; and (d) temperature profile along the symmetric line x = 0.
Figure 2.
Numerical results for the sealed attic case: (a) streamlines (in kg/m s); (b) isotherms (in K); (c) horizontal velocity profile along the vertical line x = 2 m; and (d) temperature profile along the symmetric line x = 0.
The turbulent air flow in the sealed attic is dominated by two convection cells (
Figure 2a). Air flow in the top cell along the roof is counterclockwise and associated with a stronger vortex (as manifested by a greater number of streamlines in a narrower space), as compared to the underlying clockwise swirling cell. The predicted temperature field (
Figure 2b) is characterized by a combination of thermal boundary layers developed along the roof and ceiling boundaries and thermal stratification occupying most of the attic space. The horizontal velocity profile along
x = 2 m (
Figure 2c) indicates that the air flow in the roof boundary layer has a much higher peak velocity than that in the ceiling boundary layer. This is mainly caused by the roof slope, which allows the buoyancy forces to develop and drive the air flow, as compared to the horizontal ceiling, along which buoyancy forces cannot build horizontal gradient and the air flow is purely driven by pressure difference. The temperature profile along the symmetric line
x = 0 (
Figure 2d) clearly shows the great temperature gradients associated with the roof and ceiling thermal boundary layers. It is also clear from
Figure 2d that the top portion of the temperature profile, corresponding to the height range of the top convection cell, has a greater temperature gradient than the lower portion, which belongs to the lower convection cell. This is consistent with the fact that the top cell is associated with a stronger vortex.
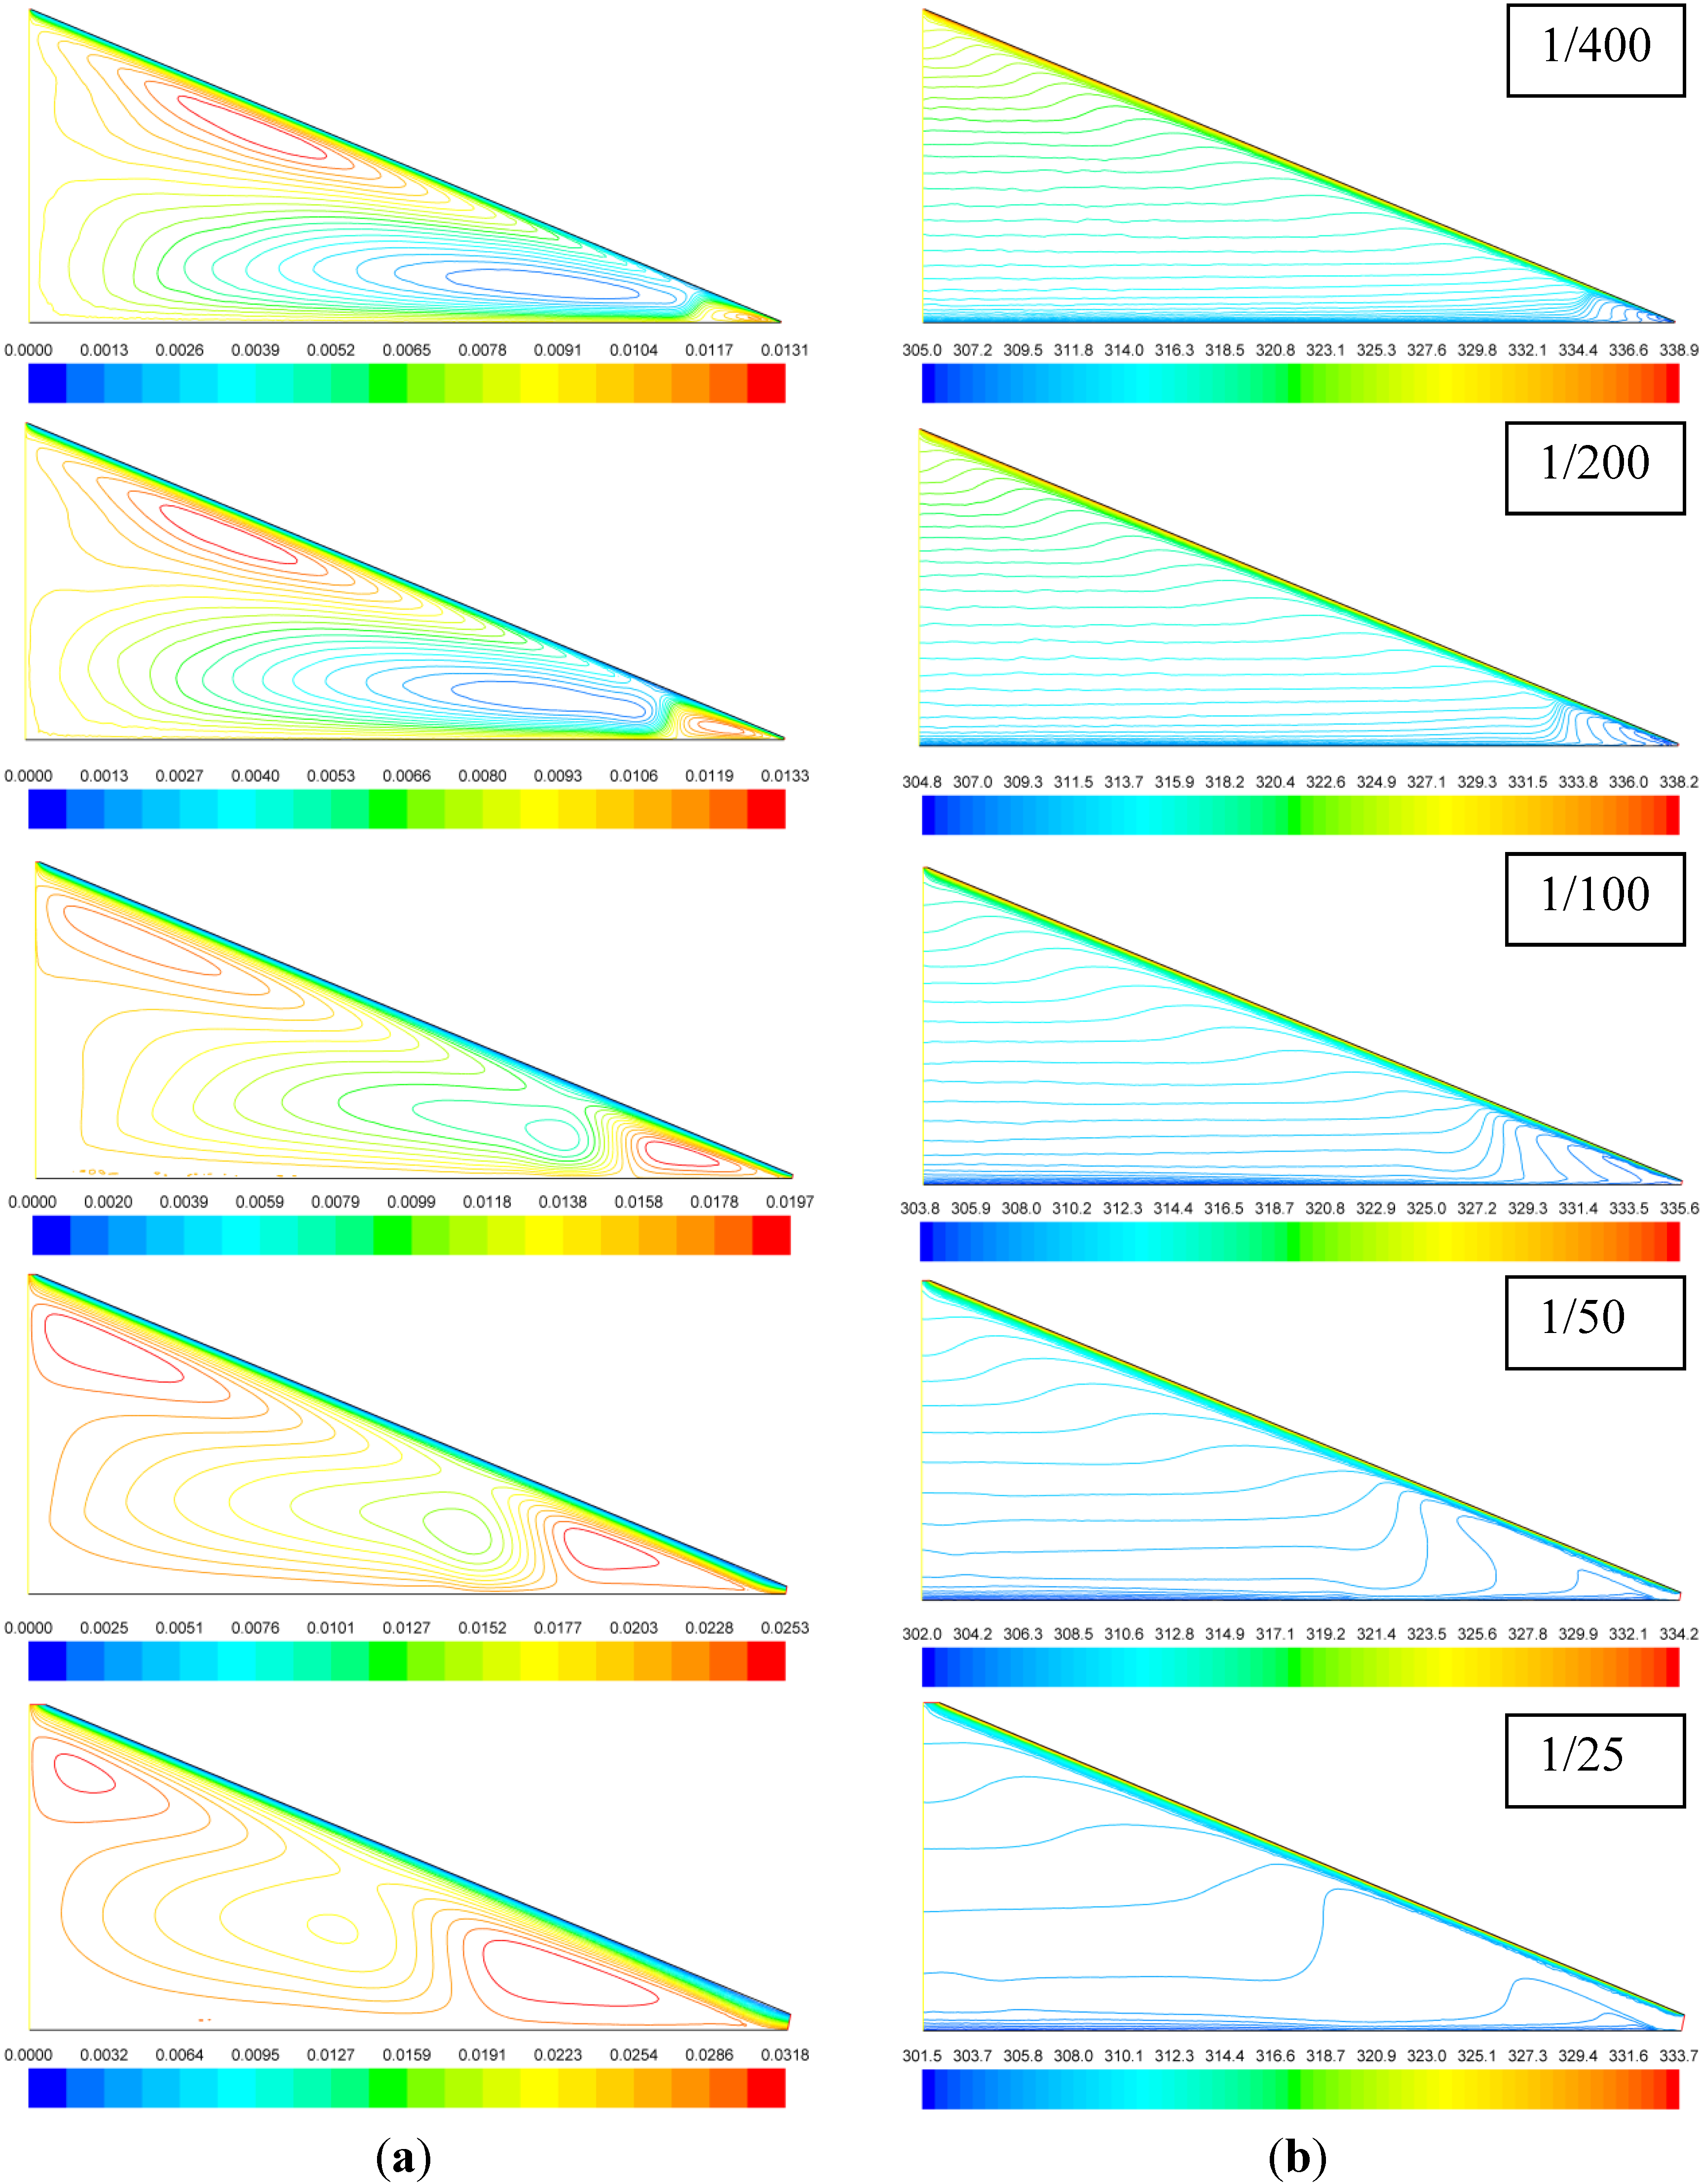
Figure 3 shows the predicted velocity and temperature distributions for balanced attic ventilation.
Figure 3.
Predicted (a) streamlines (in kg/m s) and (b) isotherms (in K) for attics with balanced ridge and soffit vents at various ventilation ratios.
Figure 3.
Predicted (a) streamlines (in kg/m s) and (b) isotherms (in K) for attics with balanced ridge and soffit vents at various ventilation ratios.
The streamlines in
Figure 3 indicate that the general pattern of the flow field is qualitatively independent of the ventilation ratio variation. For all the ventilation ratio cases, the outside air enters from the soffit vent, travels along the roof bottom for a portion of the roof length, and then follows two different paths. The mainstream of the ventilating air continues traveling along the roof bottom and leaves the attic from the ridge vent, while a portion of the ventilating air travels a “detoured” zigzag path bounded by three convection cells: a counterclockwise swirling cell near the soffit, a clockwise one occupying more than half of the attic space, and another counterclockwise one under the top portion of the roof. The size, location, and vortex intensity of the cells, however, are strong functions of ventilation ratio. The following observations can be made from
Figure 3. First, the velocity and mass flow rate of the mainstream air flow along the roof increase with the ventilation ratio. Second, the detoured portion of ventilating air flow and its vortex intensity decease (as reflected by the reduced number of streamlines associated with the convections cells) along with the increase in ventilation ratio. Finally, as the ventilation ratio increases, all the three convection cells move left (towards the attic center), while the soffit cell increases in size and the top roof cell deceases in size. The temperature distributions shown in
Figure 3 indicate that for all the ventilation ratio cases, the thermal boundary layers develop along both the roof and ceiling boundaries, and the attic space is dominated by thermal stratification, except for the soffit region. In addition, it is clear that along with the increase in ventilation ratio, the temperature distribution inside the attic space tends to be more uniform.
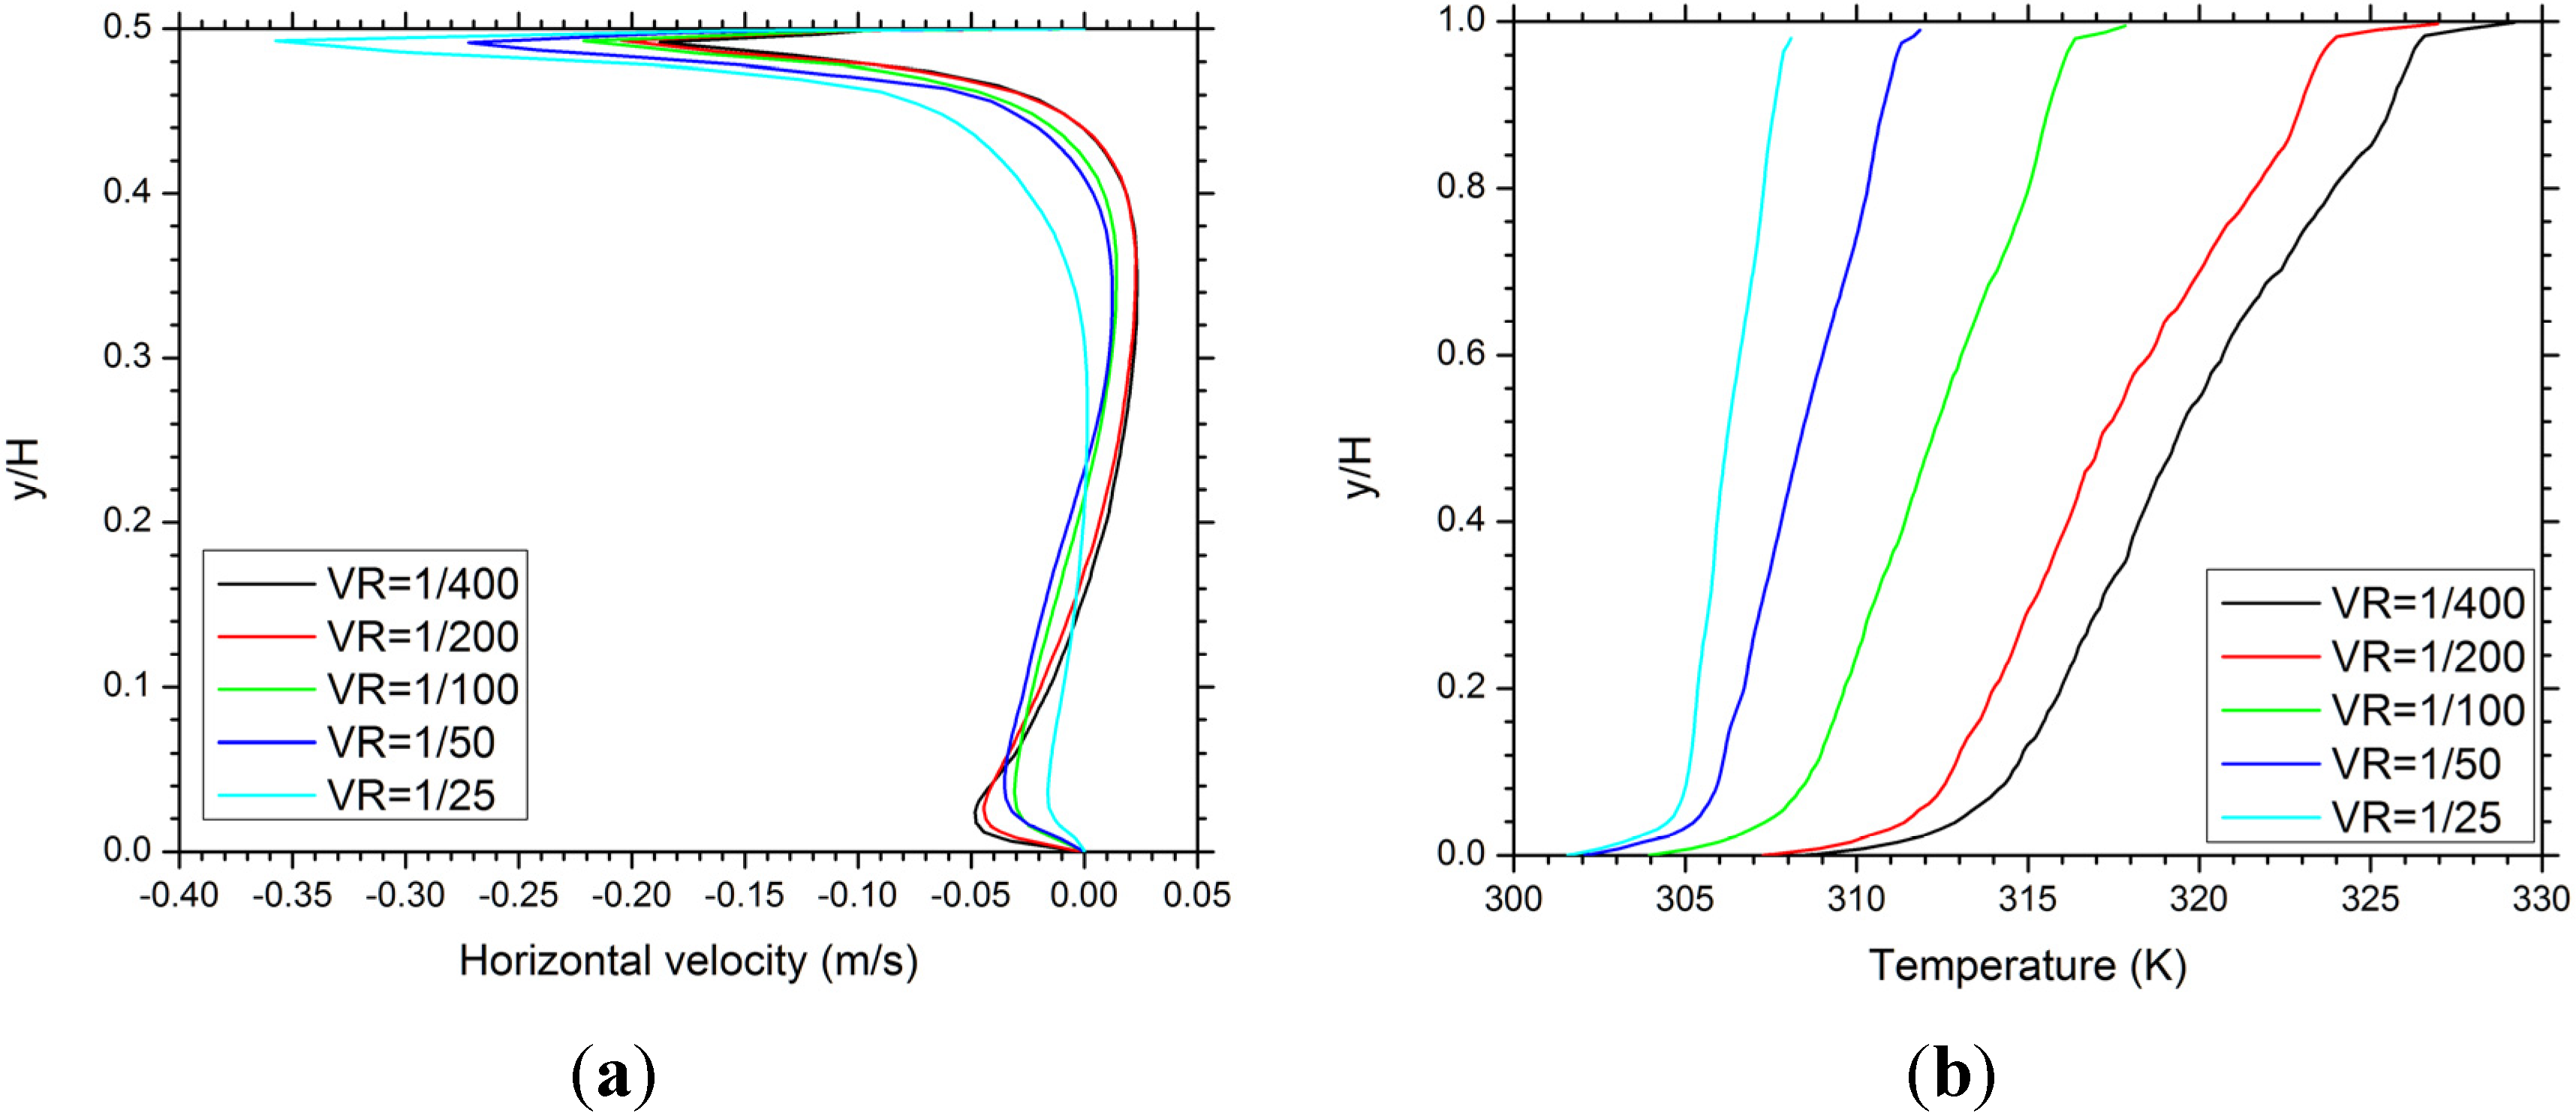
The predicted horizontal velocity profiles along the vertical line
x = 2 m for the balanced ventilation cases are shown in
Figure 4a. For each ventilation ratio case, since the vertical line cuts through one or two convection cells, the horizontal velocity changes directions at corresponding heights accordingly. The velocity peak under the roof is associated with the mainstream ventilating air flow and increases with the ventilation ratio. For all the cases shown in
Figure 4a, the mainstream has a much higher velocity, as compared to that of the circulating air inside the sealed attic (
Figure 2c).
Figure 4.
Predicted profiles of (a) horizontal velocity along the vertical line x = 2 m; and (b) temperature along the symmetric line x = 0 for attics with balanced ridge and soffit vents at various ventilation ratios.
Figure 4.
Predicted profiles of (a) horizontal velocity along the vertical line x = 2 m; and (b) temperature along the symmetric line x = 0 for attics with balanced ridge and soffit vents at various ventilation ratios.
The predicted temperature profiles along the symmetric line
x = 0 for the balanced ventilation cases are shown in
Figure 4b. For all the ventilation ratio cases, the temperature increases almost linearly with
y/
H, except in the regions near the ceiling and the ridge vent, where much greater temperature gradients indicate the effects of the ceiling and roof thermal boundary layers. It is also clear from the figure that both the average attic temperature and the temperature gradient decrease with the increase of ventilation ratio from 1/400 to 1/25. Such a trend can also be extended to include the sealed attic case shown in
Figure 2d, which is associated with a much higher average attic temperature and a much greater temperature gradient, as compared to the vented attic cases. These findings suggest that increasing ventilation ratio provides an effective way to reduce the cooling load of an attic.
A comparison between balanced attic ventilation and unbalanced attic ventilation is provided in
Figure 5 and
Figure 6.
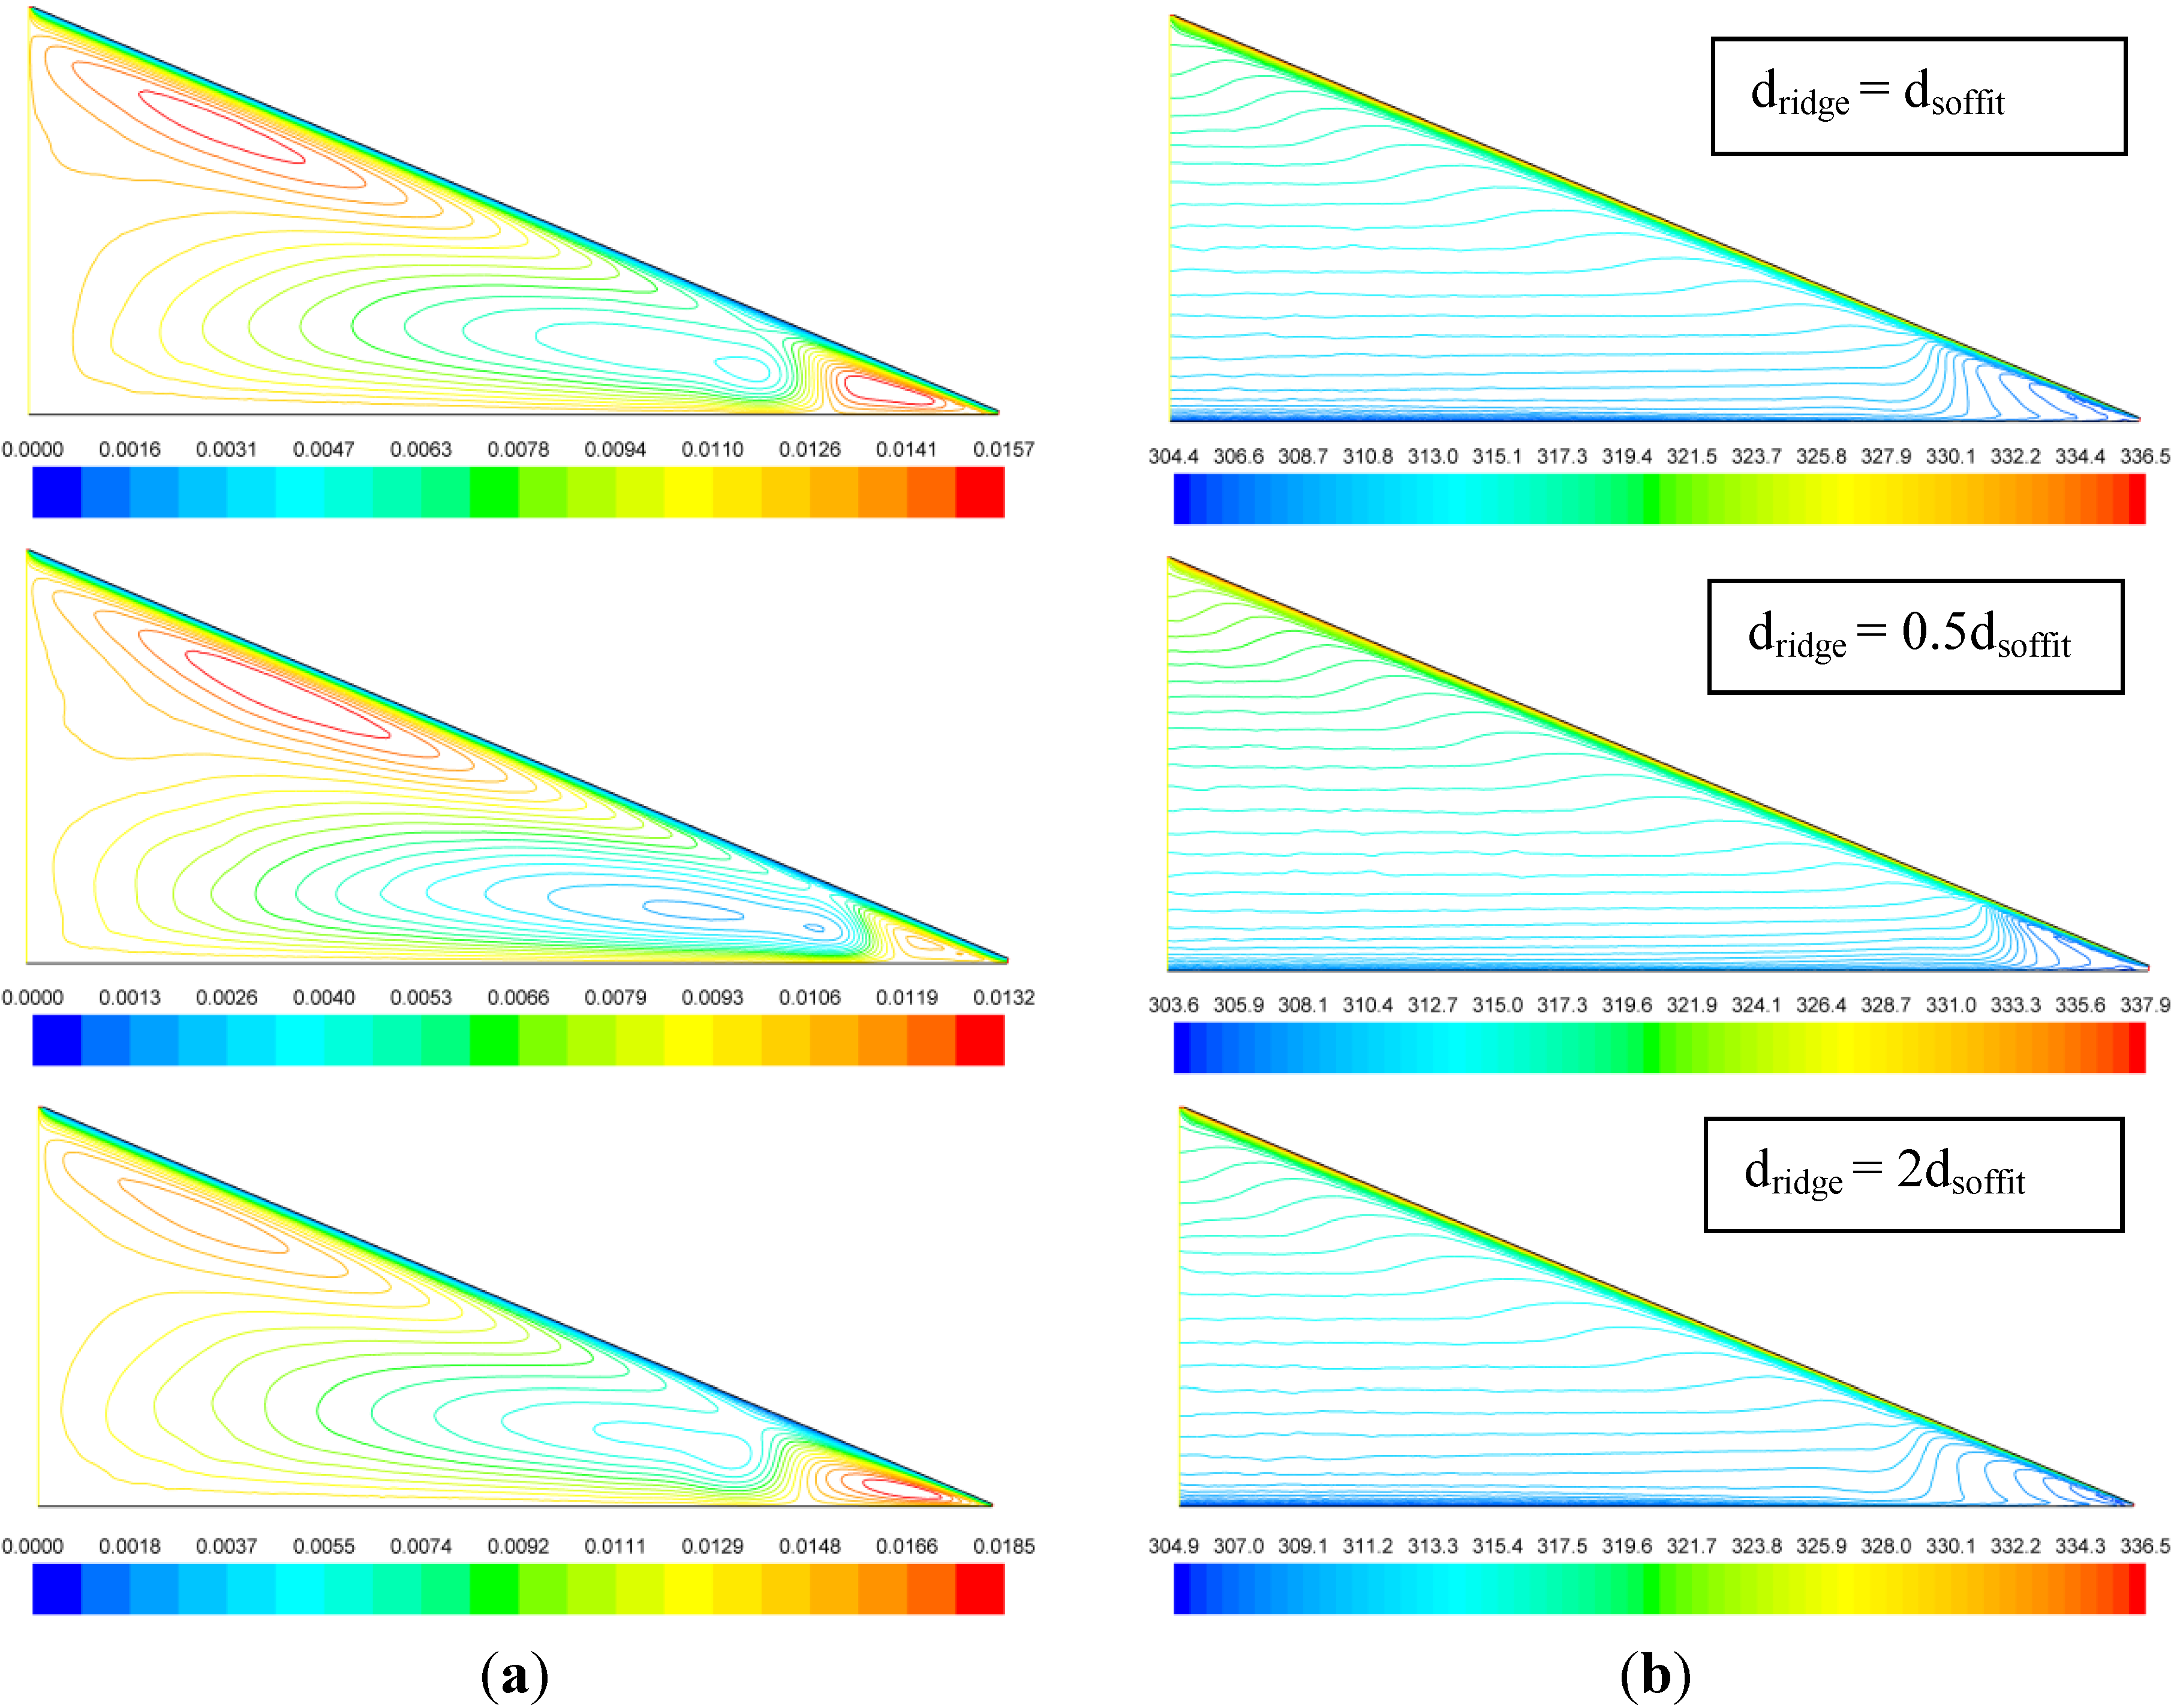
Figure 5 shows the predicted velocity and temperature distributions for three cases at ventilation ratio 1/133 with the ridge vent assumed to be equal to, half, and double, respectively, the size of the soffit vent.
Figure 5.
Comparsion of predicted (a) streamlines (in kg/m s) and (b) isotherms (in K) between balanced attic ventilation case and two cases of unbalanced attic ventilation at ventilation ratio 1/133.
Figure 5.
Comparsion of predicted (a) streamlines (in kg/m s) and (b) isotherms (in K) between balanced attic ventilation case and two cases of unbalanced attic ventilation at ventilation ratio 1/133.
Although the basic patterns of the streamlines and isotherms shown in
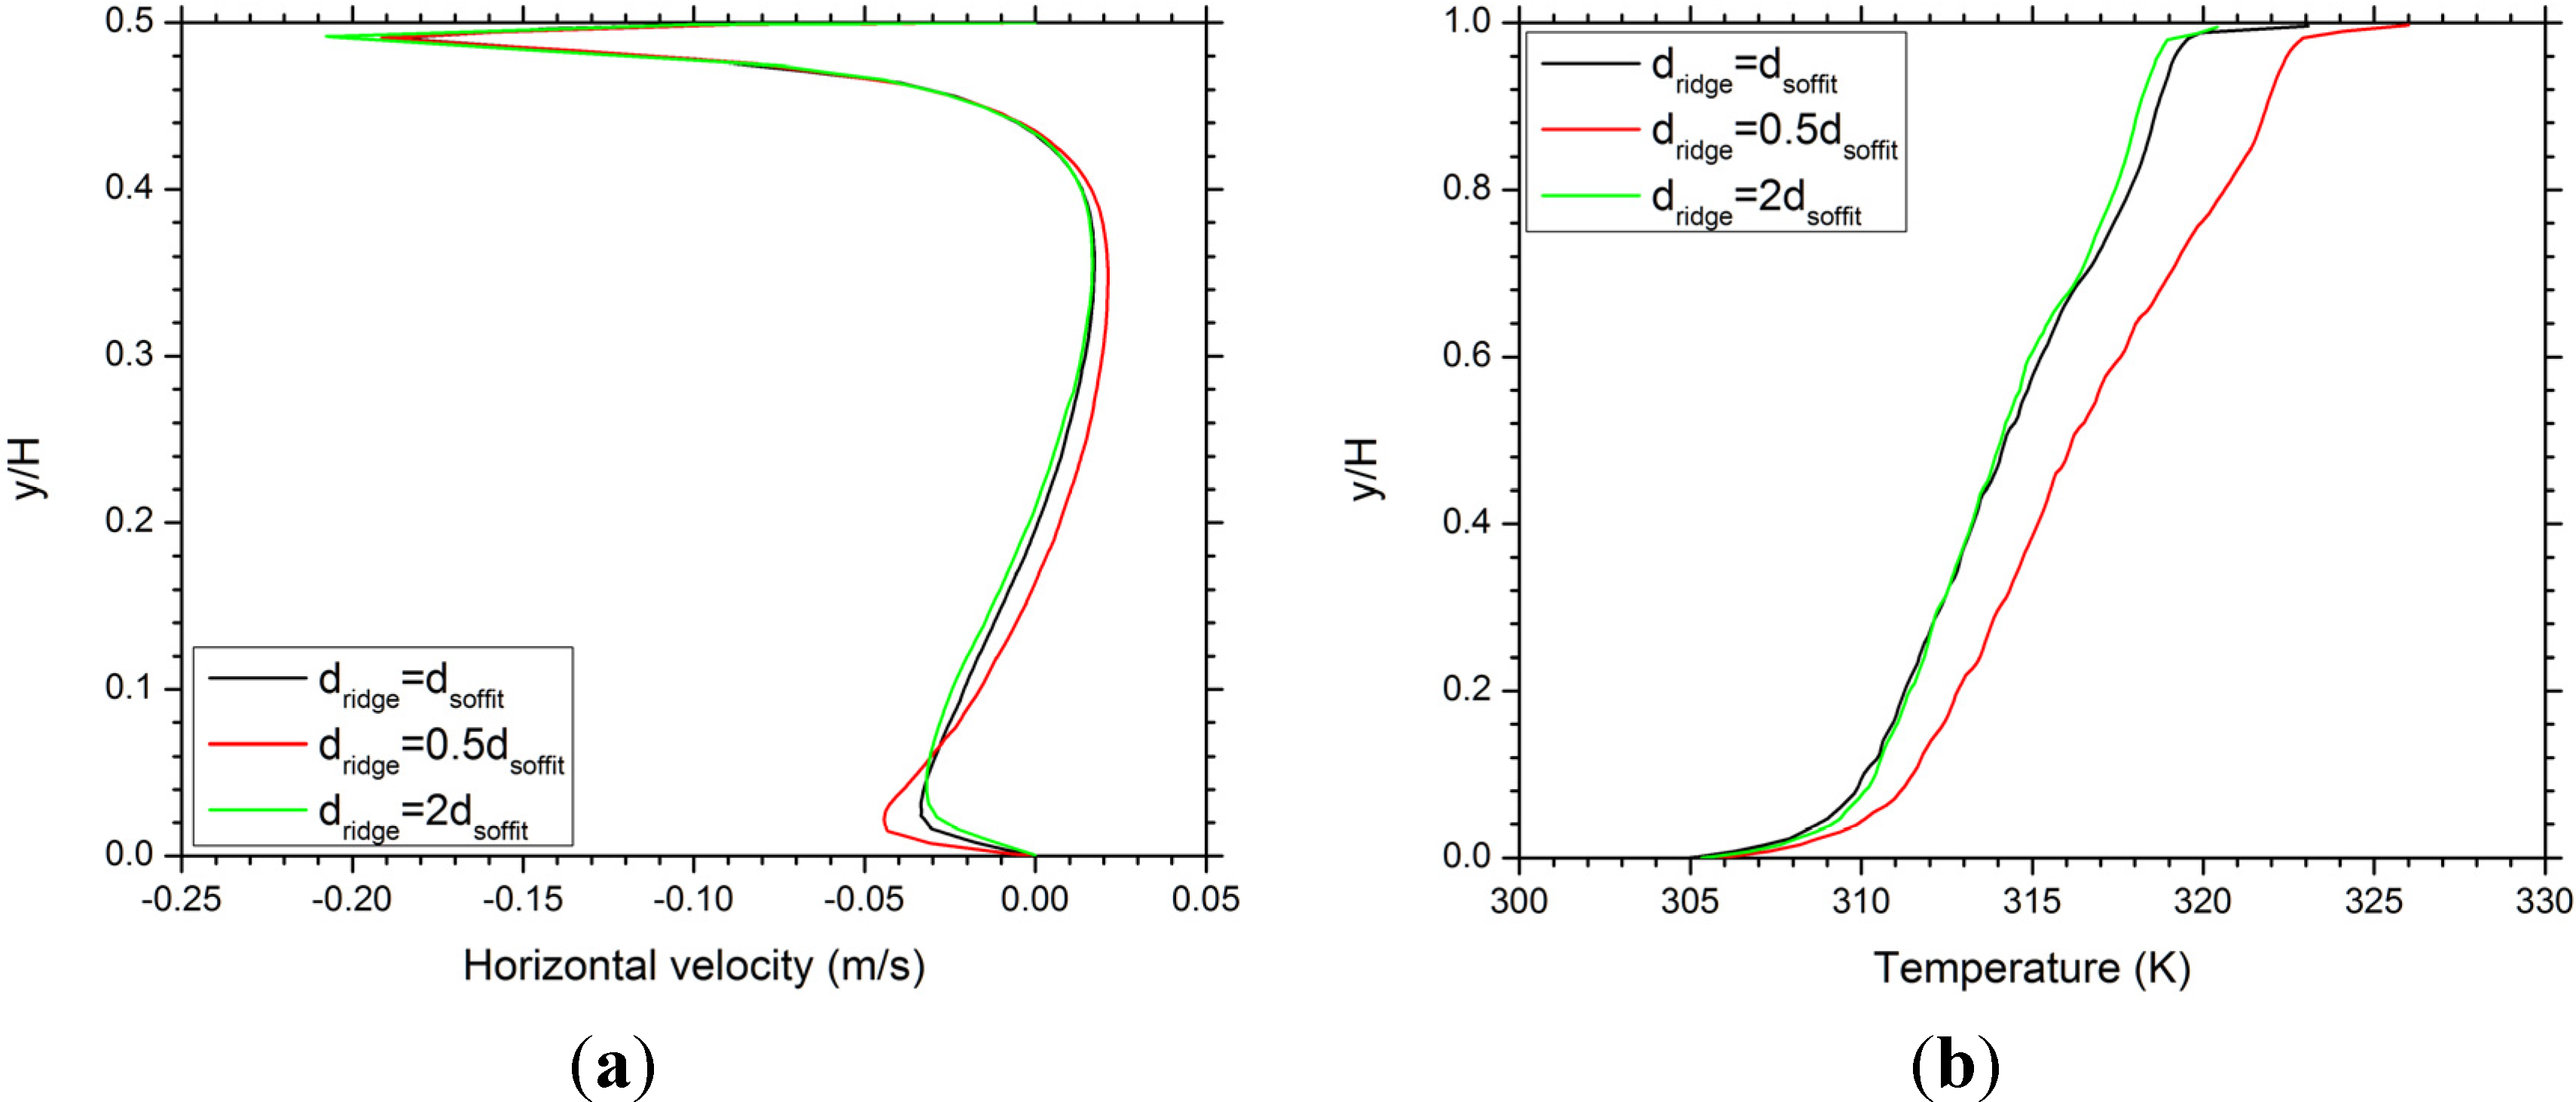
Figure 5 appear qualitatively similar for the three cases, some important differences exist. The configuration with small ridge vent and big soffit vent is predicted to have the weakest mainstream flow along the roof and the strongest vortex cells. This may be explained by the bottlenecking effect. Since the air flow is driven by the buoyancy forces developed inside the attic space, a reduction in ridge vent will result in a decrease in travel-through air flow and an enhancement in internal circulations inside the attic space. While the velocity and temperature fields of the balanced ventilation case exhibit characteristics of trade-off between the two unbalanced ventilation cases, the balanced case seems much closer to the unbalanced case with big ridge vent and small soffit vent. This is also evident in the velocity and temperature profiles shown in
Figure 6. The curves corresponding to the balanced ventilation case in
Figure 6 are much closer to the curves of the big ridge vent case, while the small ridge vent case is associated with a higher average attic temperature, as a result of the bottlenecking ridge vent that reduces the cooling effect of the ventilating air flow.
Figure 6.
Comparsion of predicted profiles of (a) horizontal velocity along the vertical line x = 2 m; and (b) temperature along the symmetric line x = 0 between balanced attic ventilation case and two cases of unbalanced attic ventilation at ventilation ratio 1/133.
Figure 6.
Comparsion of predicted profiles of (a) horizontal velocity along the vertical line x = 2 m; and (b) temperature along the symmetric line x = 0 between balanced attic ventilation case and two cases of unbalanced attic ventilation at ventilation ratio 1/133.
The overall effects of ventilation ratio and vent balance on ventilating air flow rate and attic cooling load are presented in
Figure 7,
Figure 8 and
Figure 9.
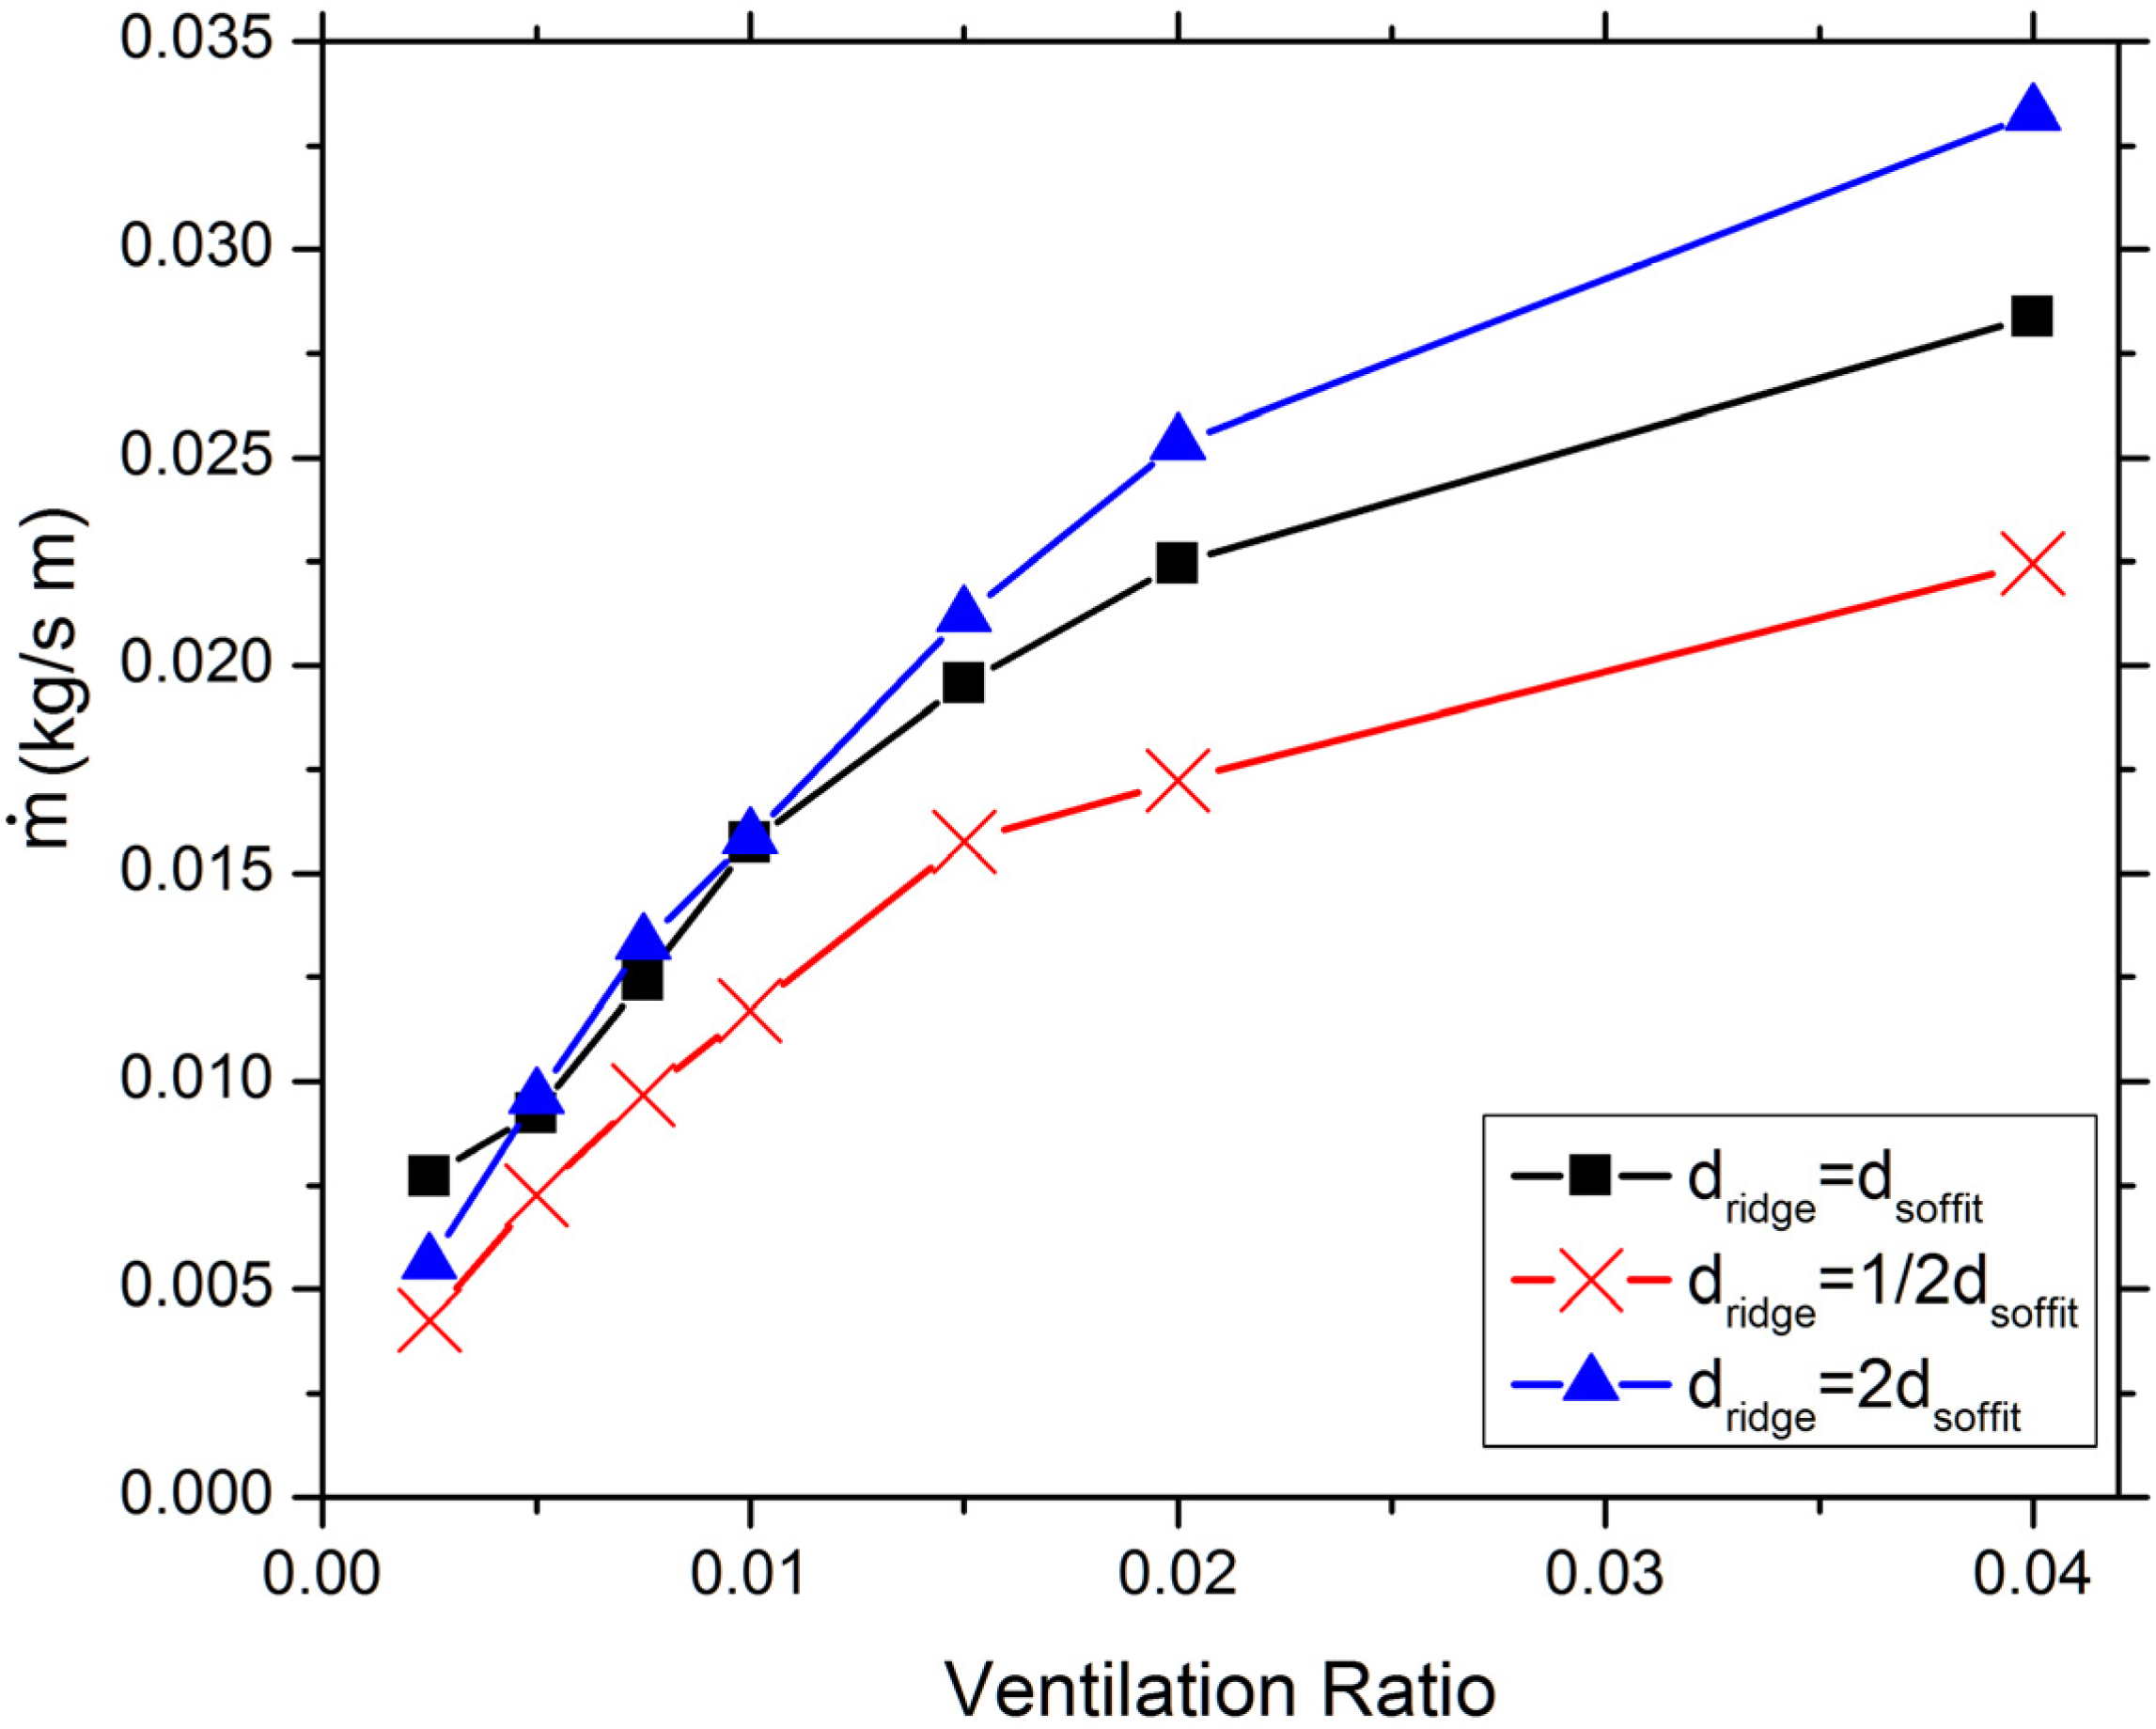
Figure 7 shows the predicted ventilating mass flow rate as a function of ventilation ratio for all the simulated cases. The three curves in the figure are corresponding to the balanced attic ventilation configuration and the two configurations of unbalanced attic ventilation. All the three curves exhibit a monotonic increase of the ventilating mass flow rate with the ventilation ratio. However, the slopes of the curves generally decrease with the increasing ventilation ratio, suggesting the benefit of increasing ventilating air flow rate by increasing ventilation ratio decays with the increasing ventilation ratio. In case of the balanced ventilation configuration, for example, increasing ventilation ratio from 1/200 to 1/100 results in an increase in ventilating mass flow of 70%, while an increase of ventilation ratio from 1/50 to 1/25 only increases the ventilating mass flow by 43%.
The predictions shown in
Figure 7 are consistent with the general guidelines in attic ventilation practice. It is usually required by the building codes that at least half of the vent area should be installed on the upper portion of the attic in order to assure sufficient ventilating air flow rate. This requirement is supported by the numerical results shown in
Figure 7. It is predicted that the cases with 2/3 vent area being soffit vent are always associated with the lowest ventilating flow rate, as compared with the cases with balanced ventilation or 2/3 vent area being ridge vent. Therefore, in order to gain the maximum ventilating air flow rate, ventilation systems with big soffit vent and small ridge vent should be avoided. Furthermore, for ventilation ratios lower than 1/100,
Figure 7 indicates that balanced ventilation provides the highest or nearly the highest ventilating air flow rate among the three configurations investigated for a given ventilation ratio. This result provides quantitative evidence to support balanced attic ventilation as an optimal solution for maximizing the ventilating air flow rate for typical residential attic ventilation ratios. For ventilation ratios greater than 1/67 (which are well above the recommended ventilation ratio by various building codes), the big ridge vent cases offer the highest ventilating air flow rate.
Figure 7.
Predicted ventilating mass flow rate as a function of ventilation ratio for balanced and unbalanced attic ventilation cases.
Figure 7.
Predicted ventilating mass flow rate as a function of ventilation ratio for balanced and unbalanced attic ventilation cases.
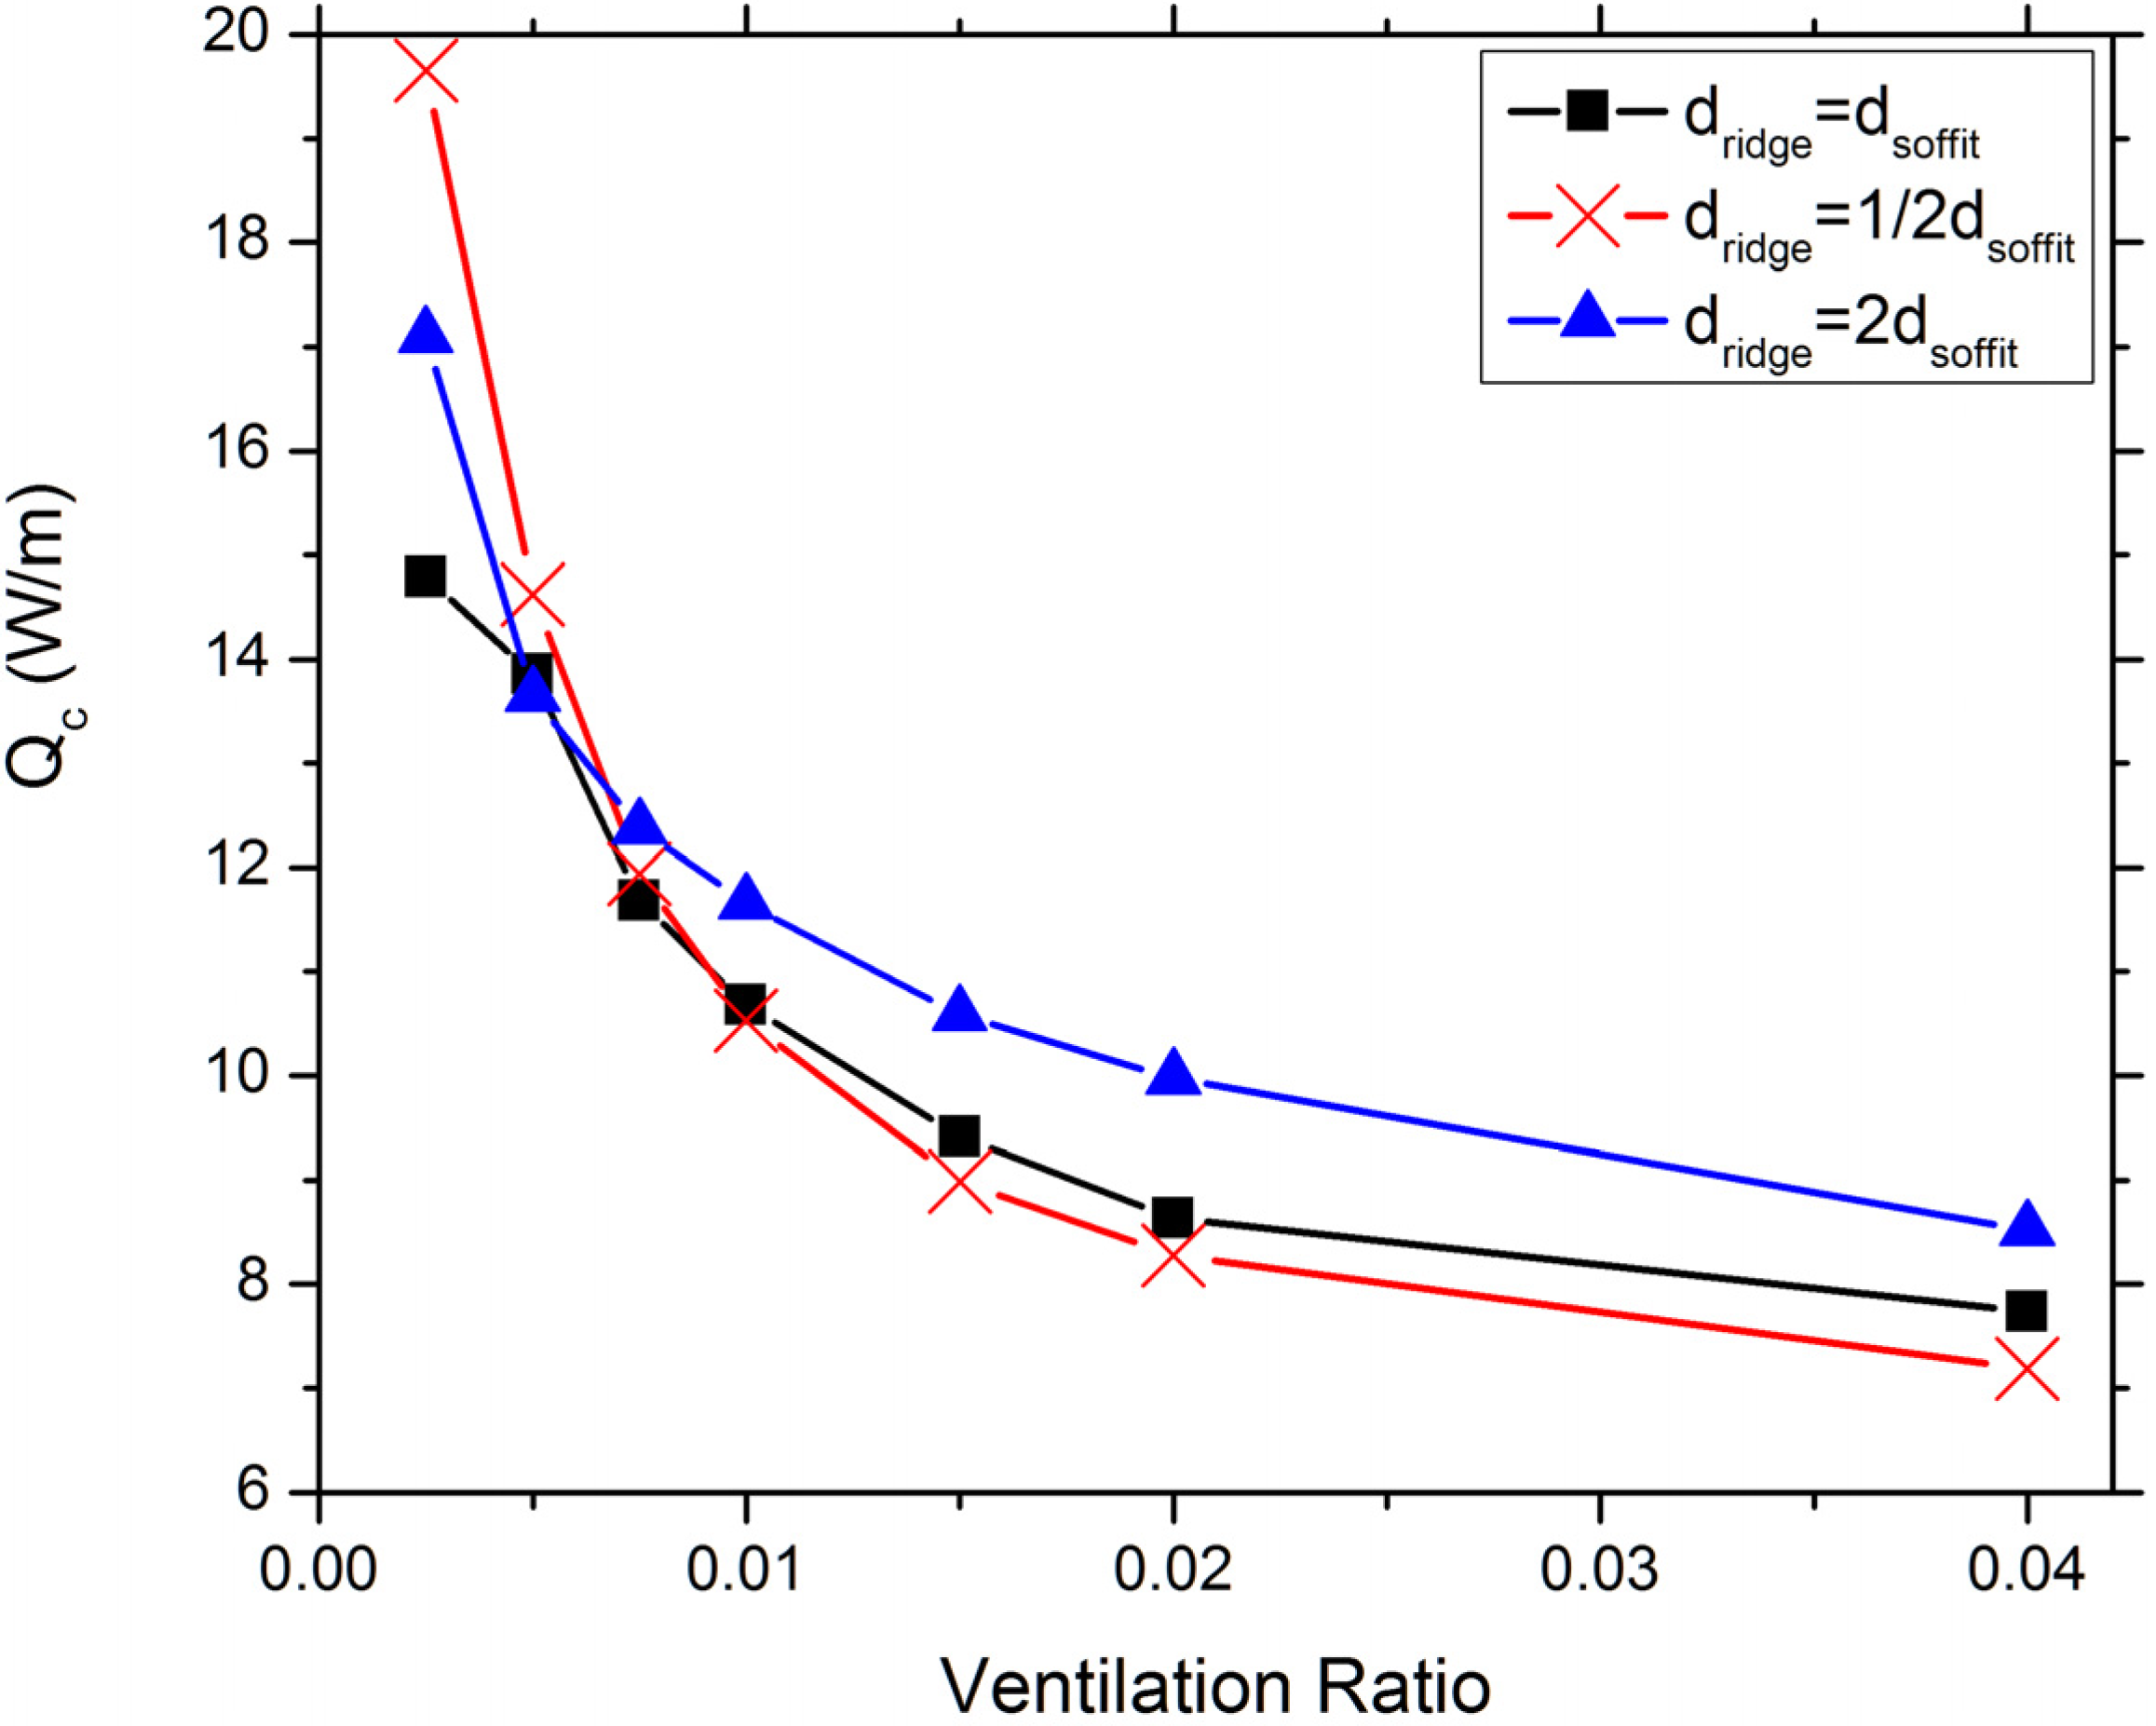
Figure 8.
Predicted attic cooling load as a function of ventilation ratio for balanced and unbalanced attic ventilation cases.
Figure 8.
Predicted attic cooling load as a function of ventilation ratio for balanced and unbalanced attic ventilation cases.
The predicted attic cooling load as a function of ventilation ratio for the vented attic cases is shown in
Figure 8. All the three curves in the figure show a monotonic decrease of the attic cooling load (measured by heat transfer through the ceiling boundary) with the increase in ventilation ratio. Also consistent with this trend but not shown in the figure is the cooling load of 40 W/m for the sealed attic case. Therefore, providing sufficient attic ventilation has a very profound impact on energy saving under summer conditions. The benefit of reducing cooling load by increasing ventilation ratio, however, decays with the increasing ventilation ratio. In case of the balanced ventilation situation, for example, increasing ventilation ratio from 1/200 to 1/100 results in a decrease in cooling load of 23%, while an increase in ventilation ratio from 1/50 to 1/25 only reduces the cooling load by 9.7%. It is interesting to observe from the figure that for ventilation ratios lower than 1/100, balanced ventilation corresponds to the lowest or nearly the lowest cooling load among the three configurations investigated for a given ventilation ratio. Therefore, balanced attic ventilation is also an optimal solution for minimizing the attic cooling load for typical residential attic ventilation ratios. For ventilation ratios higher than 1/67, the small ridge vent cases are related to the lowest cooling load, while the big ridge vent cases require the highest cooling load.
Figure 9.
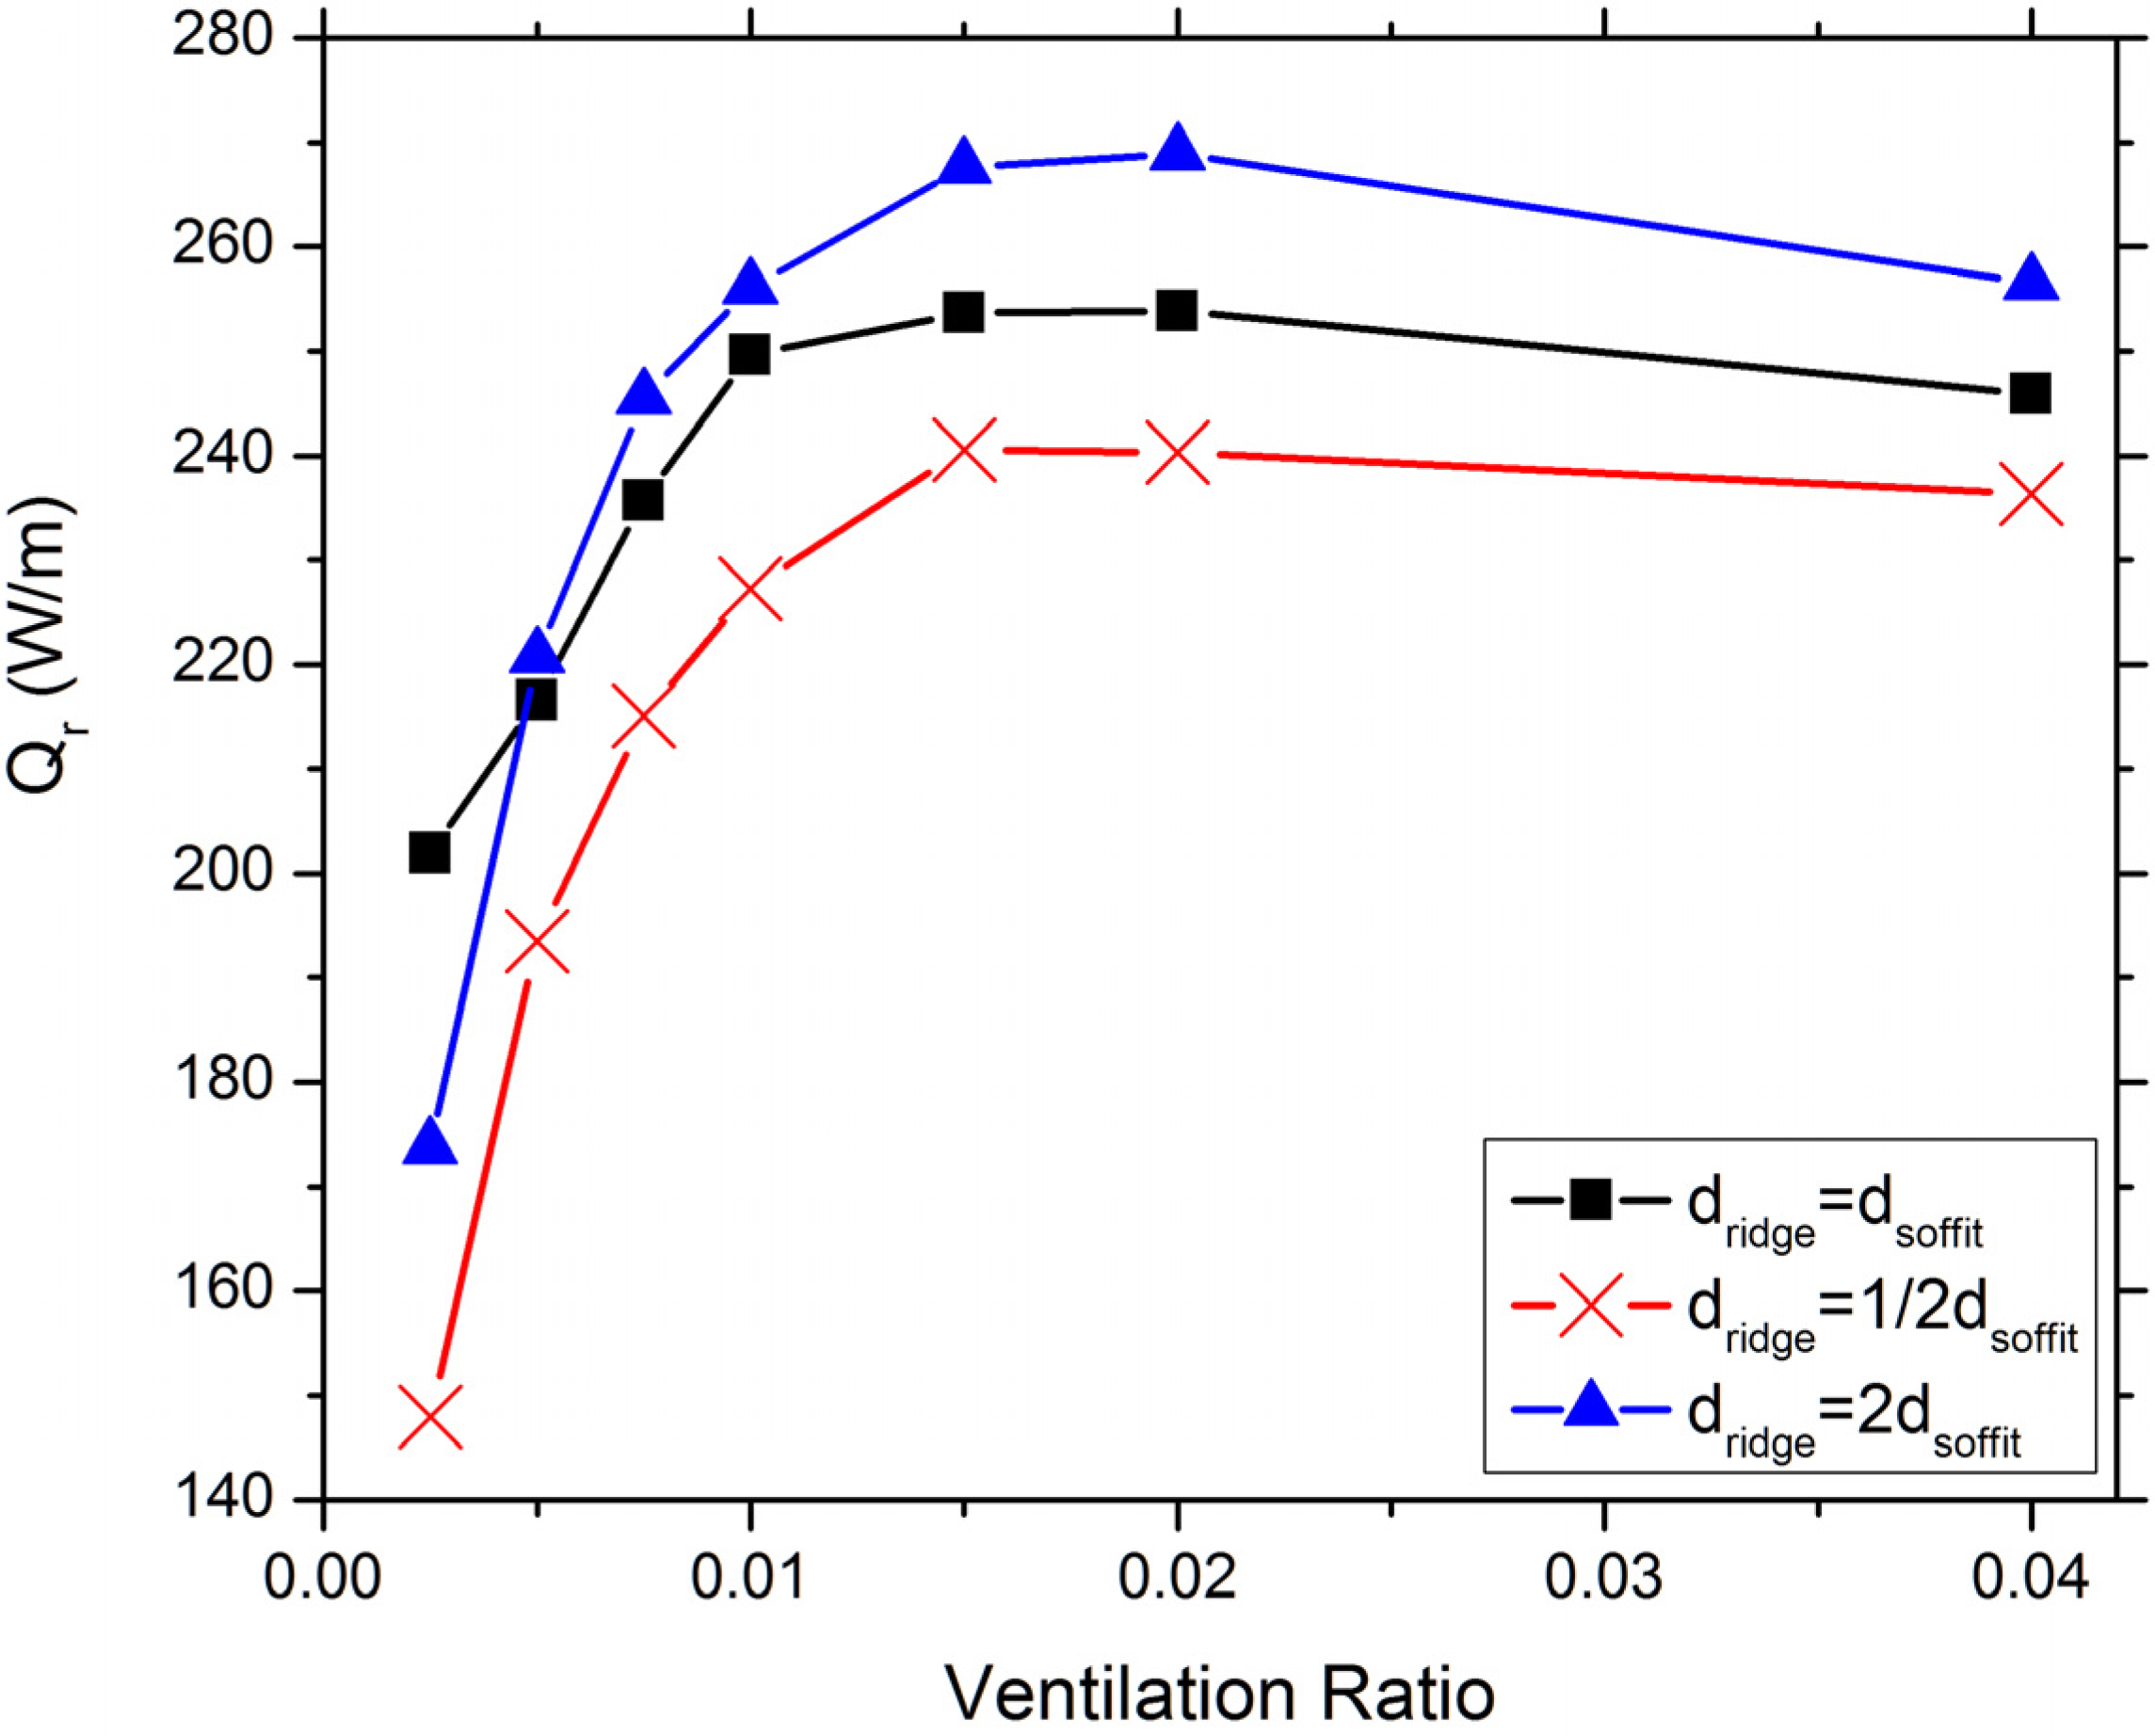
Predicted heat gain from roof as a function of ventilation ratio for balanced and unbalanced attic ventilation cases.
Figure 9.
Predicted heat gain from roof as a function of ventilation ratio for balanced and unbalanced attic ventilation cases.
Figure 9 shows the predicted heat gain from the roof as a function of ventilation ratio for the investigated cases. All the three curves in the figure show roof heat gain increases with ventilation ratio as long as it is lower than 1/67. For ventilation ratios higher than 1/67, the roof heat gain decreases slightly with the increase in ventilation ratio. Comparing
Figure 8 and
Figure 9 suggests that the roof heat gain is an order of magnitude higher than the heat loss through the ceiling. Therefore, most of the heat entering the attic through the roof is carried out by the ventilating air flow. In other words, attic ventilation provides an effective mean to cool the roof using the ambient air.
