1. Introduction
Energy efficiency refers to a lower energy input to produce the same amount of services/useful output [
1]. Energy is essential both to provide quality of life to mankind and as input in any production process. After the industrial revolution the Western economies have developed based on industrial production and an increasing energy
per capita consumption. With the 1970s’ oil crisis there was an increased interest in adopting energy savings and more energy efficient solutions in the industrialized world, for both economic and security of supply reasons. In the beginning of the 1990s the awareness of the consequences of global warming has emerged strongly as another important driving force for energy efficiency solutions. As manufacturing industries account for approximately one-third of global energy use [
2], energy efficiency in industry has been claimed as one of the main cost-effective paths to the reduction of both energy consumption (according to the first law of thermodynamics the term “energy consumption” is a misnomer, because the total amount of energy is maintained, even if its form changes, however, this term is used in the paper referring to the useful energy demanded by the pulp and paper production process) and GHG emissions [
3,
4,
5,
6,
7]. In fact according to the IEA it seems a necessary ingredient if we aim to stop the level of carbon dioxide in the atmosphere from reaching above 450 ppm [
2].
The energy consumption of an industrial sector is determined by its activity level, sector structure and energy efficiency [
8] and the use of some indicators can provide insights into levels of energy efficiency. These indicators can be useful in the evaluation of energy efficiency policies or in the development of policy goals, or even in the identification of potential savings. However, the usefulness of an energy efficiency indicator regards to its comparability [
9]. A given industry can find energy savings potential in its production processes by comparing its own energy performance with the energy performances of competing industries, or even evaluate improvements on its energy performance during time. Furthermore, a cross-country comparison can help in evaluating or designing national energy policies, either for the whole economy or specific sectors. Potential energy savings can be classified as technical (e.g., based on a Best Available Technology, BAT), economic (which considers the cost-effectiveness of the available technologies) and market potential (in which barriers to technologies implementation are also considered) [
10].
The various indicators used to monitor changes in energy efficiency can be classified into four main groups,
i.e., thermodynamic (e.g., energy output/energy input), physical-thermodynamic (e.g., energy input/tonne of product), economic-thermodynamic (e.g., energy input/GDP) and economic indicators (e.g., energy input in terms of economic value/GDP) [
1]. The most commonly energy efficiency indicators used in industry are related to the energy consumption per value added or to a specific energy consumption, SEC (e.g., energy consumption per tonne of product). The former has the disadvantage of making no distinction about changes in energy intensity due to structure changes or technical improvements while the latter allows to consider possible changes in products mix [
8,
11,
12,
13]. The use of SEC is claimed as a more suitable indicator for energy intensive industries, although it can be difficult to establish SEC’s in highly integrated production processes [
8,
12,
13,
14].
Several attempts have been made in the literature to identify energy saving potentials in specific industrial sectors through international comparison, most of which are focused on energy intensive industries.
Reference [
14] presented a methodology for a cross-time and cross-country comparison of energy efficiency developments in the manufacturing industry based on the use of physical indicators. The methodology has a weighting scheme based on specific energy requirements to produce different products to calculate a physical production index (PPI), giving higher values to more energy intensive products. They also applied a decomposition analysis to measure the influences of changes in production activity, production mix and energy efficiency in the variation of energy consumed by an industrial sector (e.g., the pulp and paper sector).
Reference [
15] presented an international comparison of energy intensive industries, in terms of both energy efficiency and CO
2 emission performances based on best available technologies. The industries studied were chemical and petrochemical, iron and steel, non-metallic minerals, pulp, paper and printing, and non-ferrous metals. Still, there are other important publications in this field, e.g., [
9,
16,
17].
The pulp and paper sector is the fourth-largest industrial consumer of energy; it represented 6% of world industrial energy use in 2005 [
2]. It is characterized as an intensive industry, in terms of both capital and energy, with a high minimum efficient scale of production [
14,
18,
19]. There are ample studies of pulp and paper sector energy use. Many of those concentrate on comparing mills to each other [
20] or try to define the gap between current and theoretical minimum energy consumption [
21,
22,
23,
24]. There are also a lot of studies of how to improve a single mill’s energy efficiency [
25,
26,
27,
28]. Schumacher and Sathaye analysed India’s pulp and paper industry historical trends and found that actually energy intensity had grow as the industry was more focused saving in capital investments and labour [
29], Szabó
et al. used specific electricity and heat consumptions for each product grade and assumed energy efficiency improvement to study global pulp and paper industry energy use development up to 2030 [
19].
The aim of this work is firstly to identify reasons for decreases of pulp and paper industry energy use and secondly look at how changes in primary energy used as well as changes in production mix affect national energy intensity. How much of the energy efficiency improvement is due to the growth, due to the change of primary energy source and most importantly due to the energy efficiency measures in the existing industry. As Brazil is a country where continuous growth of pulp and paper industry is still occurring and reasonable data was available it was chosen to be the target country. Thirdly the aim was to evaluate the long-term energy efficiency development of Brazilian pulp and paper industry, identifying the main causes of its energy consumption development and fourthly to compare its energy efficiency performance with other countries of great importance in world’s pulp and paper production, i.e., Canada, Finland, Sweden and the United States of America. As growth of pulp and paper production in these countries is slow it is important for global energy perspective to compare them to a country, Brazil, where the industry is growing fast.
The chosen methodology for this study was the described by [
14], the reasons were: (i) it allows the international comparison in physical measures (excluding the distortions caused by the use of monetary measures); (ii) will identify the energy efficiency improvement; (iii) and allows to identify cross-time structural changes within the sector by differing the influences weight of different pulp and paper grades.
This paper is structured in four sections, besides this introduction.
Section 1 briefly describes the main energy intensive processes in pulp and paper production.
Section 2 shows a detailed description of the characteristics of the Brazilian pulp and paper sector and the changes in its energy consumption patterns from 1979 to 2010. The methodology used in the analysis is described in
Section 3, while the results and discussion are in
Section 4.
Section 5 states the main conclusions of this study.
2. Pulp and Paper Production
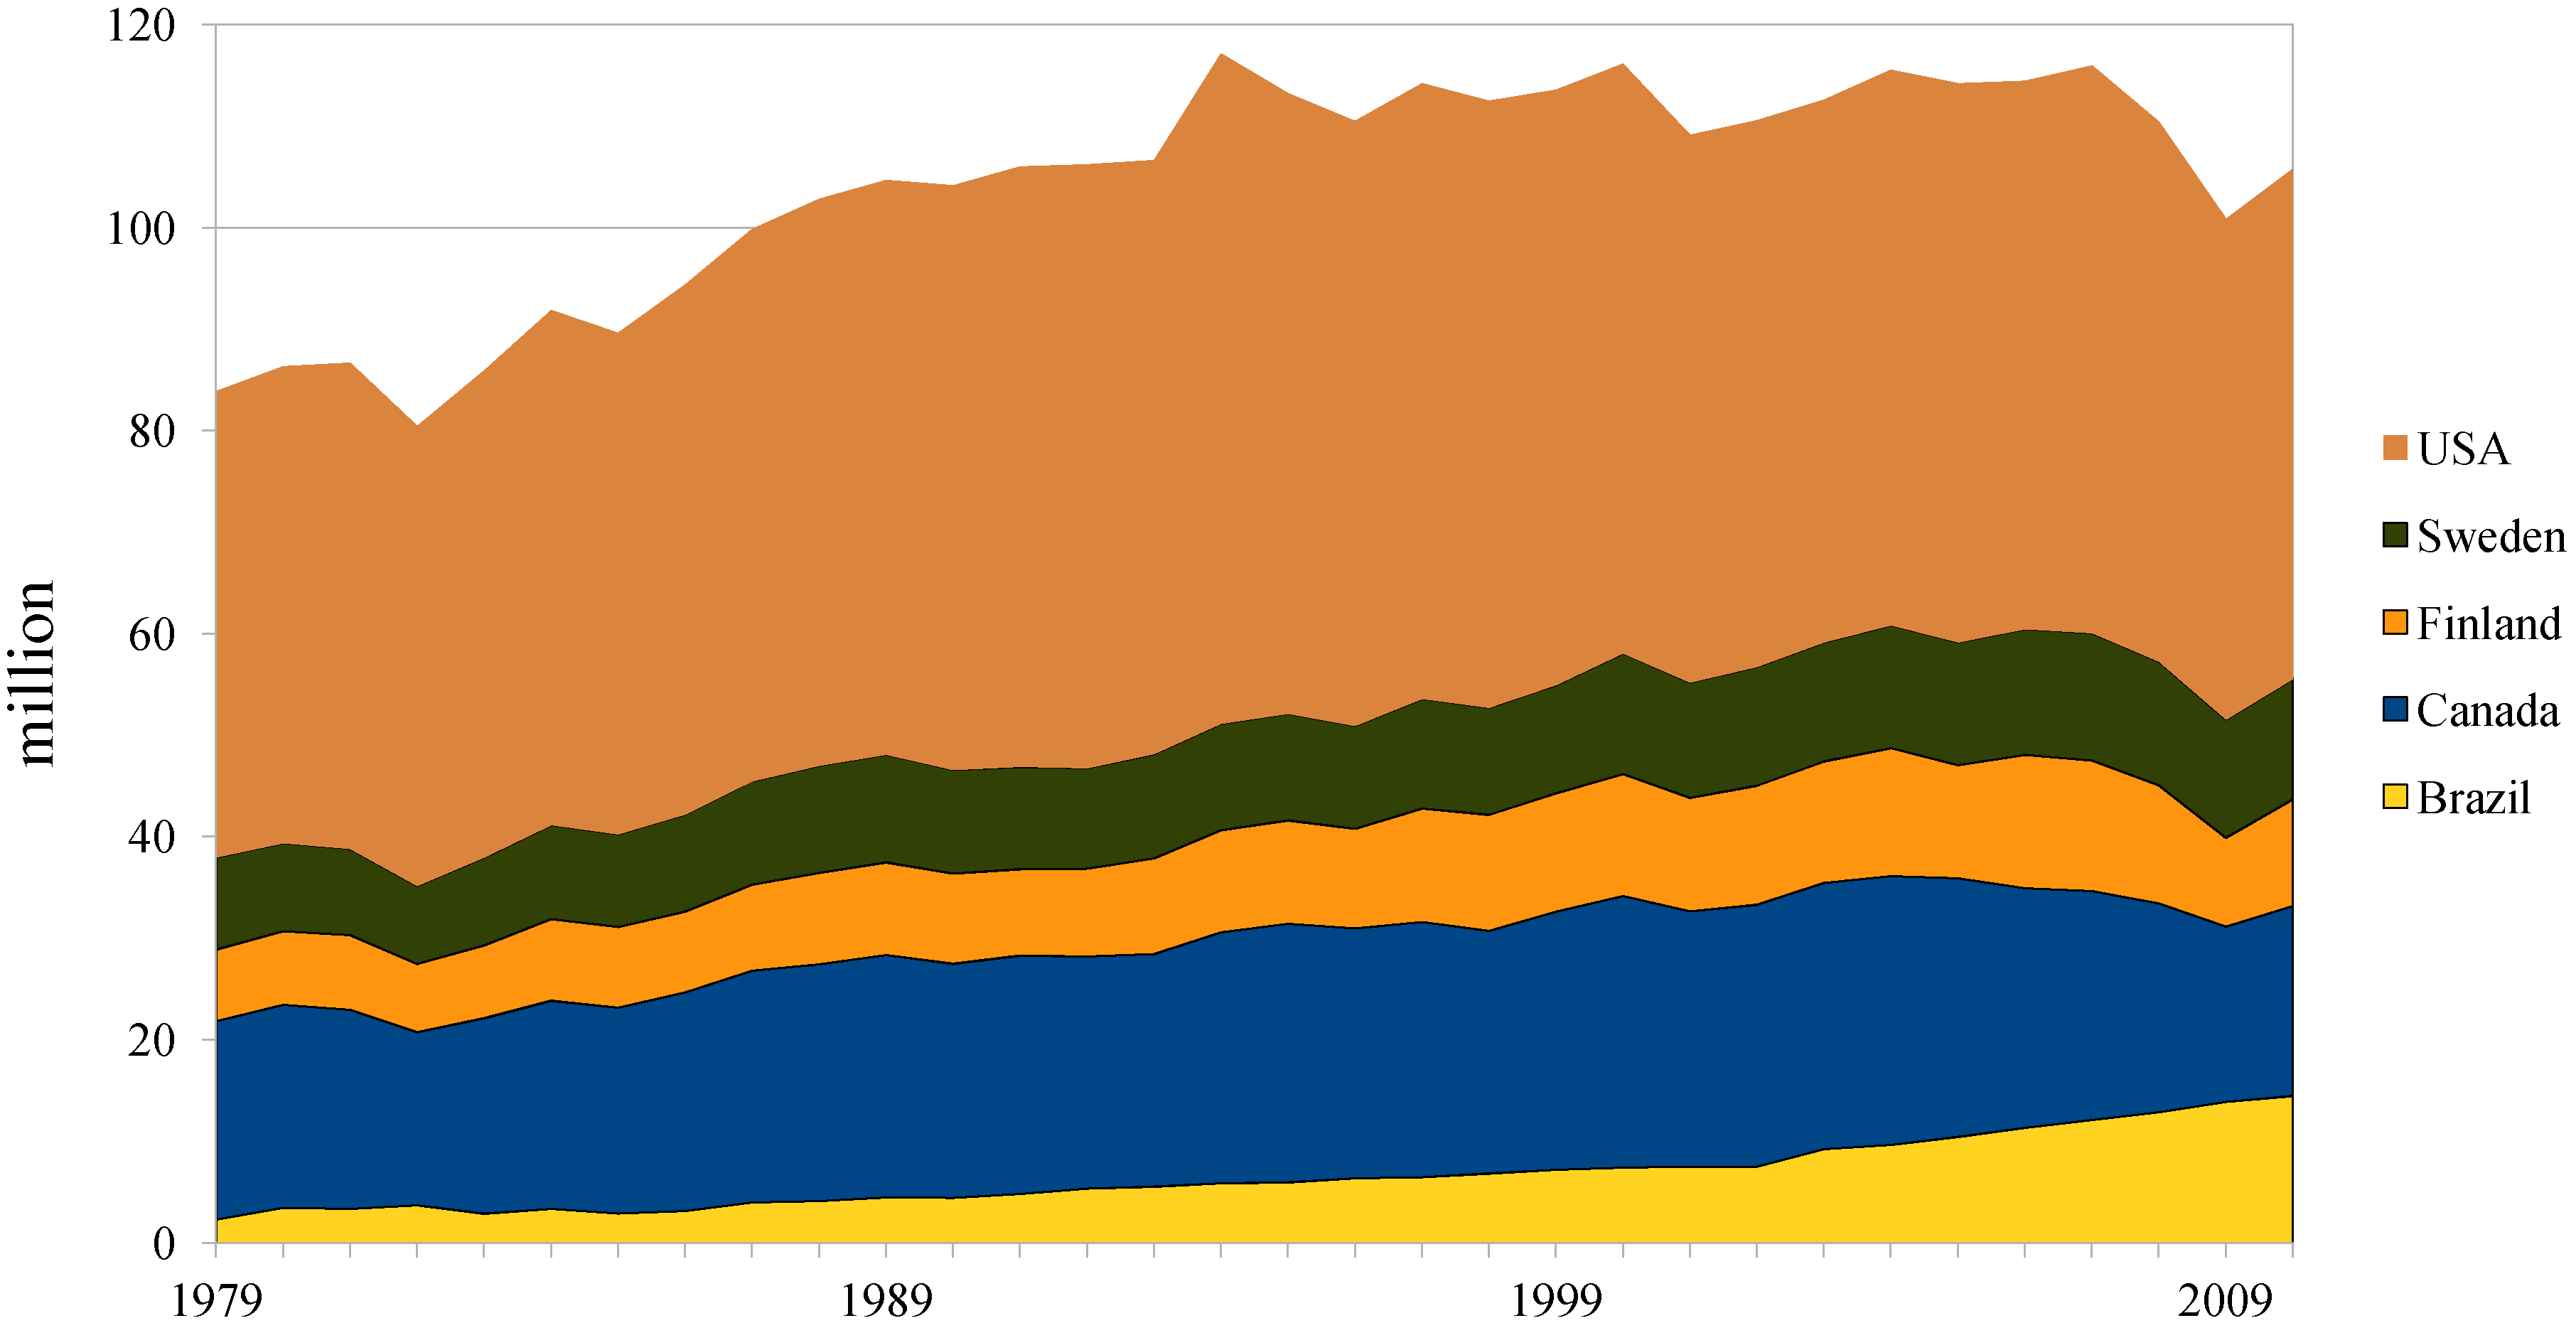
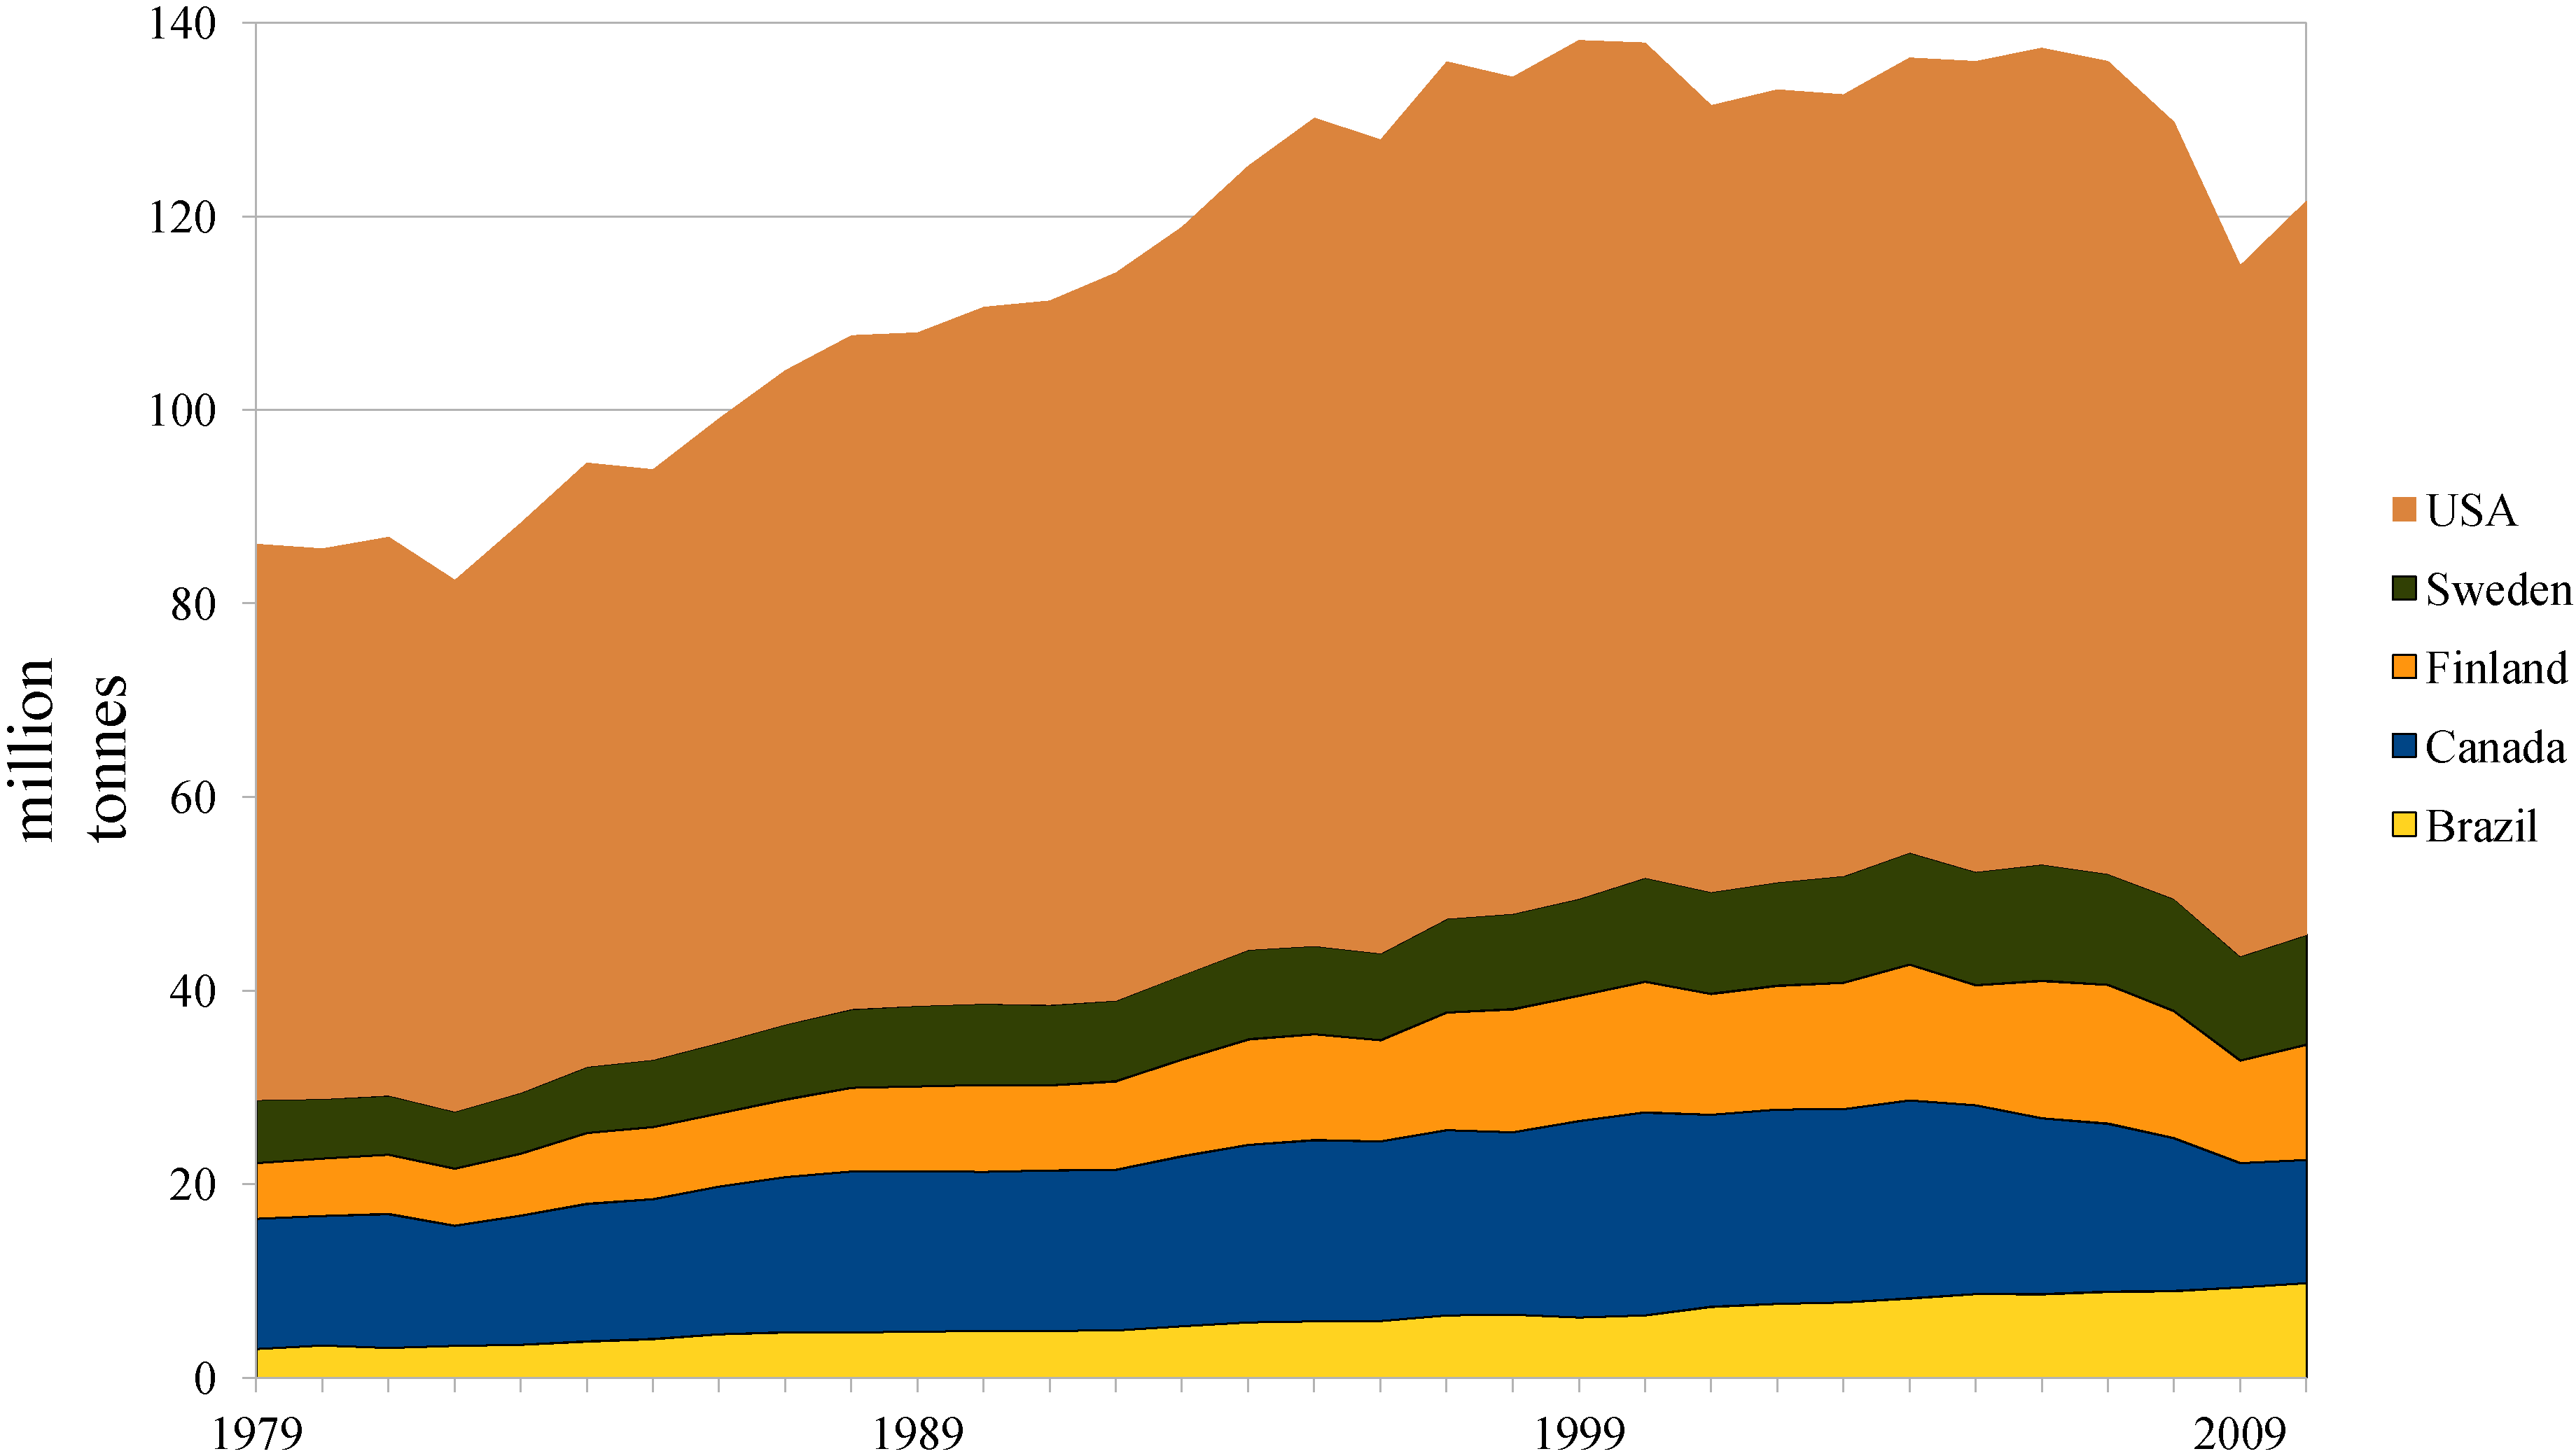
The World’s pulp and paper production in 2010 was approximately 186 and 394 million tonnes, respectively. The world’s largest paper and paperboard producers are China, USA, Japan, Germany, Canada, Finland, Republic of Korea, Indonesia, Sweden and Brazil, while the largest pulp producers are USA, China, Canada, Brazil, Sweden, Finland, Japan, Russian Federation, Indonesia and Chile. These countries together were responsible for approximately 81% and 73% of 2010 world’s pulp and paper & paperboard production, respectively [
30].
Figure 1 and
Figure 2 show the development of the annual pulp and paper production of the countries selected for this study.
Figure 1.
Annual pulp production of the selected countries.
Figure 1.
Annual pulp production of the selected countries.
Source: elaborated from [
30].
The pulp and paper industry converts fibrous raw materials into pulp, paper and paperboard [
17]. Production can happen either in stand-alone pulp mills and stand-alone paper mills or in integrated mills. Pulp types can be produced either through chemical (sulphate or sulphite wood pulp), mechanical (ground or refined wood pulp) or semi-chemical processes (the most common is the Neutral Sulfite Semi-Chemical, NSSC, pulp), and are used as raw material in paper and board production. Recovered paper can also be used as production feedstock [
12].
The most significant energy-consuming processes are pulping and drying [
15,
17] but the specific energy consumption in pulp and paper production is highly influenced by several factors, e.g., product mix (
i.e., structure), processes used, plant size, plant location, technology used, technical age of the mill, feedstock quality, fuel prices, utilisation rate of plant capacity, integration level, climate conditions and the level of management attention to energy efficiency [
12,
14,
15,
17].
Figure 2.
Annual paper production of the selected countries.
Figure 2.
Annual paper production of the selected countries.
Source: elaborated from [
30].
2.1. The Brazilian Pulp and Paper Industry
2.1.1. Production
Brazil is the world’s fourth and the tenth largest pulp and paper producer, respectively [
30]. The sector has an important role in Brazilian economy, as it represented 0.3% and 1.8% of the country’s GDP and industry’s value added, respectively [
31]. Pulp and paper are the tenth main export products and represented 3.4% of exported products (in value) in 2010 [
32].
From 1979 to 2010 both wood pulp and paper production increased significantly in the country. In 1979 the wood pulp production was around 2.1 million tonnes per year and paper production was approximately 3.0 million tonnes per year, while thirty one years later the annual production of wood pulp and paper was 14.1 and 9.8 million tonnes, respectively. Despite a decrease in wood pulp production between 1982 and 1986, wood pulp and paper production increased at relative similar rates until 2002. In the beginning of the 2000’s, propitious worldwide market conditions (e.g., closing of small pulp mills in North America and Europe, increasing acceptability of eucalyptus fibre and rising Chinese pulp demand) led to investments in large capacity chemical pulp mills,
Figure 3, increasing the wood pulp production at an annual rate of 8.5%, against 3.1% in paper production, between 2002 and 2010 [
30].
Wood pulp in Brazil is produced mainly through chemical processes, representing 96.7% of total raw wood pulp produced in the country in 2010,
Figure 4. Its production increased at an average annual rate of 6.6% between 1979 and 2010, when the production reached about 13.6 million tonnes, or 10.2% of world’s wood chemical pulp production. In contrast, the share of mechanical processes has been steadily decreasing since 1985. In the same period, the mechanical wood pulp production increased at an average annual rate of 2.2%, reaching 433,000 tonnes per year in 2010, which is approximately 1.4% of world’s production [
30].
Figure 3.
Brazilian pulp and paper annual production.
Figure 3.
Brazilian pulp and paper annual production.
Source: elaborated from [
30].
Figure 4.
Share of different pulp types in raw wood pulp production in Brazil.
Figure 4.
Share of different pulp types in raw wood pulp production in Brazil.
Source: elaborated from [
30].
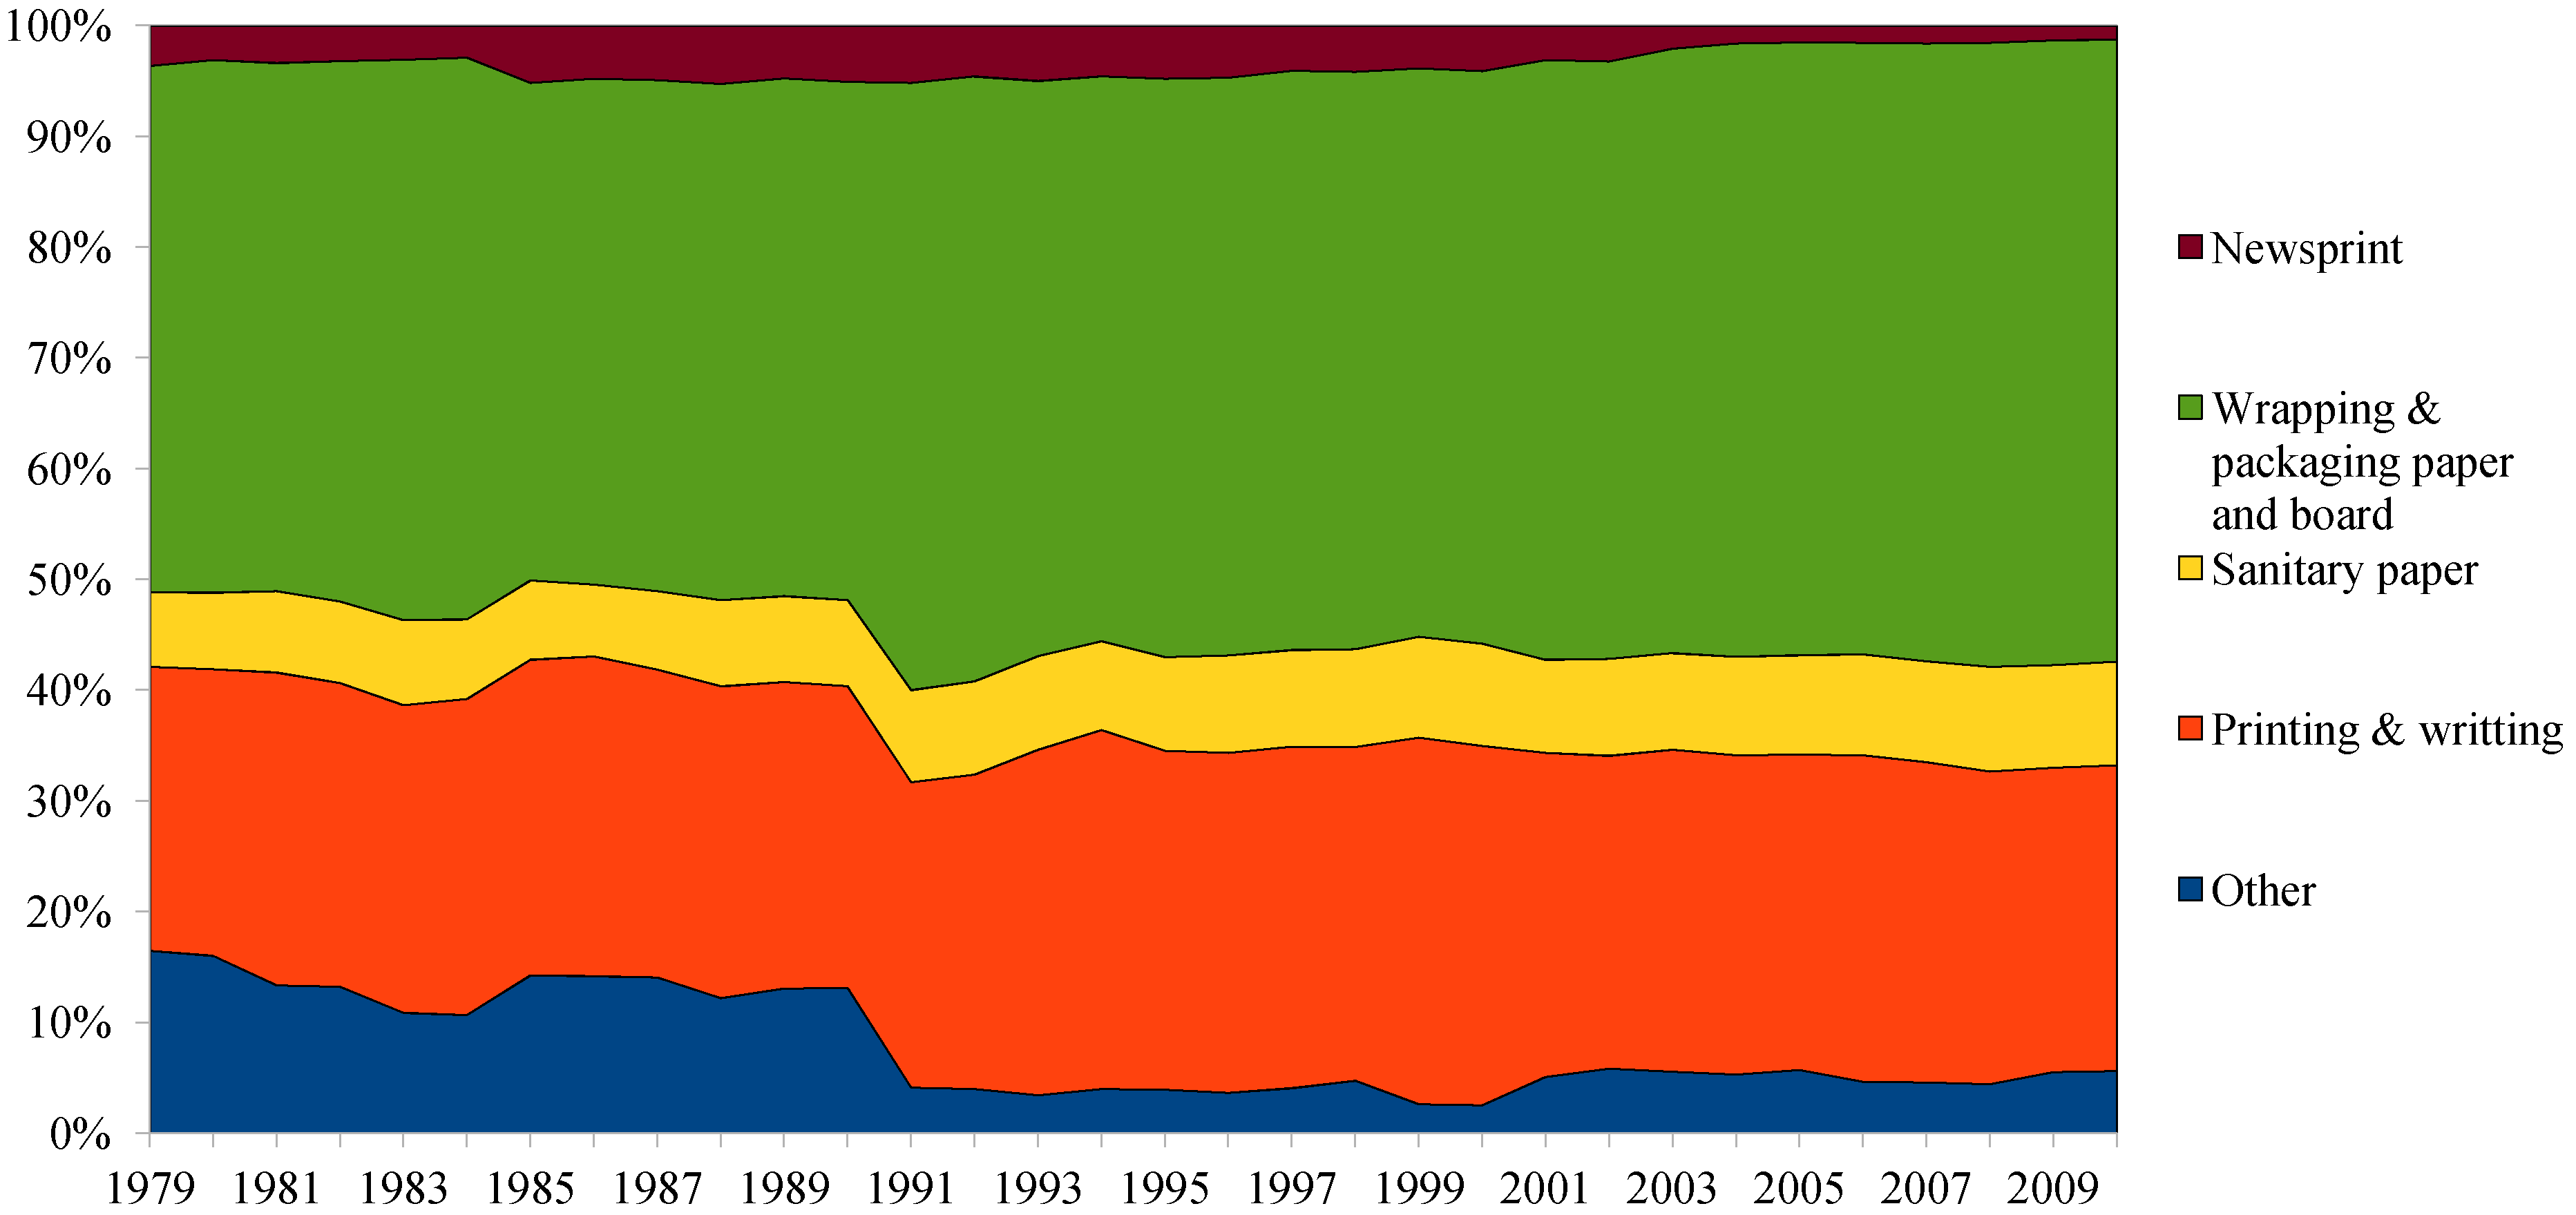
From 1979 to 2010, there were no significant changes in the paper production mix. The share of newsprint production reduced from 3.7% to 1.3%, which was expected given the reported decrease of mechanical pulp production. On the other hand, household and sanitary paper, printing and writing paper and wrapping and packaging paper and board production increased from 6.8% to 9.3%, from 25.7% to 27.6%, and from 47.5% to 56.2% [
30], respectively,
Figure 5. The utilisation of recovered fibre, defined as the ratio between recovered fibre input and total paper production, also increased in the analysed period, from 0.8 million tonnes per year in 1979 to 3.9 million tonnes per year in 2010,
Figure 6. However, it is expected some inconsistency in the recovered paper data, mainly between 1990 and 1998 when the data is reported at a constant value of approximately 1.3 million tonnes per year.
Figure 5.
Share of different grades in Brazilian paper and board production.
Figure 5.
Share of different grades in Brazilian paper and board production.
Source: elaborated from [
30].
Figure 6.
Recycled fibre utilization rate in Brazil.
Figure 6.
Recycled fibre utilization rate in Brazil.
Source: elaborated from [
30].
2.1.2. Energy Consumption
Industry represents approximately 38% of final energy consumption in Brazil. The share of pulp and paper sector increased from 6.8% in 1979 to 11.8% in 2010 of industry’s final energy consumption, and from 2.4% to 4.5% of the total final energy consumed in the country.
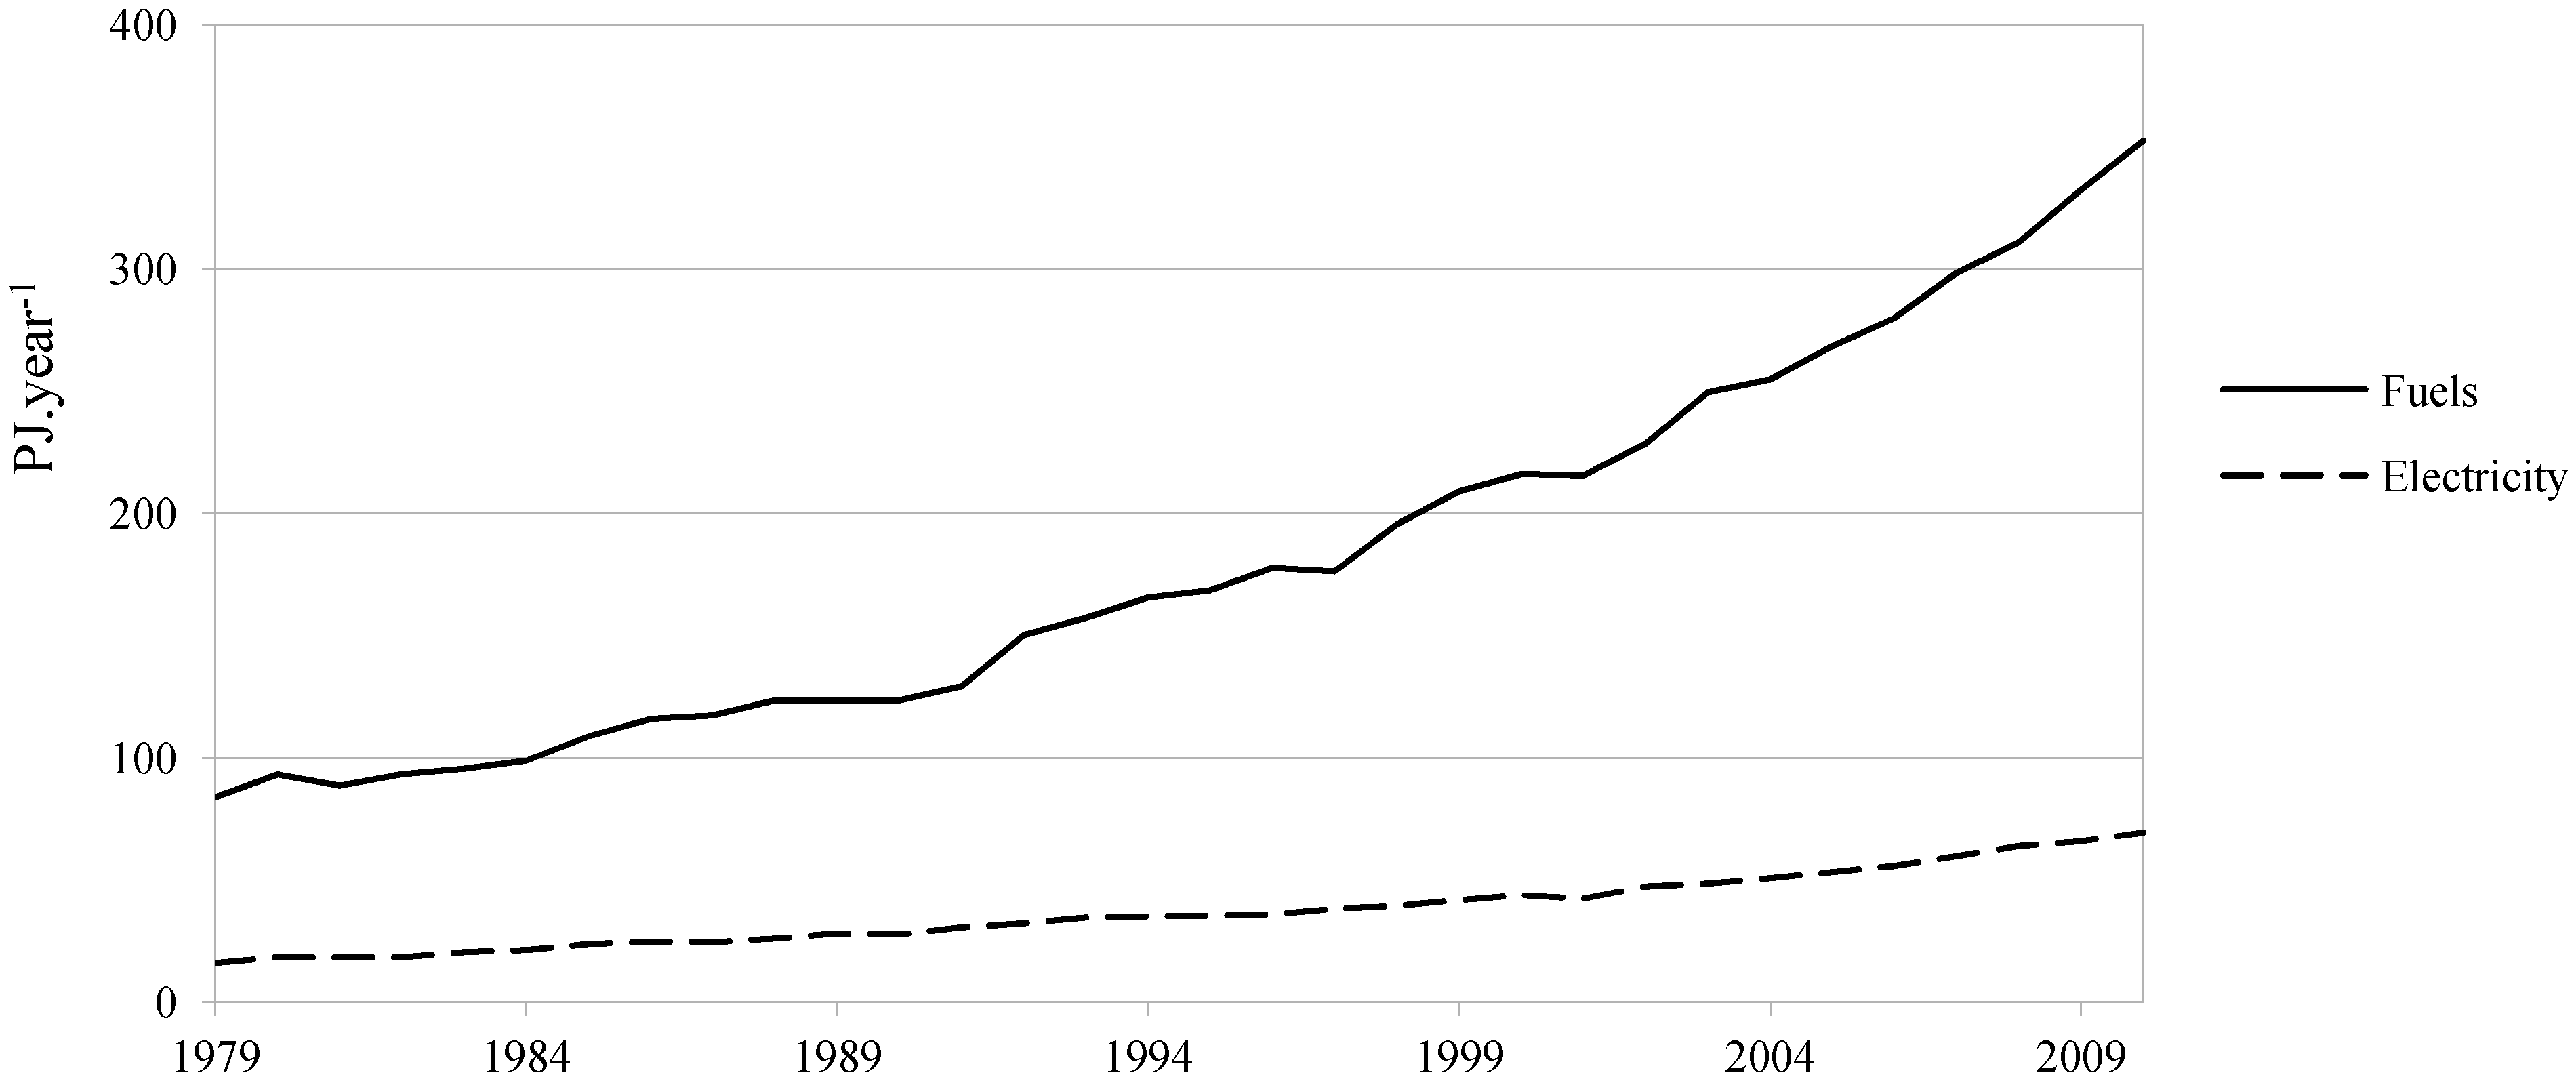
Figure 7 shows the total final energy consumption and the share of both industrial and pulp and paper sectors from 1979 to 2010 and
Figure 8 shows the yearly energy consumption of pulp and paper sector in terms of final energy (
i.e., electricity and fuels). During the analysed period, electricity consumption of pulp and paper sector increased from 16.0 PJ in 1979 to 69.3 PJ in 2010, while fuels consumption increased from 83.8 PJ in 1979 to 352.6 PJ in 2010. One important characteristic of the sector is its share of self-generated electricity, which was 40% in 1994 (
i.e., 14 PJ) and increased up to 51% in 2010 (
i.e., 35 PJ), with 1.74 GW of installed capacity [
31,
33,
34].
Figure 7.
Final energy consumption in Brazilian industrial sector.
Figure 7.
Final energy consumption in Brazilian industrial sector.
Source: elaborated from [
34].
Figure 8.
Energy consumption in Brazilian pulp and paper sector.
Figure 8.
Energy consumption in Brazilian pulp and paper sector.
Source: elaborated from [
34].
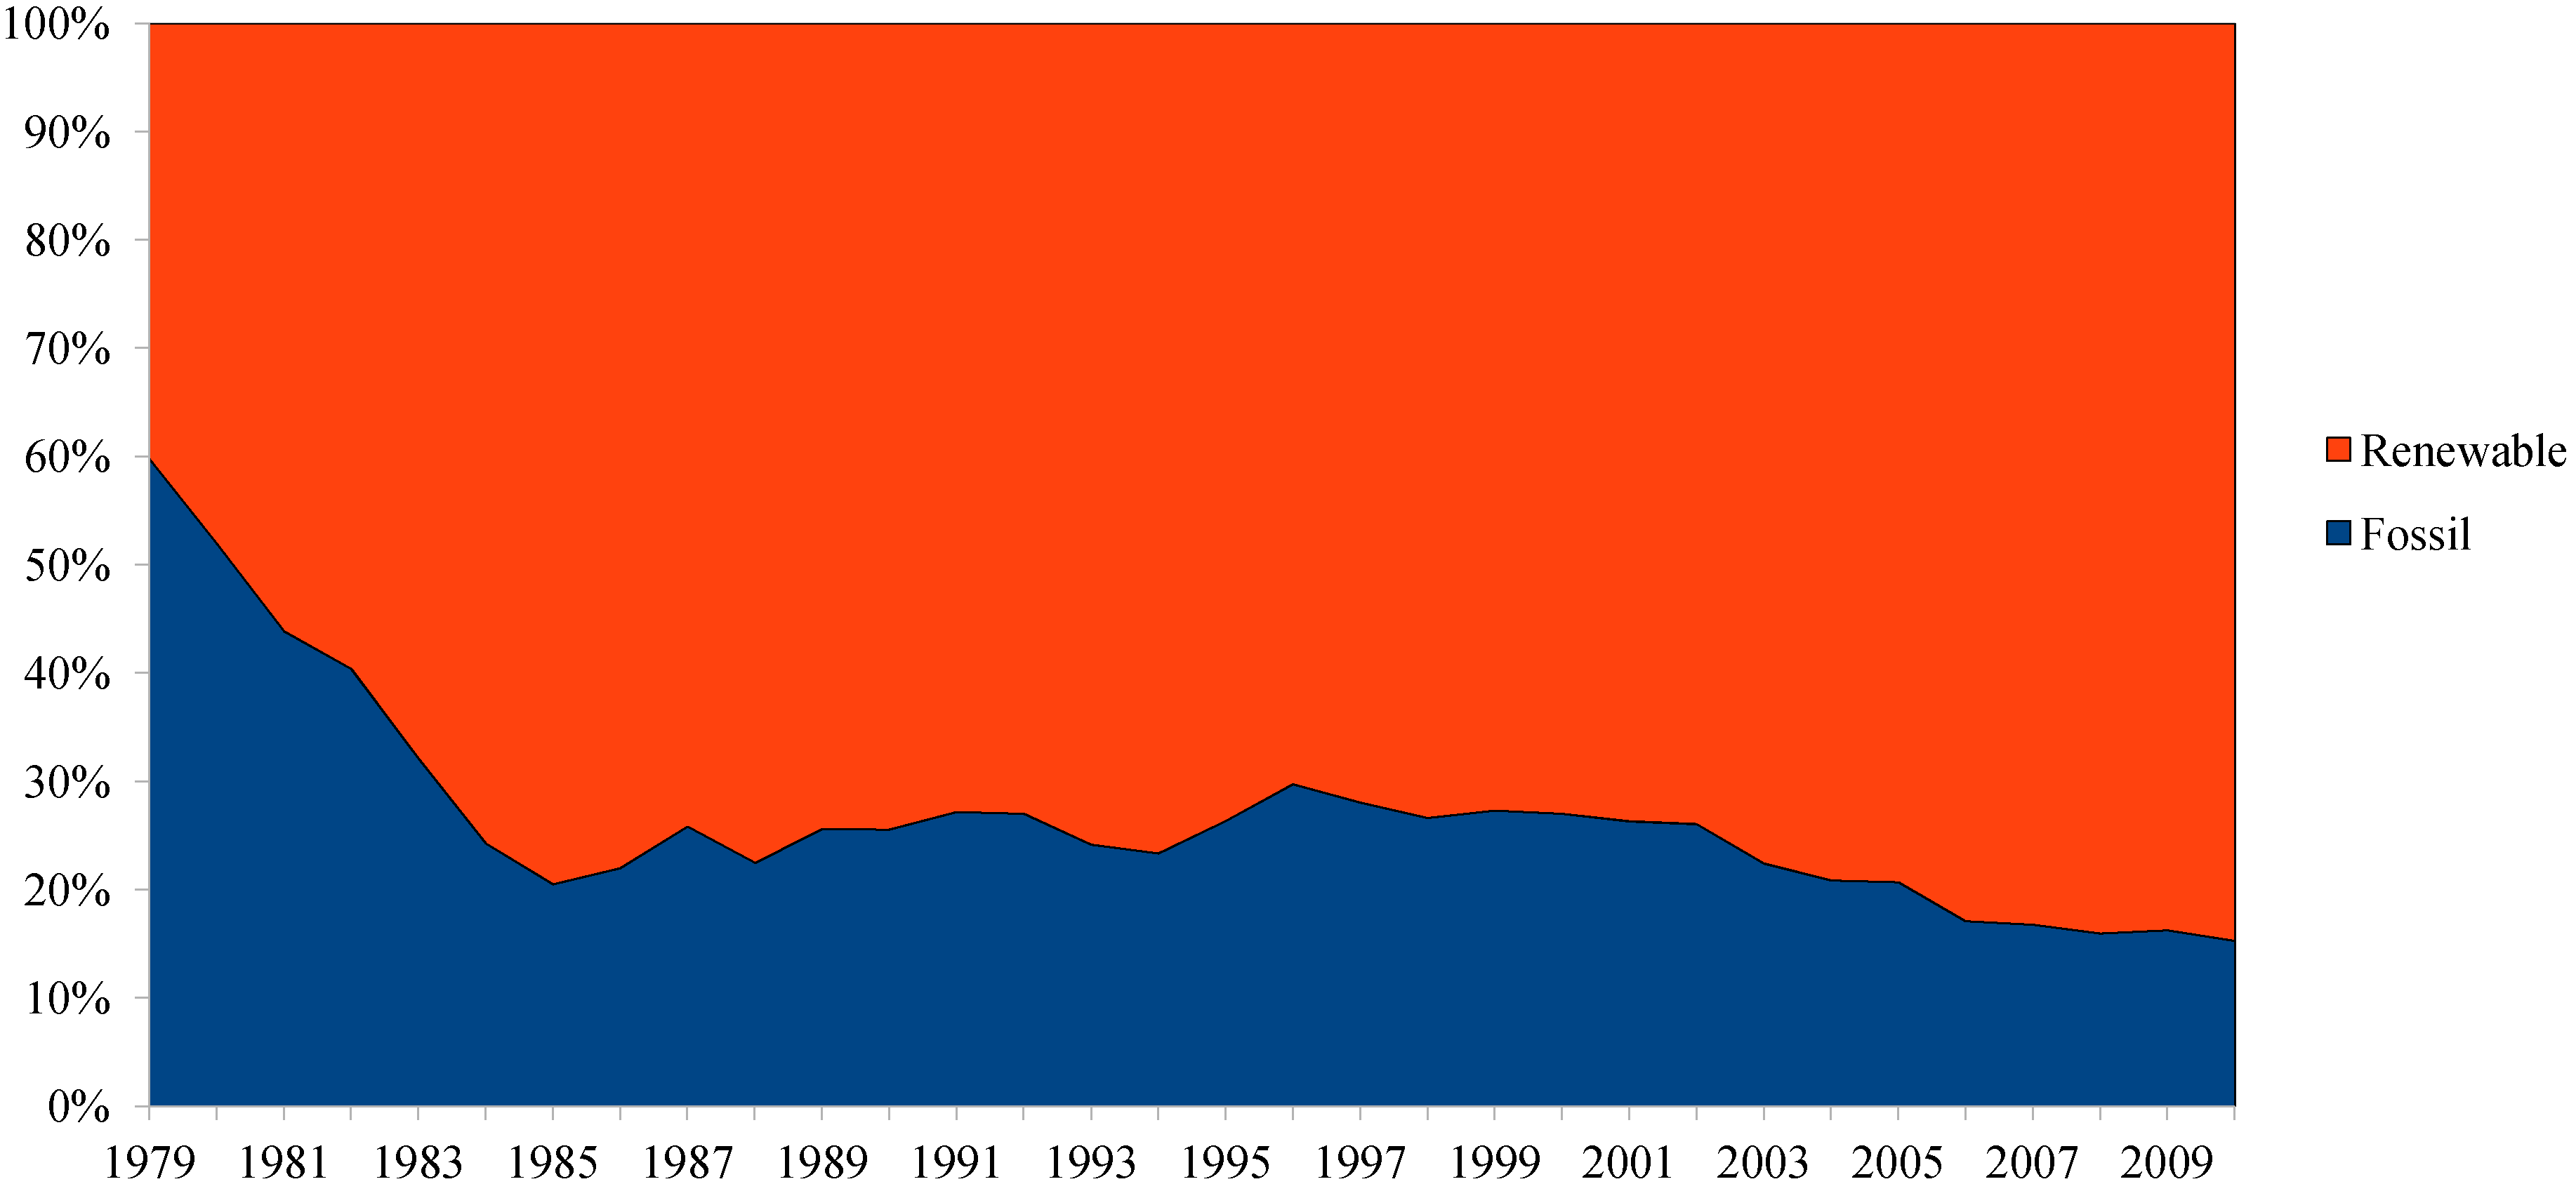
Figure 9 shows the shares of both renewable and fossil fuels used by the sector since 1979, according to the official Brazilian energy balance. In the fossil fuels category are included natural gas, coal, diesel oil, heavy oil, liquefied petroleum gas, petroleum coke, kerosene, and other not specified. Renewable fuels are related to wood, sugar cane bagasse, black liquor and other wastes.
Figure 9.
Share of fossil and renewable fuels consumed by Brazilian pulp and paper sector.
Figure 9.
Share of fossil and renewable fuels consumed by Brazilian pulp and paper sector.
Source: elaborated from [
34].
An important change in fuel mix happened between 1979 and 1985 when, due to rising oil prices, the Brazilian government implemented a programme in cooperation with the Brazilian Association of Pulp and Paper (BRACELPA) intending to replace the use of foreign oil-derived fuels in industry [
35]. During this programme there was a significant replacement of heavy oil by wood and since then the sector remained using a high share of renewable fuels.
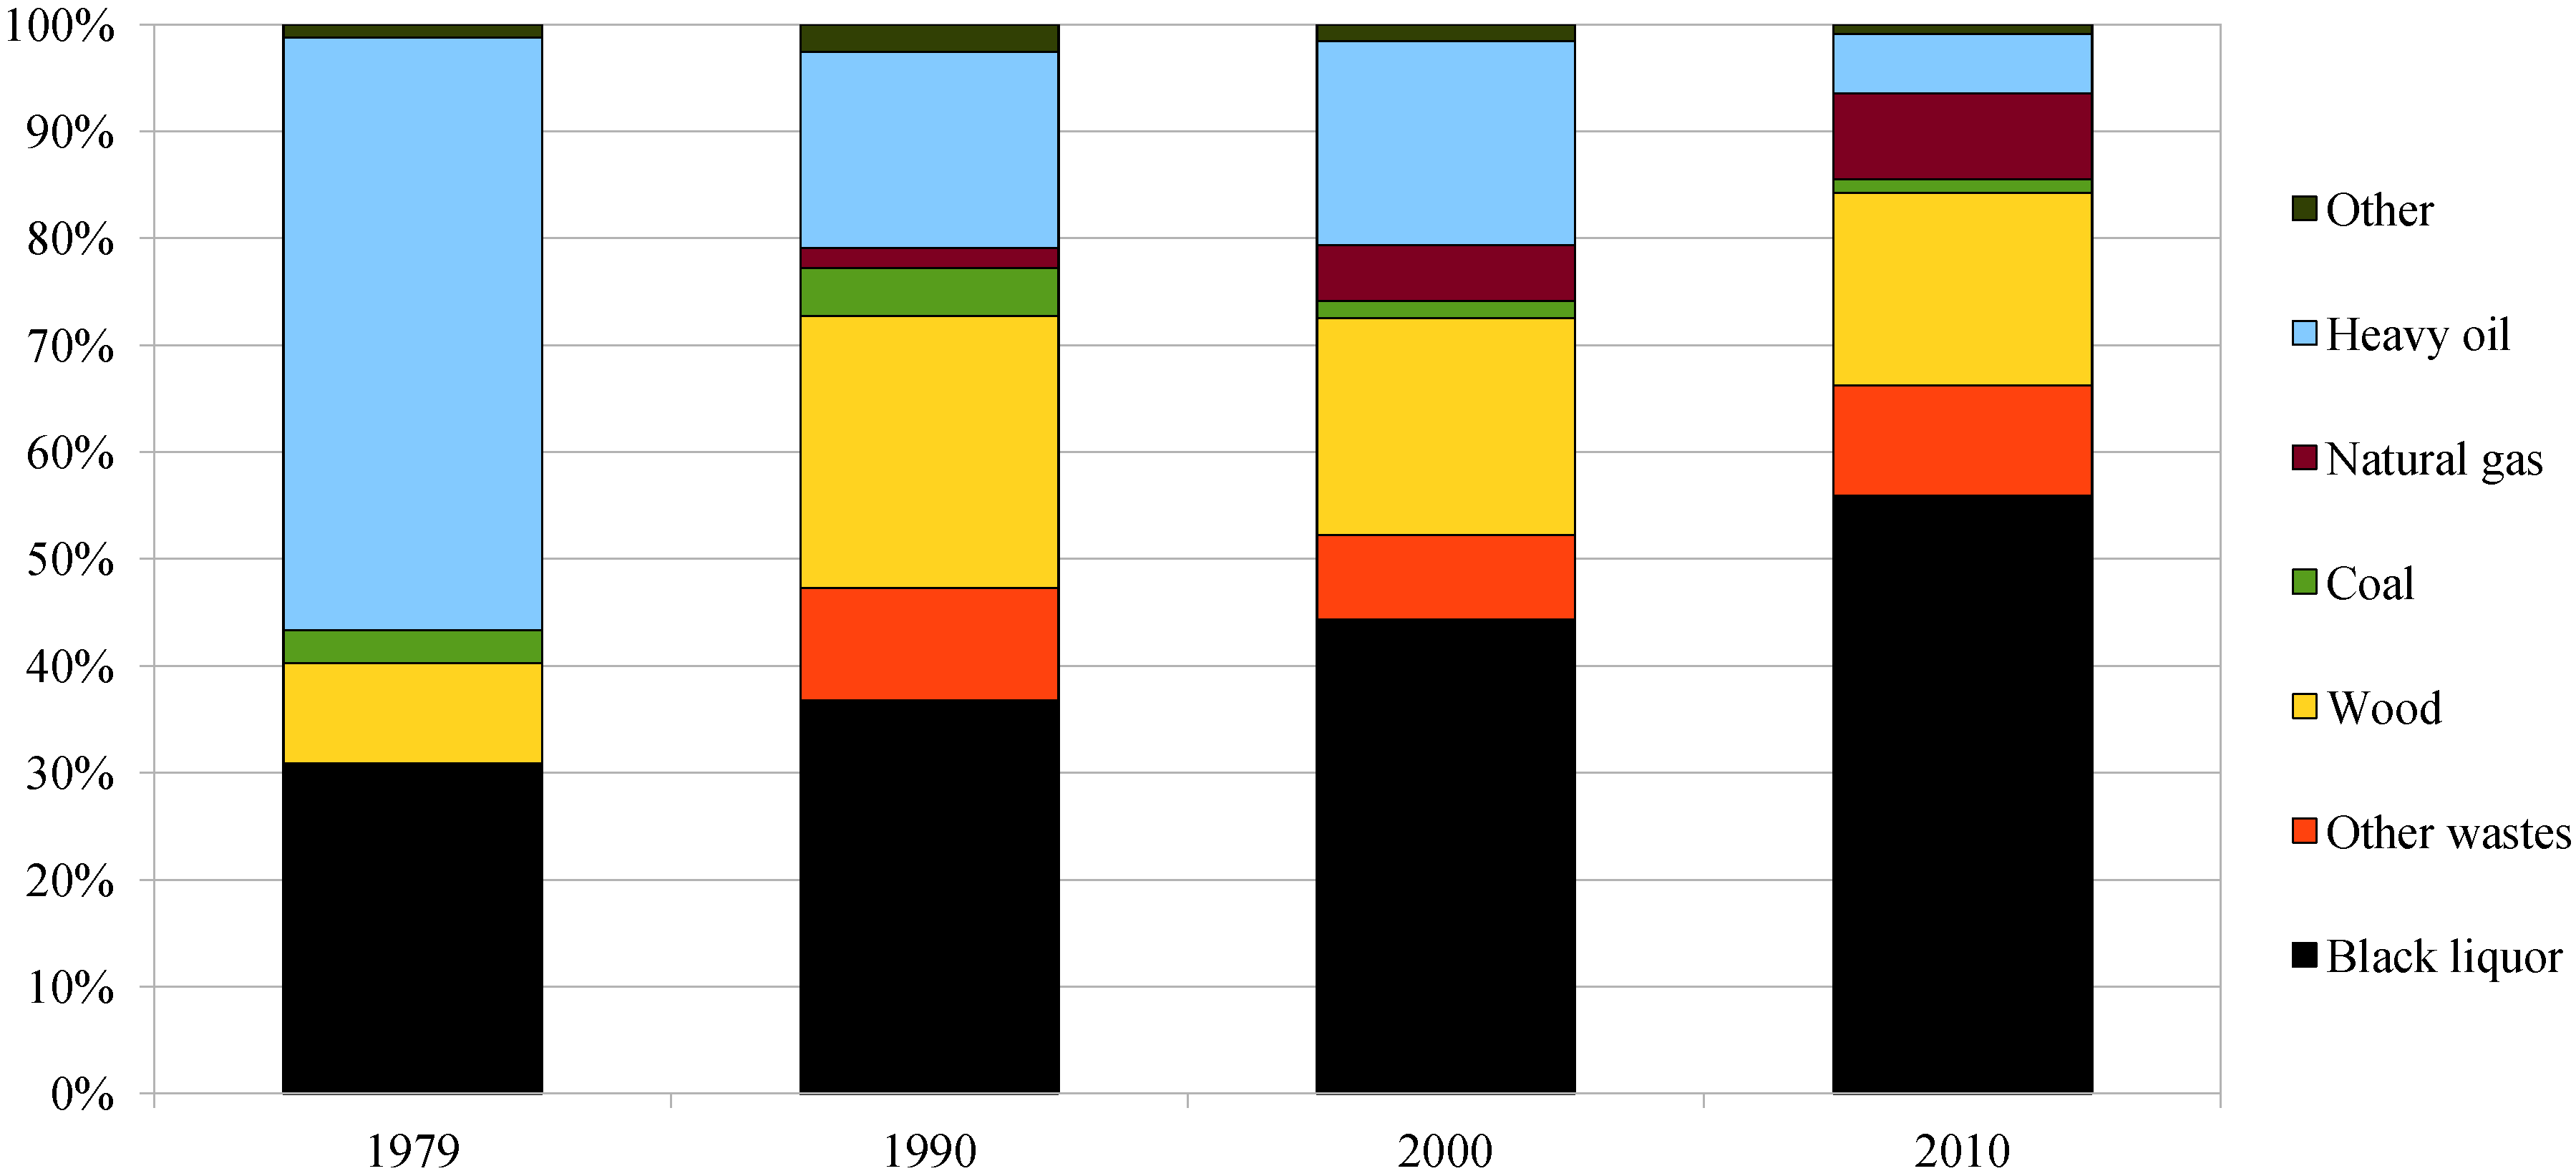
Figure 10.
Share of different fuels consumed by Brazilian pulp and paper sector.
Figure 10.
Share of different fuels consumed by Brazilian pulp and paper sector.
Source: elaborated from [
34].
The share of the main fuels used in pulp and paper sector is shown in
Figure 10. Black liquor was the main fuel used in 2010, with a share of 55.9%, in 1979 the share of this fuel was 30.9%. Its importance as the main fuel consumed in the pulp and paper sector can be explained by the high share of chemical processes in Brazilian wood pulp production and its significant growth in the considered period. Wood (18.0%), other wastes (10.3%), natural gas (8.0%), and heavy oil (5.5%) were the other main fuels consumed by the sector in 2010. Besides being significantly replaced by wood in the first half of the 1980’s heavy oil also lost importance during the 1990’s mainly because of the increasing share of natural gas, which was introduced in the industry by the end of the 1980’s.
4. Results and Discussion
The first part of this section shows the decomposition analysis of the energy consumption of Brazilian pulp and paper sector, showing the influence of the activity intensity, product mix and energy efficiency in the developments of electricity, heat and primary energy consumption, from 1979 to 2009. Further, the energy efficiency indexes developments are presented, followed by explanatory factors aiming to point some causes to the changes in the energy consumption patterns. The fourth part of this section is dedicated to the international comparison of the energy efficiency indexes developments of the selected countries.
Figure 11.
Influence of activity, structure and efficiency in the energy consumption development of Brazilian pulp and paper sector during 1979–2009.
Figure 11.
Influence of activity, structure and efficiency in the energy consumption development of Brazilian pulp and paper sector during 1979–2009.
As illustrated by
Figure 11, the energy consumption increase of Brazilian pulp and paper industry over the analysed period was mainly due the significant growth of pulp and paper production. Between 1979 and 2009, the rising activity level influenced increases of 398.0 PJ (321% of the energy consumption in 1979), 263.3 PJ (314%) and 53.8 PJ (335%) in the consumption of primary energy, fuels and electricity, respectively. The pulp production growth was approximately 503%, from 3.1 to 17.8 million tonnes, and the paper production grew 215%, from 3.0 to 9.4 million tonnes. In the same period, the primary energy consumption was 299% higher (from 124.0 to 494.1 PJ), while the fuel and electricity consumption growth was approximately 297% (from 83.8 to 332.4 PJ) and 302% (from 16.1 to 64.7 PJ), respectively.
The structural changes of the Brazilian sector were responsible for increases of 24.8 PJ (30%) and 23.7 PJ (19%) in fuels and primary energy consumption, respectively. However, the influence of these changes in the electricity consumption was much smaller, being responsible for a 0.4 PJ reduction (3%).
The most important structural changes in Brazilian pulp production were a larger share of chemical pulp, rising from 85.7% of the total pulp production in 1979 to 93.9% in 2009 and the smaller share of mechanical pulp, reducing from 6.1% to 3.1% in the same period. In paper production, the main structural changes were the larger share of the wrapping and packaging paper and board, from 47.5% to 56.4%, and the reduction of the other papers category, from 16.4% to 5.5%. Another significant change refers to the rising recovery fibre utilisation rate, from 28.0% in 1979 to 41.6% in 2009 [
30].
Higher efficiency levels also had great influence in the energy consumption changes of Brazilian sector. This factor influenced a 51.0 PJ (41%) reduction in the primary energy consumption over the 30 years period. The influences in fuels and electricity consumption were, respectively, 38.9 PJ (46%) and 5.6 PJ (35%).
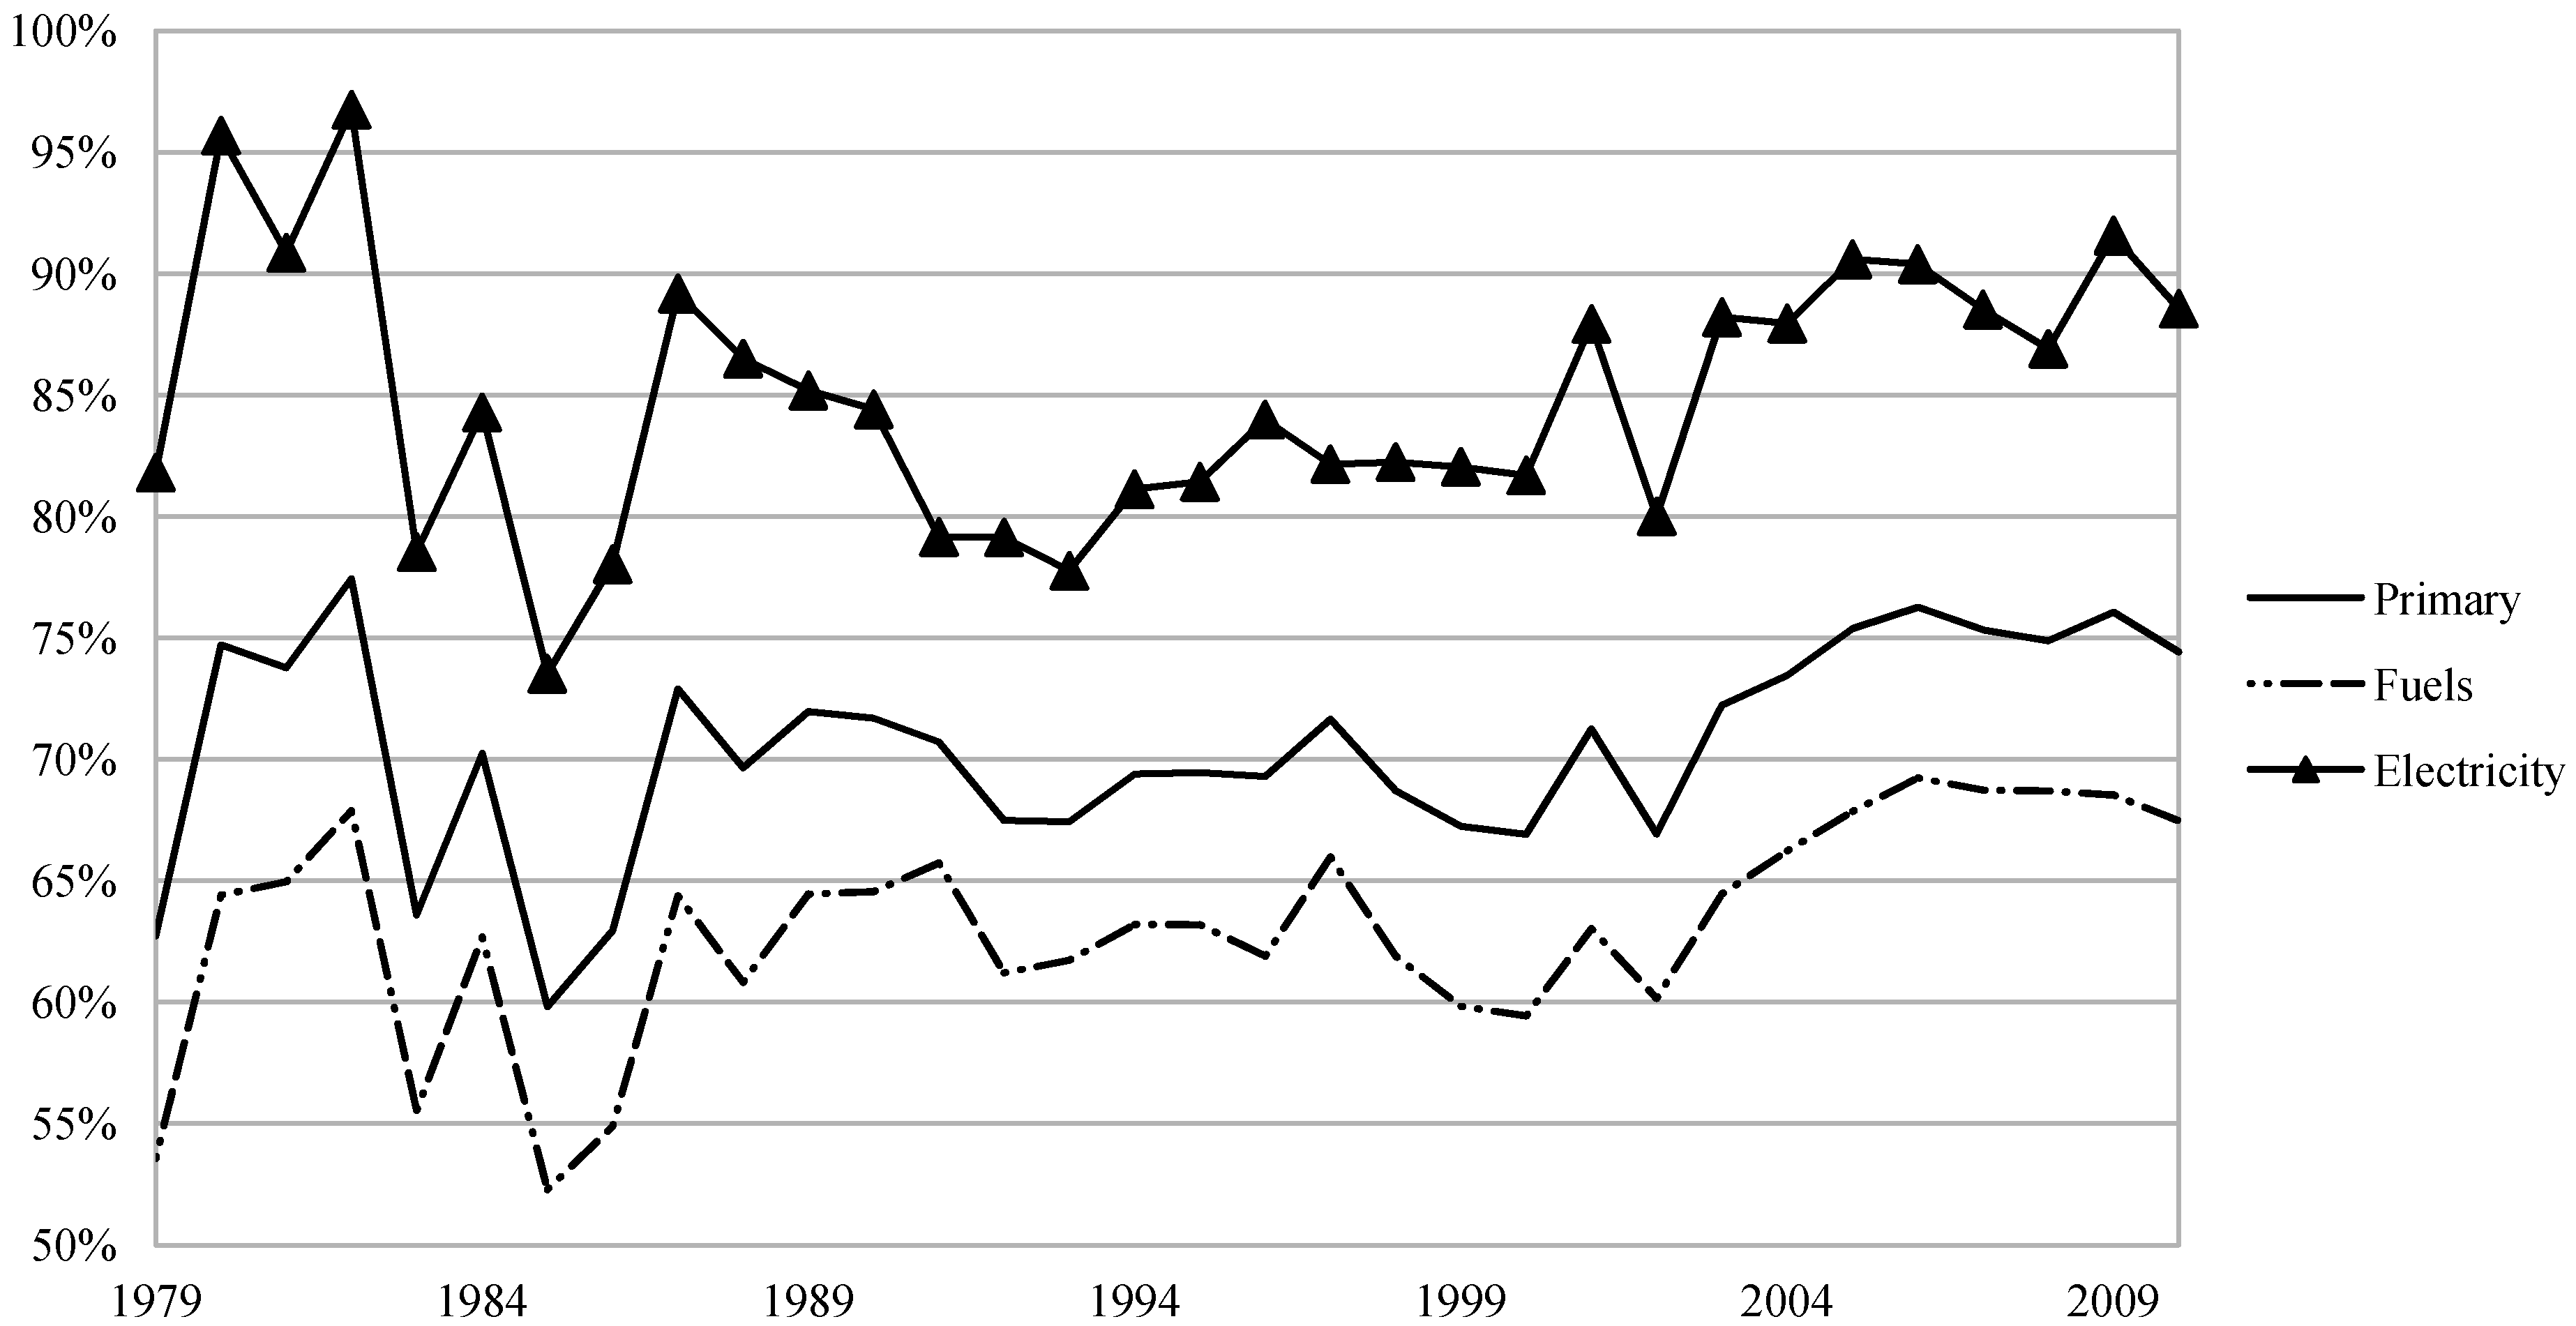
Figure 12.
Energy efficiency indexes for primary energy, fuels and electricity consumption in Brazilian pulp and paper sector during 1979–2009.
Figure 12.
Energy efficiency indexes for primary energy, fuels and electricity consumption in Brazilian pulp and paper sector during 1979–2009.
The developments of the energy efficiency levels of Brazilian pulp and paper industry, demonstrated by the energy efficiency indexes (EEI’s), are shown by
Figure 12. The graphic shows that the electricity consumption is historically more efficient than fuels consumption. However, as argued by [
14], this difference may be overestimated because of a possible use of fuels to run equipment in pulp and paper mills in the past.
As illustrated in
Figure 12, all the three energy efficiency indexes showed sharp variations between 1979 and 1987. From 1988 to 1999 the energy efficiency levels maintained relatively stable, except for the reduction in the efficiency of electricity consumption until 1991. During the 2000’s, mainly in its first half, rising energy efficiency levels can be visualised. From 2000 to 2009, the primary energy efficiency index grew from 67% to 76%, while the indexes referred to the fuels and electricity consumptions rose, respectively, from 59% to 69%, and from 82% to 92%, in the same period. These increases were influenced by two main factors,
i.e., rising energy prices and the installation of very large pulp mills, which are explained further.
4.1. Explanatory Factors
4.1.1. Energy Prices
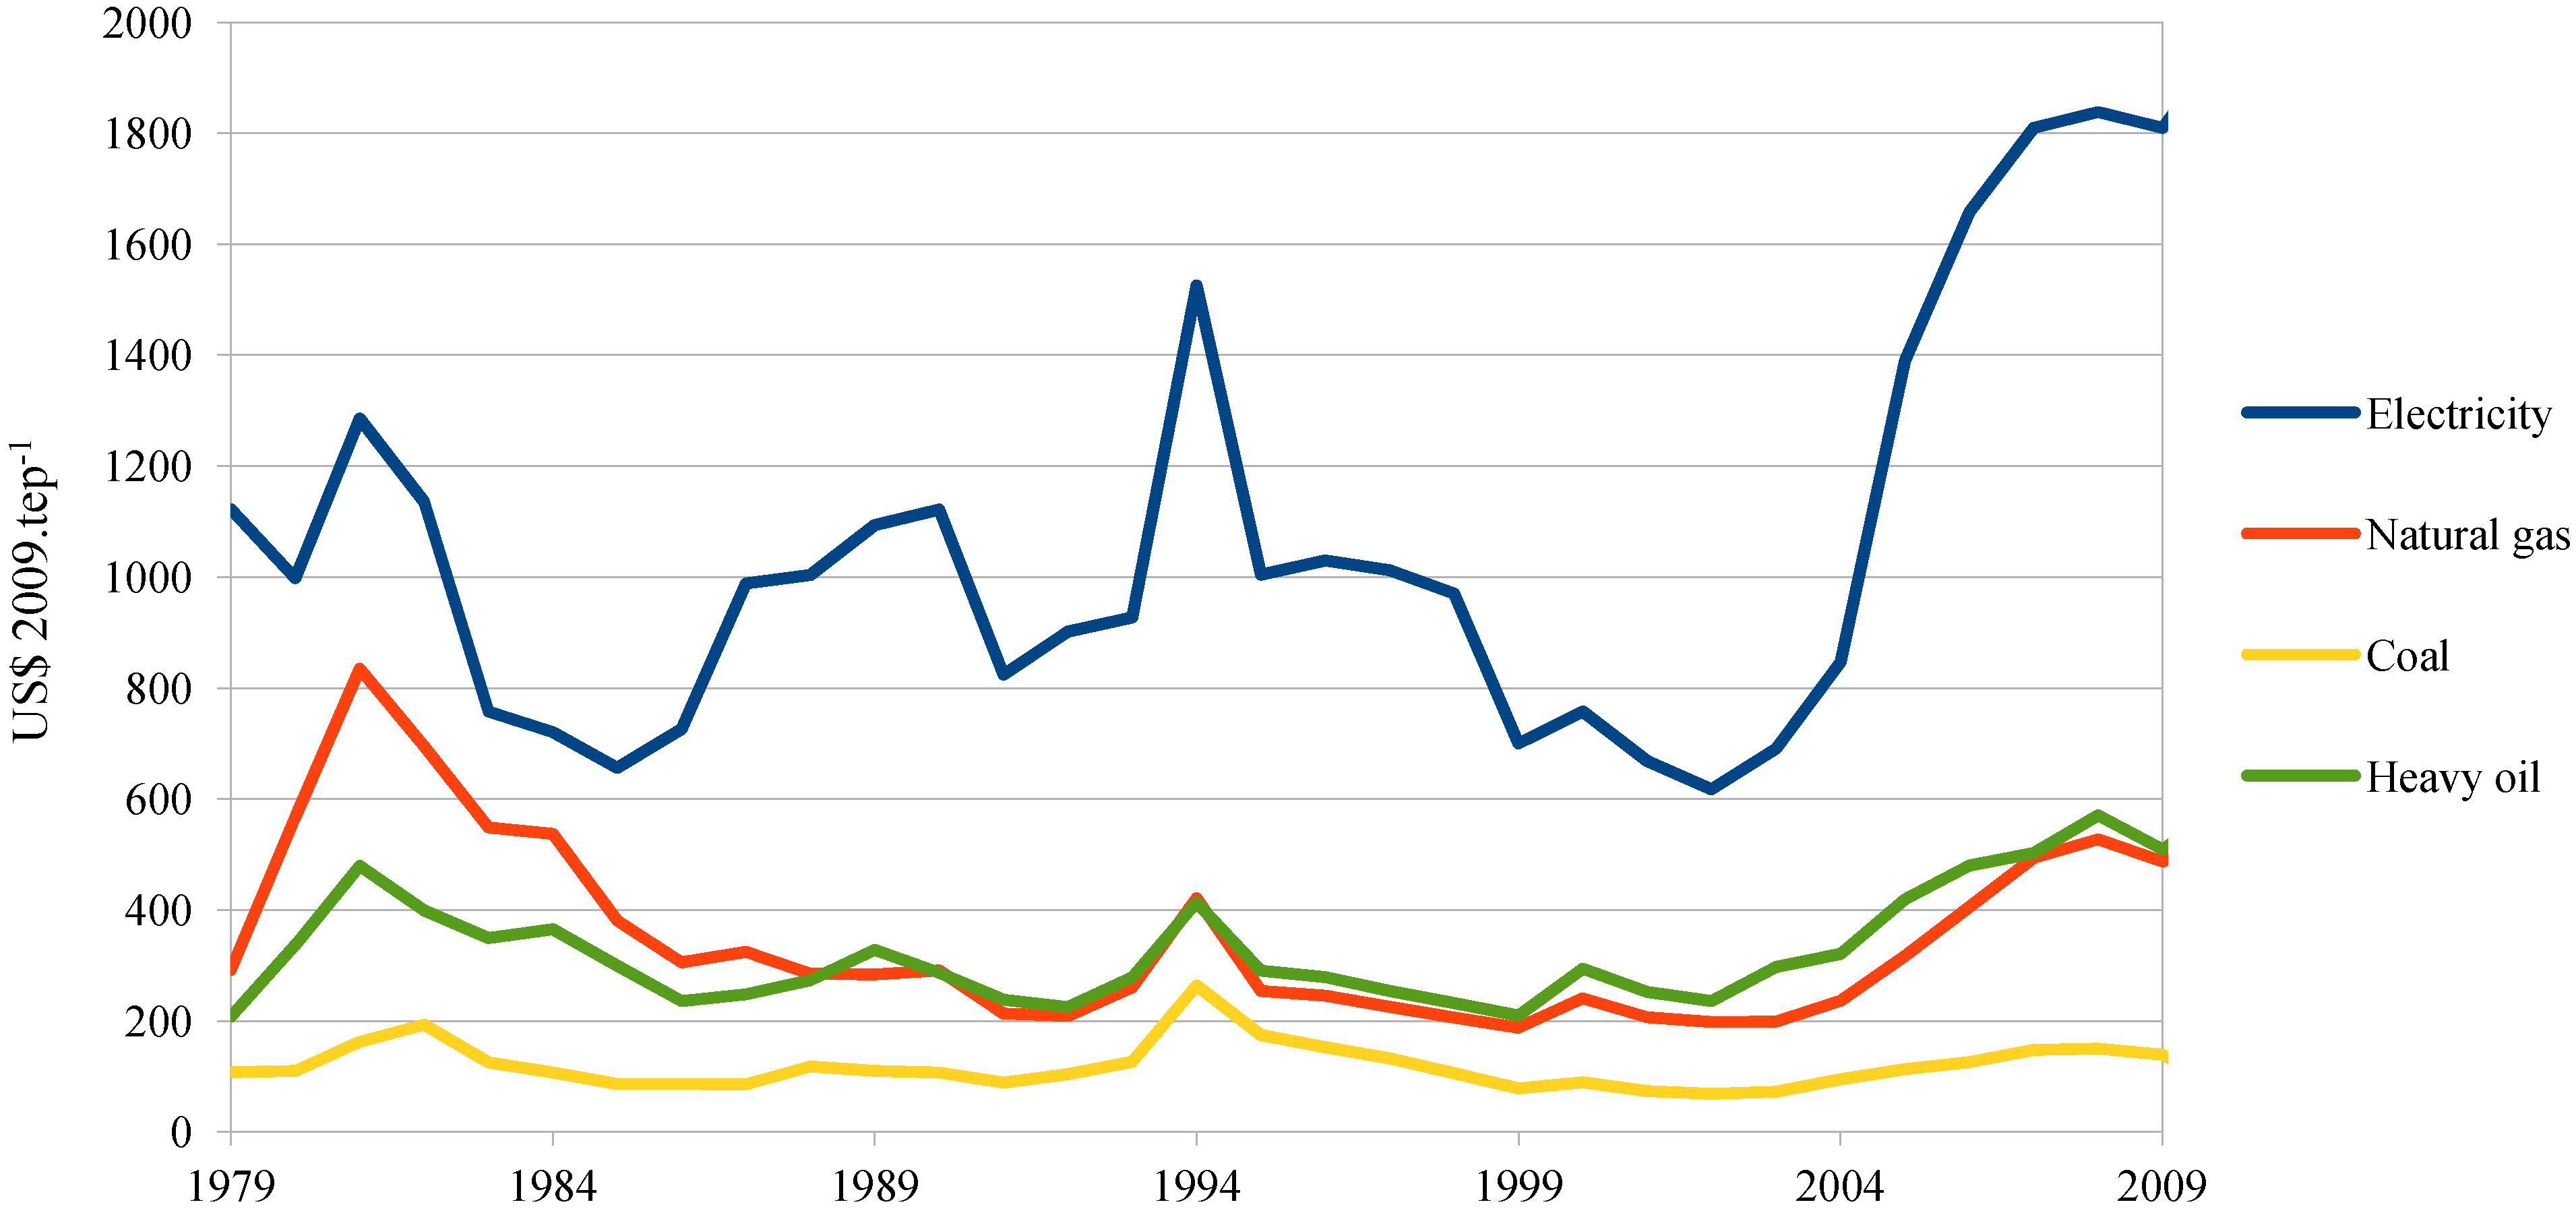
Figure 13 shows the variations in the prices of energy inputs (
i.e., electricity, natural gas, coal, and heavy oil) between 1979 and 2010. The prices related to 1994 showed an abrupt variation in all energy inputs and were not considered in the following discussion.
Figure 13.
Energy prices in Brazil from 1979 to 2009.
Figure 13.
Energy prices in Brazil from 1979 to 2009.
Source: elaborated from [
34].
Although some characteristics of the Brazilian sector (i.e., a high rate of self-generated electricity, of 51% in 2010, and the high share of chemical pulp in the overall production) harm a deeper analysis of the impacts of energy prices variations in the efficiency levels, there are two periods in which the energy prices showed some influence in the EEI’s. From 1981 to 1985, there were an overall reduction in energy prices, the average electricity price for industry reduced approximately 49%, heavy oil price 38% and coal 47% (natural gas consumption was not significant in early 1980s). During this period, the energy efficiency indexes related to fuels and electricity consumption reduced approximately 19%. Between 2002 and 2008 there were significant increases in energy prices. The electricity price rose approximately 198%, while the heavy oil, natural gas, and coal increased, respectively, 142%, 166%, and 118%. During these years the efficiency of electricity consumption increased 9% and the efficiency of fuels consumption was 14% higher.
4.1.2. Installed Capacity
The average size of Brazilian chemical pulp mills have been increasing during time, in 1993 the average installed capacity was approximately 138,600 tonnes of pulp per year, rising up to 500,340 tonnes/year.
Figure 14 shows the share of chemical pulp mills, by range of installed capacity, in total installed capacity. In 1993 there was no chemical pulp mill with an installed capacity higher than 1 million tonnes per year, while in 2009 these mills had a share of 56.1% in total installed capacity [
50]. The most significant change occurred between 2001 and 2007, when the share of mills with a production capacity higher than 1 million tonnes per year increased from 17.0% to 57.3%. There is no available data regarding changes in installed capacity of individual paper mills.
Figure 14.
Share of different ranges of installed capacity in the total installed capacity of Brazilian chemical pulp between 1993 and 2009.
Figure 14.
Share of different ranges of installed capacity in the total installed capacity of Brazilian chemical pulp between 1993 and 2009.
Source: elaborated from [
50].
4.2. International Comparison
4.2.1. Energy Efficiency Indexes
The great instability of the Brazilian energy efficiency indexes between 1979 and 1987, visualized in
Figure 12, can be explained by a possible asynchrony between the production and energy consumption data. Aiming to reduce the impact of this possible asynchrony, the international comparison was based on 3-years average energy efficiency indexes (EEI
3; the EEI
3 of a given year is built using the average values of both physical production and energy consumption of the given year and the two years before it ).
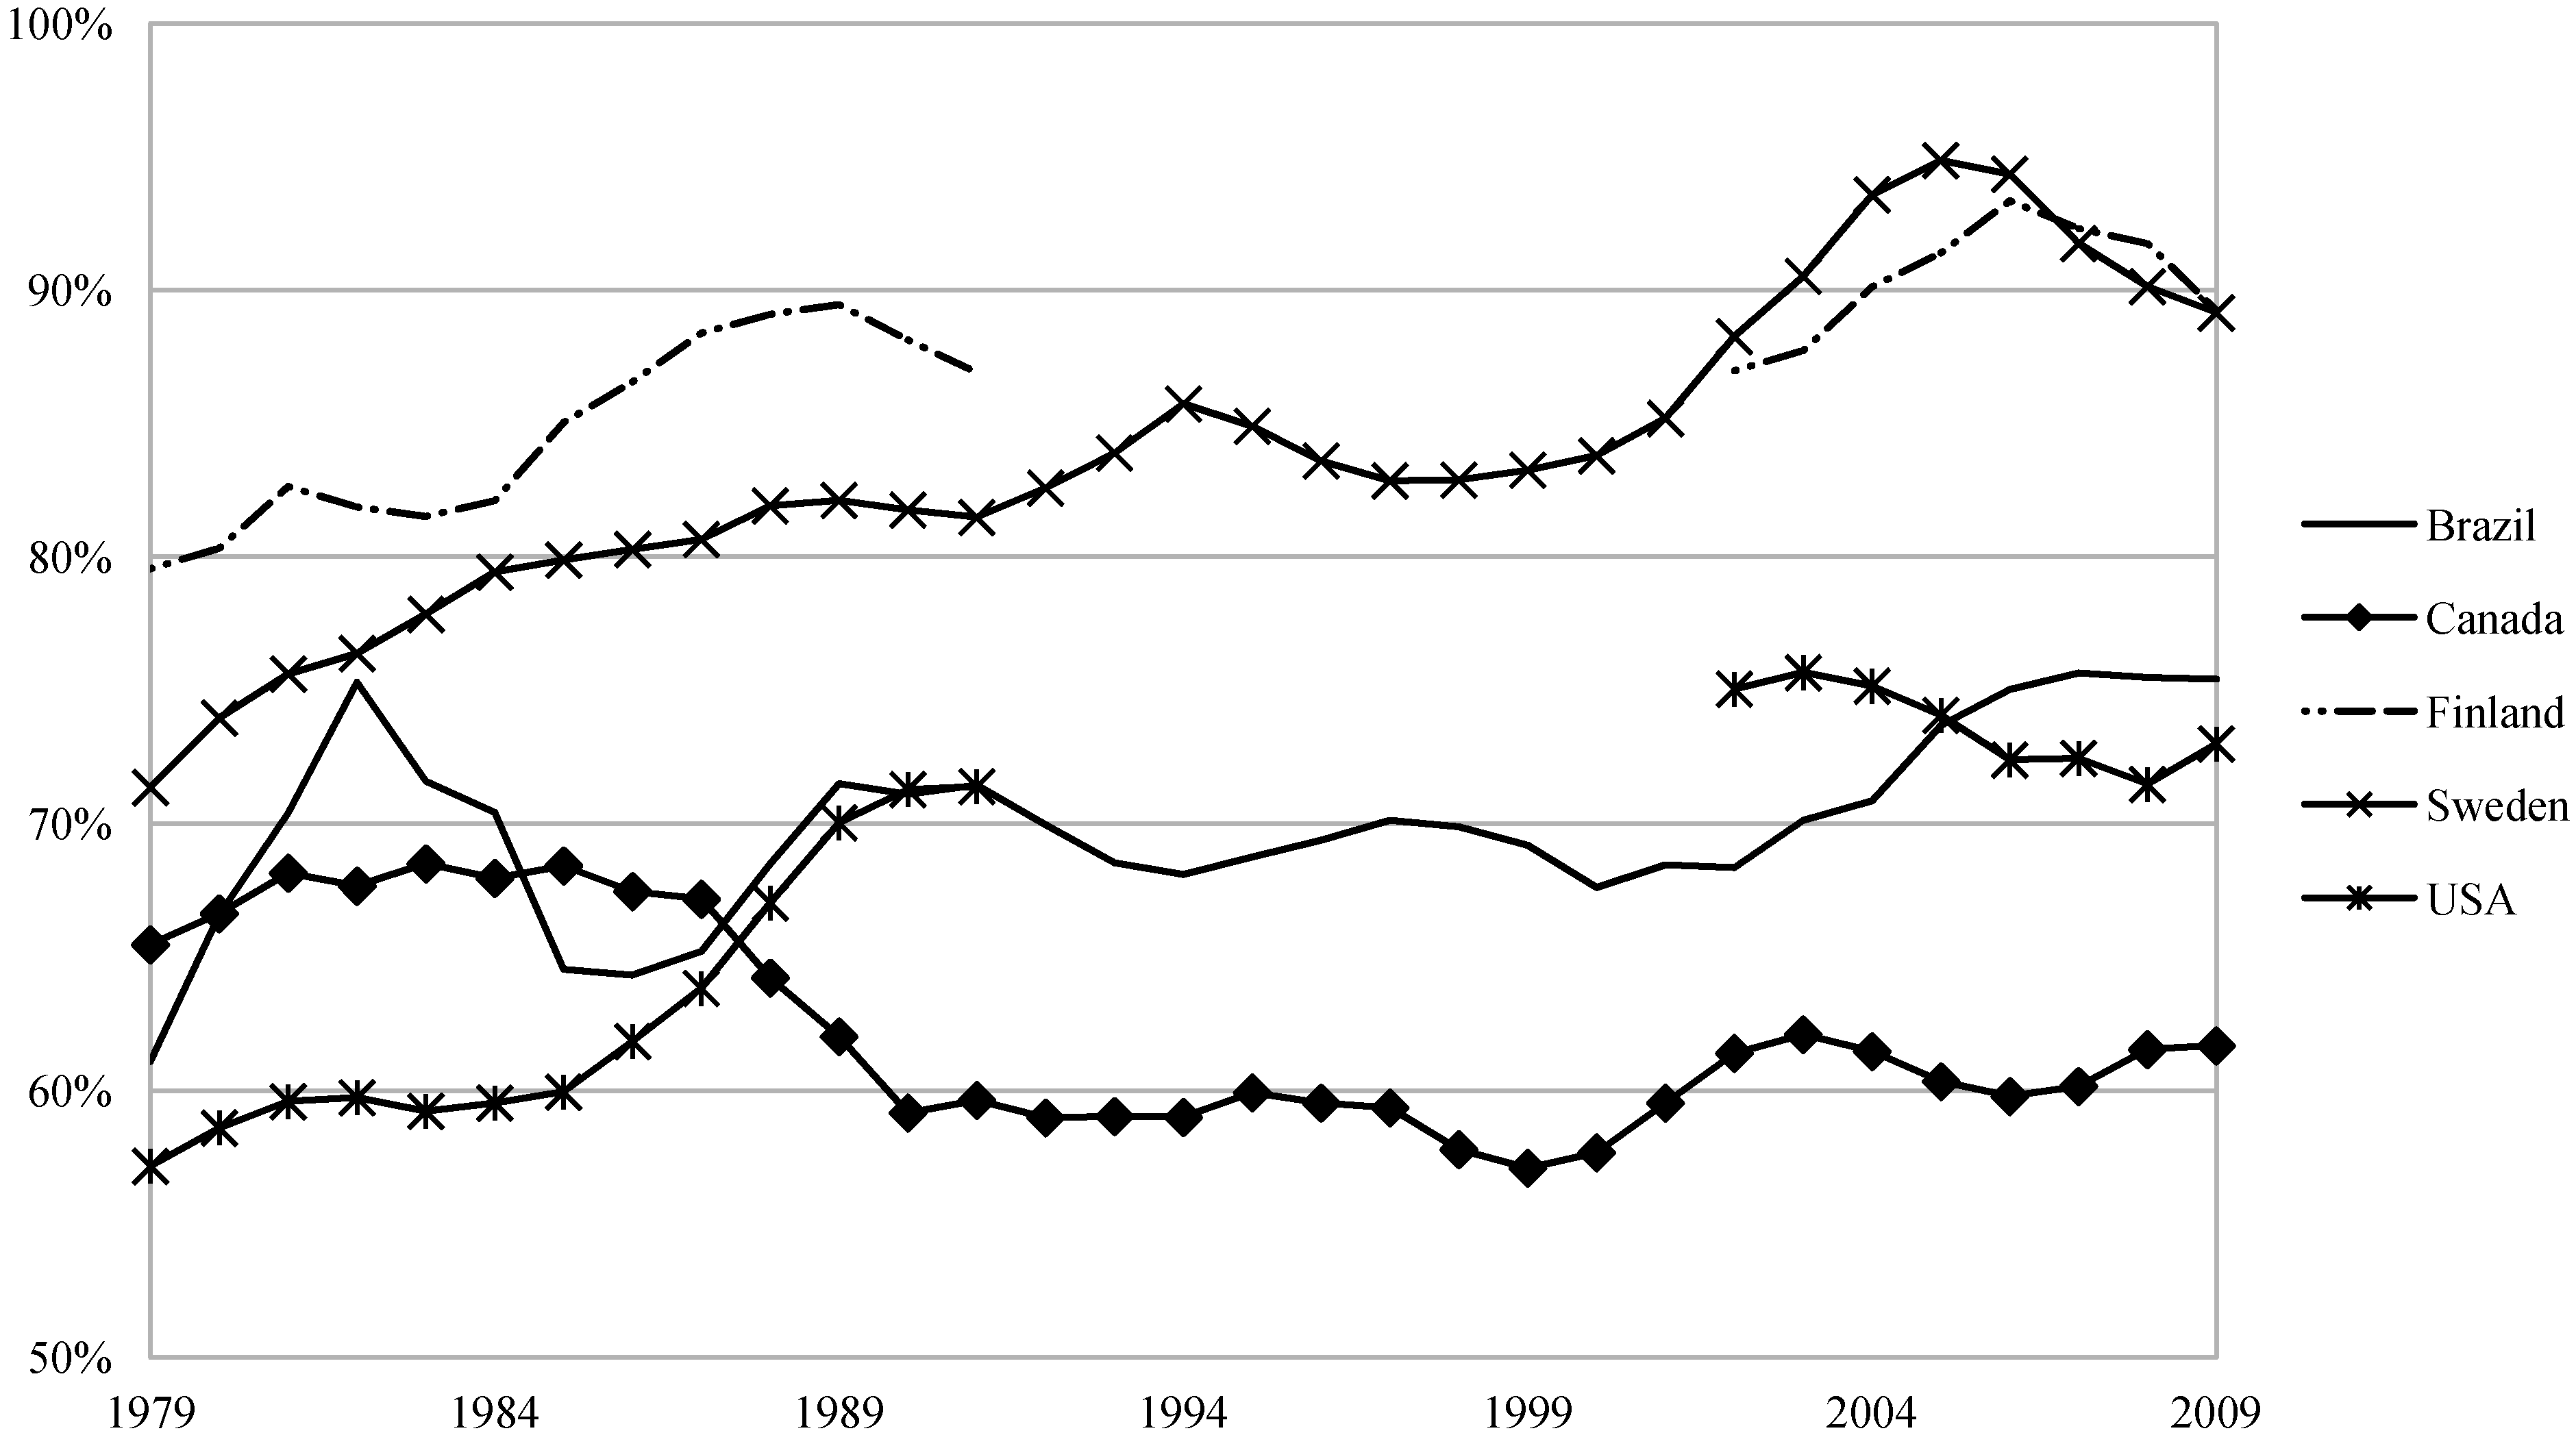
Figure 15 shows the developments of the EEI
3’s of the pulp and paper sector of Brazil, Canada, Finland, Sweden, and USA, from 1979 to 2009. The graphic shows that in 1979 the most energy efficient industry was the Finnish (with an EEI
3 of 80%), followed by the Swedish (71%), the Canadian (66%), the Brazilian (75%), and the American (57%) industries. In 2009, both the Finnish and Swedish industries were the most energy efficient amongst the analysed, with an EEI
3 of 89%, followed by the Brazilian (75%), the American (73%) and the Canadian (62%), being the latter the only one where there was a decrease in the energy efficiency level.
Figure 15.
Energy efficiency indexes—years average.
Figure 15.
Energy efficiency indexes—years average.
Considering that industrial energy efficiency levels are typically assumed to increase at an annual “normal rate” of 1% [
1,
6], the energy efficiency increases found in this analysis were significantly lower. The annual energy efficiency increase of the American industry was approximately 0.79% between 1979 and 2009. The Swedish, the Brazilian and the Finnish industries increased their energy efficiency levels at a rate of 0.71%, 0.67% and 0.37% per year, respectively, while the Canadian industry decreased its energy efficiency consumption at an annual rate of 0.19% mainly due to developments prior to 1990.
The 3-years average energy efficiency indexes showed 1229.0 PJ of potential primary energy savings amongst the analysed countries in 2009. In absolute terms, the biggest potential is in the American industry, with 742.7 PJ. The Canadian industry has a 290.5 PJ potential, followed by the Brazilian (115.7 PJ), the Finnish (40.8 PJ) and the Swedish (39.3 PJ).
4.2.2. Decomposition Analysis
The decomposition of the primary energy consumptions are shown in
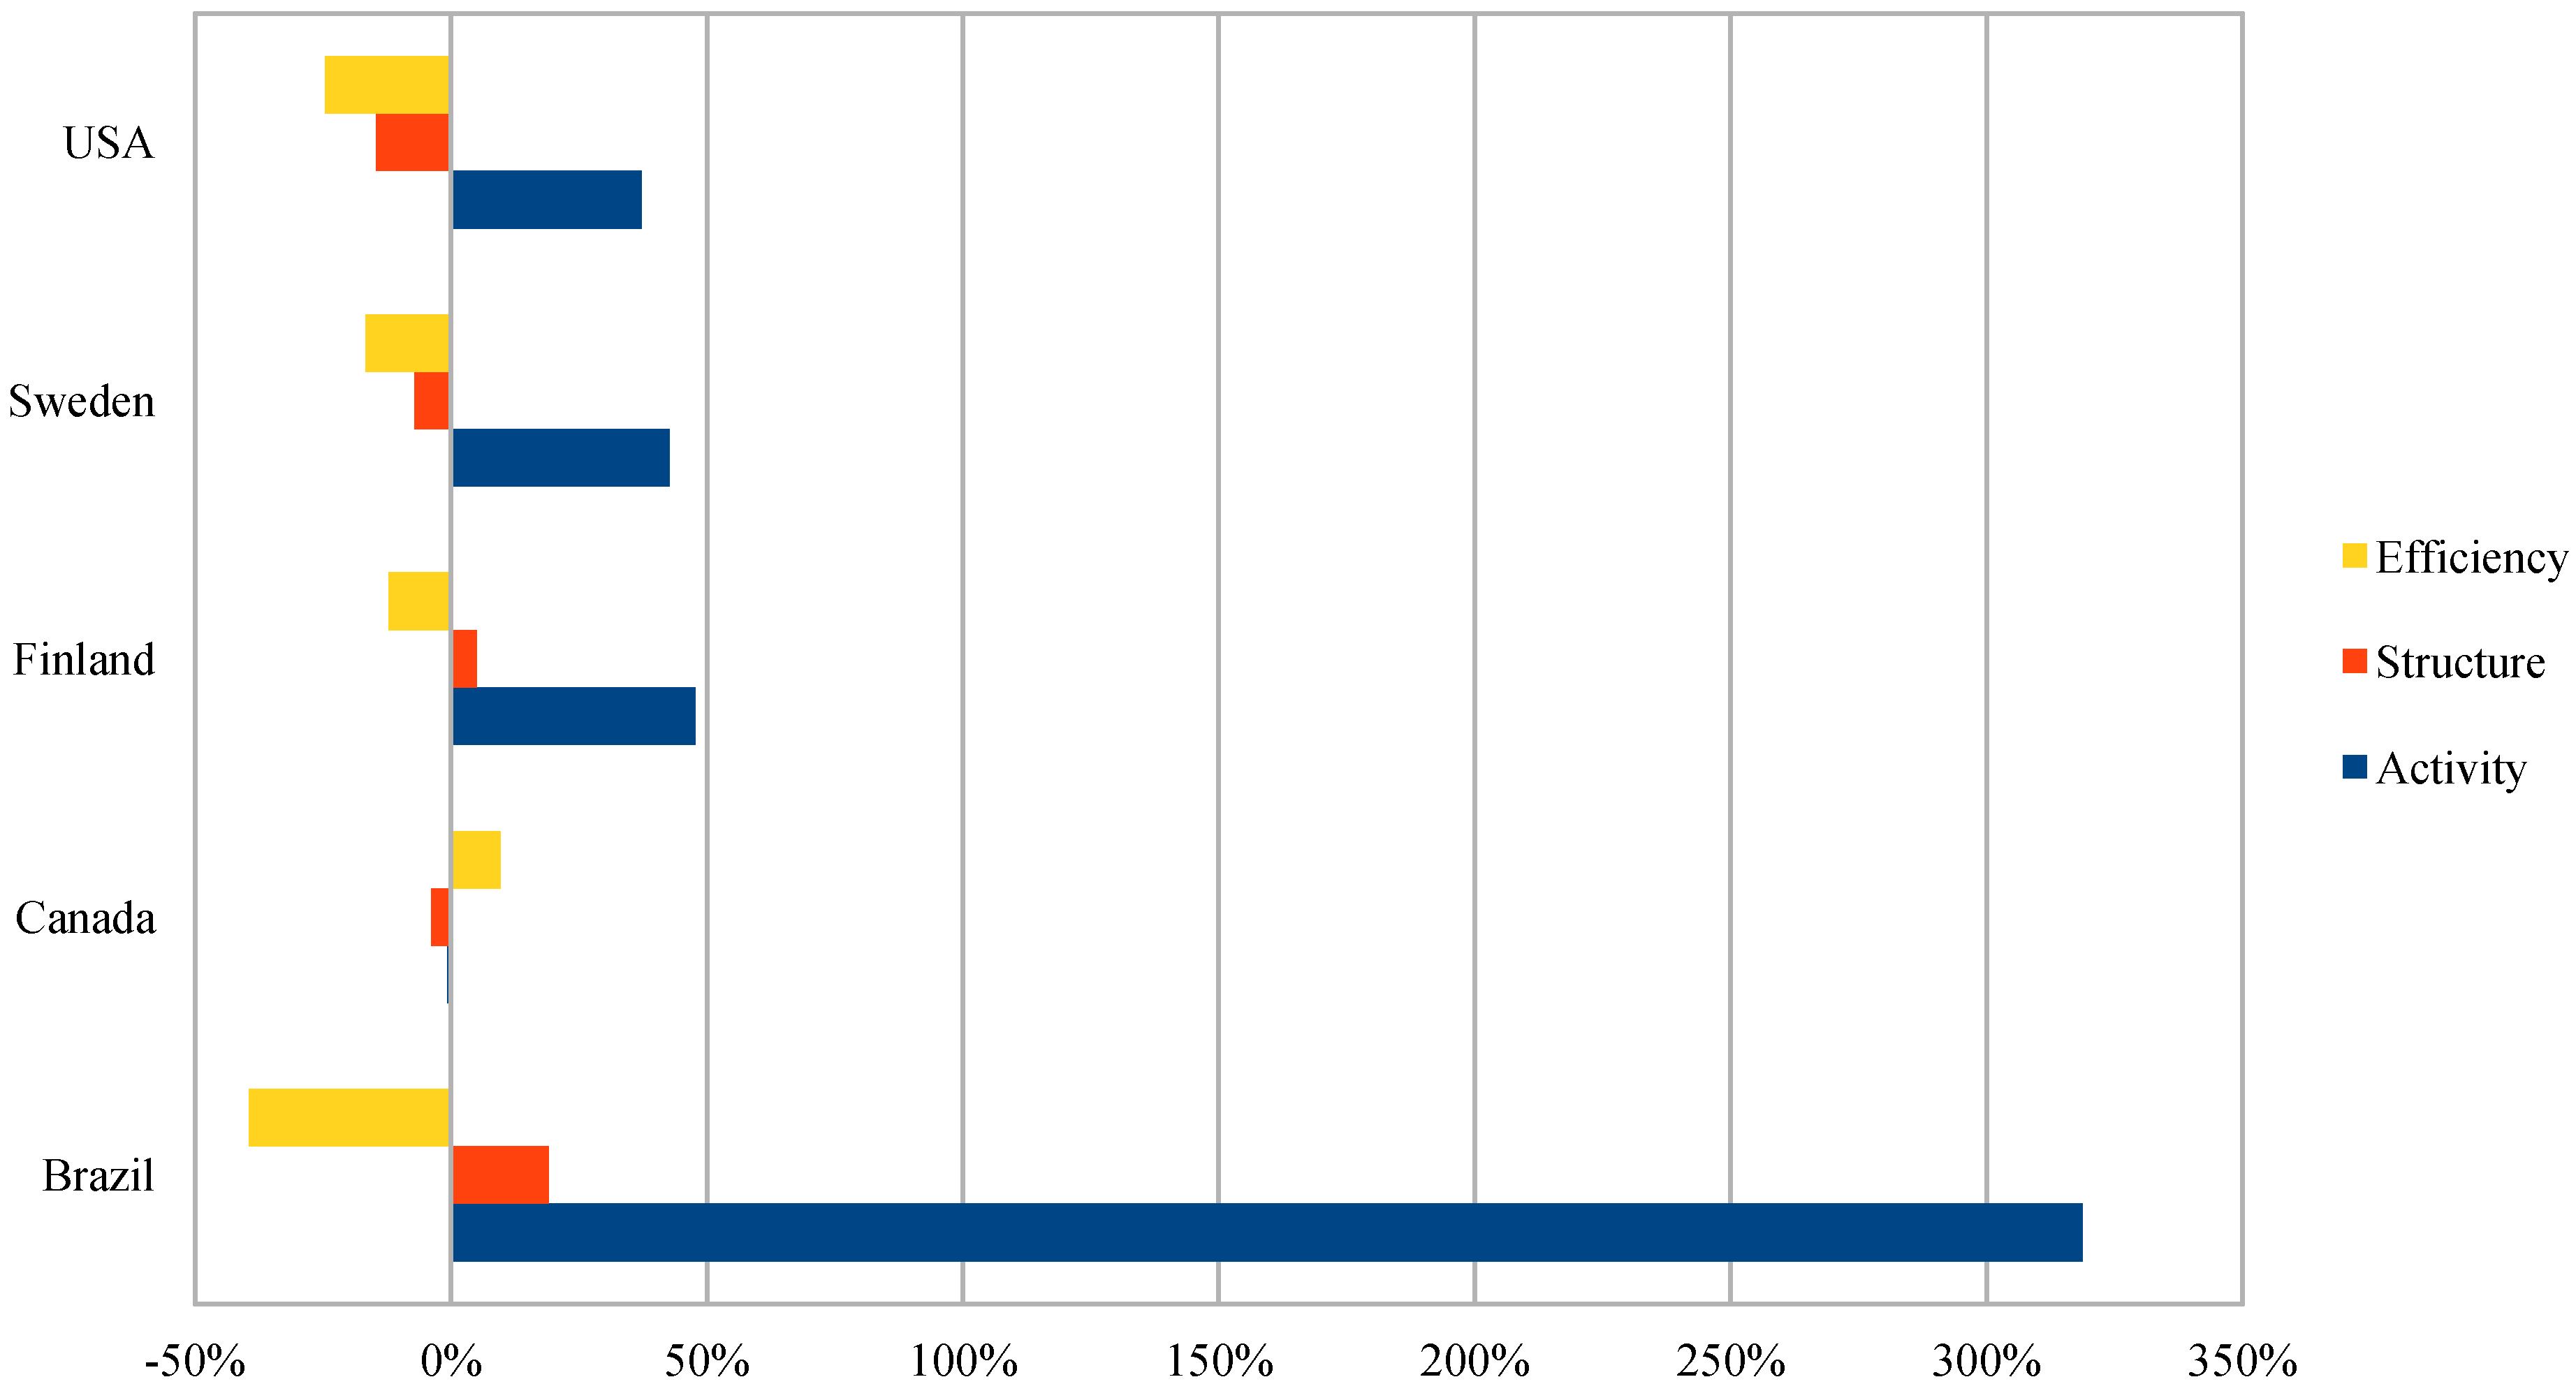
Figure 16. From 1979 to 2009, the primary energy consumption of the Brazilian, Finnish, Swedish and Canadian industries increased, respectively, 299% (from 124.0 to 494.1 PJ), 40% (from 216.3 to 303.7 PJ), 19% (from 294.5 to 350.0 PJ) and 5% (from 628.9 to 661.5 PJ). Only in the USA the primary energy consumption decreased between 1979 and 2009, approximately 2% (from 2,542.4 to 2,489.3 PJ).
Figure 16.
Influence of activity, structure and efficiency in primary energy consumption development from 1979 to 2009.
Figure 16.
Influence of activity, structure and efficiency in primary energy consumption development from 1979 to 2009.
As stated above, the Canadian industry was the only one where there was a decrease in the energy efficiency level. The lesser efficiency was responsible for an additional primary energy consumption of 61.0 PJ, which is approximately 10% of its energy consumption in 1979. In the industries of USA, Brazil, Sweden and Finland, the higher energy efficiency levels were responsible for savings of 623.8 PJ (25%), 48.9 PJ (39%), 49.1 PJ (17%), and 26.2 PJ (12%), respectively.
The analysis showed that structural changes in both the Brazilian and Finnish sectors led to an increase of 23.7 PJ (19%) and 11.0 PJ (5%), respectively, in primary energy consumption. In the USA, Canada and Sweden, structural changes were responsible for primary energy savings of 373.4 PJ (15%), 24.4 PJ (4%) and 21.0 PJ (7%), respectively.
The main changes in the Finnish production mix between 1979 and 2009 were the reduction of the newsprint share, from 26.4% to 2.0%, and the rising share of the printing & writing paper, from 32.7% to 62.7%, in the overall paper production [
30].
In the United States of America, the most significant structural change was the higher utilisation rate of recovered fibre, which rose from 24.5% in 1979 to 63.5% in 2009 [
30].
In the Swedish pulp and paper sector, the printing & writing production share increased from 15.3 to 26.7%, while the “other papers” category share reduced from 6.3 to 1.1% over the analysed period. However, the most significant changes were the reduction of the chemical pulp share, from 76.0 to 69.9%, leading to an increase in the mechanical pulp share, from 21.8% to 28.5%. The rising recovered fibre utilisation rate, from 7.8 to 17.3%, has also influenced the energy consumption significantly [
30].
In Canada, the production of chemical pulp was belittled by the mechanical pulp. The share of chemical pulp decreased from 60.0% in 1979 to 52.1% in 2009, while the mechanical pulp share increased from 37.9% to 46.9% in the same period. In Canadian paper production, the newsprint production share decreased from 64.6 to 34.1%, while the printing & writing share grew from 11.3 to 34.5%. Another important structural change was the higher recovery fibre utilisation rate, which grew from 6.2 to 29.3% [
30].
The influence of changes in the activity level was much higher in the Brazilian pulp and paper sector, where increases of 503% and 215% in pulp and paper production, respectively, were responsible for a 395.2 PJ (319%) increase in the primary energy consumption from 1979 to 2009. The higher activity level was also responsible for energy increases in the industries of the USA, Sweden, and Finland, respectively of 945.3 PJ (37%), 125.7 PJ (43%), and 103.3 PJ (48%). In the USA, the pulp and paper production grew 7.3% (from 45.9 to 49.3 million tonnes) and 24.3% (from 57.4 to 71.4 million tonnes). The Swedish pulp and paper production increased 28.5% (from 9.1 to 11.7 million tonnes) and 65.2% (from 6.5 to 10.8 million tonnes), respectively. In Finland, the pulp production grew 23.9% (from 7.1 to 8.7 million tonnes) and the paper production increased 84.8% (from 5.7 to 10.6 million tonnes). In Canada, both the pulp and paper production were lesser in 2009 than in 1979. In this period, the Canadian pulp production decreased approximately 11.7% (from 19.6 to 17.3 million tonnes) and the paper production reduced 4.9% (from 13.5 to 12.8 million tonnes). These production decreases led to a 4.5 PJ savings in the primary energy consumption, which corresponds to 1% of the primary energy consumed in 1979.
4.3. Further Work
Different production types are not in the same level of energy intensity in a country nor at world wide comparision. Changes in production from e.g., chemical pulp to mechanical pulp do create changes in energy efficiency index as it is currently defined. For more detailed analysis studying the same data with individual mill changes included would be an interesting further proposition.
As data issues are the main source of uncertainty of our study, industries entities, or even governments, should put an effort to improve quality and detail of data. If both higher quality and more detailed data was available, it would be possible to better estimate the effectiveness of different energy policies approach.
5. Conclusions
From 1979 to 2009 the Brazilian pulp and paper sector experienced a significant growth. In this period, the pulp production increased approximately 503% (from 3.1 to 17.8 million tonnes) while paper production grew 215% (from 3.0 to 9.4 million tonnes). This increase in the production intensity of the country was the main factor of the rising energy consumption, influencing increases of 263.3 PJ and 53.8 PJ in fuels and electricity consumption, respectively.
Even in a country, Brazil, with rapidly developing pulp and paper industry the often assumed global industrial energy efficiency improvement was not reached, but was at 0.67% level. More positively in studied main pulp and paper producing countries the same index varied between 0.8 and 0.6%. It seems that even though the energy efficiency development is lower than often assumed the global CO2 reduction targets are reachable if the pulp and paper industry manages to still significantly reduce the fossil energy usage like it has done between 1979 and 2009.
Although there were significant energy savings in fuels (38.9 PJ) and electricity (5.6 PJ) consumption due to higher efficiency in the sector, it was estimated there is still a potential reduction of 146.2 PJ and 7.8 PJ in fuels and electricity consumption, respectively.
From 2000 to 2009, the energy efficiency index related to the primary energy consumption increased from 67% to 76%. This increase was influenced by the significant rising energy prices and the installation of very large new pulp mills, mainly in the first half of the decade.
Amongst the selected countries for comparison, both the Finnish and Swedish industries were the most energy efficient, with an energy efficiency index, 3-years average, of 89%, followed by the Brazilian (75%), the American (73%) and the Canadian (62%), the latter being the only one where there was a decrease in the energy efficiency level.
Considering an increase of 1% per year as a “normal rate” for the industrial sector, the annual increments of the energy efficiency levels were not as high as e.g., IEA predicts. The annual energy efficiency increase of the pulp and paper industries of the USA, Sweden, Brazil, and Finland were, respectively, 0.79%, 0.71%, 0.67%, and 0.37%. The Canadian energy efficiency decreased at an annual rate of 0.19% between 1979 and 2009.


