Sustainability of the Biorefinery Industry for Fuel Production

Abstract
:1. Introduction
2. Bio-oils
2.1. Soybean
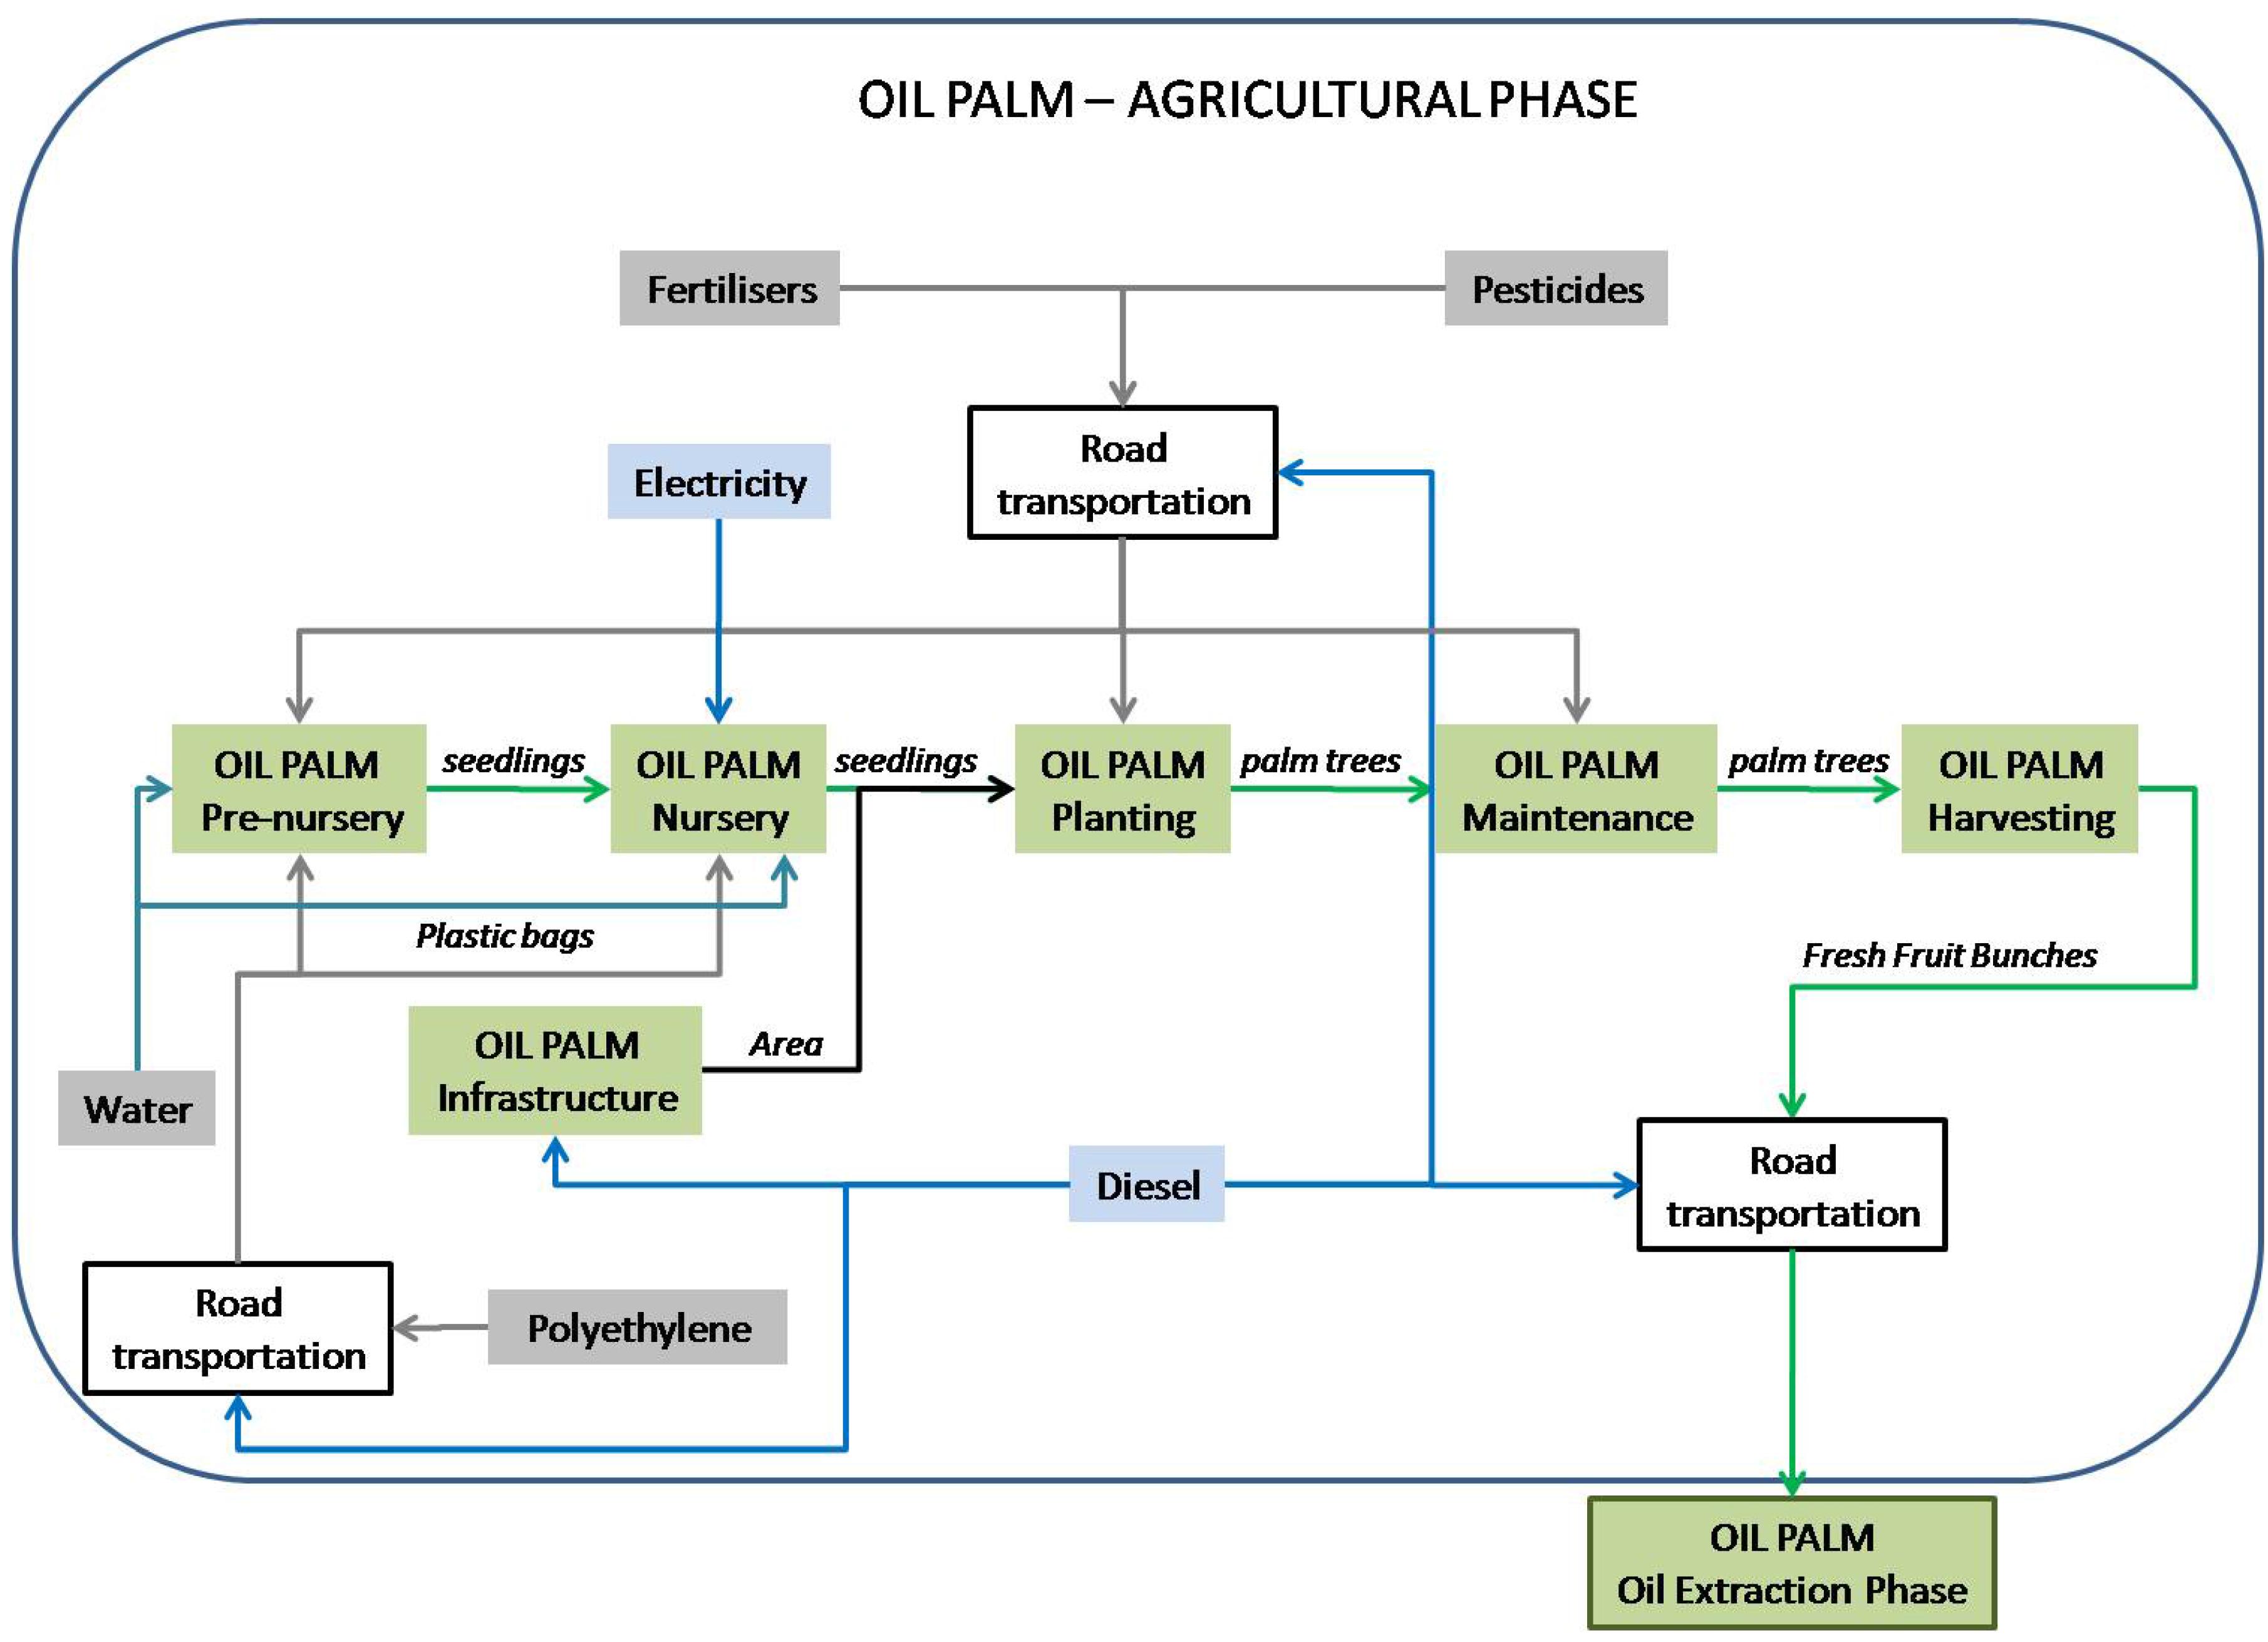
2.2. Palm Oil
2.2.1. Palm Oil Life-Cycle Inventory


| Inputs | Outputs | ||||
|---|---|---|---|---|---|
| Material | Unit | Quantity | Material | Unit | Quantity |
| Seeds | Unit | 160.00 | Fresh Fruit Bunches (FFB) | ton | 500 |
| CO2 | ton | 129.30 | Emissions | kg CO2 eq. | 22,380.27 |
| LDPE | kg | 2.75 | Solid Waste | kg (Plastic bags) | 2.75 |
| Water | L | 1791 | |||
| Urea | kg | 1,637.61 | |||
| TSP | kg | 4,282.86 | |||
| KCl | kg | 2,240.15 | |||
| MgSO4 | kg | 137.04 | |||
| Diesel | kg | 3,609.60 | |||
| Pesticide | kg | 82.5 | |||
2.2.2. Characterization of the Environmental Impacts of Oil Palm

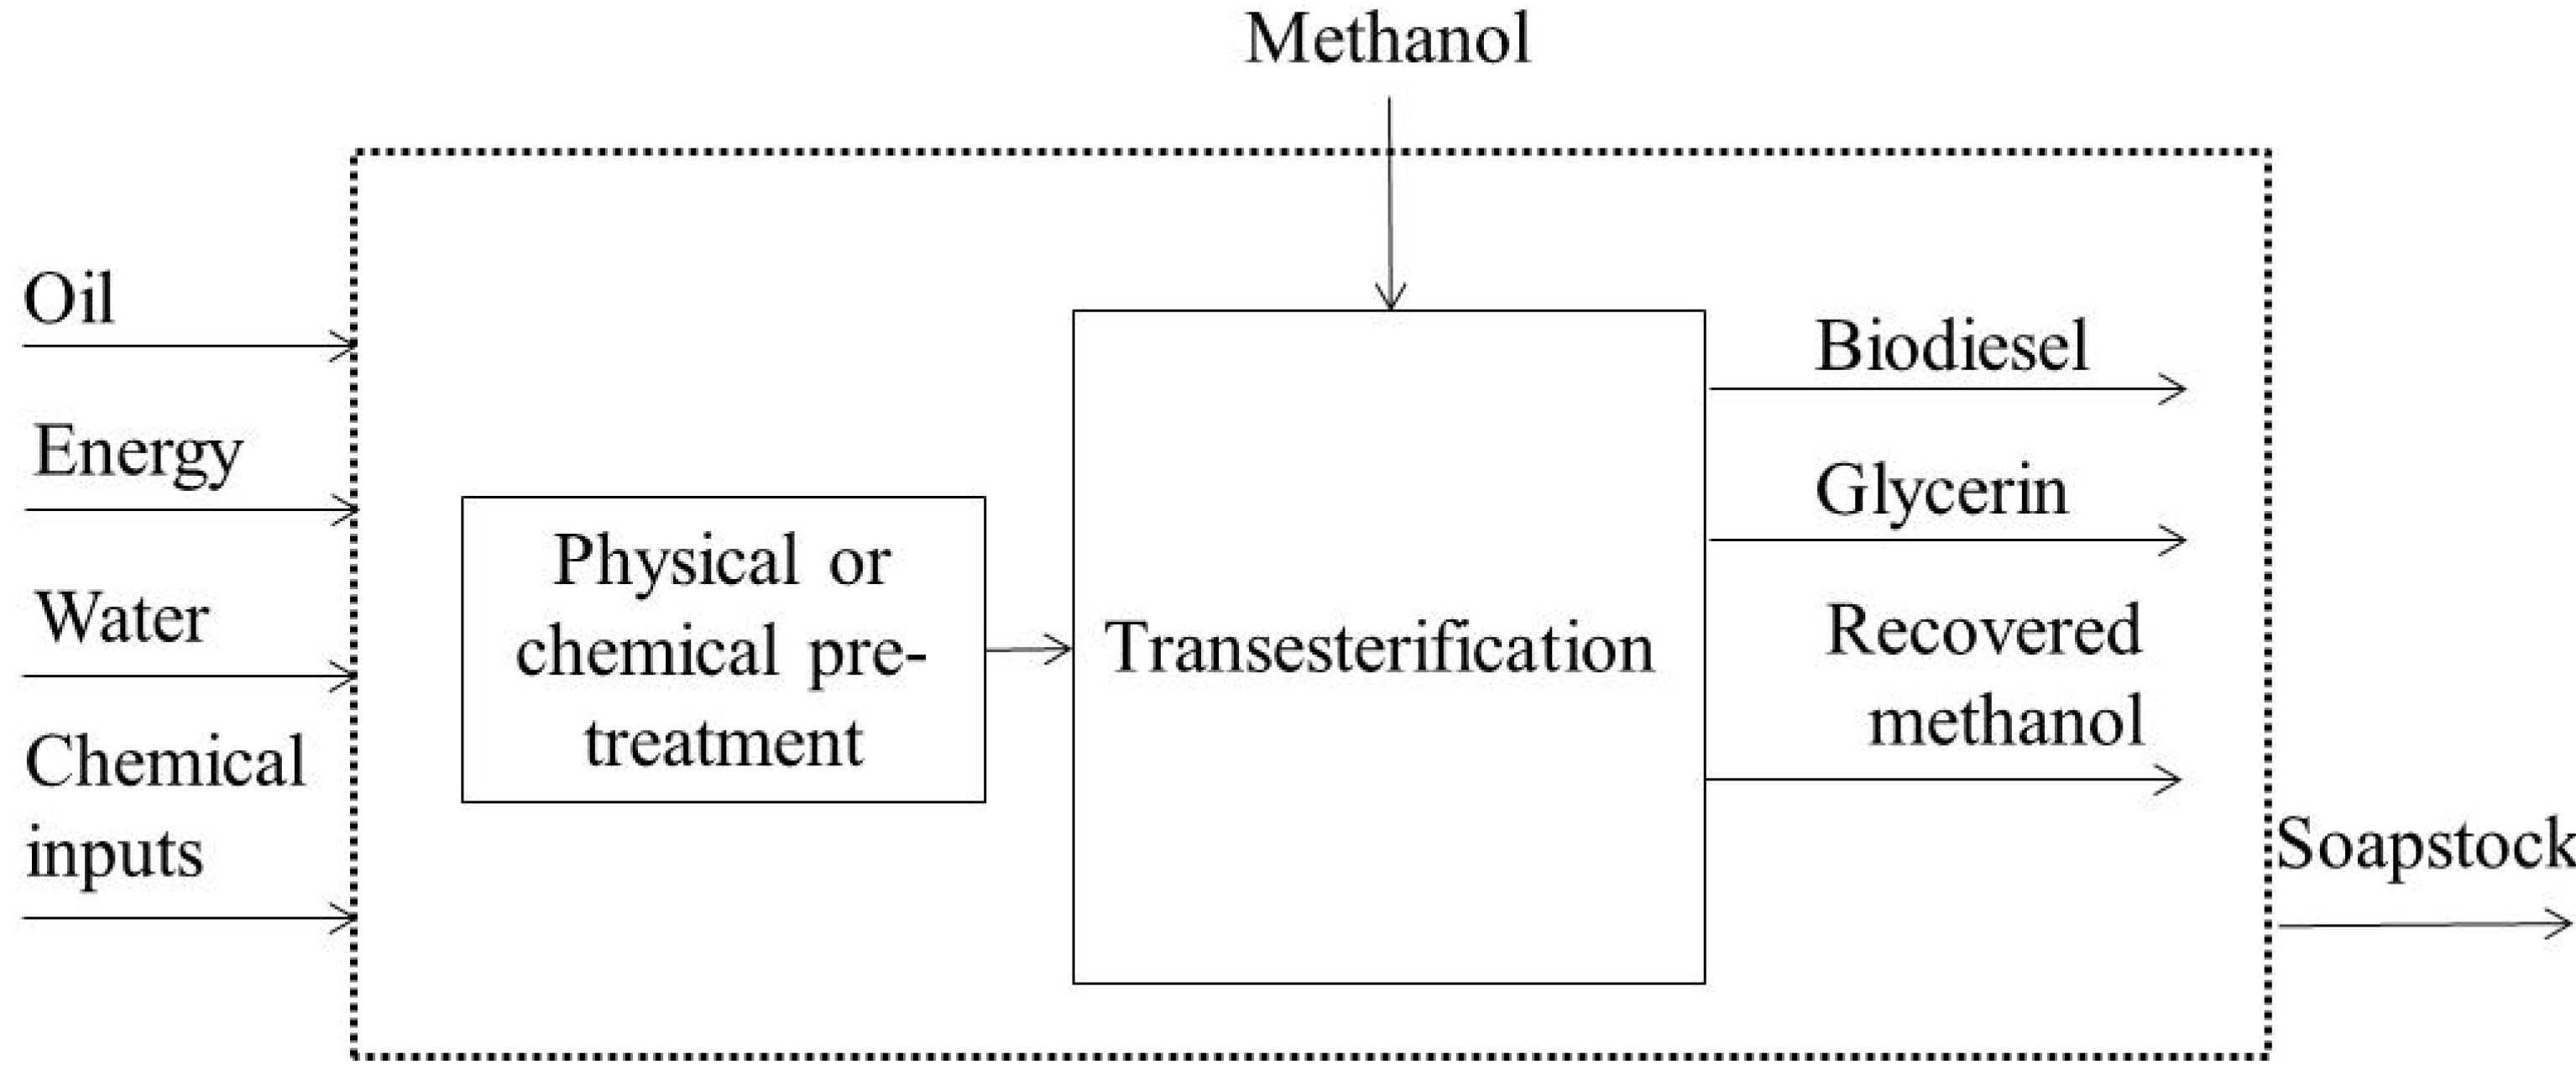
2.3. The Biodiesel Plant
2.3.1. Oil Pre-Treatment Unit
2.3.2. Transesterification Unit
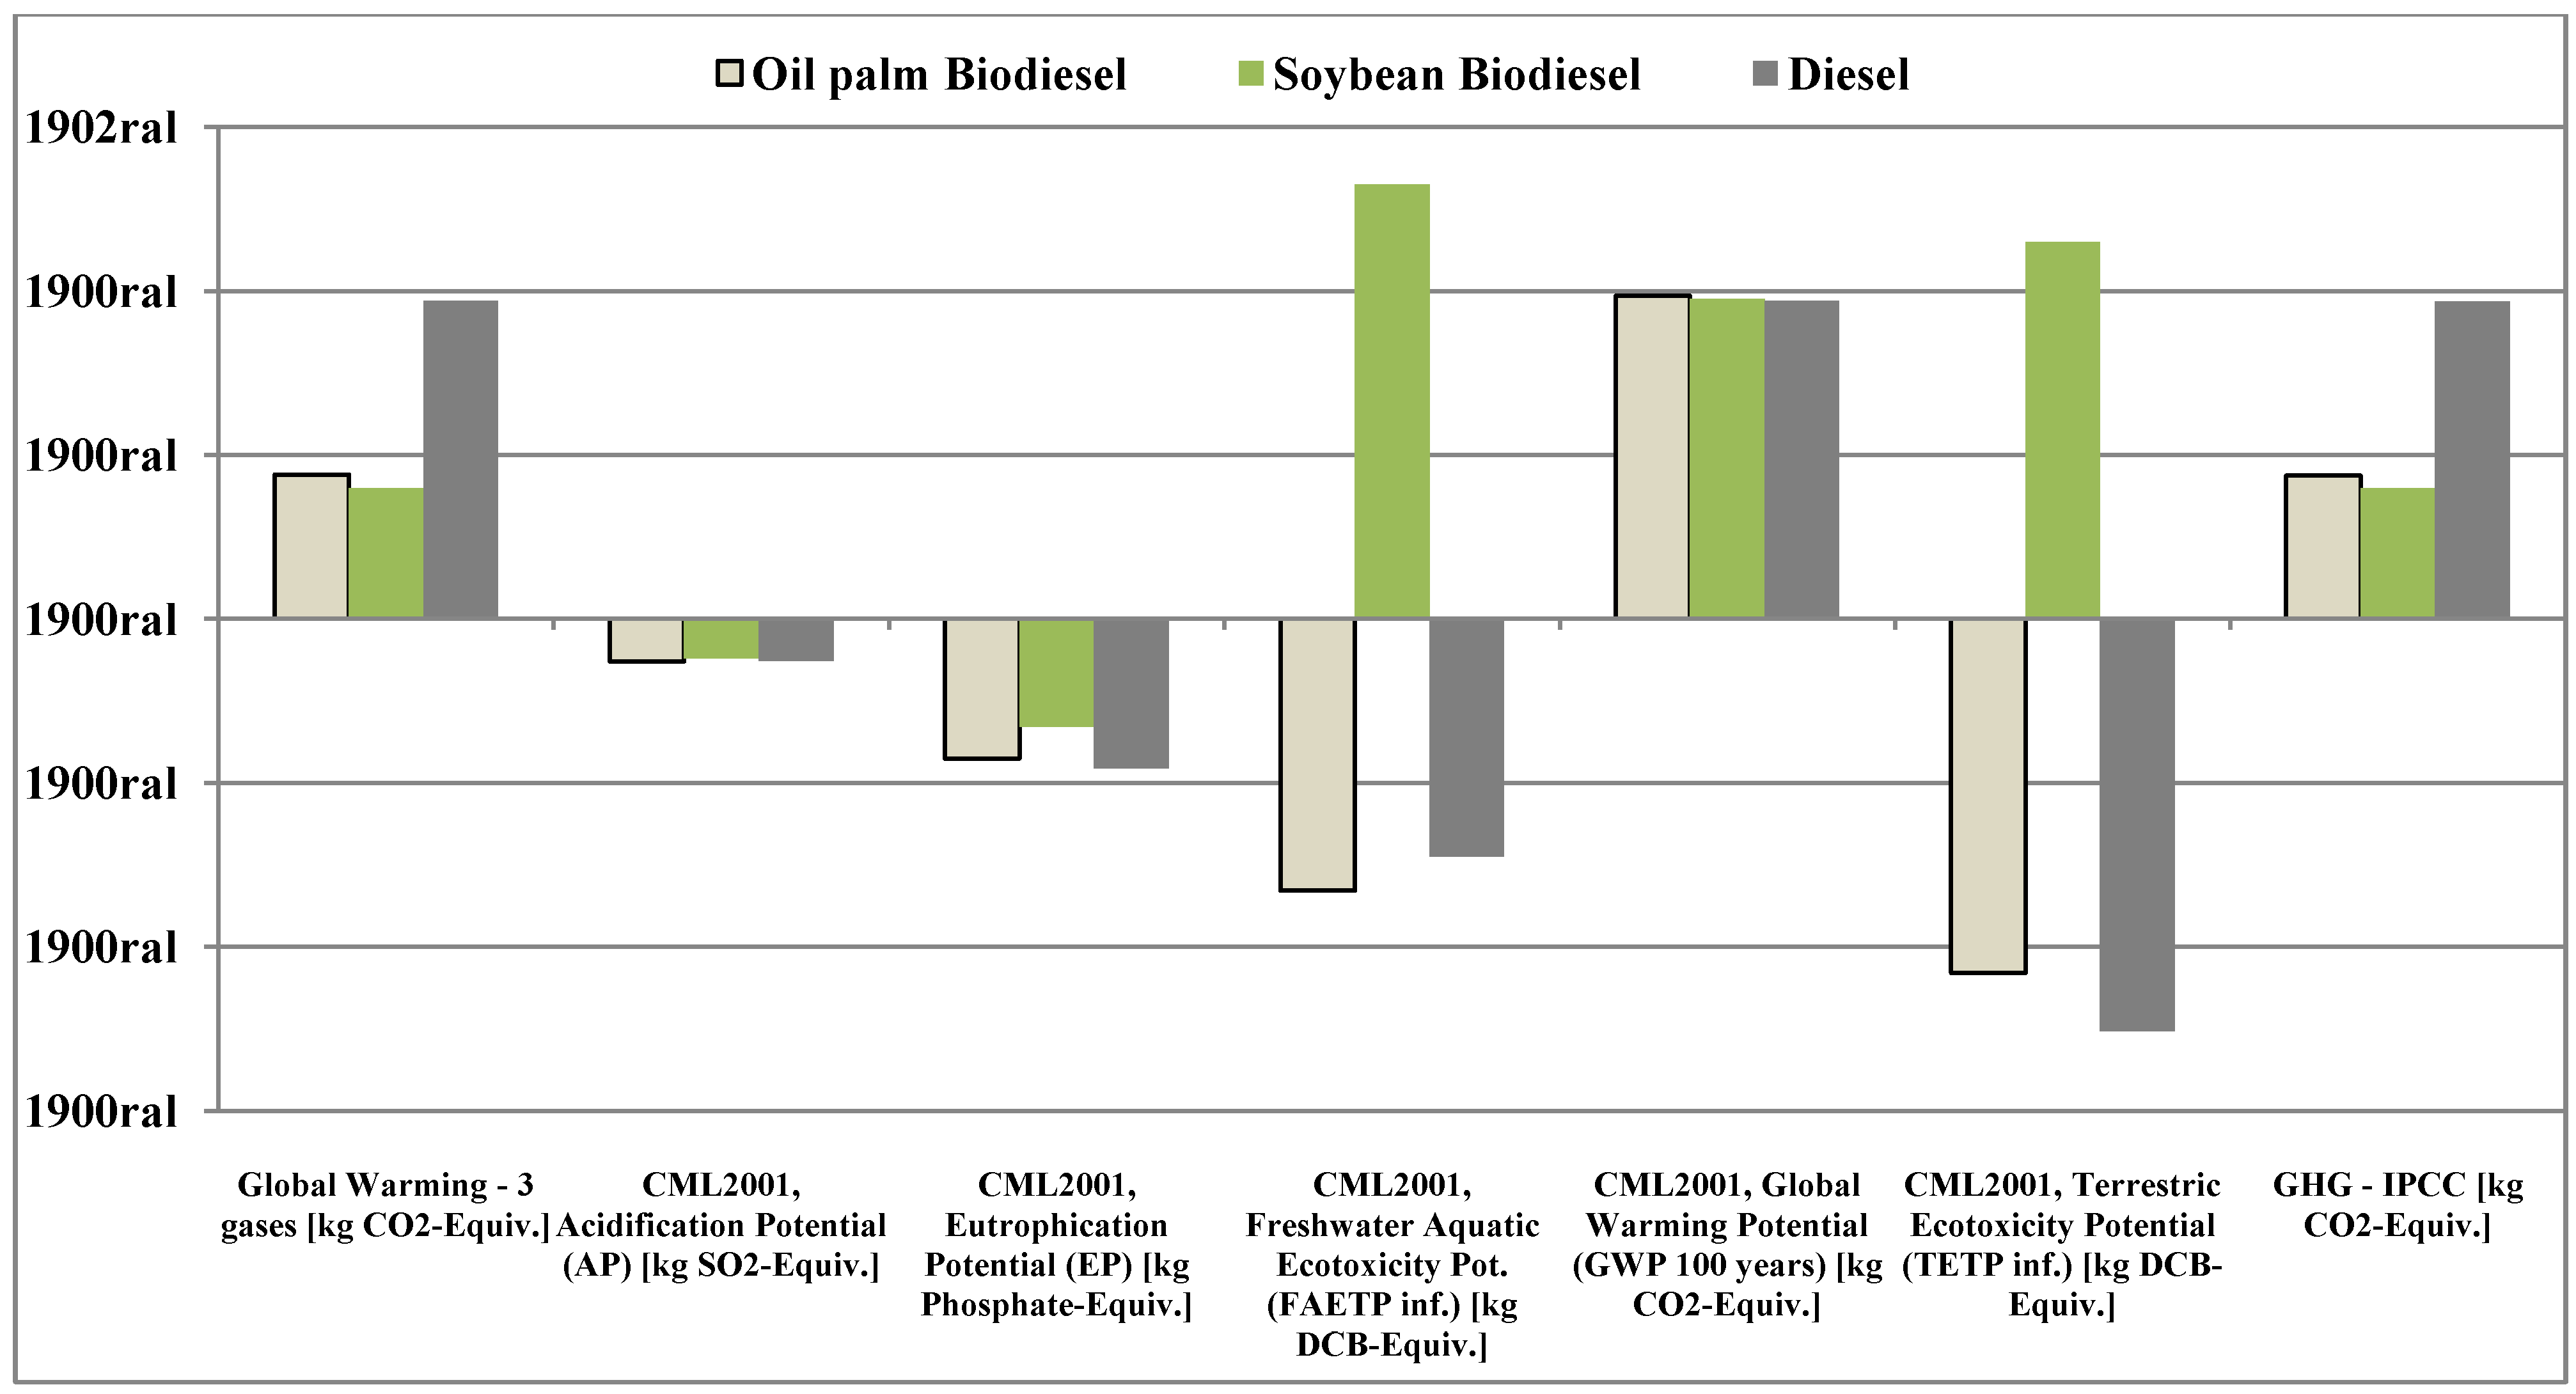
2.4.Environmental Impact Assessment of Biodiesel Production

- (i)
- Global Warming—3 gases (kg CO2-eq);
- (ii)
- GHG-IPCC (kg CO2-eq); and
- (iii)
- CML2001:
- a.
- CML2001, Acidification Potential (AP) (kg SO2-eq);
- b.
- CML2001, Eutrophication Potential (EP) (kg phosphate-eq);
- c.
- CML2001, Aquatic Ecotoxicity Potential (FAETP) (kg DCB-eq);
- d.
- CML2001, Global Warming Potential (GWP 100 years) (kg CO2-eq); and
- e.
- CML2001, Terrestrial Ecotoxicity Potential (TETP) (kg DCB-eq).

3. Bioethanols
3.1. First-Generation Ethanol
3.1.1. Goal Setting
3.1.2. Scope Definition

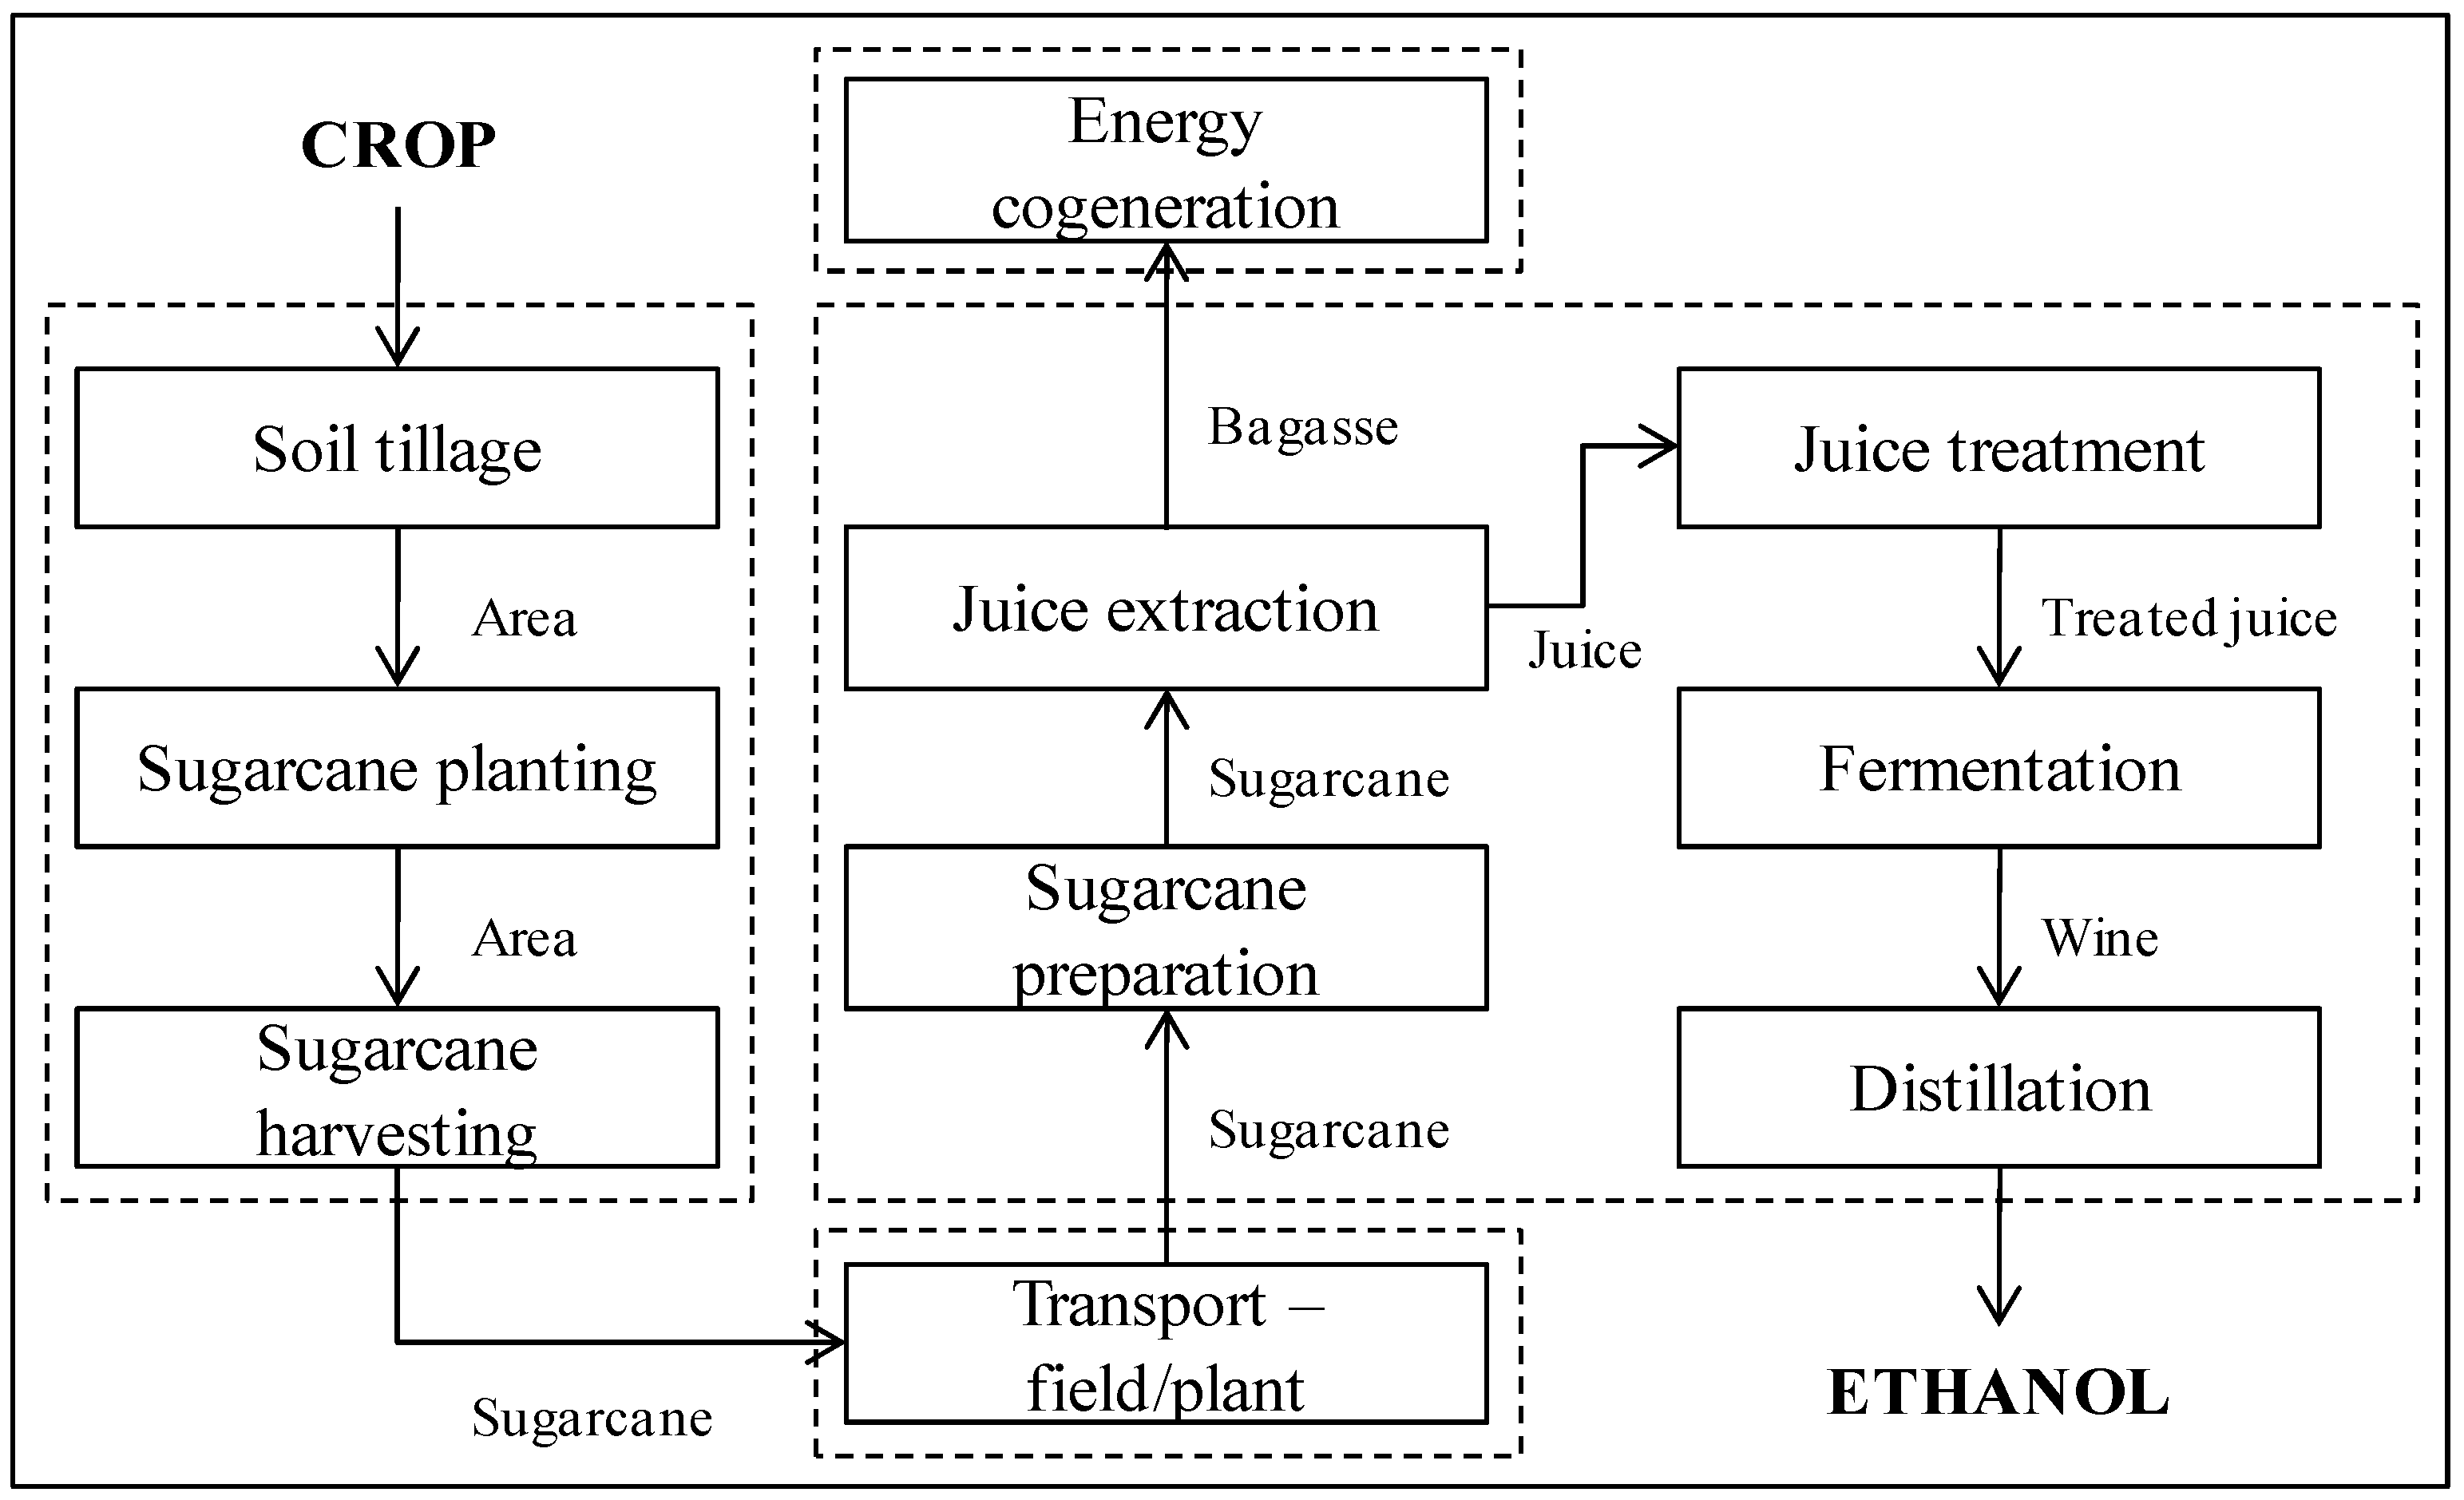
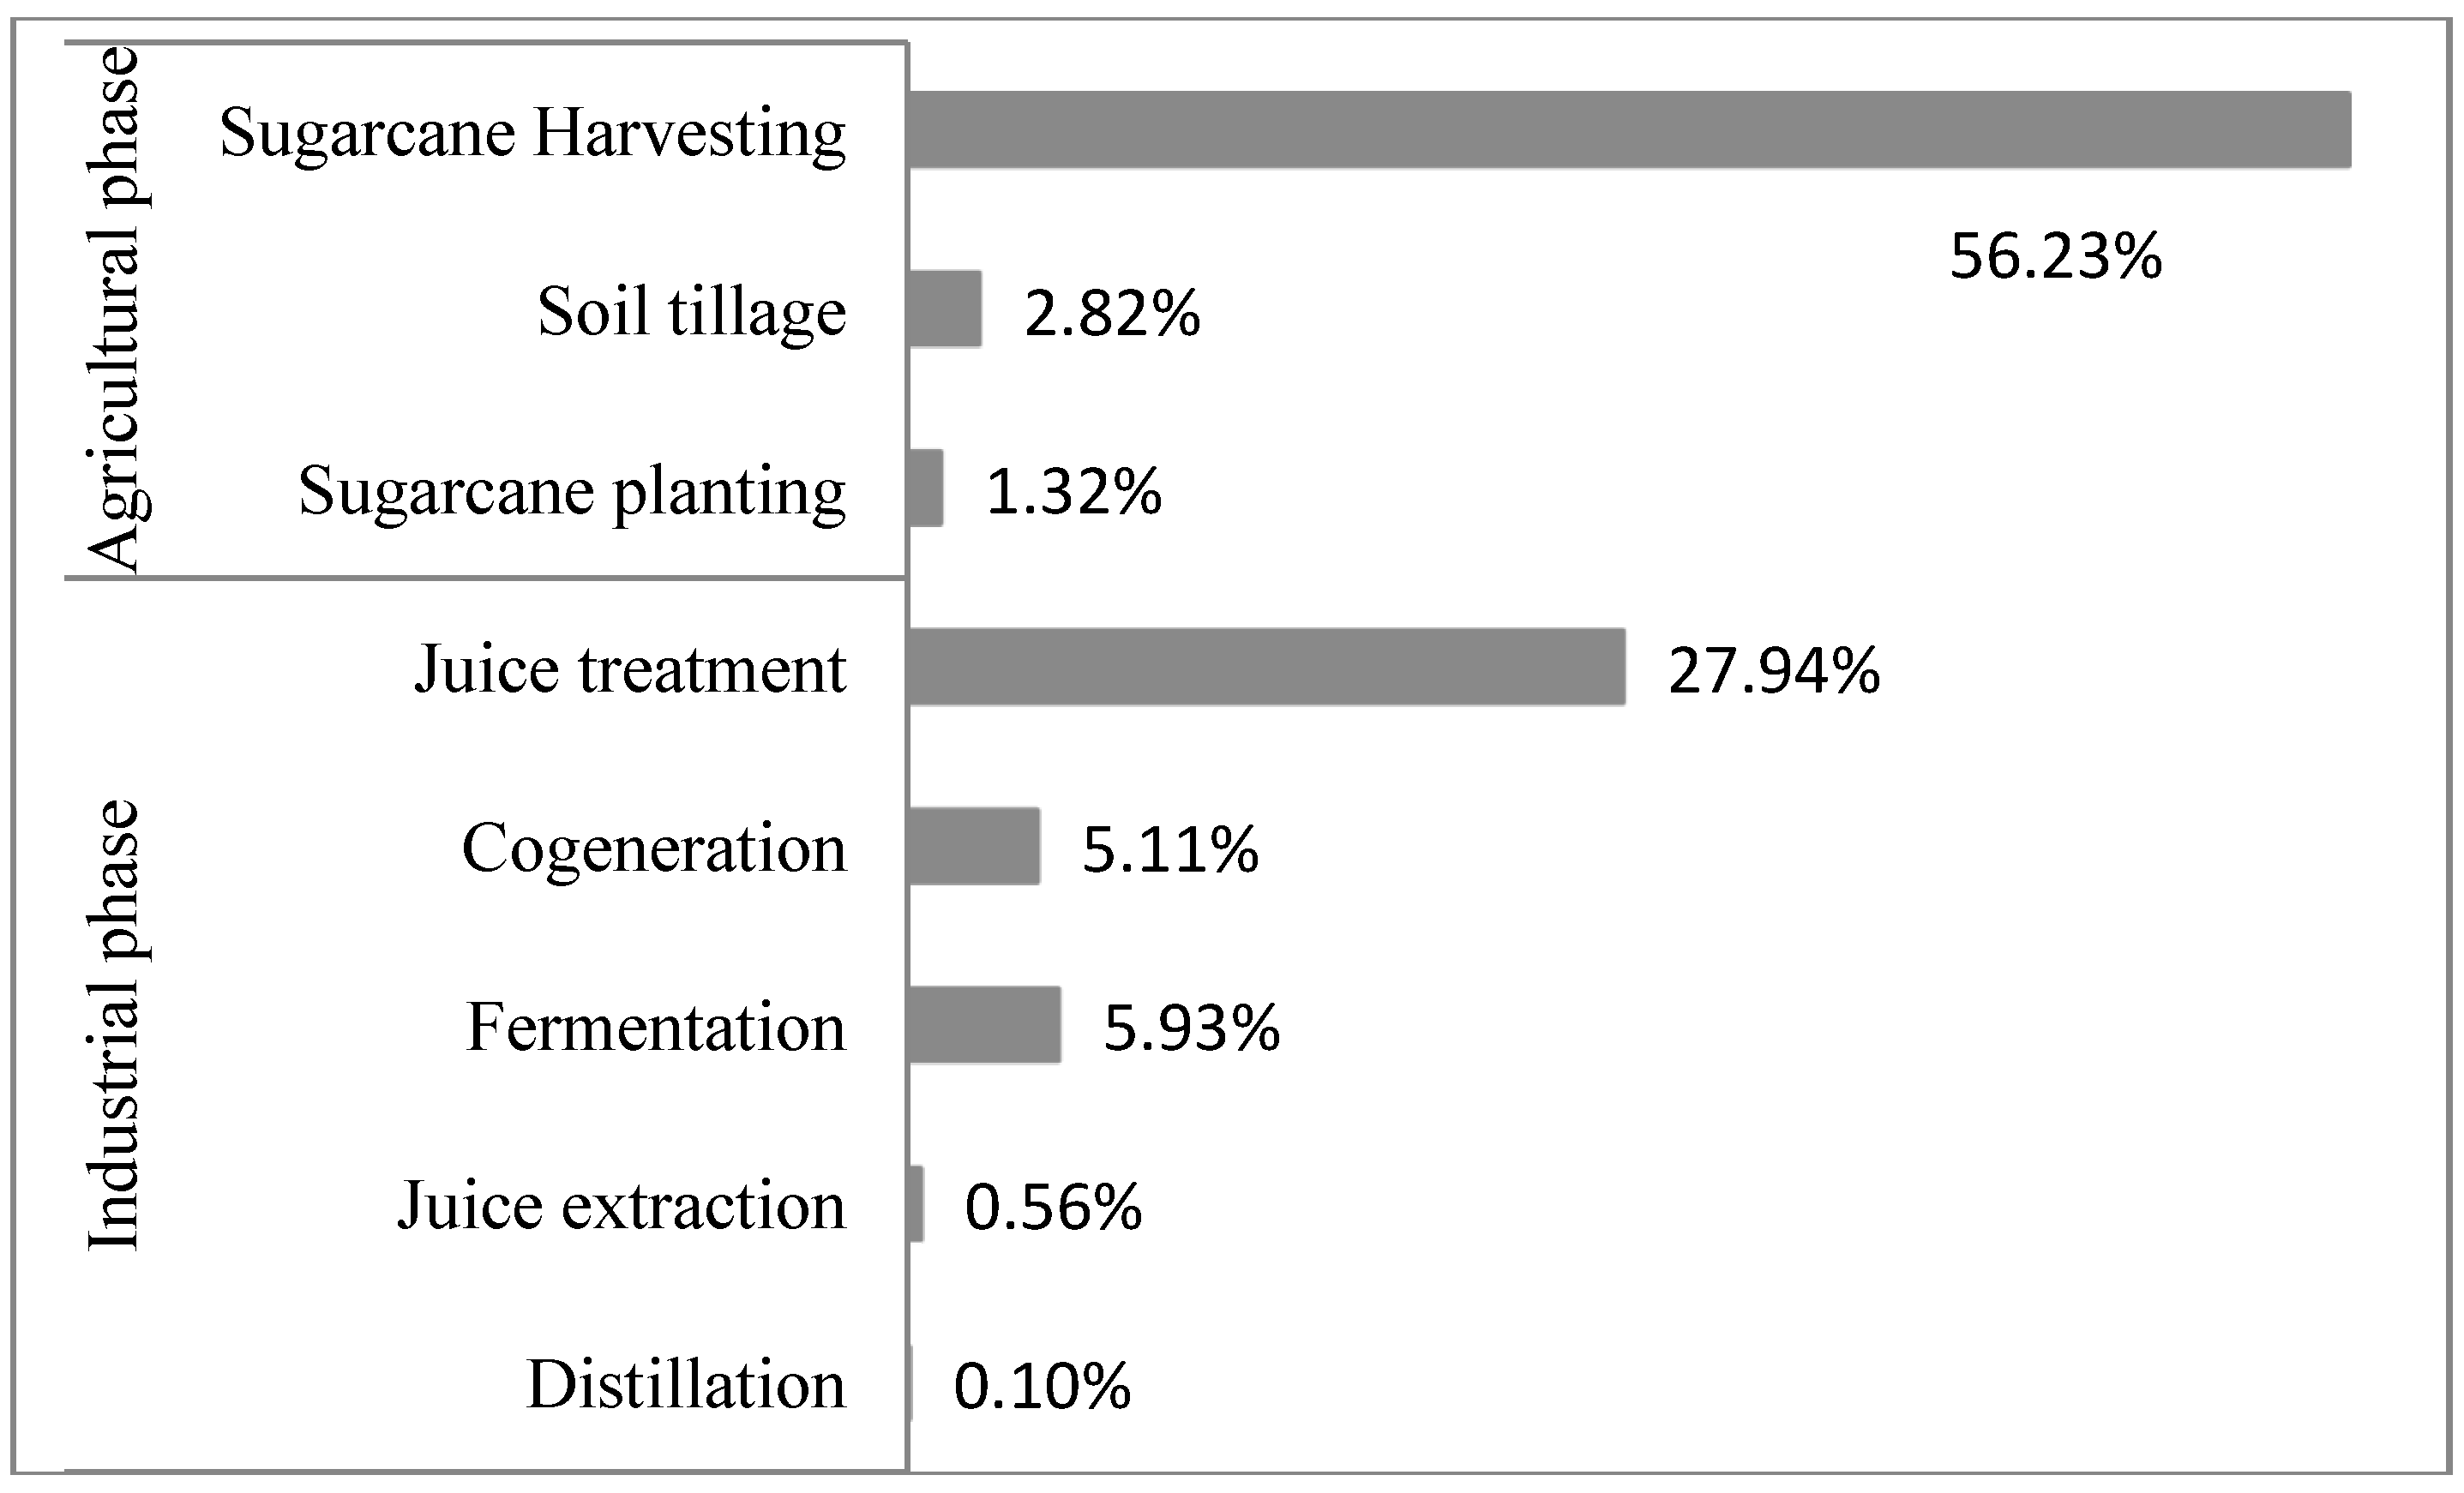
3.1.3. Characterization of the Sugarcane Cultivation Phase
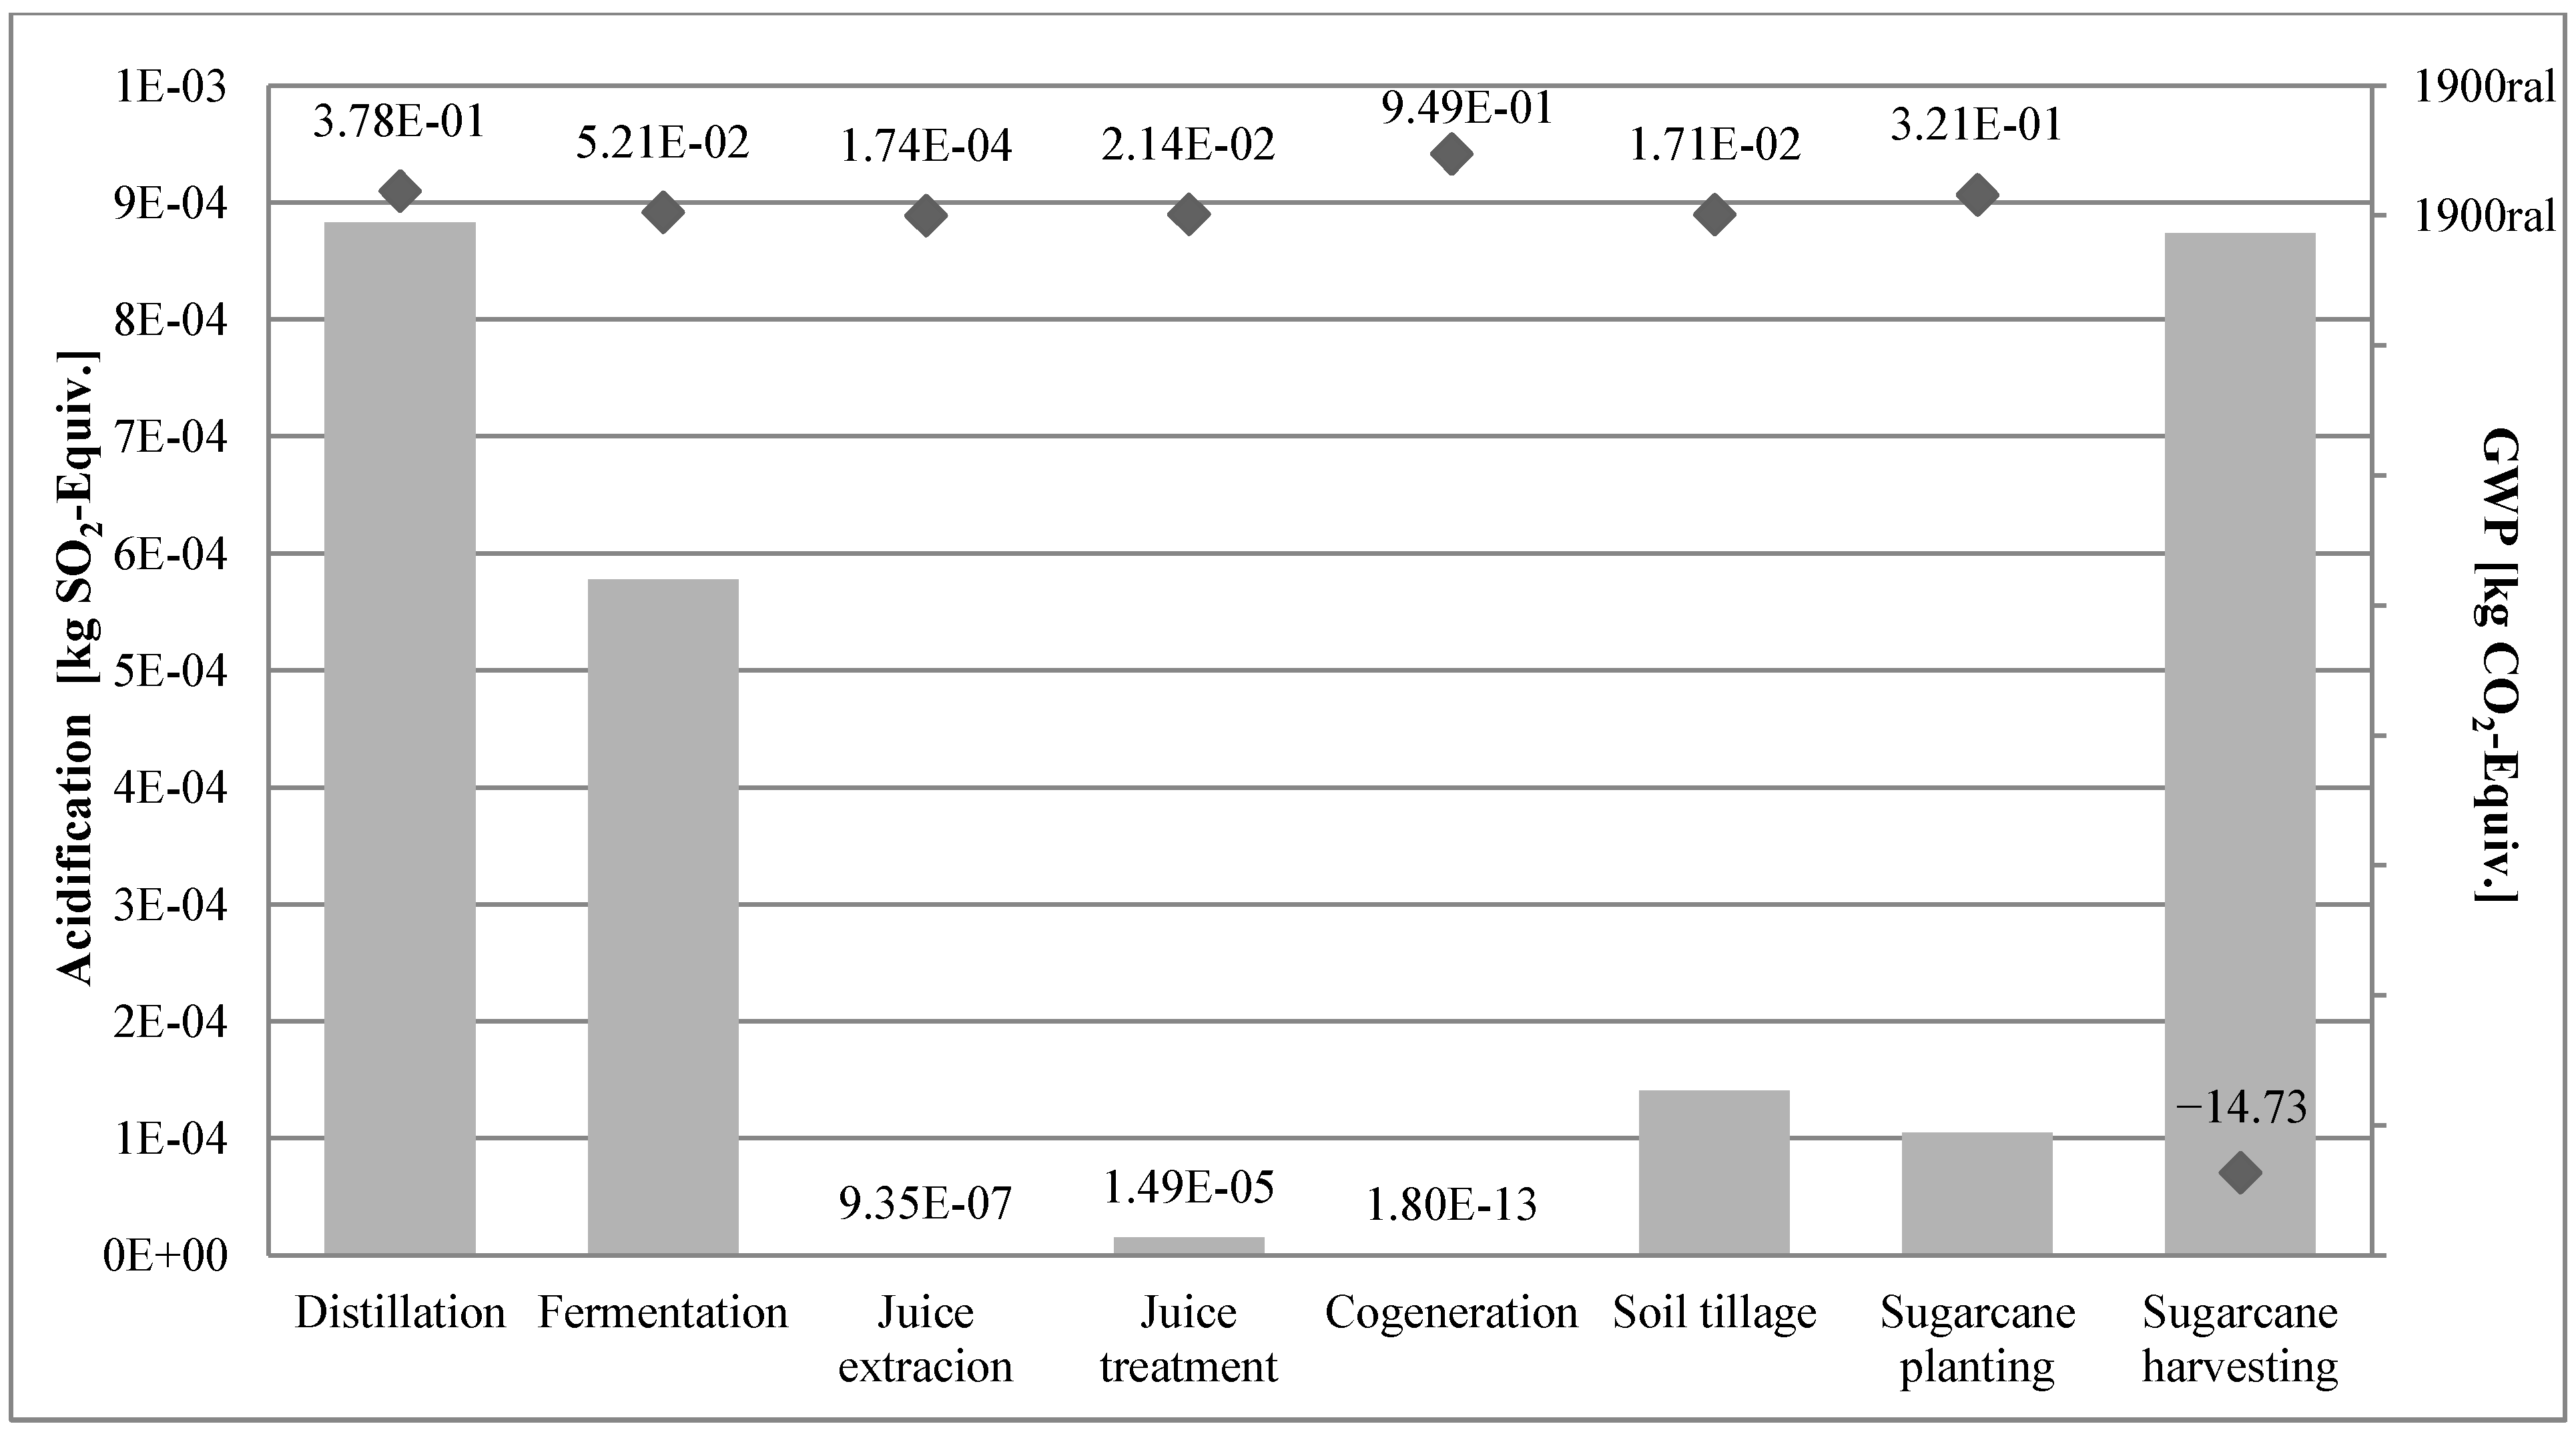
3.1.4. Characterization of the Industrial Phase of Ethanol Production
3.1.5. Assessment of Cost and Environmental Impacts

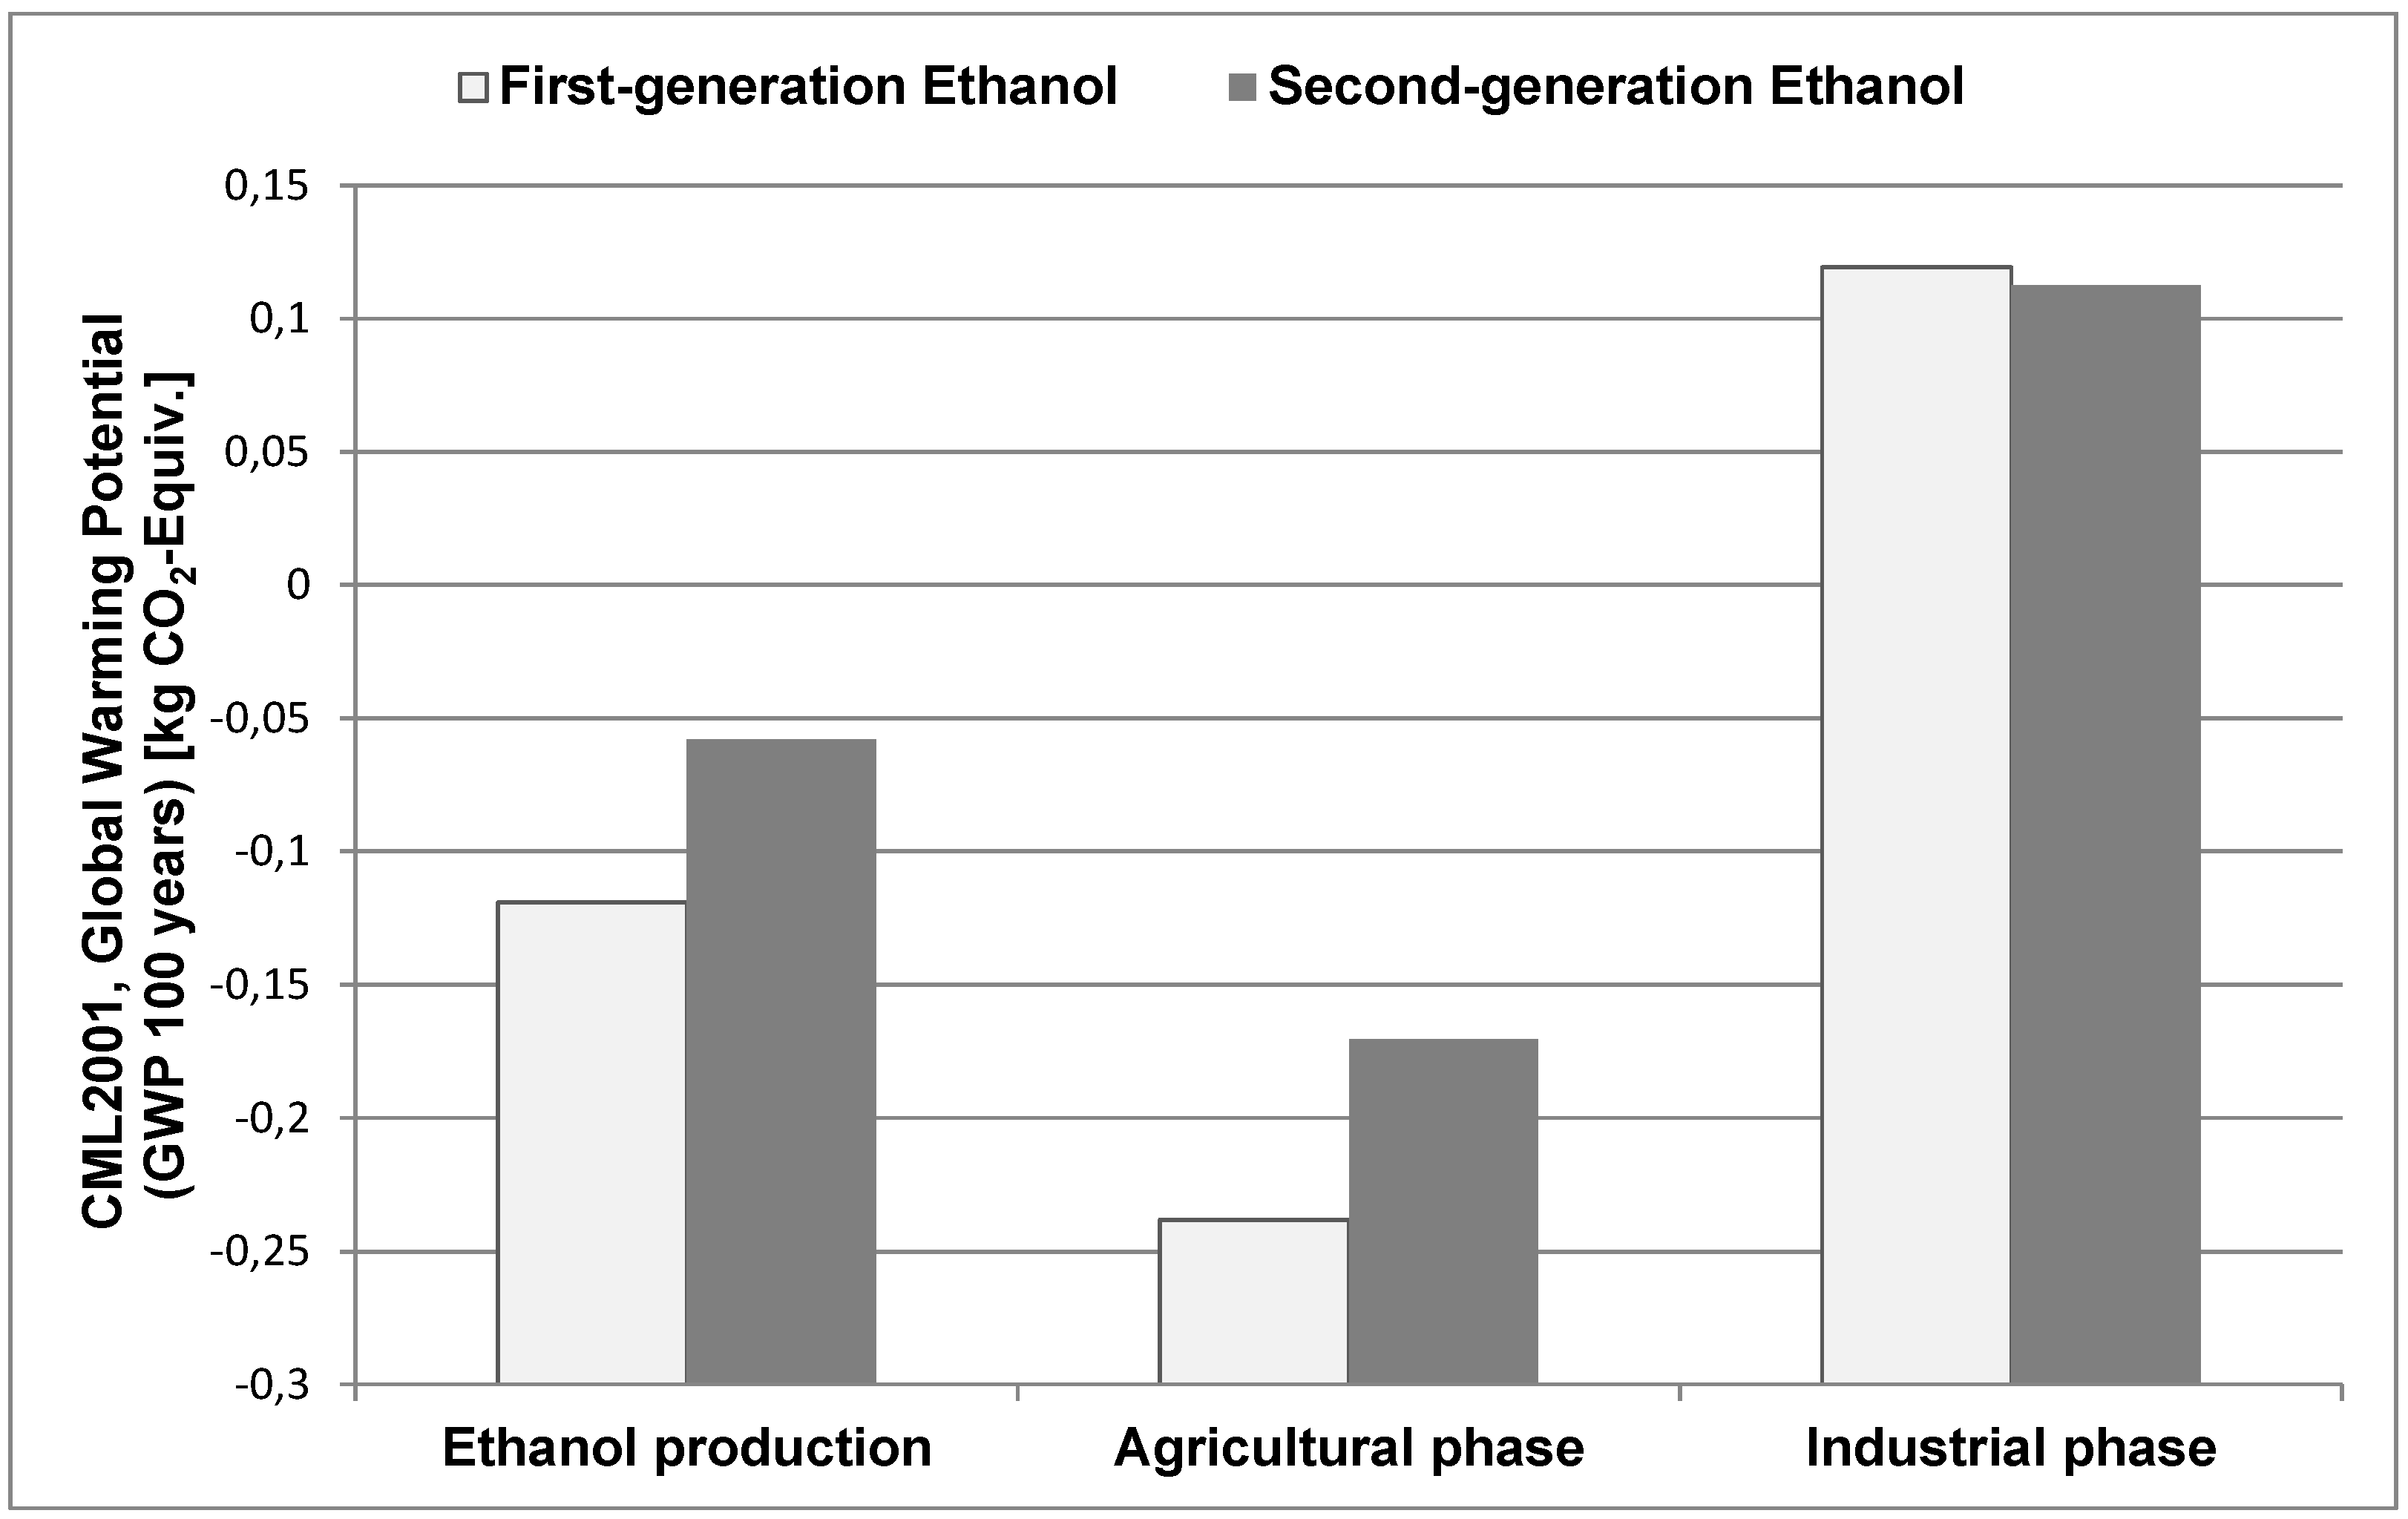
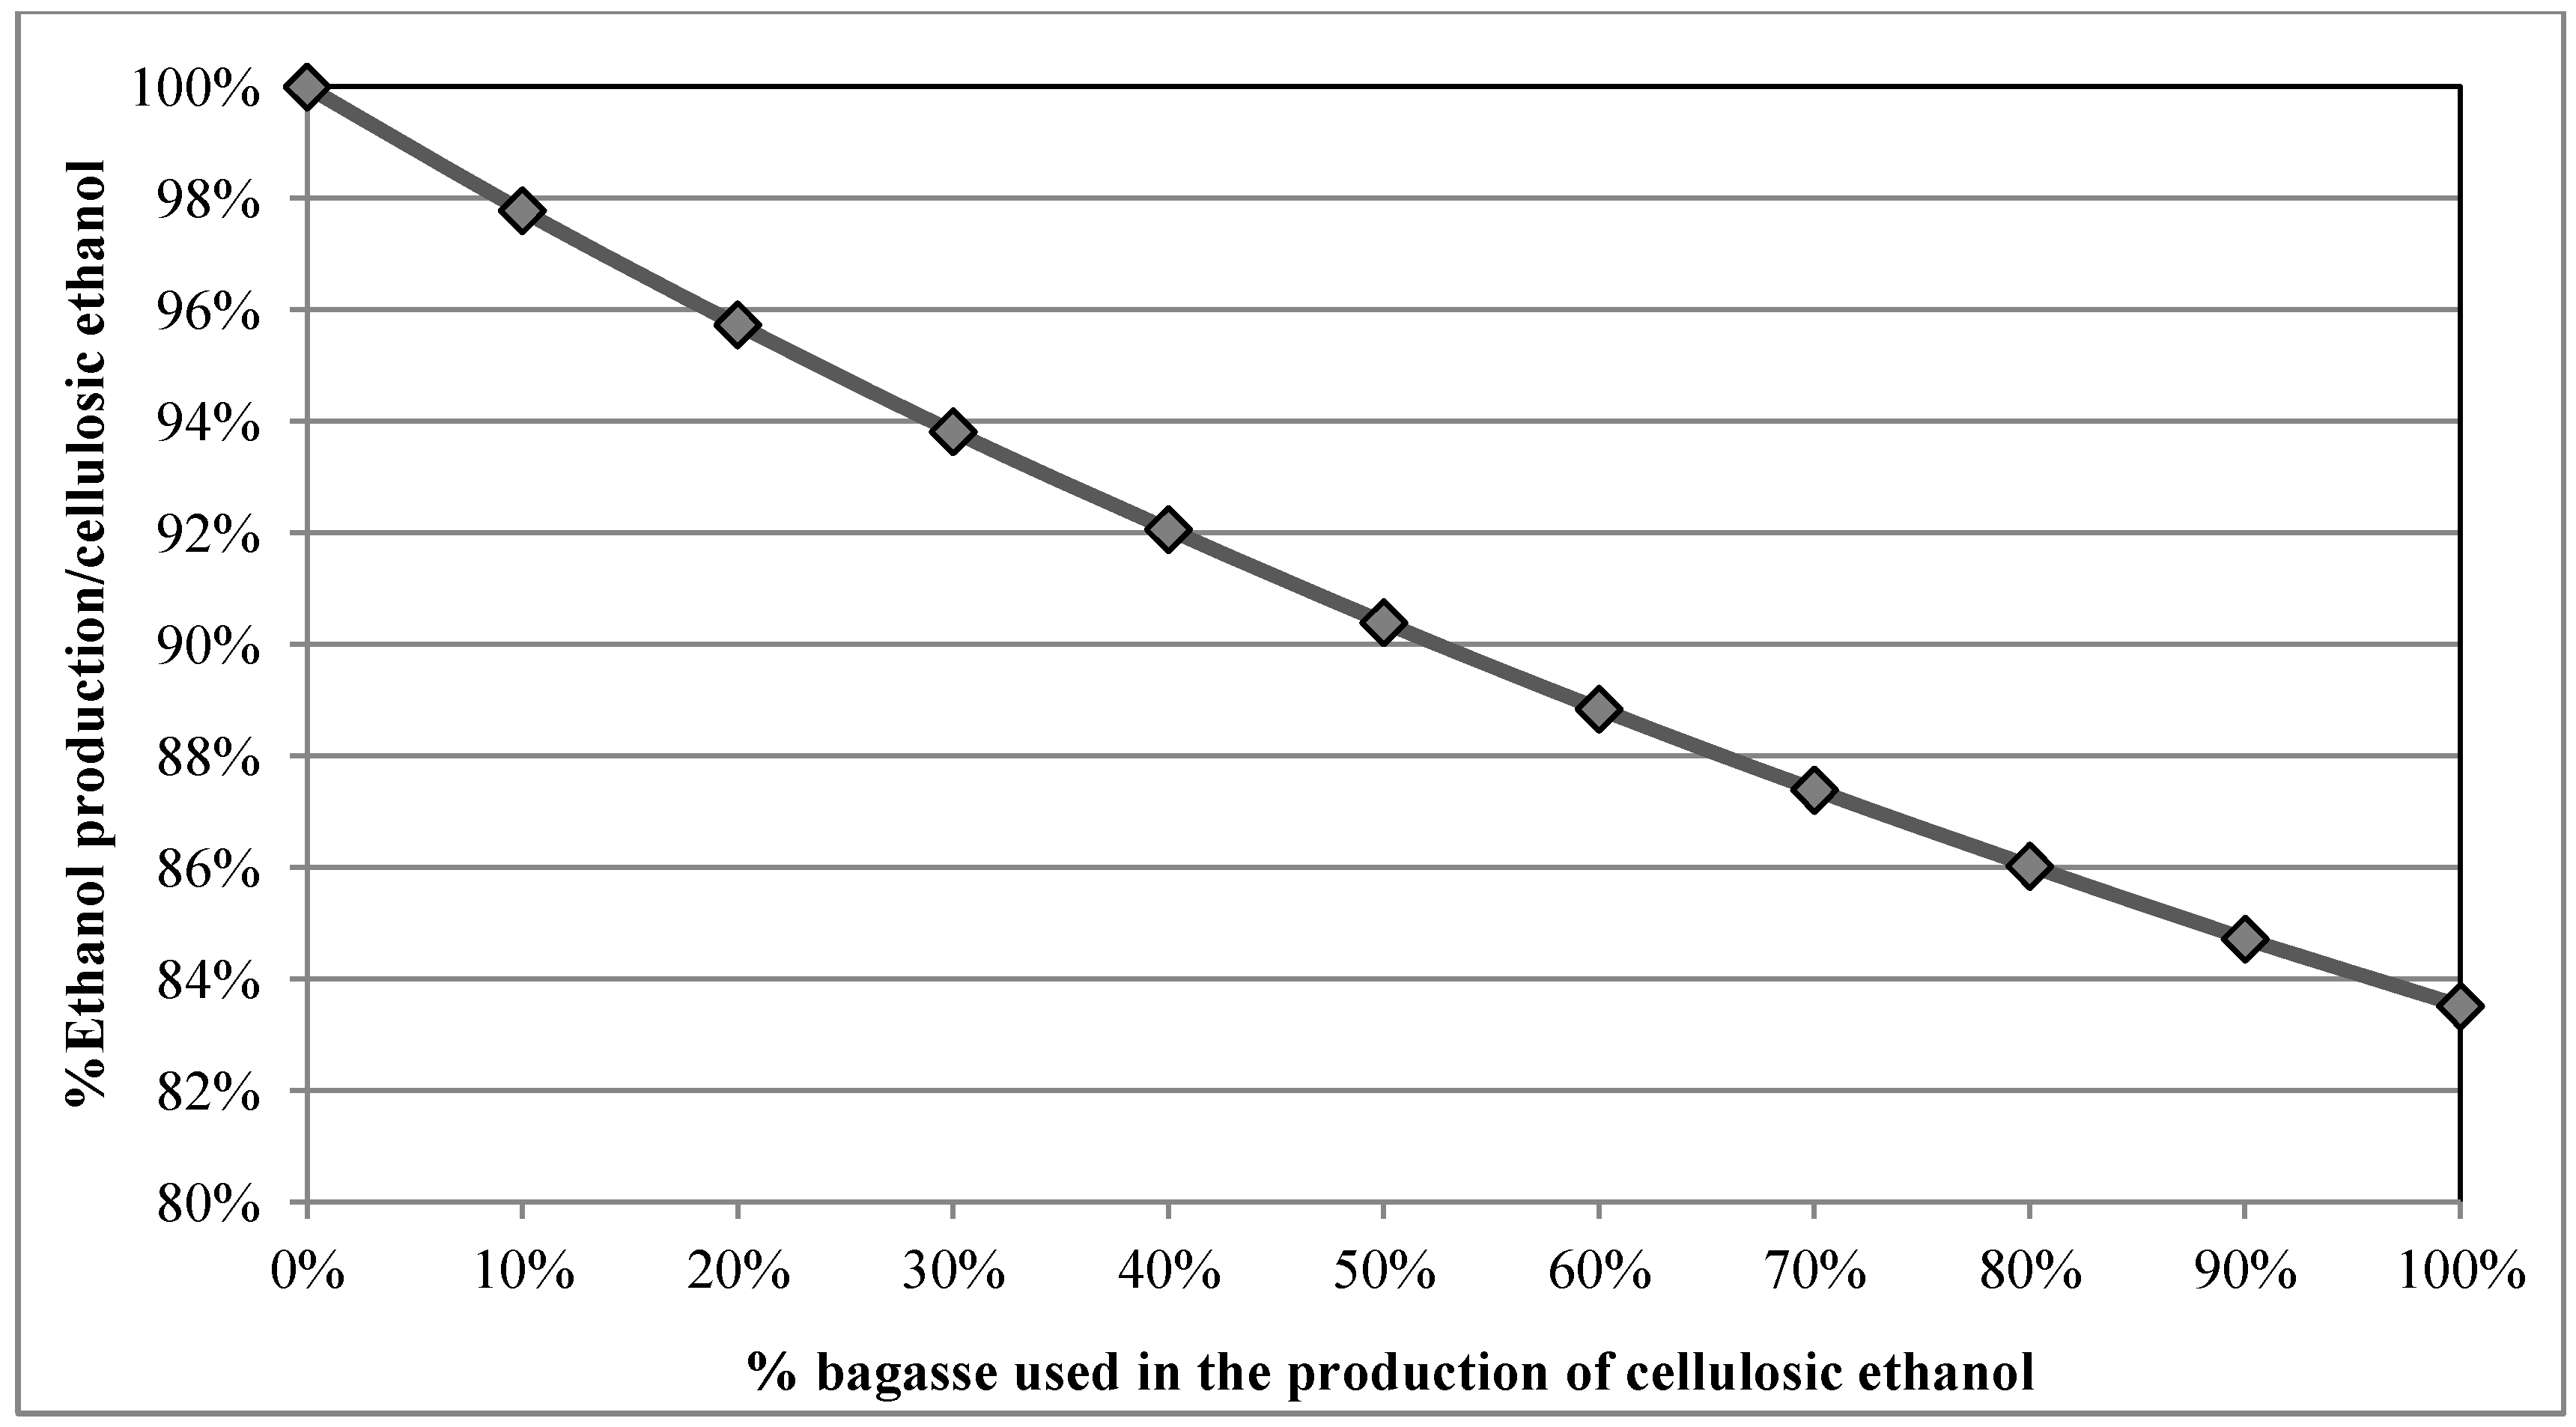
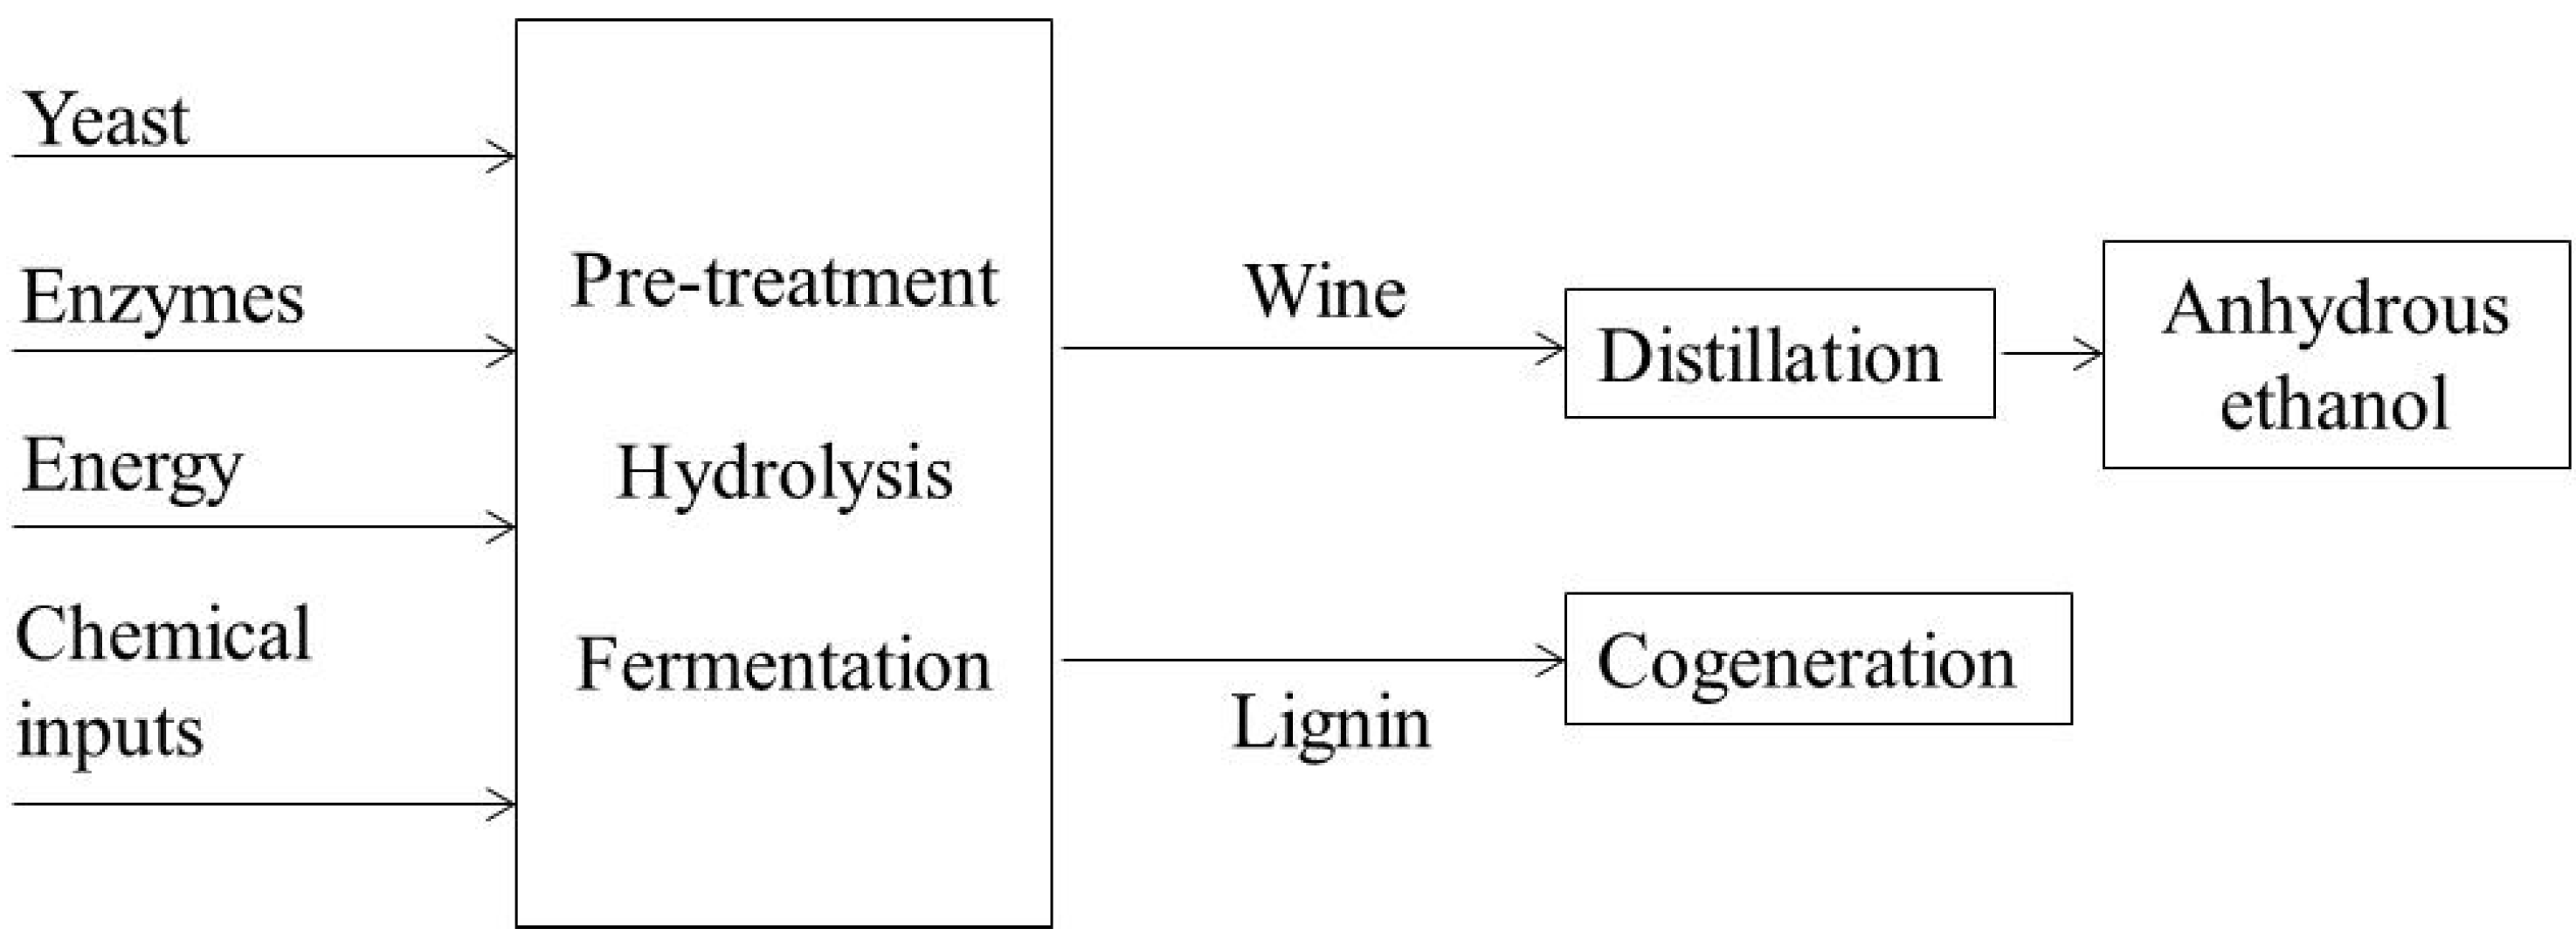
3.2. Second-Generation Ethanol


4. Economic Impacts of Ethanol Production Examined via the Structural Path Analysis Method
SPA Results
| Rank | Input Paths | Values | Units | Order | Total impact % |
|---|---|---|---|---|---|
| 1 | Fge←Sc | 951.3 | 10 ×106 kg CO2 | 1 | 39.2 |
| 2 | Fge | 873.4 | 10 ×106 kg CO2 | 0 | 36.0 |
| 3 | Fge←Tra | 80.4 | 10 ×106 kg CO2 | 1 | 3.3 |
| 1 | Fge←Sc | 10,000.1 | TJ | 1 | 64.4 |
| 2 | Fge←Tra | 1,415.0 | TJ | 1 | 9.1 |
| 3 | Fge | 909.8 | TJ | 0 | 5.9 |
| 1 | Fge←Sc | 89.8 | 10 ×103 jobs | 1 | 38.7 |
| 2 | Fge←Alf | 50.0 | 10 ×103 jobs | 1 | 21.5 |
| 3 | Fge | 30.8 | 10 ×103 jobs | 0 | 13.2 |
| 1 | Fge | 2,293.9 | 10 ×106 R$ | 0 | 47.6 |
| 2 | Fge←Sc | 1,019.1 | 10 ×106 R$ | 1 | 21.1 |
| 3 | Fge←Alf | 264.6 | 10 ×106 R$ | 1 | 5.5 |
5. Conclusions
References and Notes
- Gielen, D.J.; Fujino, J.; Hashimoto, S.; Moriguchi, Y. Biomass strategies for climate policies? Clim. Policy 2002, 2, 319–333. [Google Scholar] [CrossRef]
- Quaglio, S. Yearbook of Brazilian Energy Analysis; [in Portuguese]; Análise Editorial: São Paulo, Brazil, 2011. [Google Scholar]
- Narayanaswamy, V.; Altham, J.; Berkel, R.V.; McGregor, M. Methodological Framework for Application of Environmental Life Cycle Assessment (LCA) to Australian Grains; Curtin University of Technology: Perth, Australia, 2003. [Google Scholar]
- Pegoraro, L.A. Desenvolvimento de Fatores de Caracterização para Toxicidade Humana em Avaliação do Impacto do Ciclo de Vida No Brasil [Development of Characterization Factors for Human Toxicity in the Assessment of Life Cycle Impact in Brazil]; Mestrado em Engenharia, Programa de Pós-graduação em Engenharia Mecânica e de Materiais, Universidade Tecnológica Federal do Paraná: Curitiba, Brazil, 2008. [Google Scholar]
- Singh, A.; Olsen, S.I. A critical review of biochemical conversion, sustainability and life cycle assessment of algal biofuels. Appl. Energy 2011, 88, 3548–3555. [Google Scholar] [CrossRef]
- Nigama, P.S.; Singh, A. Production of liquid biofuels from renewable resources. Prog. Energy Combust. Sci. 2011, 37, 52–68. [Google Scholar] [CrossRef]
- Singh, A.; Pant, D.; Olsen, S.I.; Nigam, P.S. Key issues to consider in microalgae based biodiesel production. Energy Edu. Sci. Technol. Part A Energy Sci. Res. 2012, 29, 687–700. [Google Scholar]
- Luo, L.; van der Voet, E.; Huppes, G. Life cycle assessment and life cycle costing of bioethanol from sugarcane in Brazil. Renew. Sustain. Energy Rev. 2009, 13, 1613–1619. [Google Scholar] [CrossRef]
- IndexMundi. World Biodiesel Production by Year. Available online: http://www.indexmundi.com/energy.aspx?region=xx&product=biodiesel&graph=production (accessed on 6 January 2012).
- Yadava, D.K.; Vasudev, S.; Singh, N.; Mohapatra, Y.; Prabhu, K.V. Breeding Major Oil Crops: Present Status and Future Research Needs. In Technological Innovations in Major World Oil Crops; Springer: New York, NY, USA, 2012. [Google Scholar]
- FAOSTAT. Faostat Database Query: Soybean Production. Available online: http://faostat.fao.org/site/339/default.aspx (accessed on 12 June 2006).
- Dalgaard, R.; Schmidt, J.; Halberg, N.; Christensen, P.; Thrane, M.; Pengue, W.A. LCA of Soybean Meal. Int. J. Life Cycle Assess. 2008, 13, 240–254. [Google Scholar] [CrossRef]
- CONAB-Companhia Nacional de Abastecimento [Brazilian Food Supply Company]. Acompanhamento da Safra Brasileira: Grãos, oitavo levantamento, Maio 2012 [Monitoring of Brazilian Harvest: Grains, Eighth Survey, May 2012]; CONAB: Brasília, Brazil, 2012; 631.165(05), C743b. [Google Scholar]
- IEA-International Energy Agency. CO2 Emissions from Fuel Combustion: Highlights; IEA: Paris, France, 2012; Available online: http://www.iea.org/publications/freepublications/publication/CO2emissionfromfuelcombustionHIGHLIGHTS.pdf (accessed on 6 January 2013).
- Ministério da Agricultura, Pecuária e Abastecimento—MAPA. Agronegócio Brasileiro em Números [Brazilian Agribusiness in Numbers]. Available online: http://www.agricultura.gov.br/comunicacao/publicacoes (accessed on 6 January 2013).
- Banco Nacional de Desenvolvimento Economico e Social-BNDES. Bioetanol de Cana-de-Açúcar: Energia Para o Desenvolvimento Sustentável [Bioethanol from Sugarcane: Energy for Sustainable Development]; BNDES: Rio de Janeiro, Brazil, 2008. [Google Scholar]
- Xavier, J.H. Análise de Ciclo de Vida (ACV) da Produção Agrícola Familiar em Unaí-MG: Resultados Econômicos e Impactos Ambientais [Life Cycle Analysis (LCA) of Family Agricultural Production in Unai, Minas Gerais: Economic Results and Environmental Impacts]. Master’s Thesis, Brasília, Brazil, 2003. [Google Scholar]
- ANP—Agência Nacional de Petróleo. National Agency of Petroleum] Boletim Mensal de Biodiesel. Available online: http://www.anp.gov.br/?pg=60127&m=&t1=&t2=&t3=&t4=&ar=&ps=&cachebust=1336745196714 (accessed on 6 January 2012).
- NAE—Núcleo de Assuntos Estratégicos da Presidência da República [Strategic Issues Office from the Presidency of the Republic]. Cadernos NAE 2—Biocombustíveis [Biofuels]; NAE: Brasília, Brazil, 2005. [Google Scholar]
- EMBRAPA. Tecnologias de Produção de Soja: Região Central do Brasil 2011 [Soy Production Technologies: Central Region of Brazil 2011]; Embrapa Soja: London, UK, 2010. [Google Scholar]
- EMBRAPA. Complexo Agroindustrial de Biodiesel no Brasil: Competitividade das Cadeias Produtivas de Matérias-Primas [Agro Industrial Complex of Biodiesel in Brazil: Competitively of Raw Materials Chain]; Embrapa Agroenergia: Brasília, Brazil, 2010. [Google Scholar]
- Viégas, I.J.; Müller, A.A. A Cultura do Dendezeiro na Amazônia Brasileira [Oil Palm Cultivation in the Brazilian Amazon]; Embrapa Amazônia Oriental, Manaus, Embrapa Amazônia Ocidental: Belém, Brazil, 2000. [Google Scholar]
- SEAGRI—Secretaria de Agricultura, Irrigação e Reforma Agrária [Secretariat of Agriculture, Irrigation and Agrarian Reform], BA. Cultura Dendê [Oil palm culture]. Available online: http://www.seagri.ba.gov.br/Dende.htm (accessed on 6 January 2012).
- EPE—Empresa de Pesquisa Energética [Energy Research Office]. Potencial de Redução de Emissões de CO2 em Projetos de Produção e Uso de Biocombustíveis [Potential for Reducing CO2 Emissions in Production Projects and the Use of Biofuels]. Available online: http://www.epe.gov.br/Petroleo/Documents/Estudos_29/EPE%20-%202%C2%BA%20Biocombust%C3%ADveis%20x%20MDL.pdf (accessed on 6 January 2012).
- Furlan, J.; Kaltner, F.J.; Azevedo, G.F.; Campos, I.A. Biodiesel: Porque tem que ser Dendê [Biodiesel: Why It Has to Be Oil Palm], 1st ed.; Embrapa Amazônia Oriental, PALMASA: Belém, Brazil, 2006. [Google Scholar]
- CETESB—Companhia Ambiental do Estado de São Paulo [Environmental Company of São Paulo]. Metodologia Simplificada de Cálculo das Emissões de Gases do Efeito Estufa de Frotas de Veículos no Brasil [Simplified Methodology for Calculating Emissions of Greenhouse Gases from Vehicle Fleets in Brazil]. Available online: http://www.sinaldetransito.com.br/artigos/gases_efeito_estufa.pdf (accessed on 6 January 2012).
- Germer, J.; Sauerborn, J. Estimation of the impact of oil palm plantation establishment on greenhouse gas balance. Environ. Dev. Sustain. 2008, 10, 697–716. [Google Scholar]
- Finnveden, G.; Moberg, A. Environmental systems analysis tools—An overview. J. Clean. Prod. 2008, 13, 1165–1173. [Google Scholar] [CrossRef]
- Nguyen, T.L.; Gheewala, S.H. Life cycle cost analysis of fuel ethanol produced from cassava in Thailand. Int. J. Life Cycle Assess. 2008, 13, 564–573. [Google Scholar] [CrossRef]
- International Organization for Standardization (ISO). 14040. Environmental Management—Life Cycle Assessment—Principles and Framework; ISO: Geneva, Switzerland, 2006. [Google Scholar]
- Leal, M.R. Technological Evolution Processing of Sugar Cane for Ethanol and Electricity [Bioethanol from Sugar Cane: R & D for Productivity and Sustainability]; Blucher: São Paulo, Brazil, 2010. [Google Scholar]
- Suiran, Y.; Jing, T. Economic, energy and environmental evaluation of biomass-based fuel ethanol projects based on life cycle assessment and simulations. Appl. Energy 2009, 86, S178–S188. [Google Scholar] [CrossRef]
- AGRIANUAL—Anuário da Agricultura Brasileira. Yearbook of Brazilian Agriculture; Informa Economics: São Paulo, Brazil, 2009. [Google Scholar]
- Xavier, C.E.; Zilio, L.B.; Sonoda, D.Y.; Marques, P.V. Custos de Produção de Cana, Açúcar e Etanol no Brasil: Safra 2008/2009 [Production Costs for Sugarcane, Sugar and Ethanol in Brazil: 2008/2009 Crop]; Report for the National Confederation of Agriculture: Piracicaba, Brazil, 2009. [Google Scholar]
- Ripoli, T.C.; Ripoli, M.L. Biomass from Sugarcane: Harvesting, Energy and Environmental, 2nd ed.; Kluwer Academic Publishers: Piracicaba, Brazil, 2004. [Google Scholar]
- Goldemberg, J. The Brazilian biofuels industry. Biotechnol. Biofuels 2008, 1, 1–7. [Google Scholar] [CrossRef] [PubMed] [Green Version]
- Smeets, E.; Junginger, M.; Faaij, A.; Walter, A.; Dolzan, P.; Turkenburg, W. The sustainability of Brazilian ethanol—An assessment of the possibilities of certified production. Biomass Bioenergy 2008, 32, 781–813. [Google Scholar] [CrossRef]
- Contreras, A.M.; Rosa, E.; Pérez, M.; van Langenhove, H.; Dewulf, J. Comparative life cycle assessment of four alternatives for using by-products of cane sugar production. J. Clean. Prod. 2009, 17, 772–779. [Google Scholar] [CrossRef]
- Gonçalves, A.R.; Benar, P.; Costa, S.M.; Ruzene, D.S.; Moriya, R.Y.; Luz, S.M.; Ferreti, L.P. Integrated processes for use of pulps and lignins obtained from sugarcane bagasse and straw: A review of recent efforts in Brazil. Appl. Biochem. Biotechnol. 2005, 121–124, 821–826. [Google Scholar] [CrossRef] [PubMed]
- Hamelinck, C.N.; van Hooijdonk, G.; Faaij, A.P. Ethanol from lignocellulosic biomass: Techno-economic performance in short-, middle- and long-term. Biomass Bioenergy 2005, 28, 384–410. [Google Scholar] [CrossRef]
- Pires, A.; Schechtman, R. O mapa sucroenergetico do Brasil [The sugar-energy map of Brazil]. In De Souza e Macedo (Eds),Etanol e Bioeletricidade: A Cana-de-Açúcar no Futuro da Matriz Energética [Ethanol and Bioelectricity: Sugarcane in the Future of the Energy Matrix]; UNICA—Brazilian Sugarcane Industry Association: São Paulo, Brazil, 2010; ISBN 978-85-63750-00-6. [Google Scholar]
- OECD/IEA. Sustainable Production of Second Generation Biofuels: Potentials and Perspectives in Major Economies and Developing Countries; International Energy Agency: Paris, France, 2010. [Google Scholar]
- Ajanovic, A.; Haas, R. Economic challenges for the future relevance of biofuels in transport in EU countries. Energy 2010, 35, 3340–3348. [Google Scholar] [CrossRef]
- Acquaye, A.; Wiedmann, T.; Feng, K.; Crawford, R.; Barret, J.; Kuylenstierna, J.; Duffy, A.; Koh, S.C.; Mcqueen-Mason, S. Identification of carbon hot-spots and quantification of GHG intensities in the biodiesel supply chain using hybrid LCA and structural path analysis. Environ. Sci. Technol. 2011, 45, 2471–2478. [Google Scholar] [CrossRef] [PubMed]
- Baboulet, O.; Lenzen, M. Evaluating the environmental performance of a university. J. Clean. Prod. 2010, 18, 1134–1141. [Google Scholar] [CrossRef]
- Arndt, C.; Garcia, A.; Tarp, F.; Thurlow, J. Poverty reduction and economic structure: Comparative path analysis for Mozambique and Vietnam. Rev. Income Wealth 2011, 58, 742–763. [Google Scholar] [CrossRef]
- Wiedmann, T; Suh, S; Feng, S; Kuishuang, F; Lenzen, M; Acquaye, A; Scott, K; Barrett, J. Application of hybrid cycle approaches to emerging energy technologies: The case of wind power in the UK. Environ. Sci. Technol 2011, 45, 5900–5907. [Google Scholar]
- Leontief, W. Environmental Repercussions and the Economic Structure: An Input-Output Approach. Rev. Econ. Stat. 1970, 3, 262–271. [Google Scholar] [CrossRef]
- Defourny, J. Une Approche Structurale pour l’Analyse input-output: Um Premier Bilan. Economie Appliquée 1982, 35, 203–230. [Google Scholar]
- Lenzen, M.; Murray, J. Conceptualising Environmental Responsibility. Ecol. Econ. 2010, 70, 261–270. [Google Scholar] [CrossRef]
- Roberts, D. The role of households in sustaining rural economies: A structural path analysis. Eur. Rev. Agricult. Econ. 2005, 32, 393–420. [Google Scholar] [CrossRef]
- Wood, R.; Lenzen, M. Structural path decomposition. Energy Econ. 2009, 21, 335–341. [Google Scholar] [CrossRef]
- Suh, S.; Heijungs, R. Power series expansion and structural analysis for life cycle assessment. Int. J. Life Cycle Assess. 2007, 12, 381–390. [Google Scholar] [CrossRef]
- Lenzen, M. Structural path analysis of ecosystem network. Ecol. Model. 2007, 200, 334–342. [Google Scholar] [CrossRef]
- Lenzen, M. Environmentally important path, linkages and key sectors in the Australian economy. Struct. Chang. Econ. Dyn. 2003, 14, 1–34. [Google Scholar] [CrossRef]
- Defourny, J.; Thorbecke, E. Structural path analysis and multiplier decomposition within a social accounting matrix framework. Econ. J. 1984, 94, 111–136. [Google Scholar] [CrossRef]
- Martinez, H.S. Socio-economic Assessment of Sustainable Sugarcane-Ethanol Production in Northeast Brazil, Dissertação Mestrado; Universidade Utrecht: Utrecht, The Netherlands, 2011. [Google Scholar]
© 2013 by the authors; licensee MDPI, Basel, Switzerland. This article is an open access article distributed under the terms and conditions of the Creative Commons Attribution license (http://creativecommons.org/licenses/by/3.0/).
Share and Cite
Caldeira-Pires, A.; Da Luz, S.M.; Palma-Rojas, S.; Rodrigues, T.O.; Silverio, V.C.; Vilela, F.; Barbosa, P.C.; Alves, A.M. Sustainability of the Biorefinery Industry for Fuel Production. Energies 2013, 6, 329-350. https://doi.org/10.3390/en6010329
Caldeira-Pires A, Da Luz SM, Palma-Rojas S, Rodrigues TO, Silverio VC, Vilela F, Barbosa PC, Alves AM. Sustainability of the Biorefinery Industry for Fuel Production. Energies. 2013; 6(1):329-350. https://doi.org/10.3390/en6010329
Chicago/Turabian StyleCaldeira-Pires, Armando, Sandra Maria Da Luz, Silvia Palma-Rojas, Thiago Oliveira Rodrigues, Vanessa Chaves Silverio, Frederico Vilela, Paulo Cesar Barbosa, and Ana Maria Alves. 2013. "Sustainability of the Biorefinery Industry for Fuel Production" Energies 6, no. 1: 329-350. https://doi.org/10.3390/en6010329