1. Introduction
The development of hybrid and electrical vehicles has intensified during the past years and vehicle manufacturers have to work with numerous battery issues, including lifetime, weight and cost. Battery lifetime requirements are challenging since several factors have an influence, e.g., the level of vehicle hybridisation, vehicle usage and operational environment [
1]. Knowledge of battery degradation mechanisms are required in order to facilitate optimization of a complete electrical vehicle system. Alternative cell packaging materials such as laminate pouches can reduce the hybrid battery system cost and weight compared to conventional metal canister encapsulation [
2]. Laminate pouch cells are commonly used in consumer electronic products (e.g., cellular phones) where lifetime demands are essentially lower compared to the automotive industry. For example, batteries in electrified vehicles will most likely be exposed to higher vibration levels and more extensive temperature fluctuations compared to batteries in consumer electronic products. This harsh environment requires excellent cell packaging material properties. In addition, the expected lifetime of heavy-duty commercial vehicles exceed 15 years, several times longer than the expected lifetime of consumer electronic products.
Today, lithium-ion batteries are available in many different sizes and shapes, all requiring excellent encapsulation for protection against the surrounding environment. For example, water contamination of the electrolyte can cause unwanted decomposition of the electrolyte salt [
3] with hydrogen fluoride (HF) as one possible decomposition product. One suggested mechanism [
4] for salt decomposition is presented in Equations (1) and (2):
Produced HF can react with both negative and positive electrode materials and cause accelerated ageing [
5,
6,
7,
8] of the lithium-ion battery. The most common laminate pouch cell material consists of an aluminium foil between two polymer layers. The aluminium foil is intended to function as a barrier against all permeation, both into and out from the battery cell, including water diffusion. The outside polymer layer works as a mechanical protection and the inner polymer as a chemical protection. The inner polymer layer often consists of polypropylene (PP) while the outer polymer layer often consists of polyamide (PA) or polybutylene terephthalate (PBT). The pouch cells are formed by thermal welding of the edges during which the inner polymer layers are joined together. To ensure an air tight seal around the connectors, additional material are needed. The inner thermoplastic polymer welds is supposed to block diffusion of water and air from the outside, as well as act as a barrier for the electrolyte. A risk with this type of thermal welding is leaks through micro-cracks caused by insufficient amount of plastic materials or wrong temperature during the welding process. Leakage testing with fluid, hydrogen or humid air is possible methods for detecting faults in cell encapsulations. The aluminium layer need to be of high quality to guarantee absence of pinholes that otherwise could act as diffusion pathways. A thickness of 25 µm is commonly considered free of pinholes according to the food packaging industry [
9].
One issue with laminate packaging material is the mechanical strength, especially at low temperatures. This is a matter that needs to be investigated further in order to determine the material suitability for battery applications in harsh environments [
10]. In this study, water diffusion into pouch cells, including thermal polymer welds, has been investigated. This study was performed in collaboration with Scania CV AB and Innventia AB.
2. Results and Discussion
FTIR analysis showed immense similarity between the outer polymer material and polyamide (PA), either PA 6 or PA 6.6. The results from DSC suggested a melting temperature around 225 °C, corresponding to PA 6 according to literature [
11]. The FTIR spectrum of the inner polymer suggested polypropylene (PP), in good agreement with the melting temperature of 164 °C obtained from DSC analysis, indicating that commercial PP was used according to literature [
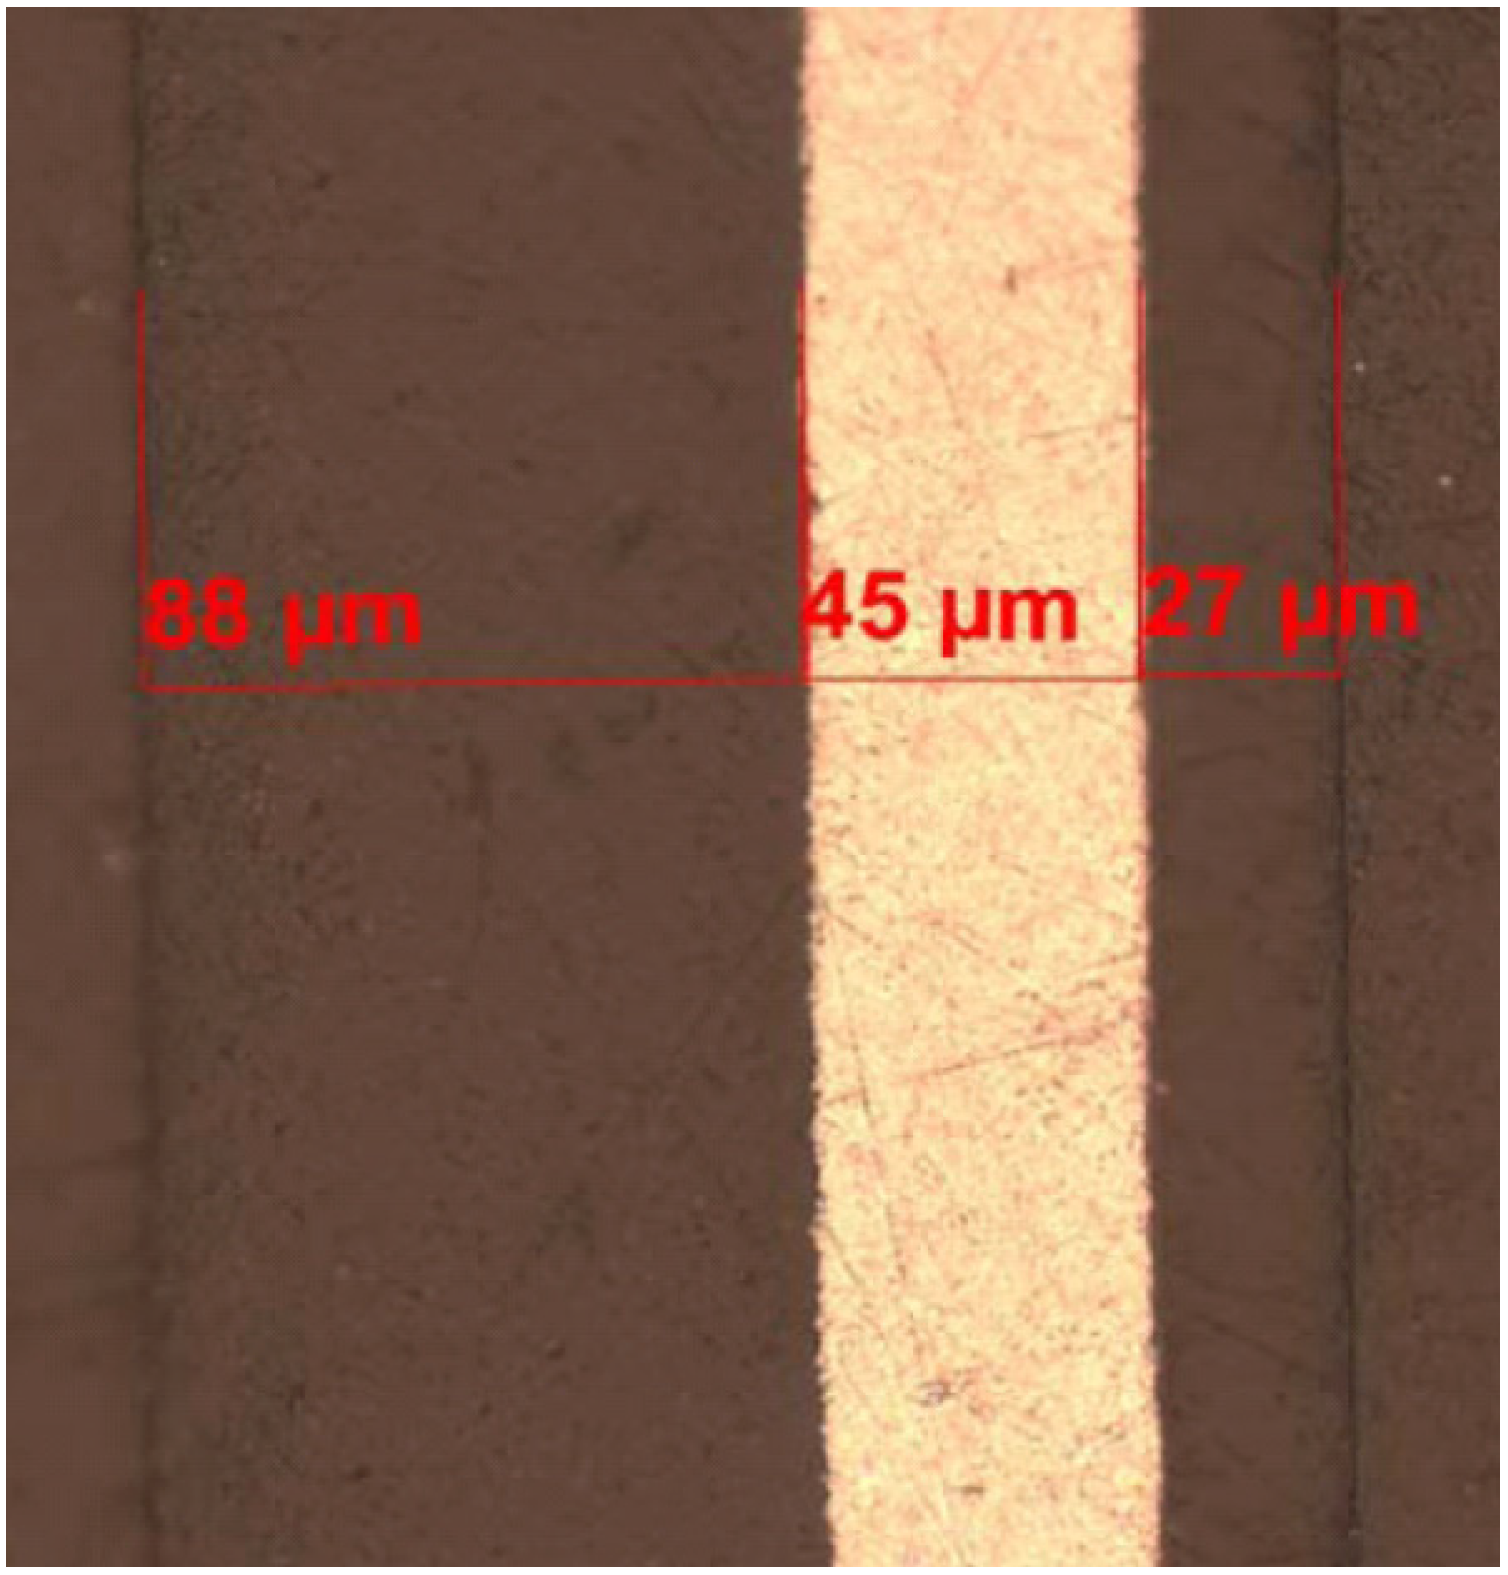
11]. DSC studies of complete pouch material including thermal welds corresponded well to the studies of individual components indicating that the welding procedure do not seem to cause material degradation. Optical microscopy and FTIR analysis also showed that the material around the connector tabs consist of a three layered structure based on olefin. DSC suggested low density polyethylene (LDPE) as one layer but the other two materials could however not be specified. SEM and EDX studies of the aluminium film showed a matrix of Al with precipitations of Al, Fe and Si. The thicknesses are mean values from four different cross sections (
Table 1 and
Figure 1).
Table 1.
Thicknesses of individual pouch package layers.
Table 1.
Thicknesses of individual pouch package layers.
| Film | Film thickness [µm] |
|---|
| PA (Outside) | 27 ± 3 |
| Aluminium | 45 ± 0.5 |
| PP (Inside) | 88 ± 3 |
Figure 1.
Microscope picture from a cross-section of the laminate material in a pouch cell: 88 μm PP, 45 μm aluminium foil and 27 μm PA6.
Figure 1.
Microscope picture from a cross-section of the laminate material in a pouch cell: 88 μm PP, 45 μm aluminium foil and 27 μm PA6.
The glass transition temperature for commercial available PP is −20 °C [
11], and the temperature during the vibration test went down to −25 °C. This means that the thermal welds in the tested cells could enter a brittle state several times during the vibration test, and this might have an effect on WVTR. The prepared battery packages did not reveal any leakage, including epoxy seals and Swagelok connectors, when tested with the hydrogen detector.
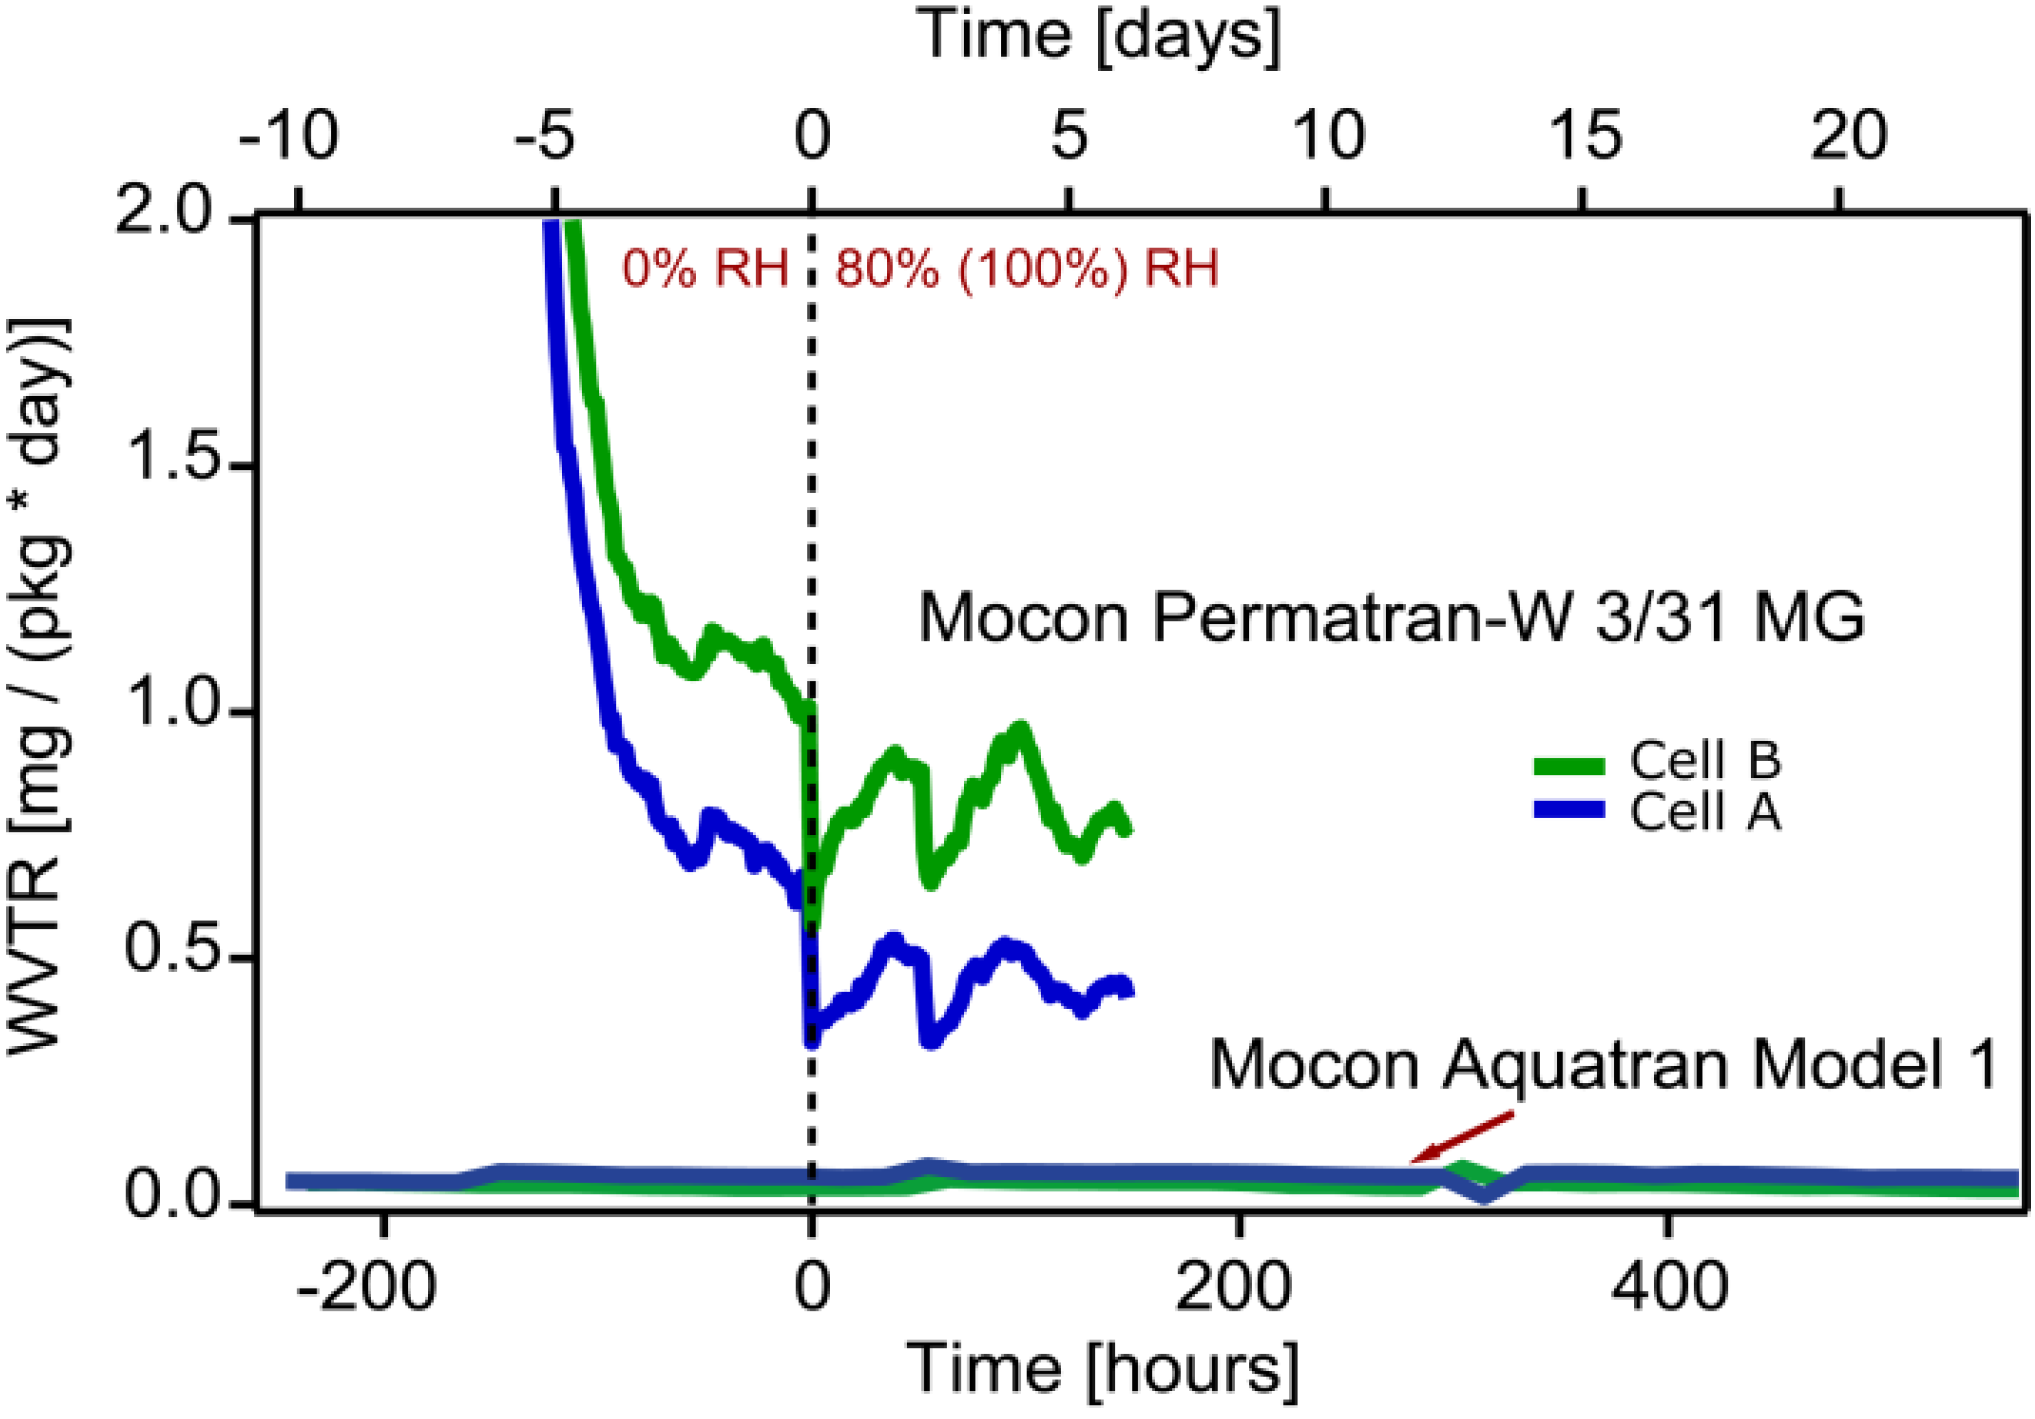
The first test in which the Mocon Permatran equipment was used showed diminishing WVTR levels throughout the entire study for both the vibrated and reference cell. The most probable cause for this behavior is that the inner polymer layer still contains water even after the precondition period. At time zero showed in
Figure 2 the humidity surrounding the packages were changed from 0% RH to 100% RH and from 0% to 80% RH respectively. However, no change in WVTR level could be correlated to the change of humidity level outside the packages during the test period.
Figure 2.
WVTR results from both Mocon Permatran-W 3/31 MG (100% RH) and Mocon and Aquatran Model 1 (80% RH) equipments. Cell A is the encapsulation from a fresh battery cell. Cell B is from a vibration tested cell.
Figure 2.
WVTR results from both Mocon Permatran-W 3/31 MG (100% RH) and Mocon and Aquatran Model 1 (80% RH) equipments. Cell A is the encapsulation from a fresh battery cell. Cell B is from a vibration tested cell.
The WVTR levels measured with the Mocon Permatran equipment were higher compared to the calibrated background level. The rapid reduction of detected humidity in
Figure 2 in the beginning of the test indicates presence of water in the polymer inside the encapsulation as well as on surfaces inside the test set-up. This implies that a more rigorous drying process should have been applied prior to the measurement. Furthermore, since the measurement period was relatively short a steady-state situation was never established. For each measurement point the integration time for the detector was 45 min. This time was too short to establish stable WVTR levels. (Mocon Permatran curves in
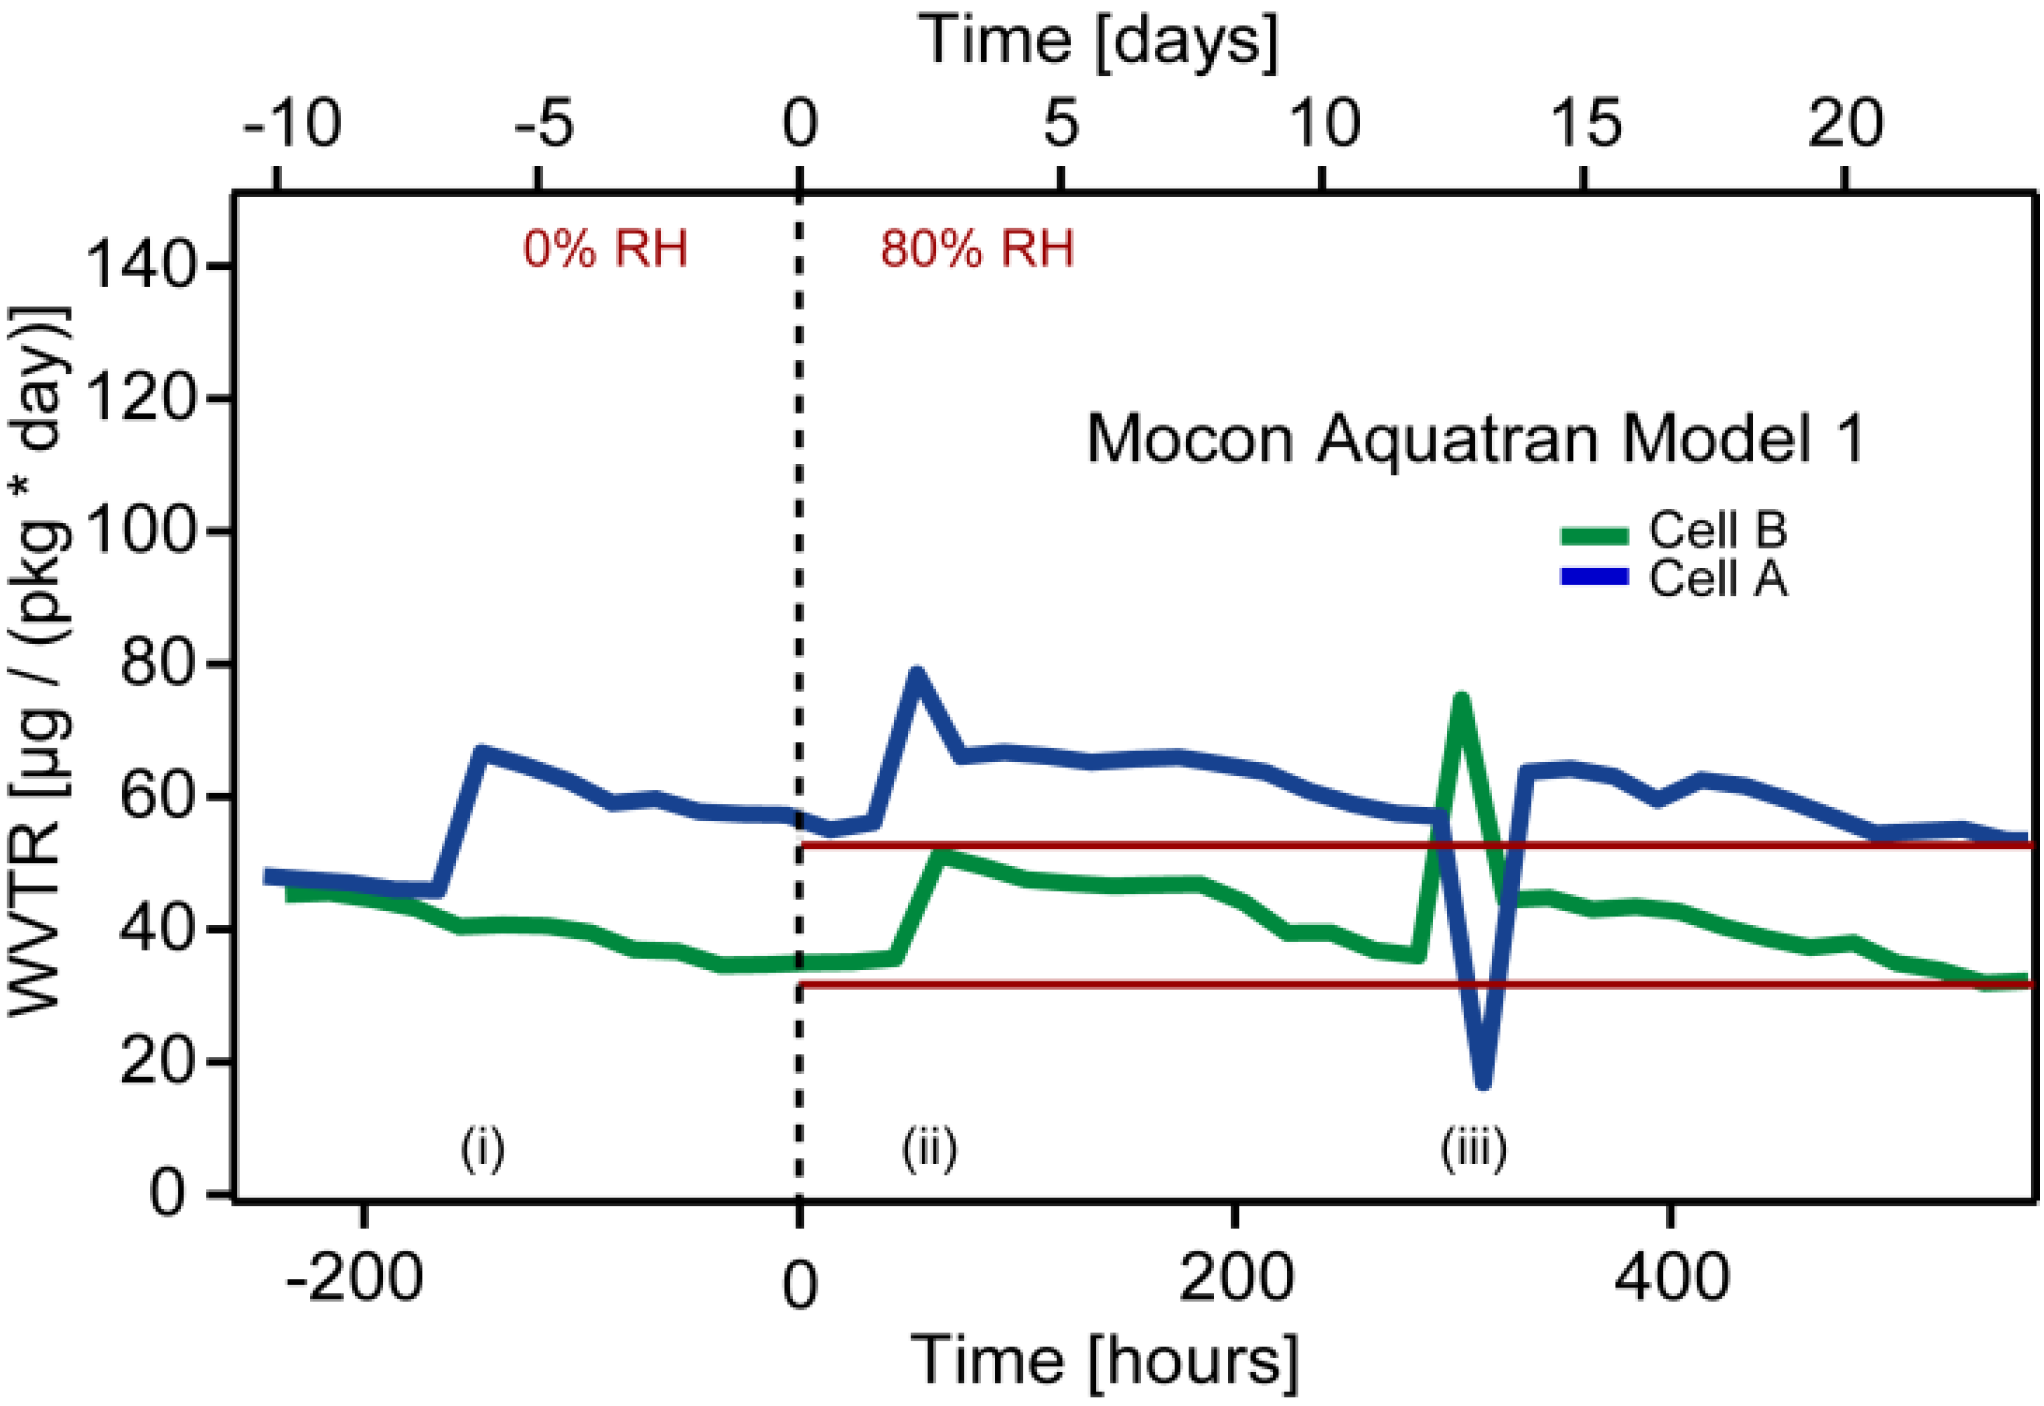
Figure 2). However, in the in the second test when using a Mocon Aquatran equipment both the integration time and the total test time were extended. In addition, to ensure a dry environment inside the packages before testing they were purged with dry nitrogen in an elevated temperature (50 °C) for several weeks. The packages were exposed to the humidity in the air for several months before purging, and this should have eliminated all residues of lithium salt that otherwise could have had an influence on the WVTR measurement. Aquatran equipment has an order of magnitude lower detection limit compared to the Permatran. The comprehensive preconditioning enabled studies of very low water vapor concentrations. Nevertheless, it was not possible to reach the detection limit of the instrument even during the second test. The measured water vapor transmission rate approached values close to 40 μg/(package day) (
Figure 3),
i.e., an order of magnitude higher than the detection limit of the equipment [2.5 μg/(package day)].
Figure 3.
WVTR results from Mocon Aquatran Model 1 equipment. Cell A is the encapsulation from a fresh battery cell. Cell B is from a vibration tested cell.
Figure 3.
WVTR results from Mocon Aquatran Model 1 equipment. Cell A is the encapsulation from a fresh battery cell. Cell B is from a vibration tested cell.
In addition, the background levels were measured to 46 μg/(package day) for Cell A and 43 μg/(package day) for Cell B. It could not be confirmed if it was leakage within the test set-up including all valves and connections or an internal test equipment issue connected to the automatic calibration system that caused the large background levels. However, the transmission rate of water through the encapsulations remained below the background level throughout the complete test for both the vibrated cell and the reference cell. In addition, no trends of increasing WVTR levels are seen in the curves in
Figure 2 even after almost 500 hours exposure to humidity. This indicates that the encapsulation material and thermal welds are virtually defect free even after vibration and temperature cycling, indicating that the forces on the welds caused by the vibration test is insufficient to induce defects in the material. The peaks seen in
Figure 3 were caused by:
- (i)
Connecting pouch cells to detector;
- (ii)
Gas flow adjustment;
- (iii)
Change of gas bottle.
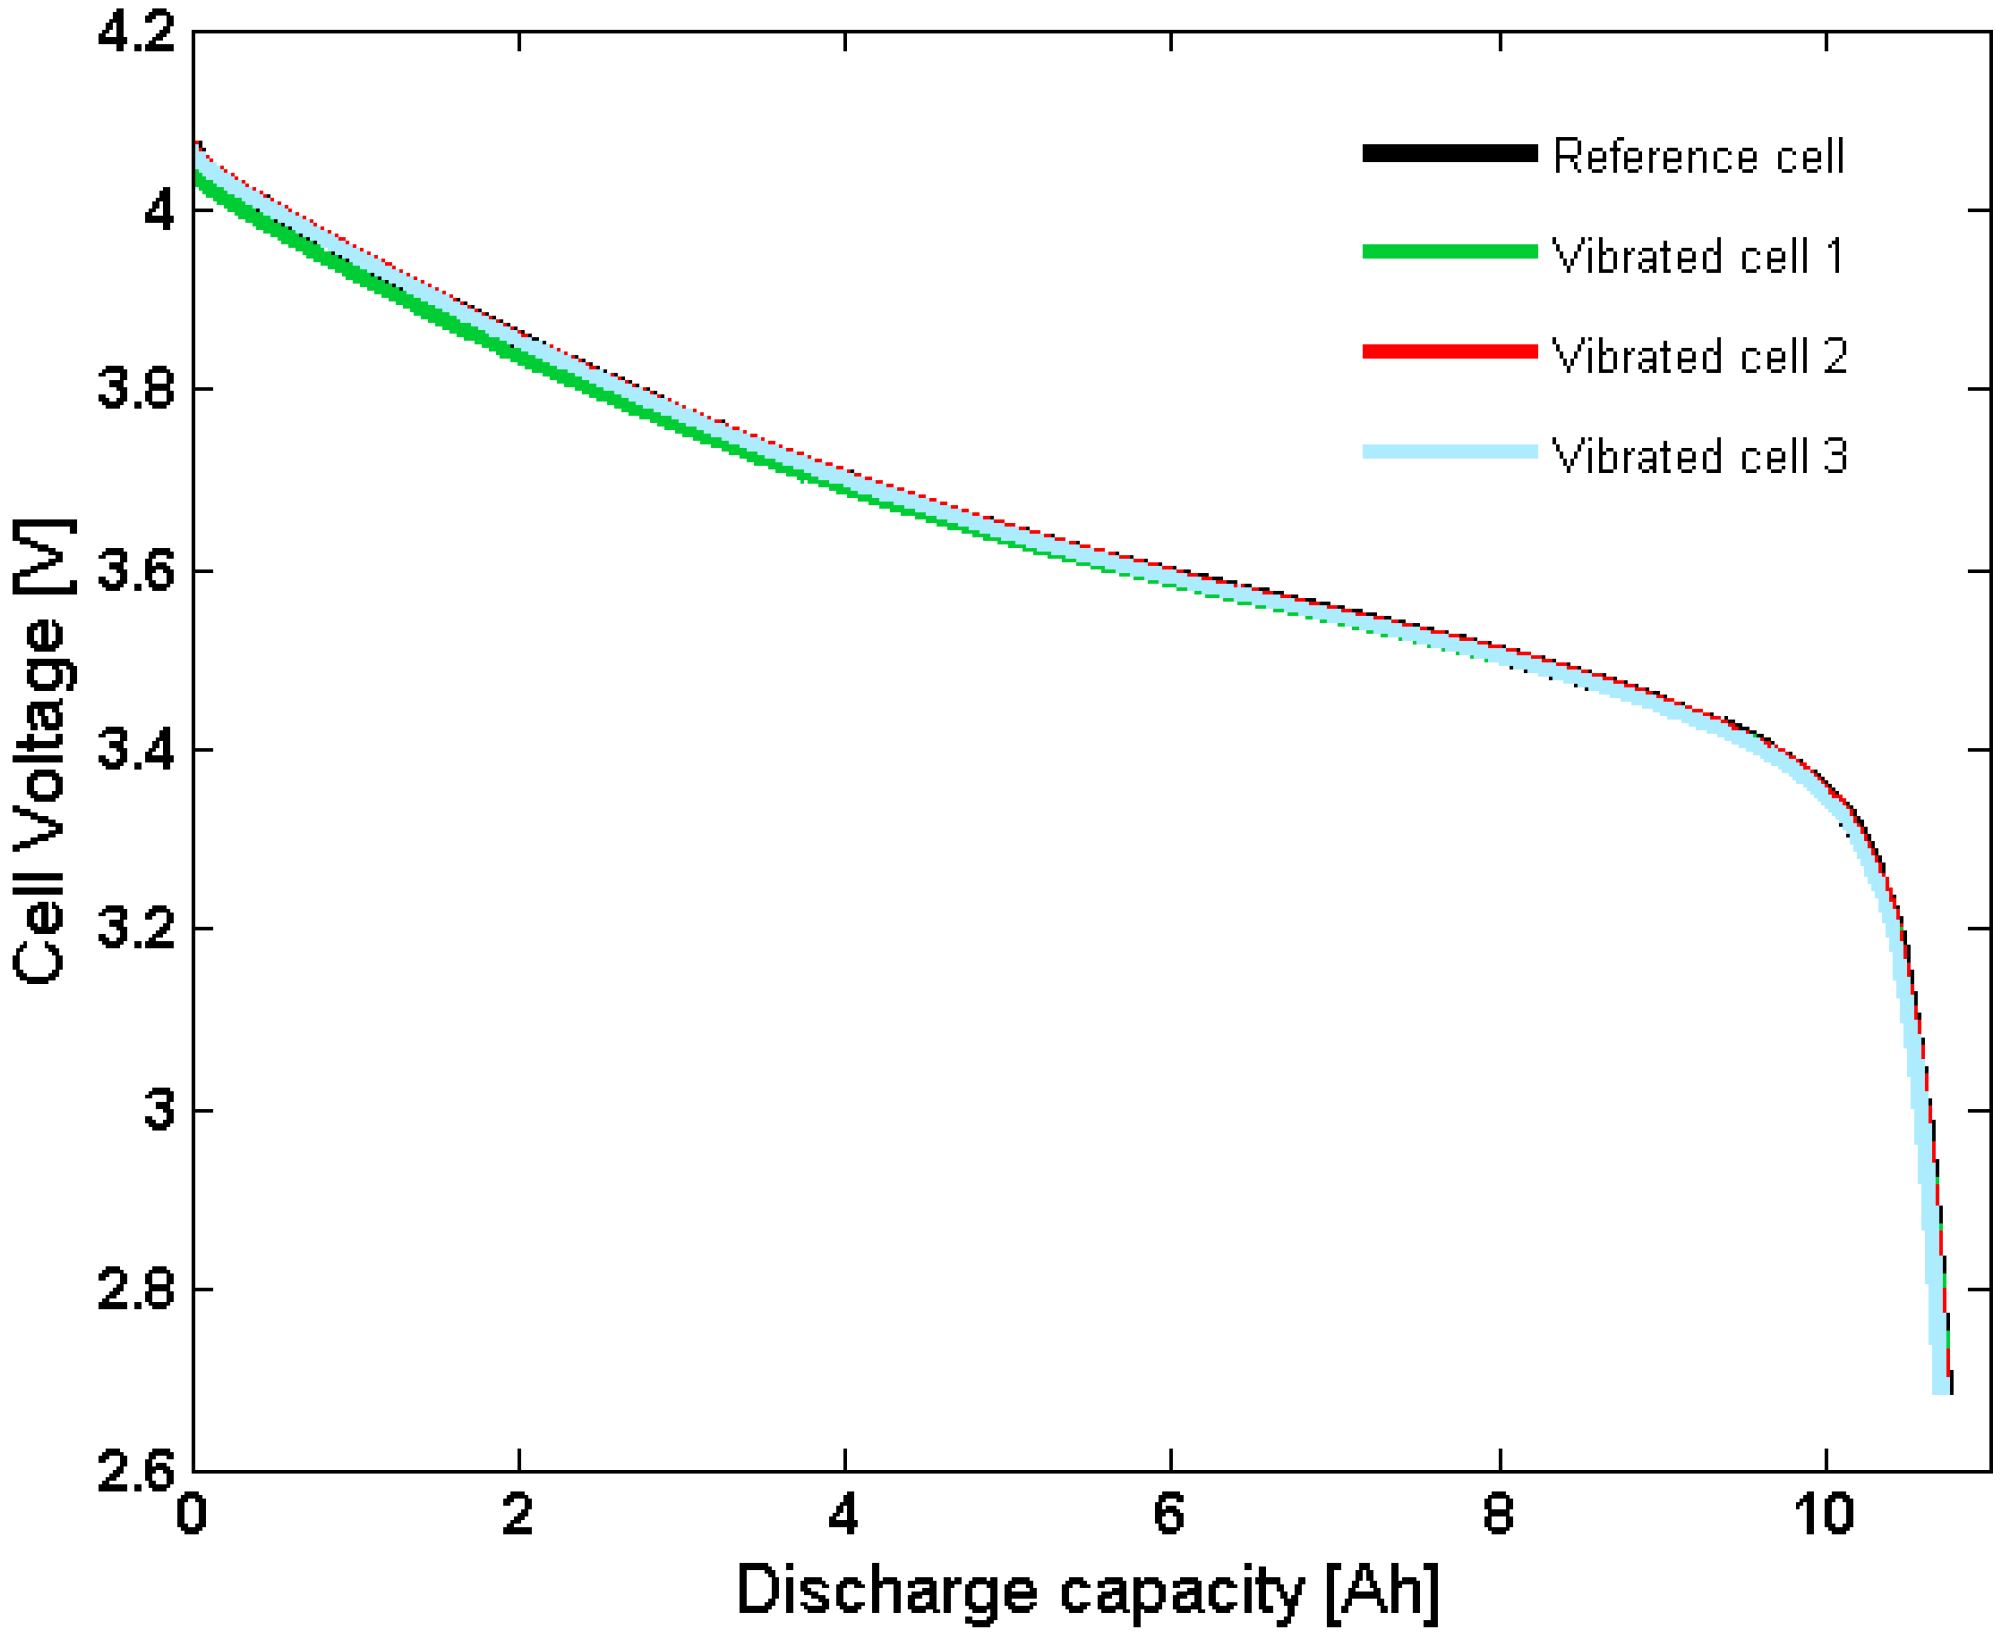
Capacity measurements showed no difference between cycled battery cells and fresh reference cells. The total spread in capacity between all tested batteries was less than 0.5%. This indicates that the vibration and temperature cycling had no significant influence on the electrochemical performance of the batteries (
Figure 4).
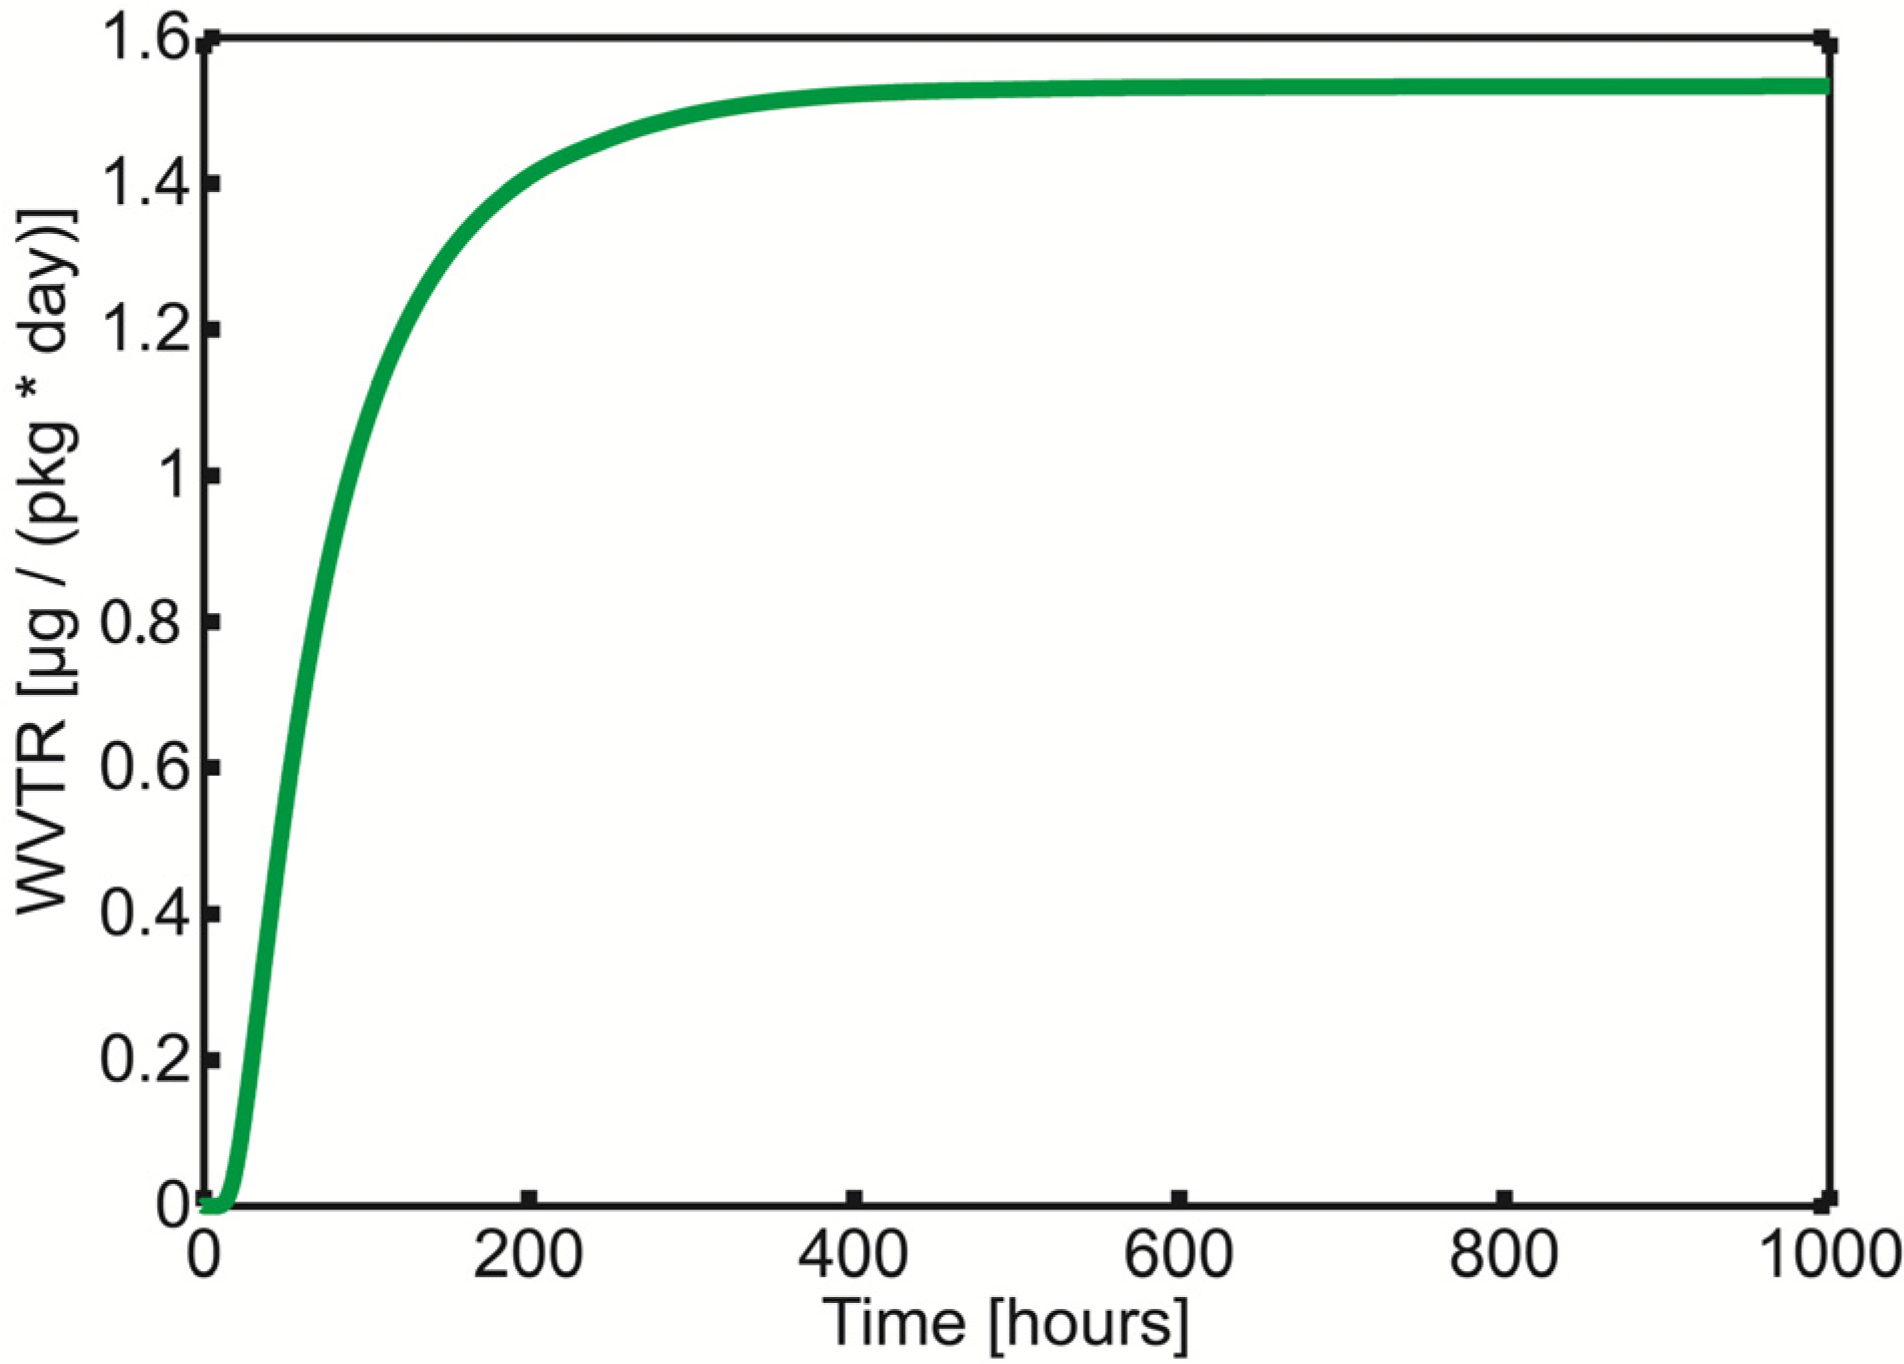
The results from the modeling of the thermal welds show that the PP material in the welds gets saturated after about 400 hours at 23 °C (
Figure 5). It is seen that the WVTR level in the simulation, 1.5 μg/(pack day), has the same magnitude as the detection limit of the Mocon Aquatran equipment. The simulated WVTR level corresponds to a total amount of water of 8.2 mg after 15 years. This corresponds to an electrolyte humidity level of about 150 ppm assuming that the weight fraction of electrolyte in the cell is 15% [
12]. A more probable situation is that the water reacts with the electrolyte salt. In this case, the produced amount of HF would be about 170 ppm. According to flexible packaging survival goals for automotive propulsion batteries, the estimated HF-level for this encapsulation is within target [
9].
Figure 4.
Capacity measurement of three vibrated cells and one reference cell.
Figure 4.
Capacity measurement of three vibrated cells and one reference cell.
Figure 5.
Simulation of water diffusion through thermal polymer welds for 80% RH and 23 °C.
Figure 5.
Simulation of water diffusion through thermal polymer welds for 80% RH and 23 °C.
3. Experimental
Commercial lithium-ion battery cells (130 mm × 200 mm, 12 Ah) were studied to investigate how the harsh environment in a vehicle could affect the integrity of the battery encapsulations. Three battery cells were exposed to vibration and temperature cycling at Scania CV AB according to standard ISO16750-3 [
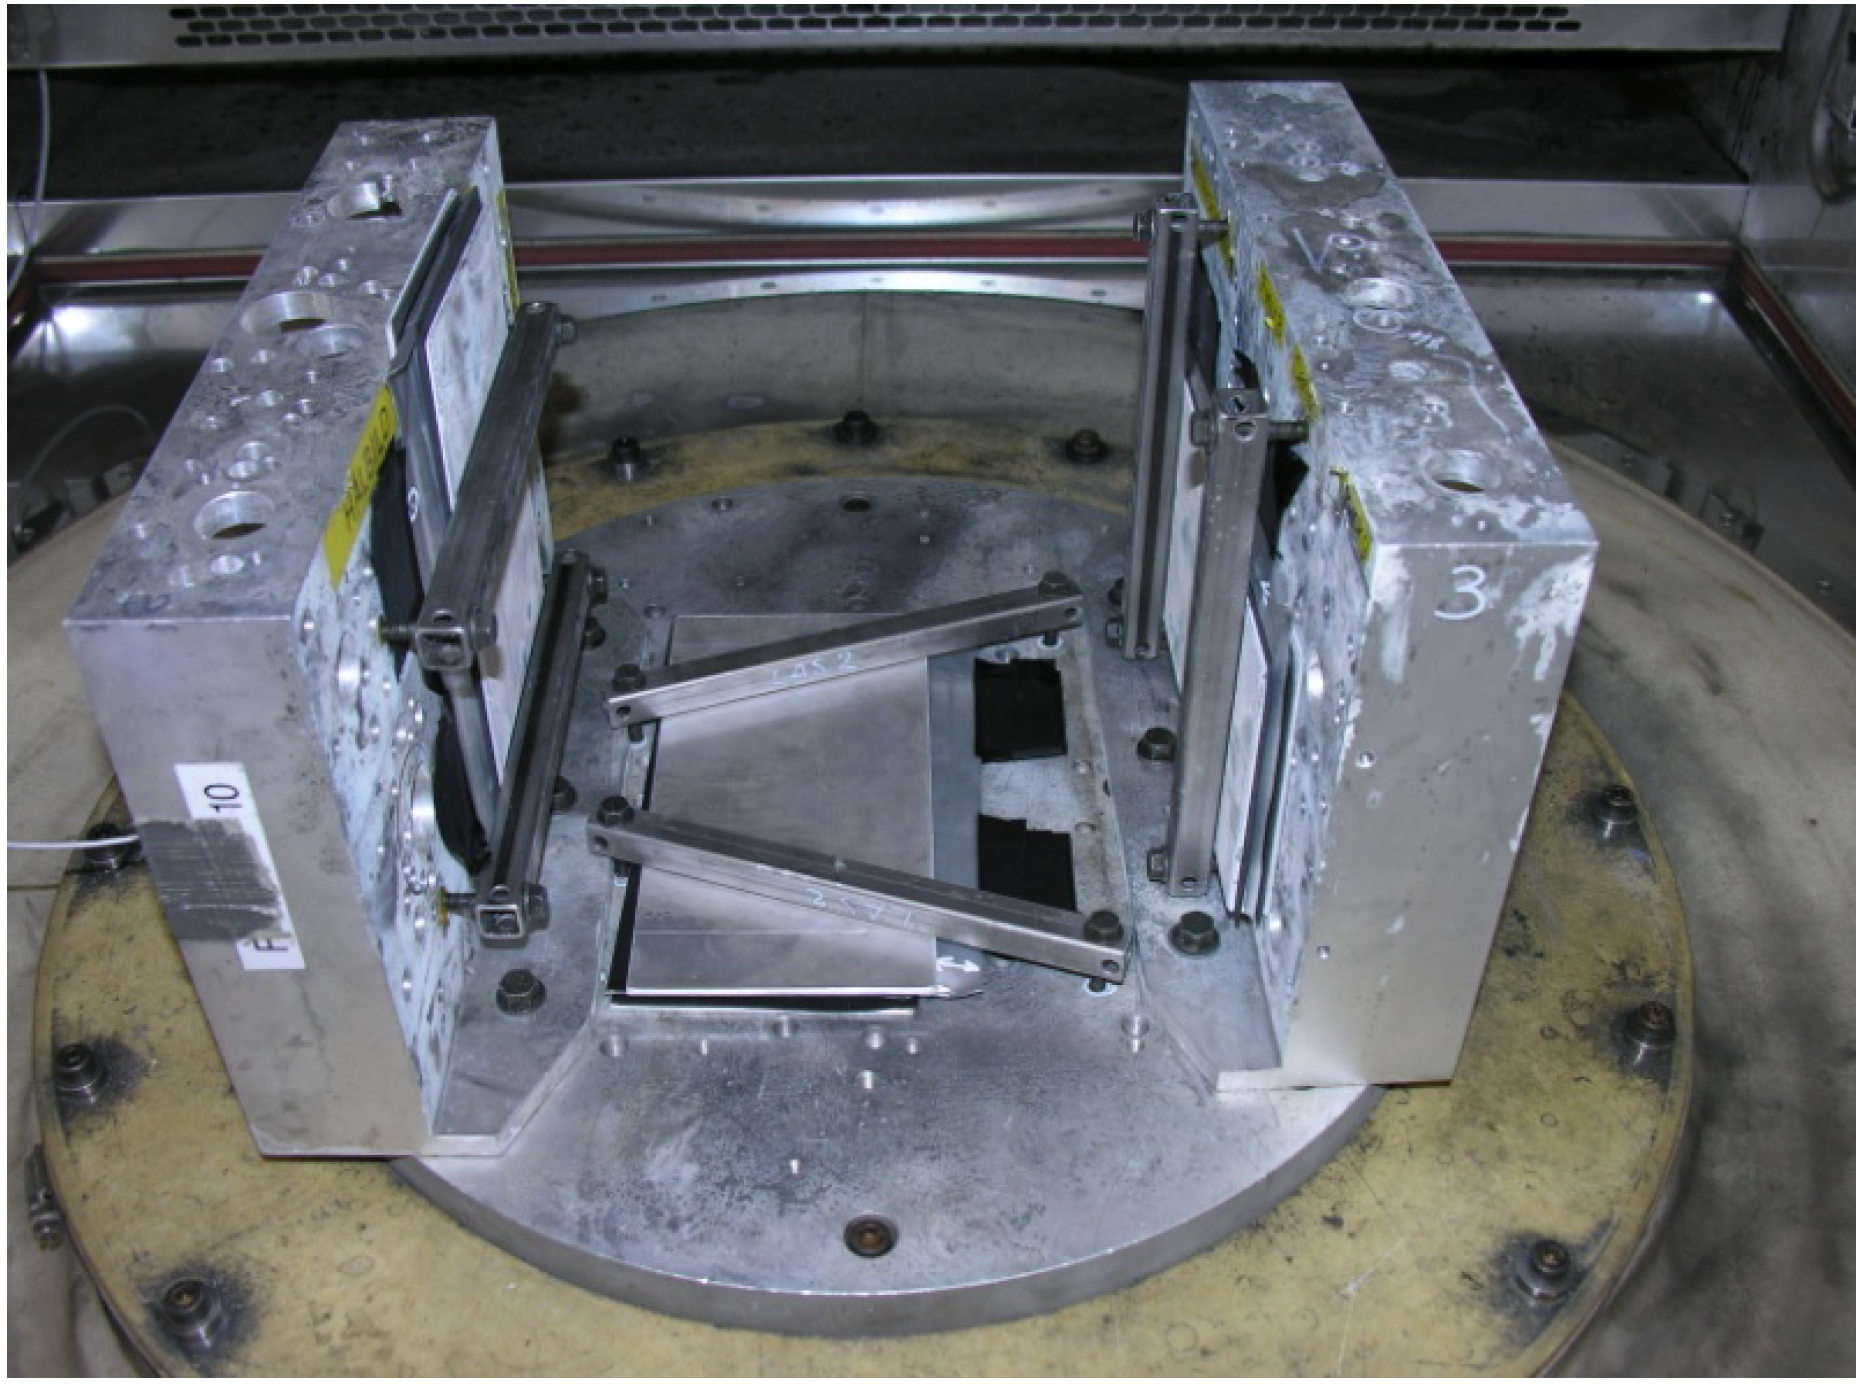
13], paragraph 4.1.2.7, “Test VII—Commercial vehicle, sprung masses”. A vibration equipment LDS V8 and temperature chamber Vötsch VCV 7120-5 were used. The batteries were mounted on a holder according to
Figure 6 and were not electrically connected during the test.
The cells were exposed to random vibration levels of maximum 5.2 g (RMS) within a frequency range between 8 Hz and 500 Hz. In addition, the temperature was ramped between −25 °C and +70 °C periodically during the complete vibration test.
Capacity measurements (at 25 °C and a rate of 1C) were performed before and after the environmental testing of the cells. An Amrel PLA 800-60-300 electrical load was used together with an NI 9219 National Instruments data acquisition equipment and the test was performed in a B.I.A Climatic MTH 4-30 climate chamber.
Figure 6.
Mounting of three battery cells prior to vibration test and temperature cycling.
Figure 6.
Mounting of three battery cells prior to vibration test and temperature cycling.
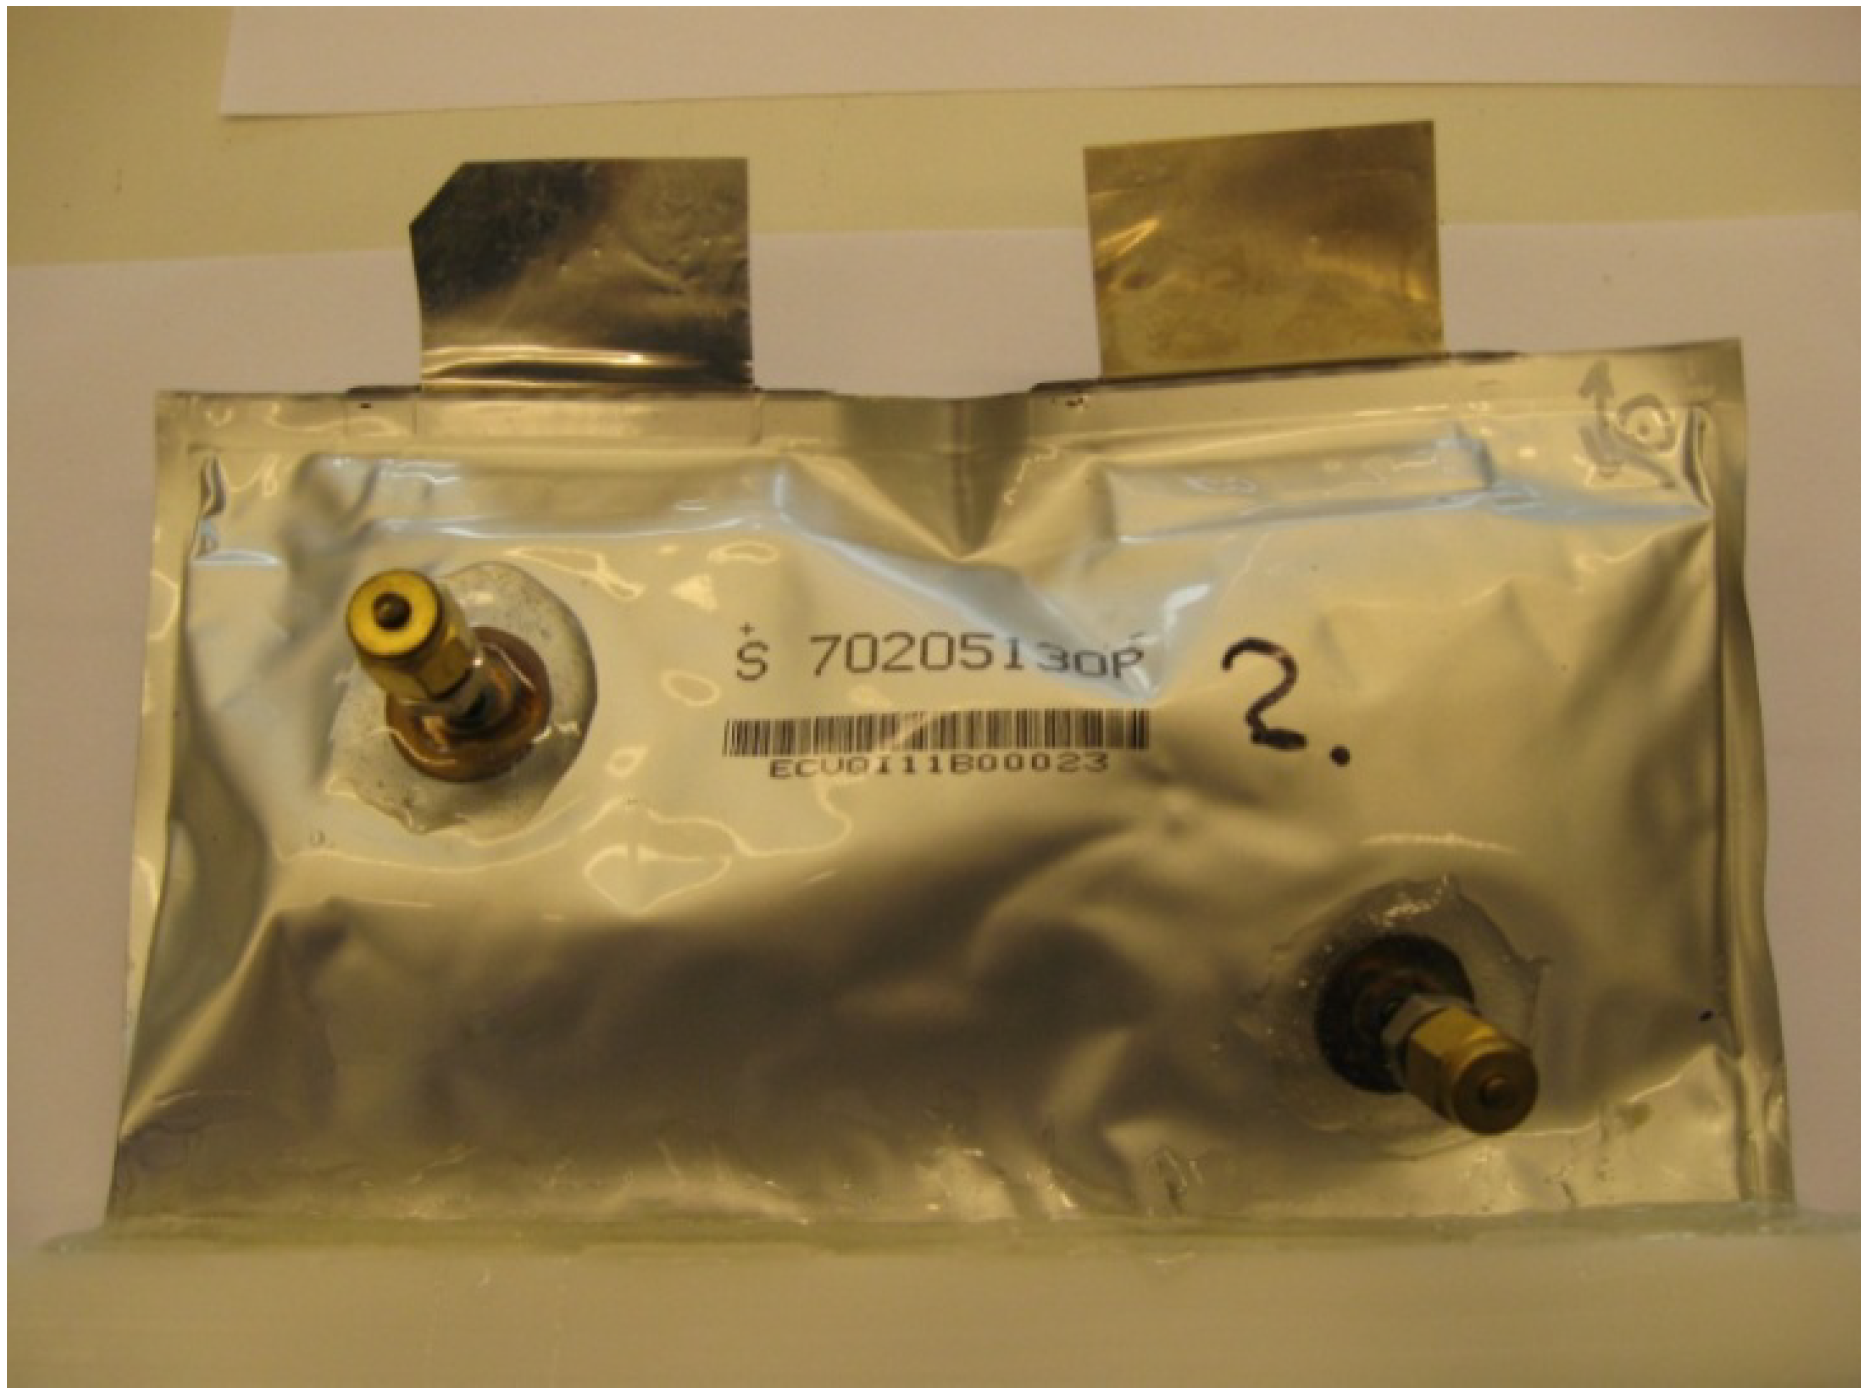
All battery cells were completely discharged with a 5 Ω power resistor before opening the encapsulations. The cells were opened by making an incision with a scalpel on the side opposite to the current collector tabs and no thermal welds were affected by this procedure. Electrodes and separator were gently removed from the cells. Residual electrolyte was thereafter allowed to evaporate from the empty encapsulations for 12 hours in a fume hood. When drying was completed, the battery packages were prepared for WVTR measurements; Swagelok connectors with welded washers were attached to the battery packages with epoxy glue as shown in
Figure 7. The opening made earlier was sealed with epoxy glue together with a plastic bar to stabilize the set-up.
Figure 7.
The Swagelok connector on the left in picture was used as inlet for dry nitrogen. The right connector was the outlet for nitrogen gas which was directed to the detector in the Mocon equipment.
Figure 7.
The Swagelok connector on the left in picture was used as inlet for dry nitrogen. The right connector was the outlet for nitrogen gas which was directed to the detector in the Mocon equipment.
Water vapour transmission measurements were performed according to the standard test method for water vapour transmission rate through plastic films and sheeting, ASTM F 1249-05 [
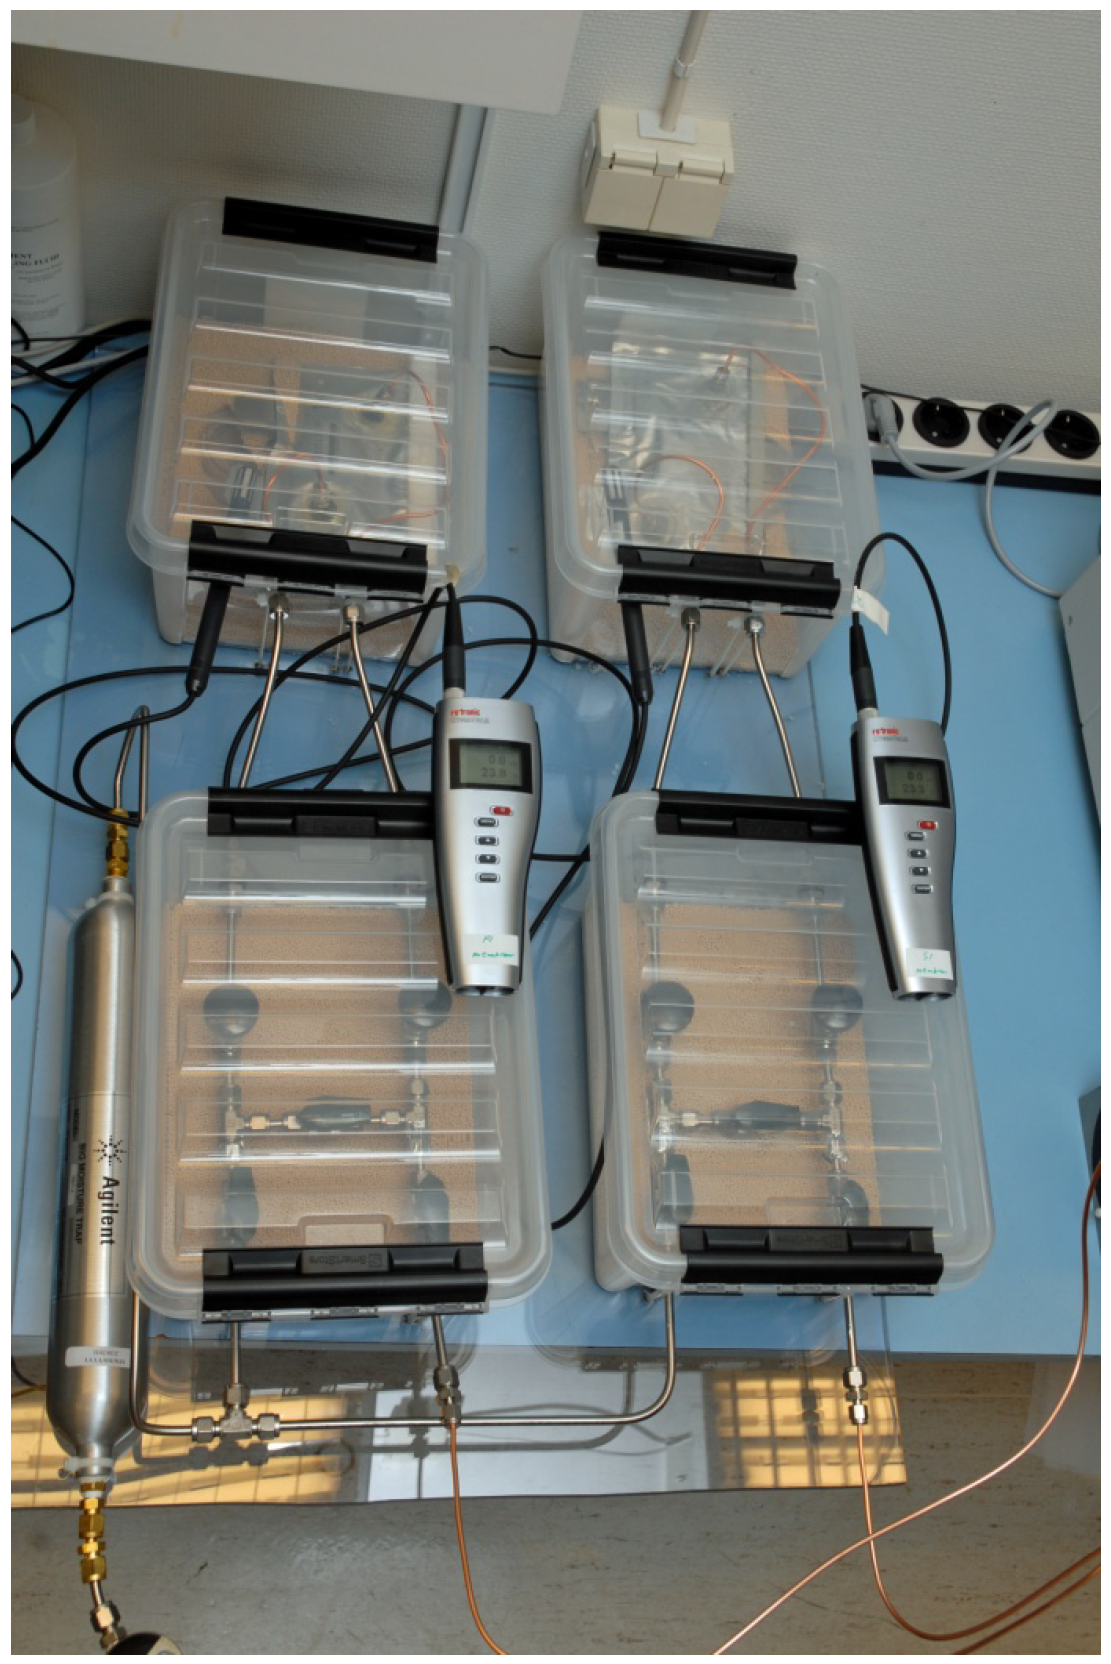
14]. Preconditioning of the packages was carried out in an environment where the humidity was close to 0%. Temperature and relative humidity (RH) measurements inside the plastic box that was acting as a climate chamber for the battery packages were performed with a Rotronic (Bassersdorf, Switzerland) HygroPalm HY-Palm 0 sensor (
Figure 8).
Figure 8.
Battery packages and valve system inside plastic boxes acting as a climate chambers. Test set-up for the Mocon Aquatran measurement.
Figure 8.
Battery packages and valve system inside plastic boxes acting as a climate chambers. Test set-up for the Mocon Aquatran measurement.
Two different equipments were used for the WVTR measurements, a Mocon Permatran W 3/31 MG (Mocon, Inc., Minneapolis, MN, USA) with a water vapour detection limit of 30 μg per package and day, and a Mocon Aquatran Model 1 with a water vapour detection limit of 2.5 μg per package and day. Both test equipments can handle two samples at the same time. The Mocon Permatran uses an IR-detector while the Mocon Aquatran uses an electrochemical detector, a coulometric phosphorous pentoxide sensor. WVTR measurements performed on the Permatran equipment preconditioning was performed by first purging the packages with nitrogen at a flow rate of 150 mL/min for about 7 days at 23 °C. The flow rate of nitrogen during measurement was 10 mL/min and the examination time for each sample was 45 min. The water vapour transmission rate was studied at 100% relative humidity (RH) and 23 °C, corresponding to a water vapour pressure of 0.02773 atm. Preconditioning before measurement with the Aquatran equipment was performed by first purging packages, tubing and with nitrogen at a flow rate of 170 mL/min during 45 days at 50 °C. In this set-up, the packages and valves were placed inside boxes filled with drying agent (
Figure 8). A climate chamber was used to heat up the entire set-up during preconditioning. Additional purging with dry nitrogen was carried out for 7 days at 23 °C after connecting the set-up to the Aquatran equipment. Only the tubing, the Agilent moisture trap and the valves in the two lower boxes in
Figure 8 were purged during this step. In addition, all valves were provided with silicon grease (Dow) to counteract contamination of water. The flow rate of nitrogen during measurement was 23 mL/min. The examination time for one test cycle was 5 hours. The water vapour transmission rate was studied at 80% RH using a KCl solution to ensure a condition below the dew point at 23 °C, which was the temperature during testing. The corresponding water vapour pressure was in this case 0.02219 atm. eliminating the risk for condensing water on the package during testing. The WVTR measurements were performed on two cells, one vibrated and one un-stressed, for both the Permatran and Aquatran equipment.
The polymer layers in the commercial pouch were analysed by means of Fourier Transmission Infrared Spectroscopy (FTIR) and Differential Scanning Calorimetry (DSC). FTIR could be used directly on the individual pouch materials without separating the polymer layers from the aluminium layer since the latter effectively blocks the IR light from reaching the polymer on the opposite side. DSC studies were performed on delaminated polymers separately; inside, outside, thermal welds including welds around current tabs. Different procedures for sample extraction were used in order to guarantee the validity of the results. Small amounts (~5 mg) were removed with a scalpel at room temperature and greater amounts (~15 mg) were separated from the pouch at elevated temperatures, but below the melting point. A Mettler DSC 30 with inert atmosphere (N2, 80 mL/min) was used for DSC studies at different temperatures.
Different parts of the pouch cell material were embedded in epoxy resin, grinded and polished. The thickness of the encapsulation materials was determined from studying polished cross sections with light optical microscopy. The aluminium layer was characterized using a Scanning Electron Microscopy (SEM) including Energy Dispersive X-ray Analysis (EDX). The SEM was a Philips XL30 (FEI, Hillsboro, OR, USA).
A simple model of the thermal welds was set up using input from the results of the material analysis of the packaging material. Fickian diffusion was used as governing equation in the model (Equation 3) which was set up using Comsol Multiphysics® software [
15]:
The boundary conditions were set to 0% RH on one side of the weld and 80% RH on the other side. The initial condition was 0% RH throughout the thermal welds. The diffusion coefficient was 2.0 × 10
−11 m
2/s and the temperature 23 °C. [
16,
17,
18,
19].


