1. Introduction
Smart metering is based on the ability to remotely access and control utility meters. Typical operations include meter reading, connection/disconnection and providing valuable operational information on the electrical grid (transformer load, electricity consumption per LV feeder, historical consumption patterns, etc.).
Smart metering, sometimes known as Automatic Meter Reading (AMR), enables increased overall control of the electrical grid and optimizes energy consumption management (e.g., through tariffs based on known, real time consumption and maximum energy consumption capping at certain times). Two main aspects of smart metering are infrastructure control and network integration. Smart metering programs have become a reality in many utilities all over the world. The deployment is fostered by the interest of the utilities or it is a consequence of government mandates.
Power Line Communications (PLC) is one of the preferred and best suited technologies for smart metering. For reference, [
1] studies PLC technologies for AMR and control applications, [
2,
3] refer to a generic group of PLC applications, [
4,
5,
6,
7,
8] specifically study PLC for AMR, [
9] refers to the usage of PLC technologies in AMR systems for operational purposes, [
10] explains different PLC applications (not only for utility-related purposes) and [
11,
12,
13] address the evolution of smart metering into smart grids. Non-PLC technologies are extensively used for AMR systems. It is believed they lack the integration with the electrical grid naturally offered by PLC. PLC techniques have a long tradition with utilities [
14,
15,
16]. Nevertheless, the objective of having widely accepted, cost effective and field-deployable PLC technologies has been achievable only after open and royalty-free system specifications for narrowband PLC solutions have been developed [
17,
18,
19,
20,
21,
22]. One example of such a technology is PoweRline Intelligent Metering Evolution (PRIME), which is being deployed extensively by Iberdrola in Spain [
23,
24,
25,
26,
27] and is being considered worldwide at standardization organizations such as IEEE, ITU-T, CENELEC or IEC. PRIME [
28] employs Orthogonal Frequency Division Multiplexing (OFDM) and is developed to work in the CENELEC A-band [
29] (42 to 90 kHz range), with adaptive physical layer transmission capabilities of up to 120 kbps, and with a Media Access Control (MAC) layer which guarantees the configuration of highly available “plug and play” telecommunications networks.
Utilities have been waiting for real time PLC systems on LV networks for decades. Most of the existing systems [
8] are capable of retrieving meter readings once in several days so they cannot be deemed as real time. Thus, most AMR systems are not able to offer real time analysis of the grid [
30]. These real time data enable optimized grid operation [
31] and provide instantaneous information about points of supply fed connected to secondary substations (SS’s) [
32]. Possible uses for this information would be fast detection of cable cuts (faults), voltage control, meter tampering detection, and LV monitoring capabilities similar to those in medium and high voltages [
33].
Smart metering networks must provide communications access to millions of points of supply (meters), connected to tens or even hundreds of thousands of SS’s. The connectivity of such networks (e.g., which transformer feeds a certain meter, which is the path for each LV cable etc.) is generally unknown due to the historical grid evolution. This poses a big challenge for smart metering systems.
PRIME is a PLC technology that confers real time characteristics to smart metering networks. Real time networks require monitoring procedures that can assess the performance of the technology in the different deployment scenarios. There are no monitoring procedures for narrowband PLC networks. The monitoring process proposed in this paper does not have a precedent in previous PLC technologies (different to traditional telecommunication technologies, such as SONET/SDH transmission, radio communications or Ethernet switching, well developed in standardization bodies such as the International Telecommunication Union (ITU) and the Institute of Electrical and Electronics Engineers -IEEE). The reason for this novelty is that so far no narrowband PLC technology has been able to provide such real time characteristics (e.g., the “availability” concept in other PLC technologies is based on the possibility of accessing a meter once in a certain period of time that can be measured in units of days or months). Moreover, after the monitoring process is finished, information needs to be compiled in such a way that the results can be analyzed, considering the relevant LV grid data, such as distance to the SS, electrical grid hierarchy, etc (this kind of data can be derived from the basic data included in
Table 2). This analysis is crucial for different reasons including the operational information extracted from the results (e.g., SS connectivity, and LV line and phase identification), and other PLC network related aspects, such as the evaluation and comparison among implementations of the different solutions provided from different manufacturers delivering PRIME interoperable products, and the validation of the criteria used for field deployment options (injection at SS level [
26], effect of the different LV configurations and elements [
27],
etc.).
This paper is organized with a first section briefly describing PLC technology in general, and PRIME in particular. Then it continues with a presentation of the problems to be solved in PLC networks with the proposed monitoring and analysis methodology, including a section with the description of the methodology itself. Another section describes the grid conditioning needed to take advantage of PLC based smart metering systems, in order to gather information on LV feeder and phase connectivity of smart meters.
2. System Aspects of the PLC Technology for Smart Metering
The fundamental system element of smart metering PLC networks is the concentrator. The concentrator is the application level element located at the SS, which concentrates measurements obtained from meters in the LV grid.
Concentrators consist of two parts. One part is in charge of the metering application, and the other is in charge of telecommunications (PLC in the case studied in this paper). In PRIME, the communications part of the concentrator is called the base node (BN), and a subnetwork is defined as the group of service nodes (SN’s; meters consists also of two parts, one in charge of metering, and another one known as SN, in charge of PRIME PLC communications) depending on a BN (usually in a SS). From a telecommunications perspective, we will speak of a BN and SN’s, and from a metering perspective, we will speak of a concentrator and meters, respectively.
The PRIME subnetwork is the message exchange domain where BN and SN’s communicate. BN and SN’s configure a “topology”, i.e., the structure of telecommunications dependencies established among the different meters (their PLC modems) to communicate with the concentrator (its PLC modem).
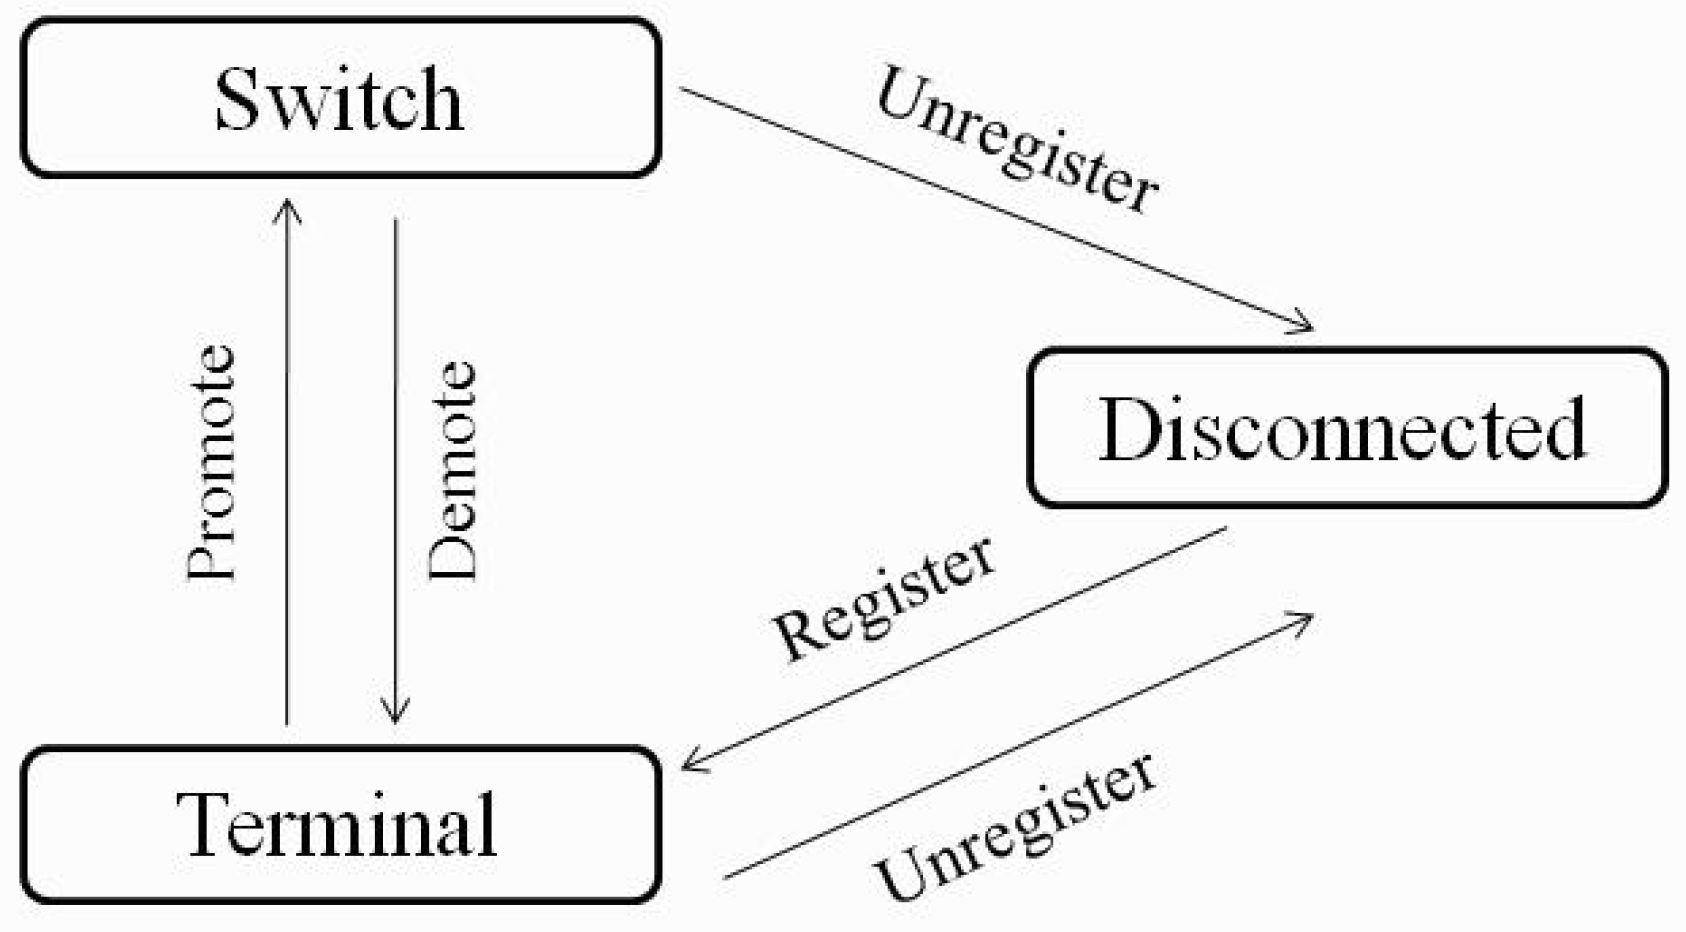
Not all devices in narrowband PLC networks can be reached from the concentrator with a direct physical layer communication between the concentrator and the meter. The concept of “repeater” exists in some PLC technologies in order to create structures that can perform PLC signal repetition, so that all meters can reach the concentrator. In PRIME technology, the concept of repetition lays inside PLC modems, just as a specific state in the state machine of all devices. As an outstanding feature of PRIME, whenever the network detects that a meter needs help to reach the concentrator, different SN’s automatically trigger the process of potentially becoming repeaters (switches) in the network. Having several candidates, only one of them will obtain authorization from the BN to become a repeater to help other meters access the BN. The topology that is established in PRIME is dynamic and self-configurable, and inside the subnetwork, some meters (their modems) manage to behave as switches (the “repeaters”, in PRIME terminology), to provide communications access to other SN’s (meters) that may behave also as switches or just terminal devices.
Figure 1 shows a PRIME PLC technology state machine, and
Figure 2 shows a typical PLC PRIME network topology, where the SN inside meters, and independently of their location in the LV grid, are configured in a dynamic structure of switches and terminals, to be able to communicate every SN with the base node.
Figure 1.
PRIME Service Node (SN) state machine [
28].
Figure 1.
PRIME Service Node (SN) state machine [
28].
Figure 2.
Example of PLC PRIME topology.
Figure 2.
Example of PLC PRIME topology.
3. Low Voltage (LV) Grid Implications of Smart Metering PLC Networks
The methodology proposed in this paper focuses on system level and electricity related parameters. This analysis of the PLC system avoids using most of the low level details of the electricity grid (type of cables, specific noises, etc.) that by far exceed the existing available information of the grid.
Operational problems in smart metering networks are related to the electrical grid, the PLC network, the metering application and/or the electronics of the devices. Examples of non-performing devices are PRIME nodes (meters) not communicating in the SS (individually, complete feeders, group of feeders, full LV panel, full medium voltage/low voltage transformer, etc.). The causes of a communication failure can be very different in nature depending upon the specific case, and to make things worse, they will be in most cases not easily detectable by traditional operation and maintenance operations.
The monitoring stage will provide information about two main concepts, i.e., availability, and stability, both at subnetwork, and subnetwork element levels. The analysis stage will be based on the correlation of those concepts with the features of the electricity grid where they occur.
There are two general concepts that describe the performance of a PRIME subnetwork. First concept is “availability”, defined as the accumulated time (relative to total time) when a device is accessible in the subnetwork. When referred to the subnetwork, availability is related to the statistical values of the subnetwork elements as a group. The second concept is “stability”, defined as the capability of a subnetwork element to remain in a non-disconnected state. When referred to the subnetwork, it is related to the ability to maintain a stable number of registered elements. The metrics that represent the performance of the subnetwork and each one of its elements from the communications and applications perspectives will be the materialization of these concepts in different measurable parameters.
4. Proposed Methodology for PLC Network Monitoring and Analysis
The proposed methodology to overcome problems described in previous sections will provide data to assess the performance of each PRIME subnetwork. The methodology is divided in two parts.
The first part (monitoring stage) collects data and elaborates results to obtain parameters that provide information on network performance, both from the communications (PLC) and applications level (metering) perspective. The second part (analysis stage), analyzes parameters (PLC and metering; parameters included in the
Appendix) and studies their relation to electricity grid data. The analysis will be richer and only complete the results are correlated with the LV grid physical characteristics. Although a precise knowledge of LV physical data is not usually possible in LV electricity grids, a minimum set of data (see
Section 4.2) is required to interpret the results.
4.1. Monitoring Stage
The methodology, on the monitoring stage, is based on stressing the communication network on purpose, driving the communication capacity to its limits by means of a continuous polling of meter data from the concentrator. As PLC is the technology being analyzed, the monitoring period is one week minimum. This duration is a compromise to account for the fact that e.g., noise in the LV grid is very dependent upon network load, which depends strongly on date, time and specific circumstances [
34]. After this period, the PRIME subnetwork will be operated under regular conditions.
The monitoring stage controls two aspects of the system behavior. First, it monitors the behavior of the PLC technology itself. The behavior of the PLC technology provides information about how the network topology evolves over time. Aspects such as SN’s dependencies, SN behavior (switch, terminal, or any other non-functional state), and all timing elements related to those nodes, are needed. PRIME BN must be able to register any single change in the subnetwork in real time (SN disconnecting, terminal promotion to switch state, etc.).
Second, as metering is the application layer we also need to monitor, a constant flow of application data is established to analyze the behavior of the complete system. The concentrator is programmed with cycles querying every element connected to it in non-stopping loops. The results obtained and recorded from this application data stress of the network will depend on the number of nodes in the network, the complexity of the network, the number of transactions and the size of the meter readings in each read attempt.
The information required to monitor the PLC subnetworks behavior can be found in concentrators, both in the metering and communications sections (the BN). These elements must have the possibility to log application information related to network status, both from the application data side and from the PLC control information side.
Table 1 summarizes the elements that need to be recorded for PLC topology network behavior analysis, as well as the application level. PLC networks, due to the unstable nature of electricity line conditions, constantly change their topology configuration. These continuous changes have the objective to make the BN capable of accessing the meters involved in their subnetwork. These changes, and the associated information, have to be registered in real time, together with the metering application data being collected from the system polls, during the whole week period.
Table 1.
Application layer required parameters for performance monitoring.
Table 1.
Application layer required parameters for performance monitoring.
| Layer (s) | Parameter | Explanation |
|---|
| PLC comms. | MAC address | Meter identity at communications level |
| PLC comms. | Parent MAC address | Identity of a meter providing a connection to the service node (SN) to access the base node (BN), at communications level |
| PLC comms. | Time Stamp | Time when the change takes place |
| PLC comms. | State Identification | Specific state (see Figure 2) the service node (SN) is changing to |
| Application | Meter number | Meter identity at metering level |
| Application | Time Stamp | Time stamp when the operation begins |
| Application | Time Stamp | Time stamp when the operation ends |
| Application | Result | Identification of a successful/unsuccessful the operation, together with indication of the cause |
Meter number and MAC address parameters in
Table 1 must be matched one another to associate both groups of parameters and results. As meters are identified in utilities’ databases, PRIME performance results can be directly associated to the meters and their location (address in a city) in an electricity grid.
4.2. Analysis Stage
Once the results are collected, the behavior of each individual meter (application level) and SN (PRIME communication level) can be identified by data processing. The correlation of the results with the electricity network physical features can help to further understand factors affecting the results, and the locations where problems might be present.
Table 2 provides the list of meter related data in the grid, useful to understand the performance of PLC solutions.
As an example, based on the referred table, we can analyze if the monitored behavior is common to one meter concentration, to one of the phases, to the whole electricity line, or to the complete LV panel or transformer at the SS. Aspects such as location and distance, single or three phase meters if three phase injection is used, etc., will explain different behaviors and help identifying database errors.
Table 2.
Meter and electricity grid related data for PLC analysis.
Table 2.
Meter and electricity grid related data for PLC analysis.
| Family | Meter and Grid connection data |
| SS | Transformer, where meter connects to |
| SS | LV Panel, where meter connects to |
| SS | Electricity Line, where meter connects to |
| Meter | Connection Phase, where meter is placed |
| Meter | Single meter or Concentration of meters |
| Meter | Single or Three Phase meter |
| Location | Location (Address), of the meter |
| Location | Distance to the Secondary Substation (SS), from meter location |
| Location | Coordinates |
Section 5 includes the concepts and the elaboration of the parameters of the analysis stage.
5. Analysis of the Performance for Smart Metering PLC Networks
The minimum set of concepts to consider in the development of relevant parameters in a smart metering PLC deployment analysis is included in
Table 3. They combine the perspective from global network performance with that of individual elements, and they also correlate meter and SN behavior.
The concepts in
Table 3 can be expressed with different numeric parameters and/or graphs that can confer the derived parameter an improved capacity to be interpreted.
A description of the concepts follows in the next subsections, with derived parameters being detailed in the
Appendix. Each of these parameters provides specific information on aspects which have to be controlled in smart metering systems.
Table 3.
Concepts needed for Smart Metering PLC networks analysis.
Table 3.
Concepts needed for Smart Metering PLC networks analysis.
| Topic | Concept | Layer1 |
|---|
| A. Subnetwork evolution | (1) Topology stability | C |
| (2) Application data evolution | A |
| B. Individual PRIME nodes | (1) Total accumulated duration of states | C |
| (2) Total number of disconnections at PRIME level | C |
| C. Subnetwork Availability | (1) PRIME availability | C |
| (2) Meter availability | A |
| (3) Compared availability | C/A |
| (4) Subnetwork availability (PRIME node and meter level) | C/A |
| D. Subnetwork Topology | (1) Most common stable states, with dependencies up to the Base Node (BN) | C |
| (2) Instant dependencies topology | C |
| E. Database information | (1) Connectivity of the Low Voltage (LV) grid | C/A |
| (2) Meter characteristics | A |
5.1. Subnetwork Evolution
This group of parameters provides information on the network vision both the concentrator and the BN (application and communications, respectively) have when controlling a subnetwork.
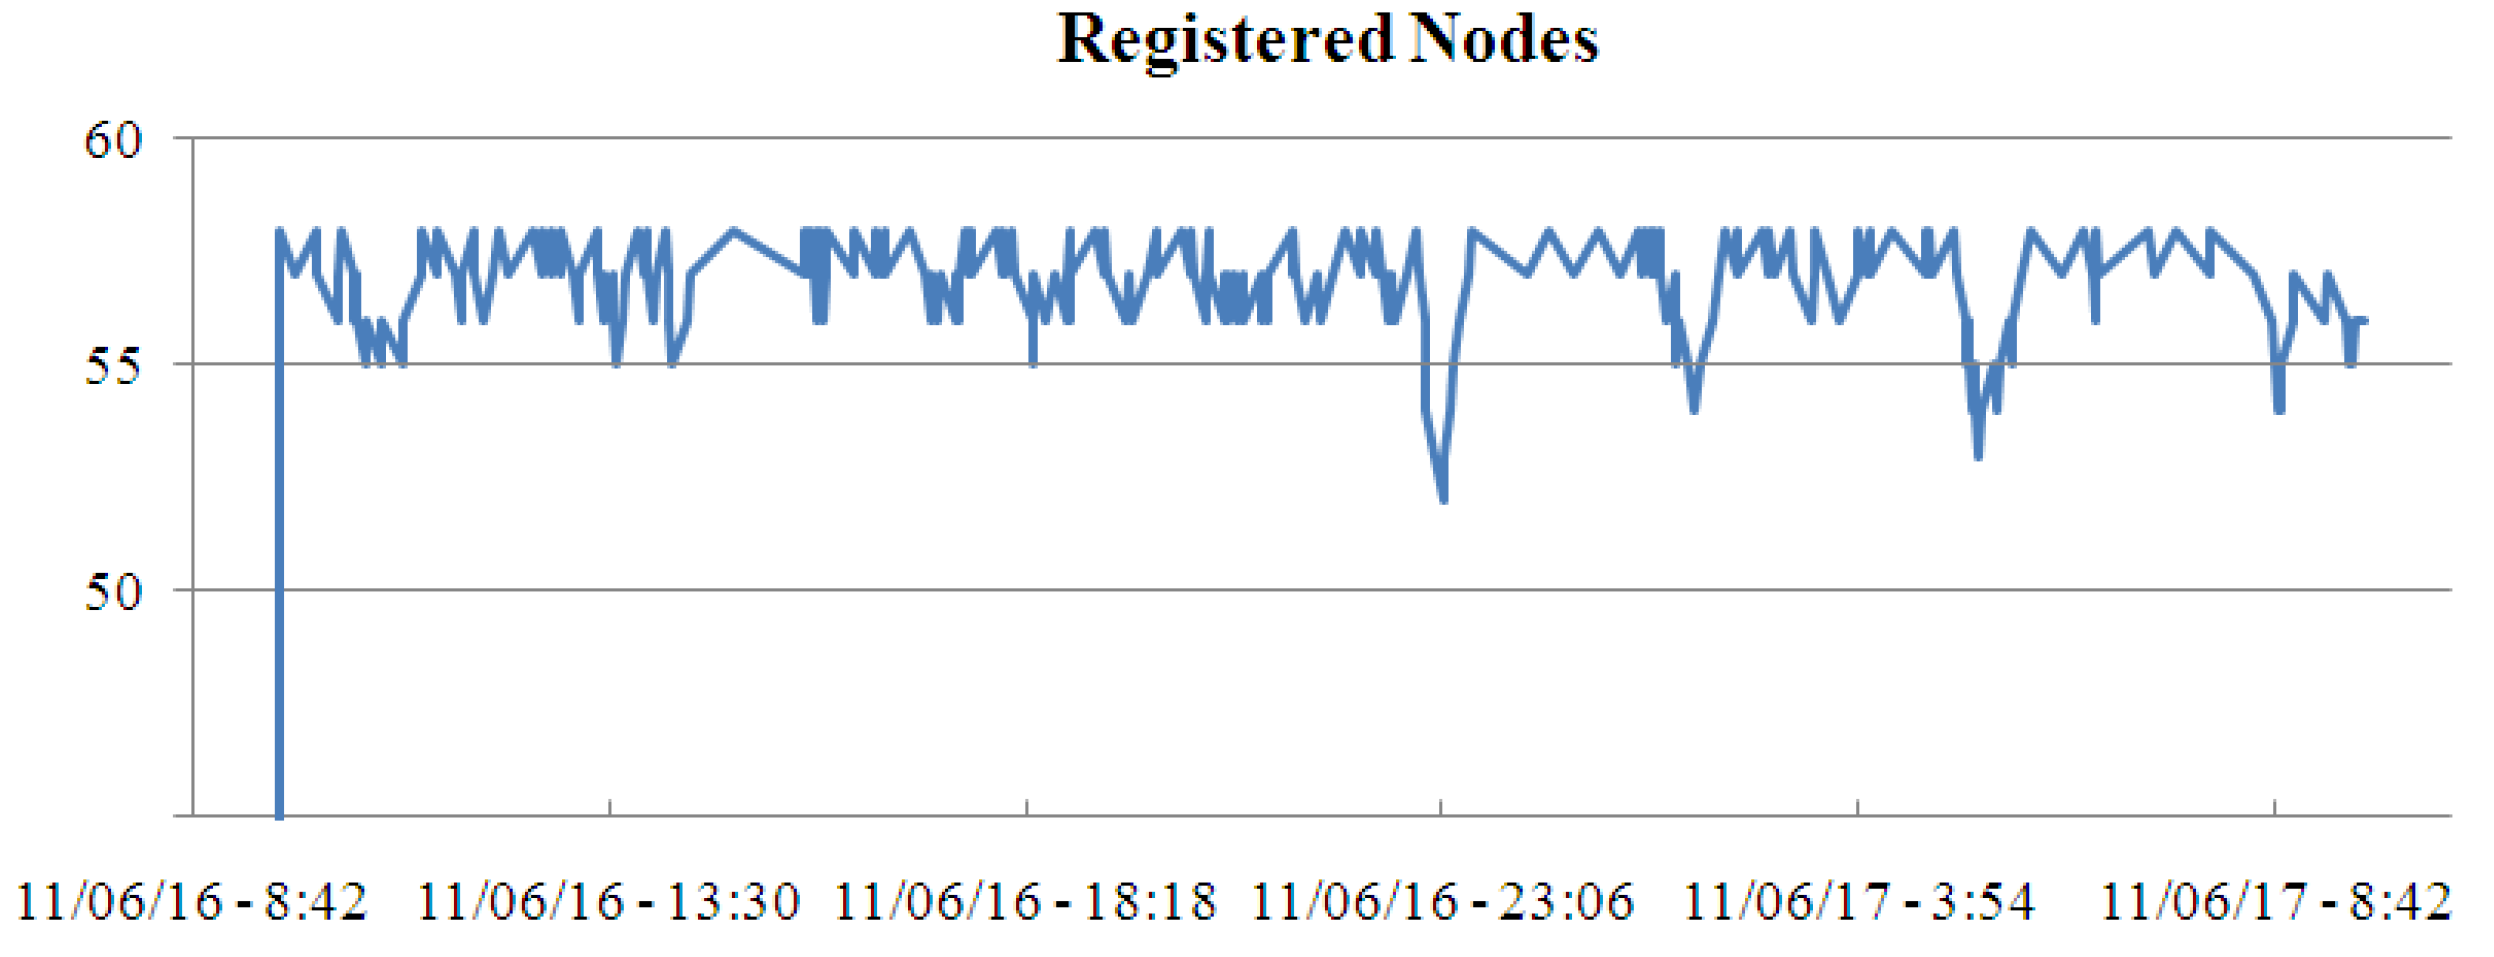
5.1.1. Topology Stability
The stability of the subnetwork topology is based on the number of elements registered in a certain concentrator in the SS (see
Figure 3). This parameter is related to the PRIME subnetwork maintenance. It does not consider application data.
5.1.2. Application Data Evolution
Smart metering systems usually present a master–slave structure, with one or several polling cycles. When a continuous polling is established, the number of registered nodes when each cycle gets started determines the number of cycles (read attempts) and the duration of each cycle.
Figure 3.
Sample evolution of registered PRIME nodes in a real field test subnetwork with 58 SN’s for 2 days.
Figure 3.
Sample evolution of registered PRIME nodes in a real field test subnetwork with 58 SN’s for 2 days.
5.2. Individual PRIME Nodes
This group is composed of parameters whose meaning is related to the behavior of the meter as a SN, a communications device.
5.2.1. Total Accumulated Duration of States
These parameters rely on the accumulated time of each of the relevant states of the network: terminal, switch and any other non-functional state. These parameters are pertinent in PRIME analysis.
5.2.2. Total Number of Disconnections at PRIME Level
This parameter describes the accumulated number of transitions from registered state to non-registered (disconnected) states.
5.3. Subnetwork Availability
This group of parameters provides information on the feasibility of access to any SN (PRIME communications) or meter (applications perspective) in the subnetwork.
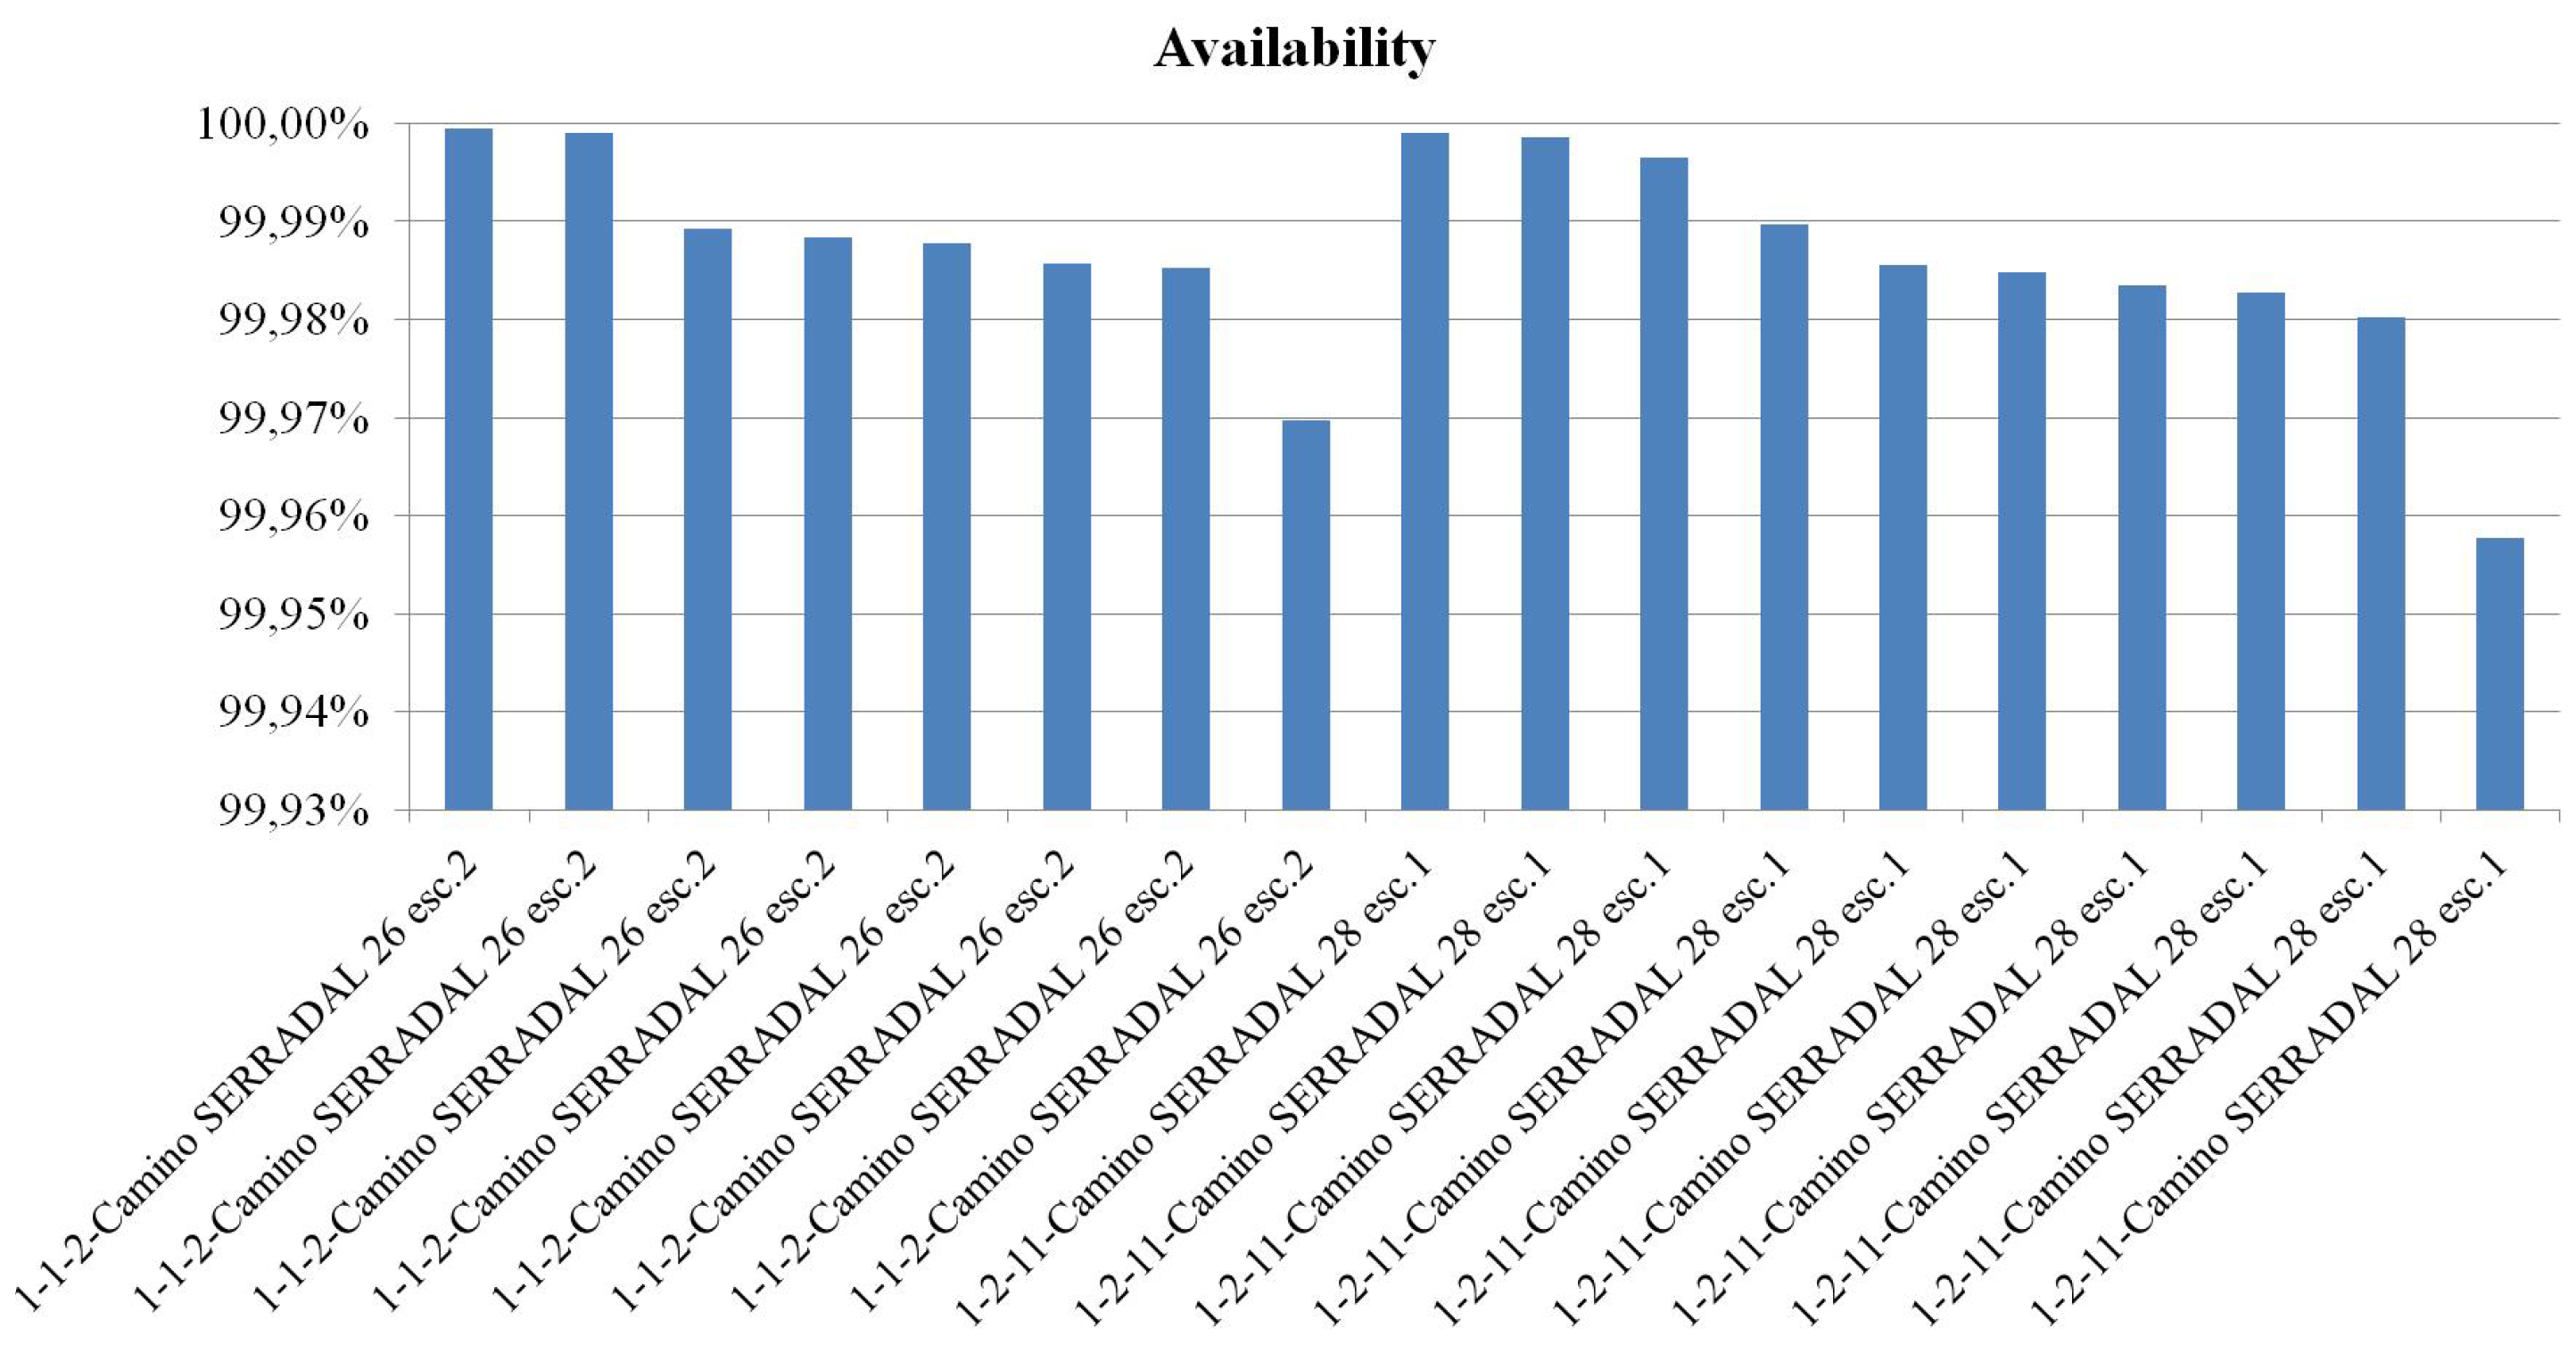
5.3.1. PRIME Availability
Considering the PRIME state machine, availability is measured in terms of the relative amount of time in which a node is in an available state (terminal, switch) compared to total evaluation/observation time (see
Figure 4).
5.3.2. Meter Availability
Considering the result from cycle tests, meter availability is the relative number of successful read attempts. Non successful attempts are those that have failed, or have not even been initiated due to unregistered states.
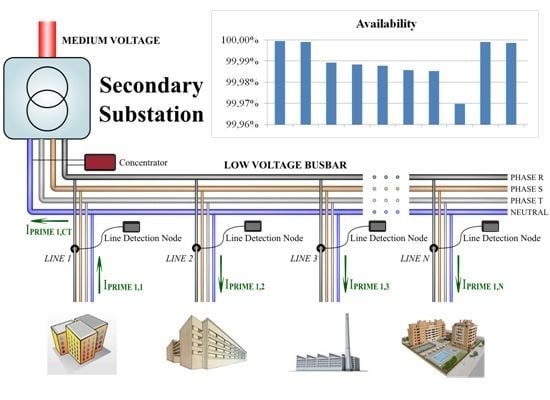
Figure 4.
Sample availability concept in PRIME in a real field test subnetwork. Each bar represents one SN in the location described by the caption.
Figure 4.
Sample availability concept in PRIME in a real field test subnetwork. Each bar represents one SN in the location described by the caption.
5.3.3. Compared Availability
This parameter is composed of the compared availabilities of PRIME nodes (communications level) and associated meters.
5.3.4. PRIME Node and Meter level Subnetwork Availability
Total average availability figures considering all elements in the subnetwork/concentrator influence area.
5.4. Subnetwork Topology
These parameters will describe the PRIME network configuration and evolution in relation to its purpose of providing a communications network for smart metering.
5.4.1. Most Common Stable States
There will be an assessment of two values for each PRIME SN: first, the maximum individual time in a state, and second, the maximum individual time adding total time even if the same state happens at different points of the monitoring period, and considering the topology dependencies as far as the BN as part of the state. Thus, if a SN is monitored for a period of 24 hours as terminal depending directly on the BN for the first 16 hours, switch for the next 4 hours and terminal again for the last 4 hours, the first value would be 16 hours as terminal, and the second would reflect 20 (16 + 4) hours as terminal.
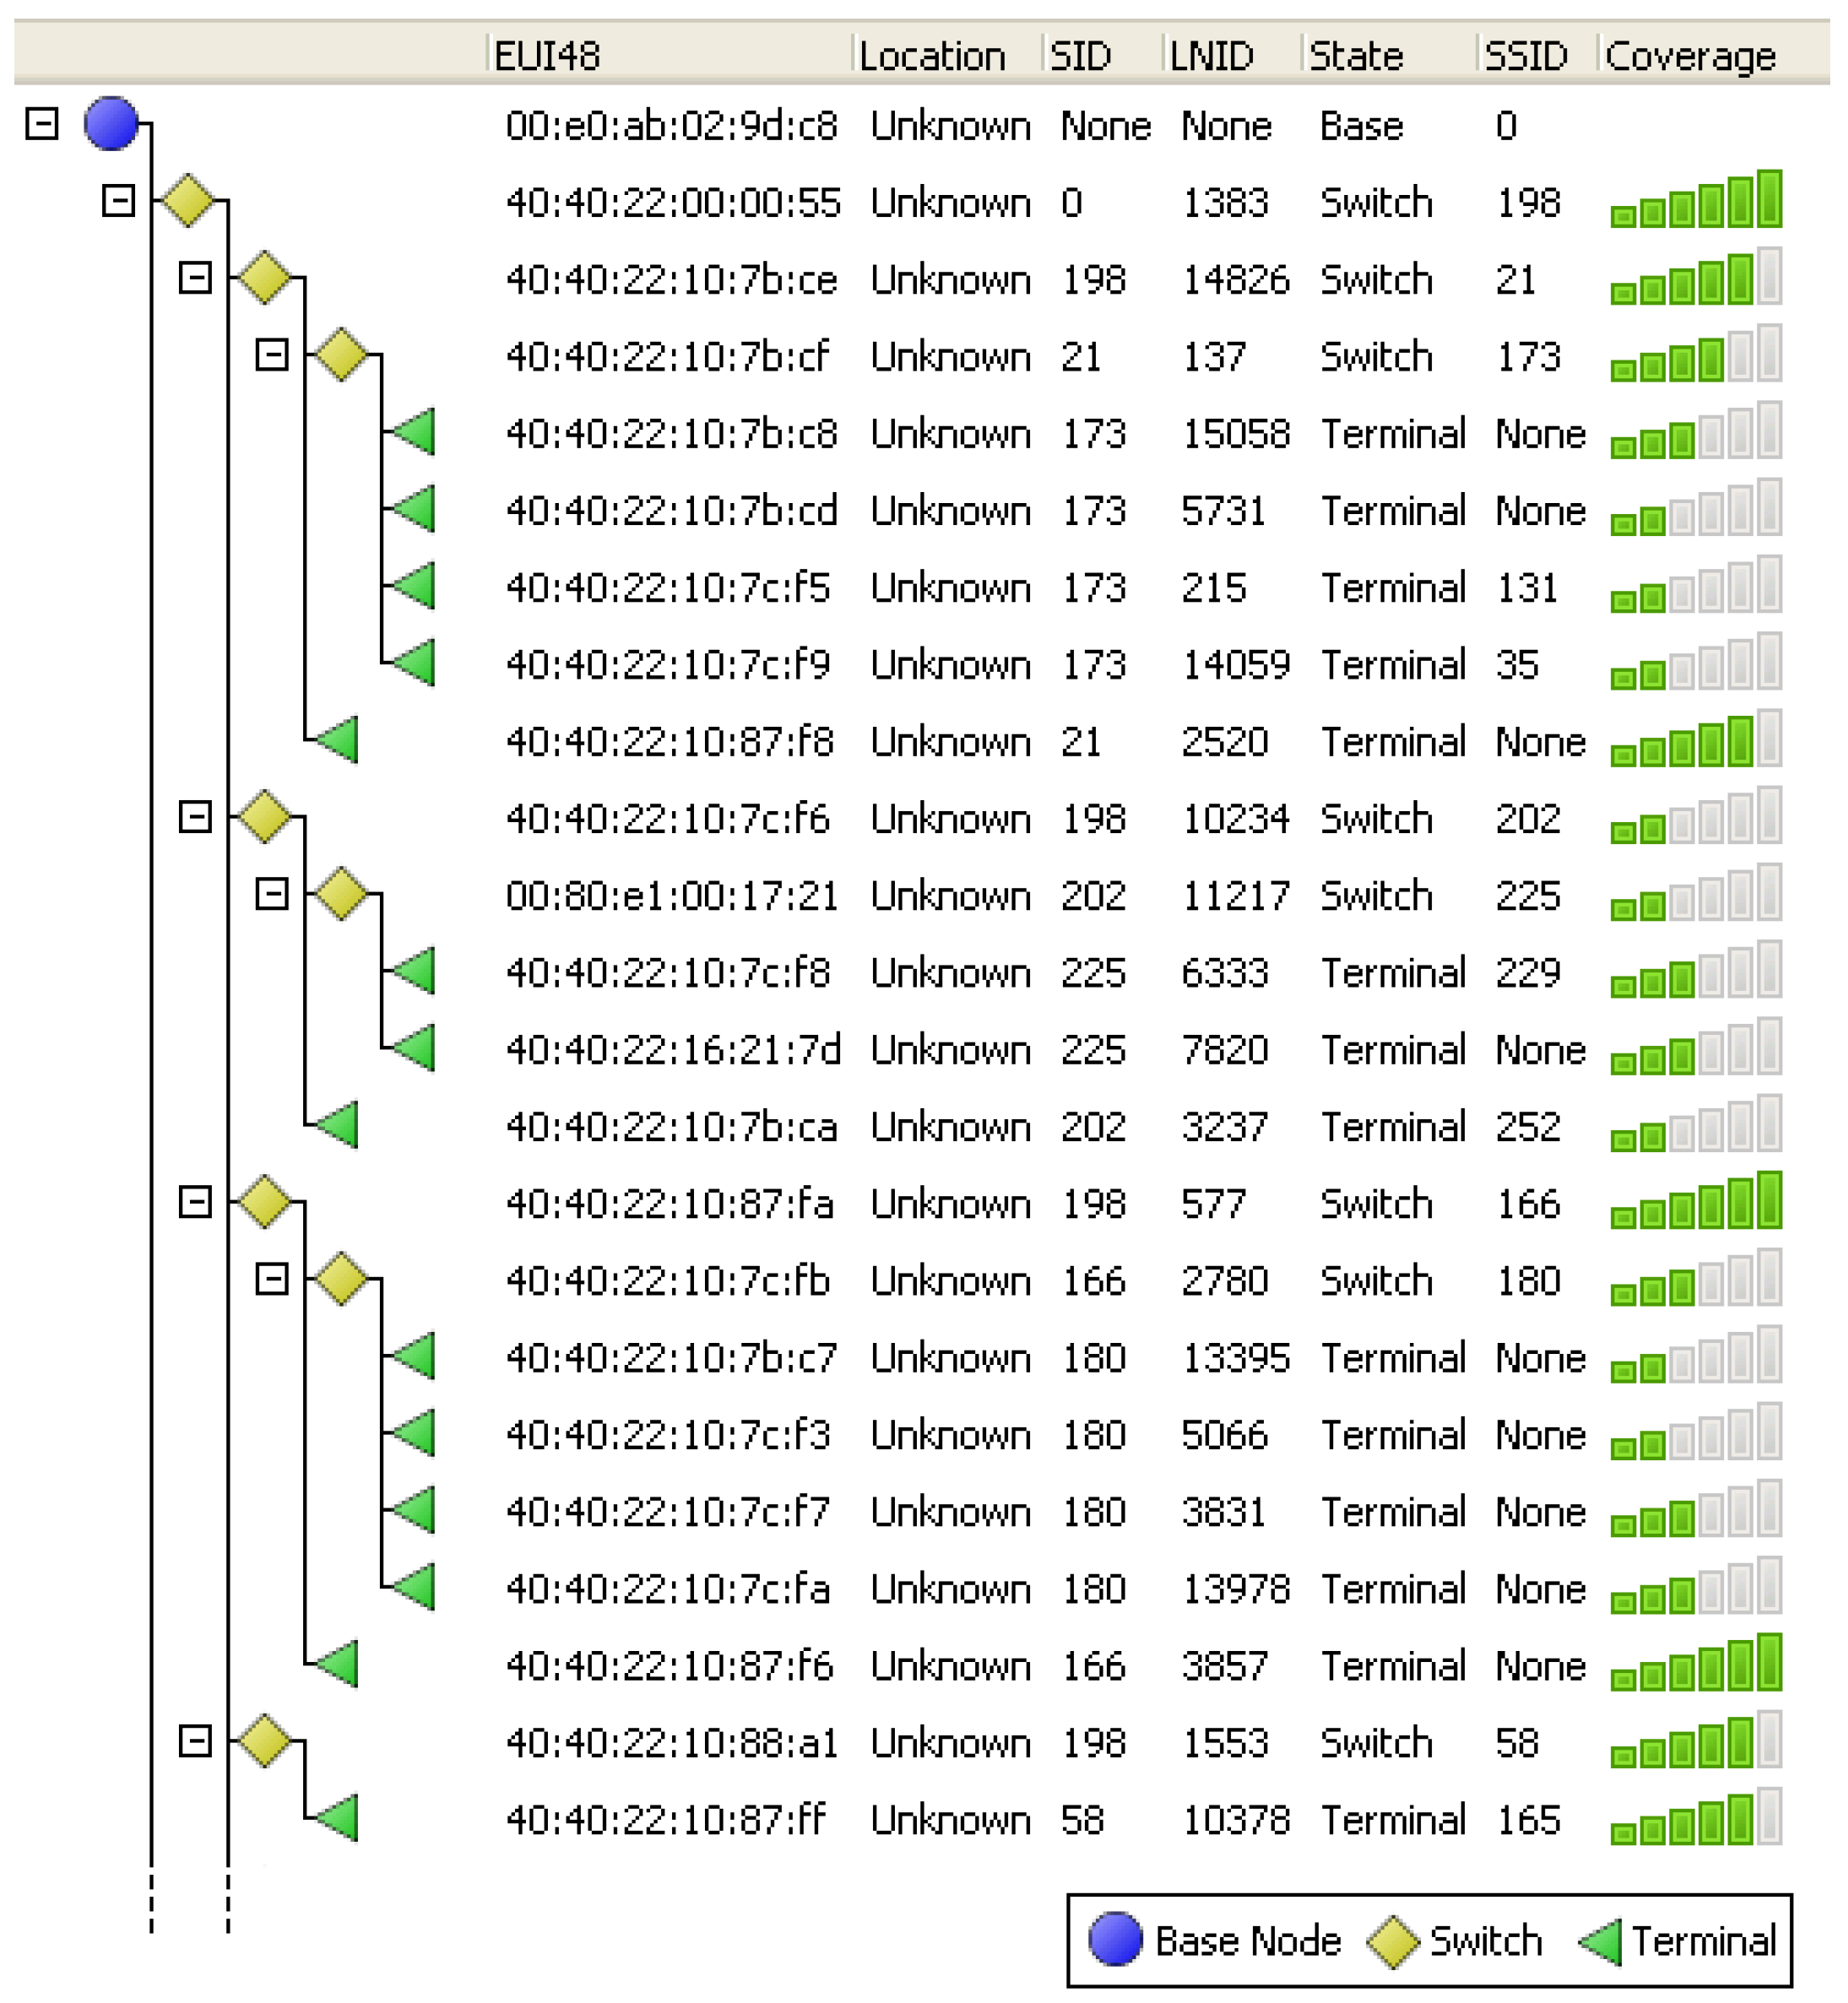
5.4.2. Instant Dependencies Topology
This parameter represents the PRIME instantaneous subnetwork “tree”.
6. Operational Data Real Time Acquisition through Grid Conditioning in a PLC Based Smart Metering System
LV grid operation requires a precise knowledge of the electricity grid, at least similar in detail as the one existing in other sections such as medium or high voltage grid parts. The LV databases available to utilities have a heterogeneous reliability. Some have a complete absence of data and others contain data that is not accurate enough. Today, although many utilities claim to have information about the exact association of a meter (point of supply) and a SS, this information is not 100% accurate. In general, if further granularity is required, the LV line and the phase to which every meter is connected are even more difficult to register and update.
In the previous section we have shown all data related to the PLC smart metering system performance available from a monitoring process. This monitoring process, as defined in previous sections, is a one-time effort, oriented to understand how the network behaves. However, these parameters could be also part of the real time information provided by PLC based smart metering Systems. Thus, real time information could also be provided in LV grid.
Moreover, if the PLC system used is PRIME, the smart metering system could take advantage of the feature described in section 2 as signal repetition with the help of switches.
This feature was also studied in [
35], where SS multi-transformer environments needed the assistance of the so called auxiliary nodes for proper signal propagation in all LV busbars. This configuration is needed because meters are better reached by PLC elements that are electrically close to them and have a good communications channel towards the concentrator. In such cases, the auxiliary nodes basically behave as switches that provide access to the meters in their LV busbar, which have subsequently been identified as electrically dependant on that specific busbar.
This concept can be extended to with a deeper granularity. Instead of having one auxiliary node per LV busbar, it would be possible to install one auxiliary node per LV line, thus rendering the benefit of identifying which meter belongs to which LV line. For this purpose, the mechanism in a PRIME system to assign a meter to an auxiliary node is based on internal PRIME stability statistics. As an extension of this approach, if the PRIME system counts also on real received PLC power level information (both voltage and current information are required by auxiliary nodes), the voting decision taken at PRIME internal level would render the real LV line connectivity of the meters in the SS.
PRIME PLC technology can be applied to both radial and mesh low voltage distribution grids. From the communications perspective, PRIME topology will always be radial, and SN’s will be connected to the BN with a better PLC signal. Thus LV line connectivity of PRIME meters can be obtained in both grid types.
6.1. Line Detection
In order to implement a line detection algorithm for a LV PRIME network, it is necessary to introduce additional calculations in the subnetwork’s BN. Every SN (meter) in the subnetwork is assigned a probability of belonging to each of the LV lines. The probability is set according to an algorithm mainly based on the PLC signal power (measured in the keep alive messages sent by SN’s) received by each auxiliary node connected to each LV line. The connection of a LV line to the SN, is deduced comparing the number of messages received in each auxiliary node from all the SN’s. An example is presented in
Table 4.
Table 4.
Line detection information kept by the base node (BN).
Table 4.
Line detection information kept by the base node (BN).
| | Line_01 | Line_02 | Line_03 | Line_04 | Deduced LV Line |
|---|
| Service Node 1 | 99% | 0% | 0% | 1% | Line_01 |
| Service Node 2 | 90% | 1% | 2% | 7% | Line_01 |
| Service Node 3 | 20% | 75% | 4% | 1% | Line_02 |
| Service Node 4 | 1% | 0% | 98% | 1% | Line_03 |
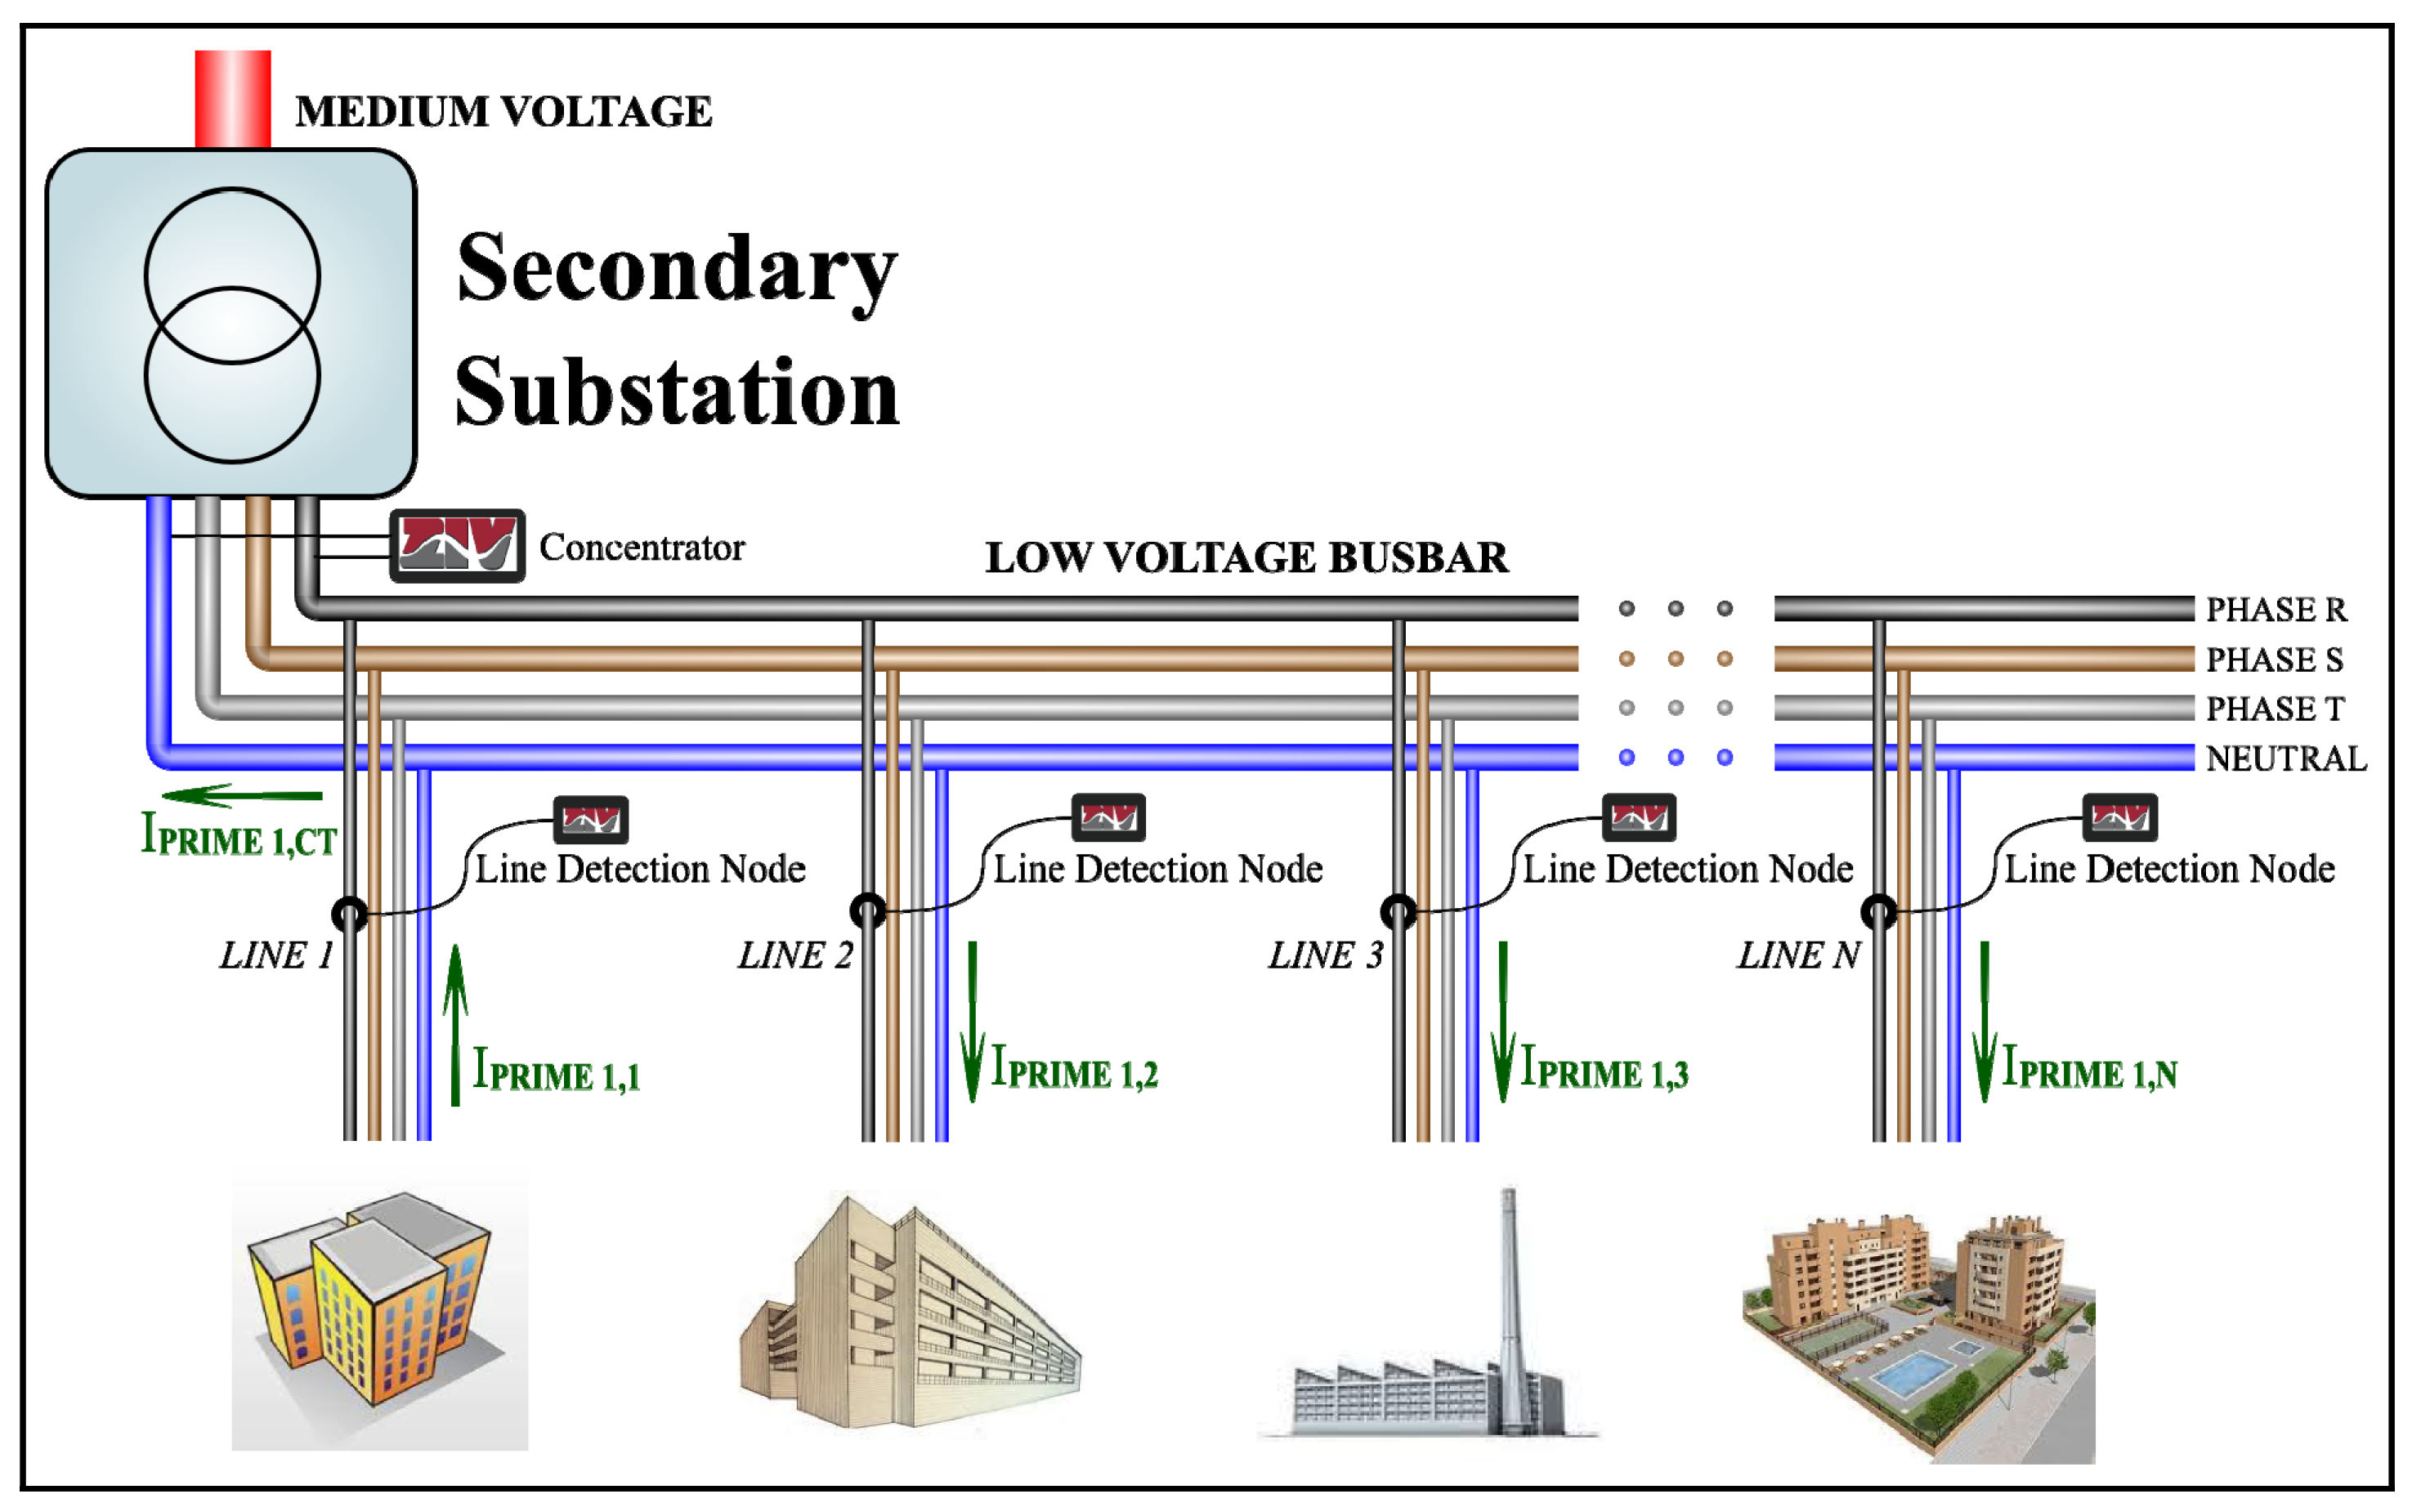
6.1.1. Line Detection Nodes
As stated at the beginning of
Section 6, one auxiliary node per LV line is required in order to implement a PRIME PLC based LV line detection system. For this purpose, a new type of node has to be added to the PRIME network. This new node will be referred as line detection node (LDN). LDN’s are standard PRIME SN’s which are responsible of measuring the PRIME signal power coming from each of the meters at the head-end of each one of the LV lines coming out of the LV busbar. The measurements needed are those of received current, obtained via inductive coupling. These LDN current values are needed because the algorithm is based on the application of Kirchhoff's current law (KCL).
Figure 5 shows how LDN’s are to be installed. Note that all LDN’s must be connected to the same LV line phase of the system, that must be coincident with the phase where the BN couples to, in PRIME single phase injection systems. From
Figure 5, and applying KCL, it can be deduced that, for a LDN connected at the head-end of Line 1:
So, according to KCL, any PRIME SN connected to any LV line will always be detected with higher intensity by the LDN connected to the same line.
Figure 5.
Line detection nodes deployed in a LV network.
Figure 5.
Line detection nodes deployed in a LV network.
6.1.2. Line Detection Algorithm
In order to apply KCL consistently and compare identical signals in all the LDN’s, they will only be listening to a particular type of PRIME traffic, the ALV (keep alive) control packets. This relies on the fact that this type of packets is sent periodically by every node in the PRIME network for link maintenance purposes, and that this frequency is known and set by the BN. LDN’s will keep an internal log where they will store the power of the last ALV received from each node level combination (SID—Switch IDentifier—and LNID—Local Node IDentifier—in PRIME terminology), the reason being that the information coming from SN’s closer in the network (connected in level 0 or level 1) is more trustworthy than the information coming from distant nodes.
Table 5 is an example of the data stored by each LDN.
Table 5.
Power information stored by the line detection nodes.
Table 5.
Power information stored by the line detection nodes.
| SID | LNID | LEVEL | Power Reference | Time Reference |
|---|
| 88 | 478 | 1 | 13,478 | 278,947,563 |
| 88 | 478 | 0 | 234,987 | 279,012,344 |
| 0 | 1449 | 0 | 142,789 | 268,765,376 |
| 0 | 628 | 0 | 83,215 | 245,678,996 |
| ... | ... | ... | ... | ... |
| 126 | 8456 | 2 | 4,623 | 280,200,231 |
| 126 | 8456 | 1 | 34,887 | 280,345,675 |
| 126 | 8456 | 0 | 166,003 | 280,500,024 |
Periodically, the BN (concentrator) will request to each one of the LDNs the latest power information they have on a particular SN (meter) of the subnetwork. The BN will make sure to request this information always after receiving a new ALV packet from the same node, so that it can also check that the information sent by each LDN’s is updated. LDN’s should have listened to this last ALV message, and if one of the LDN’s does not send updated information, that will mean that the latest ALV packet was lost.
Using the information received from the LDN’s, the BN will then update the line detection information algorithm, this is, the likelihood of a node being connected to each of the lines, associated to every node in the network. Although there will always be some random noise and jitter in the measurements made by the LDN’s, given enough iterations of this algorithm, the information will be consistent and the BN will get a precise idea of which LV line any meter is connected to.
6.1.3. Distant Nodes and Line Deduction through PRIME Topology
There is a possibility that a SN far enough from the SS could not be detected directly by any of the LDN’s. This SN may be registered in the PRIME network through a chain of switches and its location can be very far from the BN. This would make line detection through direct power information comparison completely impossible.
Fortunately, the PRIME network topology, which is highly dependent on the electrical topology of the subnetwork, provides enough information through the communications dependency to deduce the LV line a distant node is connected to. Nodes registered through level 2, or higher level switches, belong to the same line as the chain of switches and, as the PRIME network topology fully converges, the probability that a distant node registers through a switch from a different LV line tends to zero (existing PRIME field experience shows that it is not realistic that a SN is far enough not to be detected by any LDN and, at the same time, for that SN to be capable of registering through a switch connected to a different LV line).
6.2. Phase Detection in PRIME
Now that we are able to identify which is the SS and LV line a meter belongs to, there are other additional parameters that can be determined in order to provide additional functionality. We focus our attention on phase of the LV line to which a meter is connected. This information is important for transformer phase consumption balance, in order to minimize the so called technical losses.
PRIME PLC technology can be also used as a synchronization mechanism. PRIME is divided into functional layers. The most important time domain layers are the physical and the MAC layers. The PRIME MAC layer is intrinsically synchronous, and this feature can be easily used to provide synchronization services to upper layers. Additionally, PRIME specification offers a PHY layer primitive (PHY_ZCT [
28]) that allows a meter to communicate to upper layers the instant when the voltage level signal crosses zero in the phase it is connected to. As a result, if every SN (
i.e., meter) in the PRIME network is able to detect the zero crossing of its respective phase, and the zero crossing event can be tagged relative to the timing of the MAC layer superframe structure, then the BN can assign the right phase correspondence to each meter in its subnetwork by issuing a query to each SN, asking for the zero crossing relative to the superframe time, and thus the system is inherently immune to latency, propagation or calculation delays. [
36] offers a detailed analysis on this subject.
7. Conclusions
This paper offers a novel and complete methodology to assess the performance of real time PLC based smart metering systems. This methodology can be used to monitor and analyze the performance of PLC smart metering systems being deployed worldwide, using field collected information and combining it with static grid information in utility databases. The methodology enables the correct deployment of PLC based smart metering networks.
This paper has also presented the proposed grid conditioning that together with the use of PLC based smart metering information will allow to collect accurate information on the LV grid, specifically on the LV feeder and phase connectivity of each smart meter. This information provides a solid ground for improved LV grid planning, fault location and accurate point of supply identification. These functions are based on the information about the connection of each meter (identified by its address) to each LV feeder and phase, thus allowing to accurately and completely map the LV distribution grid topology.

 ,
, 


