Article

Optimal Conditions for Fast Charging and Long Cycling Stability of Silicon Microwire Anodes for Lithium Ion Batteries, and Comparison with the Performance of Other Si Anode Concepts

by
Enrique Quiroga-González
,
Jürgen Carstensen
and
Helmut Föll
*
Institute for Materials Science, Christian-Albrechts-University of Kiel, Kaiserstr. 2, 24143 Kiel, Germany
*
Author to whom correspondence should be addressed.
Energies 2013, 6(10), 5145-5156; https://doi.org/10.3390/en6105145
Submission received: 31 July 2013 / Revised: 3 September 2013 / Accepted: 29 September 2013 / Published: 10 October 2013
(This article belongs to the Special Issue Li-ion Batteries and Energy Storage Devices)

Abstract

:
Cycling tests under various conditions have been performed for lithium ion battery anodes made from free-standing silicon microwires embedded at one end in a copper current collector. Optimum charging/discharging conditions have been found for which the anode shows negligible fading (< 0.001%) over 80 cycles; an outstanding result for this kind of anodes. Several performance parameters of the anode have been compared to the ones of other Si anode concepts, showing that especially the capacity as well as the rates of charge flow per nominal area of anode are the highest for the present anode. With regard to applications, the specific parameters per area are more important than the specific gravimetric parameters like the gravimetric capacity, which is good for comparing the capacity between materials but not enough for comparing between anodes.

Graphical Abstract

1. Introduction

One of the best candidates to substitute graphite as anode material in Li-ion batteries is Si, due to its high nominal gravimetric capacity of 4200 mAh/g; more than ten times the capacity of standard graphite anodes (370 mAh/g). This gravimetric capacity equals the storage of 4.4 atoms of Li per atom of Si in the form of the Li22Si5 alloy [1]. However, the four-fold volume expansion during lithiation of bulk Si invariably leads to its fracture and pulverization. Recently, it has been demonstrated that Si microwires of 1 µm in diameter do not suffer dramatic rupture problems and exhibit very high and stable charging/discharging capacities at relatively high rates, representing a “benchmark” for Si-based anode materials for Li-ion batteries [2]. This result is surprising, considering that the size of the wires is much larger than the 300 nm deemed critical for avoiding cracking [3]. Most of the reports about Si-based anodes deal with wires or particles with sizes below that limit [4,5,6,7,8,9]. The good performance of the microwire anode may be due to its good electrical and mechanical contact, provided by the embedment of the wires into a Cu sheet.
In the present report the best conditions for the lithiation and delithiation of this Si microwire anode are discussed. The performance of the anode using the best cycling conditions is compared to the performance of other existing Si anodes with different anode concepts. For the comparison, standard parameters for real applications are used.

2. Results and Discussion

A typical SEM micrograph of the Si microwire array anodes of this work is shown in Figure 1. The wire array is embedded into an electrodeposited layer of Cu at one side for a length of around 15 µm, which enables an extremely good electrical contact and mechanical stability of the contact. This section of the wires is not lithiated during the charging/discharging of the anode [10]. The wires have a quadratic cross section with a side width of 1 µm and are ~75 µm long; 60 µm thus are active, i.e., can be charged with Li. The total volume of the wires relative to the total volume of the array, i.e., the fill factor (FF), is 1/9, leaving enough space for the expansion of the wires when lithiated, and enough space for the penetration of electrolyte. Given the dimensions and FF of the wires, it can be inferred that the anodes contain 1.35 mg/cm2 of active material. The details about the fabrication of the anodes are given in [11,12].
Figure 1. SEM micrograph of the Si microwire anode. The wires are embedded in a Cu layer on their upper part.
Energies 06 05145 g001

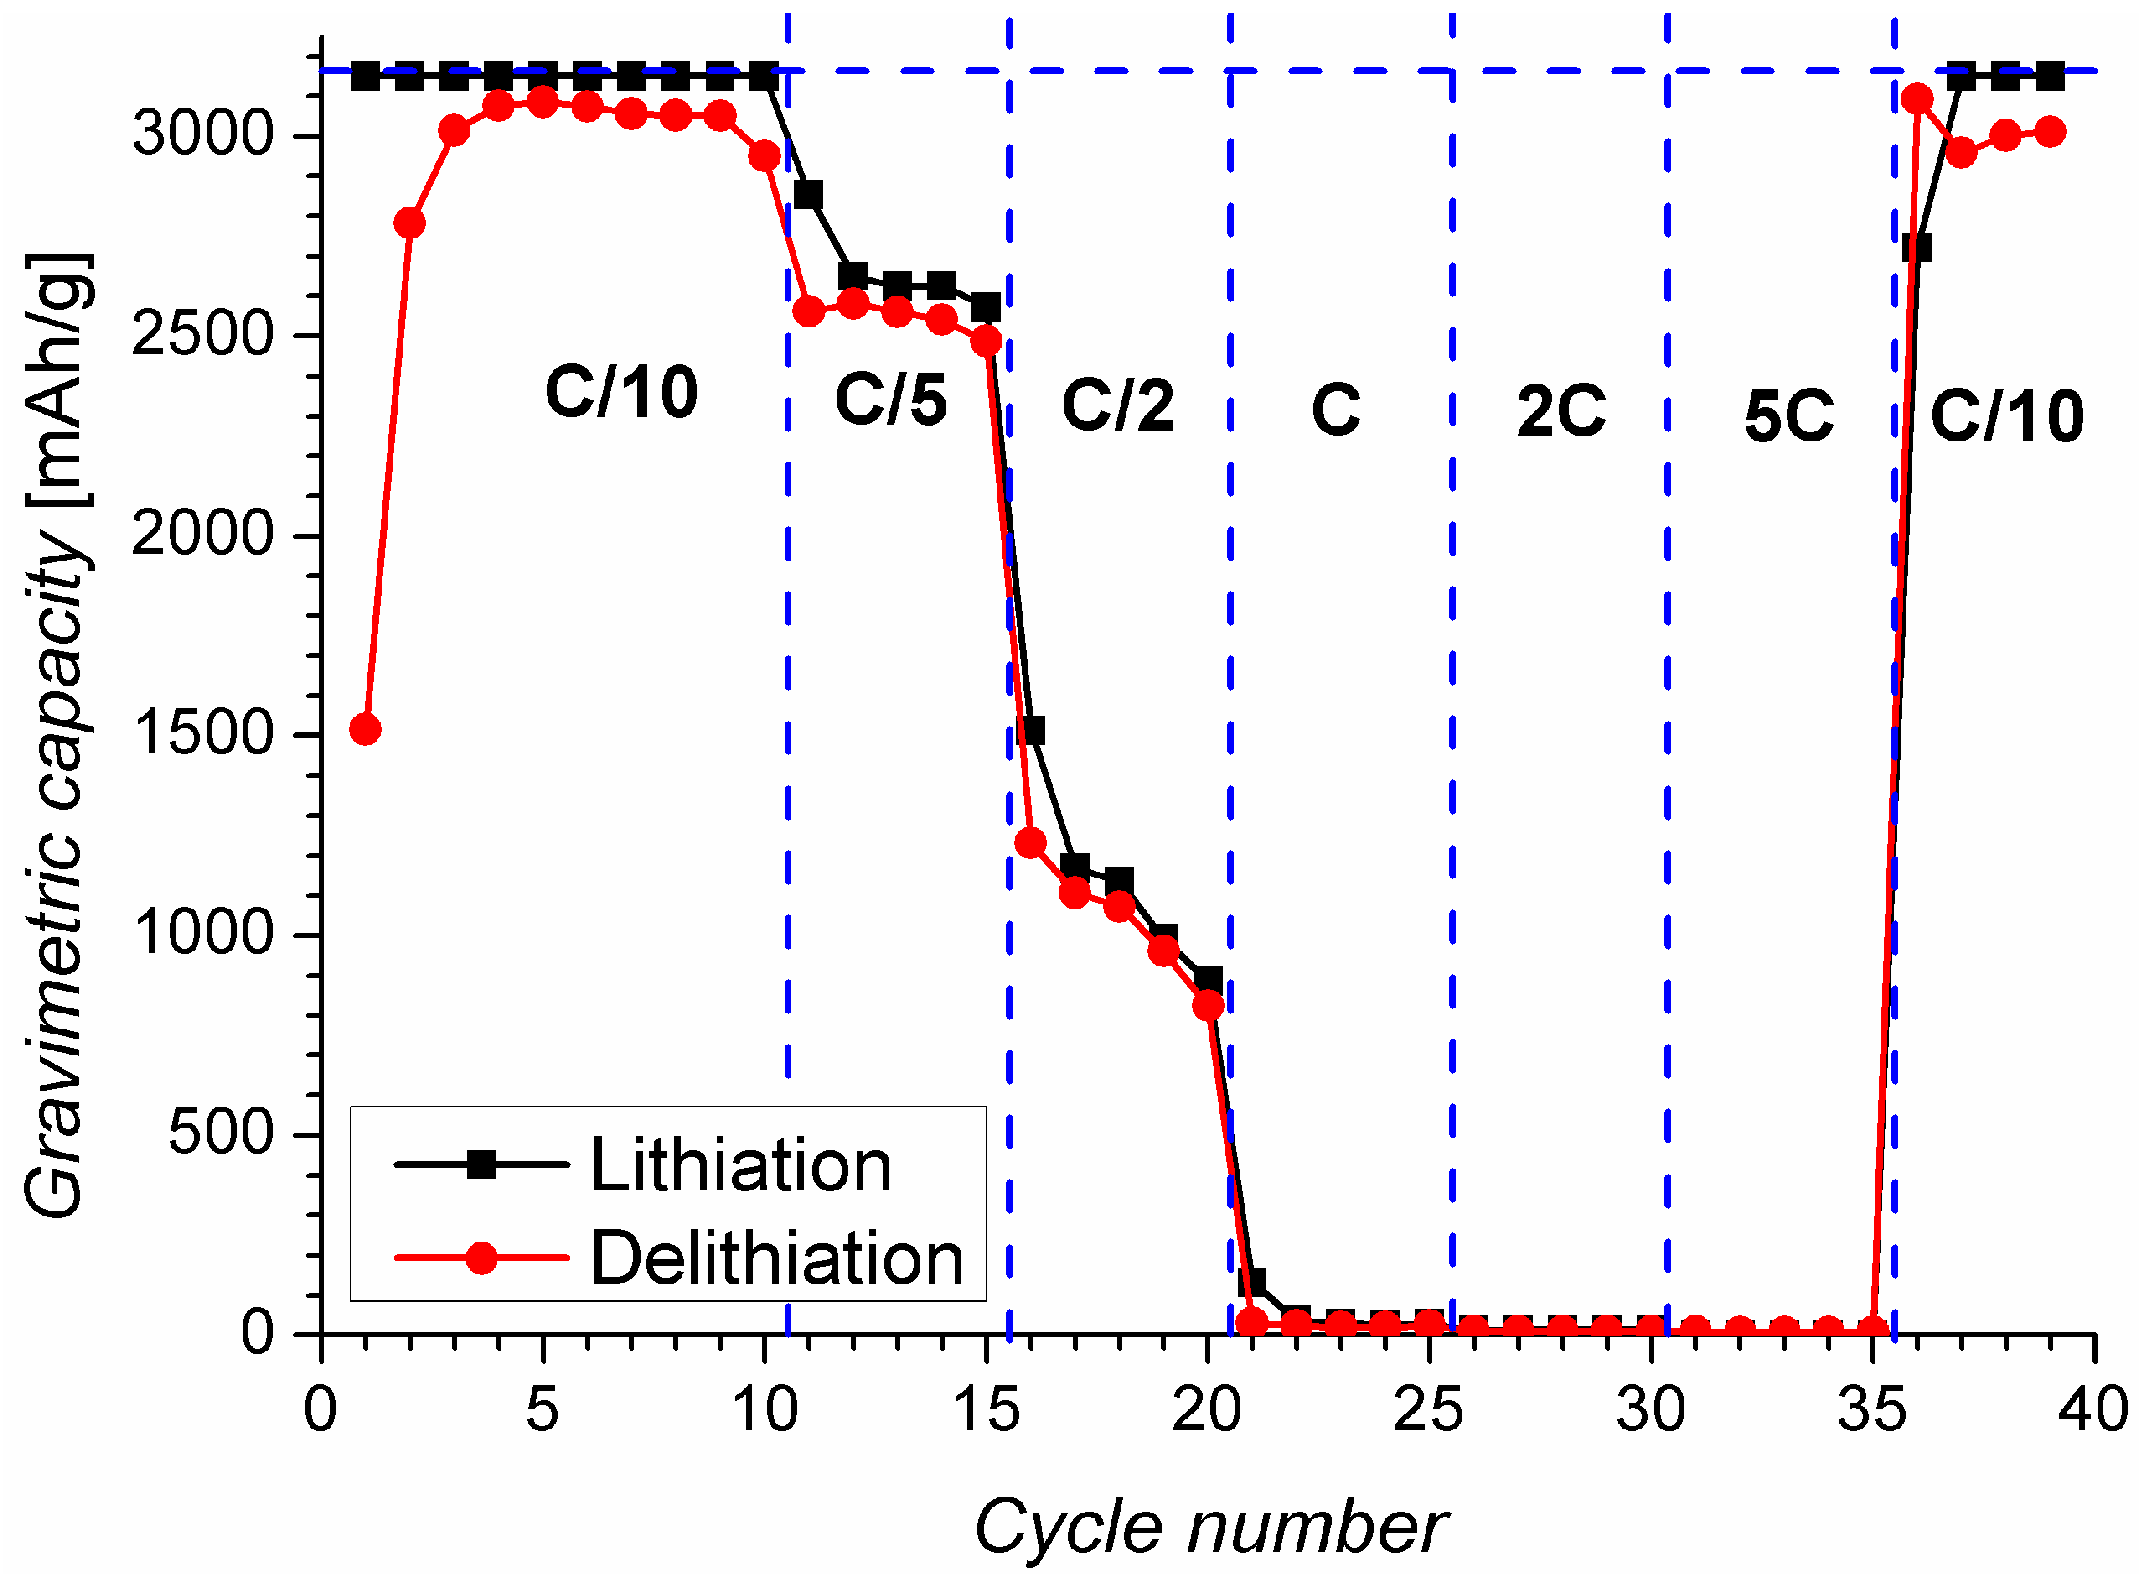
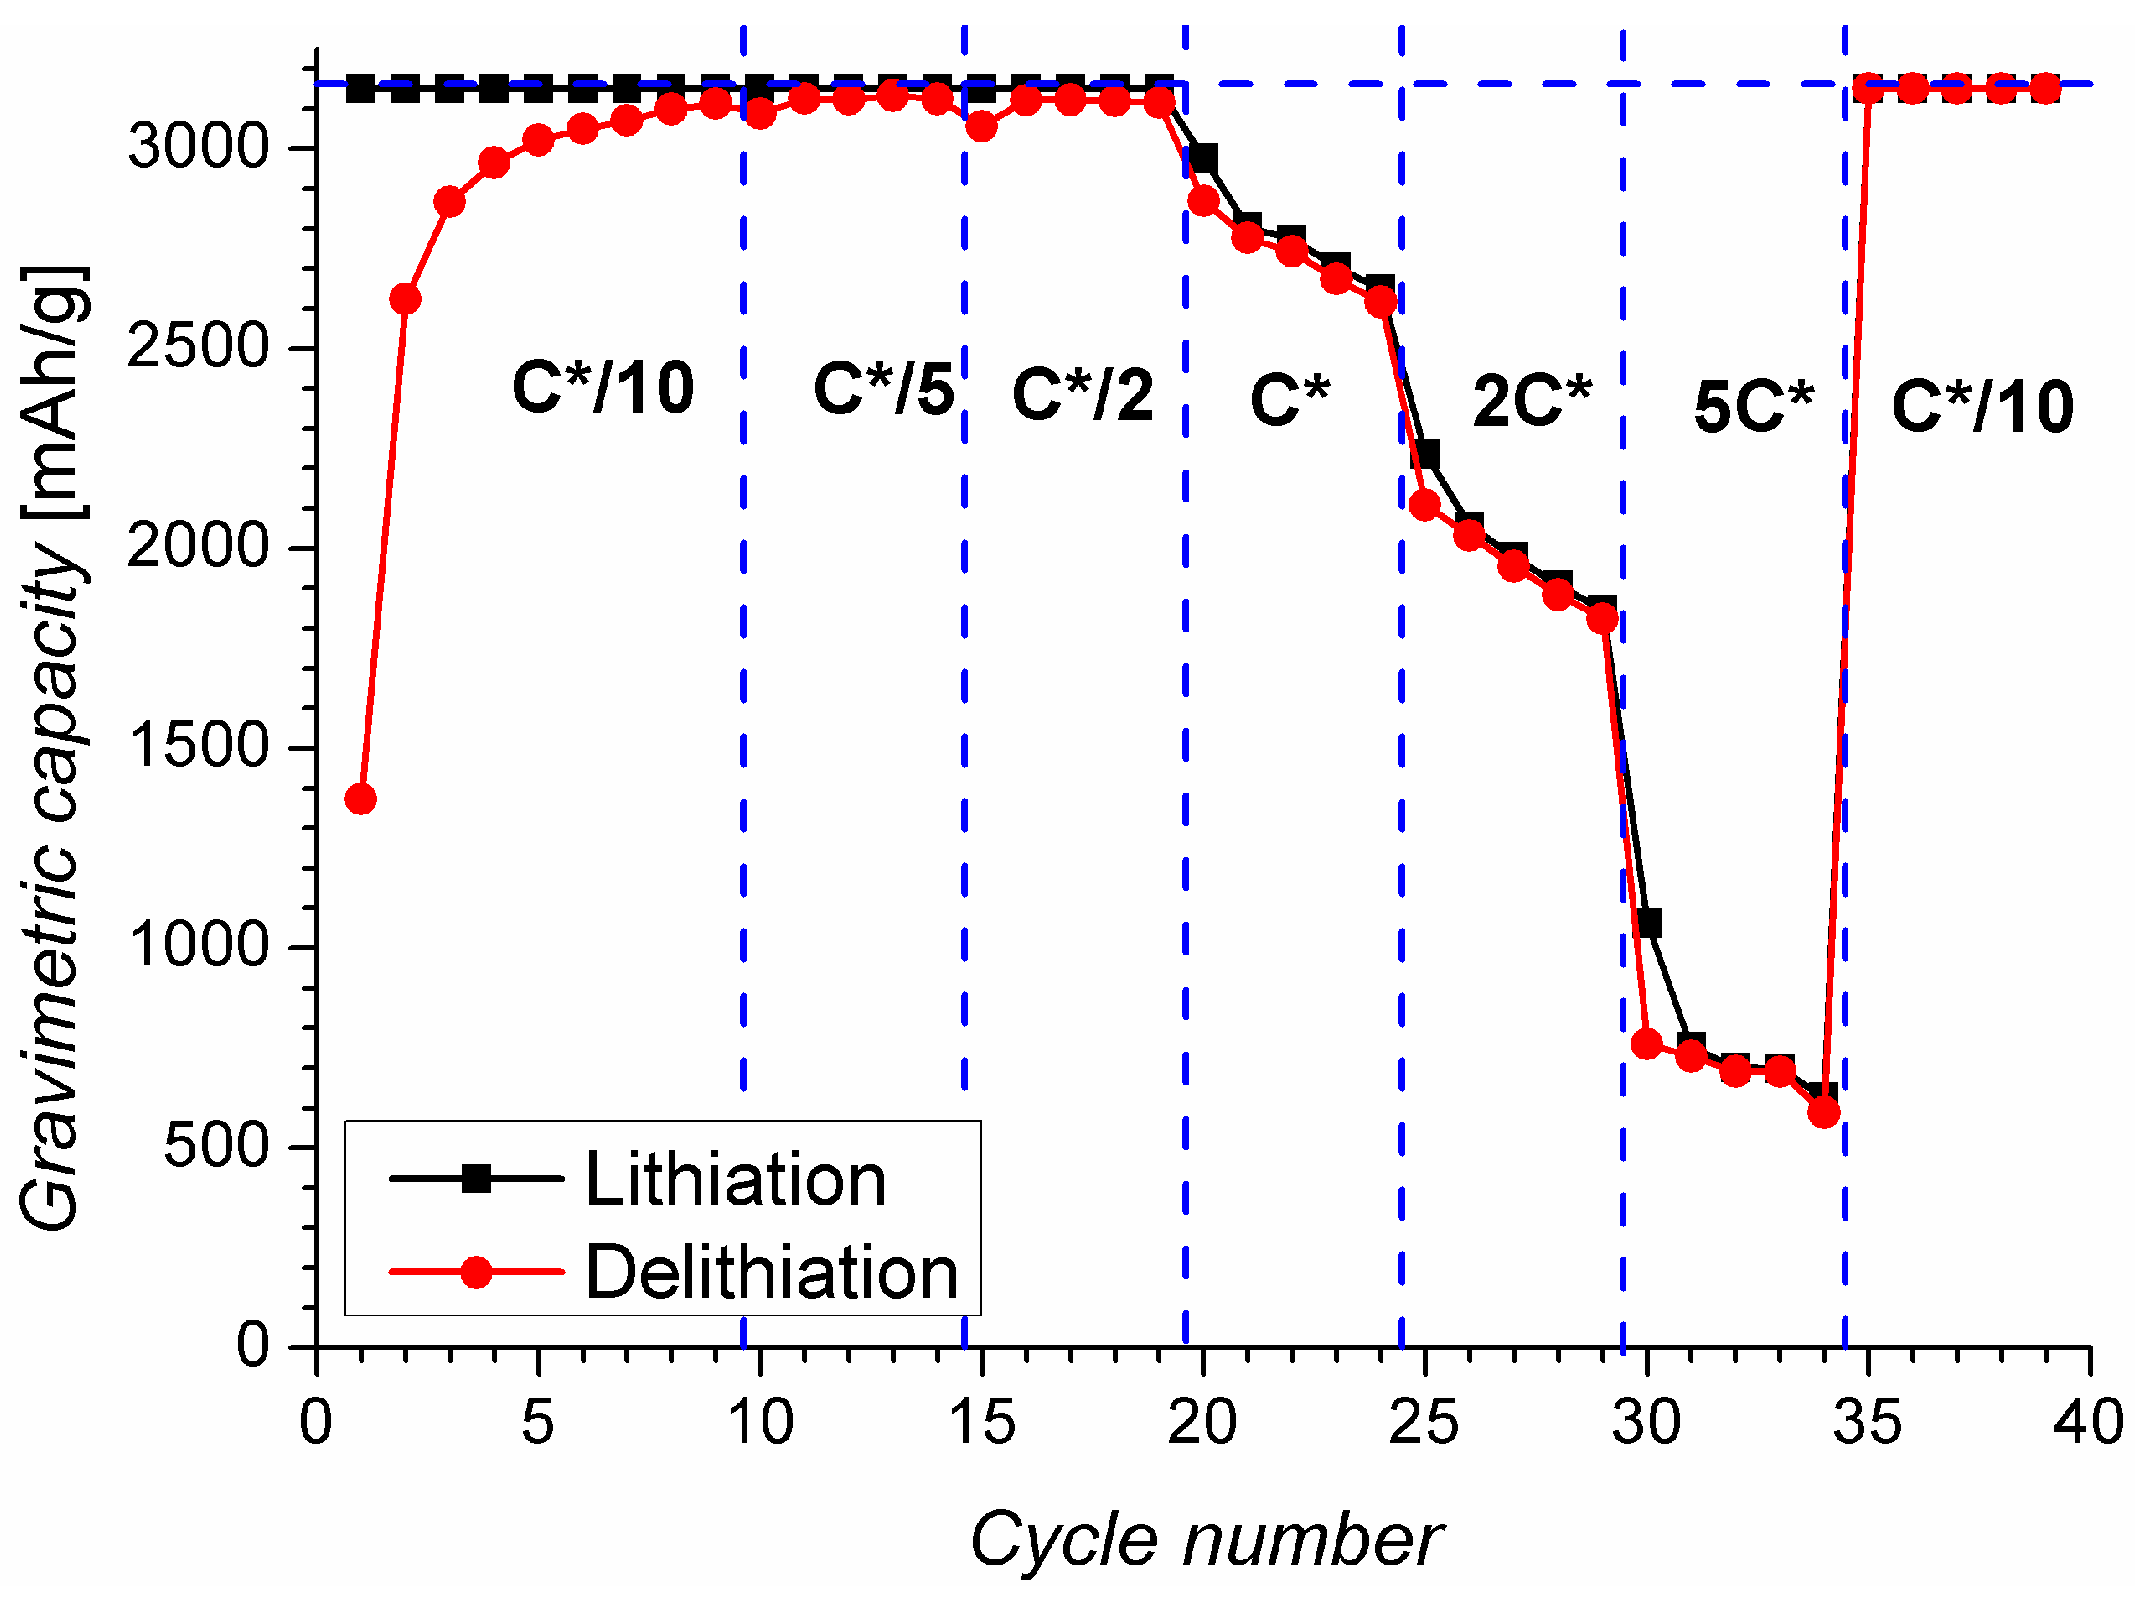
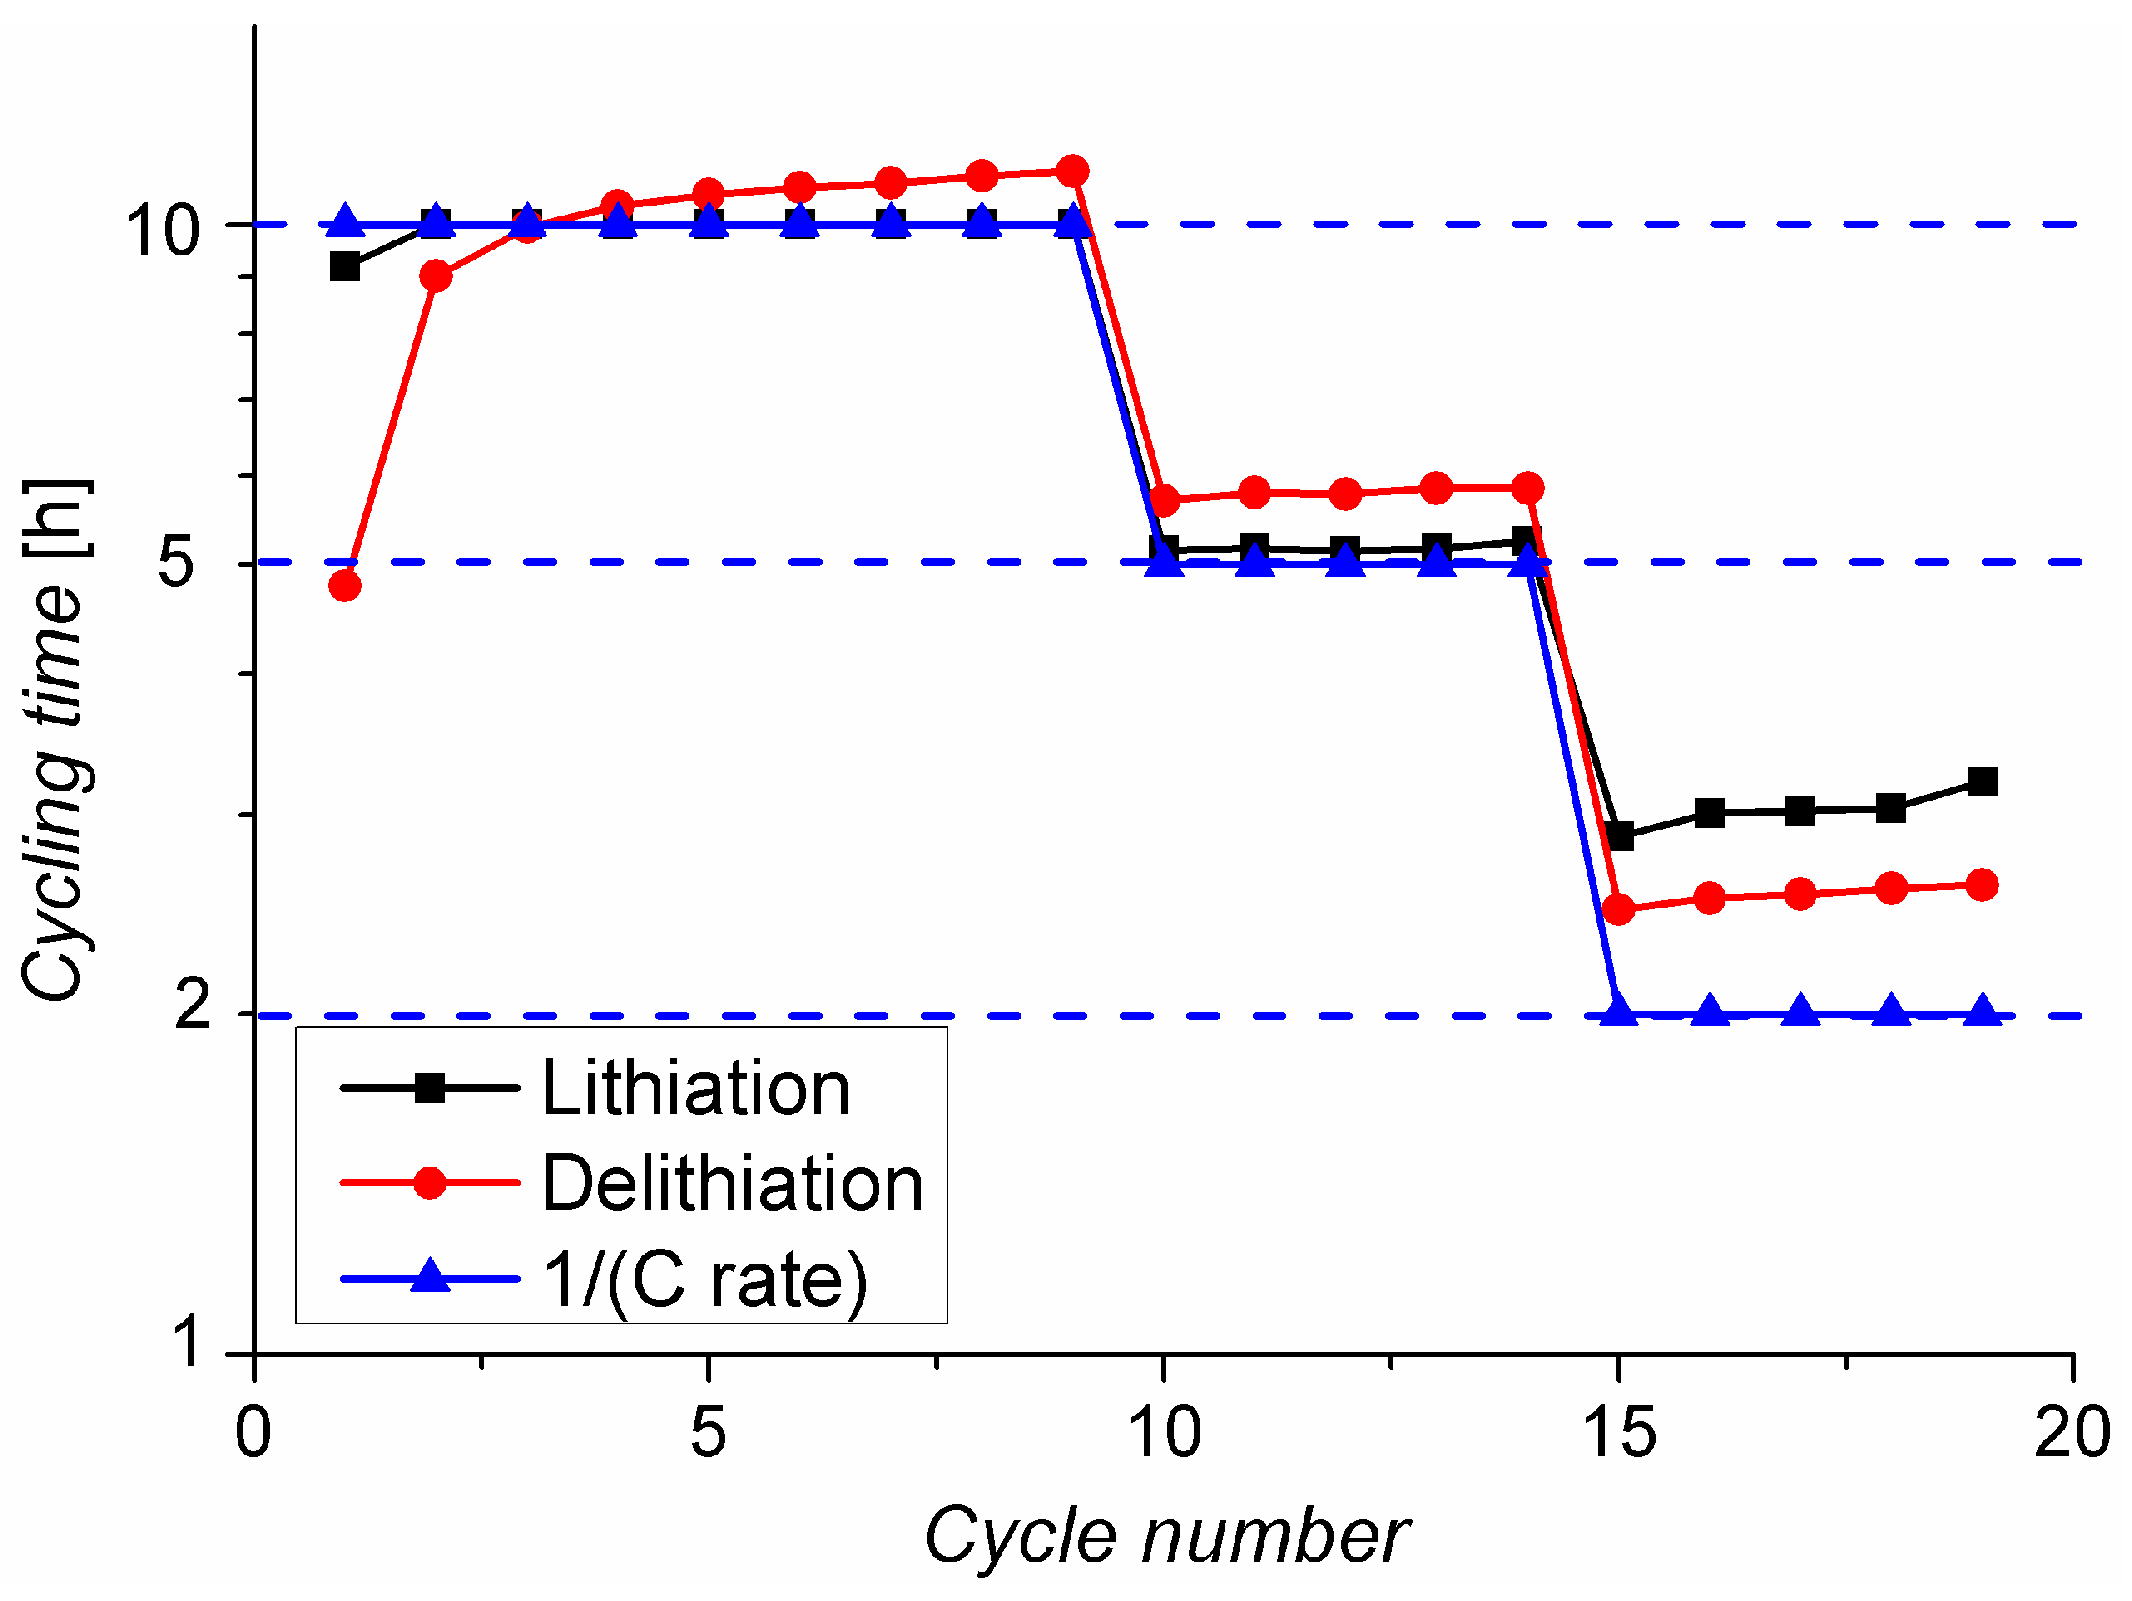
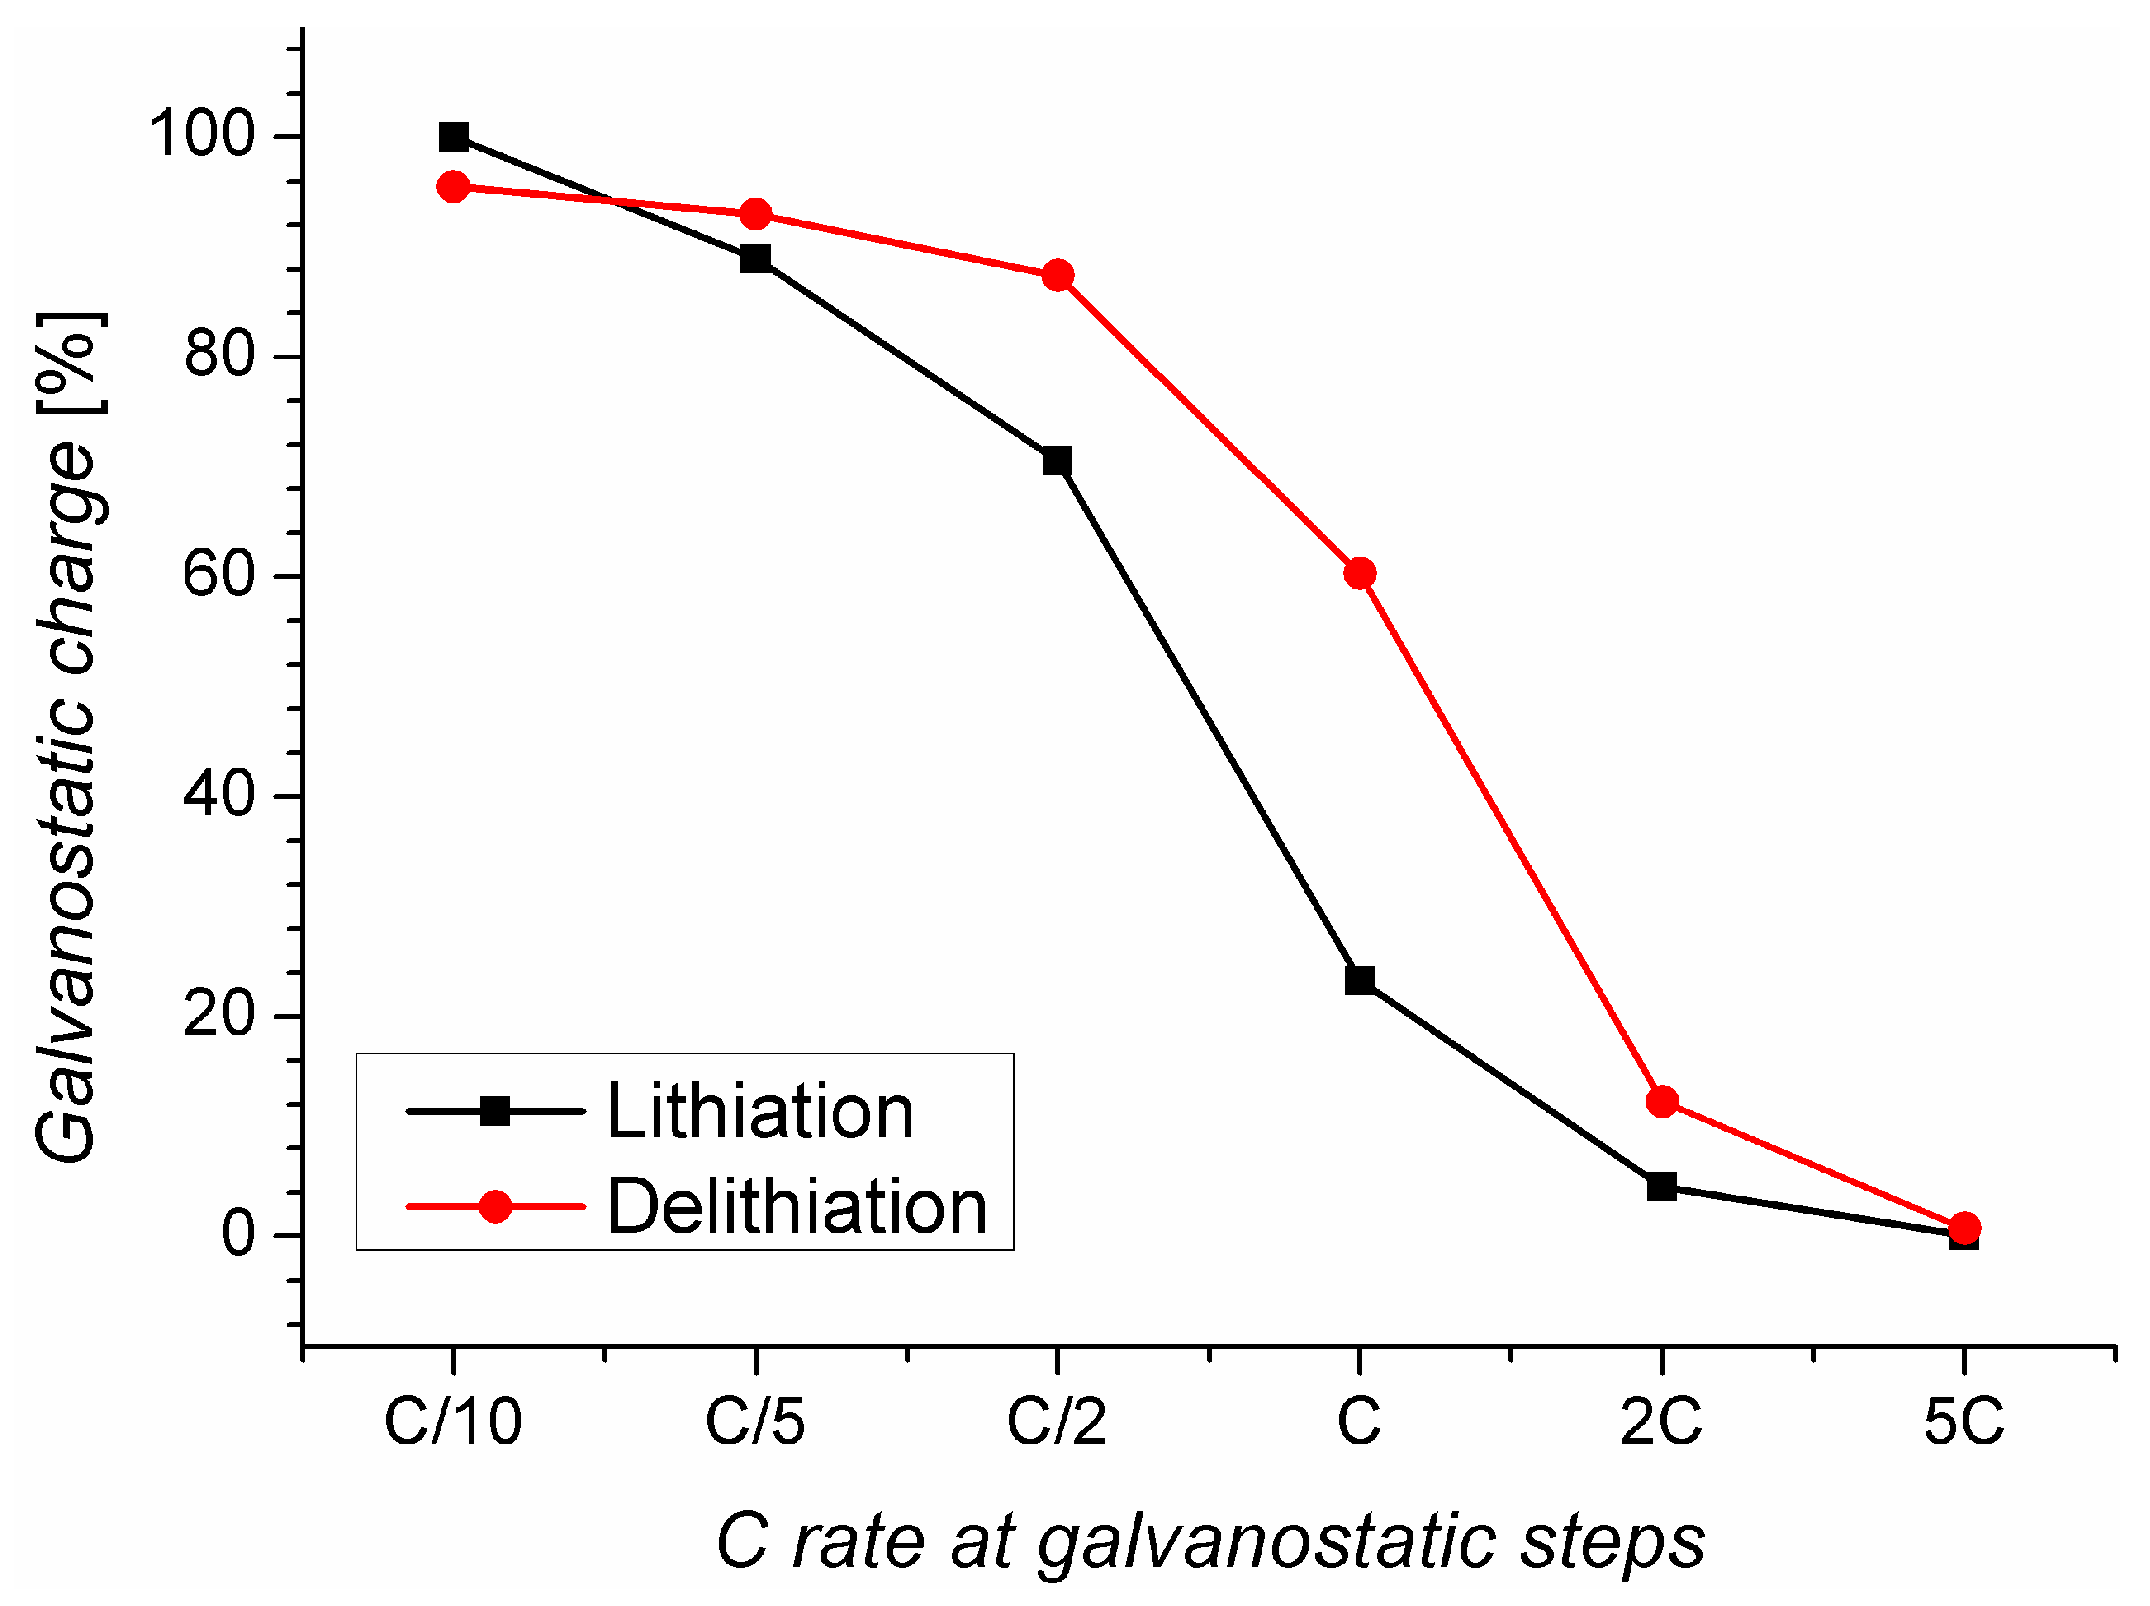
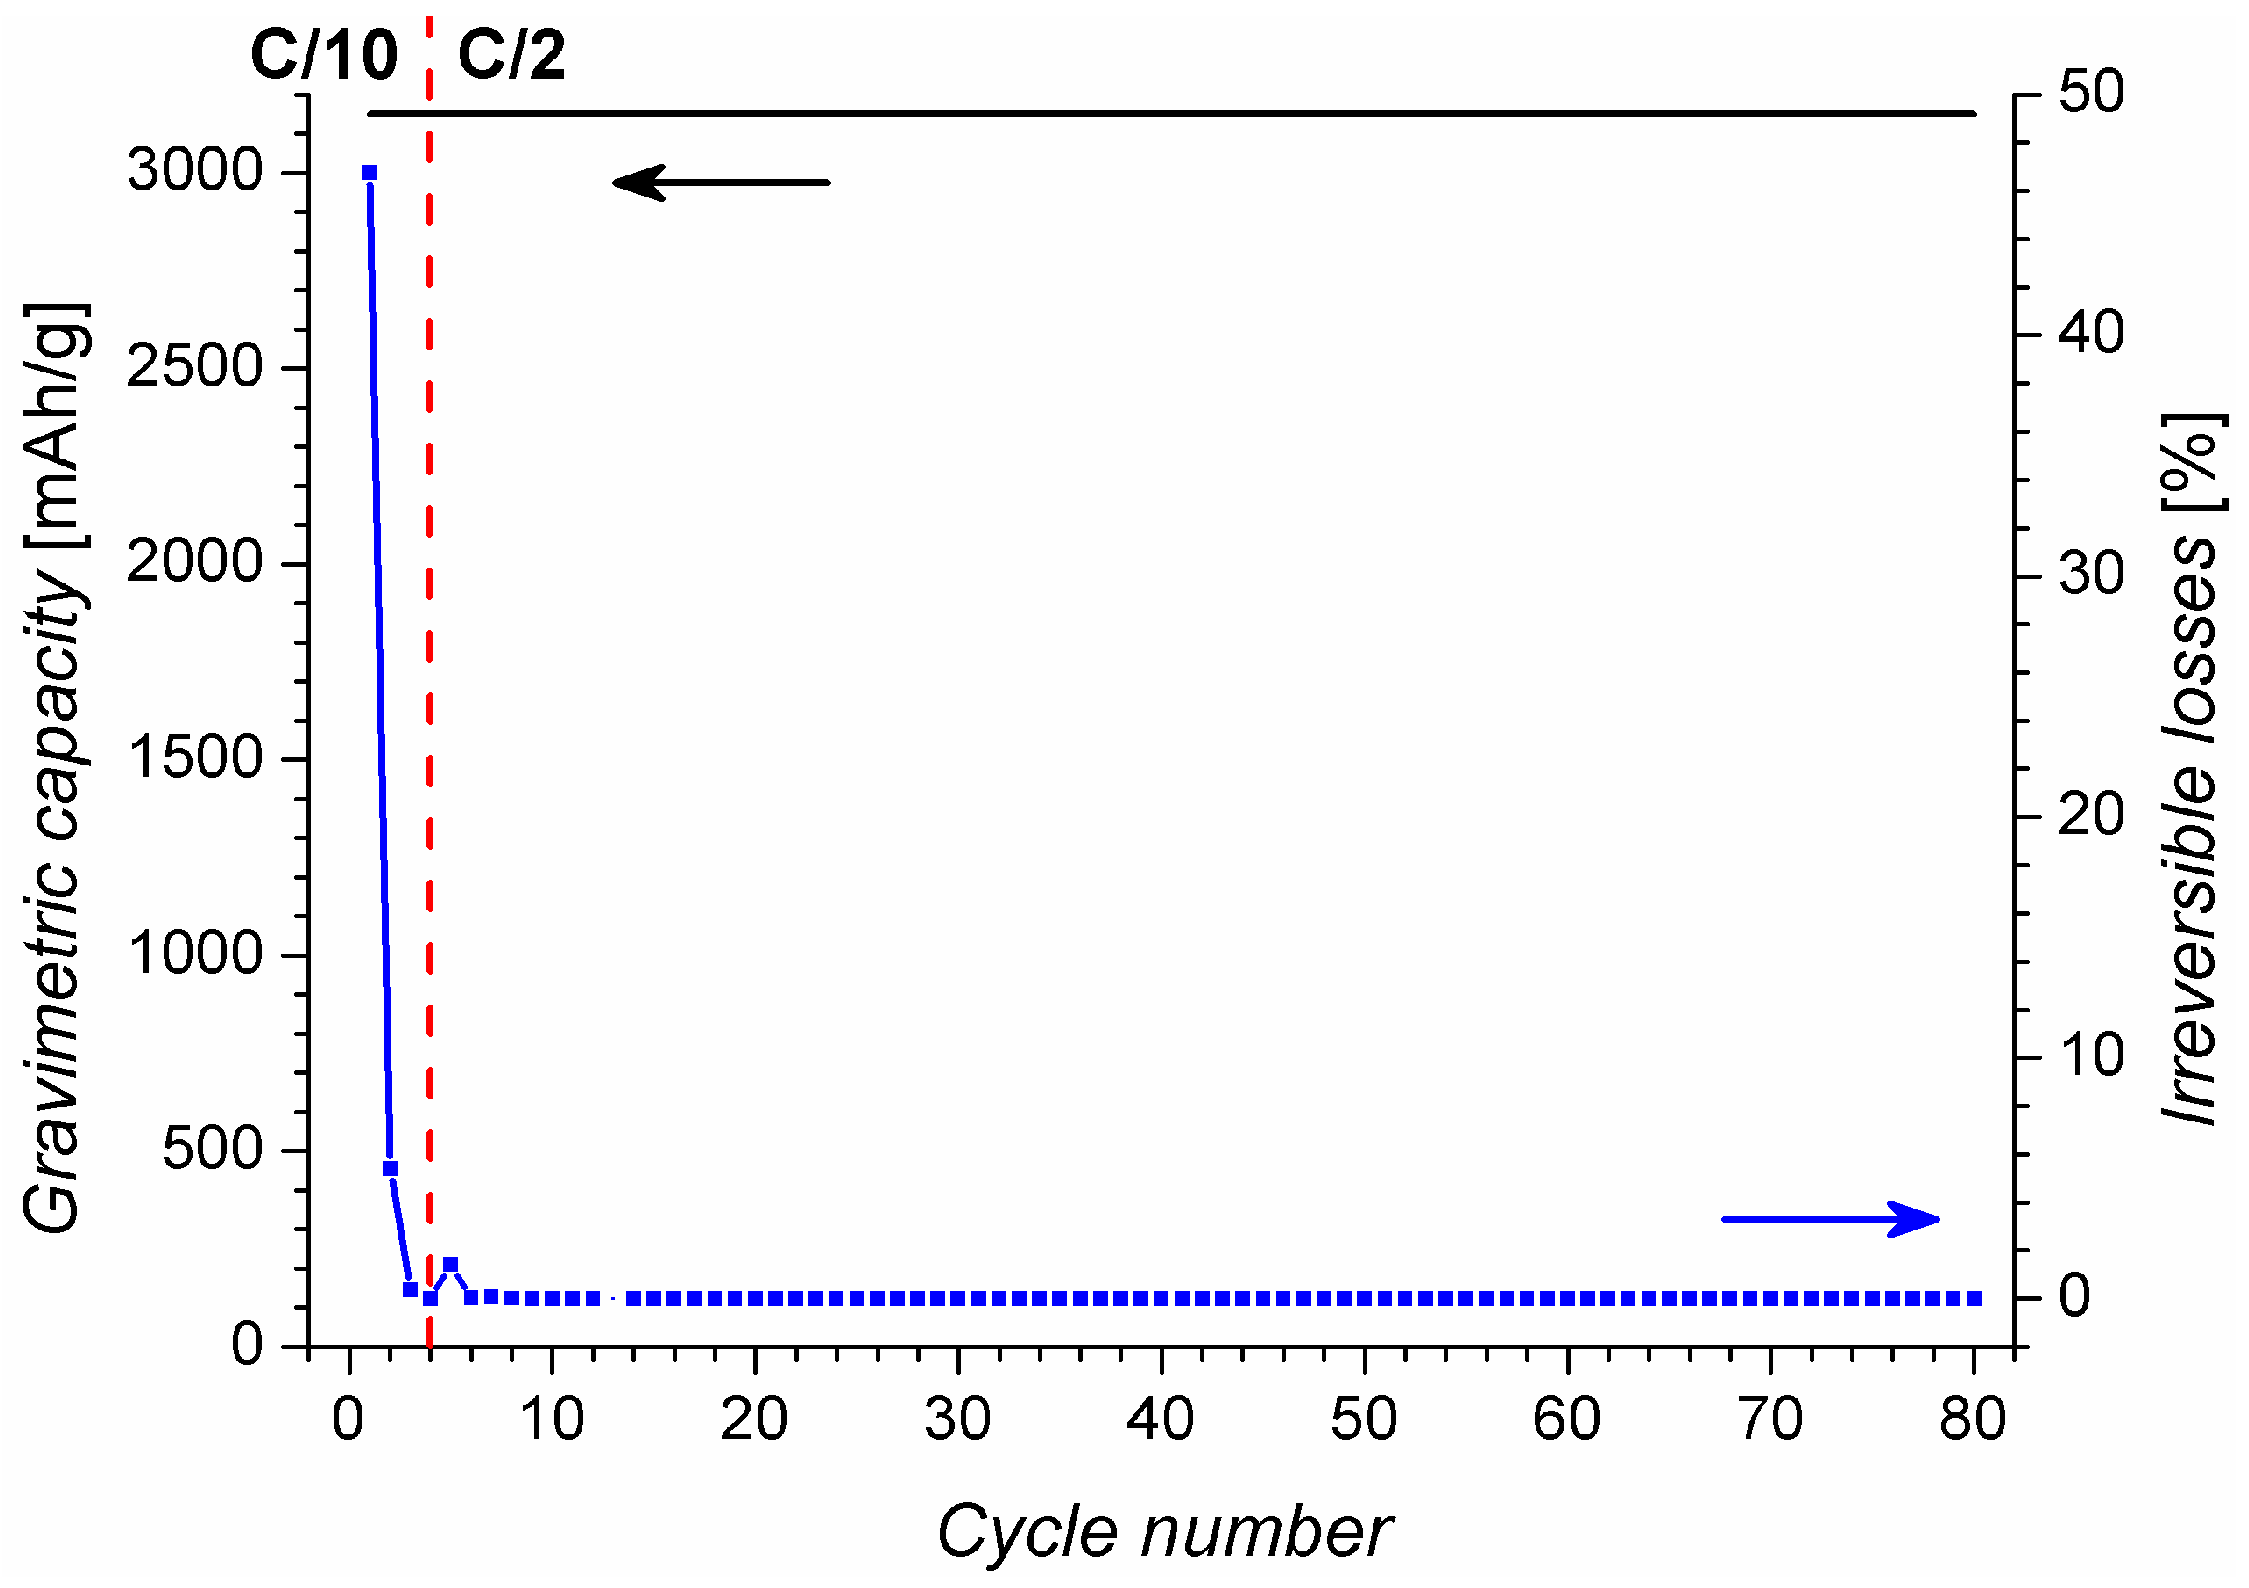
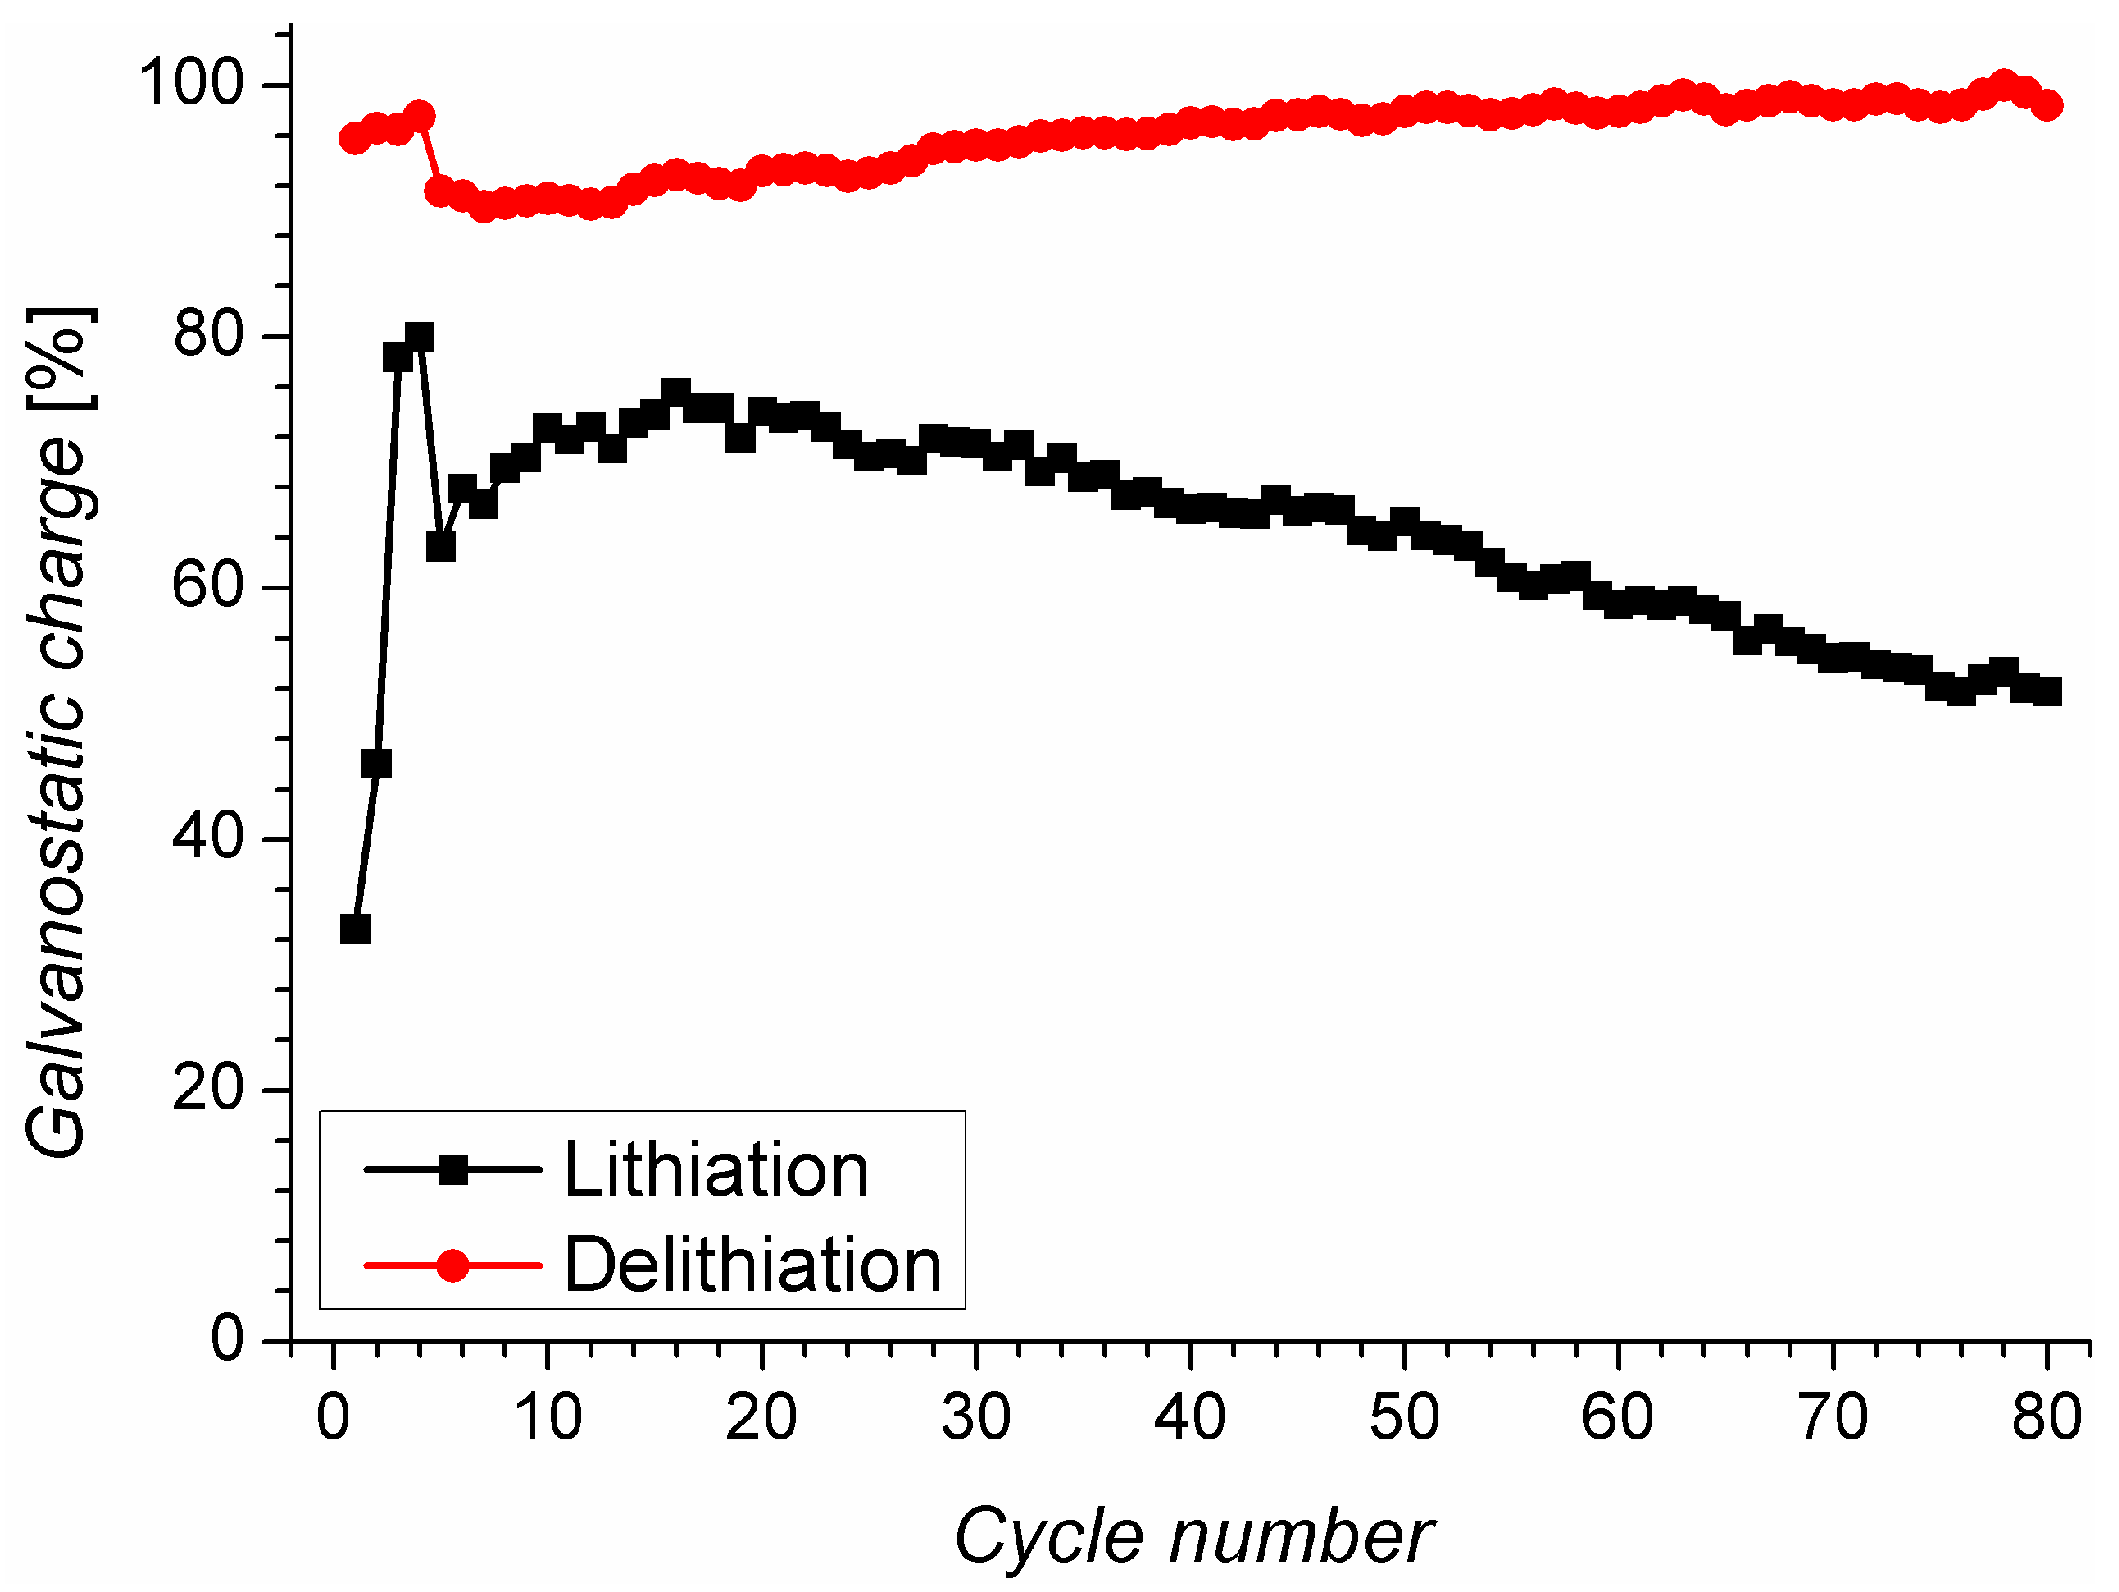
2.1. Variation of Charging Conditions

The Si microwire anode shown in Figure 1 was charged/discharged in two standard ways: (a) only galvanostatically (constant current); and (b) galvanostatically/potentiostatically (alternation between constant current and constant voltage steps). For both modes lower and upper voltage limits were set. In the pure galvanostatic mode (a), the current changes the polarity when the voltage limit is reached or when the capacity limit is accomplished. In the case of the galvanostatic/potentiostatic mode (b), when the voltage limit is reached, the cycling is switched to potentiostatic mode, and this mode finishes when the current has decreased to 10% of its initial value or when the capacity limit is reached. The current is calculated using the standard C rate definition, which indicates the nominal number of hours that it takes to reach the maximum charge when applying constant current; e.g., a rate of C/10 indicates that for the given current it will take 10 h to nominally lithiate or delithiate to 100% of the capacity in ideal conditions. For Si, a rate of C/10 translates into a current of 420 mA/g, since the nominal capacity is 4200 mAh/g. For both types of experiments a voltage limit of 0.11 V (vs. Li) was chosen for the lithiation of the anode, and of 0.7 V for the delithiation; they have been found from cyclic voltammetry experiments (for details see [12]). The definition of a current density related to the C rate is not trivial since it depends on the amount of active material. In addition, for the galvanostatic/potentiostatic mode (b) the C rate in the starting galvanostatic part may not be meaningful to characterize the (average) charging rate since the time with potentiostatic control as well as the integral current, i.e., charge, in this period may change for each cycle. Therefore the analysis of the cycling time in mode (b) can provide important information about the cycling performance.
Nearly no existing battery concept allows for a 100% charging of the electrodes. For the Si wire anode a capacity limit to 75% (3150 mAh/g) has been chosen. Typical for all Li ion anodes, a preconditioning of the electrode is necessary. In our case the first 10 cycles were done galvanostatically/potentiostatically at a low rate of C/10, to reduce initial stresses [2].
Figure 2 shows a curve of the gravimetric capacity (capacity per unit of mass) of the microwire anode versus the cycle number for cycling at different C rates in the pure galvanostatic mode (a). As can be observed, the wires can be cycled up to a rate of C/2 for obtaining capacities above 1000 mAh/g. C rates larger than that produce capacities below 50 mAh/g. Such typical behavior can be attributed to the (large) series resistances of the anode leading to appreciable voltage drops at high currents, i.e., high C rates. The voltage limits thus are reached earlier. Therefore, much less charge can be driven into the anode when increasing the C rate. This causes a shallow lithiation of the anode. One reason for a capacity reduction is therefore induced by the control algorithm and is not indicating a damage of the anode. This can be seen for the last part of the experiment, since the capacity recovers practically completely if the rate is reduced again to C/10. An additional capacity fading from cycle to cycle is found (indicated by a nearly linear decay) for charging/discharging at rates starting from C/2, which can most probably be attributed to an increase of the series resistance upon cycling, which is a first hint of a successive destruction of the electrode by longer cycling.
Figure 2. Curve of capacity vs. cycle number of the microwire anode, under galvanostatic mode at different C rates.
Energies 06 05145 g002
Cycling tests in the galvanostatic/potentiostatic mode (b) should significantly reduce the effect of the serial resistance mentioned above due to further charging at lower currents under potentiostatic control. The results for different initial C* rates (the asterisk indicates that the C rate only holds for the galvanostatic control) are shown in Figure 3. Under these conditions, it was possible to obtain 100% of the prescribed capacity limit (3150 mAh/g, see above) using currents corresponding to C* rates up to C*/2 during the galvanostatic steps. Capacities above 600 mAh/g are obtained even at a rate of 5 C*. Of course, the velocities for cycling do not necessarily correspond to the C* rates; details will be discussed in the next section. Cycling using this mode enables complementing the charge filling after the voltage limits are reached, overcoming the serial resistance losses. Additionally, smaller currents reduce (mechanical) stresses typically caused by a shallow lithiation/delithiation at high currents and thus can hinder an irreversible damage of the anode.
Figure 3. Curve of capacity vs. cycle number of the microwire anode cycled in the galvanostatic/potentiostatic mode at different C* rates during the galvanostatic steps. The C* rates have an asterisk * to indicate that they are only meaningful for galvanostatic cycling.
Energies 06 05145 g003
Obviously, fading at high C* rates cannot be avoided (see Figure 3). Starting for rates of 1 C* additional fading from cycle to cycle is found, probably again related to an increase of the serial resistance. It amounts to about 1.6%/cycle for 1 C* and 1.5%/cycle for 2 C*. This type of additional fading is smaller at 5 C*, because at this rate the cycling is mainly done potentiostatically, as will be seen later. Working under the potentiostatic control makes smaller changes in the series resistance upon cycling, i.e., the aging process is slower under these conditions. Although the serial resistance increases by cycling, the capacity for C* rates below C*/2 is still 100% of the prescribed capacity, i.e., 3150 mAh/g with no fading.
For the first three C* rates in Figure 3, which allow for a full charging of the electrode, the times needed for the lithiation and delithiation are presented in Figure 4. For this plot the times have been normalized for cycling to 100% of the capacity; i.e., the times for lithiation and delithiation have been divided by a factor of 0.75, due to the cycling to 75%.
Figure 4. Cycling rates during the galvanostatic/potentiostatic cycling of the Si microwire anode. The value of 1/(C rate) is shown for comparison.
Energies 06 05145 g004
It becomes very obvious how important it is to differentiate between C* rate and cycling time. Only in an ideal case, the time of the C* rate is equal to the cycling time (when the maximum capacity is reached under constant current). According to Figure 4 this is nearly true for very small currents corresponding to rates of C*/10 and C*/5. The time needed for lithiation using C*/2 current is equivalent to the time of a C/3 rate (it takes 3 h to lithiate), while for delithiation the time is close to a time of C/2.5. Cycling at higher C* rates further increases the time difference. This is because at higher C rates the voltage limits are reached faster, and the time of potentiostatic cycling becomes larger in proportion to the time of the galvanostatic steps. Figure 5 shows the proportion of the charge obtained during the galvanostatic steps at different C* rates. As can be seen, at a rate of 5 C* the lithiation/delithiation is done mainly potentiostatically (just 0.4% is charged galvanostatically). Up to a rate of C*/2 most of the charging is done galvanostatically, e.g., for C*/2 the percentage of galvanic charging is 70.6% during lithiation and 87.4% during delithiation.
The advantage of galvanostatic/potentiostatic mode (b) becomes very clear when combining the results of Figure 2 and Figure 3. Within 3 hours a complete charging of the electrode is possible using a C*/2 rate. In contrast, no complete charging is possible using a C/3 rate as can be seen from the data points at C/5 and C/2 in Figure 2.
Figure 5. Proportion of the average charge obtained under the galvanostatic steps at different C rates when cycling under the galvanostatic/potentiostatic mode.
Energies 06 05145 g005

2.2. Charging under Optimal Conditions

Charge cycling was performed under the best conditions described before (potentiostatic/galvanostatic with current of C*/2). For this test also a preconditioning of the anode with galvanostatic steps of C/10 was done (four cycles), and the capacity was limited to 75% (3150 mAh/g), as recommended in [2]. The results are shown in Figure 6. As can be observed, a constant capacity of 3150 mAh/g is obtained over 80 cycles. Irreversible losses are just apparent during the first three cycles, which can be attributed to the formation of a solid electrolyte interface (SEI) [10]. After this point the losses are zero and no fading of the capacity is observed. The coulombic efficiency is 100% until cycle 80. The good performance of the anode supports the idea of having selected the optimal conditions for cycling.
Figure 6. Cycling performance of the Si microwire anode with C/10 current for the first four cycles and C/2 current for the following ones. The capacity was limited to 75%.
Energies 06 05145 g006
Figure 7 shows the proportion of the charge obtained during the galvanostatic steps of the cycling of Figure 6. During the first cycles the time of the galvanostatic steps is short, due to the amorphization process of the crystalline Si wires, but it increases upon cycling until cycle 15, probably because at this cycle the amorphization process is over. At this cycle the amount of lithiation charge obtained galvanostatically reaches a maximum. From this point the proportion of the galvanostatic charge decreases almost monotonically during lithiation, and increases during delithiation. This may indicate that the series resistance of the wires increases with the cycle number. Adjustment of the voltage limits upon cycling should be done when using the anode in a real application, to always allow for the highest possible charging of the electrode. Otherwise, to reduce the variation of the resistance, approaches to increase the conductivity of the wires should be tested. Even without doing anything in respect to the resistance of the anode, the anode presents top performance, as will be seen when comparing with other Si-anode concepts in the next section.
Figure 7. Proportion of the charge obtained under the galvanostatic steps of the test in Figure 6.
Energies 06 05145 g007

2.3. Comparative Measures

Besides the Si anode concept presented in this work, there are many other concepts. For some alternative concepts extremely high capacities or very high cycling rates are claimed. However, as will be shown, the commonly used parameters to describe the performance of the anodes (and electrodes in general) are not enough for making standard and objective comparisons relative to practical applications.
As a first point it must be noted that the gravimetric capacity (capacity per unit weight, mAh/g), often used to denote the capacity of an electrode, is a good parameter for indicating the capacity that a material can reach, but not for the capacity that an electrode can accomplish. For most applications the electrodes have to be planar allowing for making stacks. For this purpose, it is common to calculate the “areal capacity” (mAh/cm2), which indicates the amount of charge that the electrode can store per nominal area. This is important because it allows checking if cathode and anode match. “Nominal” area is the projected area of the electrode in contrast to the (much larger) surface area of the Si microwires.
On the other hand, the C rate, which is used to denote the velocity of charging, has also no practical meaning in terms of charge. It indicates how fast a battery would be charged ideally, but it says nothing about the amount of charge. It is clear that an electrode with very low amount of active material could be charged faster, but the amount of stored charge would be very low. An important parameter to indicate the velocity of charging for practical applications could be the amount of charge that is being stored per unit of time and nominal area of the electrode. This parameter is called “charge density rate” [mAh/(cm2h)] in this work. It is equivalent to the parameter current density (mA/cm2) but it describes better what happens in a battery in terms of energy storage. The parameter “current density” is meaningful only in the case of uniform electrodes.
A survey of the newest and most attractive Si anode concepts was done. Table 1 presents a list of battery parameters of different Si anode concepts, reported in different journals. There were considered just the reports where enough information was provided. In all the cases from literature the anodes were lithiated in galvanostatic mode. In this sense a comparison with the performance of the anode of the present work is just possible keeping in mind that the galvanostatic mode for its lithiation lasted until it was charged to 70.6% of the set capacity. The delithiation was done in this mode until 87.4% of the capacity was obtained. In this way the charging/discharging time of the microwire anode (2.75 h in average) is close to the time of the nominal C rate (C/2). For making a standard comparison, the parameters area capacity and charge density rate were calculated. The C rates presented in Table 1 have been calculated considering the nominal capacity of Si (4200 mAh/g), considering the current densities and masses indicated in the reports. The C rates are the ones obtained from the galvanostatic modus during battery cycling. The charge density rate is calculated from the C rates: (C rate) (active mass/area) (4200 mAh/g). The parameters of the Si microwire anode presented in this work are also shown (cycled to 75% of the nominal capacity), together with the parameters of the same anode cycled to 100% of the capacity. Cycling to 100%, the anode stands just 50 cycles, after which a sudden fading of the capacity occurs, probably due to Li dendrite formation [2].
From Table 1 it can be seen that the areal capacity of the present Si microwire anode is one of the highest among the different Si anode concepts, besides a couple of anodes made by slurry casting [13,14], where it is possible to add as much material as wanted, and a porous Si membrane [15]. In the case of the paste electrodes, when the amount of material is high, the fading is usually high due to stresses, as happens with the anode of [13]. In [14] the areal capacity is surprisingly high for a slurry-made electrode. The thickness of the paste electrode was not given in the report. For the comparison of Table 1 a re-calculation of the capacity was done considering a thickness of 40 µm (the length of the active material according to the report [14], which is also a common thickness for a paste electrode), only active material, and FF of 0.15 (the material is an array of wall-sharing hollow tubes). This approximate value for the capacity of the electrode should be even smaller, considering the volume of the conductive additives and binders of the slurry.
Table 1. Half-battery cell parameters of different Si anode concepts.
Form of SiΦ Si (nm)Weight active (mg/cm2)C rate (galv. steps)Capacity start (mAh/g)Capacity end (mAh/g)CyclesV min (V)V max (V)Areal capacity (mAh/cm2)Ch. density rate (mAh/cm2h)Fading/cycle (%)Ref.
Si microwires (charged to 75%)10001.350.50031503150800.1100.74.252.840.00-
Si microwires (charged to 100%)10001.350.50042004200500.1100.75.672.840.00[2]
Free standing Si wires/tubes
Si nanowires1000.200.20026001900800.0070.70.520.170.34[4]
C-Si core shell nanowires502.000.11920001600550.0101.04.001.000.36[16]
Si nanowires with Si nanoparticles501.500.19017301200400.0501.02.601.200.77[17]
Si nanopillars5800.063.7881718859500.0252.00.100.951.00[18]
Cu-coated Si nanowires1000.600.05026802500150.0202.01.610.130.45[19]
Si nanotube with SiOx3500.065.71067555050000.0101.00.041.440.00[20]
p-doped Si nanowires300.142.00021501900200.0002.00.301.180.58[21]
Si particles in slurry
C-coated porous particles40003.500.02421001600300.0201.57.350.350.79[13]
C-coated Si nanowires with CNTs24.60.200.20016001050700.0101.00.320.170.49[22]
Si nano-particles782.000.01521001260200.0000.84.200.1252.00[23]
Si nanotubes nominal22510.001.00032503150800.0001.532.5042.000.04[14]
Si nanotubes calculated2251.401.00032503150800.0001.54.555.880.04-
Si thin films
Si film on CNF200 *0.050.100160012001020.0103.00.080.020.25[24]
Si film on rough Cu substrate350 *0.070.200230021001000.0101.20.160.060.09[25]
Film of Si nanoparticles35 *0.100.02422006501000.0201.50.210.010.70[26]
Porous Si
C-coated macroporous Si15005.820.0081250950200.0701.57.280.201.20[15]
Au-coated macroporous Si10001.000.02416192452100.1002.01.620.10−5.15[27]
* In the case of thin films; Φ Si is not the diameter of Si particles/wires, but the thickness of the films.
The value is in the same range of the capacity of the Si microwire anode (see the result in Table 1), but the charge density rate is larger mainly due to the conductive additives of the slurry (just note that the charge density rate for the Si microwire anodes is used just during 70.6% of the charging, because it is done in galvanostatic/potentiostatic mode). One of the most important features of the Si microwire anode is that it does not contain anything else than the active material, avoiding additional weight. The porous Si membrane of [15] has high areal capacity due to the high amount of active material, but the charge density rate is low and the fading is large. This concept does not overcome the problems of fading due to material cracking for volume expansion when Li is incorporated and de-incorporated in Si.
Besides considering the capacity and the charging rate of the anodes when comparing between electrodes, it is also important to take a look at the voltage limits taken for the battery cycling. For Si anodes it is known that the electrochemical processes related to lithiation and delithiation of Si occur in the range of around 20 mV to 1 V vs. Li/Li+ range [6,18,19,22], even considering size effects. The lower voltage limit, corresponding to the formation of Li22Si5 (the Si/Li phase with the highest Li content), is around 35 mV for Si nanowires of 50 nm in diameter [6,18], but it is around 110 mV for micron-sized wires [12]. Setting the lower voltage limit below 10 mV may cause Li plating and no Li incorporation in the anode [28]. On the other hand, setting the voltage limit above 1 V may cause undesired reactions that do not have anything to do with the delithiation of Si, producing parasitic currents. Not selecting the correct voltage limits may produce erroneous values of the amount of charge, which may not be stored in the electrode, but may be used for secondary reactions.

3. Experimental Section

The Si microwire anodes used for this study have been produced by an electrochemical-chemical method, whose steps could be summarized as follows: (a) Pre-structuring of Si wafers with a quadratic array of cavities; (b) electrochemical etching of macropores; (c) chemical over-etching of macroporous Si to obtain a wire array; (d) chemical-electrochemical deposition of a Cu current collector on the wires; (e) detaching the anode from the (reusable) Si substrate. The production process is thoroughly described in [11,12].
Battery cycling tests were performed using half-cells, with Li as reference electrode. The separator was a glass fiber filter from Whatman, with pores of 1 μm. The electrolyte was LP-30, consisting of dimethyl carbonate and ethylene carbonate (1:1) plus 1 mol/L of LiPF6. The tests were done with a BatSMALL battery charging system from Astrol Electronic AG (Oberrohrdorf, Switzerland). SEM observations were performed with an Ultra Plus SEM from Zeiss (Jena, Germany).

4. Conclusions

Anodes of high-density arrays of Si microwires embedded in Cu at one end have been prepared. Charging and discharging the anodes under constant current can be done just until rates below C/5. For large anode currents the voltage limits are reached early because of series resistances intrinsic to the anodes. If a potentiostatic step is applied after the voltage limits are reached, it is possible to apply currents corresponding to rates of C/2 during the galvanostatic step without observing any apparent capacity fading over 80 charge/discharge cycles (charging to 75% of the nominal capacity of 4200 mAh/g). Among the existing Si anode concepts, the Si microwire anodes feature one of the highest “areal capacities” (capacity per area of anode) and “charge density rates” (charge stored per unit of time, per unit of area of the electrode). Additionally, they exhibit the lowest capacity fading. This top performance is obtained if the correct voltage limits for the battery cycling are observed.

Acknowledgements

The authors acknowledge the German Federal Ministry of Education and Research (BMBF) for the economical support provided through the “AlkaSuSi” project.

Conflicts of Interest

The authors declare no conflict of interest.

References

  1. Okamoto, H. The Li-Si (lithium-silicon) system. J. Phase Equilib. 1990, 11, 306–312. [Google Scholar]
  2. Quiroga-González, E.; Carstensen, J.; Föll, H. Good cycling performance of high-density arrays of Si microwires as anodes for Li ion batteries. Electrochim. Acta 2013, 101, 93–98. [Google Scholar] [CrossRef]
  3. Graetz, J.; Ahn, C.C.; Yazami, R.; Fultz, B. Highly reversible lithium storage in nanostructured silicon. Electrochem. Solid-State Lett. 2003, 6, A194–A197. [Google Scholar] [CrossRef]
  4. Ruffo, R.; Hong, S.S.; Chan, C.K.; Huggins, R.A.; Cui, Y. Impedance analysis of silicon nanowire lithium ion battery anodes. J. Phys. Chem. C 2009, 113, 11390–11398. [Google Scholar] [CrossRef]
  5. Huang, R.; Fan, X.; Shen, W.; Zhu, J. Carbon-coated silicon nanowire array films for high-performance lithium-ion battery anodes. Appl. Phys. Lett. 2009, 95. [Google Scholar] [CrossRef] [PubMed]
  6. Kang, K.; Lee, H.S.; Han, D.W.; Kim, G.S.; Lee, D.; Lee, G.; Kang, Y.M.; Jo, M.H. Maximum Li storage in Si nanowires for the high capacity three dimensional Li-ion battery. Appl. Phys. Lett. 2010, 96. [Google Scholar] [CrossRef]
  7. Yang, Y.; McDowell, M.T.; Jackson, A.; Cha, J.J.; Hong, S.S.; Cui, Y. New nanostructured Li2S/Silicon rechargeable battery with high specific energy. Nano Lett. 2010, 10, 1486–1491. [Google Scholar] [CrossRef] [PubMed]
  8. Chan, C.K.; Peng, H.; Liu, G.; McIlwrath, K.; Zhang, X.F.; Huggins, R.A.; Cui, Y. High-performance lithium battery anodes using silicon nanowires. Nat. Nanotechnol. 2008, 3, 31–35. [Google Scholar] [CrossRef] [PubMed]
  9. Ghassemi, H.; Au, M.; Chen, N.; Heiden, P.A.; Yassar, R.S. In situ electrochemical lithiation/delithiation observation of individual amorphous si nanorods silicon nanotube battery anodes. ACS Nano 2011, 5, 7805–7811. [Google Scholar] [CrossRef] [PubMed]
  10. Quiroga-González, E.; Carstensen, J.; Föll, H. Structural and electrochemical investigation during the first charging cycles of silicon microwire array anodes for high capacity lithium ion batteries. Materials 2013, 6, 626–636. [Google Scholar] [CrossRef]
  11. Föll, H.; Carstensen, J.; Ossei-Wusu, E.; Cojocaru, A.; Quiroga-González, E.; Neumann, G. Optimized Cu contacted Si nanowire anodes for Li ion batteries made in a production near process. J. Electrochem. Soc. 2011, 158, A580–A584. [Google Scholar] [CrossRef]
  12. Quiroga-González, E.; Ossei-Wusu, E.; Carstensen, J.; Föll, H. How to make optimized arrays of Si nanowires suitable as superior anode for Li-ion batteries. J. Electrochem. Soc. 2011, 158, E119–E123. [Google Scholar] [CrossRef]
  13. Xiao, J.; Xu, W.; Wang, D.; Choi, D.; Wang, W.; Li, X.; Graff, G.L.; Liu, J.; Zhang, J.G. Stabilization of silicon anode for Li-ion batteries. J. Electrochem. Soc. 2010, 157, A1047–A1051. [Google Scholar] [CrossRef]
  14. Park, M.-H.; Kim, M.G.; Joo, J.; Kim, K.; Kim, J.; Ahn, S.; Cui, Y.; Cho, J. Silicon nanotube battery anodes. Nano Lett. 2009, 9, 3844–3847. [Google Scholar] [CrossRef] [PubMed]
  15. Thakur, M.T.; Pernites, R.B.; Nitta, N.; Isaacson, M.; Sinsabaugh, S.L. Freestanding macroporous Silicon and pyrolyzed polyacrylonitrile as a composite anode for lithium ion batteries. Chem. Mater. 2012, 24, 2998–3003. [Google Scholar] [CrossRef]
  16. Cui, L.-F.; Yang, Y.; Hsu, C.-M.; Cui, Y. Carbon-silicon core-shell nanowires as high capacity electrode for Lithium ion batteries. Nano Lett. 2009, 9, 3370–3374. [Google Scholar] [CrossRef] [PubMed]
  17. Hu, L.; Wu, H.; Hong, S.S.; Cui, L.; McDonough, J.R.; Bohy, S.; Cui, Y. Si nanoparticle-decorated Si nanowire networks for Li-ion battery anodes. Chem. Commun. 2011, 47, 367–369. [Google Scholar] [CrossRef]
  18. Green, M.; Fielder, E.; Scrosati, B.; Wachtler, M.; Moreno, J.S. Structured silicon anodes for lithium battery applications. Electrochem. Solid-State Lett. 2003, 6, A75–A79. [Google Scholar] [CrossRef]
  19. Chen, H.; Xiao, Y.; Wang, L.; Yang, Y. Silicon nanowires coated with copper layer as anode materials for lithium-ion batteries. J. Power Sources 2011, 196, 6657–6662. [Google Scholar] [CrossRef]
  20. Wu, H.; Chan, G.; Choi, J.W.; Ryu, I.; Yao, Y.; McDowell, M.T.; Lee, S.W.; Jackson, A.; Yang, Y.; Hu, L.; Cui, Y. Stable cycling of double-walled silicon nanotube battery anodes through solid-electrolyte interphase control. Nat. Nanotechnol. 2012, 7, 310–315. [Google Scholar] [CrossRef] [PubMed]
  21. Kim, J.S.; Choi, W.; Byun, D.; Lee, J.K. Electrochemical characteristics of phosphorus doped silicon for the anode material of lithium secondary batteries. Solid State Ionics 2012, 212, 43–46. [Google Scholar] [CrossRef]
  22. Chan, C.K.; Patel, R.N.; O’Connell, M.J.; Korgel, B.A.; Cui, Y. Solution-grown silicon nanowires for lithium-ion battery anodes. ACS Nano 2010, 4, 1443–1450. [Google Scholar] [CrossRef] [PubMed]
  23. Li, H.; Huang, X.; Chen, L.; Wu, Z.; Liang, Y. A high capacity nano Si composite anode material for lithium rechargeable batteries. Electrochem. Solid-State Lett. 1999, 2, 547–549. [Google Scholar] [CrossRef]
  24. Chen, P.-C.; Xu, J.; Chen, H.; Zhou, C. Hybrid silicon-carbon nanostructured composites as superior anodes for lithium ion batteries. Nano Res. 2011, 4, 290–296. [Google Scholar] [CrossRef]
  25. Cho, G.; Noh, J.; Sung, H.; Lee, S.; Ahn, H.; Nam, T.; Kim, K. Improved electrochemical properties of patterned Si film electrodes. Microelectron. Eng. 2012, 89, 104–108. [Google Scholar] [CrossRef]
  26. Chen, W.; Jiang, N.; Fan, Z.; Dhanabalan, A.; Chen, C.; Li, Y.; Yang, M.; Wang, C. Facile synthesis of silicon films by photosintering as anode materials for lithium-ion batteries. J. Power Sources 2012, 214, 21–27. [Google Scholar] [CrossRef]
  27. Thakur, M.; Isaacson, M.; Sinsabaugh, S.L.; Wong, M.S.; Biswal, S.S. Gold-coated porous silicon films as anodes for lithium ion batteries. J. Power Sources 2012, 205, 426–432. [Google Scholar] [CrossRef]
  28. Shu, Z.X.; McMillan, R.S.; Murray, J.J. Electrochemical intercalation of lithium into graphite. J. Electrochem. Soc. 1993, 140, 922–927. [Google Scholar] [CrossRef]

