2.1. Model Structure
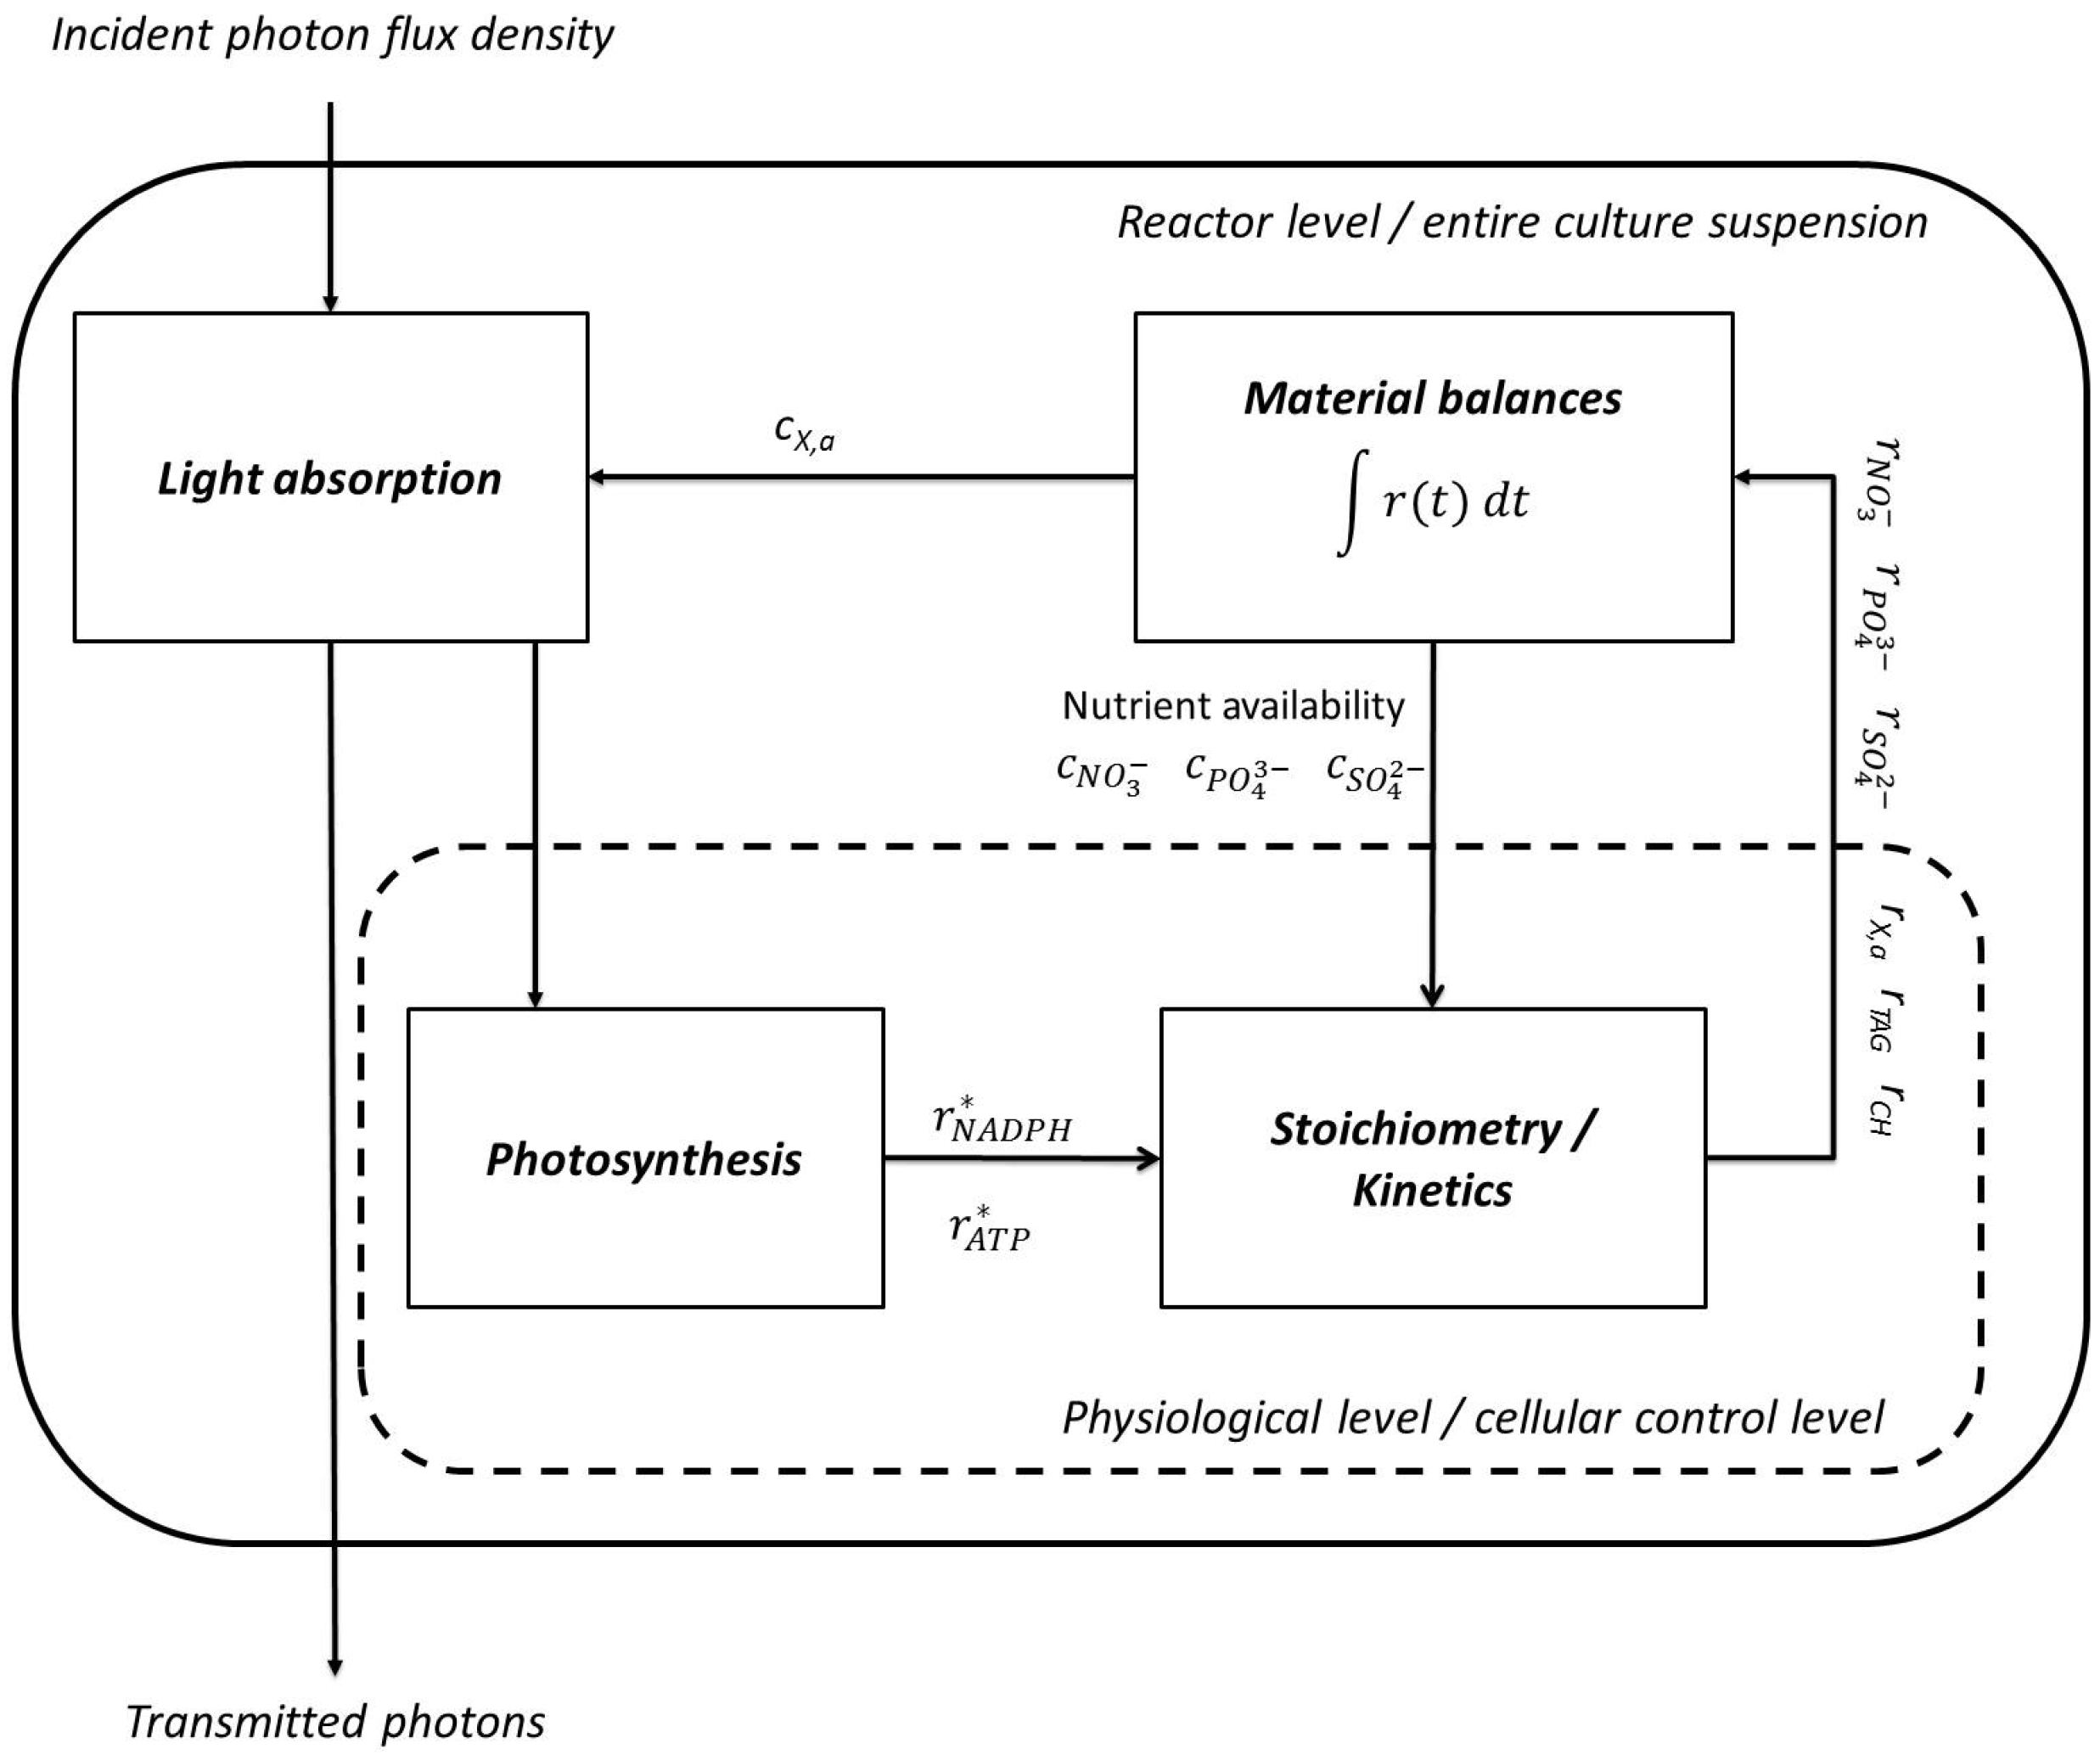
Figure 1 shows the principal structure of the model. Two principal compartments are distinguished in the structure, the cellular and the reactor level.
Figure 1.
Model structure. Rates of synthesis of cellular components and nutrient uptake are calculated on a physiological level together with the efficiency of adenosine triphosphate (ATP) and nicotinamide adenine dinucleotide phosphate (NADPH) synthesis. On the reactor level light absorption by the cell suspension as well as the material balances of cellular components and nutrients are considered.
On the reactor level the block “light absorption” calculates which fraction of the incident irradiance is absorbed by the cell suspension. These absorbed photons potentially contribute to the photosynthetic energy conversion. Transmitted photons do not contribute to the generation of nicotinamide adenine dinucleotide phosphate (NADPH) and adenosine triphosphate (ATP) and can be measured at the backside of the reactor. Moreover, all rates of synthesis of the cellular compounds as well as nutrient uptake rates of ions are processed in the block “material balances”. By their integration the concentrations of the respective molecules on the reactor level are calculated.
On the cellular level the efficiency of the photosynthetic energy conversion as well as rates of nutrient uptake and synthesis rates of cellular compounds are calculated. Not all the energy of absorbed photons contributes to the synthesis of ATP and NADPH. By non-photochemical quenching a part of the absorbed energy is dissipated as heat and fluorescence since either restrictions in the photosynthetic apparatus or downstream reactions limit the efficiency of energy conversion [
12]. This coherence is regarded in the block “photosynthesis”. It calculates which fraction of impinging photons is efficiently used in the photosynthetic process and drives phosphorylation of ADP as well as reduction of NADP
+.
The block “stoichiometry/kinetics” comprises all stoichiometric equations representing the mass balances of NADPH, ATP and the elements nitrogen, phosphorus and sulfur. Uptake of nutrients and consumption by anabolic reactions are determined by the respective rates of uptake and synthesis and linked via the mass balances of the corresponding elements. Equally, the photosynthetic generation of ATP and NADPH and the rates of their consumption balance. However, the number of synthesis rates of cellular compounds and nutrient uptake rates exceeds the number of material balance equations. Consequently, the former cannot be calculated solely by the stoichiometric equations. The system is underconstrained and the cells have additional degrees of freedom, e.g., the possibility to increase the synthesis of either storage compound at the expense of the other.
The mathematical model therefore comprises a linear programming algorithm. It optimizes the organism’s objective function, namely the optimization of growth rates at nutrient-replete or nutrient-deprived conditions. By maximizing the objective function the rates of syntheses of active (or storage molecule free) biomass
[
19], of storage lipids
and of storage carbohydrates
are calculated. The optimization is not only restricted by the aforementioned stoichiometric equations but also by inequality constraints. The latter consist of kinetic limitations, such as nutrient uptake kinetics or empirically observed saturation kinetics. By solving the simplex optimization algorithm the optimal solution of the system is obtained. It represents the most efficient anabolism of the microalgae in the possibility space, which is defined by stoichiometric and kinetic constraints. Therewith, the synthesis rates of active biomass, TAGs and carbohydrates as well as nutrient uptake rates are gained.
As aforementioned, the rates are subsequently integrated in order to calculate the associated concentrations in the reactor. The latter, in turn, influence light absorption properties of the culture.
2.2. Light Absorption
Light is absorbed by the algae suspension due to the absorption of the photosynthetic pigments. Scattering complicates the mathematical description of light absorption. For reasons of simplification, the light gradients inside the algae cultures were described by exponential decrease of the light intensity along the light path through the culture suspension, while the effects of light scattering are implicitly regarded in this approach. It is generally assumed that the description of the light gradients inside algae cultures, analogous to the Lambert-Beer Equation, is feasible for flat reactor geometries. Even though the Lambert-Beer law is valid only for molecular disperse systems a mathematically similar description is applied in literature [
17]. The transmitted irradiance is described as:
The irradiance of incident light I
0 was measured prior to the start of the cultivation inside the reactor compartment behind the front glass slide.
L is the length of the light path and amounts to 2 × 10
−2 m according to the dimensions of the photobioreactor. The concentration of functional or active biomass
is changing over time.
εapp represents the apparent extinction coefficient of the active biomass. However, absorption is the result of a complex interplay of scattering and absorption by pigments. Its mechanistic description is beyond the scope of this work and an empiric approach was chosen to uncouple light absorption from the remaining model.
εapp was empirically described by Equation (2) to account for the experimental observation of a first decreasing and towards higher biomass concentrations increasing extinction coefficient. The temporal changes of the extinction coefficient are presumably mainly influenced by photoacclimation [
20]. Since cells experienced low light intensity because of the higher cell concentration and mutual shading in the preculture the specific pigment concentrations are presumably decreasing shortly after inoculation. They increase again during the following stage of the cultivation because of increasing shading. During the nutrient limitation, on the other hand, the chlorophyll content does not significantly increase, since nitrogen is an essential element in the molecular composition of the pigment. Therefore, the extinction coefficient calculated with Equation (2) approximates a constant value:
The parameters
a and
b were determined by minimization of the least squares of errors between the experimentally observed extinction coefficients and those described by Equation (2) with the Generalized Reduced Gradient (GRG) Nonlinear Solving Method [
21].
With Equation (1), the irradiance of absorbed light
can be calculated at any given time as:
2.3. Light Use and Photosynthesis
Not every absorbed photon is efficiently absorbed and contributes with its energy content to the syntheses of ATP and NADPH. Energy dissipation due to photosaturation and photoinhibition must be considered. Camacho Rubio
et al. published a model [
22], which is able to describe the efficiency of photon capture by pigments depending on the state of the photosynthetic units (PSU). The distinction is made between three states of the PSUs: resting, activated and nonfunctional PSUs. Only the absorption of photons by resting PSUs contributes to photosynthetic regeneration of ATP and NADPH. In case a photon is captured by an activated or nonfunctional PSU, its energy is dissipated. Steady state fractions of all three states can be calculated by consideration of kinetic transitions between all states. The fraction of photons that are captured by resting PSUs, denoted as
η, is given by:
The equation was developed for light-limited growth at steady state with constant illumination by Camacho Rubio
et al. The ratio
α/
I describes the maximum rate of photosynthesis relative to the absorbed light.
κ denotes the number of activated PSUs when productivity is half-maximal. The parameters
α and
κ can be estimated from P-I curves and serve as starting points for parameter estimation. Finally, minimization of residues leads to convergence of the model according to Equation (5) with experimental data as shown in
Figure 2. Origin and meaning of the parameters are described in more detail by Camacho Rubio
et al. [
22]:
The parameters gained from this experimental fit were
Pm = 0.996 d
−1,
κ = 0.042,
α = 65.98 µE/(m
2·s) and the inhibiting parameter was
δ = 0.042. Equation (5) was developed for photoinhibition under steady state with constant illumination and accounts for the fact that not all photosynthetic units are functional [
22]. Experimental data were collected by cultivation of
P. tricornutum illuminated with different photon flux densities in the flat plate reactor system. All other conditions were identical to the conditions of experiments used for model validation. The growth rates were calculated as described in
Section 3.2. The effects of hydrodynamics are neglected in this model. Therefore, additional influences of flashing light cycles are not regarded in this approach. The enzymatic steps of dark reactions are rate limiting at saturating light intensities. The P-I curve can be shifted to higher saturating intensities when cells are circulating with favorable frequencies through dark and illuinated zones within the liquid volume. However, incorporation of hydrodynamics was not intended in this approach for reasons of simplification. Nevertheless, it potentially improves the transferability to other reactor systems.
Experimental data were additionally fitted with piecewise linear functions Equation (6) for calculation of the growth rate
µ of the algae:
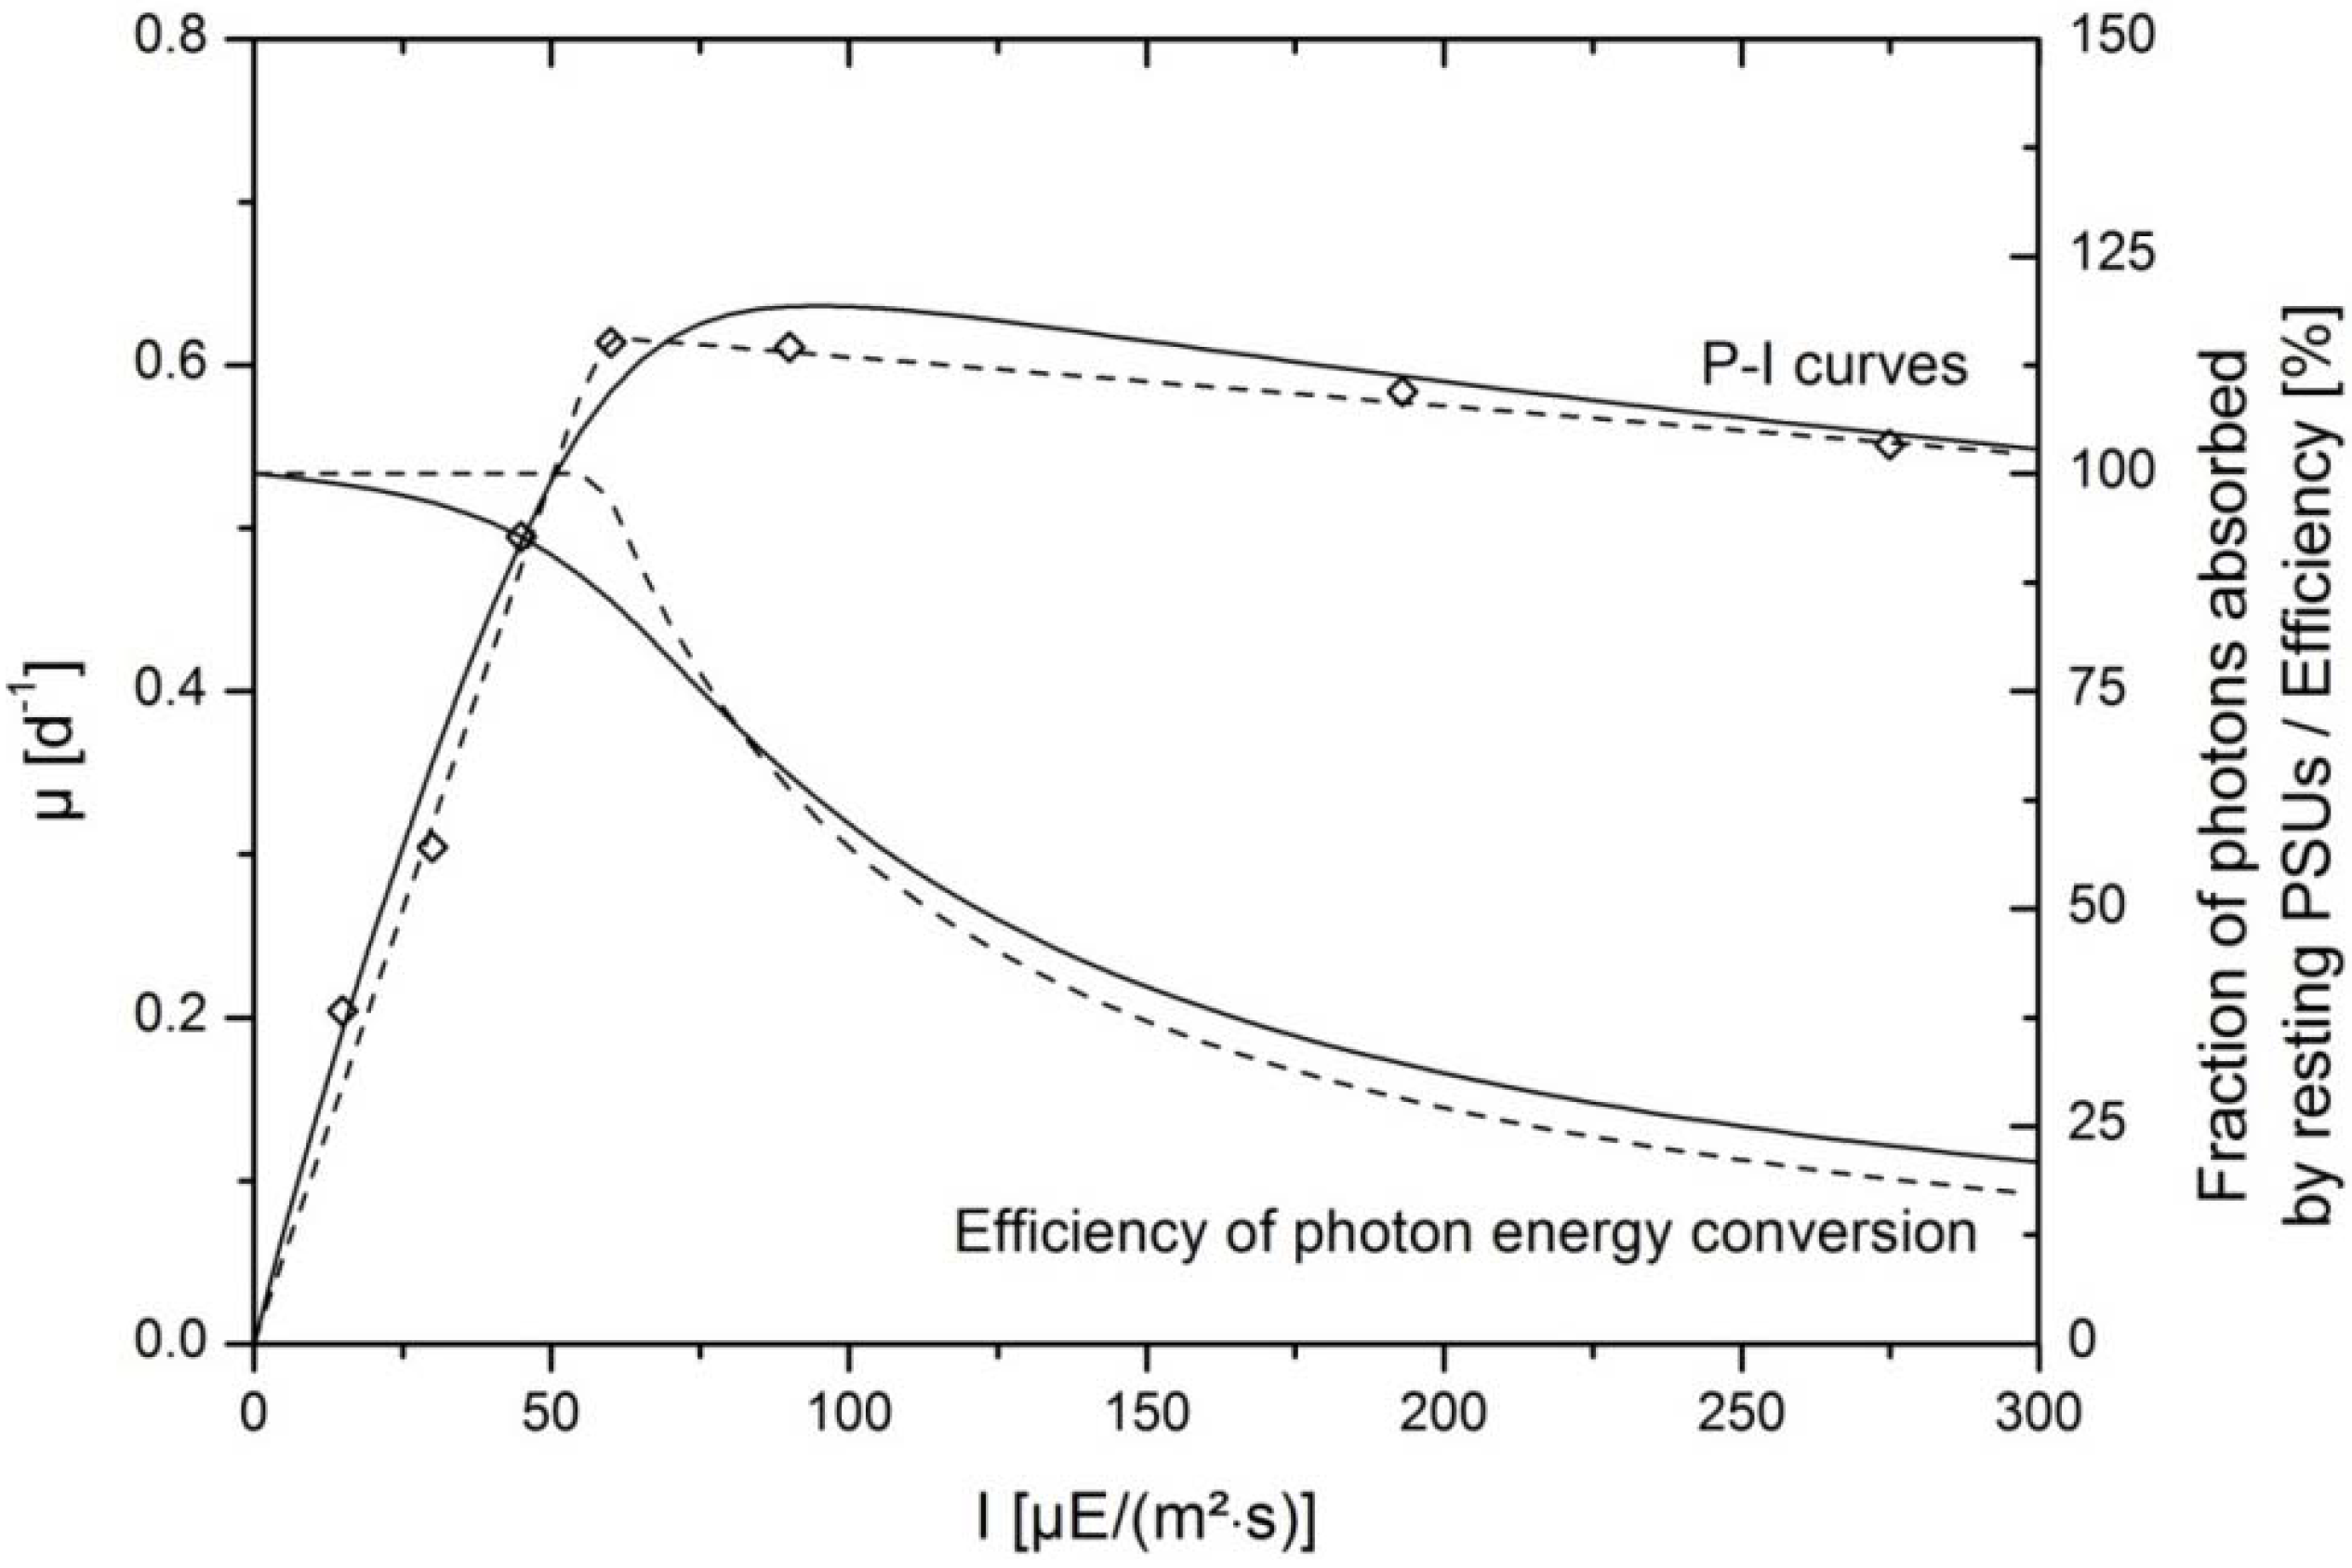
The resulting P-I curve is depicted in
Figure 2 and describes experimental data with the highest accuracy. The angle
can be regarded as the efficiency of the photon capture by the photosynthetic apparatus and is given by:
Starting with a near 100% absorption by resting PSUs, similar to the model of Camacho Rubio
et al. [
22], the efficiency
η’ at any given irradiance can be calculated with:
Both approaches described the light kinetics of the growth of
P. tricornutum accurately as indicated by the good correspondence of the model curve and experimental data (
Figure 2). Experimental data were gained from batch growth experiments under nutrient replete conditions. Growth rates were determined in the exponential growth phase at low biomass concentrations where only slight shading of cells occurred (see
Section 3.2.). Between 60 and 75 µE/(m
2·s) growth rate was maximal and transition to the saturating light intensities was visible. At higher intensities photoinhibition became apparent, since the growth rates decreased slightly at intensities higher than 100 µE/(m
2·s). According to the model the amount of photons which were absorbed by resting PSUs were at the maximum level near 100% at very low light intensities and decreased continuously when light intensitites increased. Similarly, the efficiency of photon capture, derived from the piecewise linear fit was initially 100% in the linearly rising range of the growth kinetics. In the saturating range, where growth rates were almost constant despite increasing irradiance, the efficiency was continuously reduced.
Figure 2.
Efficiency of photon energy conversion in the photosynthetic system of
P. tricornutum. Continuous lines indicate data fits according to the model published by Camacho Rubio
et al. [
22]. Interrupted lines represent the growth curve in dependence of light intensity and efficiency of photon capture with the piecewise linear data fit. Experimental data are shown with symbols.
I indicates the incident photon flux density; and
µ is the growth rate of the algae.
While the model by Camacho Rubio was derived from mechanistic modeling of the photosynthetic apparatus and regarded time constants of transition between different states of the photosystem, the latter approach was based on simple considerations of efficiency and worked with fewer parameters. There was little divergence of the resulting efficiency calculated with both approaches. Therefore, they could be used to describe energetic losses due to non-photochemical quenching, especially in the working range of ca. 200 µE/(m
2·s), where data for model validation were collected. At the working point of 200 µE/(m
2·s) the mechanistic model gave a fraction of 24% of photons that were absorbed by resting PSUs, whereas the efficiency based model gave an efficiency factor of 27%. This information was essential for further simulations, since it was the basis for the calculation of rates of ATP and NADPH syntheses. The latter restrictes the syntheses of functional and storage molecules in the block “stoichiometry/kinetics”. Rates of syntheses of ATP,
, and of NADPH,
, are calculated by the following stoichiometries [
12,
23]:
where
A is the illuminated surface of the culture and
V is the culture volume.
P. tricornutum is able to circumvent charge separation in the photosystem II (PSII) at very high and saturating light intensities by cyclic electron transport [
24]. In this case absorbed photons do not contribute to further NADP
+ reduction but exclusively to ADP phosphorylation. In this manner, cells can adapt their ATP:NADPH synthesis ratio according to the specific requirements of their metabolism. However, cyclic electron transport is not explicitly considered in the model for reasons of simplification. According to Equations (9) and (10), a ratio of 2:3 is assumed for the synthesis of NADPH and ATP.
This simplification was made because linear electron transport is energetically favorable for algae growth due to a higher yield and experimental evidence is available, which shows that cyclic electron flow rates in nutrient replete cultures of unicellular algae are low compared to linear electron flow [
25]. Even though modelling of cyclic electron flow in a similar context was implemented in [
26] a constant ratio of NADPH:ATP synthesis was assumed in this approach. However, further model improvement is possible in order to account for ajustment of the ratio of NADPH:ATP formation by the cells. Moreover, any reduction in efficiency is covered by the calculation of losses due to non-photochemical quenching at high light intensities, as shown in Equations (4) and (8). Even though a siginificant change in the ratio of r
NADPH:r
ATP is not covered, a general decrease of the overall efficiency is comprised in this approach.
2.4. Biomass Composition and Metabolic Costs
As mentioned above, two major classes of molecules were distinguished in the simulation to account for changing biomass compositions. Firstly, active biomass is composed of functional molecules, proteins, membrane lipids, structural carbohydrates, nucleic acids, pigments and metabolites. Secondly, storage molecules, carbohydrates and lipids, accumulate during nutrient limitation. Lipids, which accumulate during nutrient limitation, are mainly triacylglycerols (TAG) and regarded as such in the model. Since the simulation is based on mass and energy balances, the model requires knowledge of the elemental composition of all cellular compounds as well as NADPH and ATP requirements for their syntheses. A major simplification was achieved by the assumption that the composition of active biomass is not subject to significant changes during the cultivation. Even though restructuring on the subcellular level is possible significant shifts of the mass fractions of principal components, e.g., protein content in the active (in contrast to total) biomass, are not to be expected. This assumption was supported because chromatographic measurements of the consumption of sulfate and nitrate in the culture medium showed constant yield coefficients of nutrient replete growth, whereas the yield coefficient for anabolism could not be determined by ion-chromatography due to the capability of intracellular phosphate storage [
19,
27]. Moreover, a model which only described nutrient replete growth and included Equations (1)–(14), (21) and (22) converged towards a distinct composition of active biomass for six different experiments under nutrient replete conditions. According to these findings active biomass is represented by a composition of 59.3% proteins, 15.8% membrane lipids, 18.4% carbohydrates, 2.1% ribonucleic acid (RNA), 2.9% deoxyribonucleic acid (DNA) and 1.5% pigments. The latter consist of chlorophyll
a, chlorophyll
c and carotenoids in a ratio of 0.6:0.1:0.3, which was averaged from experimental results. Biomass is not entirely composed of these macromolecules but remaining components and metabolites are assumed to be represented by a similar composition.
The elemental composition was calculated for all molecular classes and is represented in
Table 1.
Table 1.
Elemental composition of molecular components of biomass and yield coefficients for their synthesis based on ATP and NADPH requirements [
28,
29].
Table 1.
Elemental composition of molecular components of biomass and yield coefficients for their synthesis based on ATP and NADPH requirements [28,29].
| Compound | C (w/w) | H (w/w) | N (w/w) | O (w/w) | P (w/w) | S (w/w) | Y1/NADPH [g/mol] | Y1/ATP [g/mol] |
|---|
| Proteins | 0.53 | 0.07 | 0.18 | 0.20 | 0 | 0.03 | 5.88 | 4.63 |
| Membrane lipids | 0.65 | 0.10 | 0.01 | 0.24 | 0.01 | 0 | 5.56 | 2.71 |
| TAG | 0.77 | 0.12 | 0 | 0.11 | 0 | 0 | 5.56 | 2.71 |
| Carbohydrates | 0.44 | 0.06 | 0 | 0.49 | 0 | 0 | 13.75 | 7.46 |
| Pigments | 0.77 | 0.08 | 0.06 | 0.09 | 0 | 0 | 3.78 | 5.46 |
| DNA | 0.38 | 0.05 | 0.16 | 0.31 | 0.10 | 0 | 12.61 | 7.39 |
| RNA | 0.36 | 0.04 | 0.15 | 0.35 | 0.10 | 0 | 11.99 | 7.02 |
| Active biomass | 0.52 | 0.07 | 0.12 | 0.27 | 0.01 | 0.02 | 6.78 | 4.68 |
The compositions of the distinct molecular classes were derived from the molecular structures of the compounds. The amino acid composition of
P. tricornutum, for example, was published by Brown [
28] and served as a basis for the calculation of the elemental composition of proteins. The mass fractions of elements in membrane lipids was calculated with the knowledge of the fatty acid composition of total lipids extracted from nutrient replete cultures and determined by gas chromatography. The fatty acid spectrum of nutrient limited cultures served as basis to deduce the mass fraction of elements in TAGs (data not shown).
Data given by Raven [
29] concerning the ATP and NADPH requirement per carbon atom in different molecular components of microalgal cells were used to calculate yield coefficients for all molecules considered in the model except for pigments, RNA and DNA. In this manner, the yield coefficients for lipids, proteins and carbohydrates were calculated as inverse of the NADPH or ATP requirements for the synthesis of 1 g of the respective molecule. The results are depicted in
Table 1. Equivalent data for the synthesis of DNA, RNA and pigments could not be found in literature. The NADPH and ATP requirements of their syntheses were calculated based on information on the ATP consumption and NADPH requirement of enzymatic steps involved in their syntheses. Information on the enzymatic conversions was gained from the Kyoto Encyclopedia of Genes and Genomes (KEGG) Pathway database. The composition of active biomass was calculated on the basis of the percentages of its components. Similarly, yield coefficients given in
Table 1 for the synthesis of active biomass are the sum of the ATP or NADPH demand of particular components weighted with their mass fraction in active biomass.
Data concerning the maintenance energy requirement of
P. tricornutum are not readily available. However, light kinetic experiments and reports of a light compensation point lower than 1 µE/(m
2·s) [
30] indicate that the maintenance coefficient for
P. tricornutum can be assumed to be low. In this context we assume that an irradiance of at least 4 µE/(m
2·s) is necessary to illuminate a reactor with 1 g/L biomass concentration for coverage of the maintenance energy demand. With an illuminated surface of A = 0.05 m
2 of the reactor 1.73 × 10
−2 mol Photons must therefore be absorbed per day and g. Biomass to cover the maintenance energy requirement of the cells. According to the stoichiometry of 2 mol NADPH and 3 mol ATP generated per eight mol photons absorbed, maintenance requirements of 4.3 mmol/(g·d) NADPH and 6.5 mmol/(g·d) ATP were calculated. The lower boundaries of the rates of ATP and NADPH consumption for maintenance purposes,
and
, are calculated with:
where
cX(
t) is the total biomass at the time
t. Since it does not only comprise the active biomass but also the storage molecule fraction of the biomass the rates of maintenance ATP and NADPH consumption fulfill also the function to account for potential turnover of storage molecules [
31].
2.5. Stoichiometry
The stoichiometric constraints of the cell metabolism are represented by the matrix notation:
where the vector
r* comprises all rates of synthesis and nutrient uptake which are themselves optimized by the simplex algorithm. The matrix
b is the stoichiometry matrix. Their multiplication gives
y as shown in Equation (14). The rates of NADPH and ATP generation are calculated by the blocks “light absorption” and “photosynthesis”. The availability of both molecules restricts the synthesis of the cellular compounds active biomass, TAGs and storage carbohydrates as shown in the first two lines of Equation (14). They ensure that an accumulation of either molecule is prevented and that synthesis of NADPH(/ATP) and its consumption by the anabolism as well as maintenance requirement equate. Calculation of NADPH(/ATP) consumption is based on synthesis rates of the cellular compounds, e.g.,
. Their multiplication with the inverse yield coefficient, e.g.,
, determines the requirement of NADPH or ATP for the synthesis of the respective compound. These two stoichiometric equations represent not only the mass balances of ATP and NADPH but in a wider sense also the energy balances of the system.
Moreover, Equation (14) comprises the mass balances for the elements nitrogen, phosphorous and sulfur (lines 3 to 5). The uptake rate of nitrate
, for example, multiplied with the mass fraction of nitrogen in nitrate
determines the amount of nitrogen that is available for the synthesis of active biomass in a defined time period. The nitrogen requirement for anabolism on the other hand is represented by the synthesis rates of the specific compounds weighted with the nitrogen content in the respective molecules:
The model could be easily expanded by incorporation of the carbon balance as well but it would require the description of mass transfer with the system specific mass transport coefficient kLa. Moreover, carbon limitation is usually (and also in this work by control of the CO2-volume fraction in the aeration) avoided by aeration with relatively high partial pressures of CO2 so that the necessity was not given in the context of this work. The system is underconstrained because the number of variables exceeds the number of equations in Equation (14). Therefore the solution, calculation of all synthesis rates, cannot solely be obtained with the knowledge of the stoichiometry.
2.6. Kinetics/Linear Programming
The underconstrained system given in Equation (14) is not sufficient to calculate the synthesis rates of all compounds. However, with the underlying assumption, that cells optimize their metabolism to gain a maximum growth rate, a linear programming approach can be implemented. With consideration of the equality constraints in Equation (14) and additional inequality constraints given by Equation (15) the simplex algorithm provides the synthesis rates of all compounds as result of the optimization of the inherent objective function Equation (21).
The first two lines of Equation (15) indicate that the rates of NADPH and ATP syntheses,
and
are smaller than or equal to the photosynthetic rates of synthesis,
and
, as calculated with Equations (9) and (10). The consecutive two lines enforce that the maintenance requirements of the cells,
and
equal or exceed the lower boundaries
and
defined by Equations (11) and (12):
Additional non-negativity constraints in the subsequent three lines ensure that none of the synthesis rates of active biomass, TAGs or storage carbohydrates is negative. The model does not take into account that an interconversion of carbohydrates into TAG might occur inside the cell and only describes the observable net-synthesis rates. The following three lines state that the maximum uptake rates for the nutrients nitrate, phosphate and sulfate are restricted by the underlying Michaelis-Menten kinetics of their uptake. These are shown in Equations (16)–(18).
where all
r* represent the uptake rates;
c represents the concentrations in the culture suspension; and
K represents the Michaelis-Menten constants for the uptake of the individual anions. Since the description of the kinetics in the range of very low nutrient concentrations was not in the focus of the modeling and data points at very low nitrate concentrations were not available for parameter optimization, the maximum rates of uptake were arbitrarily chosen as 1 g/(L·d). Thus high values were assigned to the maximum attainable rates. The Michaelis-Menten constants on the other hand were chosen as very small values of 1 mg/L indicating high affinity of the organisms to the nutrients. Batch growth experiments did not allow for experimental observation of the nutrient uptake kinetics, since the transition of nutrient-replete to nutrient-limited is fast. Also very low concentrations of the respective nutrients are only present in very short time ranges in batch cultures so that the kinetic impact was not observable by measurements of ion concentrations or growth rates of biomass. However, the formulation by Equations (16)–(18) allows for improvement of the model if kinetic data for nutrient uptake are available.
The last two lines of Equation (15) serve to empirically describe the observed saturation kinetics of the synthesis of TAGs and carbohydrates during nutrient limitation. The saturation can be considered a form of product inhibition and was modeled with inhibition terms which can be found in literature, e.g., in [
32].
and
in Equation (15) are the momentary concentrations of both storage molecules.
and
represent the maximum observable concentrations of the storage molecules and are calculated by multiplication of the maximum specific contents inside the cells and the active biomass concentration.
n is a smoothing parameter. It was introduced because of the fast transition of carbohydrate synthesis to saturation. However, it is merely a parameter to empirically describe the observations. Lipid accumulation did not show a similar behavior and the introduction of an additional parameter for their saturation kinetics was therefore omitted.
Maximum rates of synthesis
and
are calculated by the following restrictions:
Therewith, the maximum attainable rates of synthesis of TAGs or storage carbohydrates are only restricted by ATP and NADPH availability in this context.
In order to solve the optimization approach an objective function is additionally required. It represents the organism’s inherent driving force to maximize its growth rate and to optimize energy storage. It is given by:
where
,
and
represent weighting factors. The simulation mainly passes through two distinct phases, nutrient-replete growth and storage molecule accumulation. Even though the model proved to be relatively insensitive to variations of the weighting factors it was important that
was greater than the other weighting factors. The synthesis of active biomass has a direct reproductive value for the cells. If
was not greater than
and
the cells would also synthesize storage molecules during nutrient-replete conditions to convert the absorbed energy in reactions of the cells’ anabolism. In contrast, the accumulation of storage molecules is not a primary objective of the microalgal cells.
fCH was arbitrarily normalized to 1. Since the enthalpy of combustion of lipids (Δ
Hc,TAG = 40 kJ/g) is greater than that of carbohydrates (Δ
Hc,CH = 18 kJ/g) [
33] TAGs represent a storage compound with higher energy density. The synthesis of TAGs was weighted with a factor 2.2. This corresponds to the ratio Δ
Hc,TAG:Δ
Hc,CH and accounts for the higher value of 1 g of TAGs compared to 1 g of carbohydrates in terms of energy reserve for the cell.
was set to 5 to ensure that the synthesis of active biomass is preferred over that of storage molecules.
The rates of syntheses of active biomass
, storage carbohydrates
, and storage lipids
, were thus calculated by the simplex algorithm [
34] implemented in the MATLAB (MathWorks) function “linprog”. In this respect all valid solutions are bounded by equality constraints of Equation (14) and inequality constraints of Equation (15). The maximization of the objective function given by Equation (21) then calculates the optimal rates taking into account these constraints.
2.8. Model Validation
Model validation was performed by fitting of experimental data gained from experiments with varying NaNO
3 starting concentrations with the model.
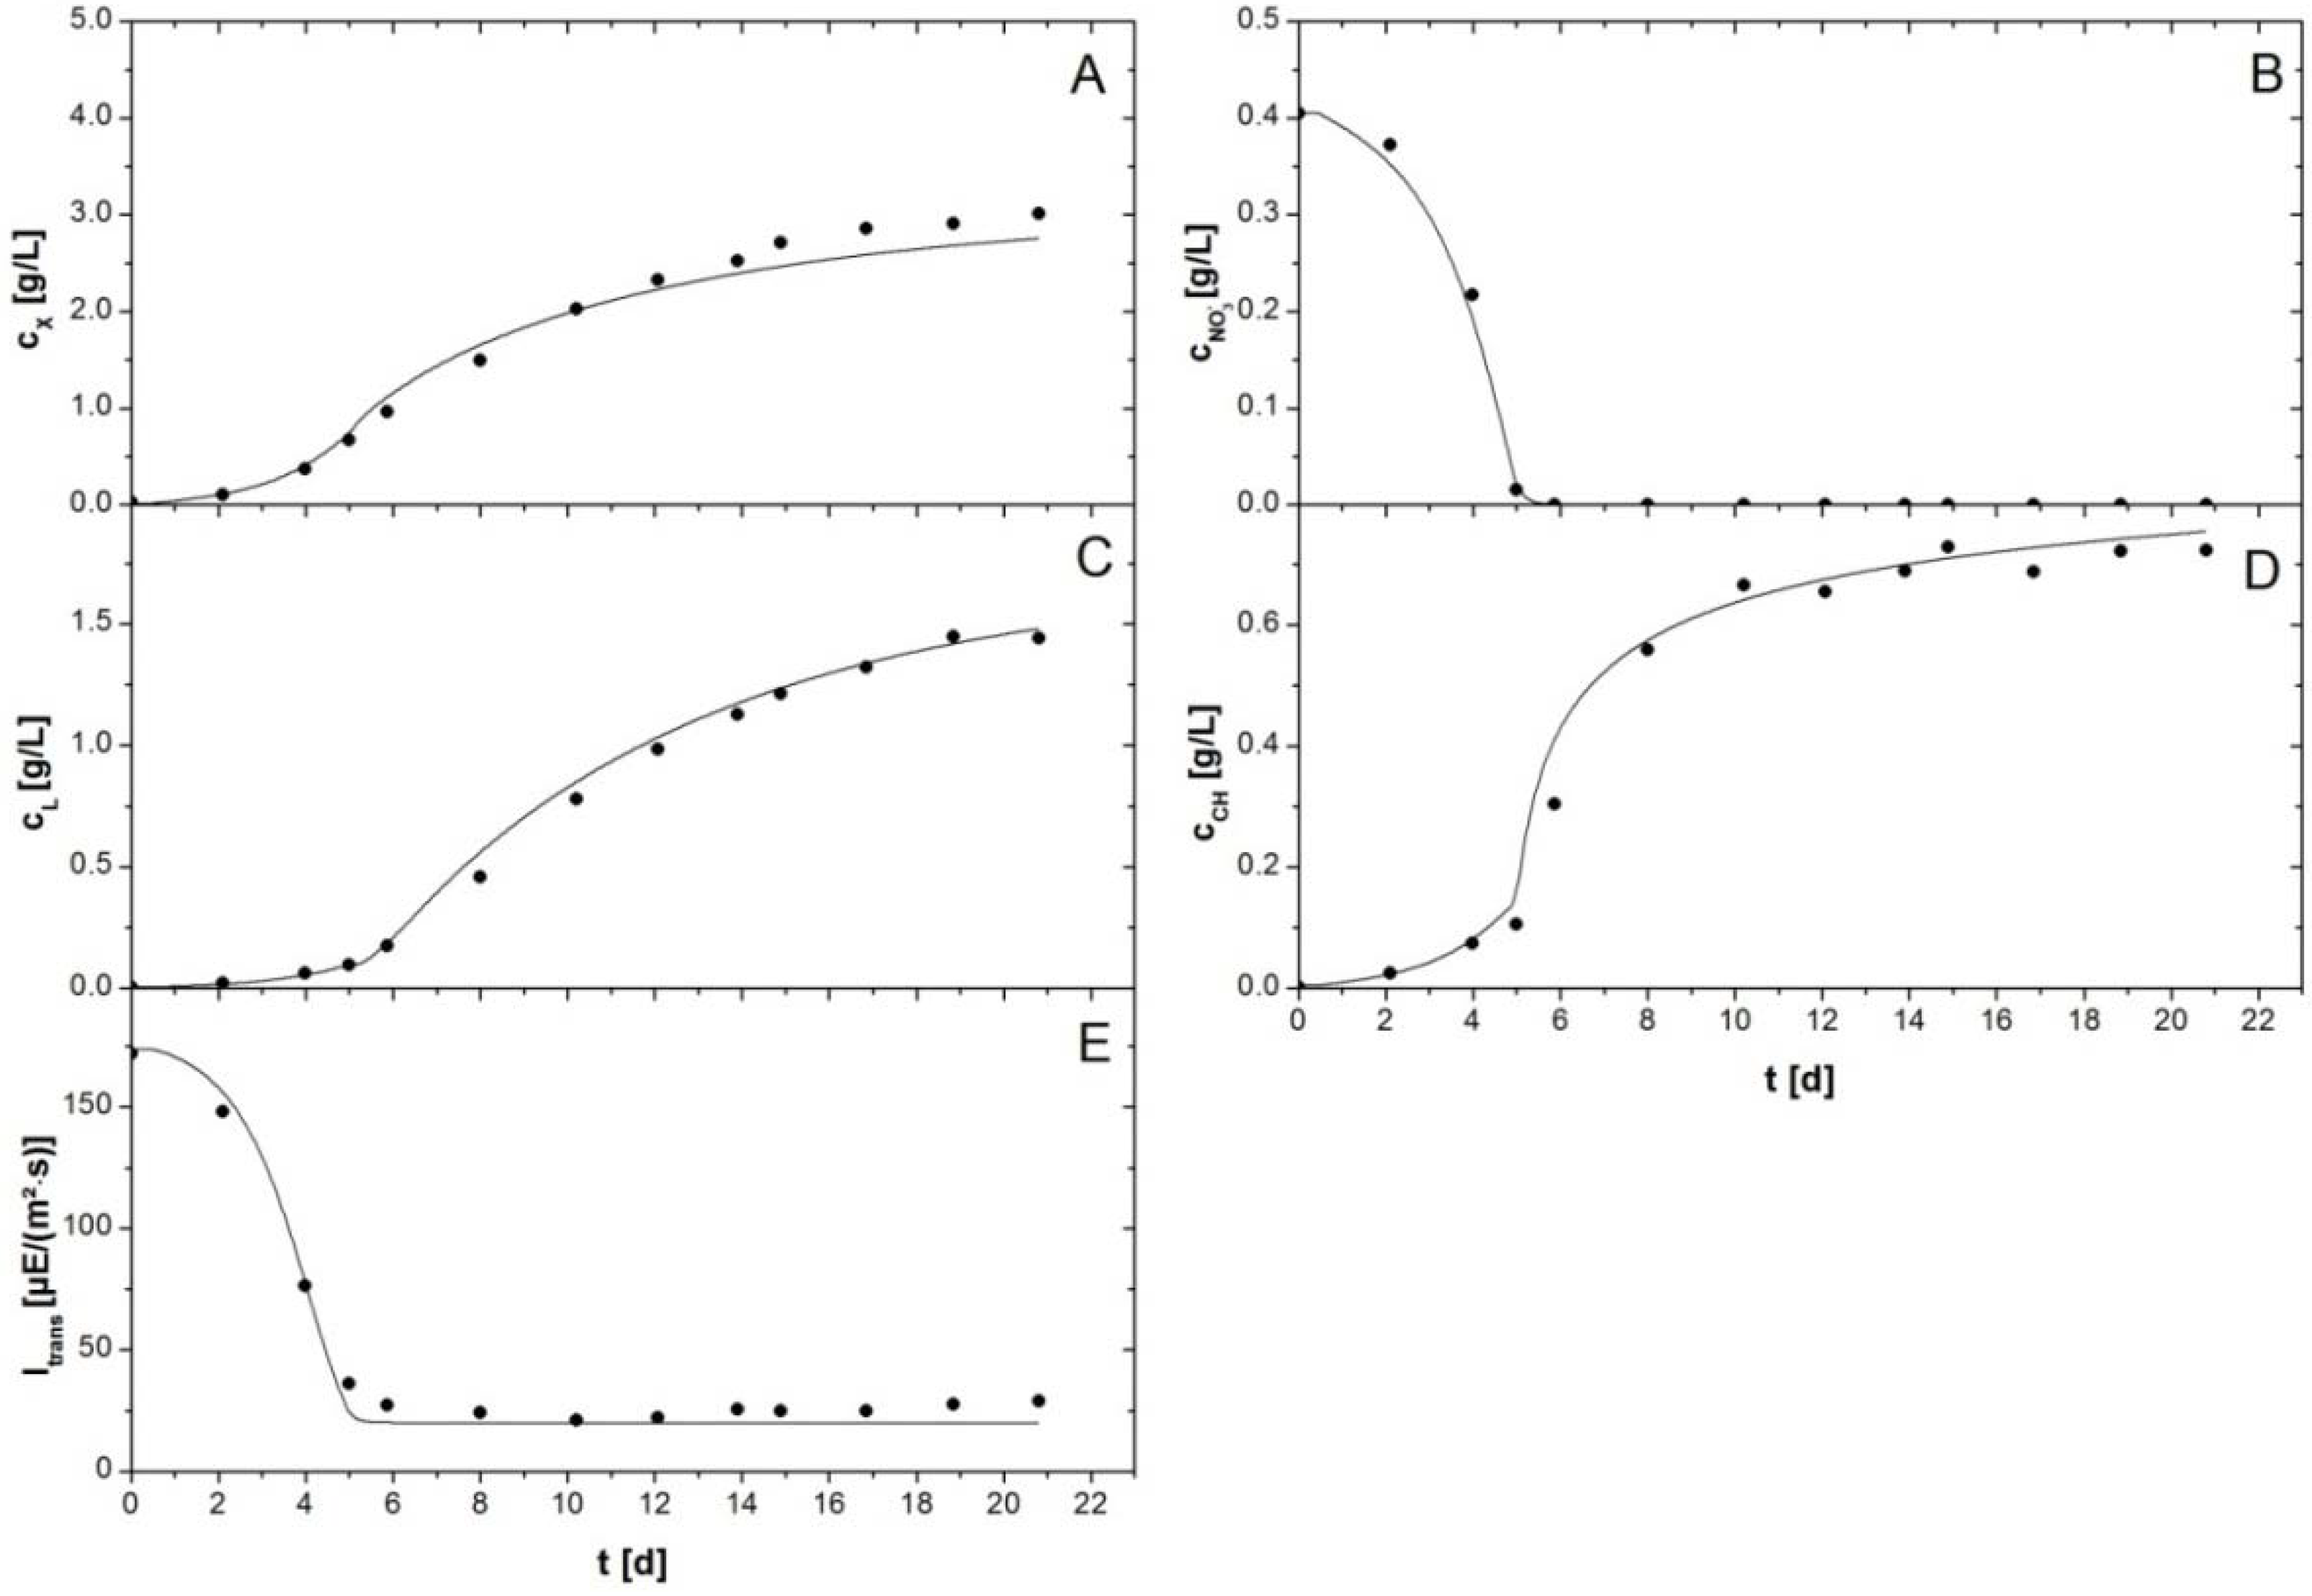
Figure 3 shows the fit with an experiment with an initial NaNO
3 concentration of 0.56 g/L. The experimental data show batch growth of
P. tricornutum in the flat plate reactor. After a short lag phase the biomass was growing exponentially until nitrate concentration in the culture medium was depleted (
Figure 3B). Subsequently, a shift was observable, since carbohydrates started to accumulate quickly from initially ca. 0.15 g/L to more than 0.7 g/L (
Figure 3D). Biomass growth rate was slightly reduced in this stage. At the same time an increase in lipid productivity occurred. This was observable because lipid concentrations increased faster after onset of the limitation (
Figure 3C). Lipid concentration increased from less than 0.2 g/L before onset of the nitrogen limitation to almost 1.5 g/L until the experiment was stopped at day 21. Due to the experimental procedures TAGs could not be discriminated from membrane lipids so that total lipid concentrations are given in
Figure 3 and
Figure 4. In the simulation they were calculated as sum of membrane lipids (from active biomass) and TAG concentrations. The transmission of photons through the culture was initially high, but decreased in the same manner as biomass grew. However, when growth of active biomass stopped because of the nitrogen limitation the transmission did not continue to decrease. Complete absorption of light was not achieved. Transmission stayed at a level of ca. 25 µE/(m
2·s) throughout the remaining days of the cultivation (
Figure 3E). The experimental data and simulation were in good correspondence. The model was able to describe both exponential growth of the algal culture and storage molecule accumulation in the subsequent limitation. Notably, simultaneous accumulation of both storage molecules took place in cultures of
P. tricornutum. The linear programming approach was able to predict this accurately (
Figure 3C,D). Adjustment of the parameters resulted in a description of light absorption Equation (2) with the parameters
a = 1.93 × 10
−1 m and
b = 1.62 × 10
−2 m
2/g. Parameters of Equation (15) were
= 2.1∙
,
= 1.2∙
, and
n = 4.25.
Figure 3.
Batch cultivation of P. tricornutum with a NaNO3 starting concentration of 0.55 g/L. Symbols indicate experimental data. Lines represent simulated data. (A) Biomass concentration ; (B) Nitrate concentration ; (C) Lipid concentration comprises concentration of membrane lipids and TAGs, (D) Carbohydrate concentration comprises concentrations of functional and storage carbohydrates; and (E) Irradiance of transmitted light .
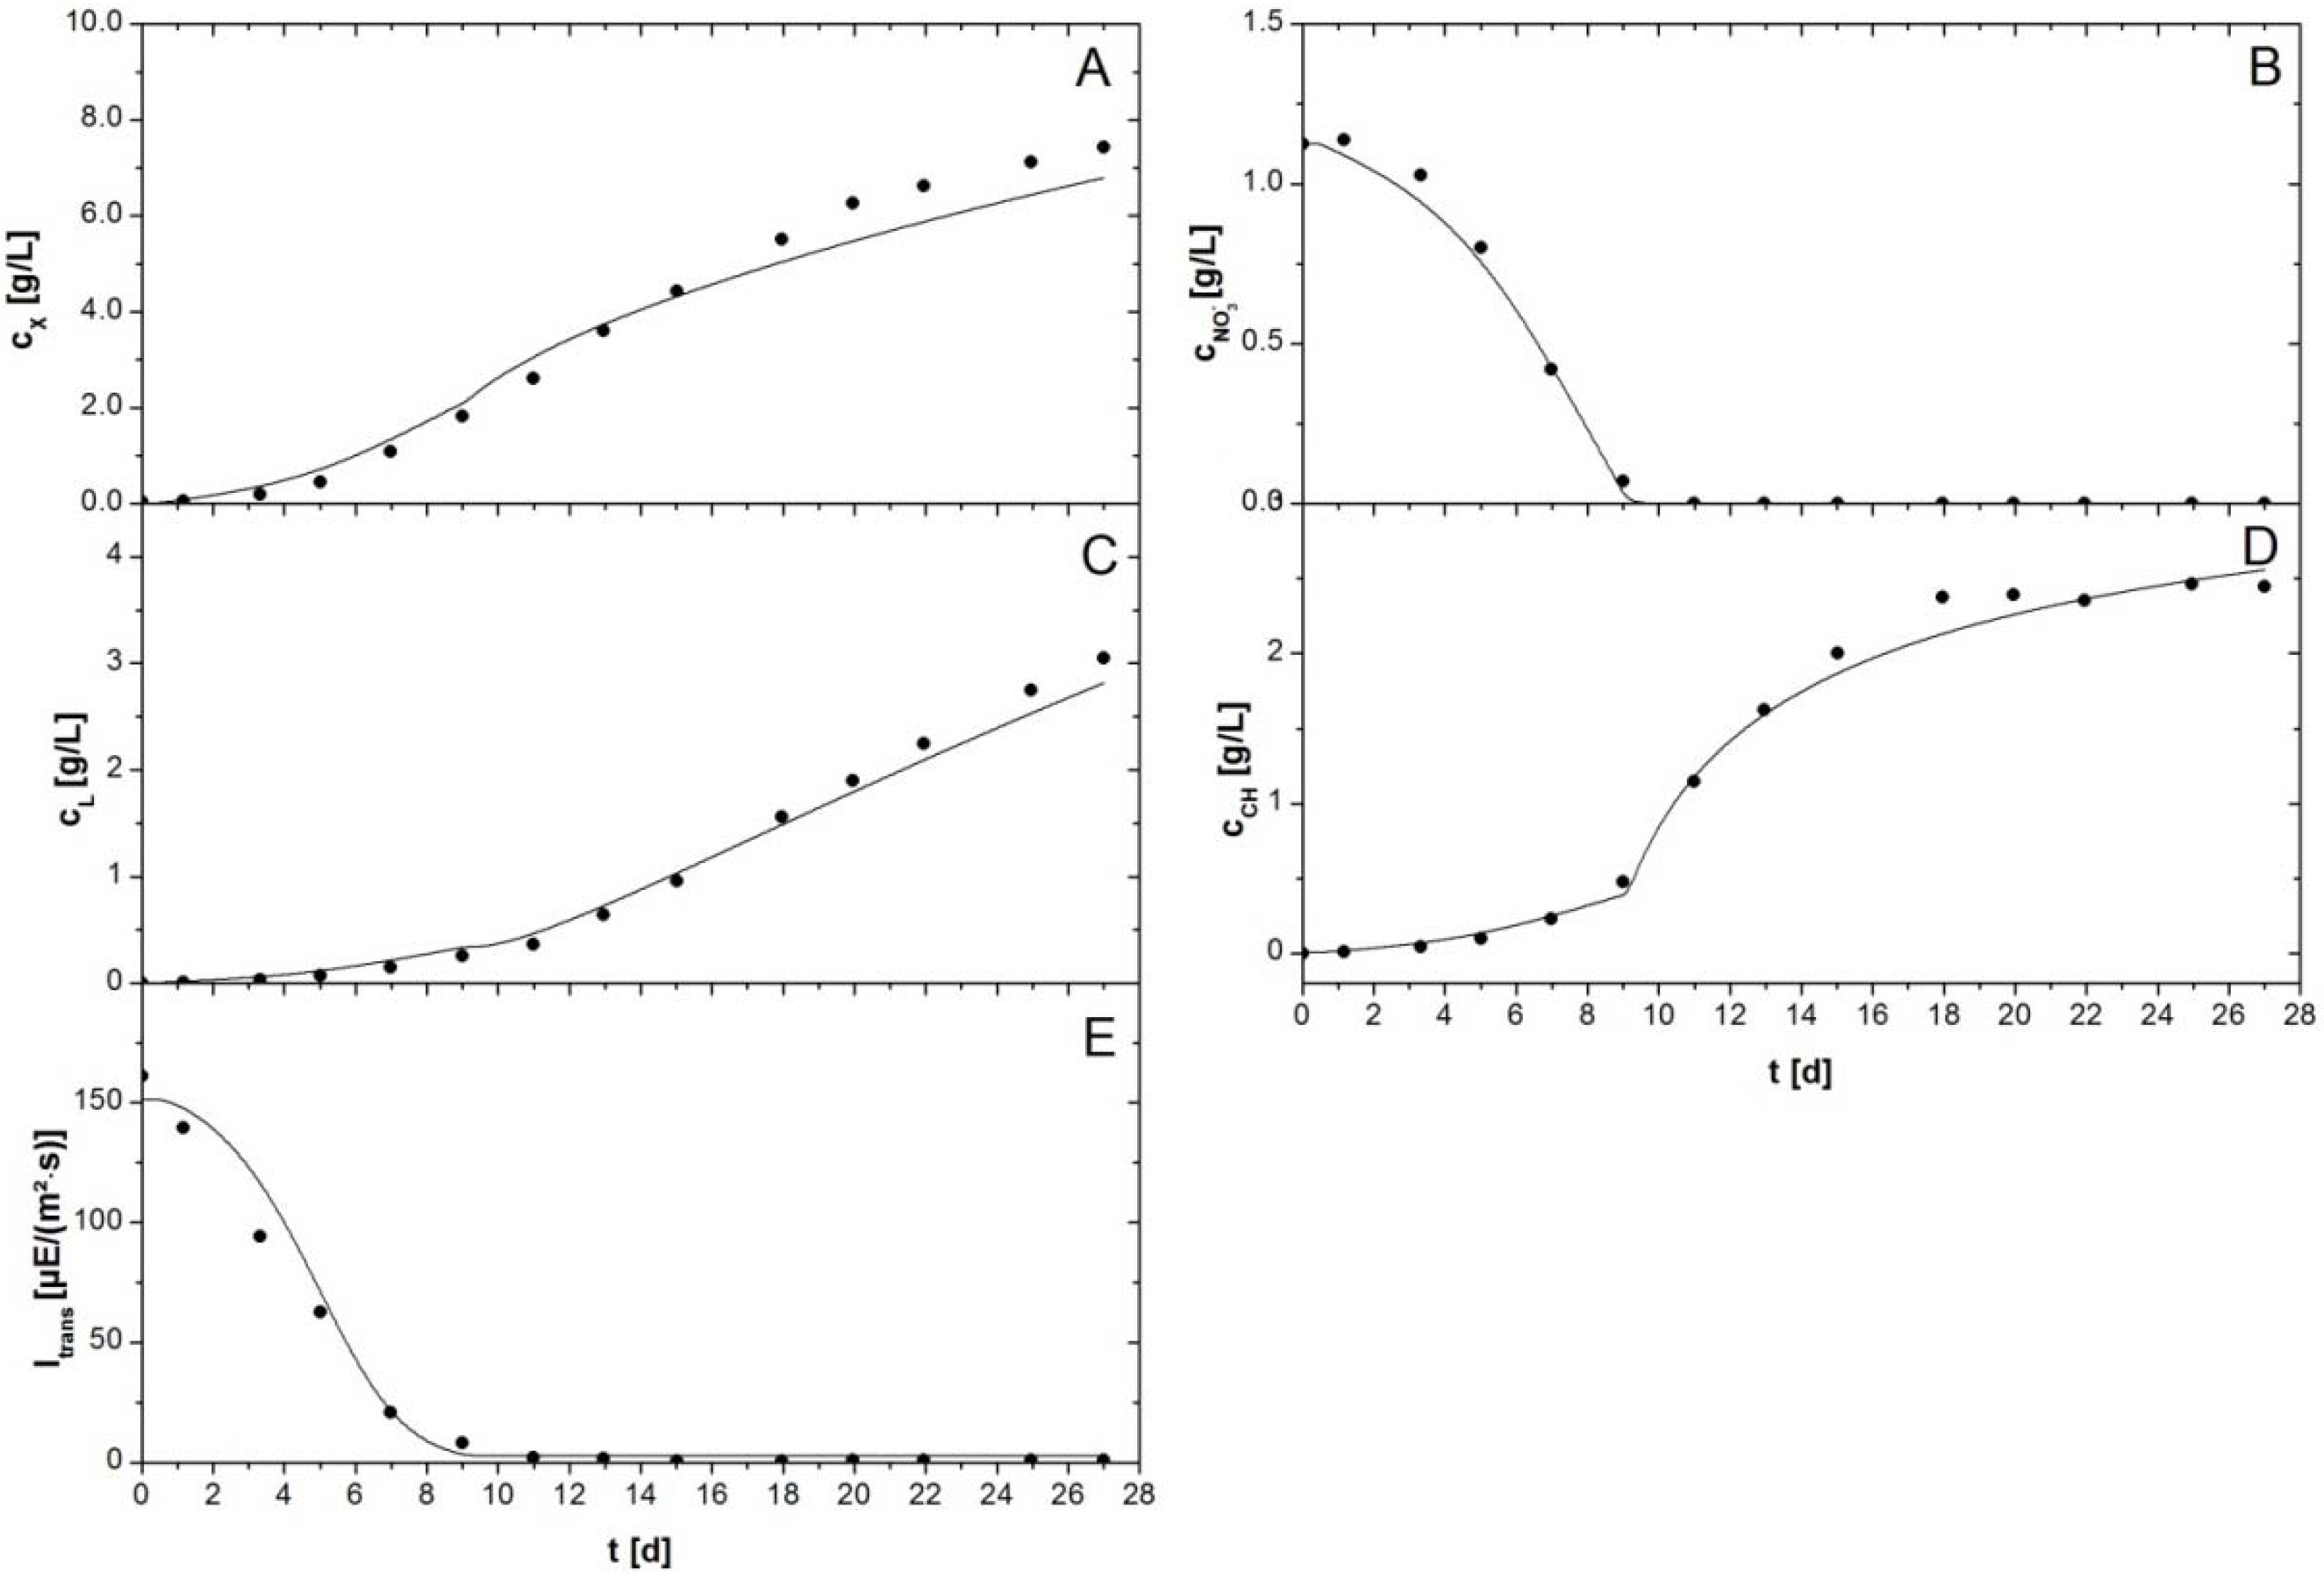
Figure 4.
Batch cultivation of P. tricornutum with a NaNO3 starting concentration of 1.56 g/L. Symbols indicate experimental data. Lines represent simulated data. (A) Biomass concentration ; (B) Nitrate concentration ; (C) Lipid concentration , comprises concentration of membrane lipids and TAGs; (D) Carbohydrate concentration , comprises concentrations of functional and storage carbohydrates; and (E) Irradiance of transmitted light .
Table 2.
Parameters of the validation experiments.
Table 2.
Parameters of the validation experiments.
| Experiment | A [m] | B [m2/g] | | | n |
|---|
| Equation (2) | Equation (2) | Equation (15) | Equation (15) | Equation (15) |
|---|
| 0.55 g/L NaNO3 | 1.93 × 10⁻¹ | 1.62 × 10⁻² | 2.1· | 1.2· | 1 |
| 1.56 g/L NaNO3 | 8.2 × 10⁻² | 6.39 × 10⁻³ | 3.5· | 2.2· | 4.25 |
The biomass concentration was slightly underestimated at high biomass concentrations (>2.5 g/L). The deviation of experimentally measured biomass concentration and simulation data at the very end of the simulation was 8%. This could result from inaccuracies of the measurement of either compound or accumulation of a compound different from lipids or carbohydrates, which was not measured with the described methods. All other data were described more precisely with the simulation.
In order to test for validity of the model, a second batch cultivation with an initial NaNO
3 concentration of 1.56 g/L was simulated and compared to the associated experimental data. The results are depicted in
Figure 4. The principal evolution of all concentrations was comparable to that observed in the experiment depicted in
Figure 3. The biomass was growing exponentially until nitrate was entirely consumed in the culture medium at day 9. Concentrations of carbohydrates and TAGs started to increase abruptly and increased ca. 5–6 fold until the experiment was stopped at day 27. In contrast to the experiment with a starting concentration of 0.55 g/L sodium nitrate the light was completely absorbed by the culture at the onset of the cultivation. Consequently, transmission stayed on a very low level until the end of the experiment.
The mathematical model was able to describe biomass growth, lipid and carbohydrate accumulation as well as light absorption and nitrate uptake accurately. Only biomass concentration showed again a deviation of ca. 8% towards the very end of the cultivation. It was remarkable that lipid accumulation was only restricted by the energy balance, and therewith by the availability of ATP and NADPH. The lipid concentration followed a linear regime (
Figure 4C) and TAGs accumulated with a constant productivity until the end of the experiment. The application of saturation kinetics for TAG accumulation was redundant in this case. Variation of
in the model did not influence the outcome of the simulation, but simply needed to exceed a value of 3.5
to describe experimental data accurately. All other parameters (see
Table 2) were
a = 8.2 × 10
−2 m,
b = 6.39 × 10
−3 m
2/g in Equation (2),
= 2.2∙
, and
n = 4.25 in Equation (15).
2.9. Suitability and Implications of the Process Model
The purpose of the here presented metabolic modeling was the mathematical description of the physiological behavior and in particular the storage molecule accumulation of the algae strain P. tricornutum as response to a nutrient limitation. The focus of the model was the incorporation of the linear programming approach and application to stress-inducing physiologic conditions. With this approach it was demonstrated that microalgal growth can be modeled by maximization of energy conversion to yield biomass taking account of restrictions imposed by nutrient availability and light intensity.
Major determinant of the growth of algae is light. Light absorption determines the rates of ATP and NADPH supply for the cultures and therewith restricts growth. Beside the intensity impinging on the photobioreactor the absorption of light is mainly determined by the mutual shading of cells. The latter is influenced by the biomass concentration, but also affected by the scattering of light. Moreover, cells adapt their intracellular content of pigments according to the light intensity that the cells perceive [
35]. Since these processes are complex and their mathematical description was not readily available in literature, a simplification was introduced into the model by describing the light gradients within the reactor as exponential decrease of the light intensity along the light path. Since the accumulation of lipids and carbohydrates did not significantly change the overall absorption properties of the cultures, as shown by the constant intensity of transmitted light during the nutrient-limited growth stage (
Figure 3), the calculation of the extinction coefficient in Equations (1)–(3) were based on the concentration of active biomass instead of total biomass. This approach required the introduction of additional parameters. However, one dataset, the flux density of transmitted light, was available for each individual experiment. Therefore, the parameter adaption did not decrease the relevance of the model, but served simply to decouple light absorption from the remaining model.
The subsequent conversion of absorbed light to the energy carrier molecule ATP and the reduction equivalent NADPH was described by two different approaches. The Model presented by Camacho Rubio
et al. [
22] gives a mechanistic description of the light absorption by photosynthetic units. However, the introduction of photoinhibition complicated the model. Therefore, a second approach was followed by simple efficiency considerations. Efficiency could be derived from the dependence of growth rates from light intensity. Both approaches represented viable ways to calculate the efficiency of photon capture and energy conversion in photosynthesis. By comparison of the two approaches a higher certainty was achieved with regard to the modeling of ATP and NADPH generation in the “photosynthesis” block of the model. The determination of the rates
and
was of critical importance for the model, since the energy restrictions limit growth and storage molecule accumulation throughout the entire process. A further improvement could potentially be achieved by the incorporation of cyclic electron transport into the simulation. This would be relevant for very high irradiances but was neglected in the work presented here.
By introduction of a simplex algorithm the allocation of resources, ATP, NADPH and nutrients, was described by the model and rates of synthesis were calculated for all major compounds. In this respect the stoichiometric equality constraints, or mass balances, alone were not sufficient to calculate rates of synthesis and nutrient uptake because the system was underconstrained. Additional kinetic restrictions, formulated as inequality constraints, were necessary to solve the optimization algorithm. The simulation finally demonstrated that modeling was accurate, even though not all kinetic data were exactly quantified, e.g., the maximum nutrient uptake rates.
A major simplification was made by the assumption of an invariable composition of the functional fraction of biomass. The ratio of macromolecular compounds of cells is subject to variation within certain limits. However, data from ion chromatography indicated that yield coefficients for the active biomass are constant. This was recorded throughout single cultivations for the salts containing sulfur and nitrate [
19]. Furthermore, yield coefficients were identical when different cultivations with varying starting concentrations of the salts were compared. The simulation confirmed that the assumption of a constant composition of active biomass was valid. The composition of total biomass on the other hand drastically changes during storage molecule accumulation and by association also the mass fraction of the respective elements in total biomass [
36].
The model demonstrated the ability to describe simultaneous synthesis of carbohydrates and lipids, especially at the onset of the limitation. Nevertheless, the incorporation of empiric saturation kinetics in Equation (15) was necessary in this respect to account for more complex processes inside the cells. Even though NADPH and ATP is abundantly available when very high concentrations of carbohydrates and lipids occur simultaneously, the cells synthesis rates are restricted by the kinetic restrictions given in Equation (15). The model postulates that the synthesis and consumption of NADPH and ATP equate at every time. The excess of NADPH and ATP is mathematically compensated by the adaption of the maintenance energy requirement of the cells. The latter is part of the optimization task including the respective rates. An upper limit for the accumulation of carbohydrates and lipids is most likely imposed by spatial restrictions or solubility of carbohydrates. Moreover, unfavorable thermodynamics for balance reactions with the accumulation of products, as well as a high turnover of the pool of triacylglycerol [
31] might be further reasons for decreasing rates of carbohydrate and lipid synthesis at high concentrations. In case of a high turnover of the storage molecules, rates of their synthesis would decrease because of the higher energy requirement. In the simulation, however, an additional term that accounts for compound turnover was not foreseen, if nothing else because it would be hard to experimentally quantify. Nevertheless, it is partially comprised in the terms for maintenance requirements in Equations (11) and (12). Moreover, saturation might be explained by accumulation of carotenoids towards the end of the process. It was indeed experimentally observed towards the end of experiments (data not shown). A higher content of carotenoids could result in higher energy dissipation by non-photochemical quenching [
37]. This would necessarily lead to a decrease of storage molecule accumulation, since photosynthetic regeneration of ATP and NADPH was reduced. In conclusion, the model is not able to explain whether the excess of ATP and NADPH does not even occur because of energy dissipation by protective carotenoids or a higher energy requirement exists because of turnover of molecules at very high concentrations of lipids and carbohydrates. Nevertheless, such conditions only occur at extremely high storage molecule concentrations and would require further experimental investigation.

