Article

Emergy Evaluation of the Urban Solid Waste Handling in Liaoning Province, China

State Key Joint Laboratory of Environment Simulation and Pollution Control, School of Environment, Beijing Normal University, Beijing 100875, China
*
Author to whom correspondence should be addressed.
Energies 2013, 6(10), 5486-5506; https://doi.org/10.3390/en6105486
Submission received: 31 July 2013 / Revised: 10 October 2013 / Accepted: 14 October 2013 / Published: 22 October 2013
(This article belongs to the Special Issue Large Scale LUCC, Surface Energy Fluxes and Energy Use)

Abstract

:
Waste management is a distinct practice aimed at reducing its effects on health and the environment and increasing energy and material recovery. The urban waste management industry has been slow to adopt new technologies, such as sanitary landfills and incineration, which enable better treatment results. The aim of a thorough ecological-economic evaluation of different treatment technologies is to extract the maximum practical benefits from investments and to ensure the minimum environmental impacts of wastes. This paper compares four garbage treatment systems, including sanitary landfills systems, fluidized bed incineration system, grate type incineration system and the current landfills system in Liaoning Province, China. By considering the economic and environmental impacts of waste treatment and disposal, impact of emissions, and contribution of wastes input, this paper constructed an emergy-based urban solid waste model for evaluating the sustainability of the holistic systems. The results in Liaoning indicate that the human health losses caused by the harmful air emissions are ranked in this order: fluidized bed incineration > grate type incineration > current landfills > sanitary landfills, while the ecosystem losses are ranked: grate type incineration > fluidized bed incineration > sanitary landfills > current landfills. The electricity yield ratios are ranked: grate type incineration > fluidized bed incineration > sanitary landfills > current landfills. Taken together this suggests that in considering the incineration option, decision makers must weigh the benefits of incineration against the significant operating costs, potential environmental impacts, and technical difficulties of operating. Emergy analysis of the urban solid treatment systems can provide a set of useful tools which can be used to compare the comprehensive performances of different waste treatment processes for decision-making and optimizing the whole process.

1. Introduction

The environmental pollution and waste of resources caused by garbage has become one of the major challenges of urban development [1]. The principle of “harmlessness, reduction, resource” has become an inevitable trend for the disposal of municipal solid waste. A proper waste management policy should be developed based on the principles of sustainable development, according to which our refuse should not simply be regarded as something to eliminate but rather as a potential resource to be recycled [2]. Therefore, an integrated waste management evaluation is needed.
The traditional methods of residential garbage disposal include landfilling, combustion, and composting. Methane gas generated from landfilling can be combusted to produce heat, which in turn can be used to generate electricity. Waste can be directly incinerated or combusted to produce energy. Waste materials can be converted or recycled as fertilizer through composting [3]. Each city adopts different processing techniques in accordance with their respective requirements and related policies. For instance, in Saskatoon (Saskatchewan, Western Canada), methane gas generated by the landfill site is collected and piped to the city’s main power plant in order to substitute natural gas for power generation. The composting plants in the city of Edmonton (Alberta, Western Canada) have combined the organic sediments in the household waste and waste water to produce compost through special processing, recovering 70% of the organic material [4] and thus the residential garbage is no longer sent to landfill sites. Germany and the United States have pioneered garbage power generation. In 1965, West Germany built seven waste incinerators, burning 7.81 thousand tons of garbage per year, and benefiting a population of 245 million. In 1985, the number of waste incinerators increased to 46, and burned 810 thousand tons of garbage per year, providing power to 21,200,000 people, and benefiting 34.3% of the total population. By the end of 2007, there were a total of 300 garbage incinerators in France, which can burn 40% of the urban waste. At present, a comprehensive garbage disposal system has been built in Paris, including four waste incineration plants. The processed waste has reached more than 1.7 million tons per year, producing 200,000 tons of oil equivalent energy steam for the city of Paris [5].
The United States has invested $7 billion in the construction of 90 waste incineration plants since the 1980s. The total annual garbage capacity has reached 30 million tons, and 402 new incineration plants were built in the 1990s [6]. Japan is the country with the highest proportion of urban residential garbage incineration. In view of the dependence on incineration for waste treatment, Japan is actively developing technology aimed at reducing its amount of waste residue for landfilling [7]. Its short-term waste management objectives are reducing waste growth rate, increasing the proportion of waste recovery and enhancing residue utilization and thermal energy utilization. However, this needs to be evaluated specifically for decision-making.
In recent years, some thermodynamic methods have been applied to analyze the performances of various systems. For example, material/energy flow analysis has been carried out in waste treatment systems [8,9,10], which has been among the central methodologies in ecology [11]. Parallel to Material and Energy Flow Analysis, exergy flow analysis with exergy joule serving as the unitary measurement, integrating systematical analysis and the concept of exergy, has been adopted gradually in the waste field, especially in resource accounting and environmental impact assessment of various integrated systems [12,13]. Following the paradigm of Extended Exergy derived by Sciubba and co-workers [14,15,16], which is used to calculate the real environmental cost of a system and a process, the emergy based assessment by Odum [17] is parallel to integrate the flows of social economy. In fact, emergy can serve as a real general measure of all factors, including material, energy, labor/capital as well as environmental impacts.
Emergy, with an “m”, is an accounting methodology used to calculate the total amount of energy, in terms of energy from the sun, that is required to create a product. Emergy analysis facilitates the comparison of diverse economic and ecological goods and services in common units. It’s therefore a tool well suited to evaluating the relative sustainability of the waste treatment systems. Zhang et al. [18] constructed a general sewage treatment ecosystem concept which integrated a wastewater treatment system and its by-products disposal system, and then proposed an improved eMergy-based indicator for assessing its sustainability. Cherubini et al. [19] assessed management alternatives for urban solid waste (USW) in Rome (Italy) under a multi-criteria multi-scale assessment, in which recycling showed a better performance than landfill and incineration. Yuan et al. [20] demonstrated that the close-loop recycling option is better than the open-loop recycling option for construction and demolition waste in terms of the integration of social, environmental and sustainable aspects. Zhang et al. [21] evaluated the impacts of wastes exchanges on the sustainability of a sulfuric acid production system and a titanium dioxide production system in Pan-zhi-hua City in China through several emergy indicators. Song [22] undertook a combined approach of emergy analysis and life cycle assessment (LCA) to quantitatively investigate the effectiveness of an e-waste treatment trial project in Macau. In the emergy analysis, we also introduced two new indices (emergy recovery and technical efficiency) in order to evaluate the technical level of e-waste treatment in Macau. Studying scenarios for USW handling in São Paulo Municipality (Brazil), Mendes et al. [23] pointed out that when biodegradable wastes are diverted for composting or biogasification and only the non-organic fraction is landfilled, a significant reduction in environmental impacts is observed from a life cycle inventory perspective. Agostinho et al. [24] assessed the São Paulo’s Sorting and Composting Waste Treatment Plant using emergy accounting.
Most of these studies, however, did not focus on the impact of emissions on ecosystem and human integrity, although some important steps ahead have been made by some authors. Ulgiati et al. [25] first pointed out that the impact of emissions on natural and human-dominated ecosystems requires additional emergy investment to take care of the damage or altered dynamics and make a system or process sustainable. Ulgiati and Brown [26] calculated the additional emergy for the environmental services required to dilute emissions, without considering atmospheric diffusion and chemistry. Hau and Bakshi [27] first proposed the use of disability adjusted life years (DALYs) from the Eco-Indicator 99 impact assessment method (E.I. 99) to evaluate the impact of emissions on human health by using ecological cumulative exergy consumption (ECEC) analysis. Brown and Ulgiati [28] used the emergy method to suggest a system view to ecosystem’s integrity and also assess the emergy investment needed to restore ecosystem health. Lei and Wang [29] tracked the waste treatment processes and calculated the emergy values of the fly ash and slag in Macao, as a result of the incineration of municipal solid waste. Zhang et al. [30] integrated dilution and Eco-Indicator 99 methods to evaluate the sustainability of Chinese steel production. The research on a single industry was proposed by these authors as an initial case of future applications on a regional scale. Therefore, considering cities as a multi-industry integrated system, emergy-based city studies should investigate the global impacts of emissions and integrate them into the set of existing emergy indicators in order to provide suitable and scientifically based information for cost-effective abatement strategies and policy decisions. In seeking an effective model in the analysis of pollutants, other authors developed hybrid LCA-based methodologies [31], where emissions are characterized by end-point impact factors related to human and ecosystems health. The goals of this study were to construct a general urban solid waste treatment metabolic system concept based on the emergy method. The case study can provide beneficial suggestions for the local integrated urban solid waste management.

2. Methodology

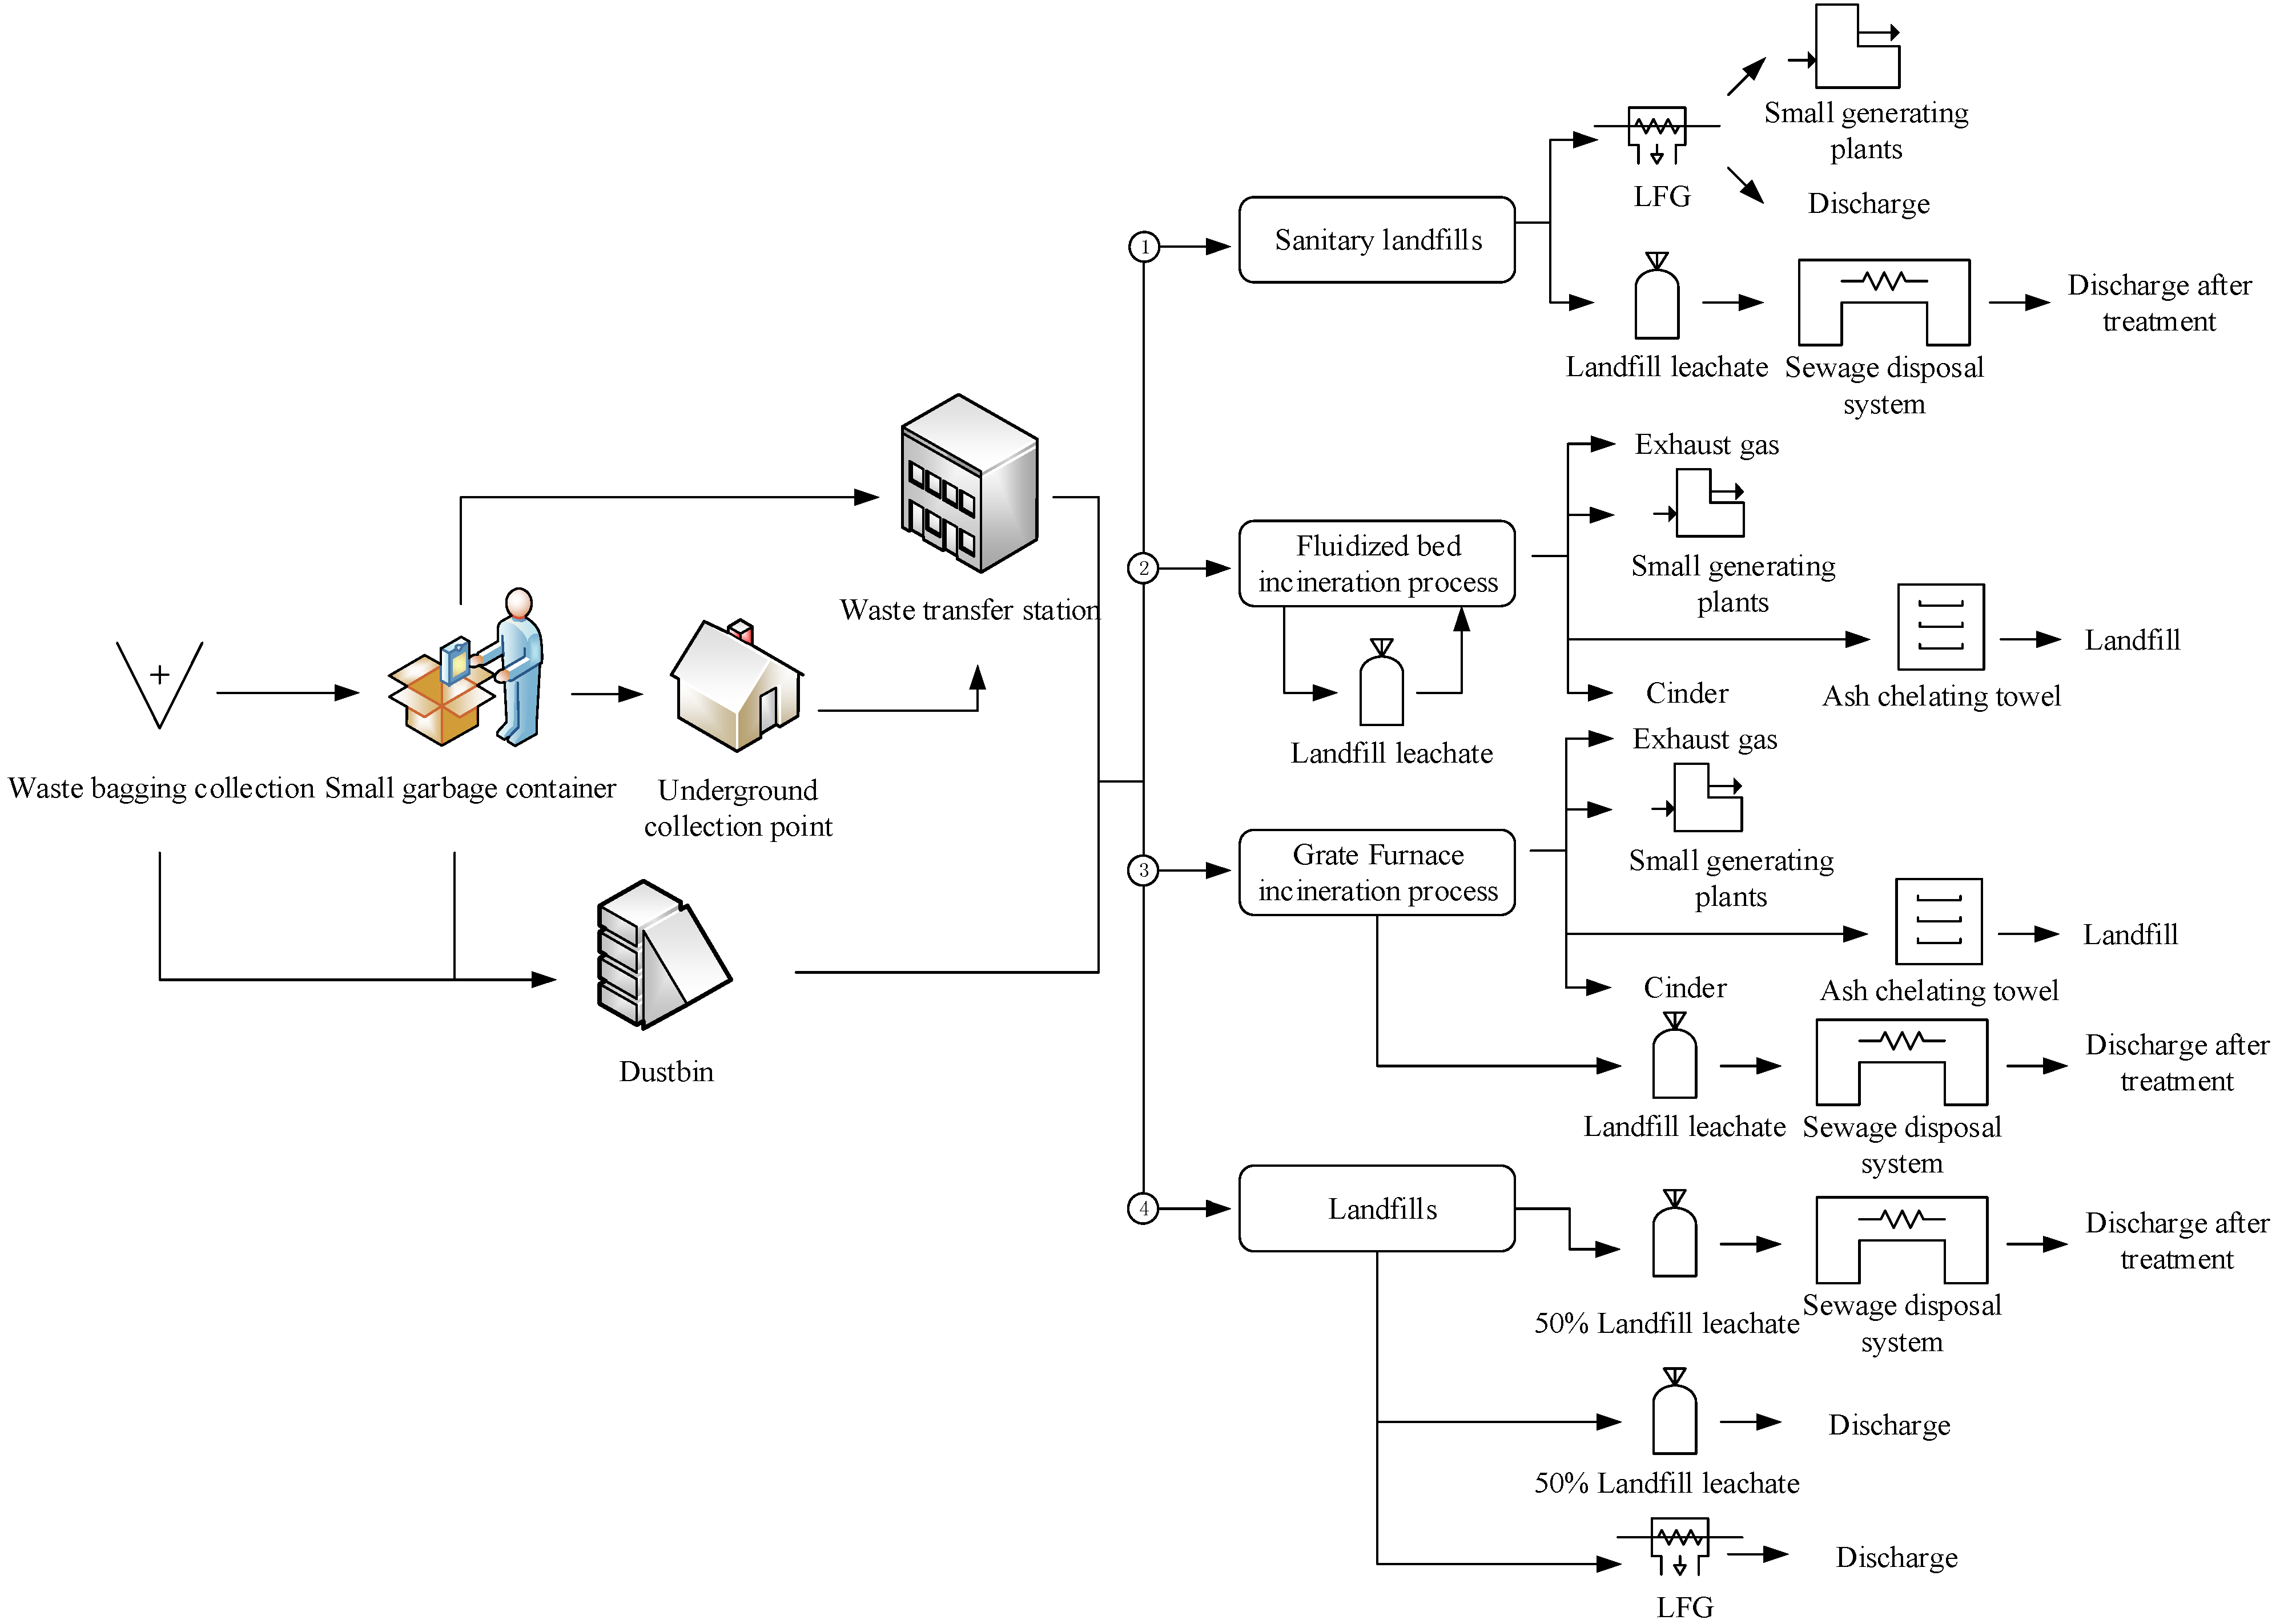
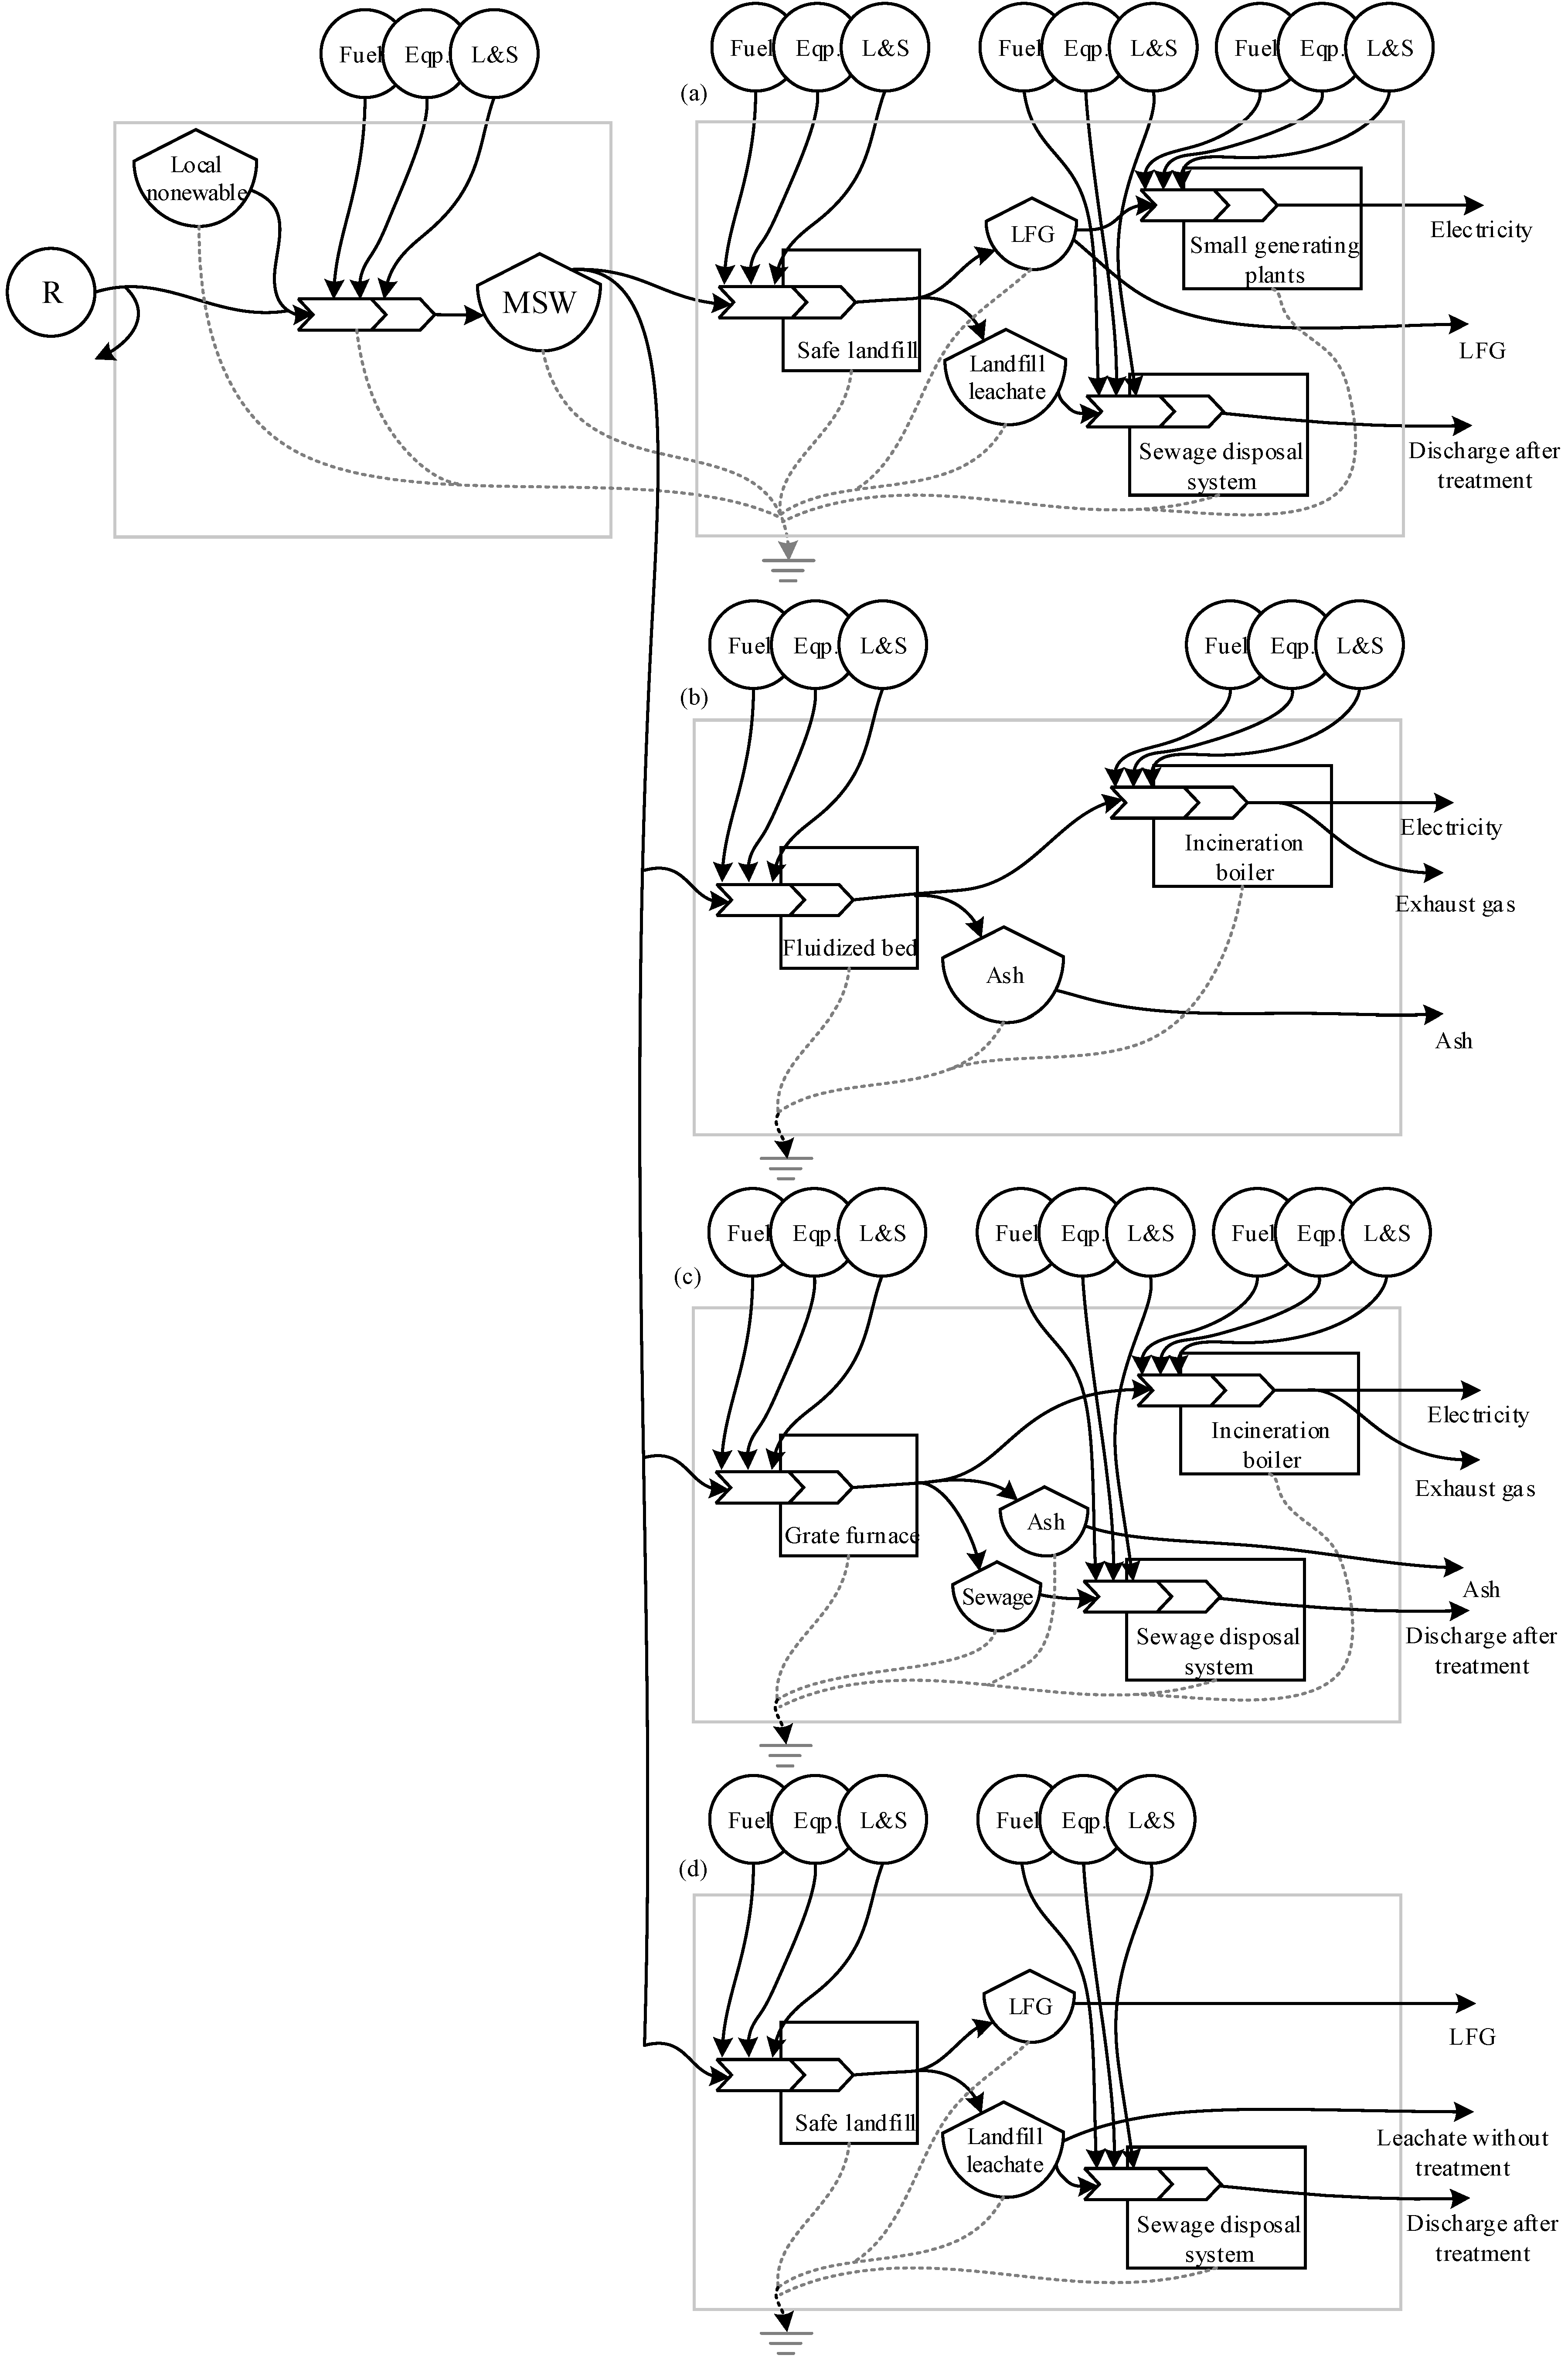
2.1. Description of the Present Urban Solid Treatment System in Liaoning

Liaoning is located in the southern part of China’s Northeast. Its nominal GDP for 2011 was 2.20 trillion yuan (ca. US$348 billion), making it the 7th largest in China (out of 31 provinces). After years of institutional and structural reforms, Liaoning Province abolished its Municipal Sanitation Bureau in 2000. The governmental function of sanitation work has also been incorporated into the Municipal Administration Commission. Currently, Liaoning residential garbage management agencies mainly consist of four departments: Municipal Administration Commission, Sanitation Service Centers at the district and county levels, Sanitation Management Departments at the district and county levels under the Municipal Administration Commission and Municipal Professional Sanitation Operating Units. The Municipal Administration Commission includes the Department of City Appearance Environmental Management, Public Institutions and the Department of Sanitation Facilities Management.
In 2011, the domestic waste treatment plants were initially developed to treat about 1.01 Mt per day generated by 16,585,459 inhabitants. Usually, the household urban waste is packed in plastic bags and left in waste containers, from which the waste is taken by a collection team (official manual collection and special trucks for compaction, as well as unofficial scavengers collecting recyclable materials. The formal waste collection system is formed. Some researchers have pointed out that the informal recycling of waste by scavengers not only constrains profits of the formal system, but also pollutes the environment if toxic substances leak when waste is not properly disposed of [32]. After collection, the waste can be handled in conventional ways in simple landfills (without leachate/sewage disposal systems), sanitary landfills, or incineration. Figure 1 shows that while the major amount of USW in Liaoning (80.5% in wet weight) is taken to simple landfills and sanitary landfills, only 7.5% is incinerated (45% by fluidized bed incineration and 55% by grate furnace incineration). Additionally, only 6.9% rather than 13.5% of the total USW is being effectively recycled (including biotic and abiotic materials).
Figure 1. Flowchart of urban solid waste destinations in Liaoning.
Energies 06 05486 g001

2.2. Emergy Accounting

Emergy is defined as the total amount of available energy of one form that has been originally used up, directly and indirectly, in the work of making a product or service [17]. The unit of emergy representing energy in Joules is named solar emergy Joules (seJ). Emergy analysis categorizes the inflows of a system used to deliver a product or service by transformity. The transformity is defined as the emergy (in emJoules) of one kind of available energy required directly and indirectly (through all the pathways required) to make one joule of energy of another type. Transformity is the ratio of emergy to available energy. Transformity measures the position of each kind of energy in the universal energy hierarchy. The total emergy driving the system can be determined by adding up the emergy of all inflows, and is assigned to the product or service delivered (for details about the emergy algebra see references [33,34,35]). After all the flows of interest have been quantified, a set of indicators can be developed for policy making, by assessing the environmental performance of the system itself [26,36].

2.3. Evaluating the Impacts of Emissions

2.3.1. Quantifying Ecological Services

The treatment processes of three different kinds for pollutant discharges (i.e., airborne, waterborne and solid waste) that characterize urban systems are used to reduce discharges of pollutants into the environment and increase energy and materials recovery (reduce, reuse and recycle). After the waste treatment process, pollutants will be diluted or abated in order to decrease the concentration and potential harm to an acceptable level.
Many pollutant discharges after treatment are rendered harmless due to services provided by the ecosystem which dilute or abate the pollutant discharges to an acceptable concentration or state. The emergy value of these ecological services may be calculated from knowledge of the concentration and nature of the emissions, and the transformity conducted by the relevant ecological services. For example, the emergy required to dilute nitrogen dioxide in air may be determined with information about the concentration of the emissions, the acceptable or the background dilution concentration, and the dilution provided by wind.
Ecological services for diluting airborne and waterborne pollutants can be calculated as follows [26]:
M a i r / w a t e r = d × ( W * c )
where Mair/water is the mass of dilution air/water needed; d is the air/water density; W* is the annual amount of a given emitted pollutant after treatment; and c is the acceptable concentration from agreed regulations. The mass of air needed depends on meteorological conditions, including wind speed and stability. Using the “acceptable concentration” assumes that some pollution is acceptable. Instead, if the background concentration were used for “c”, this would have implied a pollution down to a level that is more or less the level before the industrial era. Many more environmental services would be needed than actually available, thus placing a constraint on the acceptability of emissions: no emissions that cannot be absorbed or abated by the environment. Once the dilution mass is known, the energy value of required environmental services is determined, by calculating the kinetic energy of the dilution air or the chemical energy of dilution water:
R w . a i r * = N K i n e t i c × t r a i r = 1 2 × M a i r * × v 2 × t r a i r
R w . w a t e r * = N C h e m . × t r w a t e r = M a i r * × ρ × t r w a t e r
R w * = Max ( R w . a i r , i * ) + Max ( R w . w a t e r , i * )
where NKinetic is the kinetic energy of air; v is average wind speed; trair is the transformity of wind; NChem. is the chemical energy of water; trwater is the transformity of water; and ρ is the thermal value coefficient.
It is worth mentioning that this method is proposed without considering—for the sake of simplicity—the diffusion and the chemistry of atmosphere and water and there is a latent premise used in this analysis that the available dilution air/water is enough (which may not be true and would place a limit to the emissions, as said above).

2.3.2. Quantifying Ecological and Economic Losses

A number of methods have been developed in previous studies for assessing the environmental impact of emissions. It would be one step ahead to integrate such methods within a procedure capable of describing and quantifying the actual damage to populations or assets in emergy terms, i.e., in terms of lost biosphere work. Examples of such natural capital and human capital losses are, for example, the decreased biodiversity due to pollution or ecosystem simplification or the economic losses related to damages to human health, land occupation and degradation, damage to human-made assets, among others.
Many environmental impact assessment methods have been integrated into the LCA software (such as SimPRO, GaBi). In this study, a preliminary damage assessment of losses is performed according to the framework of the Eco-Indicator 99 assessment method [37]. Such methods, like all end-point life cycle impact assessment methods, suffers from very large uncertainties intrinsically embodied in its procedure for assessment of final impacts. Yet, it provides a preliminary—although uncertain—estimate of impacts to be used in the calculation procedure of total emergy investment. Damages to natural capital are expressed as the Potentially Disappeared Fraction (PDF) of species in the affected ecosystem, while damages to human health are expressed as Disability Adjusted Life Years (DALY), according to refs [37,38,39]. Six kinds of environmental impacts are listed in Table 1, which include carcinogenic effects on humans, respiratory effects on humans caused by organic substances, respiratory effects on humans caused by inorganic substances, damages to human health caused by climate change, damage to ecosystem quality caused by ecotoxic emissions, and damage to ecosystem quality caused by the combined effect of acidification and eutrophication.
Using concepts from E.I. 99 (PDF and DALY) to quantify a process impact on ecosystems and human health has the advantage that the assessment relies on damages that can, in principle, be measured or statistically calculated. Unfortunately, the available data in these ecological models are restricted to Europe (in most cases to The Netherlands) and their application to assess other countries requires adjustments [30] and calls for urgent database improvement. Moreover, the dose-response relationship considered in the Eco-indicator-99 is linear instead of logistic [39]. The latter characteristics suggest the method can only be applied to slow changes of pollutants concentration and are not suitable for large emissions fluctuations like environmental accidents.
The impact of emissions on human health can be viewed as an additional indirect demand for resource investment. Human resources (considering all their complexity: life quality, education, know-how, culture, social values and structures, hierarchical roles, etc.) can be considered as a local slowly renewable storage that is irreversibly lost due to the polluting production and use processes. Societies support the wealth and relations of their components in order to provide shared benefits. When such wealth and relations are lost, the investment is lost and such a loss must be charged to the process calling for changes and innovation. The emergy loss can be calculated as:
L w , 1 * = m i * × DALY i × τ H
Here, L w , 1 * is the emergy loss in support of the human resource affected, i refers to the i-th pollutant, m* is the mass of chemicals released, DALY is its E.I. 99 impact factor and τH is the unit emergy allocated to the human resource per year, calculated as τH = total annual emergy/population. The rationale here is that it takes resources to develop the given expertise or work ability and societal organization. When it is lost, new resources must be invested for replacement (not to talk of the value of the individual in itself, that is not quantifiable in physical terms).
Table 1. List of emissions and environmental impacts based on a hierarchist perspective.
Impact categoryCAS no.GroupInitial emissionUnit1# DALY2# DALY3# DALY4# DALY5# PDF*m2*yr6# PDF*m2*yr
Carbon dioxide (CO2)124-38-9inorganicairkg---2.10 × 10⁻⁷--
Carbon Monoxide (CO)630-08-0inorganicairkg------
Nitrogen oxides (as NOx)11104-93-1inorganicairkg--8.87 × 10⁻⁵--5.71
Sulphur dioxide (SO2)7446-09-5inorganicairkg--5.46 × 10⁻⁵--1.04
Dust (PM10)-inorganicairkg--3.75 × 10⁻⁴---
Dinitrogen oxide (N2O)10024-97-2inorganicairkg---6.90 × 10⁻⁵--
Methane (CH4)74-82-8nonaromatic (alkane)airkg-1.28 × 10⁻⁸-4.40 × 10⁻⁶--
Mercury (II) ion14302-87-5metalfresh waterkg----1.97 × 10²-
Cadmium (II) ion22537-48-0metalfresh waterkg7.12 × 10−2---4.80 × 10²-
Chromium (III) ion16065-83-1metalfresh waterkg3.43 × 10−1-----
Lead (II) ion14280-50-3metalfresh waterkg----7.39-
Arsenic (V) ion17428-41-0metalfresh waterkg6.57 × 10−2---1.14 × 101-
Volatile phenol108-95-2aromaticfresh waterkg1.05 × 10−5-----
Cyanide-aromaticfresh waterkg4.16 × 10−5-----
Chemical oxygen demand (COD)-organicfresh waterkg------
Oil-organicfresh waterkg2.29 × 10−4-----
NH4-N14798-03-9inorganicfresh waterkg------
Notes: 1# Carcinogenic effects on humans; 2# Respiratory effects on humans caused by organic substances; 3# Respiratory effects on humans caused by inorganic substances; 4# Damages to human health caused by climate change; 5# Damage to Ecosystem Quality caused by ecotoxic emissions; 6# Damage to Ecosystem Quality caused by the combined effect of acidification and eutrophication.
PDF is the acronym for Potentially Disappeared Fraction of Species (Eco-Indicator 99 [37]). Such effects can be quantified as the emergy of the loss of local ecological resources, under the same rationale discussed above for the human resource:
L w , 2 * = m i * × PDF ( % ) i × E B i o
Here L w , 2 * is the emergy equivalent of impact of a given emission on urban natural resource, while PDF(%) is the fraction potentially affected, measured as PDF × m2 × yr × kg−1. A damage of one in E.I. 99 means all species disappear from one m2 during one year, or 10% of all species disappear from 10 m2 during one year, etc. EBio is the unit emergy stored in the biological resource (seJ × m−1 × yr−1), which is presented as the emergy of local wilderness, farming, forestry, animal husbandry or fishery production.
As previously noted, additional emergy loss Lw,j should also be included to also account for pollution-induced damage to the city assets (e.g., facades of buildings, corrosion of monuments, etc.) according to reference [25]. This is not, however, included in the present study due to lack of sufficient data.
Finally, damage associated to solid waste generation can be measured by land occupation for landfill and disposal. This may be converted to emergy via the emergy/area ratio (upper bound, average emergy density of economic activities) or even via the emergy intensity of soil formation (lower bound, average environmental intensity). Thus the related emergy loss (Lw,3) can be obtained using the total occupied land area multiplied by the economic or environmental emergy intensity of such an area (choice depends on the area of the investigated system).
It is worth mention that not all the environmental impacts (such as climate change) occur at a local scale. As we live in a highly globalized world, economies of scale and comparative advantages exist in certain areas, which makes emissions “ownership” more complex. The multiple spatial scales between the environment and human socioeconomic systems can most easily be understood by modeling the world system as a whole. Simply trying to seek a single global solution that is implemented by national governmental units because of global impacts is far from satisfactory. The essential role of smaller-scale effects must be recognized. In this sense, under the “reciprocity” condition that the non-local environmental background value is not considered, we only focus on the local damage in this study.

3. Results

In this study, we choose 15.83 × 1024 seJ/yr as the baseline for comparison based on Brown and Ulgiati’s researches [40]. With the latest baseline, the transformities before the year of 2000 should be multiplied by 1.61 in emergy algebra.

3.1. Emergy Flows

Emergy flow system diagram of four urban domestic waste treatment systems is shown in Figure 2, and emergy analysis results are listed in Table 2, Table 3, Table 4 and Table 5. For the current landfills in Liaoning, it was found out that more than 95.86% of fuel/goods input emergy came from diesel input (for transporting solid waste), and about 3.33% came from electricity inputs (mainly using for leachate disposal). There is a similar input proportion for sanitary landfills. 92.17% and 3.39% of input emergy came from diesel and electricity input, and about 4.44% came from sulfuric acid and chemical cleaners used for leachate disposal.
Figure 2. Emergy flow system diagram of four urban domestic waste treatment systems: (a) sanitary landfills; (b) fluidized bed incineration; (c) grate type incineration; (d) current landfills.
Energies 06 05486 g002
Table 2. The emergy analysis table of sanitary landfills.
CategoryItemsBasic dataPer UnitTransformity (seJ/unit)ReferenceSolar emergy (seJ/t-waste)
Rw*Oxygen involved in combustion processes2.15 × 108J/t-waste4.14 × 105[41]8.88 × 10¹³
GDiesel (transportation)5.62 × 10⁷J/t-waste1.11 × 105After [42]6.22 × 10¹²
Electricity (transportation)5.18 × 10⁴J/t-waste1.74 × 105After [42]9.04 × 10⁹
Diesel (landfill)3.47 × 10⁶J/t-waste1.11 × 105After [42]3.84 × 10¹¹
Electricity (landfill)1.34 × 10⁶J/t-waste1.74 × 105After [42]2.33 × 10¹¹
Electricity (Leachate disposal)0.00J/t-waste1.74 × 105After [42]0.00
Sulfuric acid (Leachate disposal)2.00 × 10⁻²kg/t-waste2.65 × 1012[43]5.30 × 10¹⁰
Chemical cleaners (Leachate disposal)1.00 × 10⁻¹kg/t-waste2.65 × 1012[43]2.65 × 10¹¹
FMaintenance cost and services5.65$/t1.13 × 1012Country Emergy/$ ratio6.38 × 1012
OutputElectricity2.46 × 107J/t-waste1.74 × 105After [42]4.28 × 10¹²
TransportationNMVCOC1.36 × 10−2kg/t-waste
CO1.50 × 10−2kg/t-waste
NOx4.39 × 10−2kg/t-waste
CO24.14 × 10−2kg/t-waste
SO29.28 × 10−4kg/t-waste
LFG emissionCH41.83 × 101kg/t-waste
CO23.35 × 101kg/t-waste
H2S1.30 × 10−1kg/t-waste
NH36.00 × 10−2kg/t-waste
CO5.00 × 10−2kg/t-waste
Electricity generationCO28.20 × 101kg/t-waste
NOx1.70 × 10−1kg/t-waste
SO29.00 × 10−2kg/t-waste
LeachateCOD3.00kg/t-waste
TOC9.00 × 10−1kg/t-waste
SS7.50 × 10−2kg/t-waste
NH3-N3.00 × 10−2kg/t-waste
Table 3. The emergy analysis table of fluidized bed incineration.
CategoryItemsBasic dataPer UnitTransformity (seJ/unit)ReferenceSolar emergy (seJ/t-waste)
Rw*Oxygen involved in combustion processes9.85 × 1011J/t-waste4.14 × 105[41]4.08 × 10¹⁷
GDiesel (transportation)6.78 × 10⁷J/t-waste1.11 × 105After [42]7.50 × 10¹²
Electricity (transportion)5.18 × 10⁵J/t-waste1.74 × 105After [42]9.04 × 10¹⁰
electricity (pretreatment)1.44 × 10⁶J/t-waste1.74 × 105After [42]2.51 × 10¹¹
limestone1.00kg/t-waste1.02 × 1010After [44]1.02 × 10¹⁰
Electricity (incineration)1.13 × 10⁶J/t-waste1.74 × 105After [42]1.97 × 10¹¹
Diesel (Ignition)6.91 × 10⁷J/t-waste1.11 × 105After [42]7.64 × 10¹²
Oxidizer (Coal)2.90 × 10⁸J/t-waste6.69 × 104After [17]1.94 × 10¹³
Lotion (flue gas treatment)5.00 × 10⁻²kg/t-waste2.65 × 1012[43]1.33 × 10¹¹
Electricity (flue gas treatment)7.20 × 10⁵J/t-waste1.74 × 105After [42]1.26 × 10¹¹
DTC-dithiocarbamate (ash treatment)3.00 × 10⁻²kg/t-waste2.65 × 1012[43]7.95 × 10¹⁰
Cement (ash treatment)5.58 × 101kg/t-waste1.04 × 109[45]5.82 × 10¹⁰
Electricity (ash treatment)7.56 × 10⁵J/t-waste1.74 × 105After [42]1.32 × 10¹¹
FMaintenance cost and services6.24$/t1.13 × 1012Country Emergy/$ ratio7.05 × 1012
OutputElectricity2.04 × 108J/t-waste1.74 × 105After [42]3.56 × 10¹³
Slag1.66 × 102kg/t-waste2.70 × 1012[18]4.47 × 10¹⁴
Flue gas dischargeCO21.26 × 103kg/t-waste
CO7.11 × 10−1kg/t-waste
SO27.56 × 10−1kg/t-waste
NOx6.86 × 10−1kg/t-waste
IncinerationHCL9.39 × 10−2kg/t-waste
PCDDs/PCDFs1.50 × 10−10kg/t-waste
PM101.64 × 10−1kg/t-waste
NMVOC1.77 × 10−2kg/t-waste
CO1.95 × 10−2kg/t-waste
TransportationNOx1.22 × 10−1kg/t-waste
CO25.45kg/t-waste
SO22.58 × 10−3kg/t-waste
Table 4. The emergy analysis table of grate type incineration.
CategoryItemsBasic dataPer UnitTransformity (seJ/unit)ReferenceSolar emergy (seJ/t-waste)
Rw*Oxygen involved in combustion processes4.56 × 1011J/t-waste4.14 × 105[41]1.89 × 10¹⁷
GDiesel (transportation)6.91 × 10⁷J/t-waste1.11 × 105After [42]7.64 × 10¹²
Electricity (incineration)1.13 × 10⁶J/t-waste1.74 × 105After [42]1.97 × 10¹¹
Diesel (incineration)1.45 × 10⁸J/t-waste1.11 × 105After [42]1.60 × 10¹³
Activated carbon (flue gas treatment)7.20kg/t-waste2.65 × 1012[43]1.91 × 10¹³
Electricity (flue gas treatment)7.20 × 10⁵J/t-waste1.74 × 105After [42]1.26 × 10¹¹
Diesel (flue gas treatment)8.48 × 10⁵J/t-waste1.11 × 105After [42]9.38 × 10¹⁰
Lotion (flue gas treatment)5.00 × 10⁻²kg/t-waste2.65 × 1012[43]1.33 × 10¹¹
DTC-dithiocarbamate (ash treatment)3.00 × 10⁻²kg/t-waste2.65 × 1012[43]7.95 × 10¹⁰
Cement (ash treatment)5.58 × 101kg/t-waste1.04 × 109[45]5.82 × 10¹⁰
FMaintenance cost and services7.49$/t1.13 × 1012Country Emergy/$ ratio8.46 × 1012
OutputElectricity8.25 × 107J/t-waste1.74 × 105After [42]1.44 × 10¹³
Slag2.57 × 102kg/t-waste2.70 × 1012[18]6.94 × 10¹⁴
Flue gas dischargeCO26.34 × 102kg/t-waste
CO3.80 × 10−1kg/t-waste
SO24.26 × 10−1kg/t-waste
NOx1.19kg/t-waste
HCL1.12 × 10−1kg/t-waste
PM107.70 × 10−2kg/t-waste
TransportationNMVOC1.62 × 10−2kg/t-waste
CO1.79 × 10−2kg/t-waste
NOx5.30 × 10−2kg/t-waste
CO25.01kg/t-waste
SO21.12 × 10−3kg/t-waste
Table 5. The emergy analysis table of current landfills.
CategoryItemsBasic dataPer UnitTransformity (seJ/unit)ReferenceSolar emergy (seJ/t-waste)
Rw*Air-
GDiesel (transportation)5.62 × 10⁷J/t-waste1.11 × 105After [42]6.22 × 10¹²
Electricity (transportation)9.96 × 10⁴J/t-waste1.74 × 105After [42]1.74 × 10¹⁰
Diesel (landfill)8.31 × 10⁵kg/t-waste1.11 × 105After [42]9.19 × 10¹⁰
Electricity (Leachate disposal)1.16 × 10⁶kwh/t-waste1.74 × 105After [42]2.02 × 10¹¹
Sulfuric acid (Leachate disposal)2.00 × 10⁻²kg/t-waste2.65 × 1012[43]5.30 × 10¹⁰
FMaintenance cost and services3.17$/t-waste1.13 × 1012Country Emergy/$ ratio3.59 × 1012
LFG emissionCH42.93 × 101kg/t-waste
CO25.44 × 101kg/t-waste
H2S2.00 × 10−1kg/t-waste
NH31.00 × 10−1kg/t-waste
CO8.00 × 10−2kg/t-waste
TransportationNMVOC1.36 × 10−2kg/t-waste
CO1.50 × 10−2kg/t-waste
NOx4.39 × 10−2kg/t-waste
CO24.14kg/t-waste
SO29.28 × 10−4kg/t-waste
LeachateCODcr2.43kg/t-waste
NH3-N2.63 × 10−2kg/t-waste
SS7.70 × 10−2kg/t-waste
Compared with the two incineration systems, fluidized bed incineration process mainly needed diesel input (42.51%) and other emergy input (55.26%), which included coals as the oxidizer and DTC-dithiocarbamate and cements for ash treatment. For grate type incineration, 54.65% of input emergy came from diesel input (mainly for incineration), and about 44.60% came from activated carbon input (for flue gas treatment) and DTC-dithiocarbamate and cement used for ash treatment.
The emergy-based treatment costs are significantly different. Current landfills without leachate disposal system is the least expensive (1.022 × 10¹³ seJ/t-waste), followed by the sanitary landfills system (1.35 × 10¹³ seJ/t-waste). Two incineration systems seem to require more emergy inputs. For fluidized bed incineration process, 4.27 × 10¹³ seJ are used for treating 1t waste. It is much higher in grate type incineration (5.19 × 10¹³ seJ/t-waste). Therefore, if ecological service and emission’s impacts are not considered, the current landfill system shows promise for urban solid disposal based on the evolution of thermoeconomics.

3.2. Emission Impacts

Emission impacts are shown in Table 6. Our study will deal with the harmful emissions for the human health and ecosystem. Air emissions from both urban production and use include SO2, dust, NOx and CH4 (respiratory disorders), CO2, N2O and CH4 (climate change). Data about CO2, N2O and CH4 are calculated as greenhouse gases released at local and global scales, based on direct and indirect energy consumption. The ecological losses caused by water emissions were not considered due to a lack of the corresponding coefficients. For sanitary landfill systems, the value of emission impacts on human health was 3.82 × 10¹⁵ seJ/t-waste, which mainly came from the damages to human health resulting from CH4-caused climate change (62.54%), CO2 (18.87%, climate change) and NOx (14.74%, respiratory effects on humans caused by inorganic substances). The ecosystem loss mainly came from the damage to Ecosystem Quality caused by the combined effect of NOx and SO2’s acidification and eutrophication. The emission impacts of incineration systems were much higher than those of the landfill systems. The human health losses are 1.31 × 10¹⁶ seJ/t-waste and 8.81 × 10¹⁵ seJ/t-waste in fluidized bed incineration system and grate type incineration system respectively. The largest contributor was the damages to human health resulting from CO2-caused climate change (60.38% and 45.29%). The ecosystem losses were mainly caused by NOx’s acidification and eutrophication. The results also indicate that the human health losses caused by the harmful air emissions are ranked in this order: fluidized bed incineration > grate type incineration > current landfills > sanitary landfills, while the ecosystem losses are ranked: grate type incineration > fluidized bed incineration > sanitary landfills > current landfills. The changes of ordination are caused by the increased NOx release of the extra treatment processes (such as electricity generation), which created a damage to ecosystem quality caused by the combined effect of acidification and eutrophication.
Table 6. Emergy analysis table of emissions’ impacts (Unit: seJ/t-waste).
Impact categorySanitary landfillsFluidized bed incinerationGrate type incinerationCurrent landfills
DALY Lw,1PDF Lw,2DALY Lw,1PDF Lw,2DALY Lw,1PDF Lw,2DALY Lw,1PDF Lw,2
CO27.21 × 1014-7.91 × 10¹⁵-3.99 × 10¹⁵-3.65 × 10¹⁴-
CO0.00-0.00-0.00-0.00-
NOx5.63 × 10142.42 × 10152.13 × 10159.14 × 10153.27 × 10151.41 × 10161.16 × 10144.97 × 1014
SO21.47 × 10141.87 × 10141.23 × 10151.56 × 10156.92 × 10148.81 × 10141.50 × 10121.91 × 1012
TSP0.00-1.83 × 10¹⁵-8.57 × 10¹⁴-0.00-
N2O0.00-0.00-0.00-0.00-
CH42.39 × 1015-0.00-0.00-3.83 × 10¹⁵-
The emergy loss associated with land occupation can be used as a measure of the environmental impact of discharged solid waste. On the basis of this, household solid waste would occupy 0.27 m2/t. The results in Table 7 show that the land occupations of the landfill systems were 3.23 × 10¹⁵ seJ/t-waste. Most of ecological services came from air environment service needed to offer oxygen involved in combustion processes. The maximum usage was 4.08 × 10¹⁷ seJ/t-waste in fluidized bed incineration system, which is twice as much as the usage in grate type incineration. Meanwhile, the grate type incineration system could produce 7.08 × 10¹⁴ seJ electricity with less than 1t solid waste, while the fluidized bed incineration system ranked a distant second with 4.83 × 10¹⁴ seJ/t-waste.
The results show that the total emergy usages of the four systems without considering economic and ecological losses are ranked in this order: grate type incineration (5.19 × 10¹³ seJ/t-waste) > fluidized bed incineration (4.27 × 10¹³ seJ/t-waste) > current landfills (2.92 × 10¹³ seJ/t-waste) > sanitary landfills (1.35 × 10¹³ seJ/t-waste). After considering the impacts of emissions, the total emergy usages are: sanitary landfills (3.87 × 10¹⁶ seJ/t-waste) > current landfills (3.71 × 10¹⁶ seJ/t-waste) > grate type incineration (2.39 × 10¹⁶ seJ/t-waste) > fluidized bed incineration (2.38 × 10¹⁶ seJ/t-waste). And the electricity yield ratios (Y/U) are ranked: grate type incineration (2.96%) > fluidized bed incineration (2.03%) > sanitary landfills (0.01%) > current landfills (0.00%). The results suggest that sanitary landfills, as one of the most economical waste treatment techniques, is only cost-effective in regions where land is suitable for landfilling. If the land is scarce (high emergy density) due to geographical constraints, the attractiveness of incineration is increasing. Notable among them is grate type incineration with high electricity yield ratio and low environmental impacts.
Table 7. The values of the four waste disposal methods’ emergy based indicators (Unit: seJ/t-waste).
CategoryEquationSanitary landfillsFluidized bed incinerationGrate type incinerationCurrent landfills
Rw*-8.88 × 10134.08 × 10171.89 × 10170.00
G-7.16 × 10123.56 × 10134.34 × 10136.58 × 1012
F-6.38 × 10127.05 × 10128.46 × 10122.26 × 1013
Y-4.28 × 10124.83 × 10147.08 × 10140.00
Lw,1*Lw,1*=∑mi* × DALYi × τH3.82 × 10151.31 × 10168.81 × 10154.31 × 1015
Lw,2*Lw,2*=∑mi* × PDF(%)i × EBio2.61 × 10151.07 × 10161.50 × 10164.99 × 1014
Lw,3-3.23 × 10¹⁶--3.23 × 10¹⁶
UG + F + Lw,1* + Lw,2* + Lw,33.87 × 10162.38 × 10162.39 × 10163.71 × 1016

4. Discussion

In the previous analysis, the study repeatedly referred to the important role of law in the management of garbage treatment, especially in policy implementation. In the status-quo analysis, the present research has listed current garbage-related laws and regulations in Liaoning, and also pointed out that there is a lack of sub-laws and implementing rules concerning residential garbage under the current legal framework. A comprehensive legal system has not yet been formed, which makes it difficult for supervisors to manage garbage disposal according to laws. For instance, there are few specific regulations and standards about excessive packaging, disposable products, green design for products, the supply of clean vegetables to cities and towns, waste recycling, and the second-trading market. Laws concerning source reduction and garbage sorting are even rare.
This section is aimed to establish a comprehensive legal framework of residential garbage in Liaoning based on the relevant legislation of residential garbage both at home and abroad, including the core laws, regional guidance law, material recycling law, treatment facilities management law, sanitation industry standards and garbage classification act (see Table 8).
We adopted the national-level Law of the People’s Republic of China on the Prevention and Control of Solid Waste Inducing Environmental Pollution as the core law. Based on this, we take the lead in establishing special guidance law entitled "Law of Urban Residential Garbage Management" in Liaoning for garbage management. Material recycling laws are intended for management of recyclable daily supplies and residential garbage, including packaging bags, electrical appliances, batteries, automotive and food waste. We propose that the legislation of such laws should be as detailed as possible and this specialized recycling law is conducive to promoting source separation of garbage. The treatment facilities management laws are meant for the design and operation of transfer stations, treatment plants and garbage public facilities. The environmental industry standards include sanitation quality standards, trash can installation standards and all treatment facilities standards. These standards are primarily used for regulating and evaluating the impact of residential garbage disposal facilities on the environment and health. Finally, according to the management strategies and objectives of the residential garbage in Liaoning, we establish laws on residential garbage classification, including “Law of Urban Residential Garbage Reduction in Liaoning”, “Law of Urban Garbage Classification Deposition and Collection in Liaoning”, “The Sorting Signs of Urban Residential Garbage in Liaoning” and “Assessment Standards of Urban Community with Residential Garbage Classification”.
Table 8. The recommended legal framework of the residential garbage management in Liaoning.
TypeTitleNote
Core lawLaw of the People’s Republic of China on the Prevention and Control of Solid Waste Inducing Environmental Pollution.Y
Regional guidance lawLaw of Urban Residential Garbage Management in LiaoningN
Material recycling lawThe Recycling Law of Liaoning Household Electrical AppliancesN
The Recycling Law of Liaoning Waste BatteryN
The Recycling Law of Liaoning Waste WoodN
The Classification and Recycling Law of Liaoning Packing Bags and ContainersN
Liaoning Food Plastic Packaging ActN
Liaoning Recycling Law of Waste AutomobilesN
Law of Liaoning Kitchen Waste ManagementO
Treatment Facilities Management LawUrban Residential Garbage Transfer Station Design Specifications in LiaoningY
Urban Residential Garbage Transfer Station Operation Management Specifications in LiaoningY
Urban Residential Garbage Burning Plants Design Specifications in LiaoningY
Urban Residential Garbage Burning Plants Operation Specifications in LiaoningY
Urban Residential Garbage Compost Plant Design Specifications in LiaoningY
Urban Residential Garbage Compost Plant Operation Specifications in LiaoningY
Urban Residential Garbage Landfill Plant Design Specifications in LiaoningY
Urban Residential Garbage Landfill Plant Operation Specifications in LiaoningY
Urban Residential Garbage Treatment and Pollution Control Technological Policies in LiaoningY
Graphic Symbols of Liaoning Environmental Sanitation Facilities and EquipmentY
Regulations on Clean-up of Urban Roads and Public Places in LiaoningY
Sanitation industry standardsLiaoning Environmental Sanitation Quality StandardsY
Technical Standards of Liaoning Environmental Sanitation FacilitiesO
Urban Appearance Standards in LiaoningY
Liaoning Residential Garbage Can Installation StandardsN
Liaoning Residential Garbage Transfer Environmental StandardsN
Liaoning Residential Garbage Burning Plant Environmental StandardsN
Liaoning Residential Garbage Compost Environmental StandardsN
Liaoning Residential Garbage Landfill Plant Environmental StandardsN
Residential garbage classification actLaw of Urban Garbage Classification Deposition and Collection in LiaoningN
Law of Urban Residential Garbage Reduction in LiaoningN
The Sorting Signs of Urban Residential Garbage in LiaoningY
The Selection and Assessment Standards of Urban Community with Residential Garbage Classification in LiaoningO
Note: Y means the law has been in existence; N means there’s no such law; O means similar laws or laws at the national level are in existence.
All the legislation to be enacted can directly take advantage of the current national level laws or draw from other regional laws to enact laws on its own. According to the legal standards, we should conduct waste disposal facilities inspections and examinations on a regular basis. The evaluation system should examine the assessment criteria, program implementation and evaluation system while the assessment content should cover information management, equipment management, environmental monitoring, production management and process running. It is recommended to check the sanitation facilities once a week and perform a random inspection once a month. Another important assessment task should be oriented to the regular inspection of demonstration community characterized by garbage classification regularly. Carrying out an assessment inspection on a quarterly basis is advisable.

5. Conclusions

This paper presented a comparison of four garbage treatment systems, including sanitary landfills systems, fluidized bed incineration system, grate type incineration system and simple landfills system. By considering the economic and environmental impacts of wastes treatment and disposal, emissions’ impacts, and wastes input’s contribution, this paper constructed the emergy based urban solid waste model for evaluating the sustainability of the holistic system. With the ecological services and human health and ecological losses, it is demonstrated how it is possible to analyze the economic benefit, environmental pressure, and sustainability of different urban solid treatment ecosystems. The emergy based urban solid waste model can form a set of useful tools, which can be used to compare the comprehensive performances of different urban solid waste treatment processes for decision-making and the whole process optimization.

Acknowledgments

This work is supported by the National Science & Technology Pillar Program, China (No. 2012BAC05B02), the National Science Foundation for Innovative Research Group of China (No. 51121003), National Natural Science Foundation of China (Grant No. 41101564, Grant No. 41271543).

Conflicts of Interest

The authors declare no conflict of interest.

References

  1. Tarr, J.A. The Search for the Ultimate Sink: Urban Pollution in Historical Perspective; University of Akron Press: Akron, OH, USA, 1996. [Google Scholar]
  2. The United Nations Environment Programme (UNEP). Waste Management Planning—An Environmentally Sound Approach for Sustainable Urban Waste Management—An Introductory Guide for Decision-Makers; ISBN 92-807-2490-8. United Nations Publications: Nairobi, Kenya, 2004. [Google Scholar]
  3. Rushbrook, P.; Chandra, C.; Gayton, S.M. Starting Healthcare Waste Management in Medical Institutions—A Practical Approach. In Copenhagen, Practical Health Care Waste Management Information Series No. 1; WHO Regional Office for Europe: Copenhagen, Denmark, 2000; EUR/00/5021817. [Google Scholar]
  4. Wilson, D.C.; Velis, C.; Cheeseman, C. Role of informal sector recycling in waste management in developing countries. Habitat Int. 2006, 30, 797–808. [Google Scholar] [CrossRef]
  5. Bilitewski, B.; Härdtle, G.; Marek, K. Waste Management; Springer: Berlin, Germany, 1997; pp. 1–8. [Google Scholar]
  6. Burian, S.J.; Nix, S.J.; Pitt, R.E.; Durrans, S.R. Urban wastewater management in the United States: Past, present, and future. J. Urban Technol. 2000, 7, 33–62. [Google Scholar] [CrossRef]
  7. Hoornweg, D.A.; Thomas, L. What a Waste: Solid Waste Management in Asia; Working Paper 1. Urban and Local Government, World Bank: Washington, DC, USA, 1999. Available online: http://www.worldbank.org/html/fpd/urban/publicat/whatawaste.pdf (accessed on 10 October 2013).
  8. Torres, N.V. S-system modeling approach to ecosystem: Application to a study of magnesium flow in a tropical forest. Ecol. Model. 1996, 89, 109–120. [Google Scholar] [CrossRef]
  9. Suh, S. Theory of materials and energy flow analysis in ecology and economics. Ecol. Model. 2005, 189, 251–269. [Google Scholar] [CrossRef]
  10. Lotka, A.J. Elements of Physical Biology; Williams and Wilkins: Baltimore, MD, USA, 1925. [Google Scholar]
  11. Lindaman, R.L. The trophic dynamic aspects of ecology. Ecology 1942, 23, 399–418. [Google Scholar] [CrossRef]
  12. Jørgensen, S.E. The Thermodynamic Concept: Exergy. In Thermodynamics and Ecological Modeling; Jørgensen, S.E., Ed.; Lewis Publishers: New York, NY, USA, 2001. [Google Scholar]
  13. Chen, G.Q. Exergy consumption of the earth. Ecol. Model. 2005, 184, 363–380. [Google Scholar] [CrossRef]
  14. Sciubba, E. Beyond thermoeconomics? The concept of Extended Exergy Accounting and its application to the analysis and design of thermal systems. Exergy Int. J. 2001, 1, 68–84. [Google Scholar]
  15. Sciubba, E. Cost analysis of energy conversion systems via a novel resource-based quantifier. Energy 2003, 28, 457–477. [Google Scholar] [CrossRef]
  16. Sciubba, E.; Ulgiati, S. Emergy and exergy analyses: Complementary methods or irreducible ideological options? Energy 2005, 30, 1953–1988. [Google Scholar] [CrossRef]
  17. Odum, H.T. Environmental Accounting, Emergy and Decision Making; Wiley: New York, NY, USA, 1996. [Google Scholar]
  18. Zhang, X.H.; Deng, S.H.; Wu, J.; Jiang, W.J. A sustainability analysis of a municipal sewage treatment ecosystem based on emergy. Ecol. Eng. 2010, 36, 685–696. [Google Scholar] [CrossRef]
  19. Cherubini, F.; Bargigli, S.; Ulgiati, S. Life cycle assessment (LCA) of waste management strategies: Landfilling, sorting plant and incineration. Energy 2009, 34, 2116–2123. [Google Scholar] [CrossRef]
  20. Yuan, F.; Shen, L.Y.; Li, M.Q. Emergy analysis of the recycling options for construction and demolition waste. Waste Manag. 2011, 31, 2503–2511. [Google Scholar] [CrossRef] [PubMed]
  21. Zhang, X.H.; Deng, S.H.; Zhang, Y.Z.; Yang, G.; Li, L.; Qi, H.; Xiao, H.; Wu, J.; Wang, Y.L.; Shen, F. Emergy evaluation of the impact of waste exchanges on the sustainability of industrial systems. Ecol. Eng. 2011, 37, 206–216. [Google Scholar] [CrossRef]
  22. Song, Q.B.; Wang, Z.S.; Li, J.H. Sustainability evaluation of e-waste treatment based on emergy analysis and the LCA method: A case study of a trial project in Macau. Ecol. Indic. 2013, 30, 138–147. [Google Scholar] [CrossRef]
  23. Mendes, M.R.; Aramaki, T.; Hanaki, K. Assessment of the environmental impact of management measures for the biodegradable fraction of municipal solid waste in São Paulo city. Waste Manag. 2003, 23, 403–409. [Google Scholar] [CrossRef] [PubMed]
  24. Agostinho, F.; Almeida, C.M.V.B.; Bonilla, S.H.; Sacomano, J.B.; Giannetti, B.F. Urban solid waste plant treatment in Brazil: Is there a net emergy yield on the recovered materials? Resour. Conserv. Recycl. 2013, 73, 143–155. [Google Scholar] [CrossRef]
  25. Ulgiati, S.; Brown, M.T.; Bastianoni, S.; Marchettini, N. Emergy-based indices and ratios to evaluate the sustainable use of resources. Ecol. Eng. 1995, 5, 519–531. [Google Scholar] [CrossRef]
  26. Ulgiati, S.; Brown, M.T. Quantifying the environmental support for dilution and abatement of process emissions: The case of electricity production. J. Clean. Prod. 2002, 10, 335–348. [Google Scholar] [CrossRef]
  27. Hau, J.L.; Bakshi, B.R. Promise and problems of emergy analysis. Ecol. Model. 2004, 178, 215–225. [Google Scholar] [CrossRef]
  28. Brown, M.T.; Ulgiati, S. Emergy, Transformity and Ecosystem Health. In Handbook of Ecological Indicators for Assessment of Ecosystem Health; Jørgensen, S.E., Costanza, R., Xu, F.L., Eds.; CRC Press: Boca Raton, FL, USA, 2005; pp. 333–352. [Google Scholar]
  29. Lei, K.P.; Wang, Z.S. Emergy synthesis and simulation for Macao. Energy 2008, 33, 613–625. [Google Scholar] [CrossRef]
  30. Zhang, X.H.; Jiang, W.J.; Deng, S.H.; Peng, K. Emergy evaluation of the sustainability of Chinese steel production during 1998–2004. J. Clean. Prod. 2009, 17, 1030–1038. [Google Scholar] [CrossRef]
  31. Udo de Haes, H.A.; Lindeijer, E. The Conceptual Structure of Life Cycle Impact Assessment, Final Draft for the Second Working Group on Impact Assessment of SETAC Europe (WIA-2); Society of Environmental Toxicology and Chemistry (SETAC): Brussels, Belgium, 2001. [Google Scholar]
  32. Besiou, M.; Georgiadis, P.; van Wassenhove, L.N. Official recycling and scavengers: Symbiotic or conflicting? Eur. J. Oper. Res. 2011, 218, 563–576. [Google Scholar] [CrossRef]
  33. Brown, M.; Ulgiati, S. Emergy measures of carrying capacity to evaluate economic investment. Popul. Environ. 2001, 22, 471–501. [Google Scholar] [CrossRef]
  34. Campbell, D.E.; Brandt-Williams, S.L.; Meisch, M.E.A. Environmental Accounting Using Emergy: Evaluation of the State of West Virginia; United States Environmental Protection Agency (USEPA): Narragansett, RI, USA, 2005. [Google Scholar]
  35. Liu, G.Y.; Yang, Z.F.; Chen, B.; Zhang, Y.; Zhang, L.X.; Zhao, Y.W.; Jiang, M.M. Emergy-based urban ecosystem health assessment: A case study of Baotou, China. Commun. Nonlinear Sci. Numer. Simul. 2009, 14, 972–981. [Google Scholar] [CrossRef]
  36. Liu, G.Y.; Yang, Z.F.; Chen, B.; Ulgiati, S. Analysis of the scientific collaboration patterns in the emergy accounting field: A review of the co-authorship network structure. J. Environ. Account. Manag. 2013, 1, 1–13. [Google Scholar] [CrossRef]
  37. Goedkoop, M.; Spriensma, R. The Eco-indicator 99: A Damage Oriented Method for Life Cycle Impact Assessment: Methodology Report; Pre. Consultans: Amersfoort, The Netherlands, 2000. Available online: http://www.pre-sustainability.com/download/misc/EI99_methodology_v3.pdf (accessed on 10 October 2013).
  38. Murray, C.J.L.; Lopez, A.D.; Jamison, D.T. The global burden of disease in 1990: Summary results, sensitivity analysis and future directions. Bull. World Health Organ. 1994, 72, 495–509. [Google Scholar] [PubMed]
  39. Ukidwe, N.U.; Bakshi, B.R. Industrial and ecological cumulative exergy consumption of the United States via the 1997 input–output benchmark model. Energy 2007, 32, 1560–1592. [Google Scholar] [CrossRef]
  40. Brown, M.T.; Ulgiati, S. Updated evaluation of exergy and emergy driving the geobiosphere: A review and refinement of the emergy baseline. Ecol. Model. 2010, 221, 2501–2508. [Google Scholar] [CrossRef]
  41. Losowska, M. Embodied Energy Counting of Sustainable Heat, Power and Steel Processes. Master Thesis; The School for Renewable Energy Science, University of Iceland & University of Akureyri: Akureyri, Iceland, February 2011; pp. 53–54. Available online: http://skemman.is/stream/get/1946/7735/20130/1/MagdalenaLosowska.15.02.11.pdf (accessed on 10 October 2013).
  42. Odum, H.T.; Brown, M.T.; Brandt-Williams, S. Handbook of Emergy Evaluation Folio 1: Introduction and Global Budget; Center for Environmental Policy, University of Florida: Gainesville, FL, USA, 2000. Available online: http://www.epa.gov/aed/html/collaboration/emergycourse/presentations/Folio1.pdf (accessed on 10 October 2013).
  43. Grönlund, E.; Klang, A.; Falk, S.; Hanæus, J. Sustainability of wastewater treatment with microalgae in cold climate, evaluated with emergy and socio-ecological principles. Ecol. Eng. 2004, 22, 155–174. [Google Scholar] [CrossRef]
  44. Brandt-Williams, S.L. Handbook of Emergy Evaluation: Folio #4; Center for Environmental Policy, Environmental Engineering Sciences, University of Florida: Gainesville, FL, USA, 2001. Available online: http://www.cep.ees.ufl.edu/emergy/documents/folios/Folio_04.pdf (accessed on 10 October 2013).
  45. Pereira, J.T.V.; Nebra, S.A. Transformities and Exergetic Cost—A Discussion. In Emergy Synthesis: Theory and Application of the Emergy Methology; Brown, M.T., Ed.; Department of Environmental Engineering Sciences: Gainesville, FL, USA, 2000; pp. 71–80. [Google Scholar]

