Peukert Revisited—Critical Appraisal and Need for Modification for Lithium-Ion Batteries


Abstract
:1. Introduction


2. Methodology

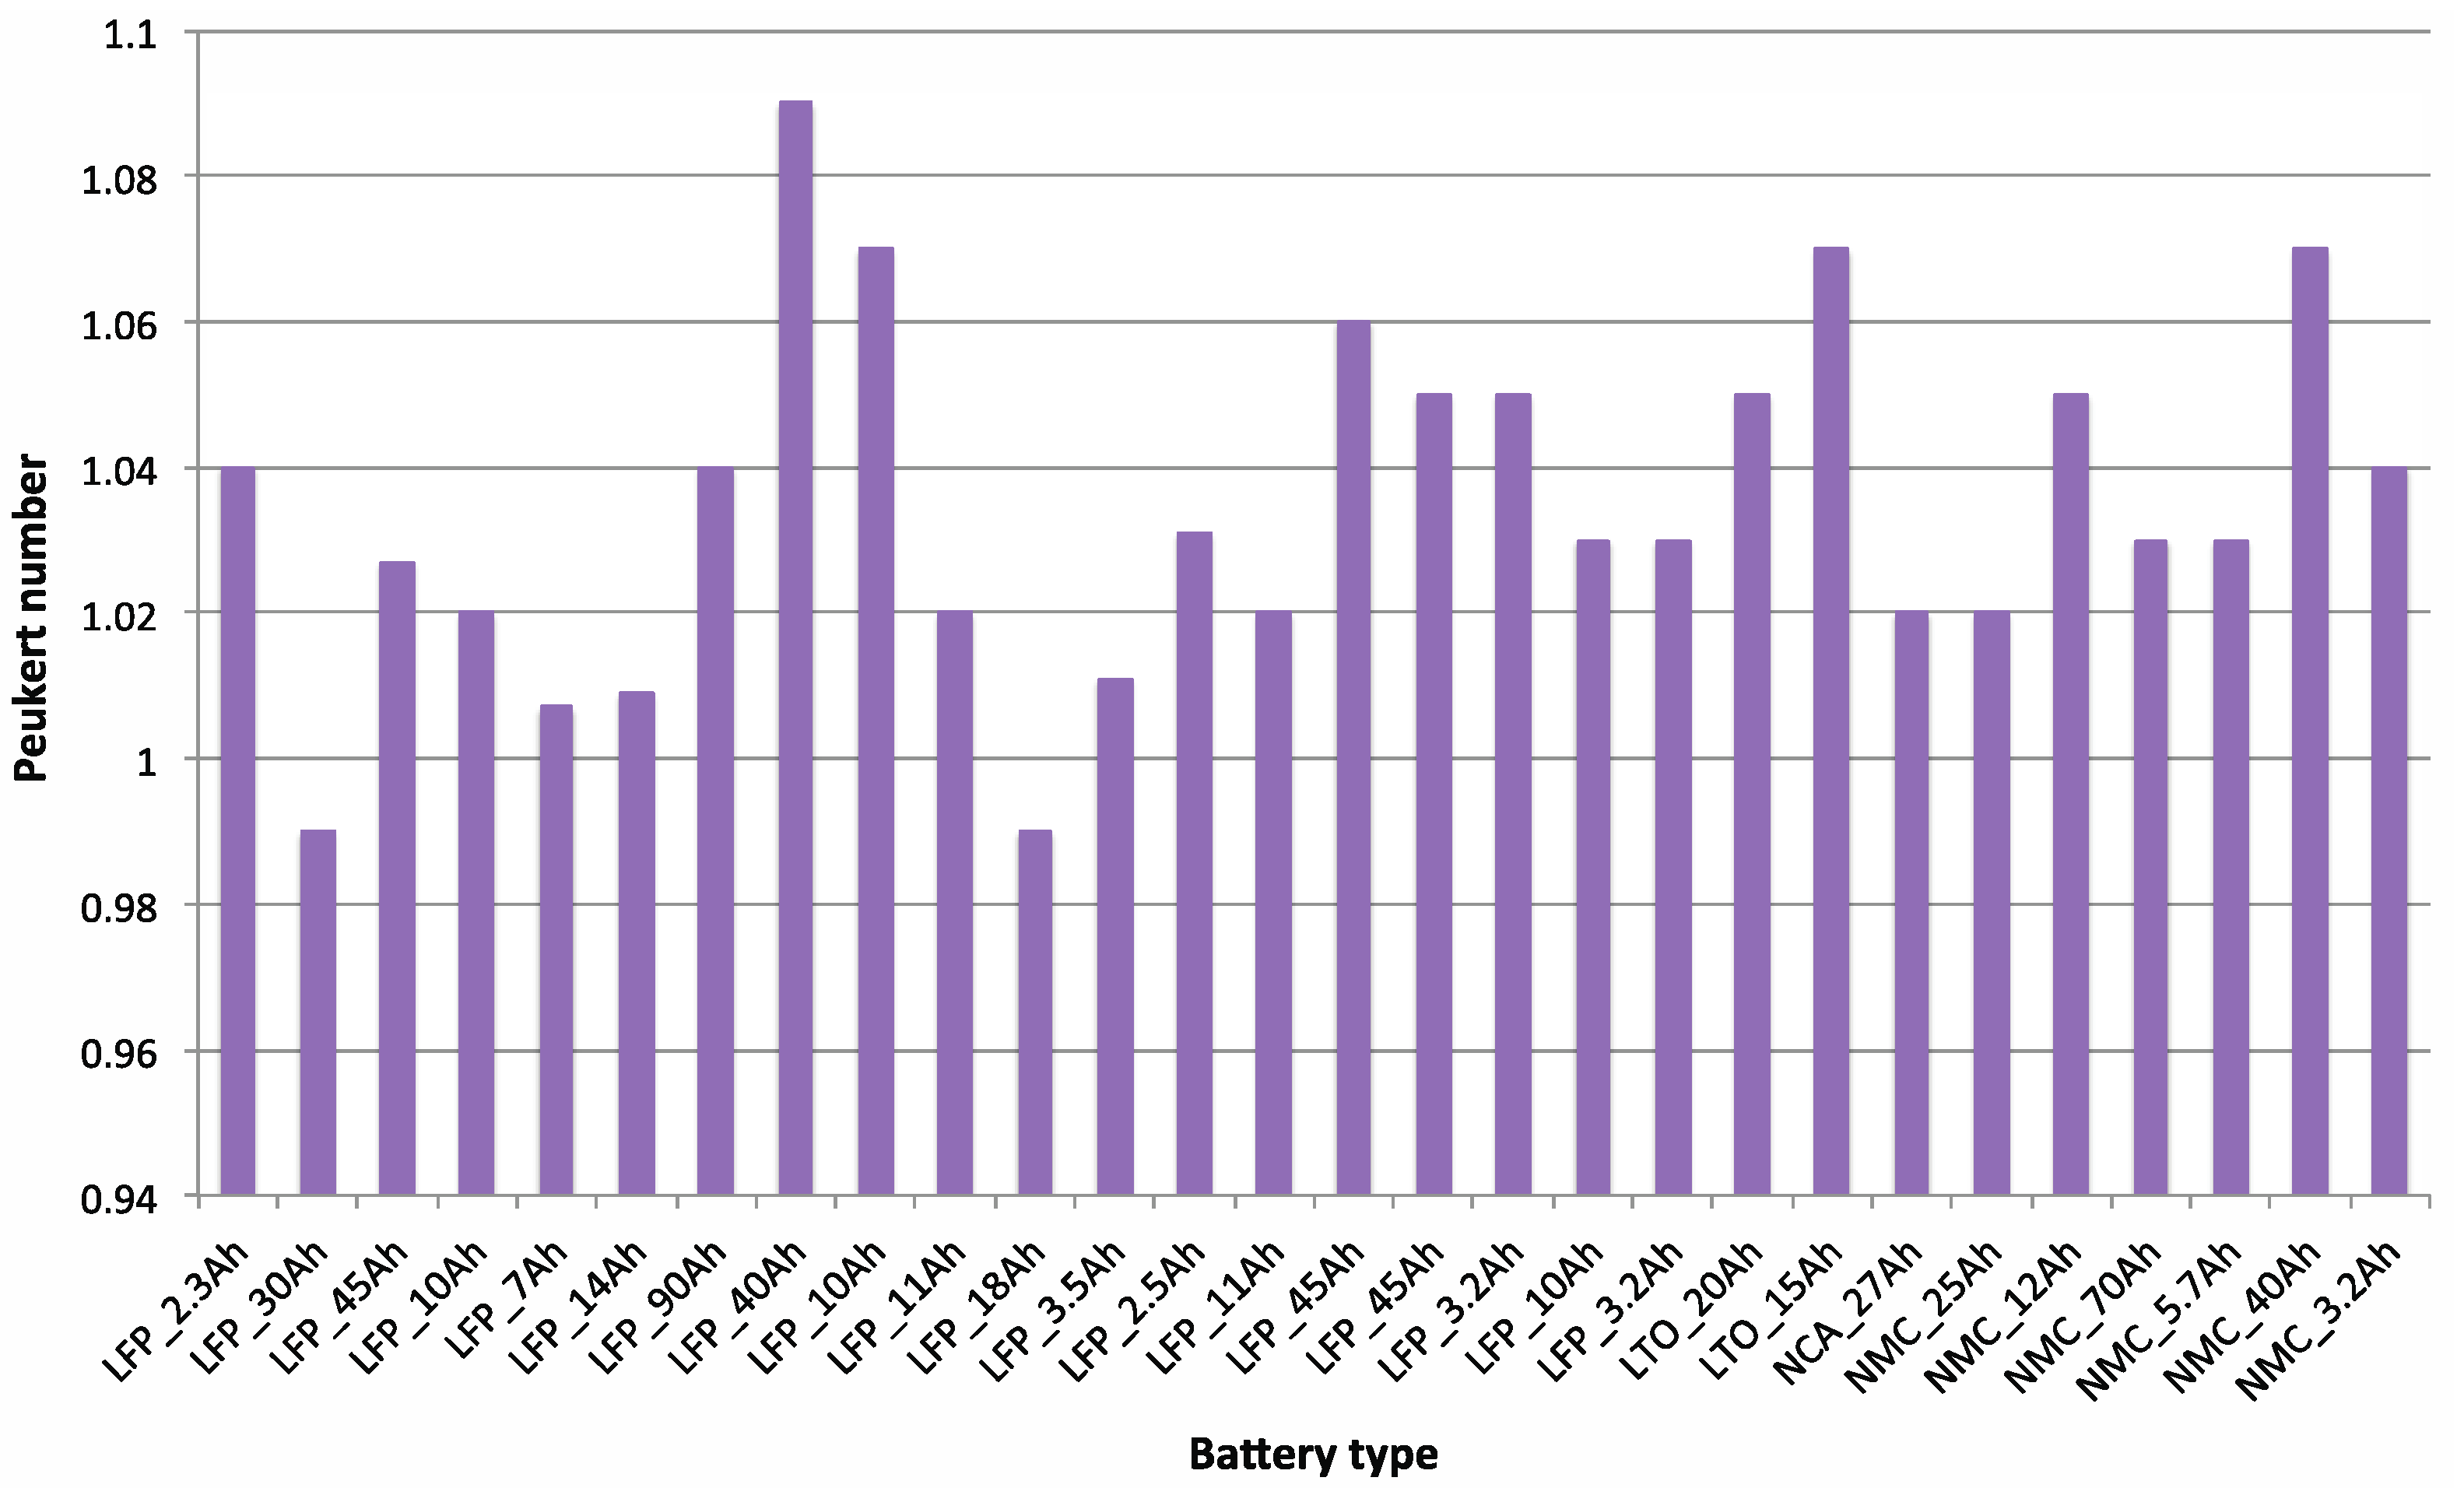
| Chemistry | Capacity (A h) | Voltage (V) | Shape |
|---|---|---|---|
| Lithium iron phosphate (LFP) | 2.3 | 3.3 | Cylindrical |
| Lithium nickel manganese cobalt (NMC) | 40 | 3.7 | Pouch |
| Lithium nickel cobalt aluminum (NCA) | 27 | 3.7 | Cylindrical |
| Lithium titanate (LTO) | 15 | 2.2 | Pouch |
3. Results and Discussion
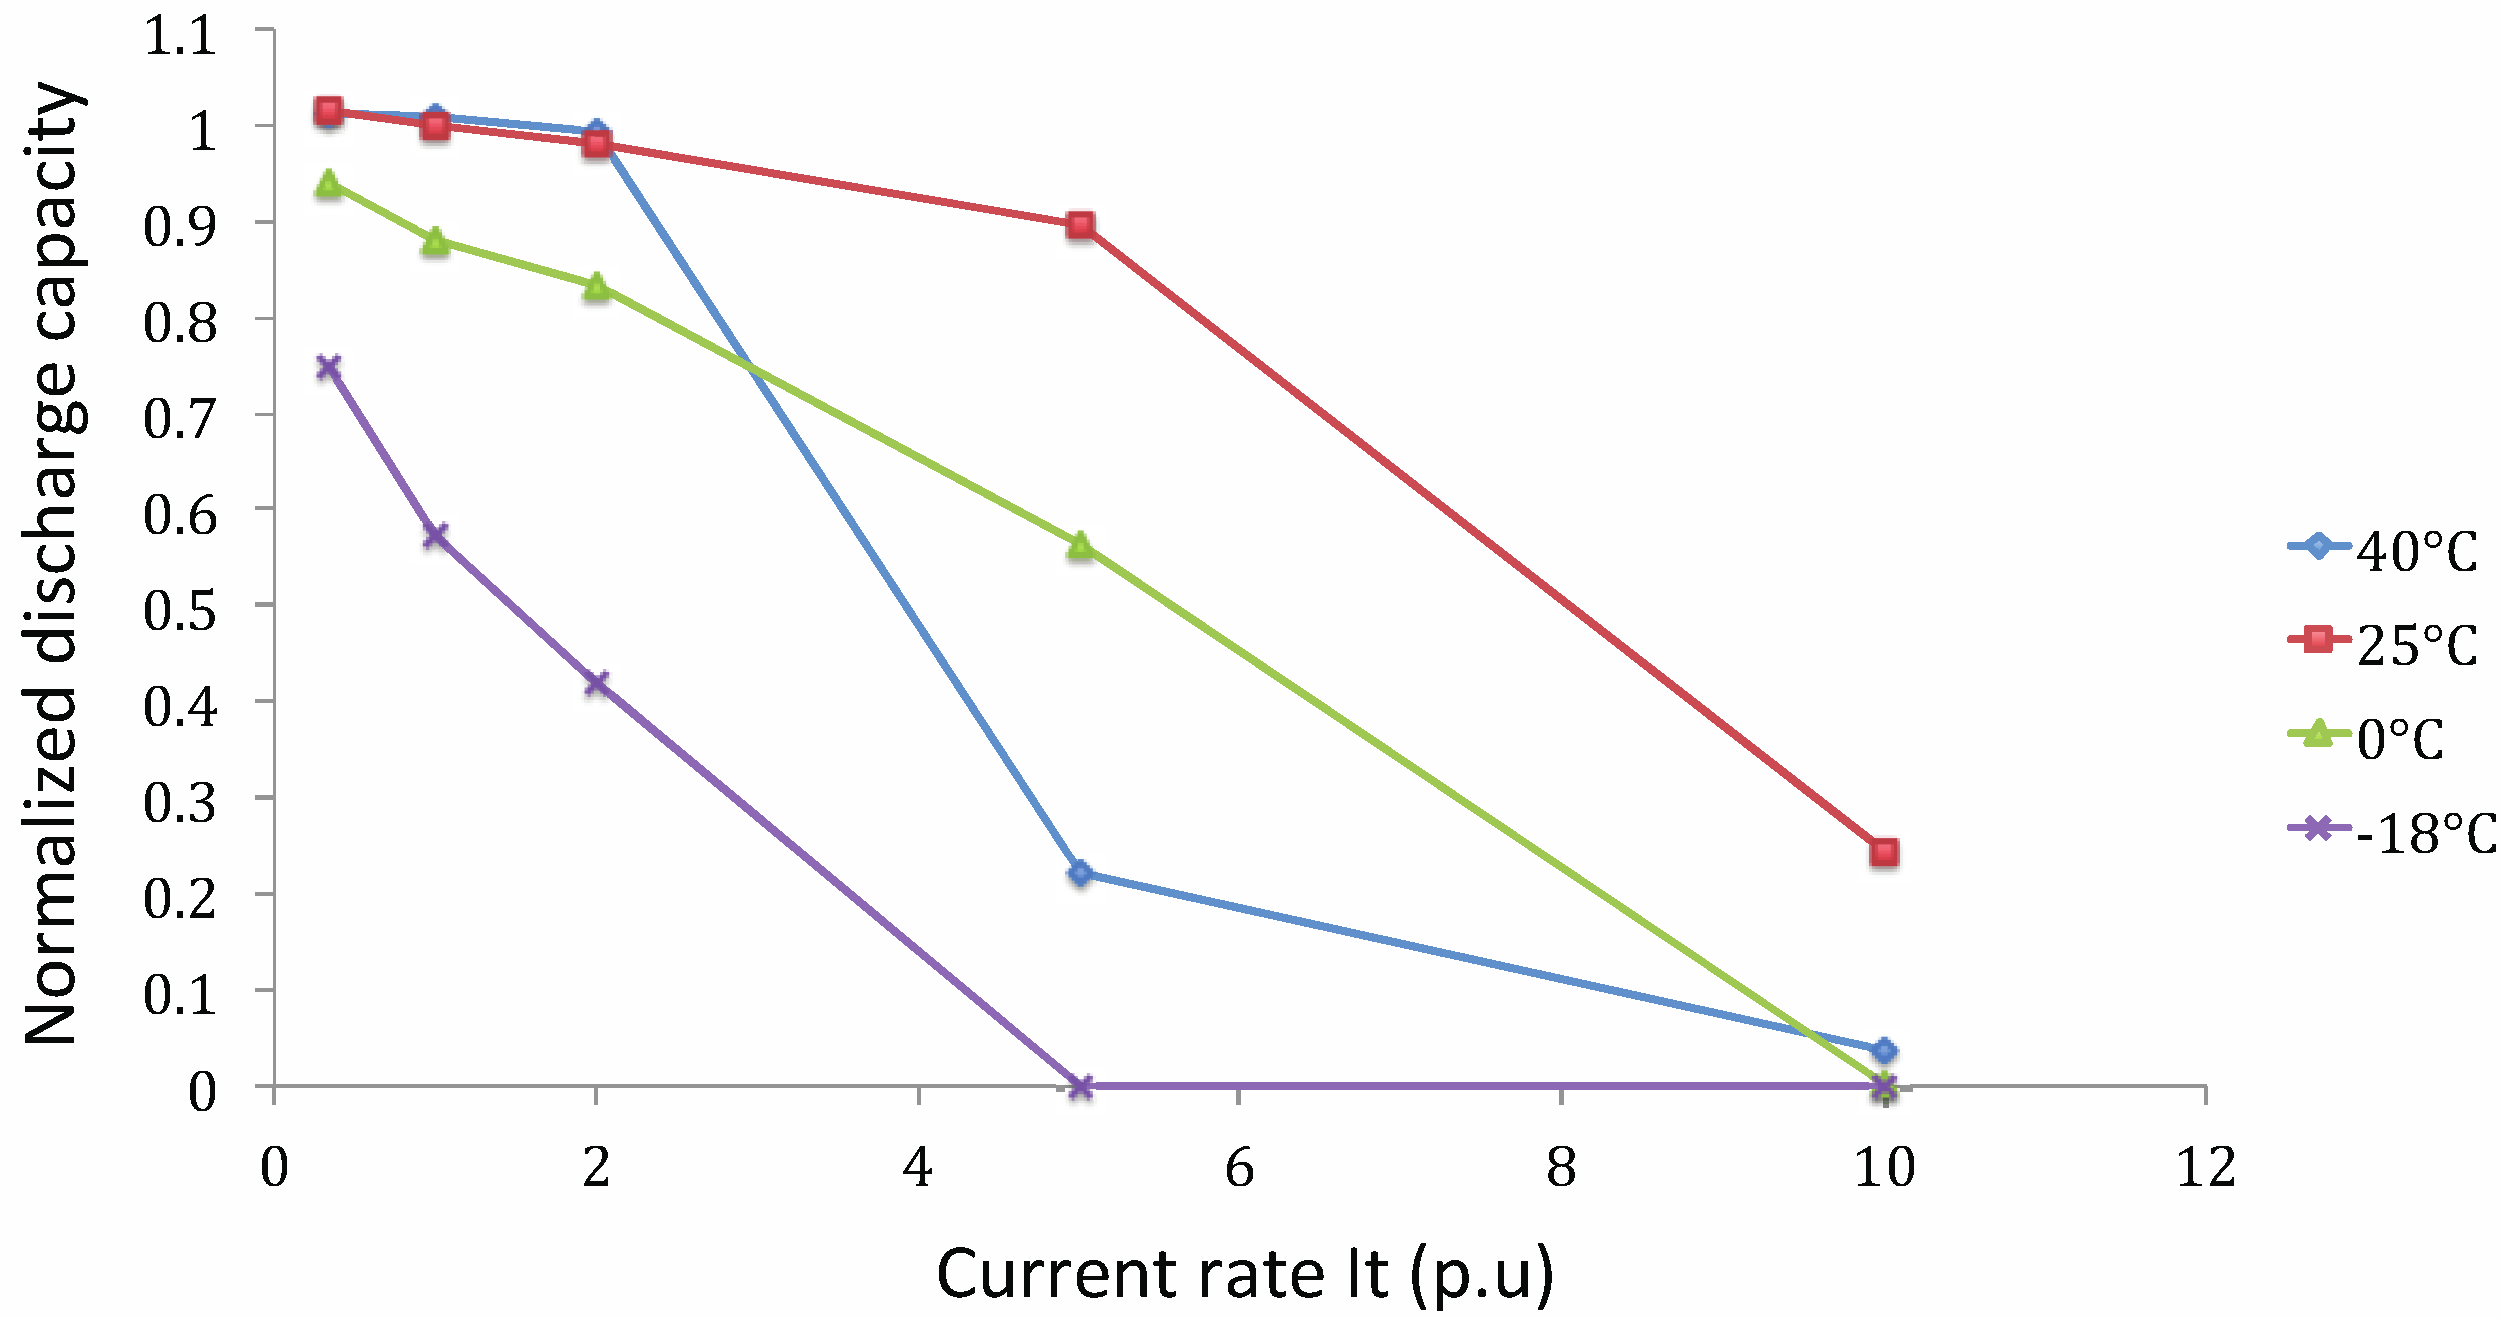
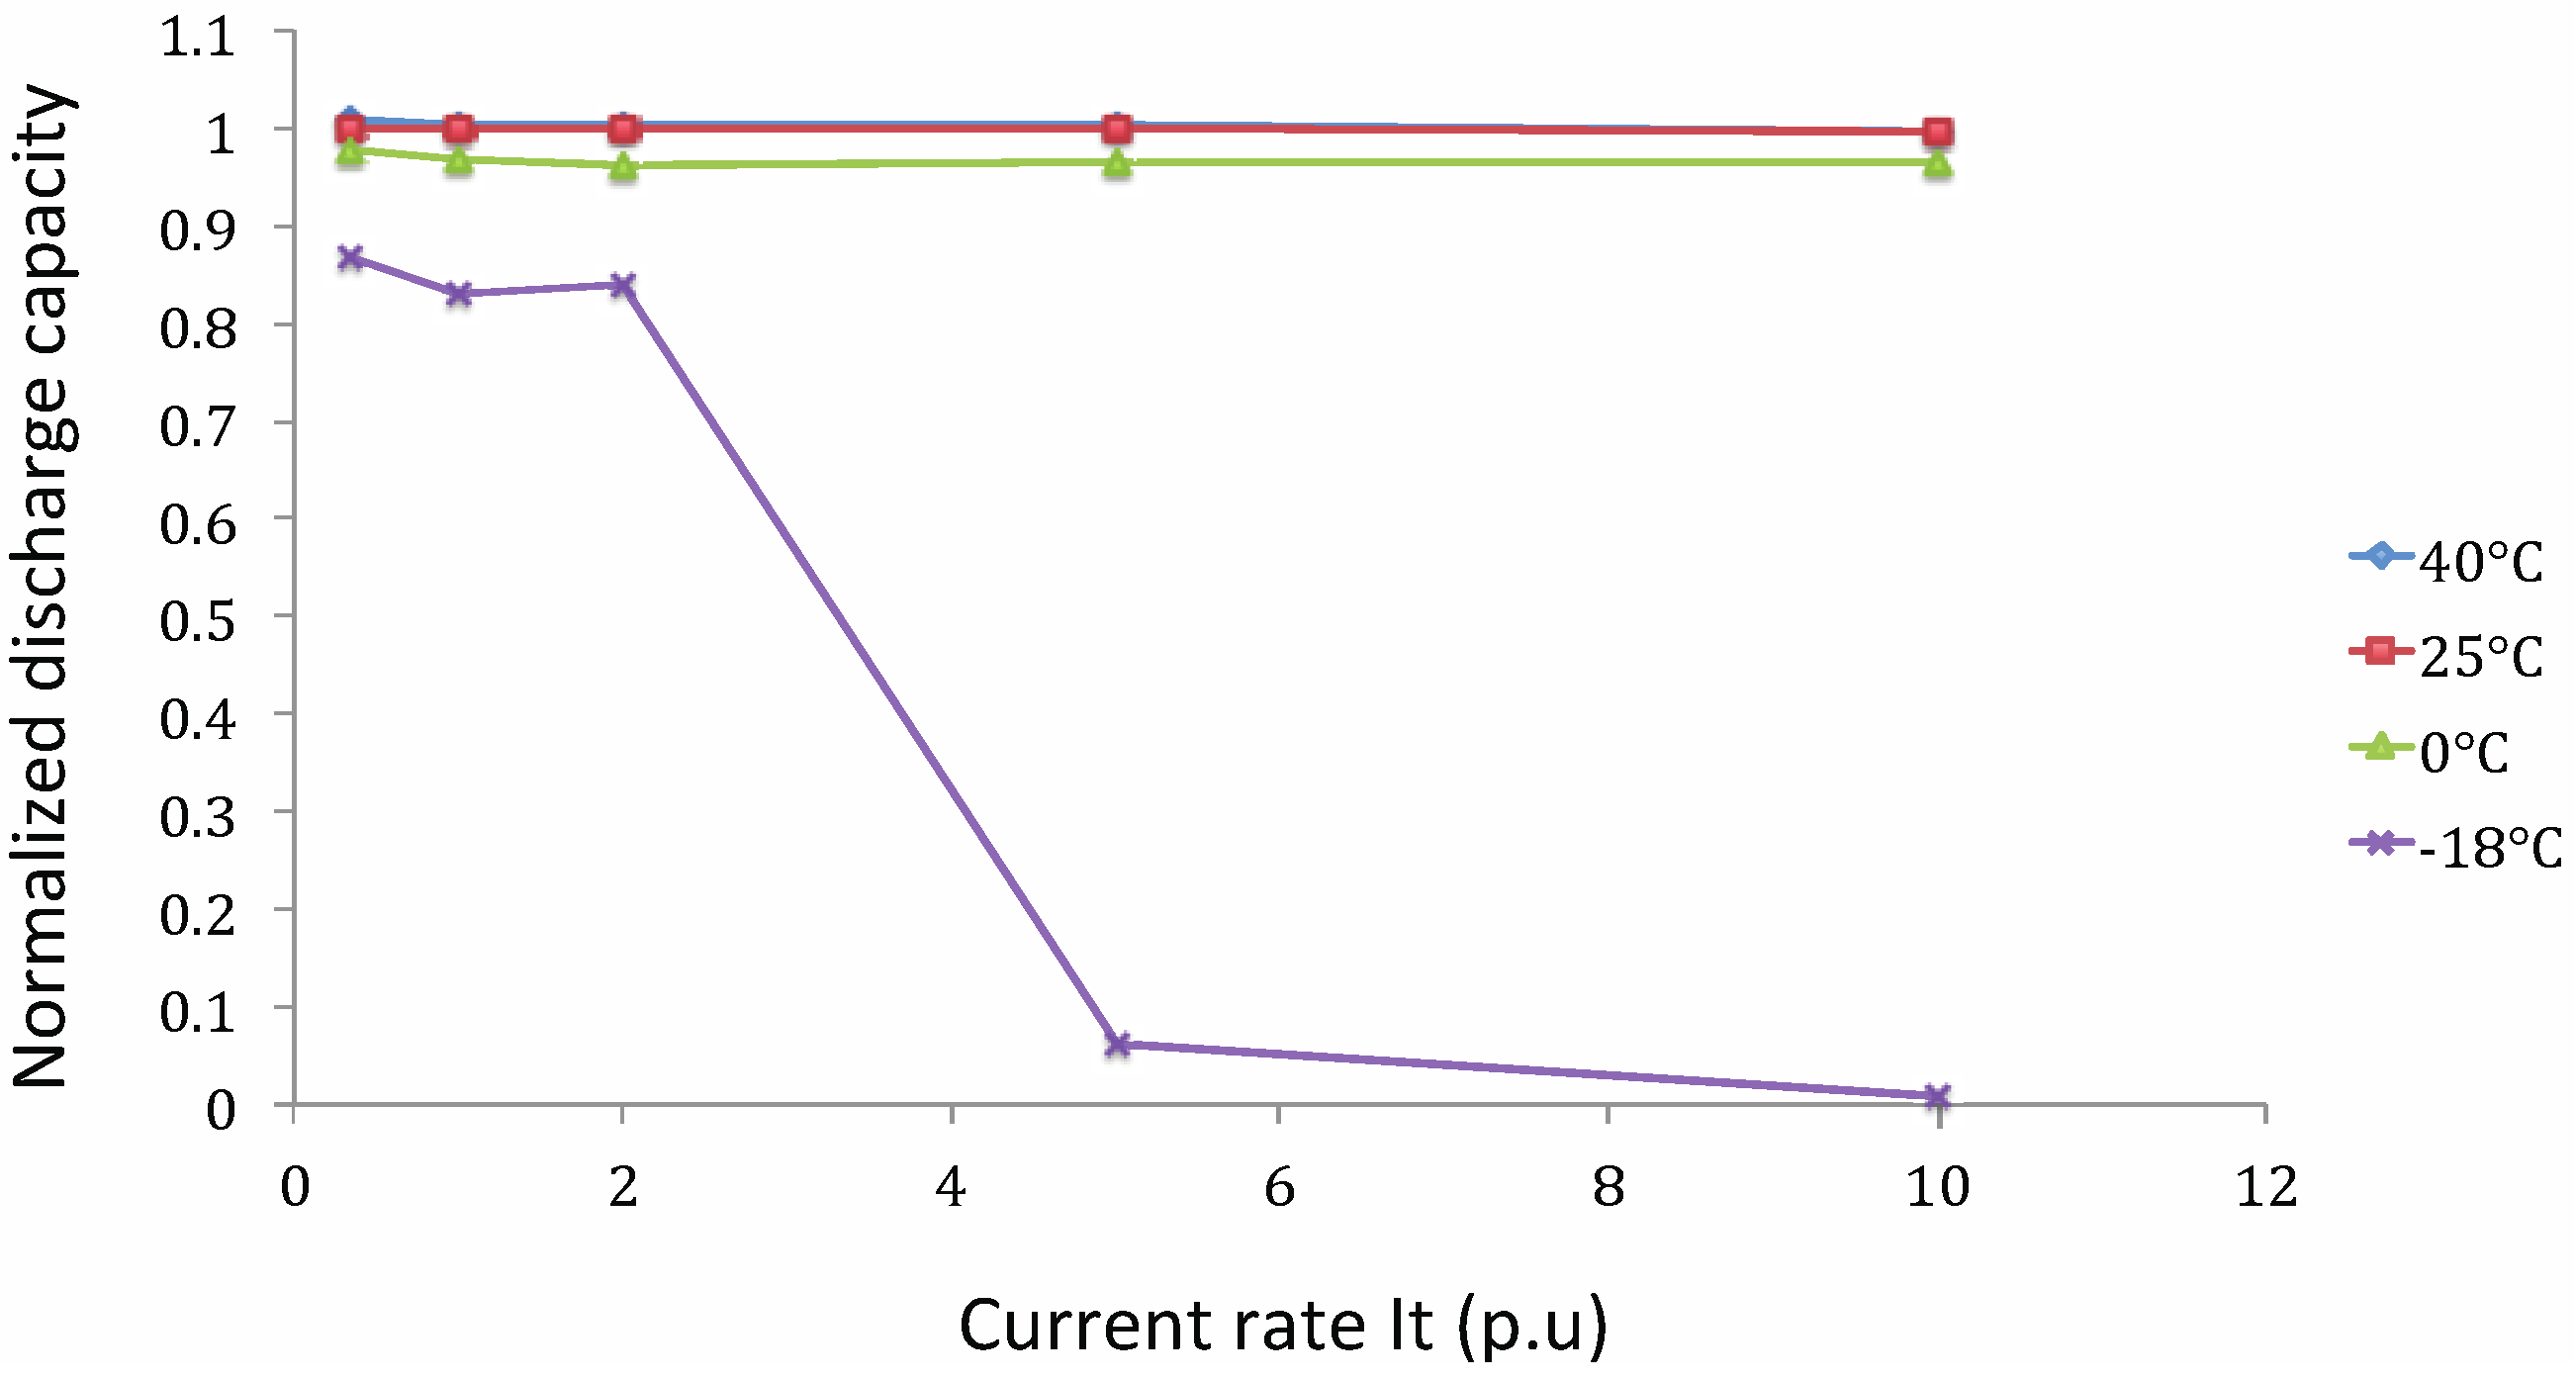
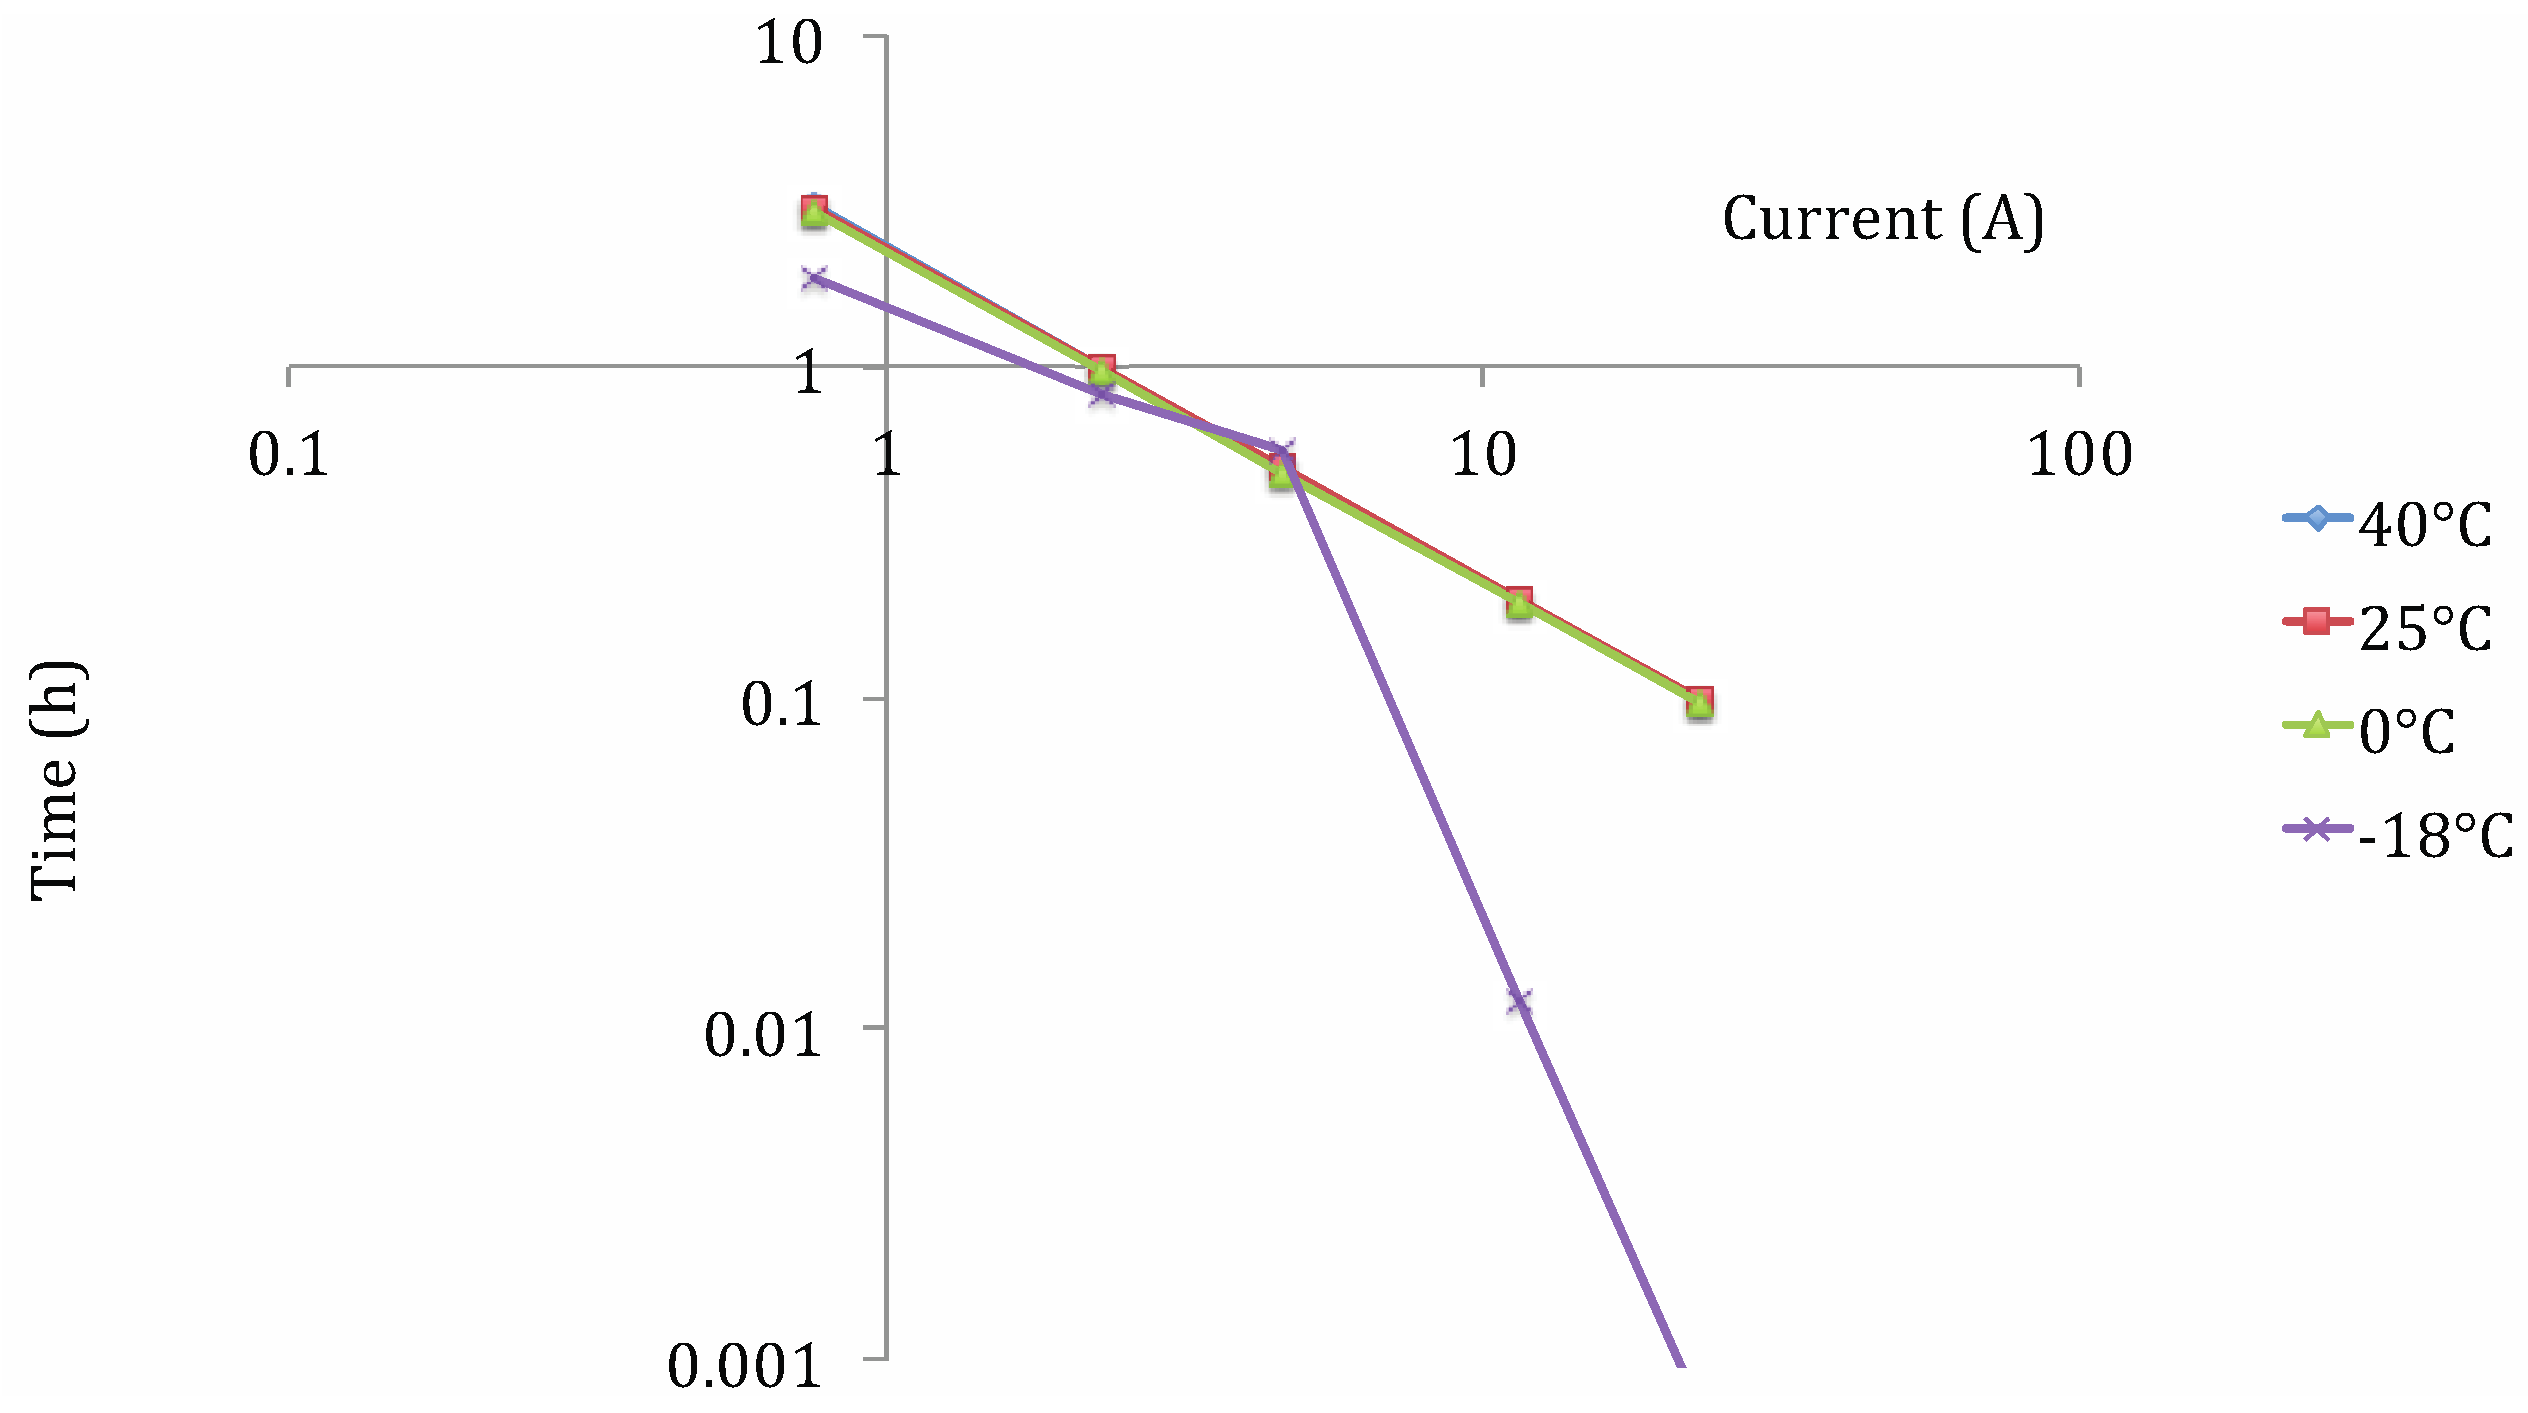
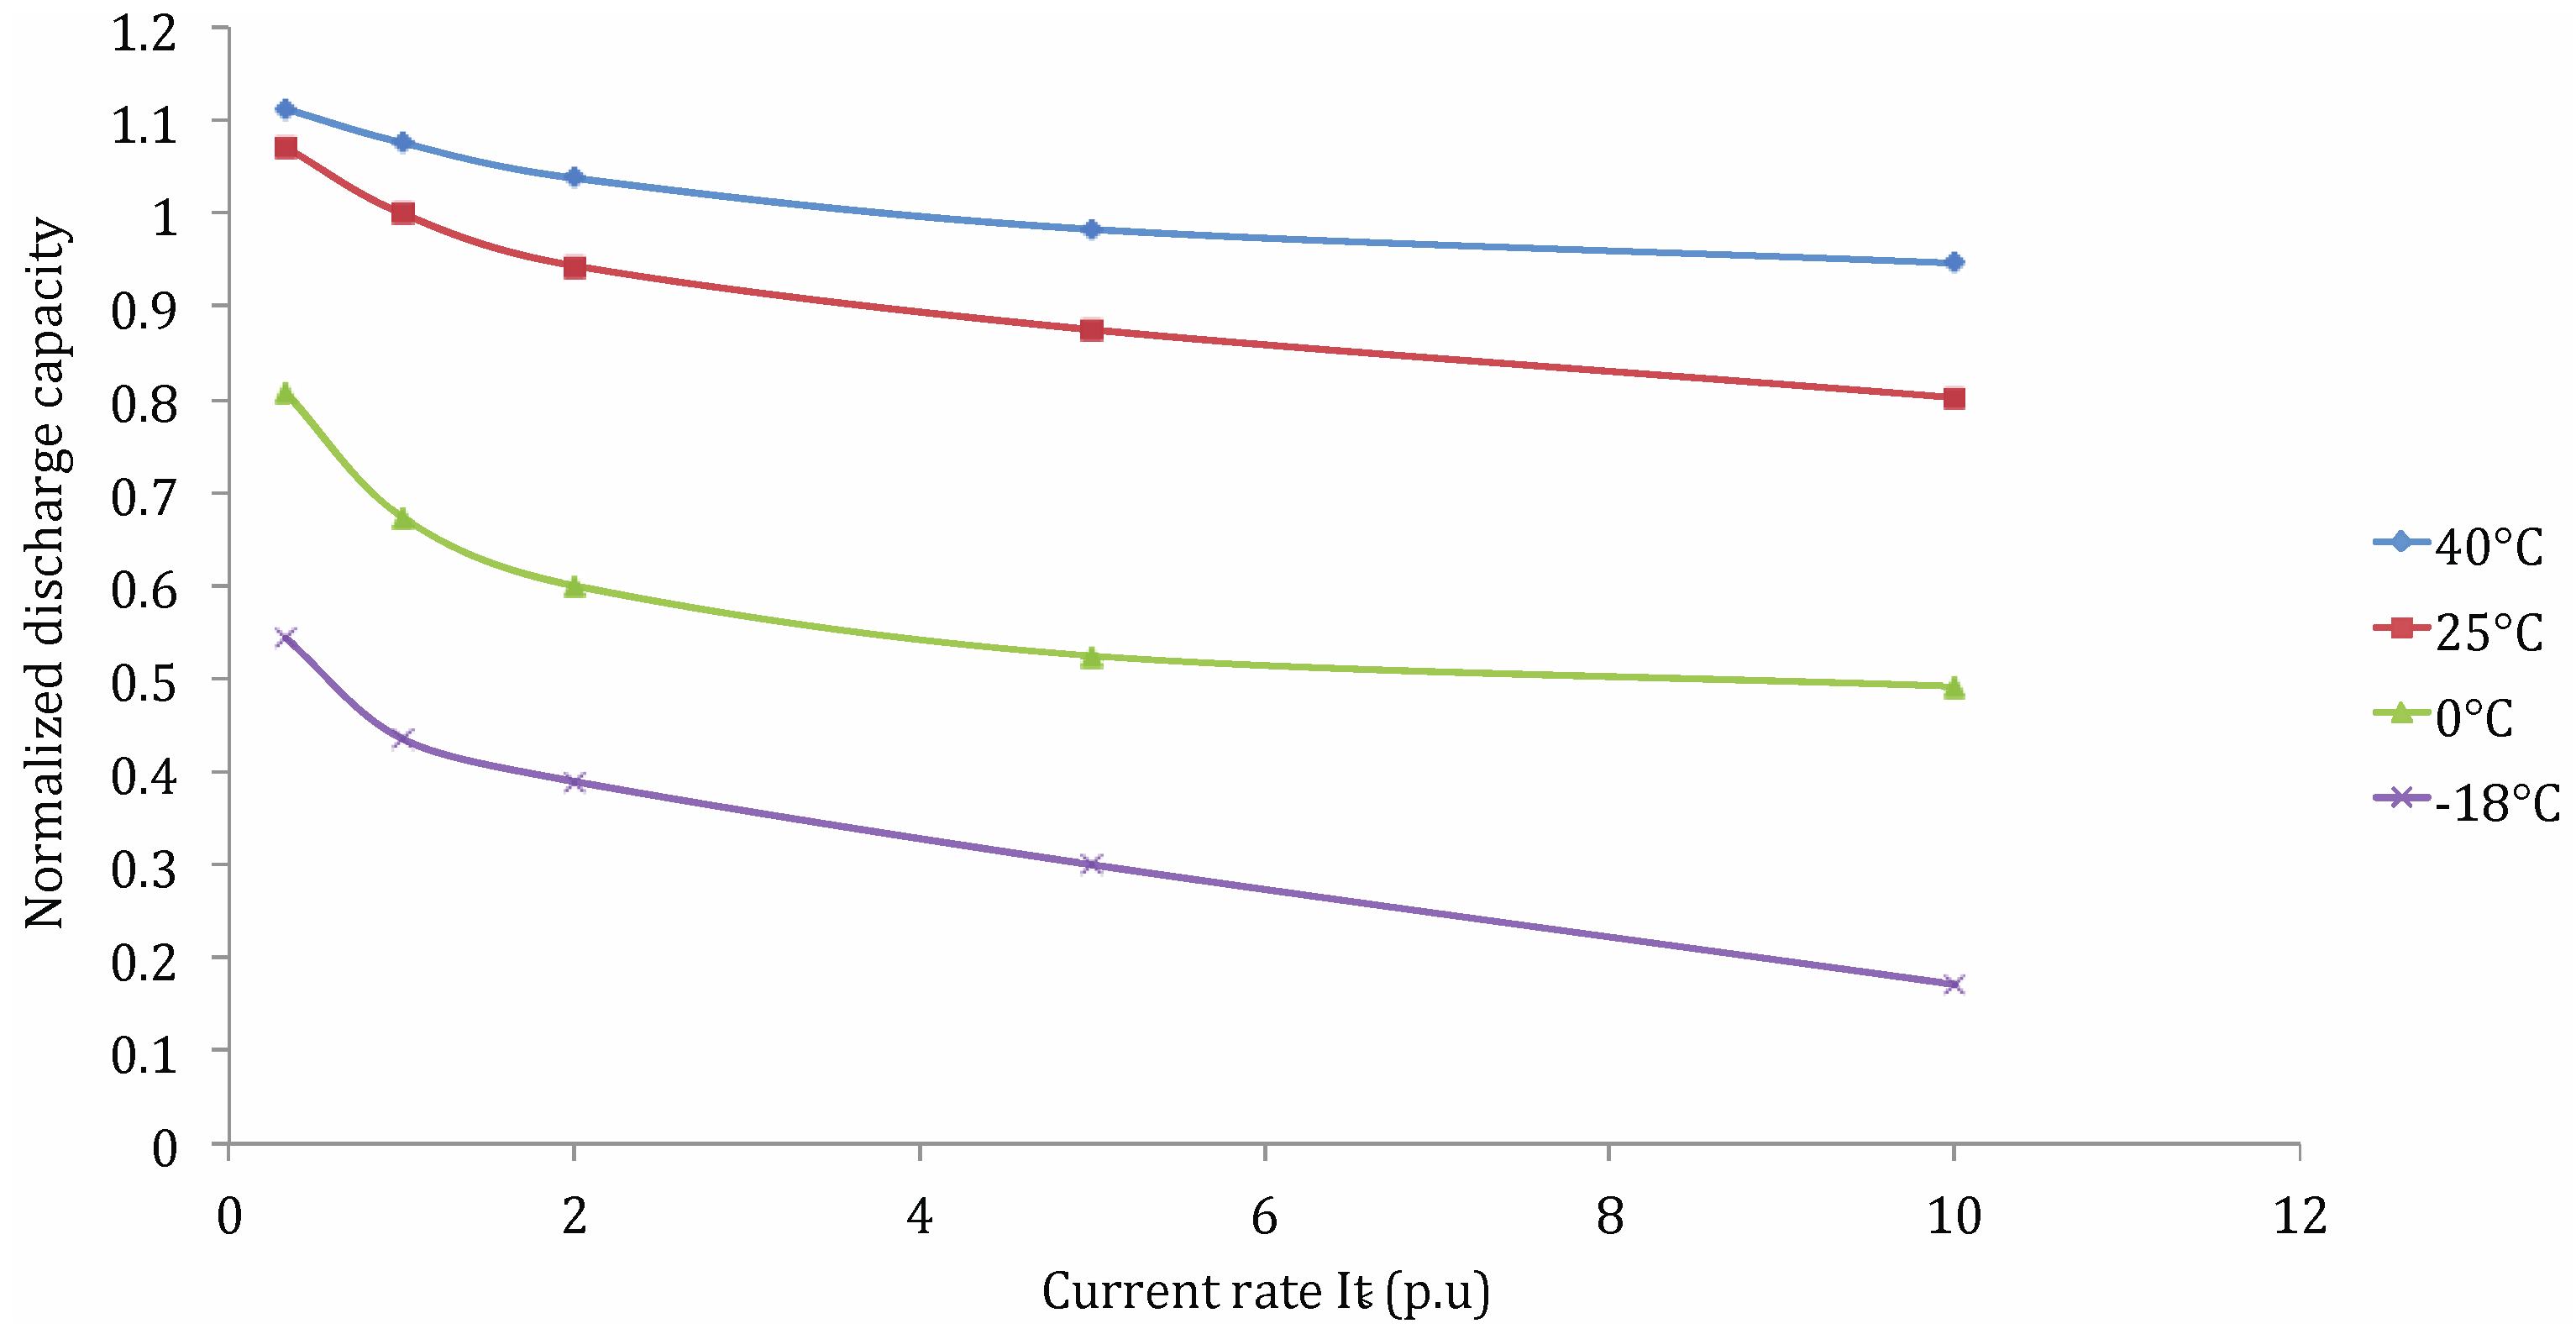
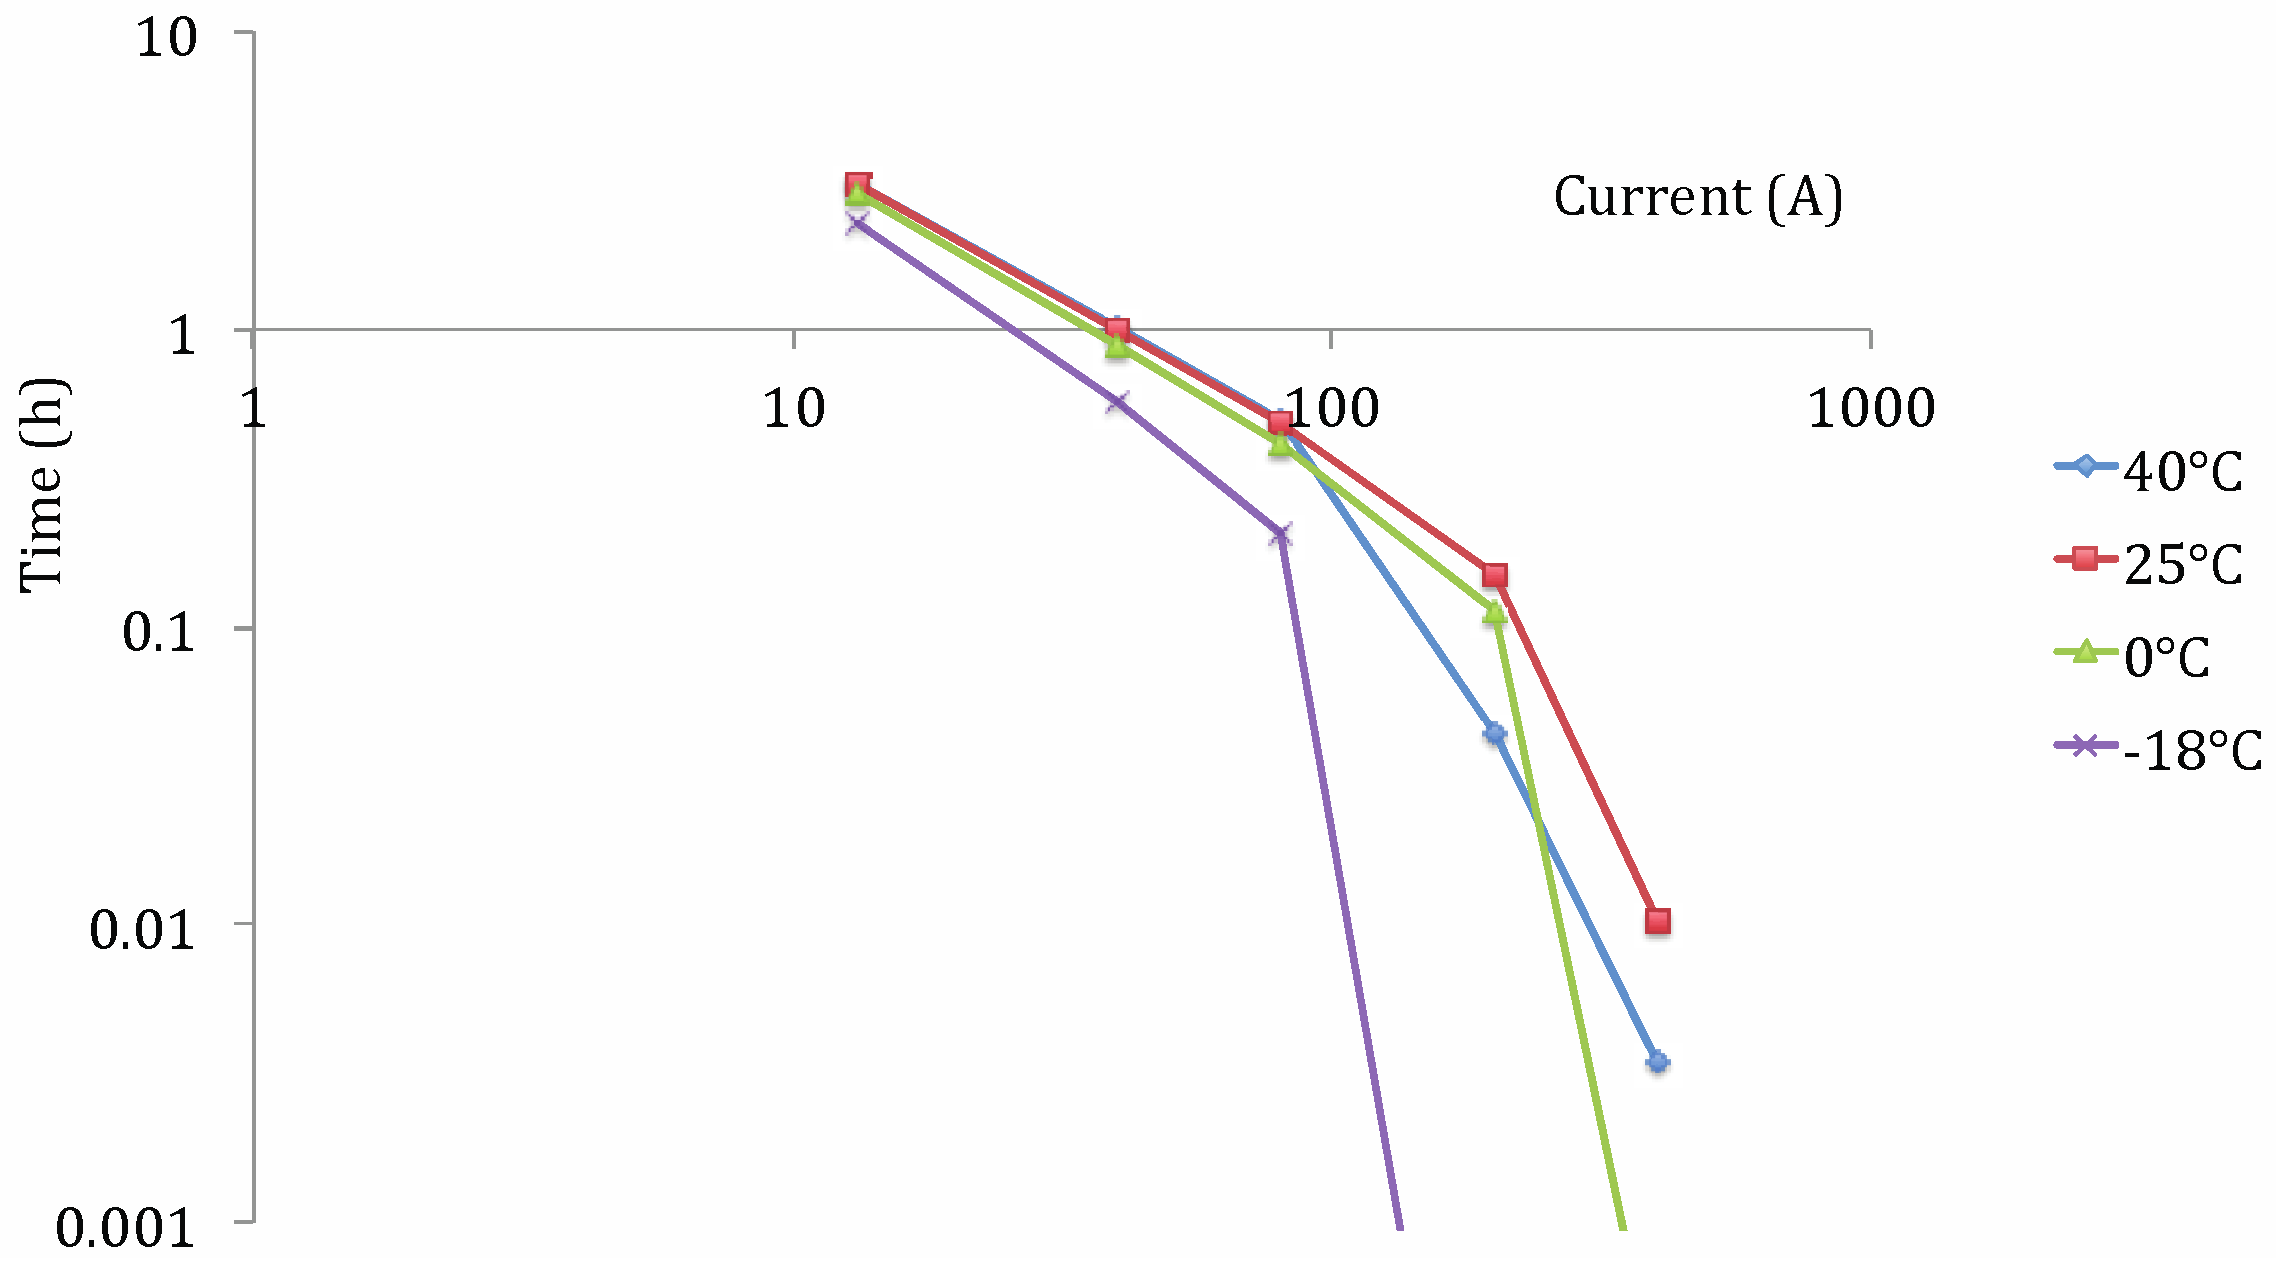
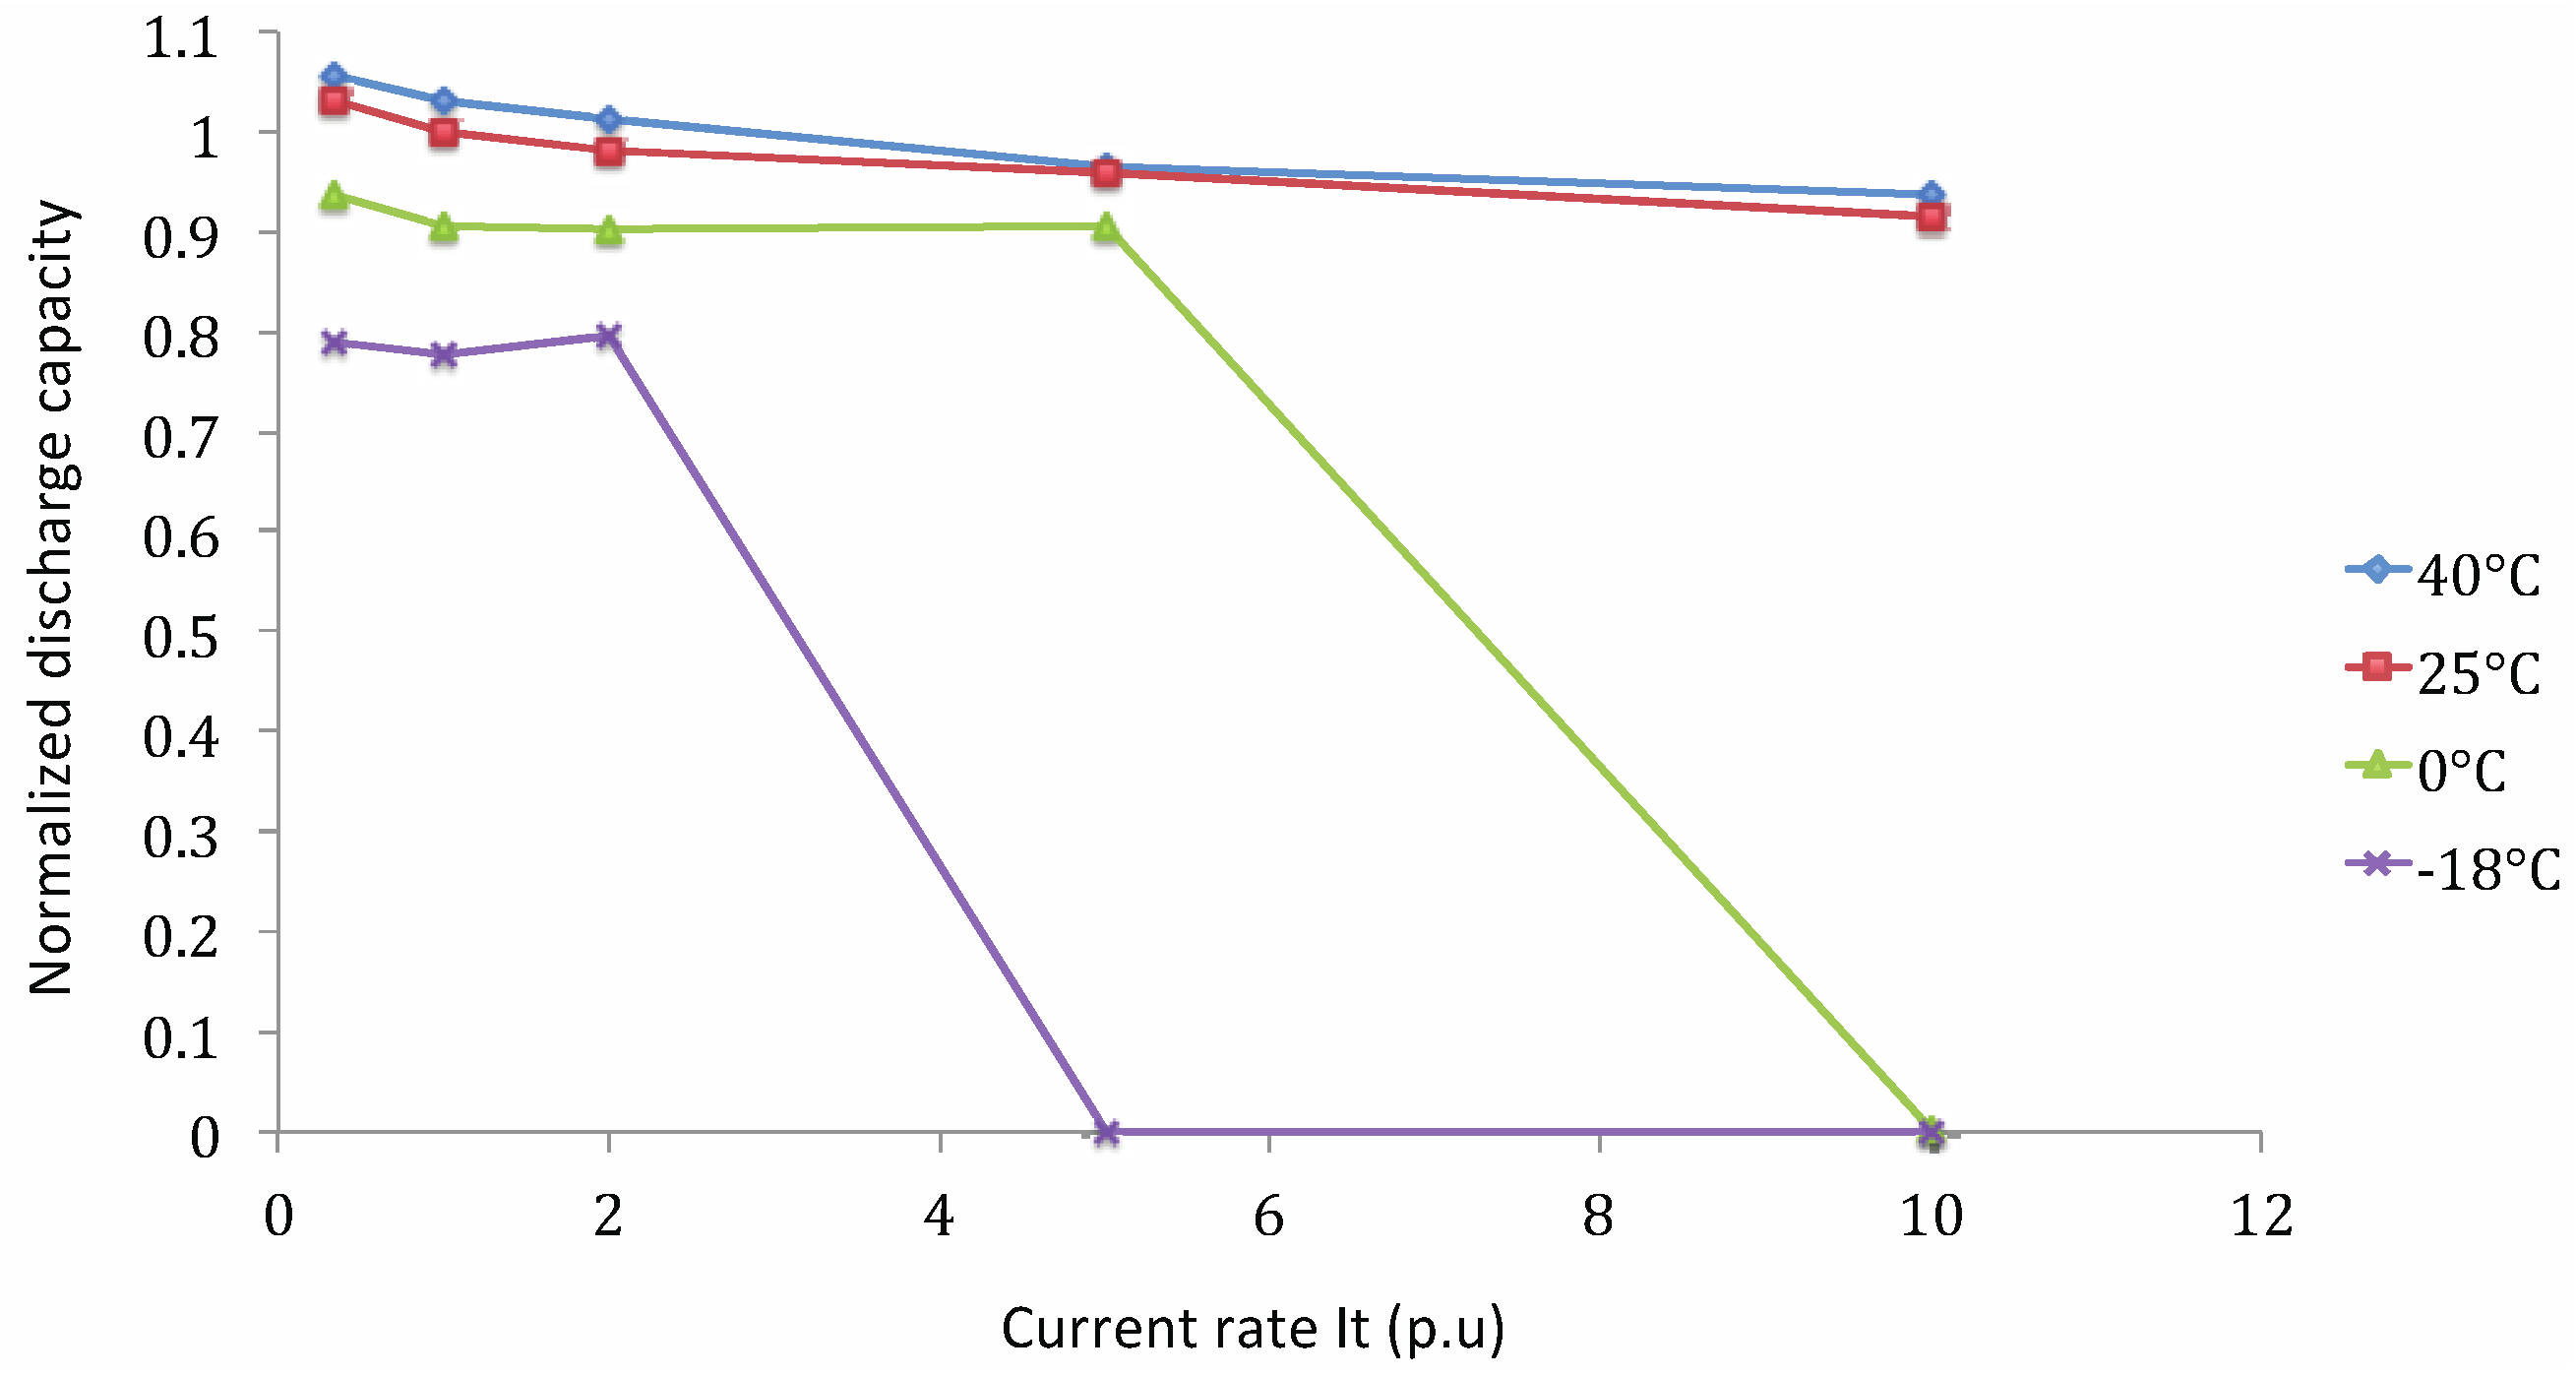
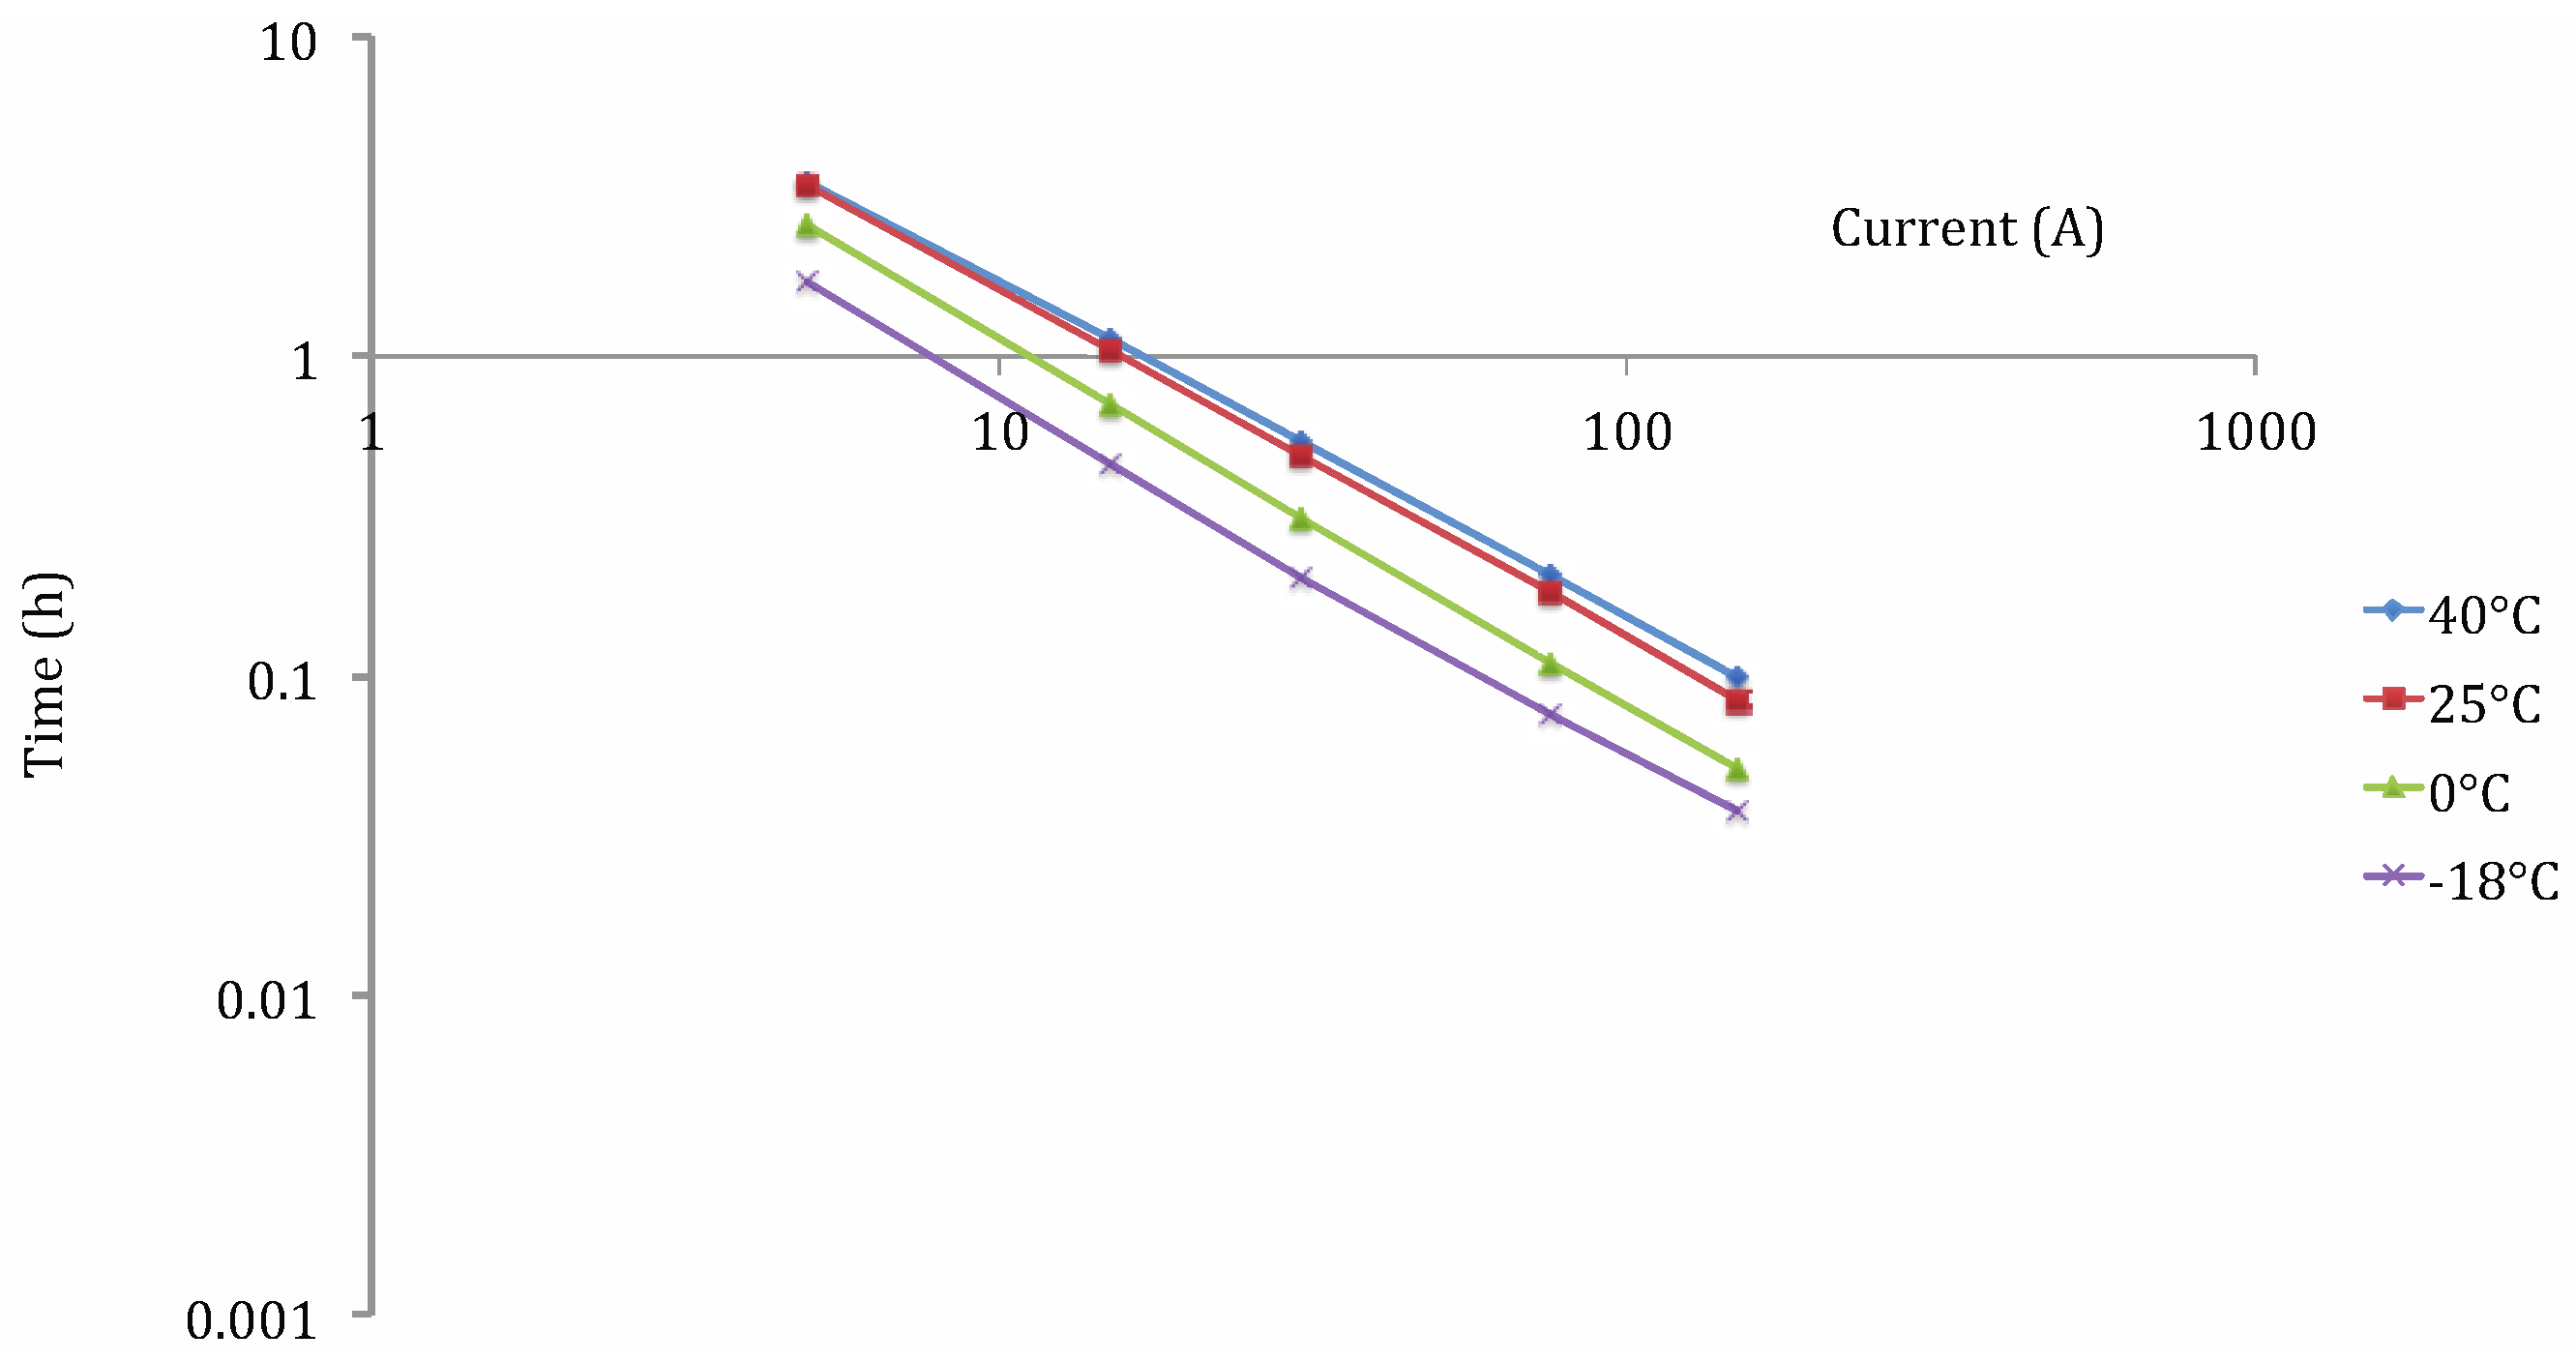
Capacity Tests at Different Working Temperatures
Lithium Nickel Manganese Cobalt Oxide (NMC)

- Cnorm: normalized discharge capacity;
- Cn,t°: discharge capacity at current rate n and working temperature t° (A h);
- C1It,25°C: discharge capacity at 1 It current rate and 25 °C (A h).
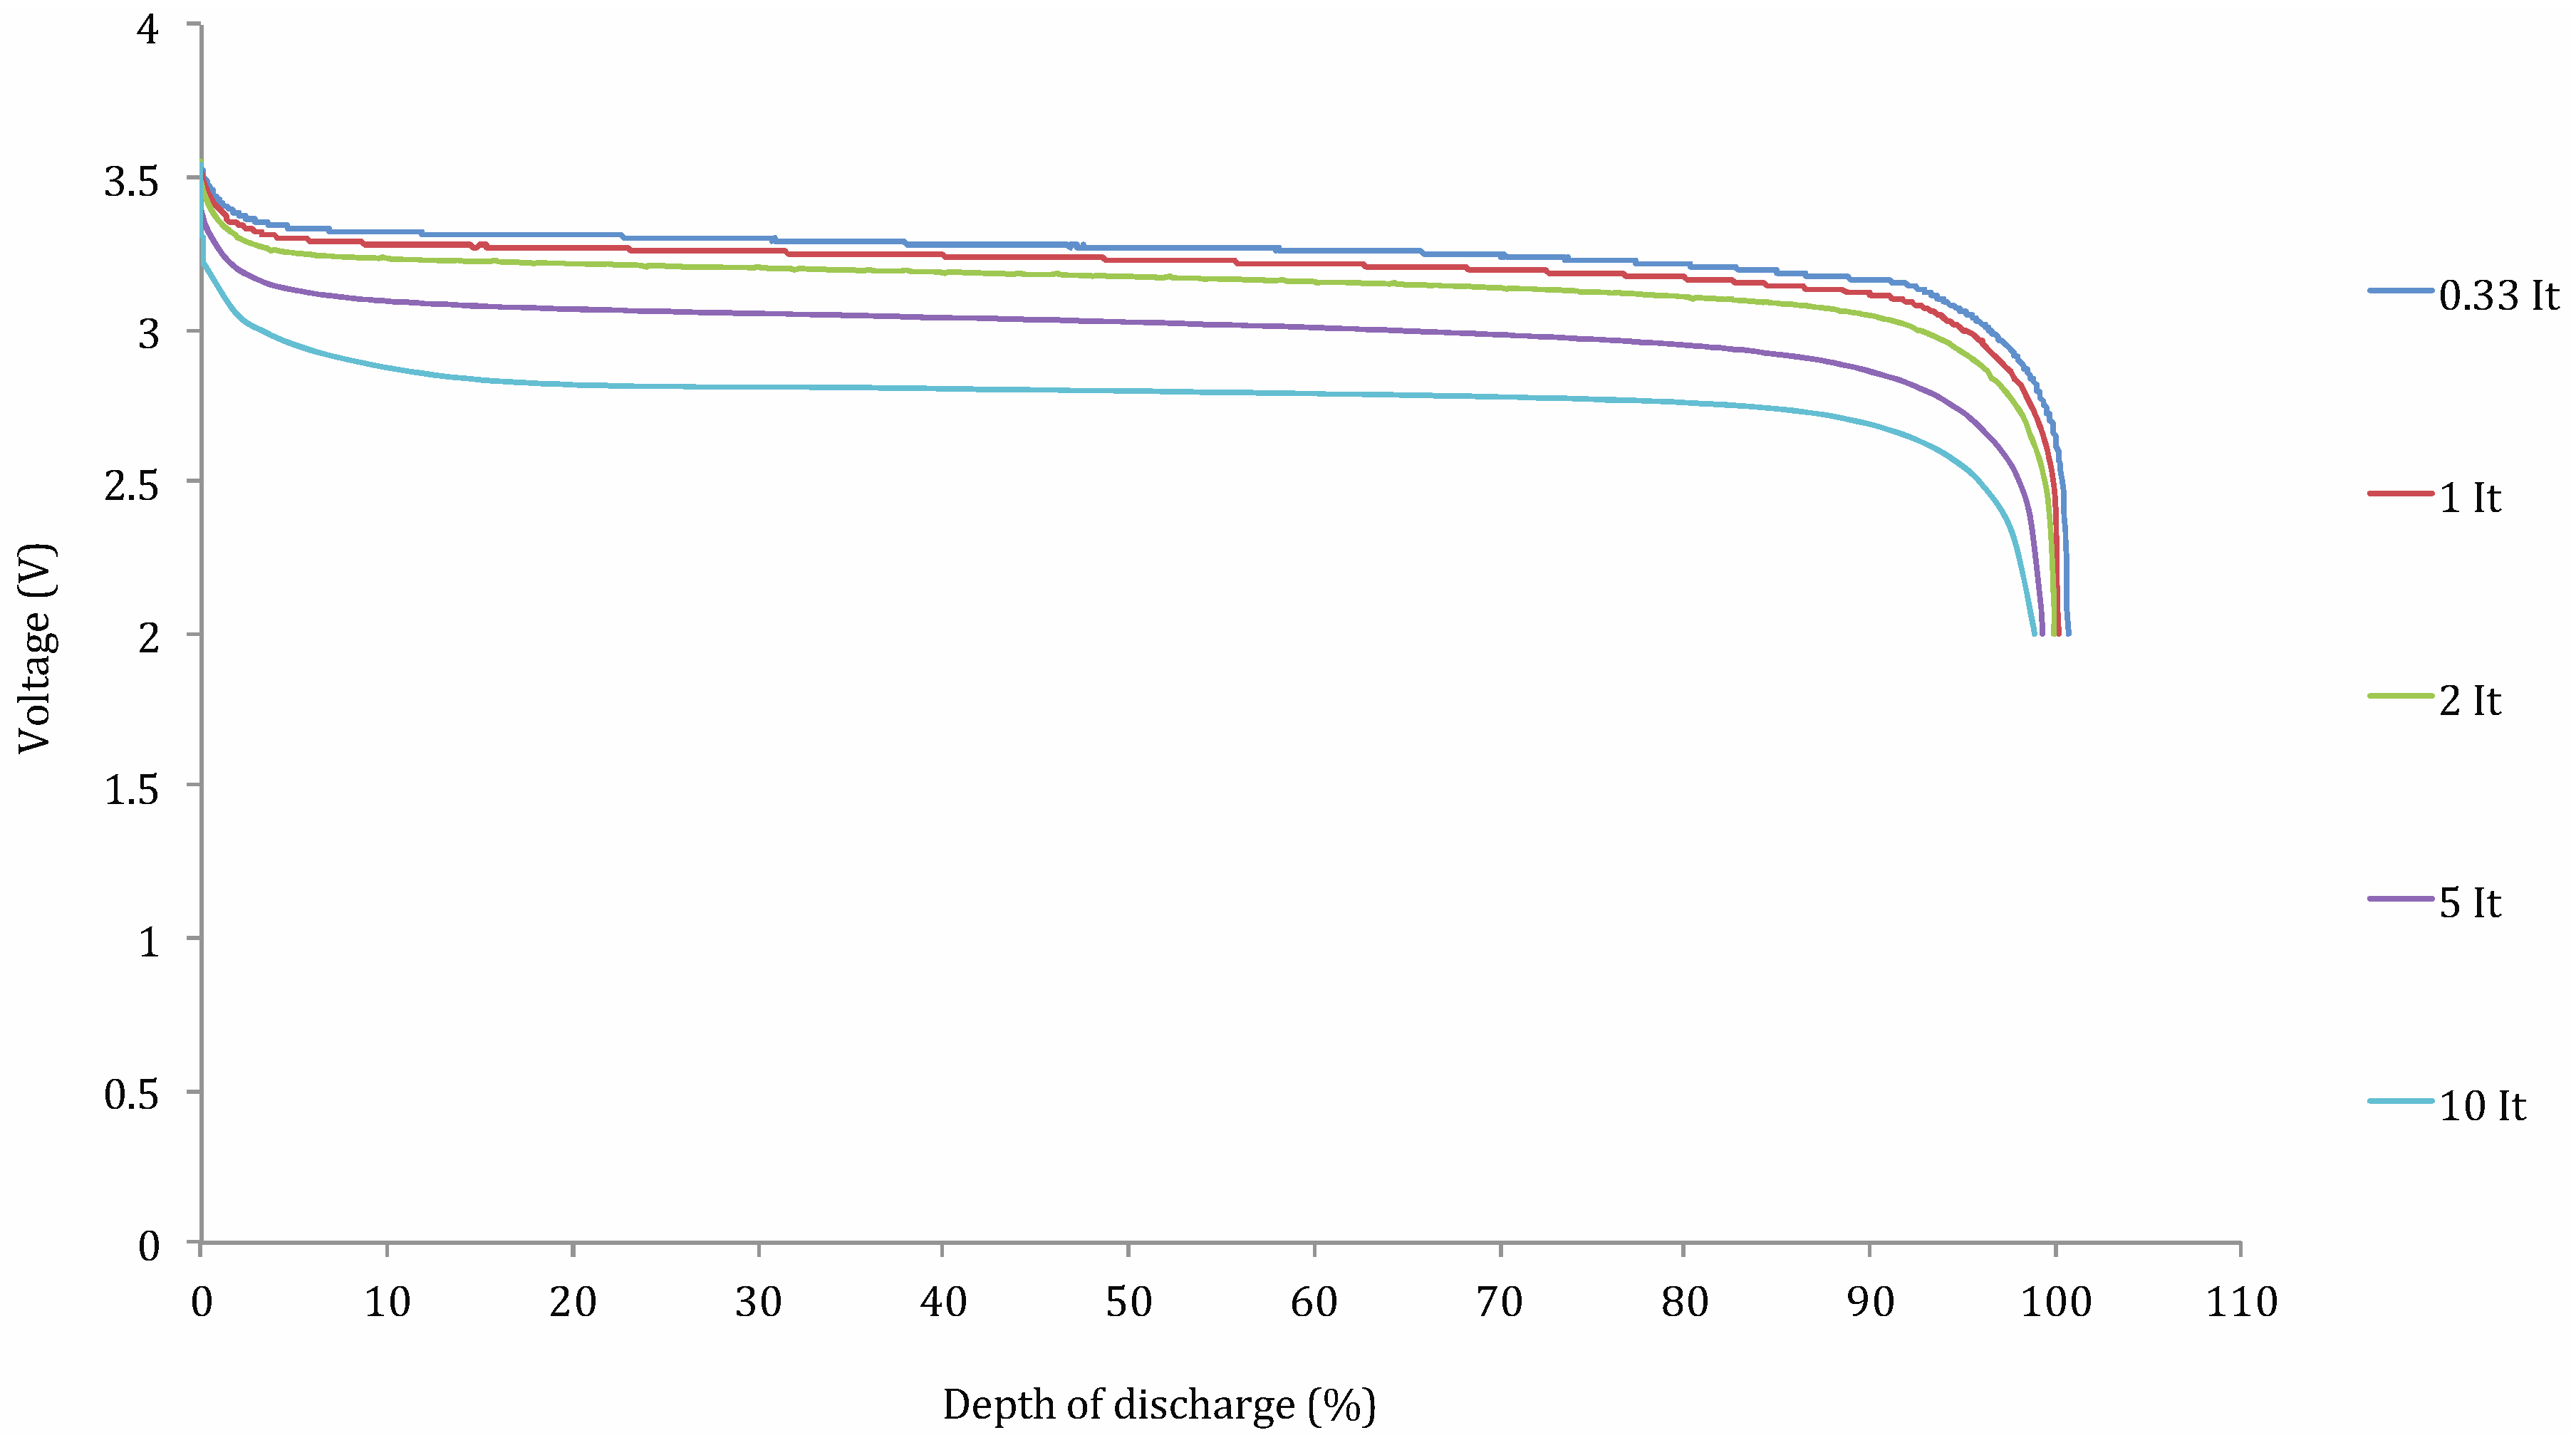
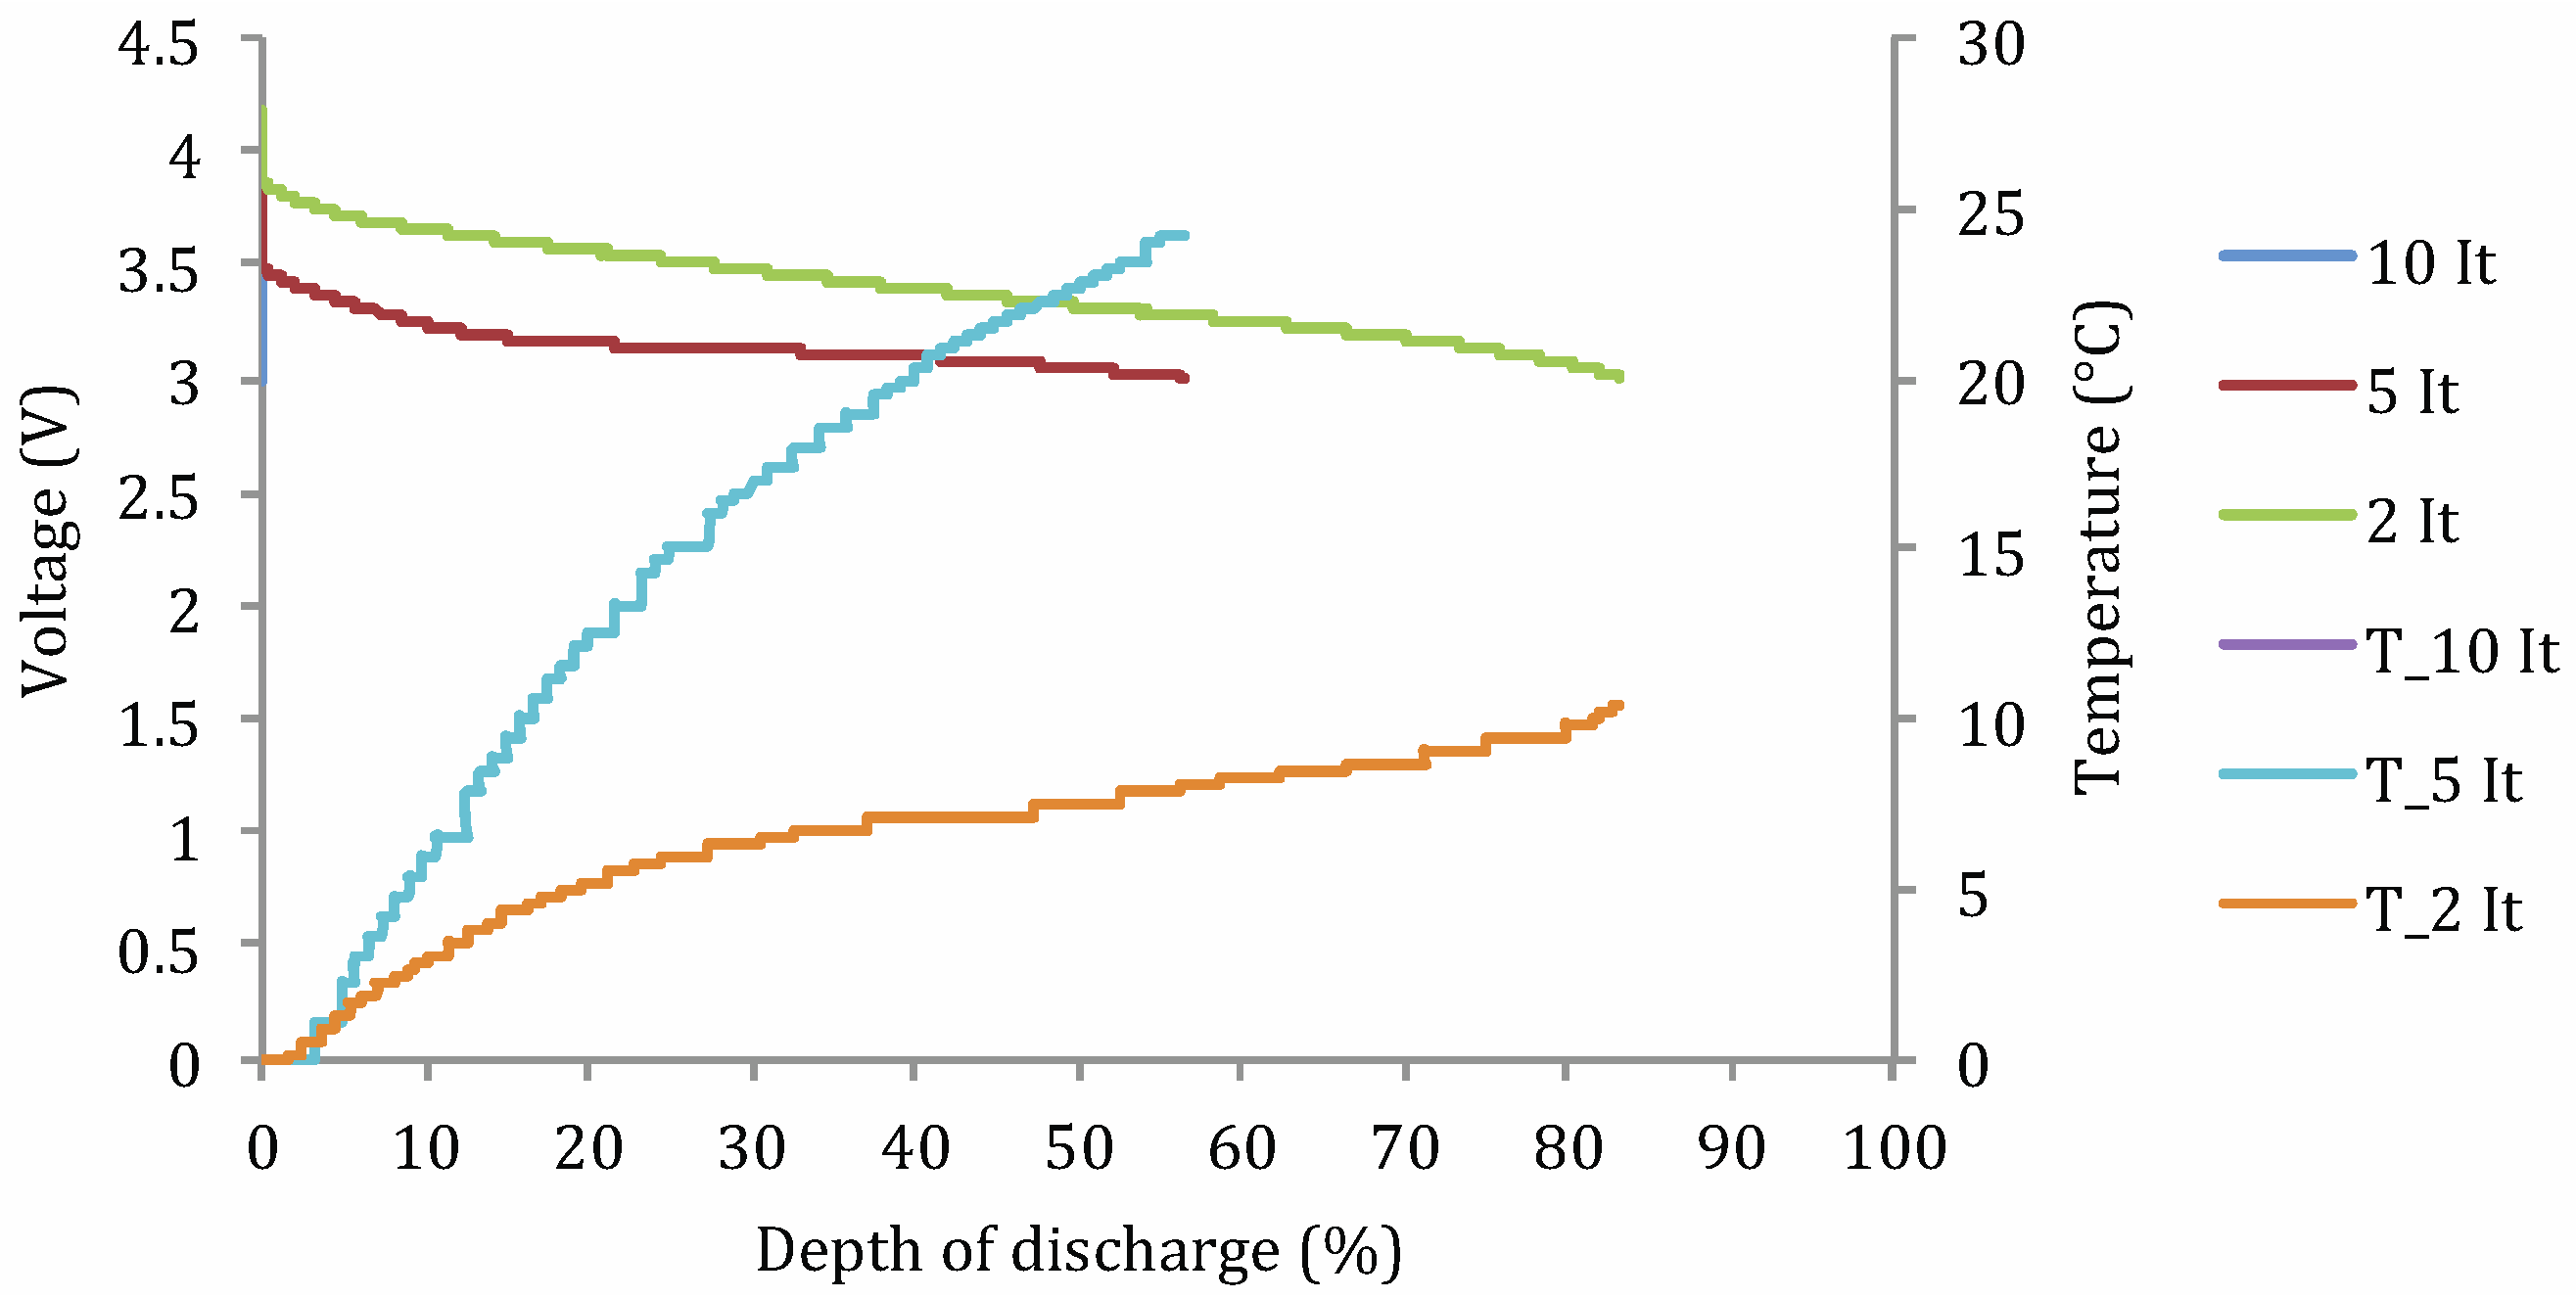
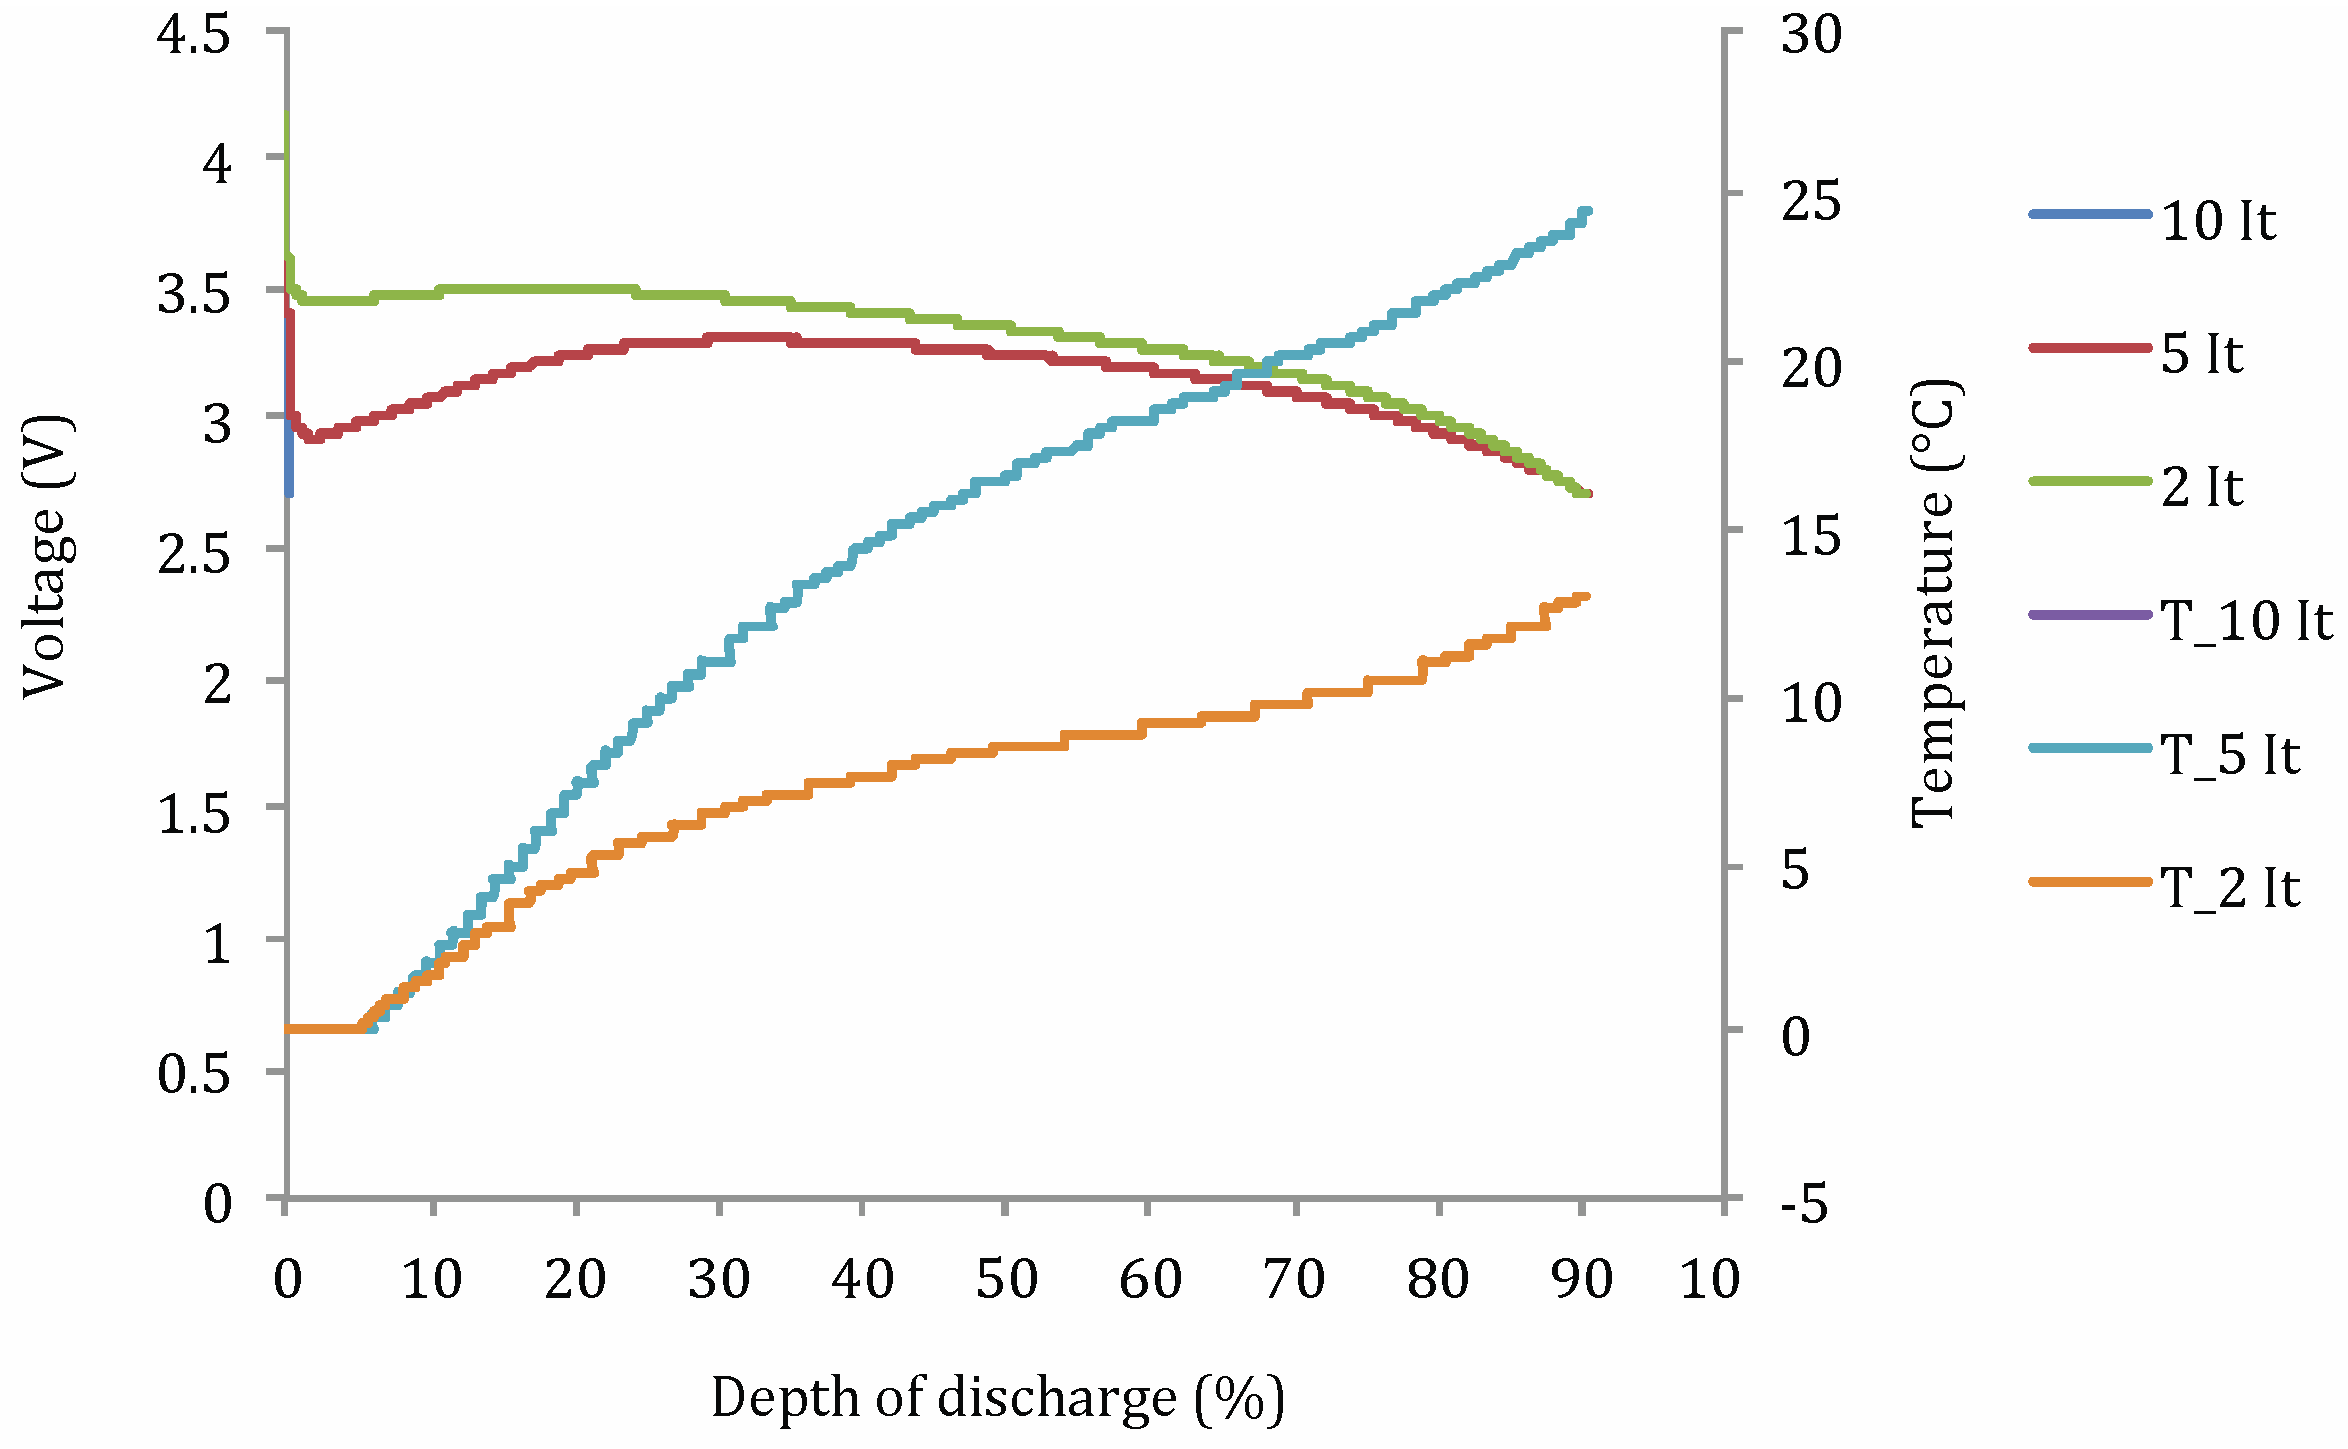
- Cdis: discharge capacity (A h);
- DoD: depth of discharge (%);
- t°: operating temperature (°C);
- Idis: applied current (A);
- Ccte: a constant.
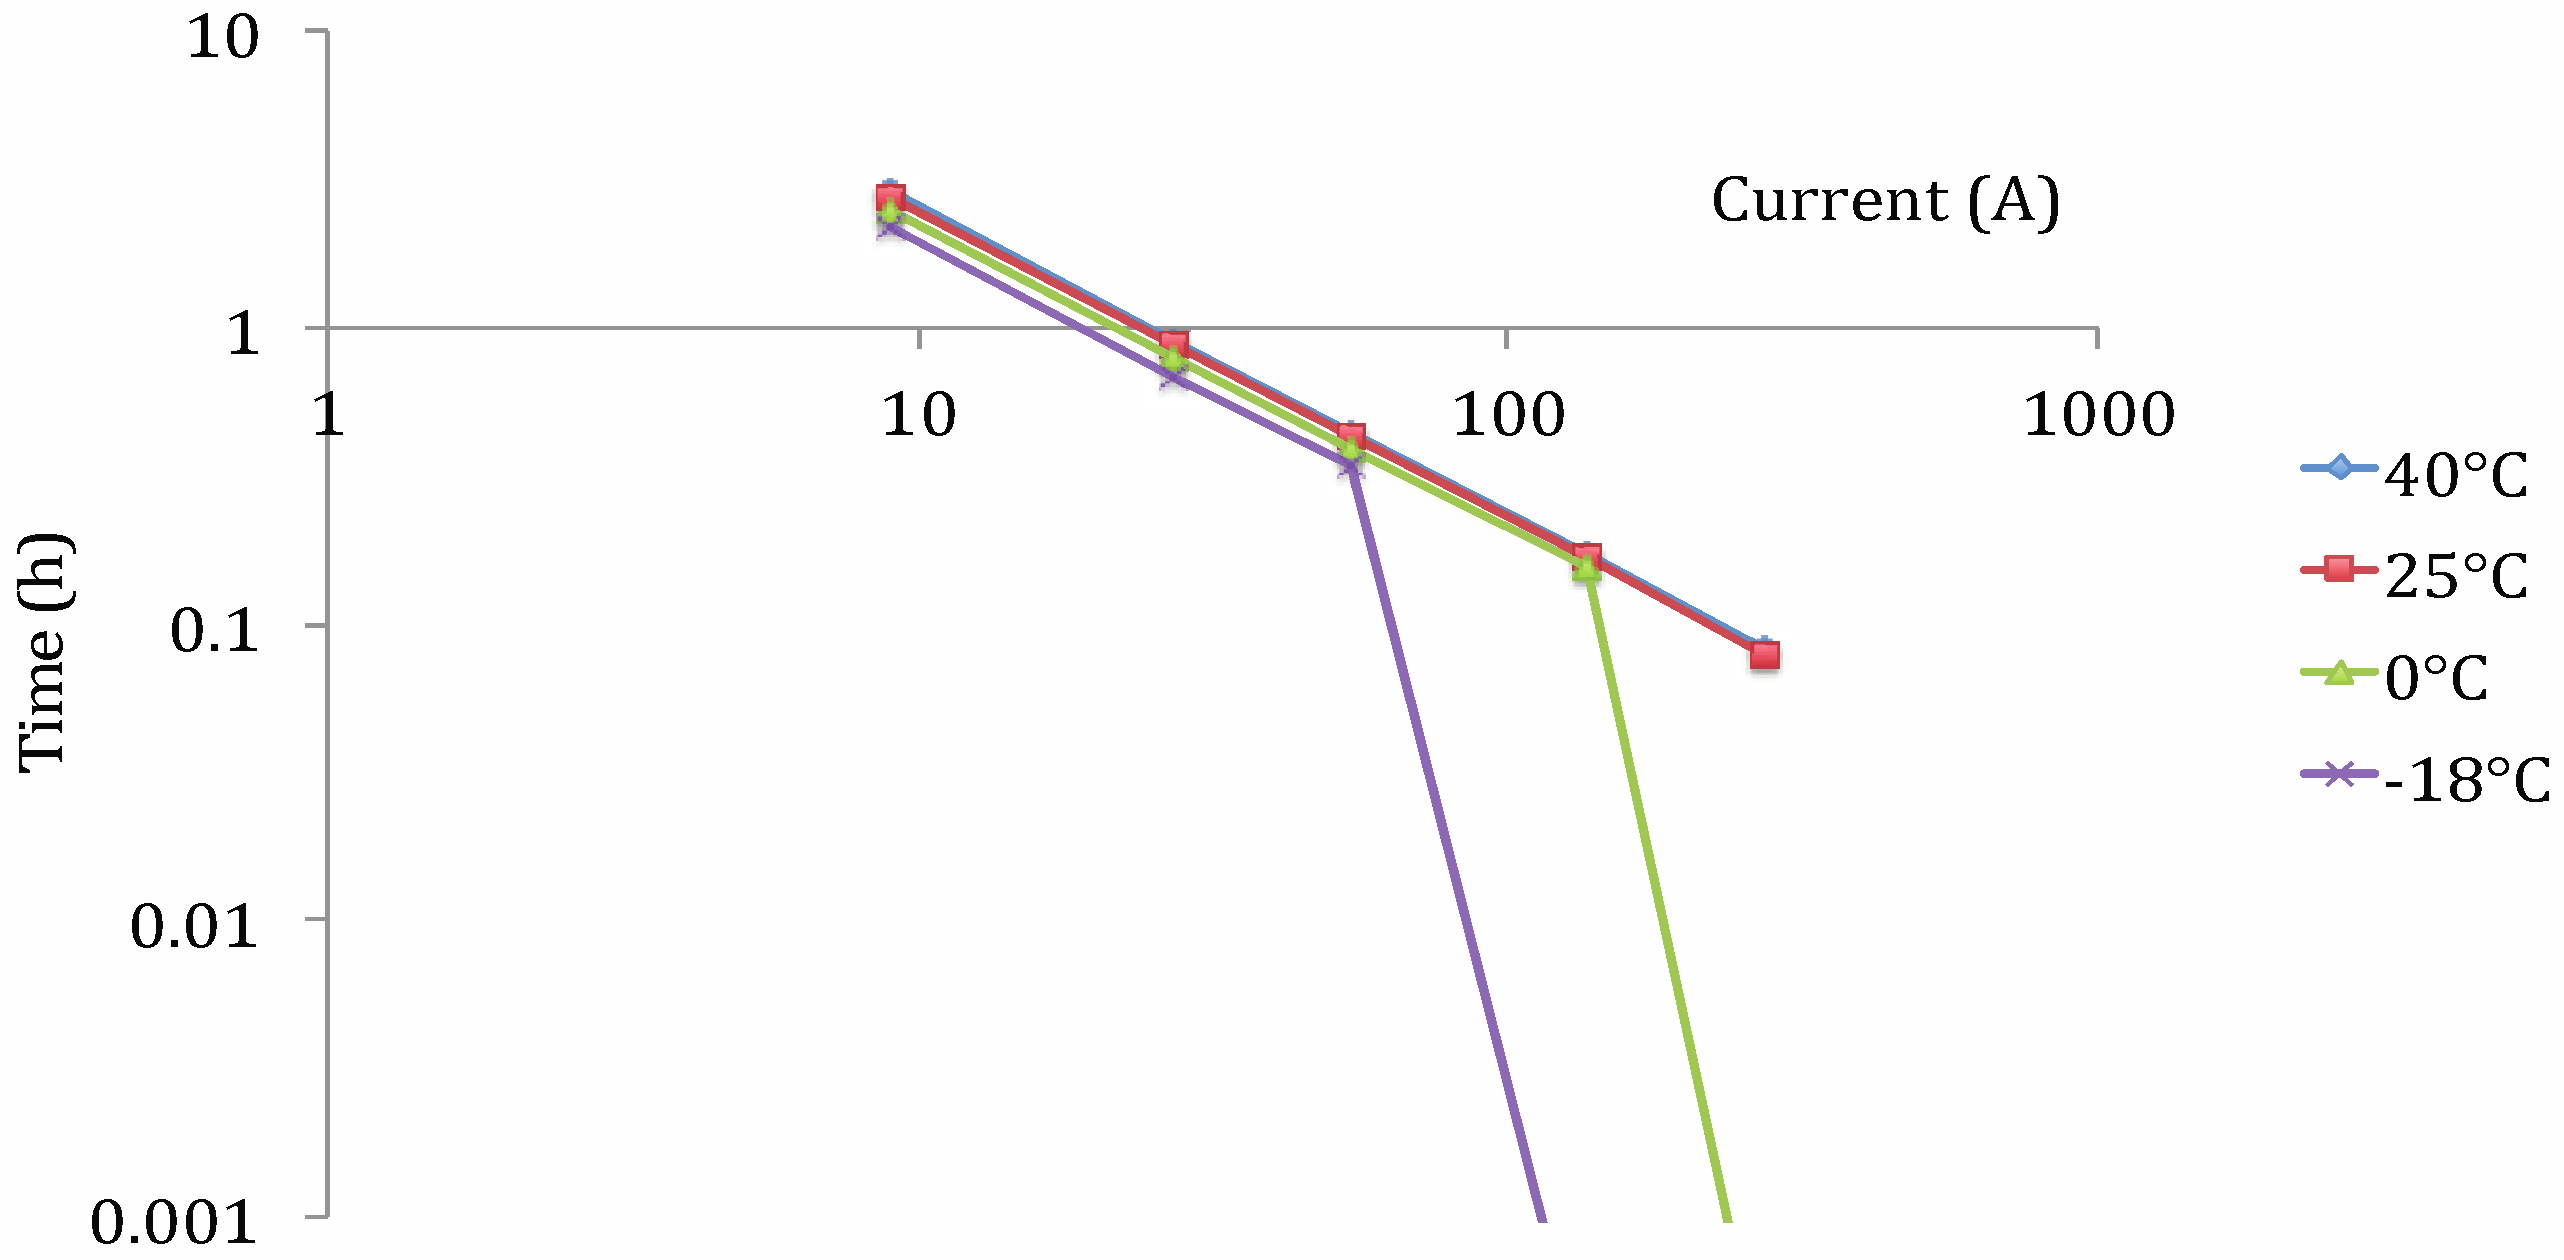
Lithium Iron Phosphate (LFP)


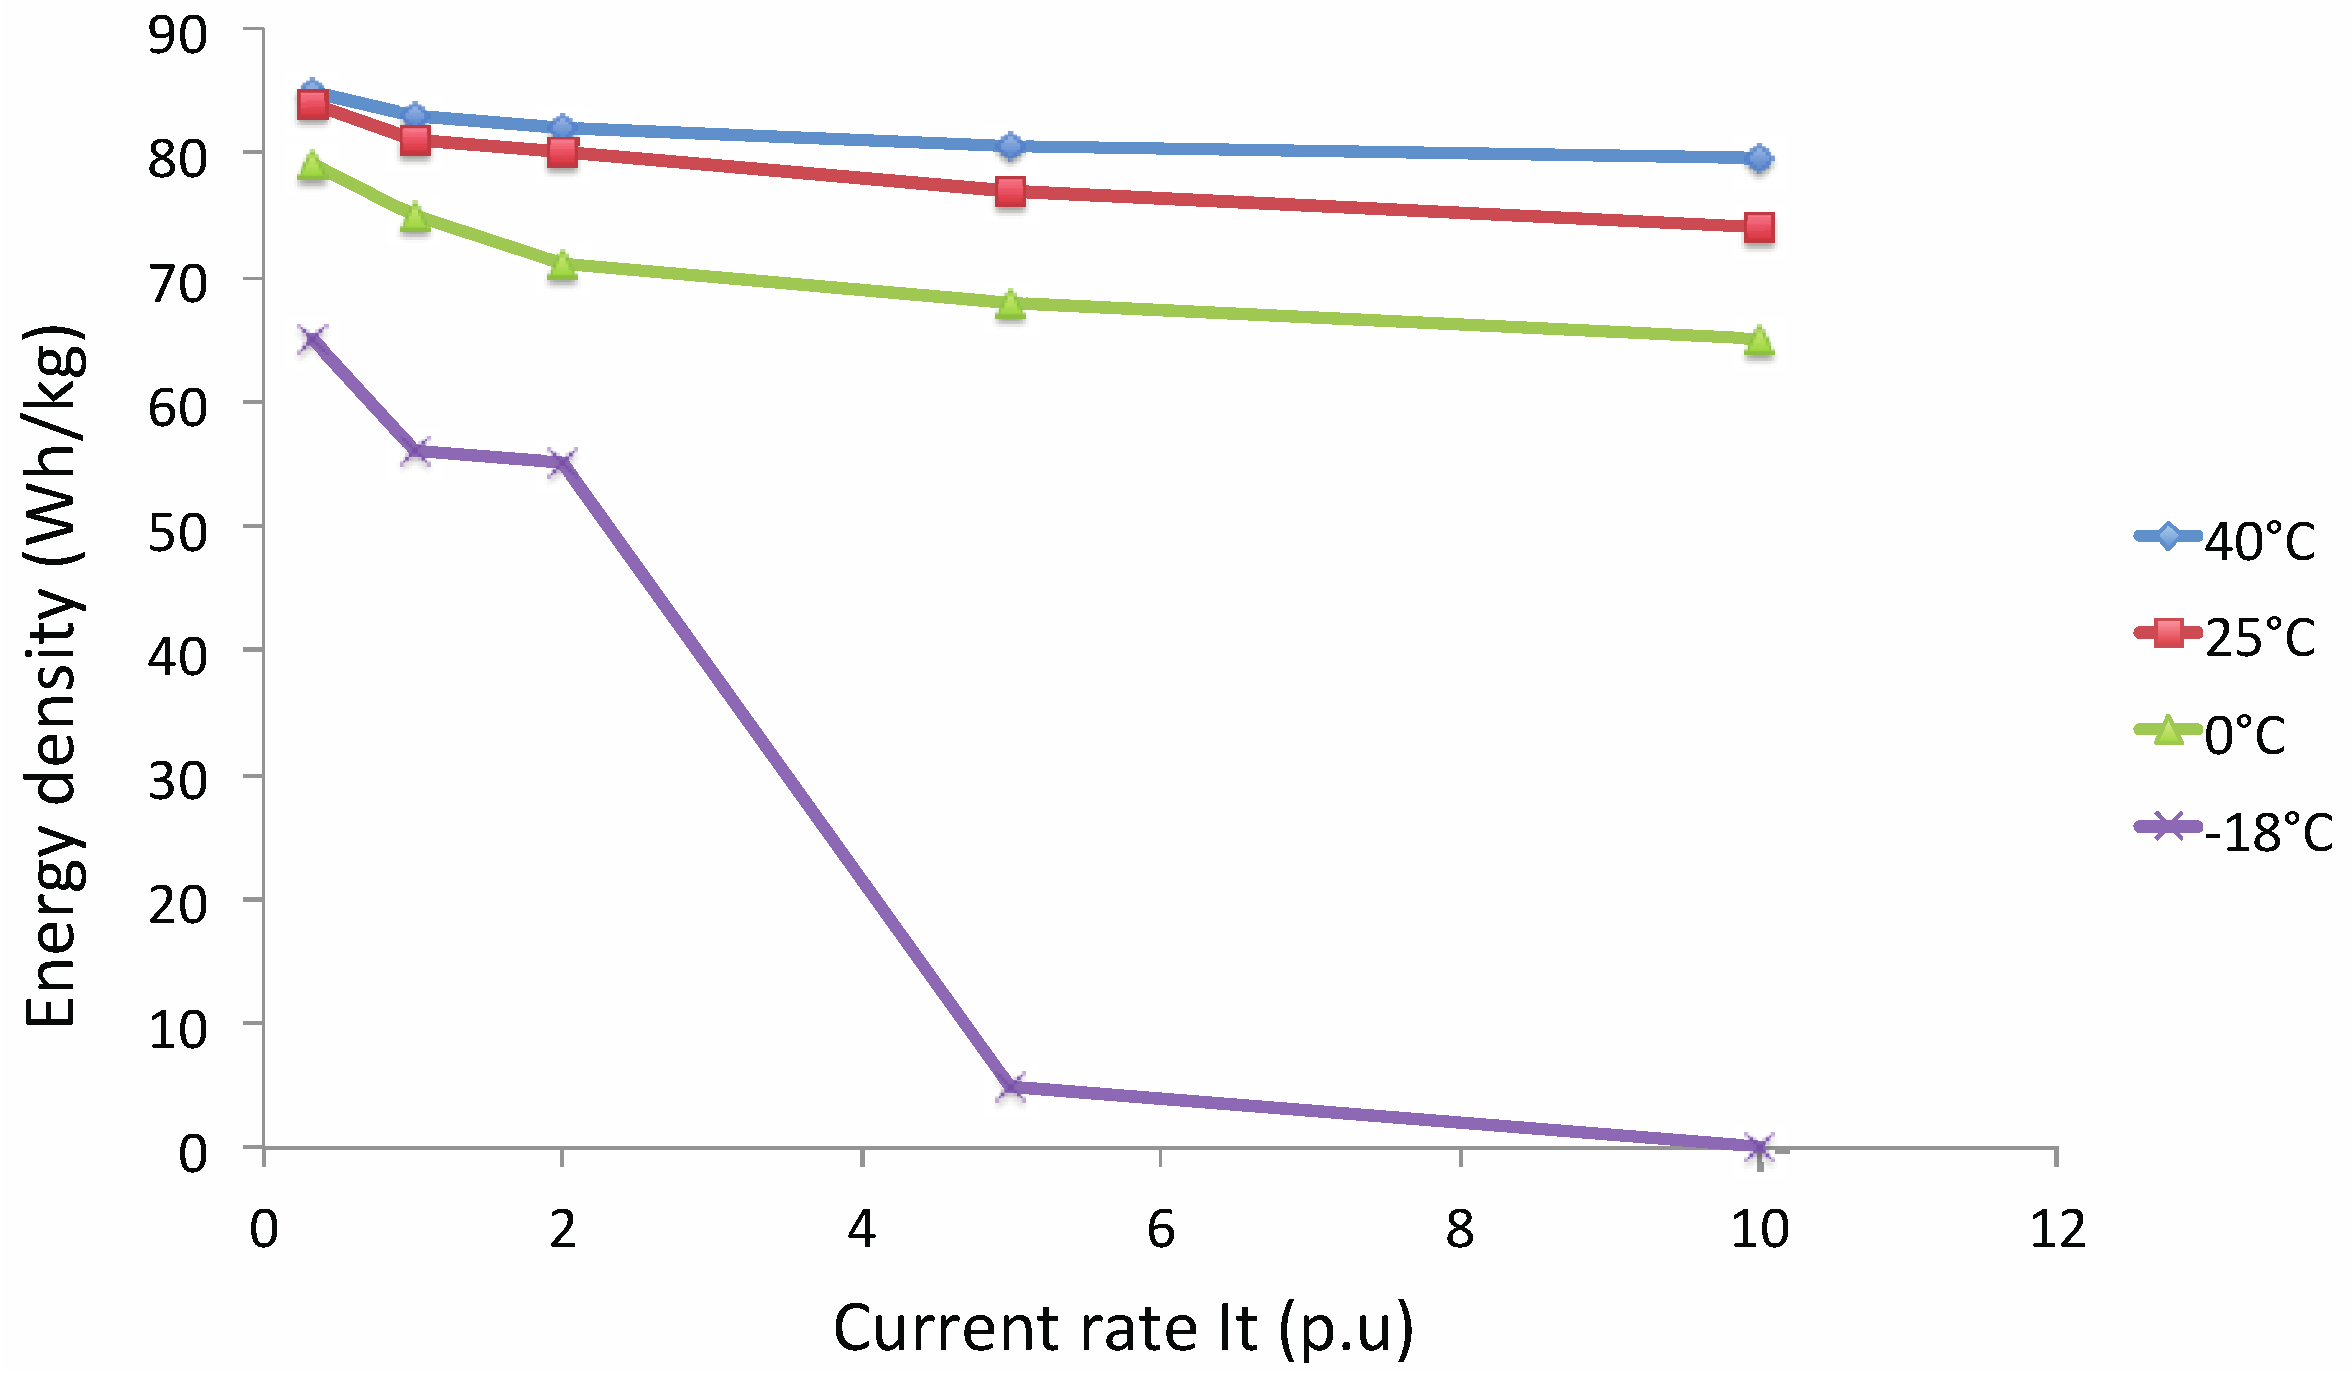
- ρden: energy density (W h/kg);
- I: applied current (A);
- a and b: coefficient (W h/kg);
- It: reference current (A).
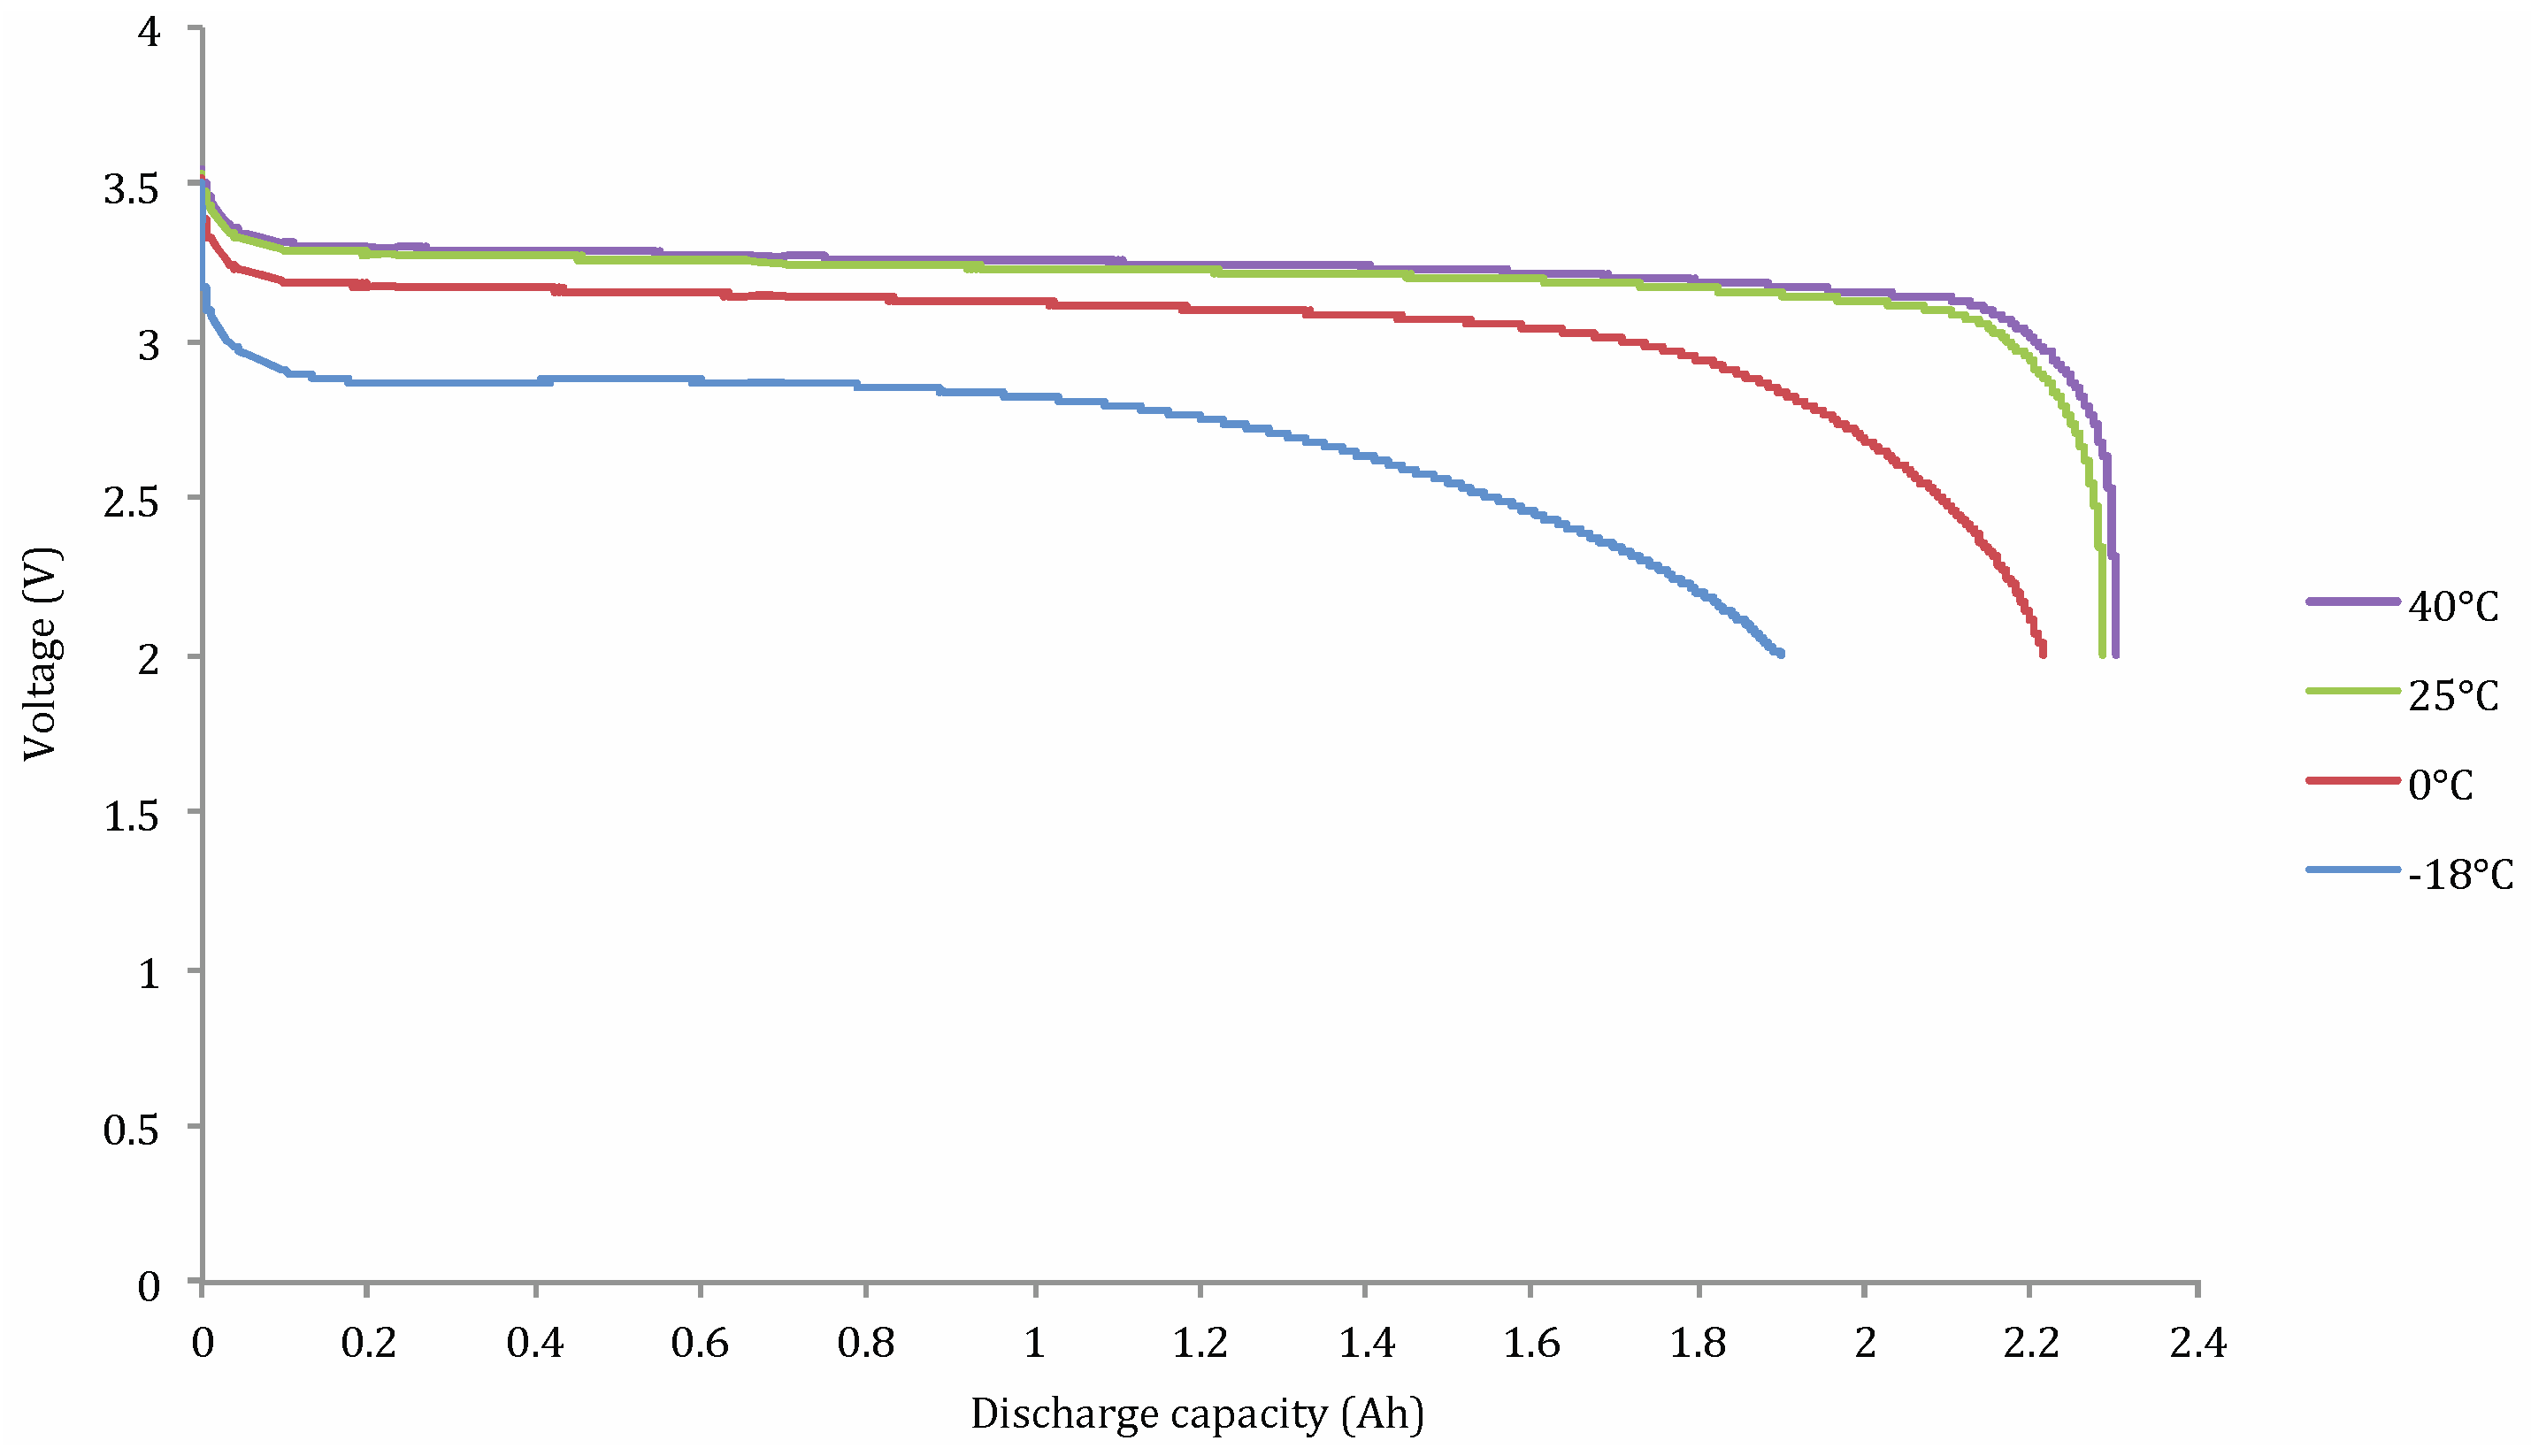
| Current rate It (A) | Discharge capacity at 40 °C (A h) | Discharge capacity at 25 °C (A h) | Discharge capacity at 10 °C (A h) |
|---|---|---|---|
| 0.33 | 0.220 | 0.200 | 0.189 |
| 1 | 0.220 | 0.210 | 0.195 |
| 2 | 0.240 | 0.230 | 0.200 |
| 3 | 0.242 | 0.232 | 0.225 |
| 5 | 0.244 | 0.237 | 0.227 |
| 10 | 0.245 | 0.242 | 0.229 |
| Current rate It (A) | Discharge capacity at 40 °C (A h) | Discharge capacity at 25 °C (A h) | Discharge capacity at 10 °C (A h) |
|---|---|---|---|
| 0.33 | 0.200 | 0.188 | 0.185 |
| 1 | 0.205 | 0.195 | 0.192 |
| 2 | 0.215 | 0.220 | 0.198 |
| 3 | 0.225 | 0.225 | 0.210 |
| 5 | 0.228 | 0.232 | 0.22 |
| 10 | 0.235 | 0.238 | 0.225 |
Lithium Nickel Cobalt Aluminum Oxide (NCA)
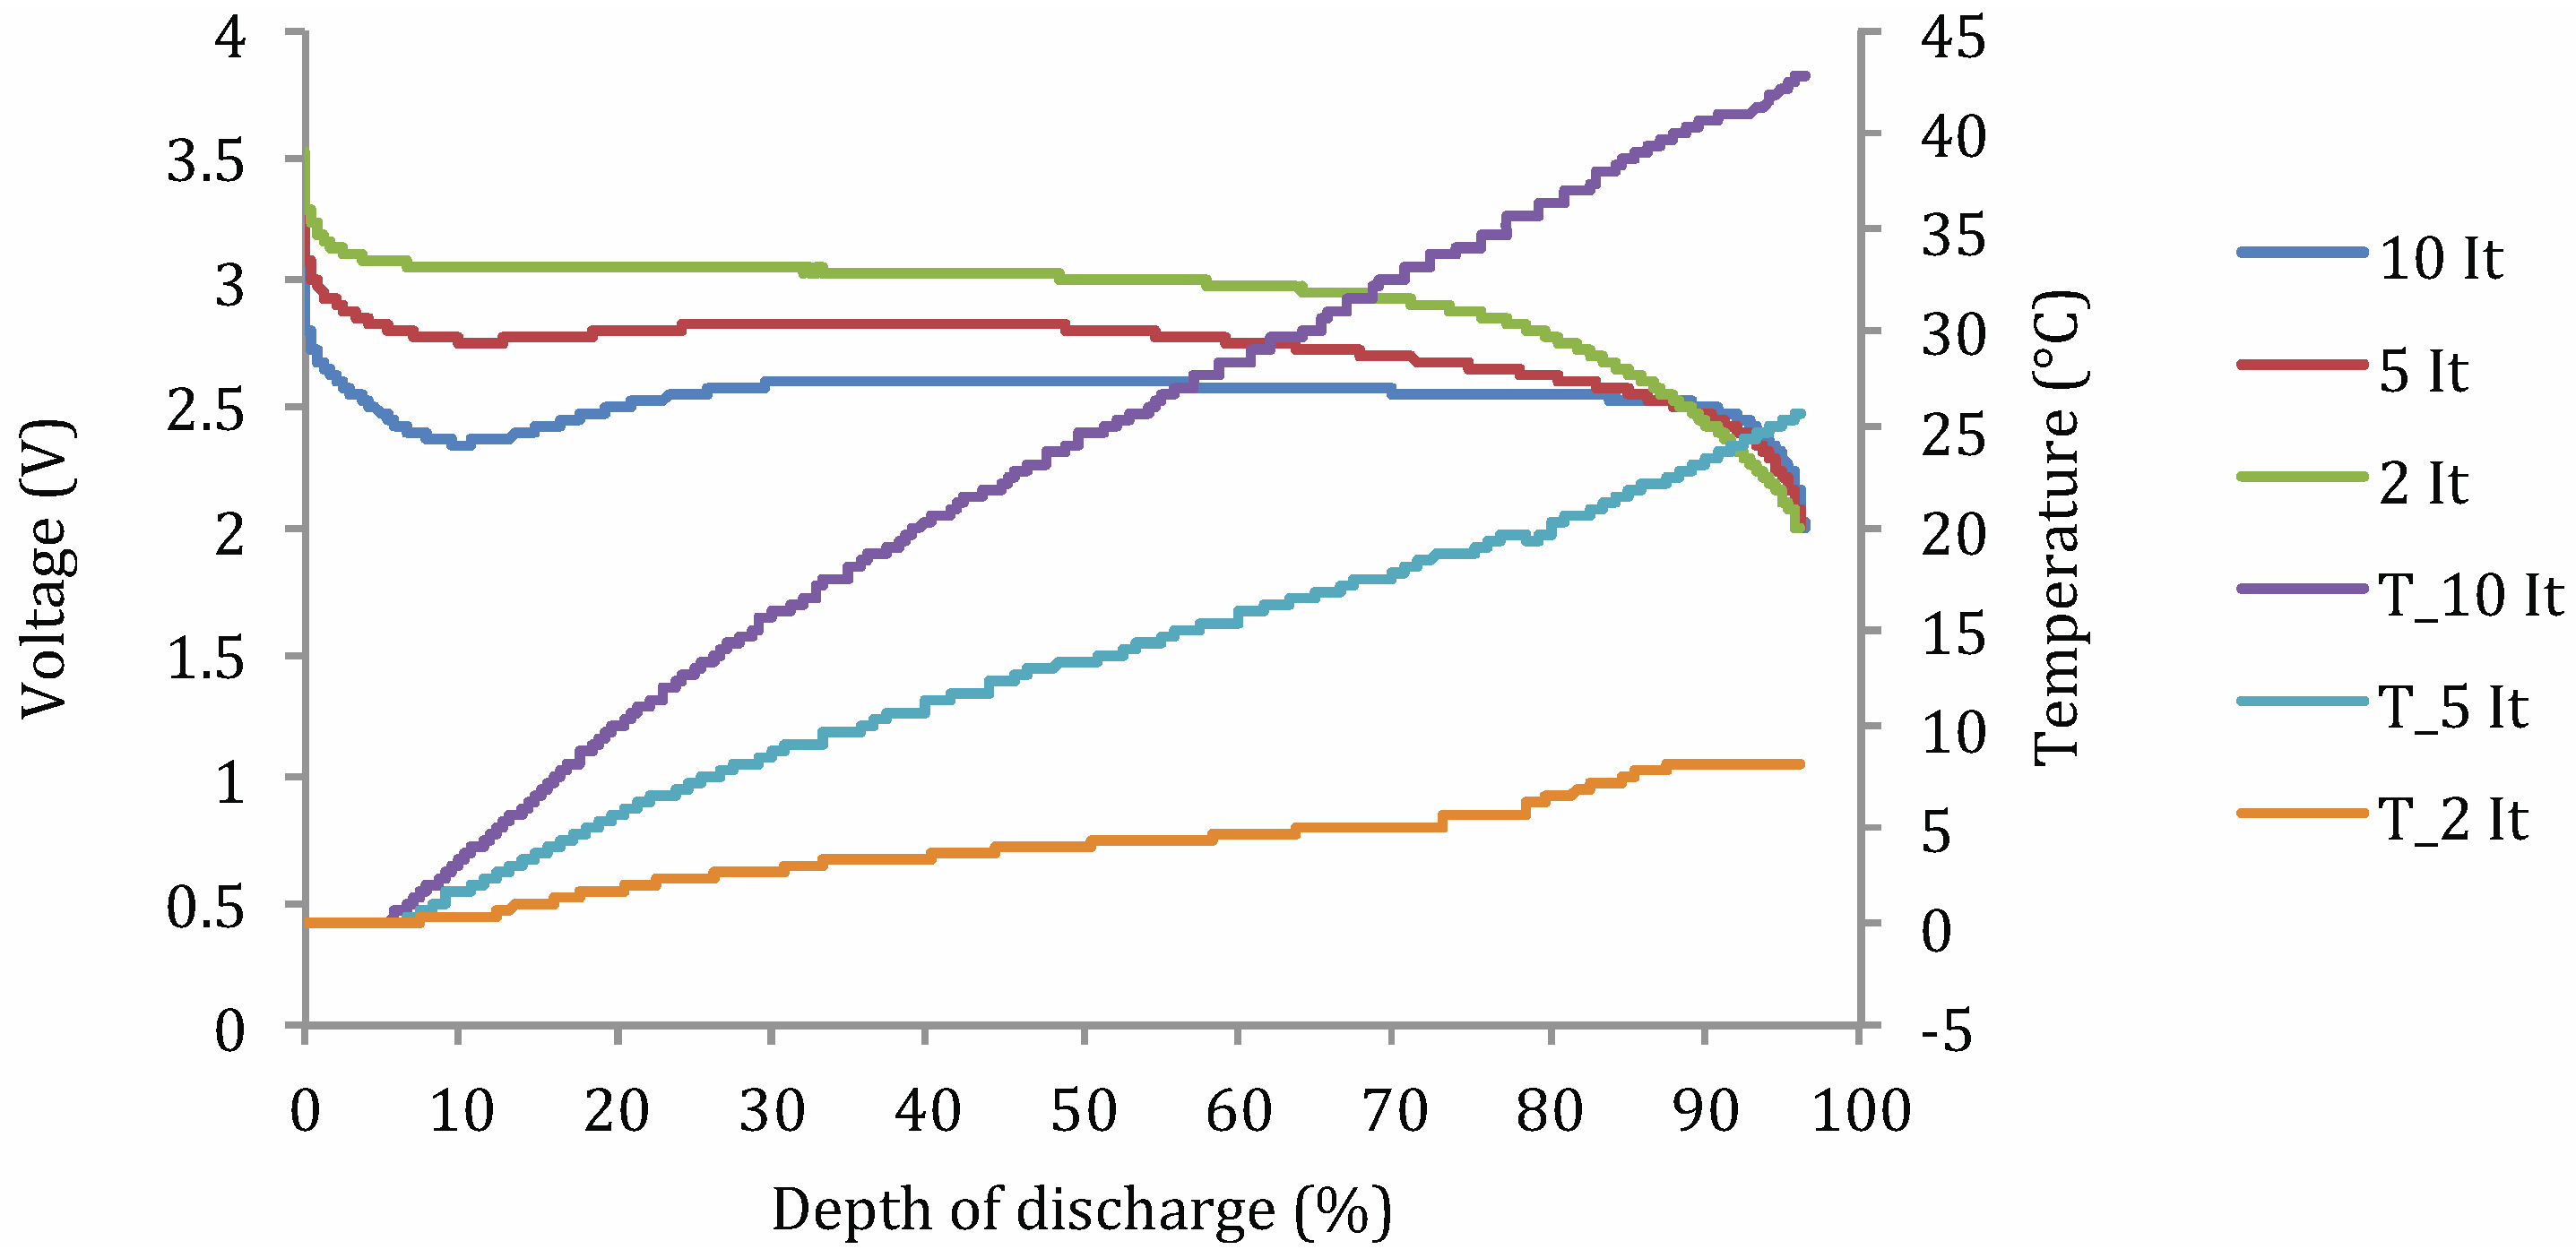
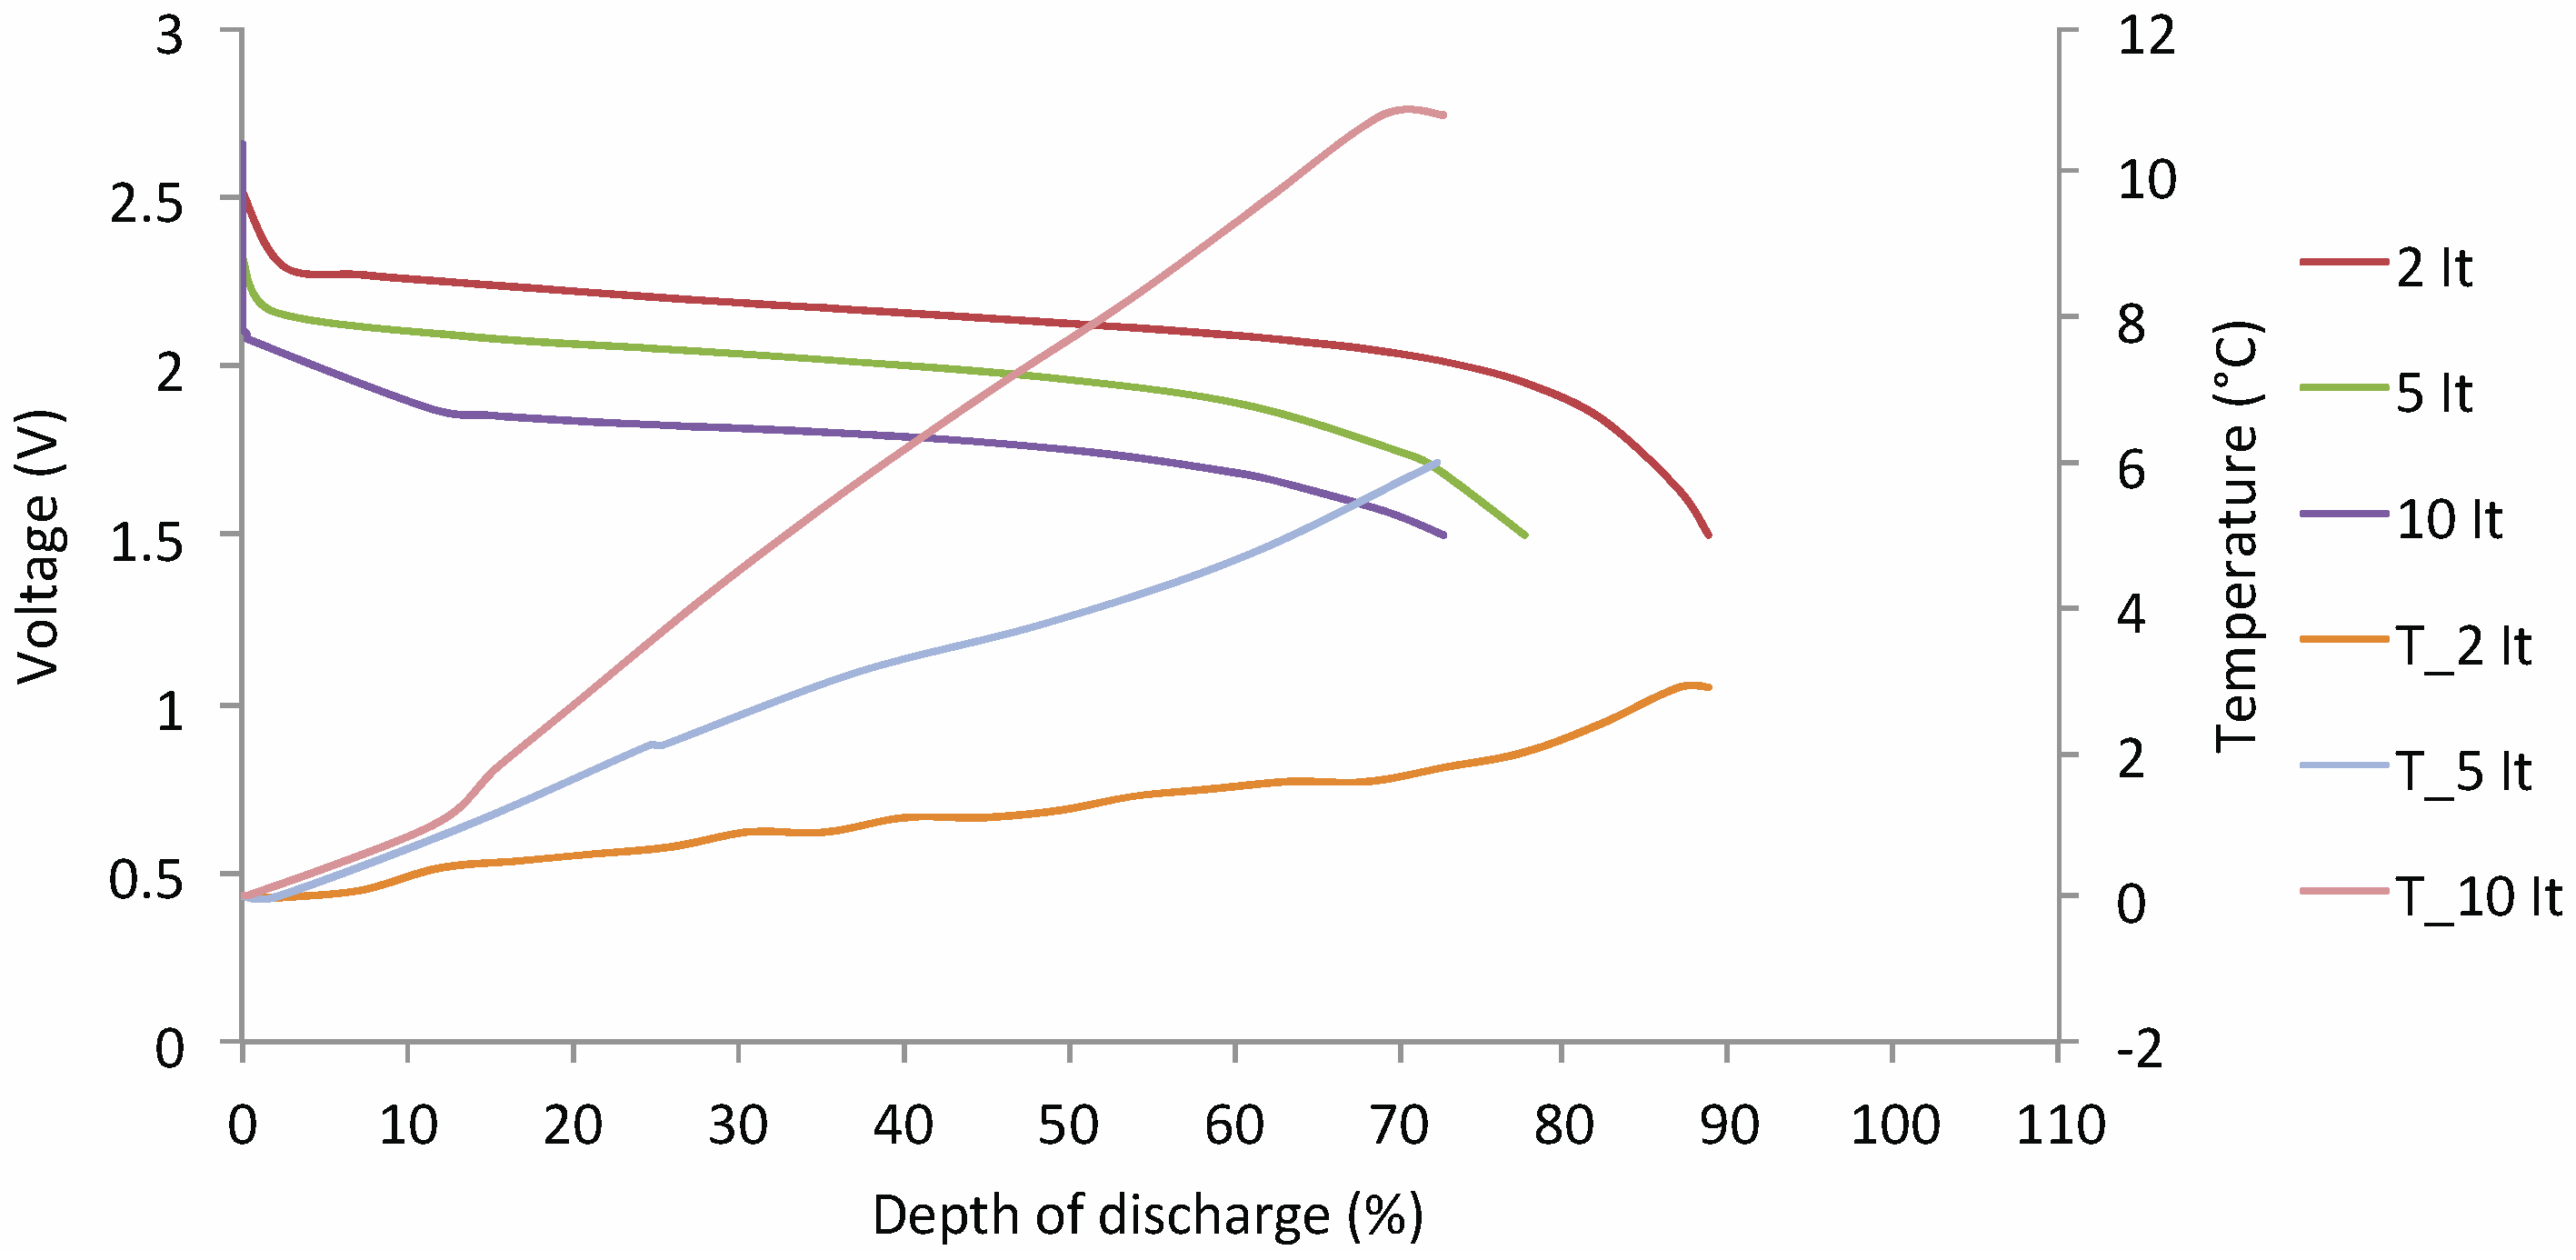
Lithium Titanate (LTO)
- Cnorm: normalized capacity;
- c and d: coefficient.

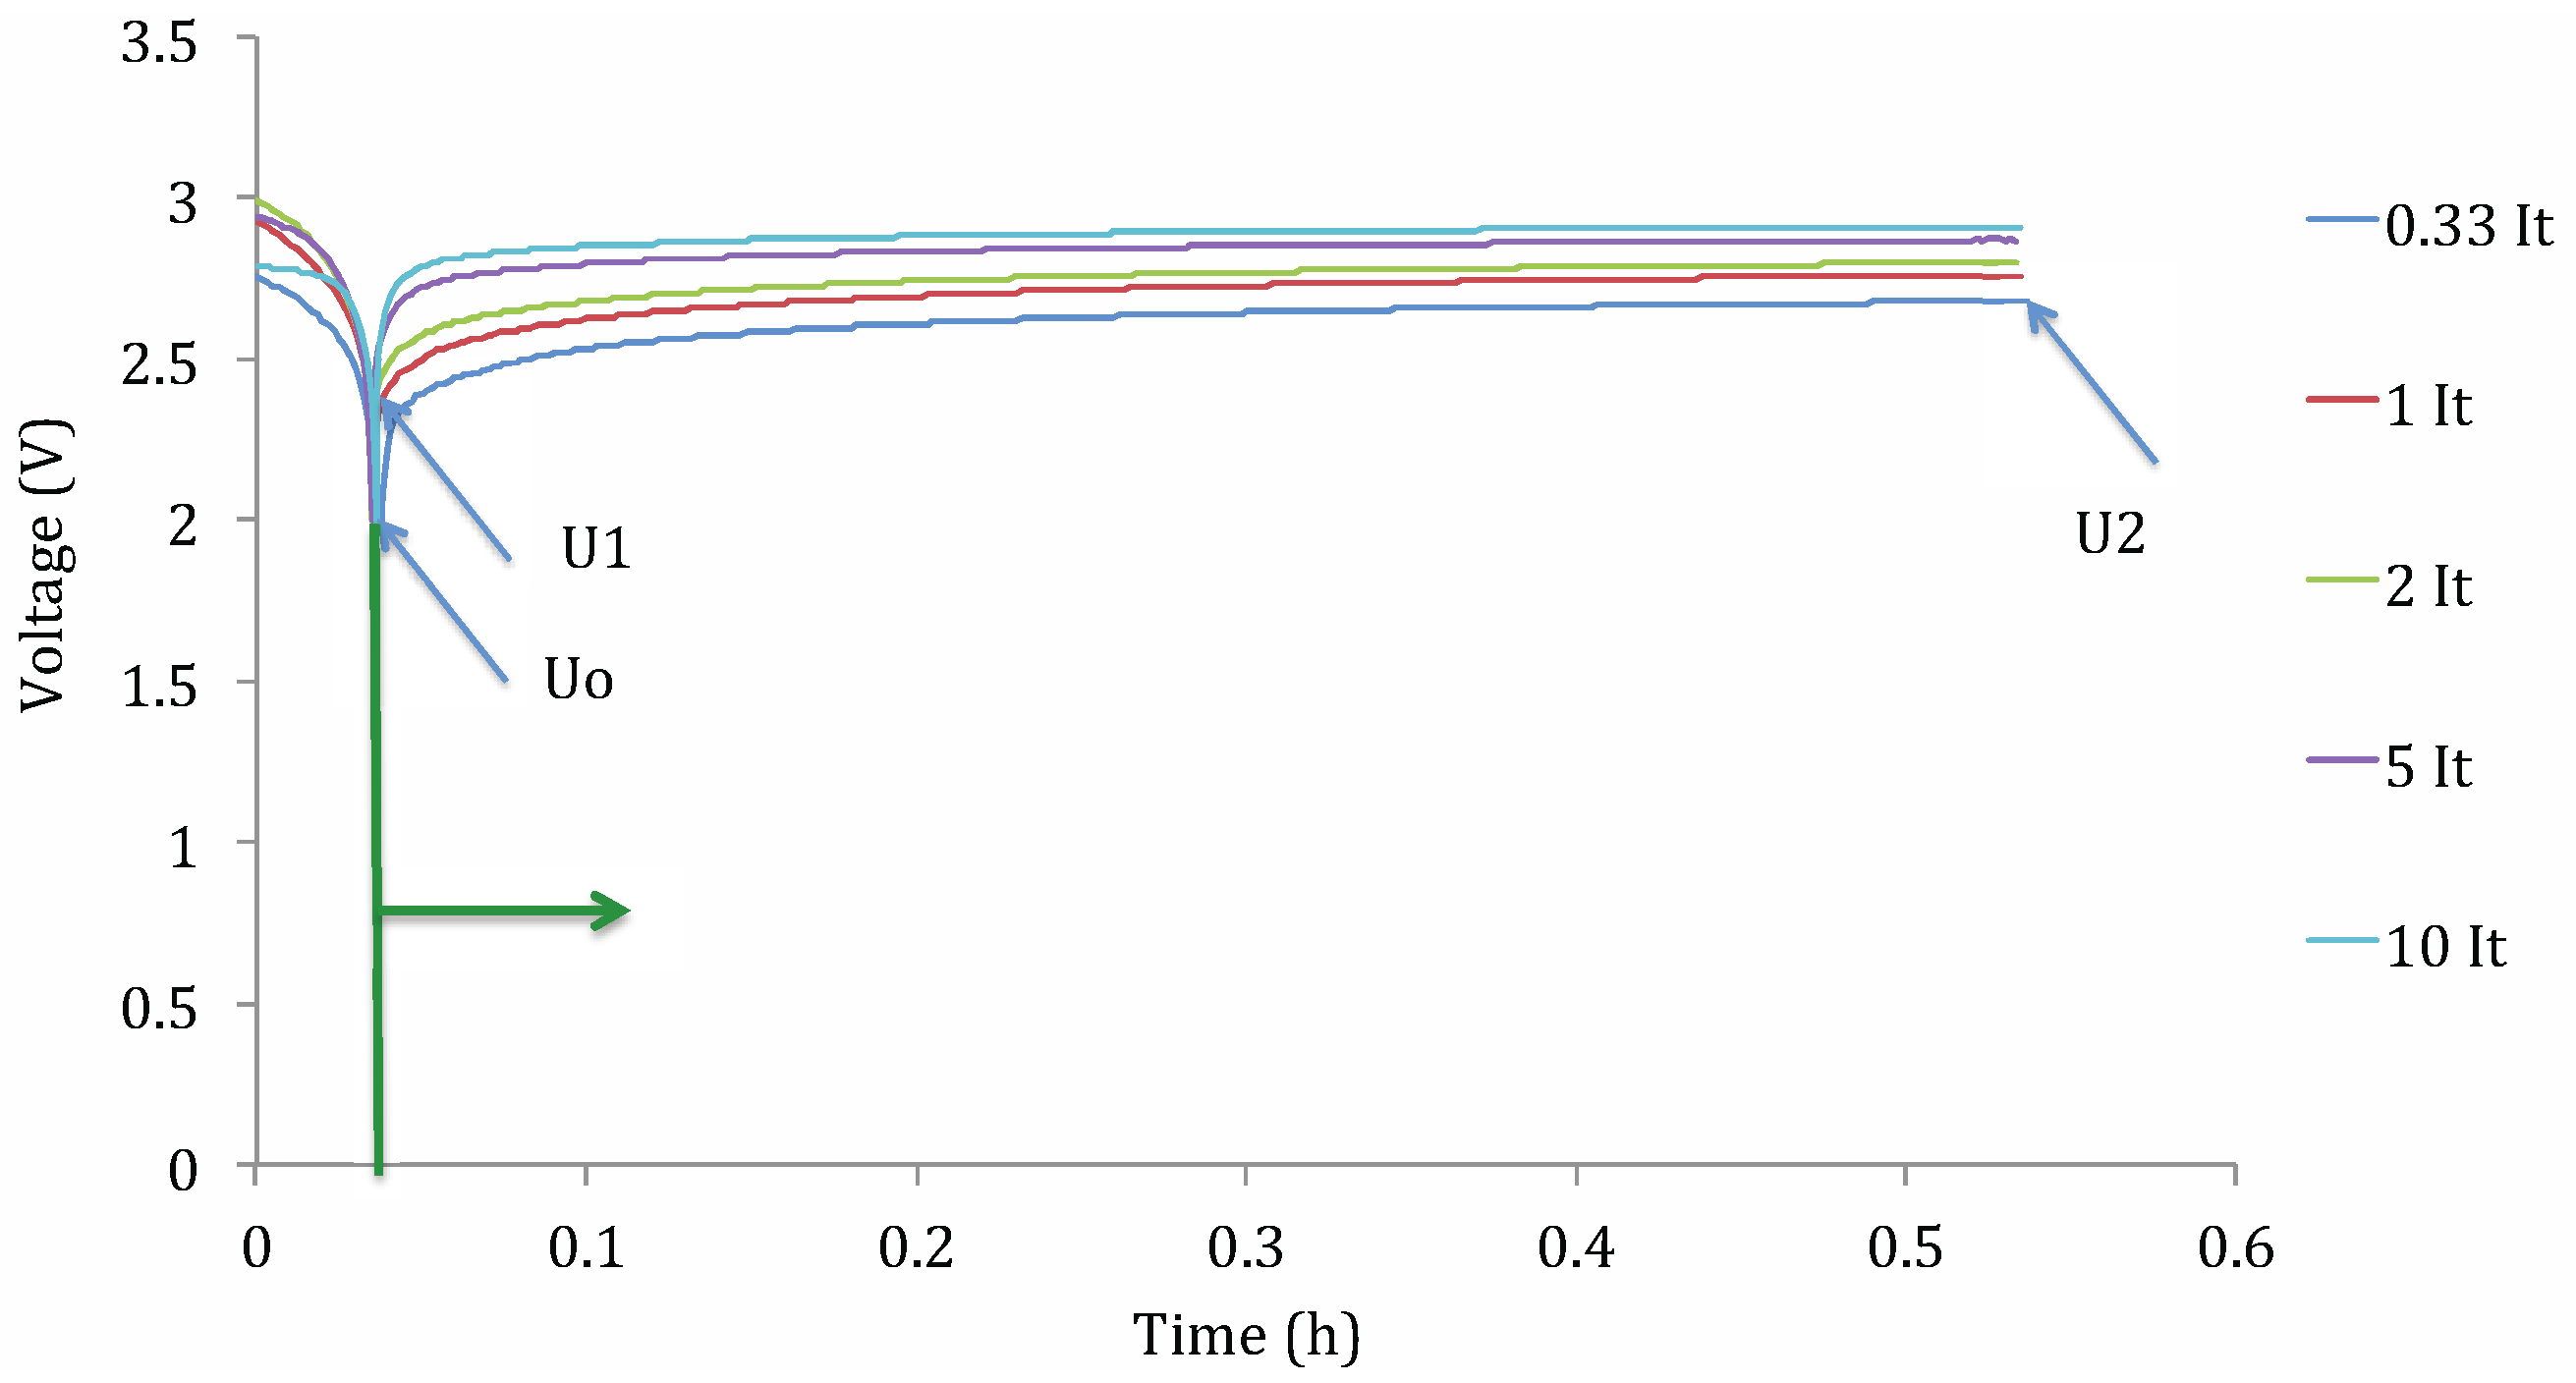
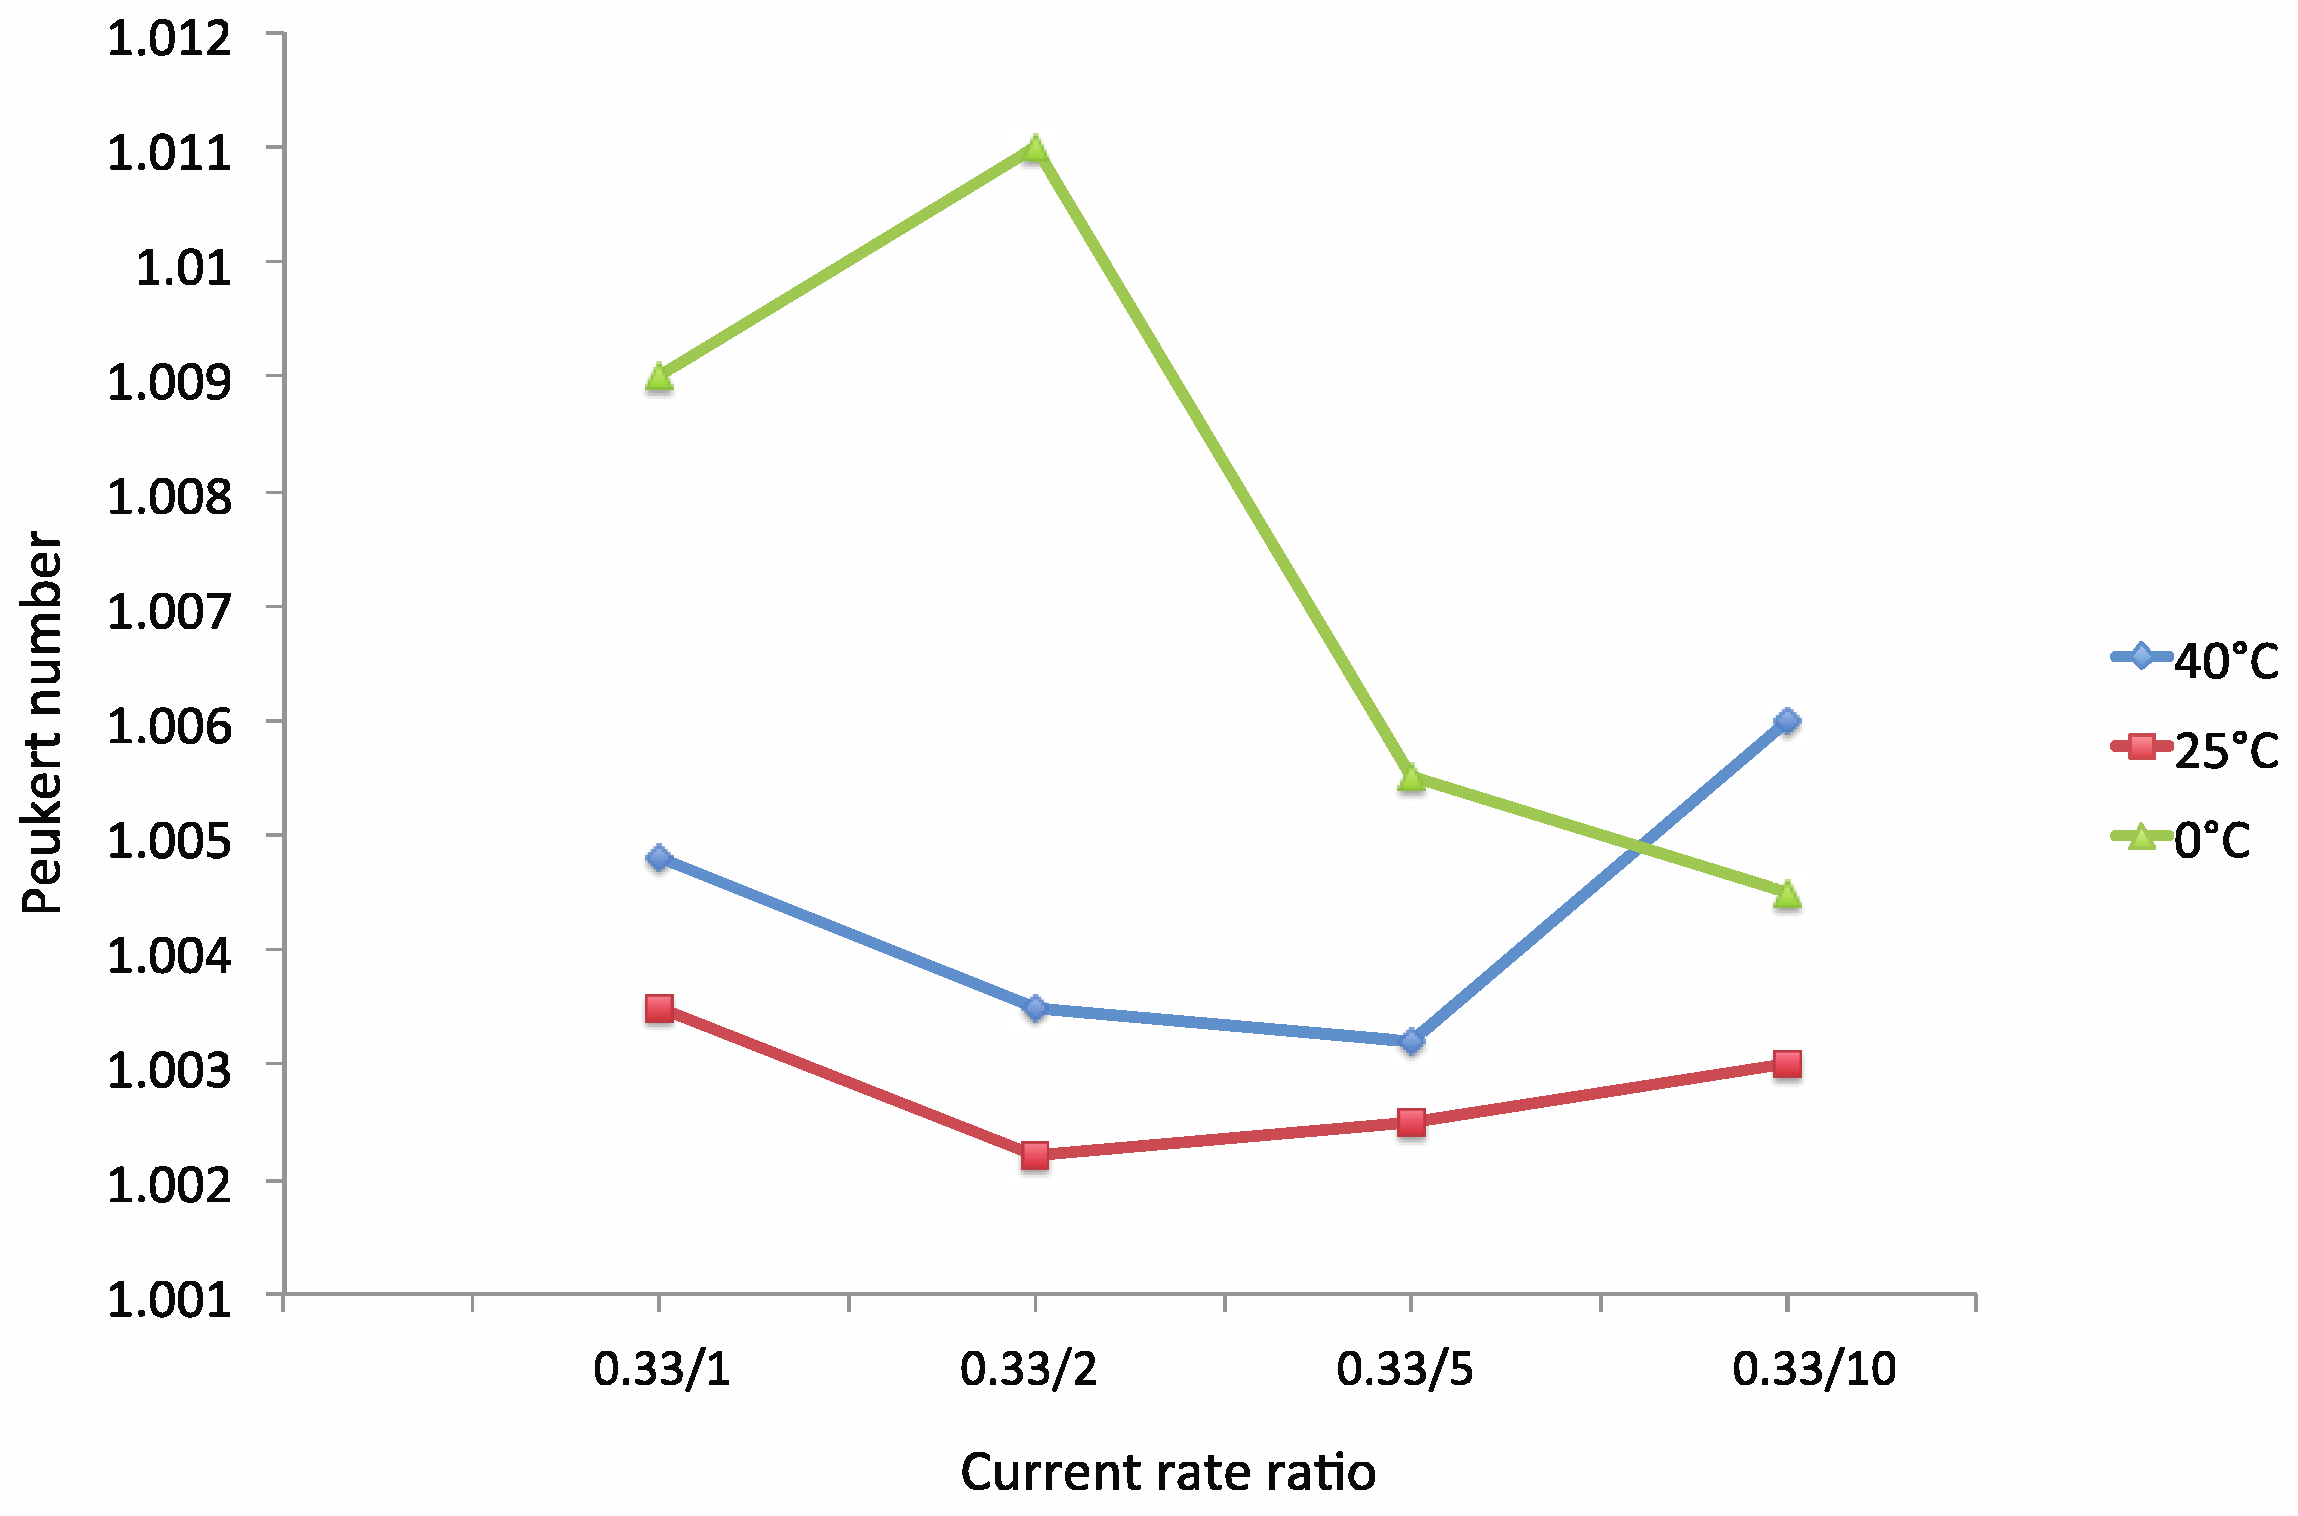
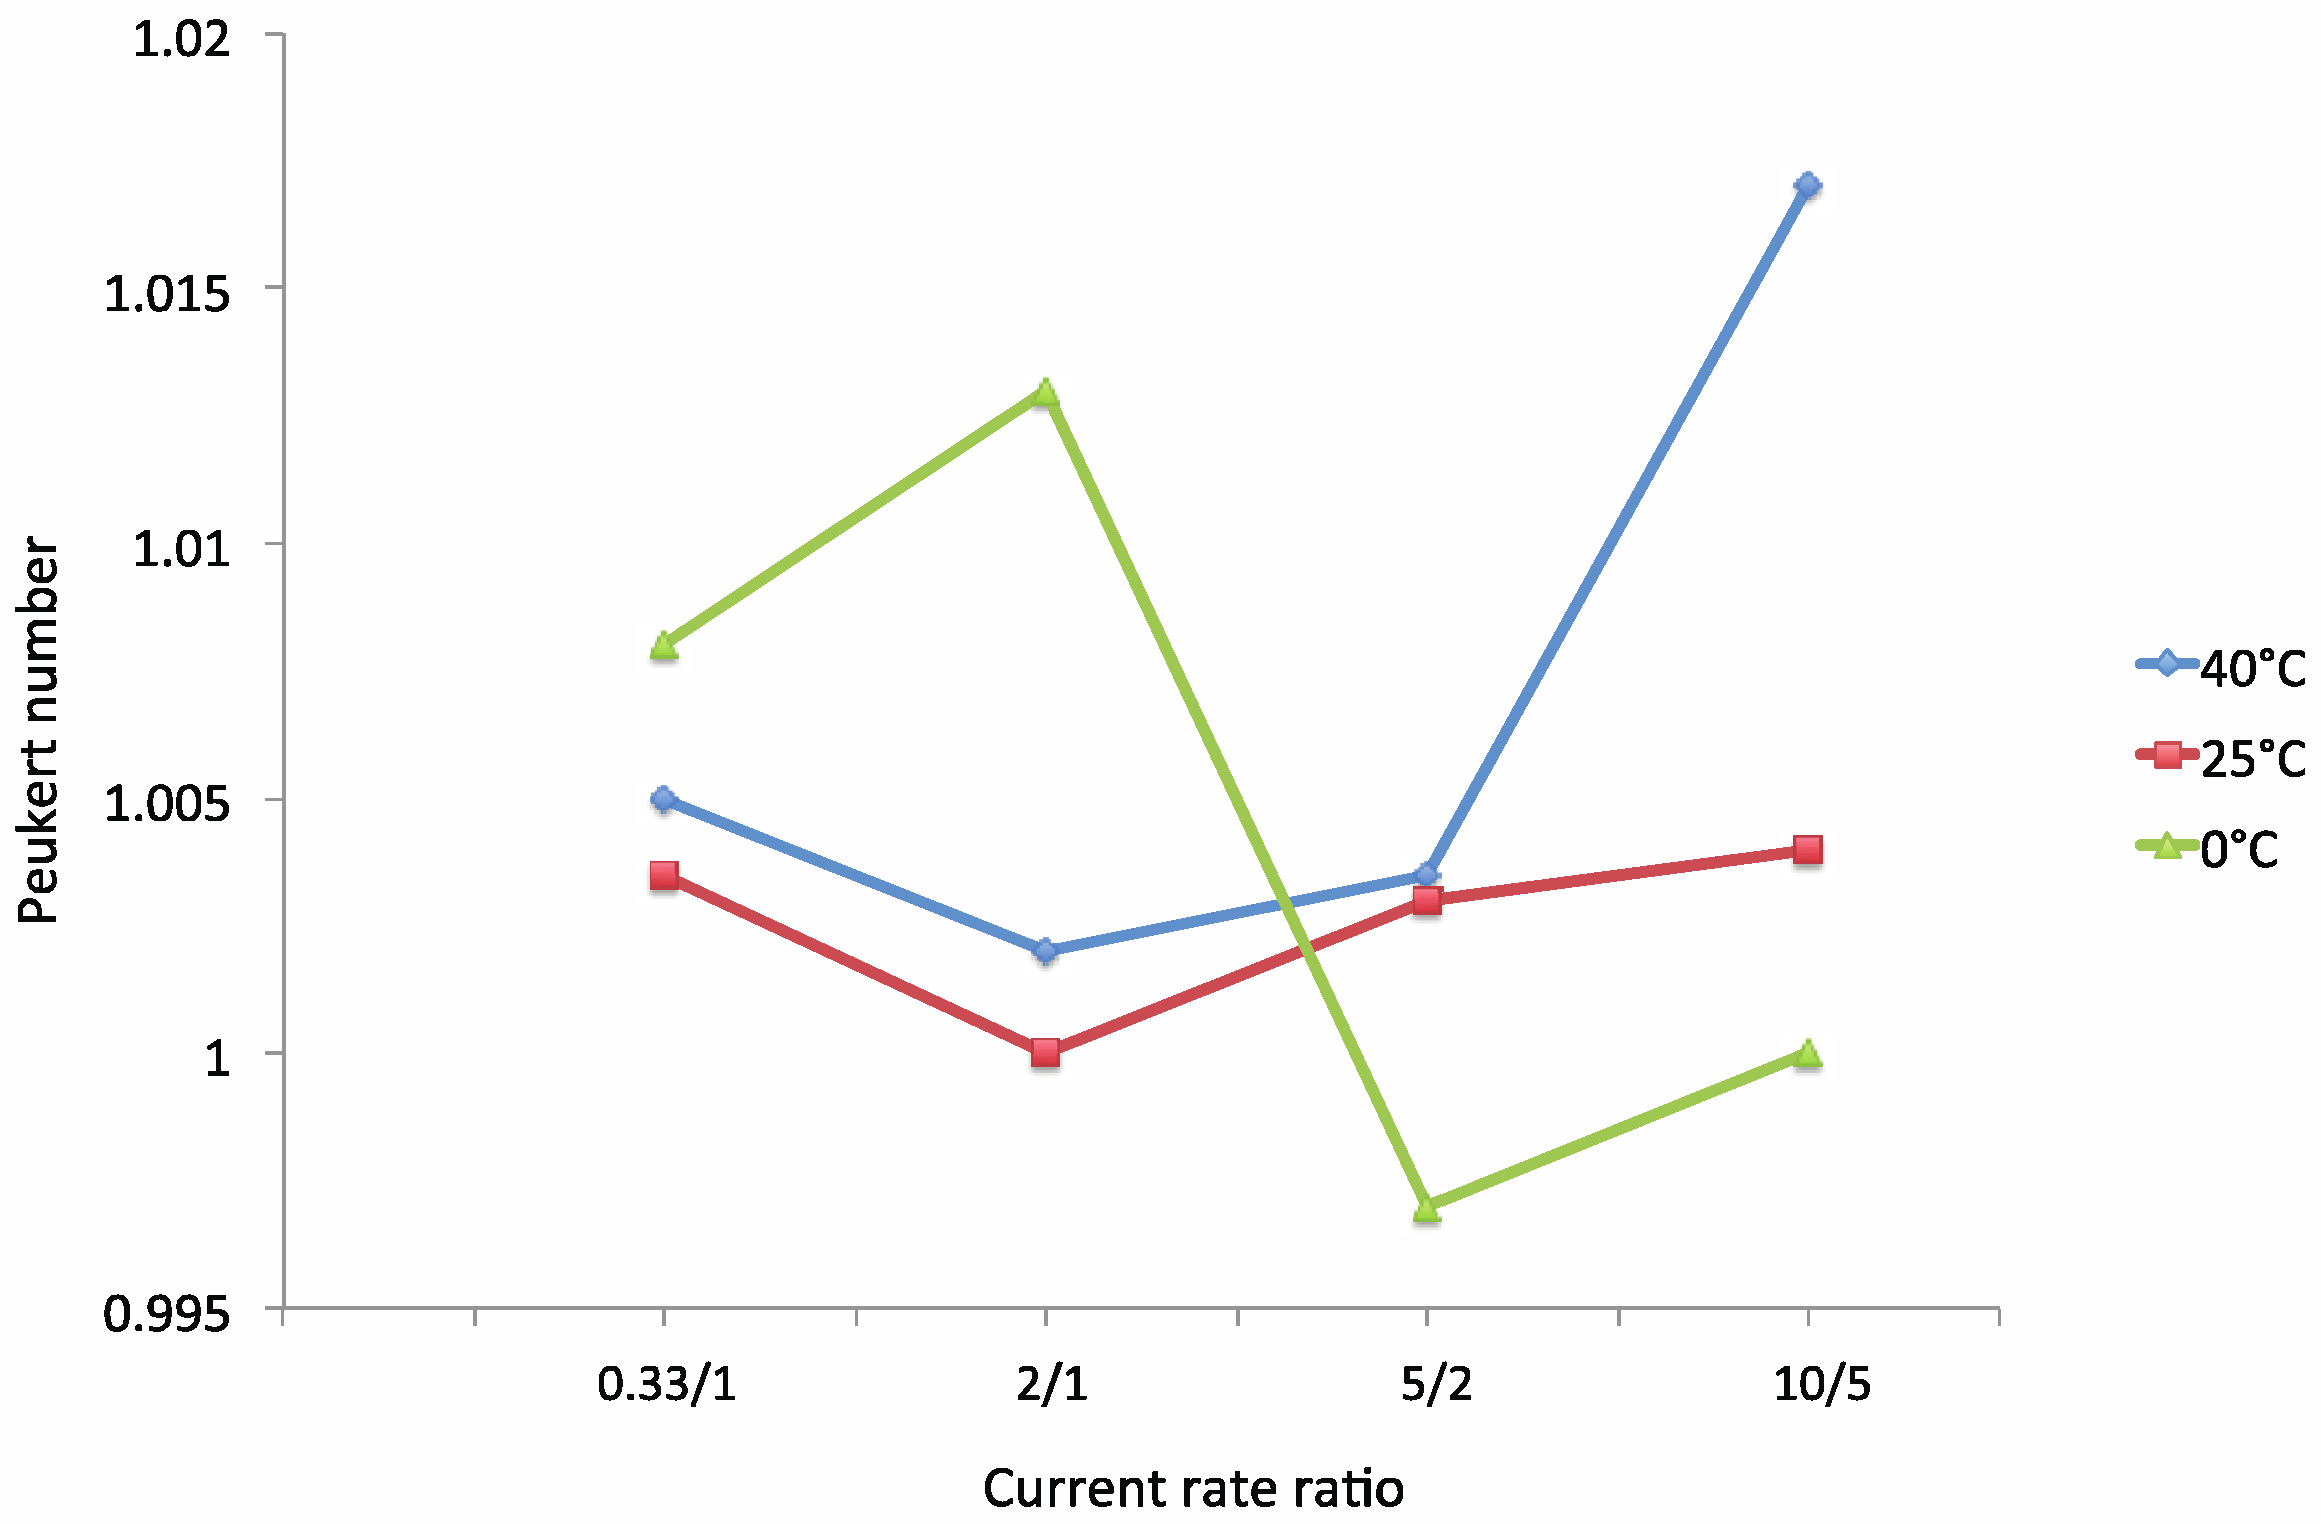
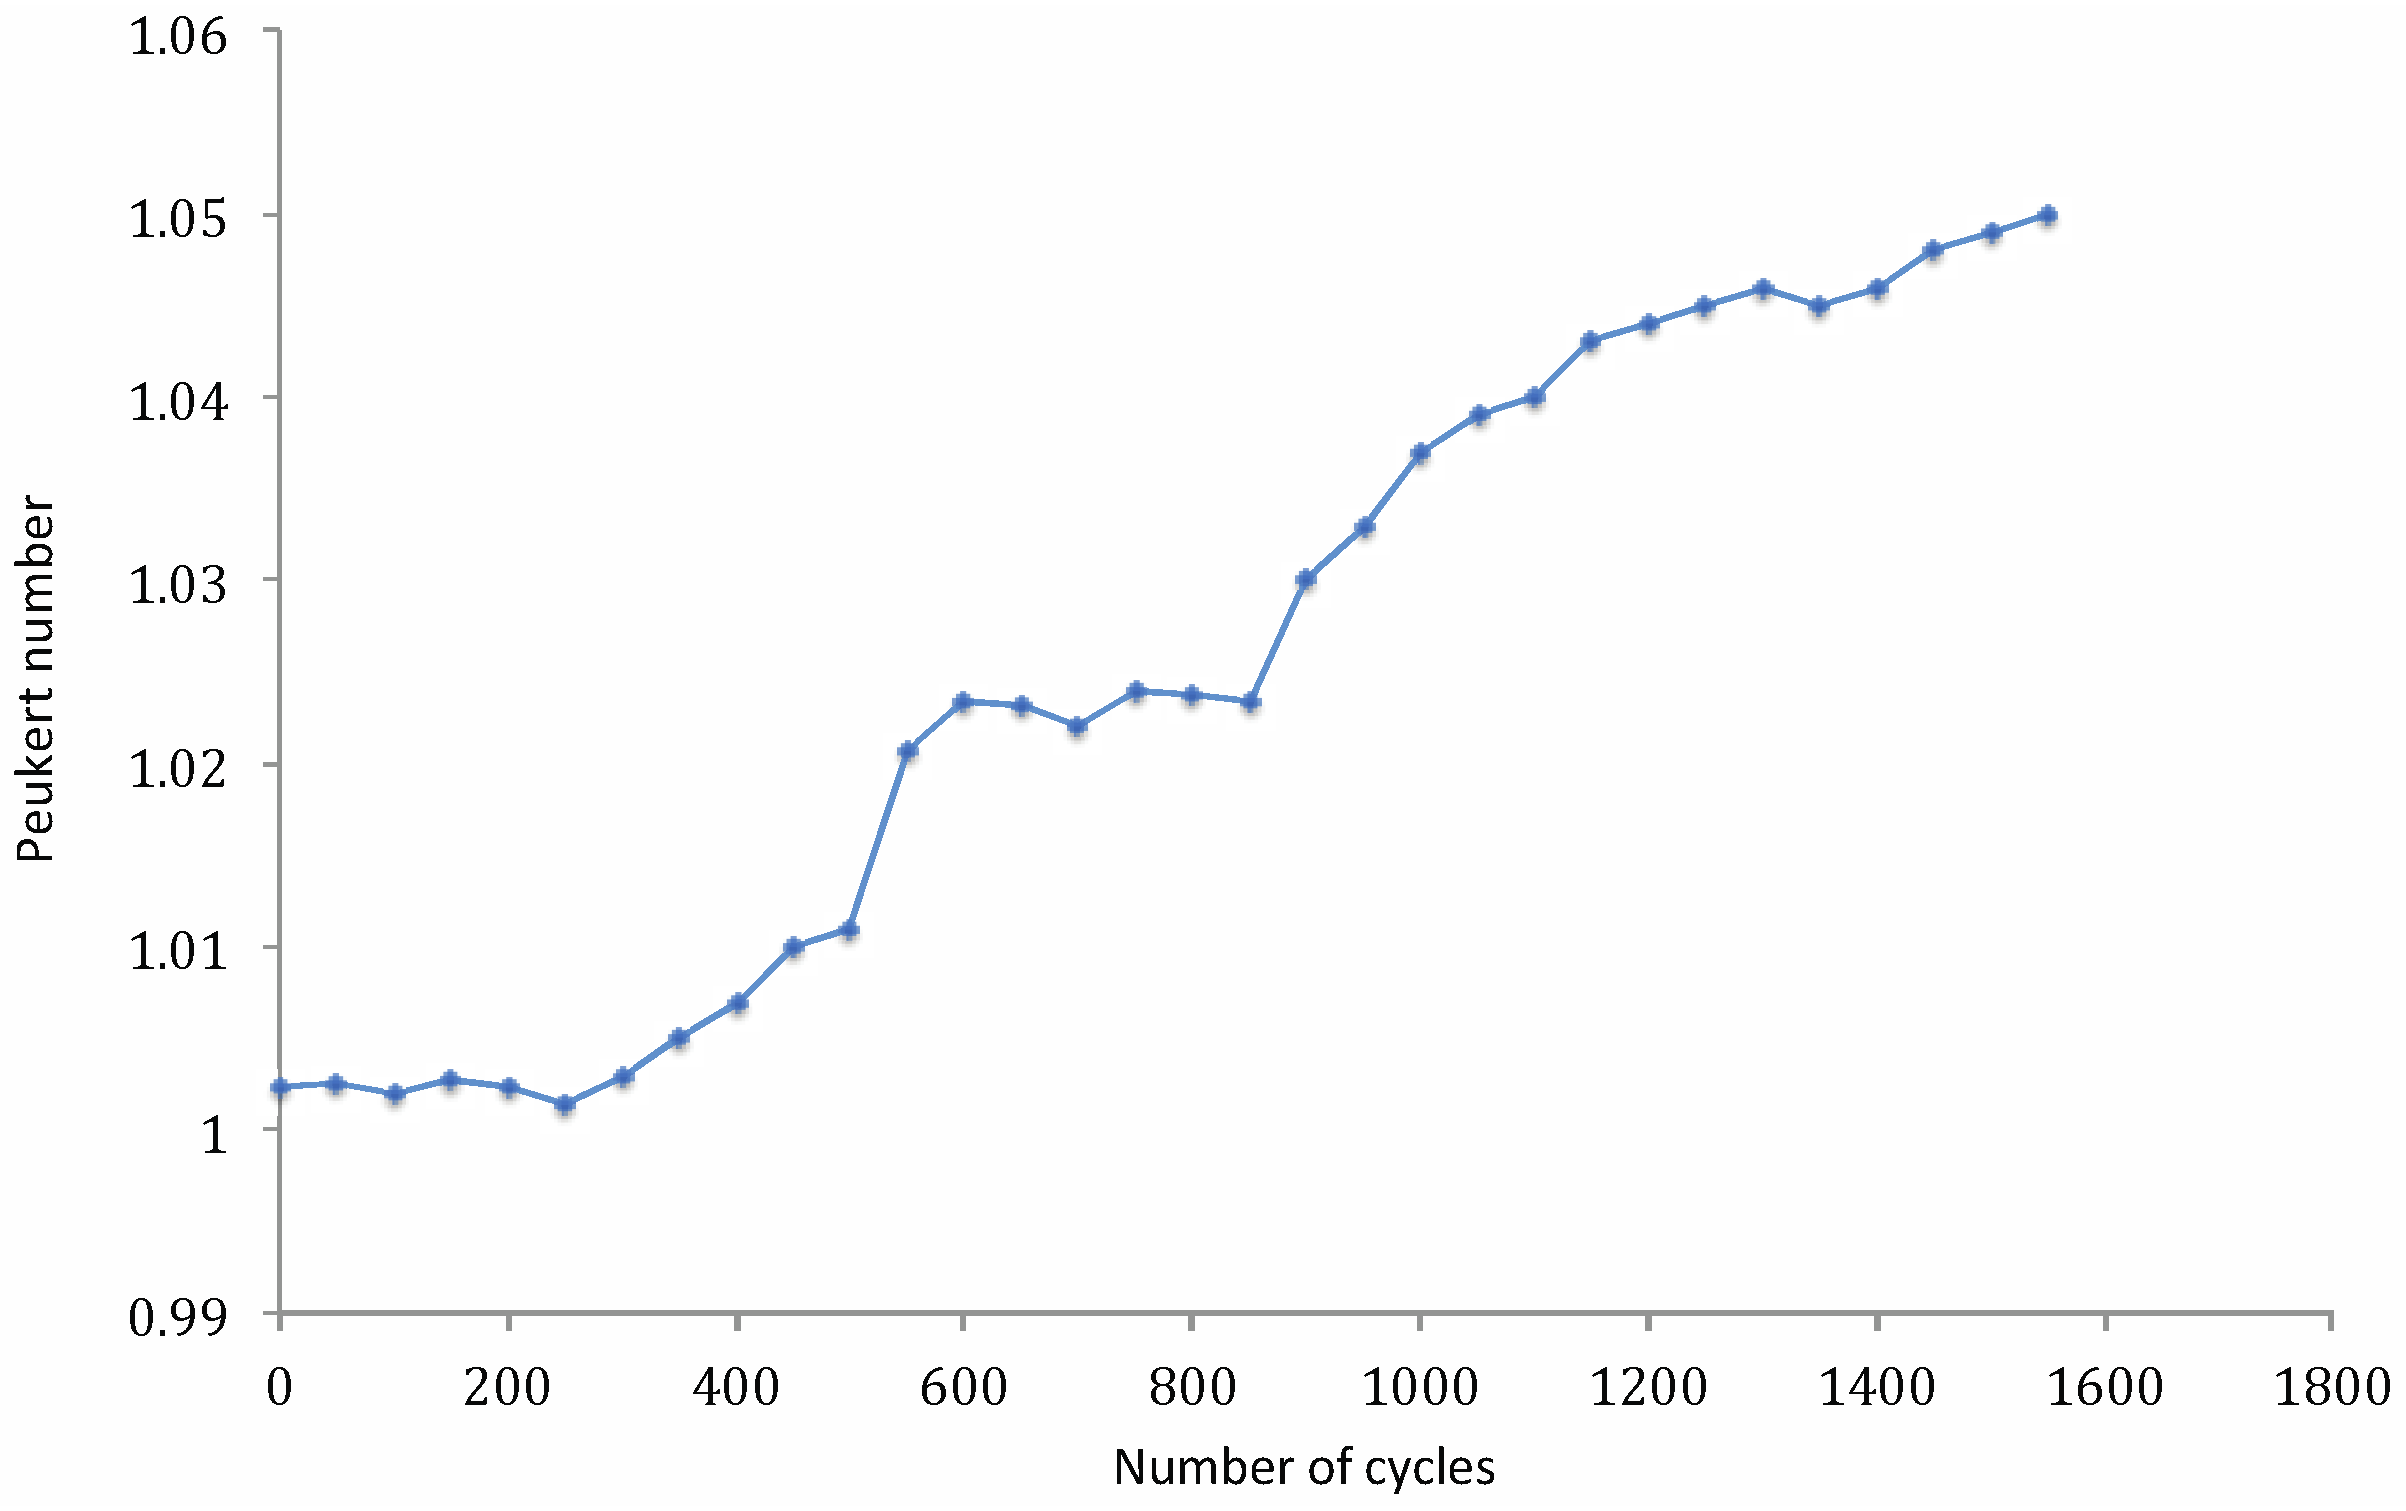
The Modified Peukert
4. Conclusions
Conflicts of Interest
References
- International Energy Agency (IEA). Energy Technology Perspectives—Scenarios and Strategies to 2050; OECD Publishing: Paris, France, 2010. [Google Scholar]
- Van Mierlo, J.; Maggetto, G. Comparison of the environmental damage caused by vehicles with different alternative fuel and drive trains in a Brussels context. J. Automob. Eng. 2003, 217, 583–593. [Google Scholar] [CrossRef]
- Boureima, F.S. Environmental Assessment of Conventional and Alternative Vehicles and Fuels in a Belgian Context. Ph.D. Thesis, Vrije Universiteit Brussel, Brussels, Belgium, 2011. [Google Scholar]
- Axsen, J.; Kurani, K.S.; Burke, A. Are batteries ready for plug-in hybrid buyers? J. Transp. Policy 2008, 7, 173–182. [Google Scholar] [CrossRef]
- Van den Bossche, P.; Vergels, F.; van Mierlo, J.; Matheys, J.; van Autenboer, W. Subat: An assessment of sustainable battery technology. J. Power Sources 2006, 162, 913–919. [Google Scholar]
- Coleman, M.; Lee, C.K.; Zhu, C.; Hurley, W.G. State-of-charge determination from EMF voltage estimation: Using impedance, terminal voltage, and current for lead-acid and lithium-ion batteries. IEEE Trans. Ind. Electron. 2007, 54, 2550–2557. [Google Scholar] [CrossRef]
- Omar, N.; Daowd, M.; van den Bossche, P.; Hegazy, O.; Smekens, J.; Coosemans, T.; van Mierlo, J. Rechargeable energy storage systems for plug-in hybrid electric vehicles—Assessment of electrical characteristics. Energies 2012, 5, 2952–2988. [Google Scholar] [CrossRef]
- Verbrugge, M.; Tate, E. Adaptive state of charge algorithm for nickel metal hydride batteries including hysteresis phenomena. J. Power Sources 2004, 126, 236–249. [Google Scholar] [CrossRef]
- Piller, S.; Perrin, M.; Jossen, A. Method for state of charge determination and their applications. J. Power Sources 2001, 96, 113–120. [Google Scholar] [CrossRef]
- Huet, F. A review of impedance measurements for determination of the state-of-charge or state-of-health of secondary batteries. J. Power Sources 1998, 70, 59–69. [Google Scholar] [CrossRef]
- Rodrigues, S.; Munichandraiah, N.; Shukla, A.K. A review of state-of-charge indication of batteries by means of a.c. impedance measurements. J. Power Sources 2000, 87, 12–20. [Google Scholar] [CrossRef]
- Hu, C.; Youn, B.D.; Chung, J. A multiscale framework with extended Kalman filter for lithium-ion battery SOC and capacity estimation. Appl. Energy 2012, 92, 694–704. [Google Scholar] [CrossRef]
- He, H.; Xiong, R.; Fan, J. Evaluation of lithium-ion battery equivalent circuit models for state of charge estimation by an experimental approach. Energies 2011, 4, 582–598. [Google Scholar] [CrossRef]
- Blanke, H.; Bohlen, O.; Buller, S.; de Doncker, R.W.; Fricke, B.; Hammouche, A.; Linzen, D.; Thele, M.; Sauer, D.U. Impedance measurements on lead-acid batteries for state-of-charge, state-of-health and cranking capability prognosis in electric and hybrid electric vehicles. J. Power Sources 2005, 144, 418–425. [Google Scholar] [CrossRef]
- He, Y.; Liu, X.T.; Zhang, C.B.; Chen, Z.H. A new model for State-of-Charge (SOC) estimation for high-power Li-ion batteries. Appl. Energy 2013, 101, 808–814. [Google Scholar] [CrossRef]
- Han, J.; Kim, D.; Sunwoo, M. State-of-charge estimation of lead-acid batteries using an adaptive extended Kalman filter. J. Power Sources 2009, 188, 606–612. [Google Scholar] [CrossRef]
- He, H.; Zhang, X.; Xiong, R.; Xu, Y.; Guo, H. Online model-based estimation of state-of-charge and open-circuit voltage of lithium-ion batteries in electric vehicles. Energy 2012, 39, 310–318. [Google Scholar] [CrossRef]
- He, W.; Williard, N.; Chen, C.; Pecht, M. State of charge estimation for electric vehicles batteries using unscented kalman filtering. Microelectron. Reliab. 2013, 53, 840–847. [Google Scholar] [CrossRef]
- Cho, S.; Jeong, H.; Han, C.; Jin, S.; Lim, J.H.; Oh, J. State-of-charge estimation for lithium-ion batteries under various operating conditions using an equivalent circuit model. Comput. Chem. Eng. 2012, 41, 1–9. [Google Scholar] [CrossRef]
- Wu, G.; Lu, R.; Zhu, C.; Chan, C.C. An Improved Ampere-Hour Method for Battery State of Charge Estimation Based on Temperature, Coulomb Efficiency Model and Capacity Loss Model. In Proceedings of the IEEE Vehicle Power and Propulsion Conference (VPPC), Lille, France, 1–3 September 2010; pp. 1–4.
- Peukert, W. Über die Abhänigkeit der Kapazität von der Entladestromstärke bei Bleiakkumulatoren. Elektrotechnisch Z. 1897, 27, 287–288. (in German). [Google Scholar]
- IEC 61434: Secondary Cells and Batteries Containing Alkaline or Other Non-Acid Electrolytes—Guide to the Designation of Current in Alkaline Secondary Cells and Battery Standards. Available online: http://webstore.iec.ch/webstore/webstore.nsf/Artnum_PK/21274 (accessed on 28 July 2013).
- Doerfell, D.; Sharkh, S.A. A critical review of using the Peukert equation for determining the remaining capacity of lead-acid and lithium-ion batteries. J. Power Sources 2006, 155, 395–400. [Google Scholar] [CrossRef]
- Cugnet, M.G.; Dubarry, M.; Liaw, B.Y. Peukert’s law of a lead-acid battery simulated by a mathematical model. ECS Trans. 2010, 25, 223–233. [Google Scholar]
- PEC Corporation. Available online: http://www.peccorp.com/SBT0550-tabs-glance.html (accessed on 28 July 2013).
- Omar, N.; Daowd, M.; Hegazy, O.; Al Sakka, M.; Coosemans, T.; van den Bossche, P.; van Mierlo, J. Assessment of lithium-ion capacitor for using in battery electric vehicle and hybrid electric vehicle applications. Electrochim. Acta 2012, 86, 305–315. [Google Scholar] [CrossRef]
- Sawai, K.; Yamato, R.; Ohzuku, T. Impedance on lithium-ion battery consisting of Li(Li1/3Ti5/3)O4 and LiCo1/2Ni1/2O2. J. Electrochem. 2005, 51, 1651–1655. [Google Scholar]
© 2013 by the authors; licensee MDPI, Basel, Switzerland. This article is an open access article distributed under the terms and conditions of the Creative Commons Attribution license (http://creativecommons.org/licenses/by/3.0/).
Share and Cite
Omar, N.; Bossche, P.V.d.; Coosemans, T.; Mierlo, J.V. Peukert Revisited—Critical Appraisal and Need for Modification for Lithium-Ion Batteries. Energies 2013, 6, 5625-5641. https://doi.org/10.3390/en6115625
Omar N, Bossche PVd, Coosemans T, Mierlo JV. Peukert Revisited—Critical Appraisal and Need for Modification for Lithium-Ion Batteries. Energies. 2013; 6(11):5625-5641. https://doi.org/10.3390/en6115625
Chicago/Turabian StyleOmar, Noshin, Peter Van den Bossche, Thierry Coosemans, and Joeri Van Mierlo. 2013. "Peukert Revisited—Critical Appraisal and Need for Modification for Lithium-Ion Batteries" Energies 6, no. 11: 5625-5641. https://doi.org/10.3390/en6115625