Article

Price Forecasting in the Day-Ahead Energy Market by an Iterative Method with Separate Normal Price and Price Spike Frameworks

LUT Energy, Laboratory of Electricity Markets and Power Systems, Lappeenranta University of Technology, P.O. Box 20, Lappeenranta 53851, Finland
*
Author to whom correspondence should be addressed.
Energies 2013, 6(11), 5897-5920; https://doi.org/10.3390/en6115897
Submission received: 12 September 2013 / Revised: 25 October 2013 / Accepted: 5 November 2013 / Published: 12 November 2013
(This article belongs to the Special Issue Smart Grids: The Electrical Power Network and Communication System)

Abstract

:
A forecasting methodology for prediction of both normal prices and price spikes in the day-ahead energy market is proposed. The method is based on an iterative strategy implemented as a combination of two modules separately applied for normal price and price spike predictions. The normal price module is a mixture of wavelet transform, linear AutoRegressive Integrated Moving Average (ARIMA) and nonlinear neural network models. The probability of a price spike occurrence is produced by a compound classifier in which three single classification techniques are used jointly to make a decision. Combined with the spike value prediction technique, the output from the price spike module aims to provide a comprehensive price spike forecast. The overall electricity price forecast is formed as combined normal price and price spike forecasts. The forecast accuracy of the proposed method is evaluated with real data from the Finnish Nord Pool Spot day-ahead energy market. The proposed method provides significant improvement in both normal price and price spike prediction accuracy compared with some of the most popular forecast techniques applied for case studies of energy markets.

1. Introduction

Electricity price forecasting has become an important area of research in the aftermath of the worldwide deregulation of the power industry. Unlike electricity demand series, electricity price series can exhibit variable means, major volatility and significant spikes [1].
Based on the needs of the energy market, a variety of approaches for electricity price forecasting have been proposed in the last decades, among them, models based on simulation of power system equipment and related cost information [2], game-theory based models which focus on the impact of bidder strategic behavior on electricity prices [3], models based on stochastic modeling of finance [4], regression models [5] and artificial intelligence models [6,7,8,9]. In recent years, hybrid approaches have become popular since it is almost universally agreed in the forecasting literature that no single method is best in every situation [10,11].
While most existing approaches to forecasting electricity prices are reasonably effective for normal prices, they cannot deal with the price spikes accurately. In early research, price spikes were truncated before application of the forecasting model to reduce the influence of such observations on the estimation of the model parameters [12,13]. Electricity price spikes, however, are significant for energy market participants to stay competitive in a competitive market.
The Generalized AutoRegressive Conditional Heteroskedasticity (GARCH) process has been tested to simulate price spikes in original price series and has not been able incorporate spikes with a height usually observed in the original prices [14]. Spikes have been incorporated into a Markov-switching model and diffusion models with the addition of a Poisson jump component [15]. Data mining techniques have been applied to the spike forecasting problem and have achieved promising results [16,17,18,19].
An analysis of price forecasts along with knowledge of upcoming price spikes is important for market participants to estimate their potential and stay competitive in a competitive market. However, most of the work on electricity market price forecasting is concentrated on improving forecast accuracy rather than the effects of price forecast inaccuracy on market participants. Only a few approaches have been reported in the literature to deal with the problem of future price uncertainty in operation planning in competitive environments [20,21,22].
The methodology presented in this paper uses an iterative hybrid approach to separately predict normal prices and price spikes in the Finnish day-ahead energy market. Such a strategy provides an opportunity to train the forecasting models more effectively while the non-separate forecasting methods should learn the behaviors of both normal prices and price spikes. The proposed approach uses a wavelet transform (WT) combined with ARIMA, a neural network (NN), a compound classifier and a k-nearest neighbor model (k-NN) to separately implement normal price and price spikes forecasting processes. WT deals with non-stationarity by decomposing the price series into less volatile components. The ARIMA model captures cyclicality of the series clearly exhibiting hourly and weekly patterns. The compound classifier discriminates normal price and price spike processes to separately predict values of those processes by different forecasting engines. The combined ARIMA and NN frameworks produce normal price forecasts by capturing linear and non linear patterns between target and exogenous variables. The k-NN is applied for the price spike value prediction. Time-varying model parameters allow capturing of localized trending of the series.
The methodology is evaluated with real data of Finnish day-ahead energy market. It can, however, be considered to have applicability for the entire Nordic region, as well as deregulated markets in other countries or even for financial markets, since the methodology addresses common statistical features of the price series.

2. Nordic Energy Market

The Nordic region has considerable experience with deregulated electricity markets. The Nordic electricity market was formed in 1993 in conjunction with deregulation of electricity markets in the region. The derivatives and energy markets were separated in 2002 to establish Nord Pool Spot, which currently operates in Norway, Denmark, Sweden, Finland, Estonia, Latvia and Lithuania.
The main goal of Nord Pool Spot is to balance the generation of electricity with the electricity demand, precisely and at an optimal price, so-called equilibrium point trading. The optimal price represents the cost of producing one kilowatt hour of power from the most expensive source needing to be employed in order to balance the system. All the employed generators are paid the same market price.
Two different physical operation markets are organized in Nord Pool Spot: Elspot and Elbas. Elspot is a day-ahead energy market in which market participants submit offers to sell, or bids to buy, physical electricity for the next day. Elbas is an intra-day energy market where trades are adjusted in the day-ahead market until one hour prior to delivery time.

3. Mathematical Framework

Before the prediction strategy is described, key features of WT, ARIMA, NN, feature selection technique and different classification frameworks are first introduced.

3.1. WT

When using classical statistical techniques, a stationary process is assumed for the data. For electricity price time series, the assumption of stationarity usually has to be rejected. One way to capture localized trending in the series is to apply models with time-varying parameters [23]. Another way to deal with non-stationarity is the use of mathematical transformations of an initial series. In many cases, information that cannot be readily seen in the time domain can be obtained in the frequency domain. Fourier transform (FT) and short time FT (STFT) are probably the most popular transforms and are used in many different areas, including many branches of engineering. However, these transforms provides poor time or frequency resolution. The WT was developed as an alternative approach to FT/STFT to overcome the resolution problem [24]. Wavelet analysis begins with selection of a proper wavelet (mother wavelet) and analysis of its translated and dilated versions [25]. It is advantageous to scale and translate the mother wavelet using defined scales and positions usually based on powers of two [26]. This technique is known as the discrete WT. An algorithm to implement discrete WT using filters has been developed by Mallat. Multiresolution via Mallat’s algorithm is a procedure to obtain approximations (A) and details (D) from a given signal f [27]. In the reconstruction stage, these components can be assembled back into the original signal f’ (see Figure 1).
Figure 1. Multilevel decomposition (top) and reconstruction (bottom) processes.
Energies 06 05897 g001
In this paper, a Daubechies wavelet of order 5 is used as the mother wavelet to transform the price series into several wavelet subseries. This wavelet offers an appropriate trade-off between wavelength and smoothness, resulting in an appropriate behavior for the price forecast [19,26,28]. Three decomposition levels are considered, since this describes the price series in a more thorough and meaningful way [26].

3.2. Seasonal ARIMA

AutoRegressive Moving Average (ARMA) models form a class of time series models that are widely applicable in the field of time series forecasting [29]. In the case of linear trends and/or seasonal behavior, non-stationary time series processes can be transformed by differentiation of the series to make them stationary. The ARMA model, therefore, is transformed to an autoregressive integrated moving average (ARIMA) model [30]. To capture a linear trend and seasonality (diurnal cycle) in the time series, one-hour (regular) and 24-hour (seasonal) differencing is used.
The Box-Jenkins approach is utilized to build the ARIMA. The approach uses an iterative model building strategy consisting of four stages. In the first stage, the structure of the model is identified. Utilization of the autocorrelation function (ACF) and the partial ACF (PACF) of the sample data is a basic tool to identify the order of the ARIMA best model, which is then estimated by maximum likelihood in the second step. The parameters of the model are estimated such that an overall measure of errors is minimized. Goodness-of-fit is tested on the estimated model residuals in the third step. If the model is not adequate, a new tentative model should be identified. Forecast future outcomes are obtained in the fourth step [29].

3.3. NN

The NN, also called a multilayer perceptron (MLP), is a semi-parametric model and has been developed based on study of the brain functions and the nervous system. Perceptrons are arranged in layers with no connections inside a layer, and each layer is fully connected to preceding and following layers without loops. The first and last layers are called input and output layers, respectively. Other layers are hidden layers. Each layer, therefore, consists of a specific number of computational elements, called neurons, which are connected to neurons in adjacent layers and capture complex non-linear phenomena. A sigmoid function is used in a hidden layer [31].
The procedure for developing NNs is as follows: data pre-processing; definition of the architecture and parameters; weights initialization; training until the stopping criterion is reached (number of iterations, sum of squares of error is lower than a pre-determined value); finding the network with the minimum error; and forecasting the future outcome.
The NN toolbox of MATLAB was selected for NN model building due to its flexibility and simplicity. The Levenberg-Marquardt (LM) algorithm was used in this study, which is an advanced optimization algorithm and one of the more efficient for training NNs. According to Kolmogorov’s theorem, NN can solve a problem by using one hidden layer provided that it has a proper number of hidden neurons (Nh) [32]. Therefore, one hidden layer has been considered in the structure of all NNs utilized in this study.

3.4. Compound Classifier

The problem of the price spike occurrence prediction is stated as a classification problem that can be solved by a pattern recognition framework. The ultimate goal of pattern recognition is to discriminate the class membership of the observed novel objects with the minimum misclassification rate. It had been observed that even if one of the designs would yield the best performance, the sets of patterns misclassified by the different classifiers would not necessarily overlap. This suggests that different classifier designs potentially offer complementary information about the patterns to be classified which could be harnessed to improve the performance of the selected classifier. The idea behind use of the compound classifier presented in this paper is to avoid reliance on a single classifier. Various classifier combination schemes have been devised and it has been experimentally demonstrated that some of them consistently outperform a single best classifier [33]. The majority vote rule is applied to get an overall output (spike or non-spike) from the compound classifier.
The three individual classifiers used together in the compound classifier are a relevance vector machine (RVM), ensemble of bagged decision tress (DT) and probabilistic neural network (PNN). These methods are chosen because they provide probabilistic output (probability of class membership, e.g., probability of spike occurrence). The methods have been previously applied to several other applications with promising results [19,34,35].

3.4.1. RVM

RVM is a statistical learning technique based on Bayesian theory. It was developed for regression and classification problems. In RVM, the method to deal with non-linear data is to use a map function to map the training data from the input space into some high dimensional feature space, so the training data become linearly separable in the feature space. The related kernel function is used to avoid explicit knowledge of the high dimensional mapping [36].
Consider a set of example of input vectors { x i } i = 1 N along with a corresponding set of targets t = { t i } i = 1 N . For classification problem, ti should be 0 for class C1 and +1 for class C2. The RVM constructs a logistic regression model based on a set of sequence features derived from the input patterns, i.e.:
p ( C 1 | x ) σ { y ( x , w ) }
y ( x , w ) = i = 1 N w i F i ( x ) + w 0
where the basis function F ( x ) = ( F 1 ( x ) , F 1 ( x ) , , F N ( x ) ) T = [ 1 , K ( x i , x 1 ) , K ( x i , x 2 ) , , K ( x i , x N ) ] T , w = ( w 0 , , w N ) T is a vector of weights, σ { y } = ( 1 + exp { y } ) 1 is the logistic sigmoid link function and K ( x i , x j ) j = 1 N are kernels terms. Assuming a Bernoulii distribution for P ( t | x ) , the likelihood can be written as:
P ( t | w ) = n = 1 N σ { y ( x i ; w ) } t i [ 1 σ { y ( x n ; w ) } ] 1 t i
To form a Bayesian training criterion, a prior distribution over the vector of model parameters or weights, p ( w ) must be imposed. The RVM adopts a separable Gaussian prior, with a distinct hyper-parameter, α ( w ) , for each weight:
p ( w | α ) = i = 1 N Ν ( w i | 0 , α i 1 )
The optimal parameters of the model are then given by the minimiser of the penalized negative log-likelihood:
log { P ( t | w ) p ( w | α ) } = i = 1 N [ t i log y i + ( 1 t i ) log ( 1 y i ) ] 1 2 w T A w
where y i = σ { y ( x i , w ) } and A = d i a g ( α ) is a diagonal matrix with non-zero elements given by the vector of hyper-parameters. A detailed mathematical description of RVM is given in [37]. Here, we select a Gaussian radial basis function (RBF) kernel with its specific value of spread σRVM for application of RVM [29].

3.4.2. DT

Ensemble of DT creates a forest of a specific number of decision trees whose outputs are combined to make the overall output for the ensemble:
p ( C | v ) = 1 N i N p i ( C | v )
where Ntree is a number of trees, C is a class label, v is a feature vector, pi(C|v) is posterior probability generated by ith tree.
Bagging is a method to develop improved estimating class probabilities from DT classification algorithm. Mathematical description of DT classifier and bagging method can be found in [38,39].

3.4.3. PNN

PNN is a radial basis network that is suitable for classification problems. PNNs are closely related to the Parzen window probability density function estimator [40]. The particular estimator used in this study is:
f C ( X ) = 1 ( 2 π ) p / 2 σ P N N p 1 m i = 1 m exp [ ( X X C i ) T ( X X C i ) 2 σ P N N 2 ]
where i is a pattern number; m is a total number of training patterns; XCi is ith training pattern of class C; σPNN is a spread parameter; p is a dimensionality of measurement. Function fC(X) is simply the sum of small multivariate Gaussian distributions centered at each training sample. However, the sum is not limited to being Gaussian. It can, in fact, approximate any smooth density function.
A PNN is organized into a multilayered feed-forward network with four layers: the input layer (set of measurements), pattern layer (Gaussian functions), summation layer (average operation of the outputs from the second layer for each class) and output layer (a vote, selecting the largest value). Mathematical details of PNN can be found in [41]. Spread of the Gaussian RBF σPNN is an adjustable parameter of PNN. If spread is near zero, the network acts as a nearest neighbor classifier. As spread becomes larger, the designed network takes into account several nearby design vectors.

3.4.4. Probability Threshold

Prediction of price spike occurrence is a serious imbalanced classification problem (i.e., the non-spike class has many more samples than the spike class). The probabilities of spike occurrence obtained from the above mentioned single classifiers are calculated for every input vector and then compared with a probability threshold V0. If the probability is larger than the threshold, a spike is predicted to occur, regardless of whether this probability is less than the probability of non-spikes. This modification is performed because many spikes occur when their occurrence probabilities are smaller than 50% [17].

3.5. k-NN

After having determined the probability of price spike occurrence, it is of considerable interest for market participants to be able to further predict the actual value of the price spike. A k-NN approach has been used for this task in this paper as in [18,42].
In the k-NN, from the training data samples, k-neighboring samples closest to the unknown sample are selected. Then the sum of weighted values of the k-closest samples is computed as the unknown sample’s value. The Euclidean distance measure is employed here to calculate the closeness between two instances of the training data set. If k = 1 the instance is assigned to the class of its nearest neighbor.

3.6. Feature Selection Technique

Suitable selection of input variables plays a large role in the success of any forecast method. For price forecasts, apart from lagged values, many other input variables can be considered: available generation, fuel costs etc. [10,43,44]. The set of potential inputs may be too large for further use in a model. Thus, it is necessary to refine the initial set of potential inputs such that a subset of the most effective inputs is selected to be applied to the forecast engine [43].
The two-step feature selection algorithm consisting of both relevance and redundancy filters is used [43]. The ability to filter out redundant information from the set of the candidate features is the benefit of such a procedure versus a simple calculation of relevance value between target and independent variables. A mutual information (MI) criterion is used within the feature selection algorithm to capture non-linearity of the original price signal [45].
In the feature selection technique applied, SETI = {x1, x2,…, xt} is supposed as a set of candidate inputs. For each feature xi ∈ SETI, its MI value with the target feature y (continuous or binary) is computed as MI(xi,y). If the MI(xi,y) value between a candidate variable and a target is greater than a pre-specified value V1, then this candidate is retained for further processing; otherwise it is filtered out:
MI(xi,y) > V1, 1 ≤ i ≤ t
In the second step, the set of the retained candidates is supposed as SET1 ⊂ SETI. For any two retained candidates xa, xb ∈ SET1, their MI value supposed as the redundancy measure is computed. If the MI value between any two candidate variables (xa and xb) is smaller than a prespecified value V2, both variables are retained; otherwise, only the variable having the largest MI value with respect to the target [MI(xa,y) or MI(xb,y)] is retained. For instance, for xa, xb ∈ SET1:
MI(xa,xb) > V2, 1 ≤ a,b ≤ t, a ≠ b
The redundancy filtering process is repeated for all candidate inputs of SET1 until no redundancy measure becomes greater than V2. The subset of candidate variables SET2 SET1 that passed the redundancy filter is finally selected as best inputs by the proposed two-step feature selection algorithm.

4. Electricity Price Spike Definition

A spike is defined as a price that surpasses a specified threshold. Some authors suggest the use of fixed log-price change thresholds [46], a varying log-price range threshold [47], or a fixed threshold value for a whole price time series under consideration [19]. Here, the statistical method employed in [16] is used, where the spike threshold is calculated as µ + 3σ. Notations µ and σ indicate the mean and standard deviation of the considered market price data. The threshold is time-varying and calculated on the basis of half-a-year price data before each day of the considered period, i.e., of years 2009–2010, to capture evolving conditions of the market. All the prices exceeding this threshold are considered as spikes and extracted from the original price series of the Finnish day-ahead energy market of Nord Pool Spot over the period from 1 January 2009 to 31 December 2010 (see Figure 2). Table 1 shows the basic distribution parameters for normal prices and spikes in the Finnish day-ahead energy market of years 2009–2010.
It can be seen from Table 1 that spikes constitute about 1.0% of all the prices. However, their magnitude and unexpectedness cause them to have disproportionate significance in the energy markets.
Table 1. Basic statistics for normal spot prices and price spikes in terms of (euro/MWh).
TypeNumber of observationsMeanStdSkewnessKurtosis
Normal prices1,732444.6215.779.651.88
Spikes196240.98256.6813.613.30
Figure 2. (a) Original price data of the Finnish day-ahead energy market in years 2009–2010; (b) Extracted price spikes.
Energies 06 05897 g002

5. Proposed Method

5.1. Forecasting Framework

The time framework to forecast hourly day-ahead market prices in the Nordic day-ahead energy market is illustrated in Figure 3. The market spot price forecasts for day D are required on day D-1 (bidding hour: 12 a.m. CET on day D-1). The market spot price data for day D-1 are announced by the system operator and are available on day D-2 (clearing hour: around 1 p.m. CET on day D-2). The actual forecasting of day-ahead prices for day D can take place between the clearing hour for day D-1 of day D-2 and the bidding hour for day D of day D-1.
Figure 3. Time framework to forecast market prices for the Nordic day-ahead energy market.
Energies 06 05897 g003
In multistep ahead prediction, the predicted price value of the current step is used to determine its value in the next step, and this cycle is repeated until the price values of the whole forecast horizon are predicted.

5.2. Price Spike Module: Compound Classifier

First, the set of candidate inputs for the compound classifier is constructed. Values of original price series lagged up to 200 h before a forecast hour are considered among the candidate inputs. If the period of the study is extended further, the results are not affected seriously, that is, the relation of the current price with the price of much more than one week ago is very small [48]. Thus, lagged hours take into account short-run trend, daily and weekly periodicity of the electricity time series itself and external explanatory time series [19,43,49].
Electricity demand and supply are among the candidate inputs for the compound classifier since the relations of these variables are known to drive the movement in the price spikes to a large extent [17]. Therefore, total electricity generation (i.e., internal supply (sup)) and electricity demand (d) in Finland, both lagged up to 200 h before a forecast hour, are selected. Despite its general importance, demand and supply forecasts will not be the focus of the present paper. Here, a WT + ARIMA model [26] is implemented to predict supply. The effect of weather variation is incorporated in a WT + ARIMAX model to predict demand. Atmospheric temperature is chosen as an indicator of weather variability.
Approximation (A3p) and detail (D1p) price wavelet components of a price series, both lagged up to 200 h before a forecast hour, are also candidate inputs for the compound classifier. In [19], a high correlation of a spiky price series with these wavelet components has been described. Hourly (indh), daily (indd), and seasonal (inds) indices are considered as candidate inputs to indicate the temporal effect.
The ARIMA is used as the initial price forecasting model and produces preliminary day-ahead predictions for all price wavelet subseries over the forecast period. For more clarity, prices and the wavelet components predicted by the ARIMA are additionally indexed as “arima” in the paper. For instance, price value predicted by the initial forecasting model at hour h is notated as parima,h and used in the candidate input set for the compound classifier.
Finally, the initial set of candidate inputs for the compound classifier, i.e., for each single classifier, includes both historical and forecasted features of both wavelet and time domains. For instance, the 1008 candidate inputs to predict possibility of spike occurrence at hour h are {parima,h, ph−1…, ph−200; dh,…, dh−200; suph,.., suph−200; A3p_arima,h, A3p,h−1,…, A3p,h−200; D1p_arima,h, D1p,h−1,…, D1p,h−200; indh; indd; inds}.

5.3. Normal Price Module

If the forecast sample is classified as a non-spike, the normal price module is activated. All electricity price spikes are extracted from the original training price series and replaced by the corresponding mean price value to form new normal price series.
Next, the set of candidate inputs for the normal price module is constructed. Firstly, the new normal price series is decomposed into four wavelet components of normal price series. Although the wavelet components are obtained by decomposition of the normal price signal, historical values of the original normal price series are considered among the candidate inputs of each price wavelet component, since it is still possible that some characteristics of the price are better highlighted in the original time domain [45]. Historical and forecasted electricity demand data are also considered within the candidate input set. The ARIMA produces preliminary day-ahead forecasts for all wavelet subseries of the normal price series. Finally, the candidate input set for each wavelet subseries of normal price includes forecasted and lagged price and demand values of these subseries (e.g., A3d is an approximation wavelet subseries of demand to predict A3p) plus original normal prices (p) lagged up to 200 h before a forecast day. For instance, the 602 candidate inputs to predict approximation normal price wavelet component at hour h (A3p,h) are {A3p_arima,h, A3p,h−1,…, A3p,h−200; A3d,h,…, A3d,h−200; ph−1,…, ph−200}.

5.4. Price Spike Module: k-NN

If the forecast sample is classified as a spike, the price spike module is activated. The target set to train a k-NN is formed by the price spike samples extracted from the original training price series. The k-NN uses the set of candidate inputs similar to the one utilized for the compound classifier.

5.5. Search Procedure to Tune Model Parameters

Usually, the adjustable parameters of a forecasting model are selected based on past experience in the study. However, as each energy market has characteristics of its own, selection of optimal model parameters is an open area of a research. In this work, an analytical iterative search procedure is realized. It can automatically adjust the parameters of a forecasting model on a selected validation set with minimum reliance on the heuristics. The procedure is used to select optimal set of inputs by defining the threshold values V1, V2 and parameter settings separately for NN (Nh), k-NN (k), RVM (σRVM and V0), DT (Ntree and V0) and PNN (σPNN and V0).
There are four adjustable parameters when the proposed search procedure is applied for RVM. The procedure is outlined below:
  • Initial values for V0, V1, V2 and σRVM for RVM are set.
  • Using the selected inputs, training samples are constructed. The classifier is trained and produces forecast on the validation set. The corresponding validation error is evaluated and stored.
  • Each adjustable parameter is varied by turn at a neighborhood around its previously selected value, while three remaining parameters are kept constant. A fixed radius of neighborhood (±25% of the previously selected value) is considered in the local search. For each value of the varied parameter in the neighborhood, training of the classifier is repeated and validation error is evaluated and stored. The value of the varied parameter resulting in the least validation error is selected and fixed. When only the first cycle described in the current step is executed, this cycle is repeated again. This modification is made to avoid a local minimum trap in the search procedure. Therefore, if the procedure misses the optimum solution in one cycle, it may find the optimum point in the next cycle.
  • If the selected values of the adjustable parameters in the current cycle are the same as their previous values, the search procedure is terminated. Otherwise go to step 3.

5.6. Forecast Strategy

The proposed forecast strategy can be summarized by the following step-by-step algorithm, shown also in Figure 4.
Figure 4. Procedure of the proposed method.
Energies 06 05897 g004
  • Original electricity price series is decomposed into four subseries by the wavelet transform.
  • ARIMA models are built to predict the future values of the price wavelet subseries 24 h ahead.
  • The compound classifier is activated:
    C. 1.
    The set of candidate inputs for each single classifier is constructed.
    C. 2.
    The threshold values for the proposed two-step feature selection algorithm and parameter settings for each single classifier are fine-tuned.
    C. 3.
    Each classifier is trained and predicts the spike occurrence possibility 24 h ahead.
    C. 4.
    Final output from the compound classifier is formed in a majority voting scheme.
  • For all test samples forecasted as non-spikes, the normal price module is activated.
    D. 1.
    All spike samples are extracted from the original training price series. The new adjusted normal price series is decomposed into four wavelet subseries.
    D. 2.
    ARIMA models are built to predict the future values of the normal price wavelet subseries 24 h ahead.
    D. 3.
    The set of candidate inputs to predict each normal price wavelet subseries by NN is constructed.
    D. 4.
    V1, V2 and Nh for NN’s are fine-tuned.
    D. 5.
    With the selected parameters, NNs are trained and predict normal price wavelet subseries 24 h ahead.
  • For all test samples forecasted as spikes the price spike module is activated.
    E. 1.
    All spike samples previously extracted from the original training price series are formed into spike series and used as targets to train the k-NN model.
    E. 2.
    The set of candidate inputs for the k-NN model is constructed.
    E. 3.
    V1, V2 and k for the k-NN are fine-tuned.
    E. 4.
    With the selected parameters, the k-NN is trained and predicts price spike value.
  • The overall electricity price forecast is formed as a joint output from the normal price and price spike modules.
  • The overall price forecast (original and transformed into price wavelet components) replaces the predictions produced by the initial forecasting model for the current forecast day, since it is expected that electricity prices predicted by the separate forecasting frameworks have more accuracy. After replacement, the forecasting cycle is repeated as shown in Figure 4 until no difference in the overall electricity price forecast output of two successive iteration steps is observed.

6. Case Study

For examination of the proposed method, the real hourly data of the Finnish day-ahead energy market are considered. The electricity price, demand and supply historical data over the period from November 2008 to December 2009 are used to establish the initial training data sample set. The data over the period from January 2010 to December 2010 are used as the test set.

6.1. Training Phase

Training periods for the forecasting models of the normal price and price spike modules are different. As recommended in [26,43], a 50 days training period preceding the forecast day is considered for the NNs of the normal price module. It should be borne in mind that the price series have local trends since market conditions evolve with time, and, hence, use of a long training period may result in significant inaccuracies.
However, there are only few price spike samples in the whole data set (see Table 1). Unlike normal price prediction, in order to get a sufficient number of spike samples to train the model, a longer price series period is required. Hence, 365 days preceeding the forecast day are considered for the price spike module (the compound classifier and the k-NN model).
Since the forecasting models of the normal price and price spike modules have the inputs preliminarily predicted by other models their training periods are extended to comprise two consecutive periods: a moving training period for the preliminary model and the training period of the main model.
As a result, to predict normal prices or price spikes, a day denoted by D is considered in the corresponding second training period. Values of prices for this day are assumed to be unknown. The preliminary ARIMA models are trained by the historical data of the 50 days proceeding hour 1 of day D and predict price wavelet subseries of day D. To improve the performance of the ARIMA forecast process for each day of the second training period (D = 1,…, 50 for NNs or D = 1,…, 365 for the price spike module), the ARIMA models are trained by the immediately previous 50-days period. This process is repeated until forecasts from the ARIMA models are obtained for all days of the corresponding second training period (see Figure 5).
Figure 5. Historical data required for the training of the normal price and price spike modules to produce overall price forecast on a single forecast day.
Energies 06 05897 g005

6.2. Validation Phase

The 24 h before the forecast day are removed from the training set of the NNs of the normal price module and used as the validation data set. Then, the NNs are trained by the remaining training samples. Adjusted parameters are fine-tuned on the validation data set. For the price spike module, all adjustable parameters of the classification approaches are fine-tuned by a 10-fold cross-validation technique applied for a whole training data set.

6.3. Numerical Results

The obtained results of the two-step feature selection algorithm implemented for the compound classifier, the k-NN and the NN to predict prices in the Finnish day-ahead energy market for a single forecast day, 5 January 2010, are presented in Table 2 and Table 3. Since electricity price spikes have a very volatile stochastic nature with respect to the normal price time series, regular and periodic behaviour of price spikes are not so obvious (see Table 2). Otherwise, variables of the short-run trend (e.g., A3p,h−1, D3p,h−2), daily periodicity (e.g., A3p,h−25, D3p,h−24) and weekly periodicity (e.g., A3p,h−169, A3d,h−169) are among the selected input features to forecast normal price wavelet components (see Table 3).
Table 2. Selected inputs for the three classification approaches of the compound classifier and the k-NN for a single forecast day, 5 January 2010.
EngineV0/V1/V2ParameterSelected candidates
RVM0.43/0.46/0.64σRVM = 0.13A3p_arima,h, A3p,h−1, A3p,h−2, A3p,h−4, A3p,h−5, A3p,h−6, A3p,h−7, D1p_arima,h, D1p,h−1, D1p,h−2, D1p,h−3, ph−1, ph−2, ph−3, ph−4,dh, dh−2, dh−46, dh−72, suph, indh, indd
PNN0.47/0.50/0.78σPNN = 0.03A3p_arima,h, A3p,h−1, A3p,h−2, A3p,h−3, A3p,h−4, A3p,h−5, A3p,h−6, A3p,h−22, D1p_arima,h, D1p,h−1, D1p,h−2, D1p,h−3, D1p,h−4, D1p,h−5, ph−2, ph−3, ph−4, dh−2, dh−21, dh−22, suph−2, indh, indd, inds
DT0.42/0.48/0.61Ntree = 100A3p_arima,h, A3p,h−1, A3p,h−2, A3p,h−4, A3p,h−5, A3p,h−6, A3p,h−7, D1p,h−1, D1p,h−2, D1p,h−3, ph−1, ph−2, ph−3, ph−4, ph−5, dh, dh−4, dh−19, dh−69, dh−73, indh, indd
k-NN-/0.45/0.56k = 3A3p_arima,h, A3p,h−2, A3p,h−9, A3p,h−15, A3p,h−21, D1p,h−2, D1p,h−5, D1p,h−7, D1p,h−8, D1p,h−16, ph−1, ph−3, ph−7, ph−52, dh−190, indh, indd, inds
Table 3. Inputs selected by the two-step feature selection to predict the normal price wavelet components for the NN for a single forecast day, 5 January 2010.
SubseriesNh/V1/V2Selected candidates
A3 p4/0.52/0.71A3p_arima,h, A3p,h−1, A3p,h−3, A3p,h−4, A3p,h−16, A3p,h−21, A3p,h−25, A3p,h−72, A3p,h−97, A3p,h−121, A3p,h−144, A3p,h−169, A3d,h−8, A3d,h−10, A3d,h−11, A3d,h−42, A3d,h−91, A3d,h−98, A3d,h−141, A3d,h−169, ph−72, ph−95, ph−97,ph−120
D3 p7/0.47/0.81D3p_arima,h, D3p,h−1, D3p,h−2, D3p,h−11, D3p,h−24, D3p,h−48, D3p,h−60, D3p,h−96, D3d,h−12, D3d,h−47, D3d,h−71, D3d,h−143
D2 p4/0.41/0.74D2p_arima,h, D2p,h−1, D2p,h−7, D2p,h−8, D2p,h−24
D1 p6/0.15/0.85D1p_arima,h, D1p,h−6, D1p,h−24, D1p,h−30, D1p,h−48, D1p,h−72, D1p,h−94, D1p,h−120, D1p,h−157
In this paper, Adapted Mean Average Percentage Error (AMAPE) proposed in [10] was considered to evaluate the forecast results:
A M A P E = ( t = 1 T [ | P i A C T U A L P i F O R E C | / ( t = 1 T P i A C T U A L / T ) ] / T ) 100 %
where PiACTUAL and PiFOREC are actual and forecast values of hour i, respectively; and T is the number of predictions.
In addition, two performance measures that are spike prediction accuracy and spike prediction confidence proposed in [17] are used to reliably assess the performance of the compound classifier.
Spike prediction accuracy is a ratio of the number of correctly classified spikes (Ncorr) to the number of actual spikes (Nsp):
S p i k e   p r e d i c t i o n   a c c u r a c y = ( N c o r r / N s p ) 100 %
This measure was introduced because the ability to correctly predict spike occurrence is the subject of greatest concern.
Spike prediction confidence aims to account for the uncertainties and risks carried within the forecast. Spike prediction confidence is described as:
S p i k e   p r e d i c t i o n   c o n f i d e n c e = ( N c o r r / N a s _ s p ) 100 %
where Ncorr is the number of correctly classified spikes and Nas_sp is the number of observations classified as spikes. As the classifier may misclassify some nonspikes as spikes, this definition is used to assess the percentile in which the classifier makes this kind of a mistake.
Only few research works have considered price forecasting in the Finnish day-ahead energy market and it was not possible to find price forecast methods considering the above-mentioned test period for price forecast. Therefore, the overall accuracy of the proposed method is compared with some of the most popular price forecast techniques applied for case studies of energy markets of other countries: seasonal ARIMA [5,44,50]; WT+ARIMA [26,28]; NN [6,50]; WT + NN [11]. Additionally, WT + ARIMA + NN, which has not been found in the literature is among competitive techniques. To demonstrate the efficiency of the proposed methodology, its obtained results for the Finnish day-ahead energy market in year 2010 are shown in Table 4 with corresponding results obtained from five other prediction techniques.
In the WT + NN and WT + ARIMA + NN models separate NNs with the LM algorithm are applied for each price wavelet component. For a fair comparison, NN, WT + NN and WT + ARIMA + NN have historical and forecasted demand data among the candidate inputs. Feature selection analysis based on the proposed two-step feature selection is utilized for all examined models. The adjustable parameters of the competing models are fine-tuned by the proposed search procedure. It should be noted that among the competing examined models, only the WT + ARIMA + NN has preliminarily predicted price values in its set of candidate inputs i.e., the NN uses predictions from ARIMA as the candidate input.
As seen from Table 4, the AMAPE values corresponding to the proposed strategy are lower than the values obtained from other examined methods. The accuracy improvement of the proposed method with respect to seasonal ARIMA, WT + ARIMA, NN, WT + NN, and WT + ARIMA + NN in terms of AMAPE is 45.88% [(1 − 8.08/14.93) × 100%], 19.44% [(1 − 8.08/10.03) × 100%], 35.46% [(1 − 8.08/12.52) × 100%], 32.55% [(1 − 8.08/11.98) × 100%], and 16.36% [(1 − 8.08/9.66) × 100%], respectively. It can also be seen that the use of WT results in an improvement in the model accuracy. This improvement in ARIMA in comparison with WT+ARIMA in terms of AMAPE is 32.82% [(1 − 10.03/14.93) × 100%]. For the NN in comparison with WT+NN, this value is 4.31% [(1 − 11.98/12.52) × 100%]. The results also confirm the efficiency of the hybrid methodology with linear and nonlinear modeling capabilities (WT + NN versus WT + ARIMA + NN) where the improvement is 19.37% [(1 − 9.66/11.98) × 100%].
Table 4. AMAPE (%) obtained from different techniques for price forecasts in the Finnish day-ahead energy market of year 2010.
TypeSeasonal ARIMAWT + ARIMANNWT + NNWT + ARIMA + NNProposed method
Normal10.537.538.178.017.185.89
Spikes55.7640.5146.3344.2237.7232.91
Overall14.9310.0312.5211.989.668.08
It is expected that implementation of the proposed iteration strategy increases the accuracy of the overall price prediction. Detailed results of the proposed iteration strategy for the four test weeks of the Finnish day-ahead energy market of year 2010 are shown in Table 5. These test weeks are related to dates 1−7 January 2010, 8−14 January 2010, 29 January−4 February 2010, 5−11 February 2010, respectively, and indicate periods of high volatility in energy price series. Iteration 0 in Table 5 represents the obtained results from the initial forecasting model.
Table 5. Accuracy of the proposed iteration procedure in terms of AMAPE (%) for the four test weeks of year 2010.
IterationWeek1Week2Week5Week7
017.4637.2713.4910.87
112.5626.247.966.93
29.5025.167.246.81
39.41--6.59
As seen from Table 5, the iteration procedure converges in at most three cycles and the prediction error for the four test weeks at the end of the iterative forecast process with respect to Iteration 1 is improved by 13% on average. In addition, the performance of the proposed compound classifier is compared with selected single classifiers and other techniques: Naïve Bayesian [17], SVM [17], PNN [19], RVM [34], and DT [35]. Ncorr and Nas_sp for the Finnish day-ahead energy market of year 2010 are presented in the second and third columns of Table 6, respectively. Corresponding spike prediction accuracy and confidence in terms of percentage are given in the fourth and fifth columns of Table 6. Candidate inputs of all alternative classifiers are similar to the candidate input set of the compound classifier and refined by the proposed two-step feature selection. All preliminarily predicted price variables which are among the input sets of each competing classifier are predicted by ARIMA model. This action is similar to the case when spike occurrence is predicted using forecasts from the initial forecasting model.
Table 6. Ncorr, Nas_sp, occurrence prediction accuracy and confidence in terms of percentage (%) for price spike classification in the Finnish day-ahead energy market of year 2010.
EngineARIMA as a preliminary forecasting modelFinal iteration step of the proposed methodology
PredictedAccuracyConfidencePredictedAccuracyConfidence
NcorrNas_spNcorrNas_sp
Bayes12424768.1350.20----
SVM12017465.9368.79----
PNN11215561.5472.2614716180.7791.30
RVM11916865.3870.8316319089.5685.79
DT12216667.0371.0815217983.5184.92
Comp.12215267.0377.6316217489.0193.10
To justify the proposed iteration strategy particularly for the price spike occurrence forecast, Ncorr and Nas_sp, accuracy and confidence measures obtained from the compound classifier on the final iteration step of the proposed methodology are shown in the sixth, seventh, eighth and ninth columns of Table 6, respectively. Total number of actual spike samples in the testing data set is 182. From the obtained results given in Table 6, it can be seen that the use of the iteration strategy results in a notable accuracy improvement of price spike occurrence prediction. Only RVM has slightly better spike prediction accuracy than the compound classifier, while the compound classifier has considerably better spike prediction confidence than RVM.
Table 7 shows the results obtained from each single classifier and the compound classifier itself on the final iteration step. The set of actual price spike test samples of year 2010 are divided according to their price value intervals (see the second column of Table 7). Large price spikes with values varying between 300 and 1500 euro/MWh constitute around 15% of all the spike samples. Because of their values and stochastic character, they are extremely important for all market participants. All the classifiers presented in Table 7 are able to correctly discriminate all the large spike samples of the test period. The accuracy of the examined classifiers varies in the prediction of price spike samples with values between 85 and 300 euro/MWh.
Table 7. Results obtained by the compound classifier for different price spike intervals.
Price interval, euro/MWhNumber of Actual SpikesNumber of predicted spikes
PNNRVMDTCompound
85–1506650555355
150–3008768797078
300–5001818181818
500–100011111
1000–15001010101010
TOTAL182147163152162
For a more detailed representation of the performance of the proposed forecast strategy and separately for price spike occurrence on the whole test year, their results for all the weeks of year 2010 are shown in Table 8. There are six measures given for all test weeks of the day-ahead Finnish energy market of 2010: AMAPE, Nsp, Ncorr, Nas_sp, accuracy and confidence of the spike forecast.
As can be seen from Table 8, price forecasts of the weeks related to a winter season (December-February), i.e., weeks 1–8 and 48–52 of year 2010, have higher prediction error with respect to price forecasts related to other yearly seasons. The performance of the forecasting model is worse during the winter season, due to extreme price volatility, reflected in price spikes, which is caused by a number of complex factors and exists during periods of market stress. These stressed market situations are generally associated with extreme meteorological events and unusually high demand. However, in light of the fact that price spike values are highly stochastic, the achieved forecast accuracy level is fairly good and provides market participants with an ability to analyze spikes and thus manage their risks. Moreover, as can be seen from 
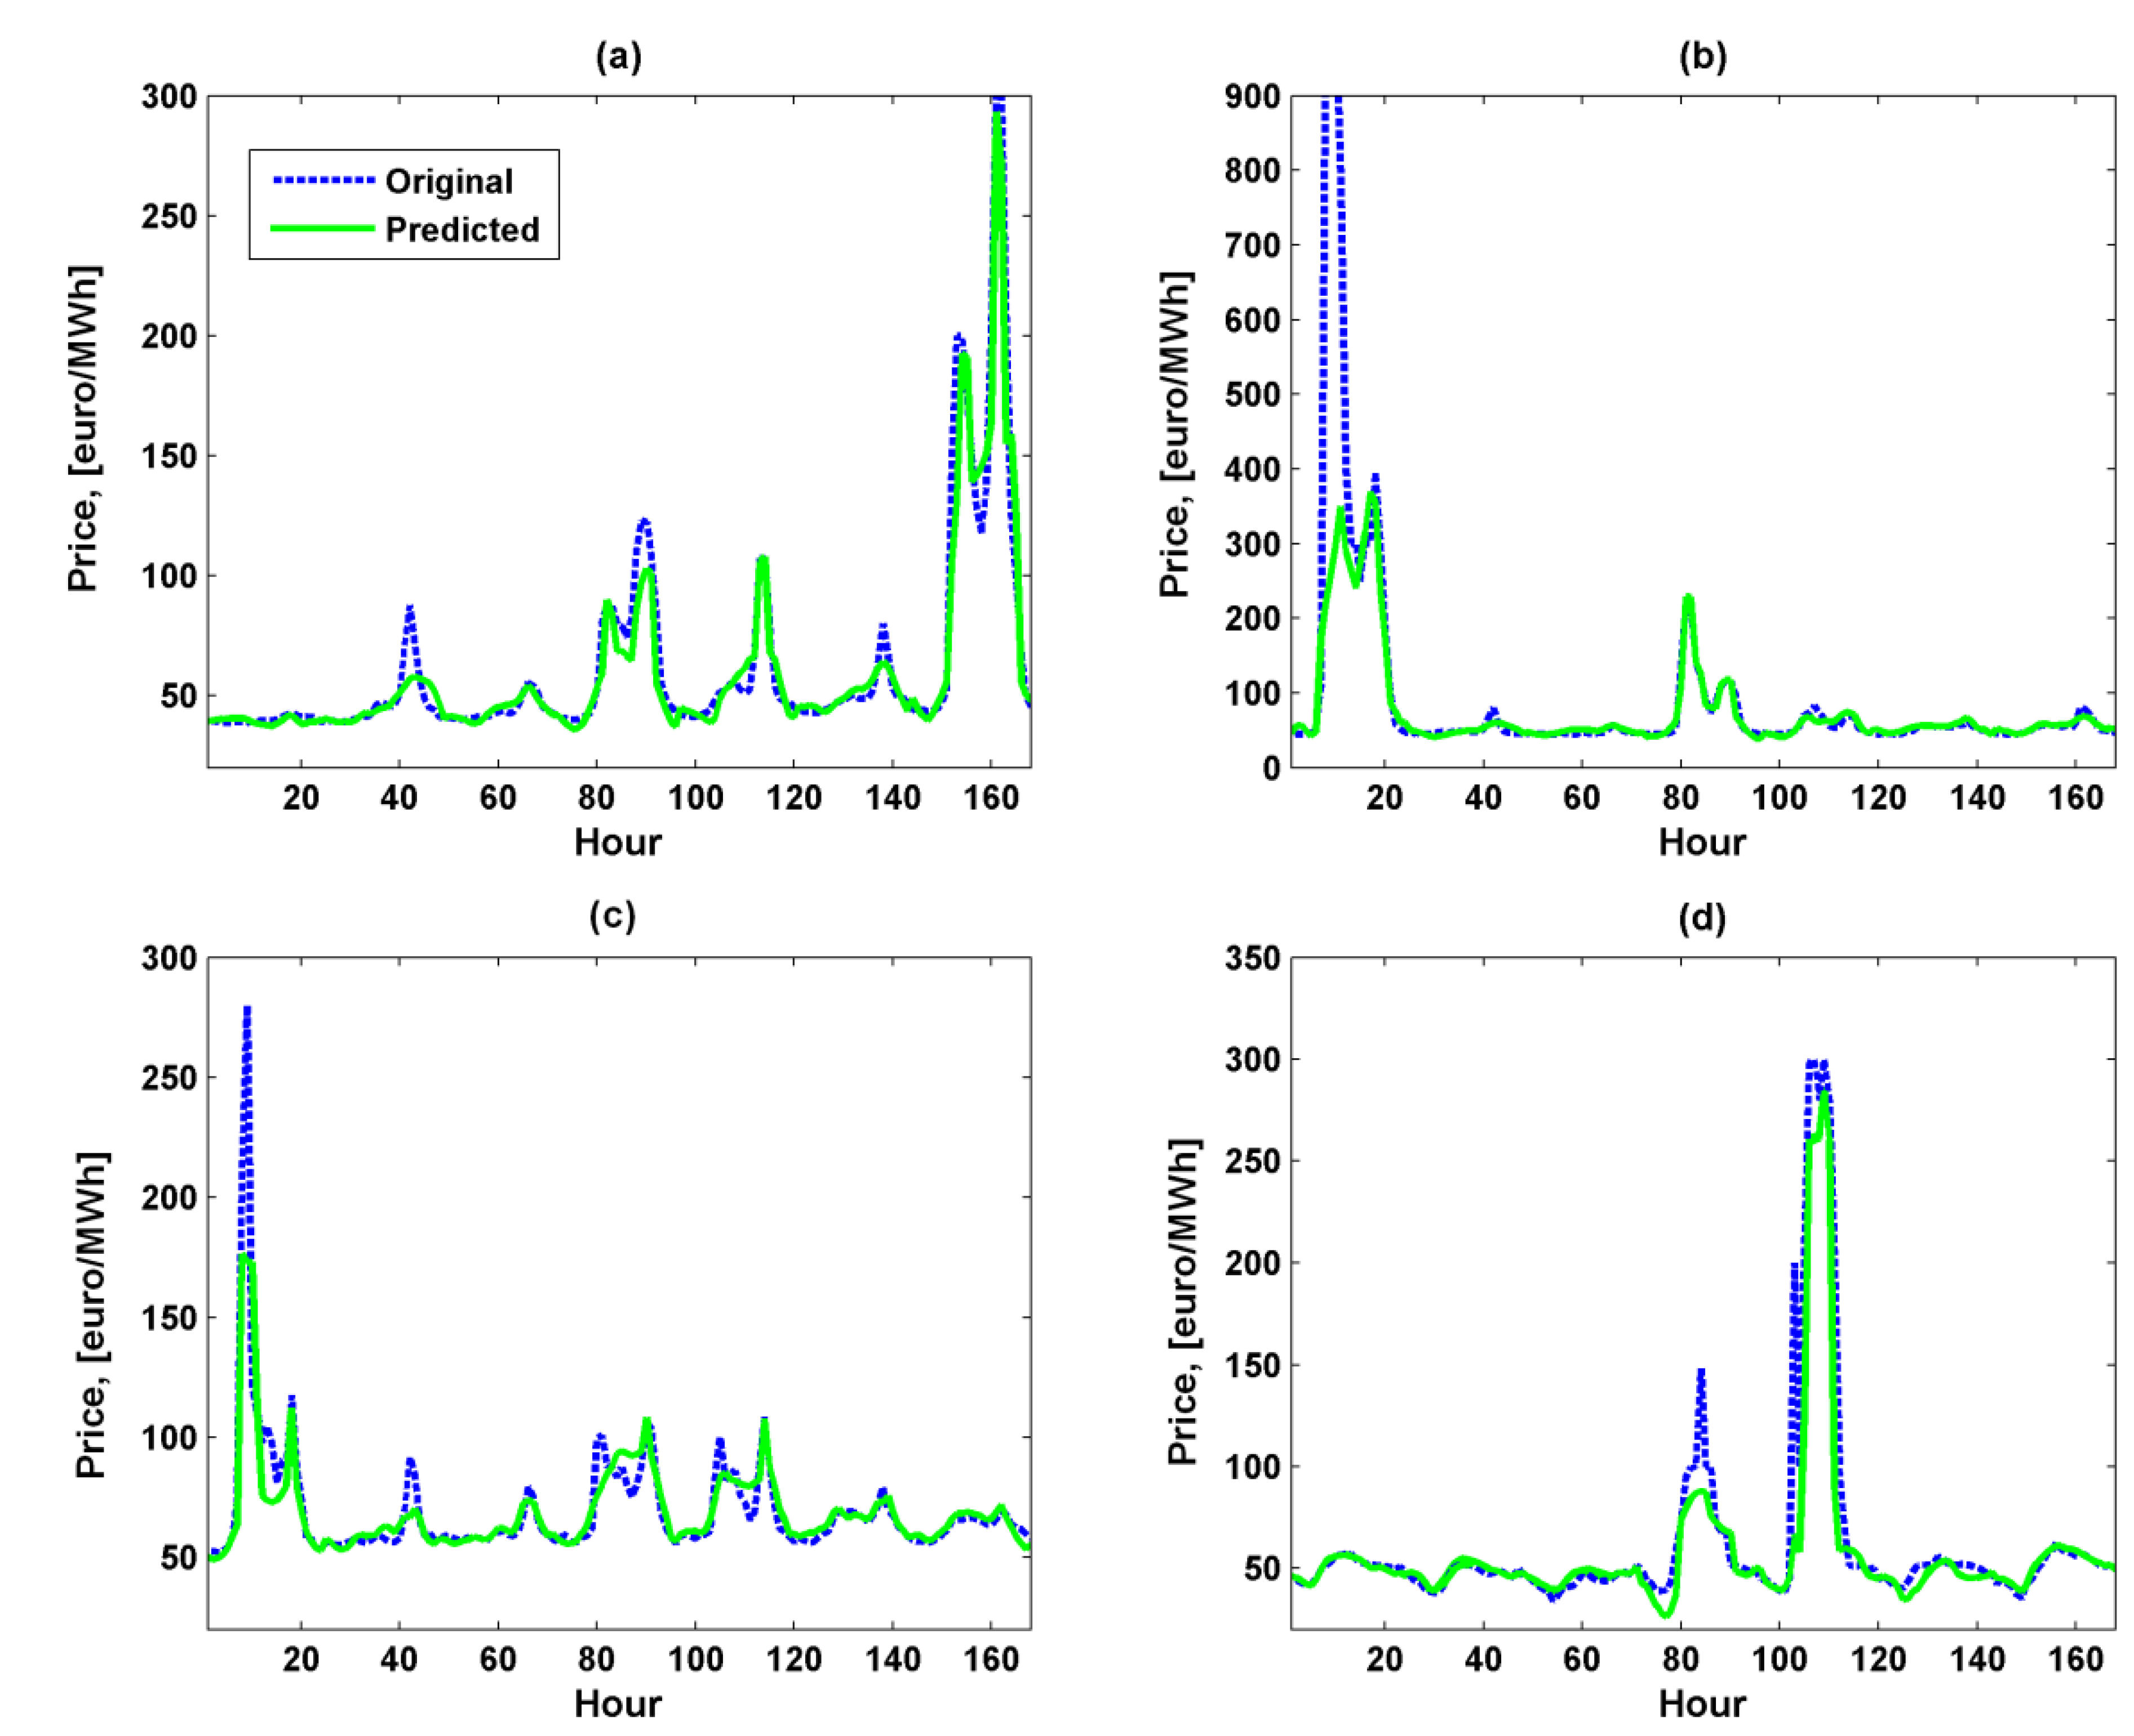
Table 8, occurrence of price spikes generally existing in the winter period is predicted by the proposed methodology with high accuracy and confidence. In this context, price spike prediction can be considered as a forecasting of a price volatility rather than exact price value. In order to graphically illustrate the price forecast performance of the proposed methodology and emphasize its ability to capture spikes, the forecasted and actual signals for the four selected spiky weeks (1,2,5 and 28 in Table 8) of the Finnish day-ahead energy market of year 2010 are shown in Figure 6.
Table 8. Obtained results from the proposed forecasting methodology for each week of 2010.
Week123456
AMAPE9.4125.166.315.757.244.51
Nsp/Ncorr/Nas_sp23/21/2222/22/220/0/09/8/87/7/71/0/0
Accur./Conf.91.30/95.45100/100-88.89/100100/1000/-
Week789101112
AMAPE6.5930.756.496.114.763.55
Nsp/Ncorr/Nas_sp5/5/544/39/392/2/20/0/00/0/10/0/1
Accur./Conf.100/10077.27/97.14100/100--/0-
Week131415161718
AMAPE2.842.993.315.076.116.88
Nsp/Ncorr/Nas_sp0/0/00/0/00/0/00/0/00/0/00/0/0
Accur./Conf.------
Week192021222324
AMAPE7.4315.516.358.037.236.46
Nsp/Ncorr/Nas_sp0/0/00/0/00/0/00/0/00/0/00/0/0
Accur./Conf.------
Week252627282930
AMAPE6.157.234.2612.824.565.38
Nsp/Ncorr/Nas_sp0/0/00/0/00/0/09/7/70/0/20/0/0
Accur./Conf.---77.78/100-/0-
Week313233343536
AMAPE7.586.343.063.144.992.19
Nsp/Ncorr/Nas_sp0/0/00/0/00/0/00/0/00/0/00/0/0
Accur./Conf.------
Week373839404142
AMAPE3.642.653.642.433.834.09
Nsp/Ncorr/Nas_sp0/0/00/0/00/0/00/0/00/0/00/0/0
Accur./Conf.------
Week434445464748
AMAPE5.913.142.262.834.0317.12
Nsp/Ncorr/Nas_sp0/0/10/0/00/0/00/0/00/0/012/7/8
Accur./Conf.-----58.33/87.50
Week49505152
AMAPE8.3711.025.704.22
Nsp/Ncorr/Nas_sp3/3/335/33/349/8/110/0/1
Accur./Conf.100/10082.86/96.6788.89/72.73-/0
As can be seen in Figure 6, all the forecasted price curves acceptably follow the actual curves. The proposed methodology based on a hybrid iterative strategy is able to capture essential features of the given price time series: non-constant mean, cyclicality, exhibiting daily and weekly patterns, major volatility and significant outliers. This ability results in the superiority of the proposed methodology over all the examined alternative techniques.
Figure 6. Real and predicted prices for the four weeks with prominent spikes of the Finnish energy market of year 2010: (a) Week 1; (b) Week 2; (c) Week 5; (d) Week 28.
Energies 06 05897 g006
The total running time to set up the proposed separate forecasting strategy including its normal price module, price spike module, and iterative prediction process for the first forecast day is about 42 h since price predictions produced by the initial forecasting model are required over the period up to 365 days. The running time of the training and prediction procedures for the next forecast days after the first one is significantly lower (about 50 min) and considered suitable for day-ahead energy market operation. All the competitive non-separate forecasting approaches examined for price prediction have lower computation costs than the proposed separate forecasting strategy but are outperformed by the proposed strategy in terms of forecasting accuracy. The prediction accuracy is a crucial concern for a forecasting method (as far as the computation time is reasonable). The PNN and RVM classifiers of the compound classifier have relatively lower computational costs than the alternative back-propagation NN and SVM, respectively. The training process of the PNN is carried out through one run of each training sample unlike the back-propagation algorithm. The RVM is faster than the SVM in decision speed, as the RVM has a much sparser structure (the number of relevant vectors versus the number of support vectors). The computation times to set up the proposed and competitive forecasting strategies are measured on a hardware platform comprising an Intel Core i5 2.40 GHz processor (Intel Corporation, Santa Clara, CA, USA) and 3.24 GB RAM. All computer codes are provided by the MATLAB (MathWorks, Natick, MA, USA) and R (R Development Core Team, Auckland, New Zealand) software packages.

7. Conclusions

In this paper, an iterative forecasting methodology for prediction of prices in the day-ahead energy market is proposed. The proposed method is composed of two modules separately applied for normal prices and price spikes prediction. The forecasting performance of the proposed method is compared with the corresponding values of the most popular frameworks for price prediction and separately for price spike occurrence prediction. The proposed method generally outperforms other competing forecasting methods due to its ability to capture different distinct features of the given price time series and incorporate an iteration strategy to separately predict two processes: normal prices and price spikes.
It should be noted that many other exogenous variables can be considered in candidate sets for feature selection, such as fuel costs and meteorological information, but this is a topic for future research. There is a clear need for a more accurate method for price spike value prediction. Possible methods which could be based on NNs or RVM regression approaches will be considered in future. Moreover, investigation of the energy costs sensitivity to price forecast accuracy across different market participants is a topic for further research.

Conflicts of Interest

The authors declare no conflict of interest.

References

  1. Bunn, D.W. Modelling Prices in Competitive Electricity Markets; Wiley: New York, NY, USA, 2004; pp. 1–17. [Google Scholar]
  2. Bastian, J.; Zhu, J.; Banunarayanan, V.; Mukerji, R. Forecasting energy prices in a competitive market. Comp. App. Power 1999, 12, 40–45. [Google Scholar] [CrossRef]
  3. Zhang, H.; Gao, F.; Wu, J.; Liu, K.; Liu, X. Optimal bidding strategies for wind power producers in the day-ahead electricity market. Energies 2012, 5, 4804–4823. [Google Scholar] [CrossRef]
  4. Schneider, S. Power spot price models with negative prices. J. Energy Mark. 2012, 4, 77–102. [Google Scholar]
  5. Contreras, J.; Espínola, R.; Nogales, F.J.; Conejo, A.J. ARIMA models to predict next-day electricity prices. IEEE Trans. Power Syst. 2003, 18, 1014–1020. [Google Scholar] [CrossRef]
  6. Mandal, P.; Srivastava, A.K.; Senjyu, T.; Negnevitsky, M. A new recursive neural network algorithm to forecast electricity price for PJM day-ahead market. Int. J. Energy Res. 2010, 34, 507–522. [Google Scholar] [CrossRef]
  7. Hong, Y.; Wu, C.-P. Day-ahead electricity price forecasting using a hybrid principal component analysis network. Energies 2012, 5, 4711–4725. [Google Scholar] [CrossRef]
  8. Georgilakis, P.S. Artificial intelligence solution to electricity price forecasting problem. Appl. Artif. Intell. 2007, 21, 707–727. [Google Scholar] [CrossRef]
  9. Georgilakis, P.S. Market Clearing Price Forecasting in Deregulated Electricity Markets Using Adaptively Trained Neural Networks. In Proceedings of the fourth Helenic Conference on Artificial Intelligence, Heraklion, Greece, 18–20 May 2006; pp. 56–66.
  10. Wu, L.; Shahidehpour, M. A hybrid model for day-ahead price forecasting. IEEE Trans. Power Syst. 2010, 25, 1519–1530. [Google Scholar] [CrossRef]
  11. Shafie-khah, M.; Moghaddam, M.P.; Sheikh-El-Eslami, M.K. Price forecasting of day-ahead electricity markets using a hybrid forecast method. Energy Convers. Manag. 2011, 52, 2165–2169. [Google Scholar] [CrossRef]
  12. Yamin, H.Y.; Shahidehpour, S.M.; Li, Z. Adaptive short-term electricity price forecasting using artificial neural networks in the restructured power markets. Electr. Power Energy Syst. 2004, 26, 571–581. [Google Scholar] [CrossRef]
  13. Weron, R. Modeling and Forecasting Electricity Loads and Prices: A Statistical Approach; Wiley: Chichester, UK, 2006; pp. 125–127. [Google Scholar]
  14. Keles, D.; Genoese, M.; Most, D.; Fichtner, W. Comparison of extended mean-reversion and time series models for electricity spot price simulation considering negative prices. Energy Econ. 2012, 34, 1012–1032. [Google Scholar] [CrossRef]
  15. Becker, R.; Hurn, S.; Pavlov, V. Modelling spikes in electricity prices. Econ. Rec. 2007, 83, 371–382. [Google Scholar] [CrossRef]
  16. Lu, X.; Dong, Z.Y.; Li, X. Electricity market price spike forecast with data mining techniques. Electr. Power Syst. Res. 2005, 73, 19–29. [Google Scholar] [CrossRef]
  17. Zhao, J.H.; Dong, Z.Y.; Li, X.; Wong, K.P. A framework for electricity price spike analysis with advanced data mining methods. IEEE Trans. Power Syst. 2007, 22, 376–385. [Google Scholar] [CrossRef]
  18. Zhao, J.H.; Dong, Z.Y.; Li, X. Electricity market price spike forecasting and decision making. IET Gener. Transm. Distrib. 2007, 1, 647–654. [Google Scholar] [CrossRef]
  19. Amjady, N.; Keynia, F. Electricity market price spike analysis by a hybrid data model and feature selection technique. Electr. Power Syst. Res. 2010, 80, 318–327. [Google Scholar] [CrossRef]
  20. Plazas, M.A.; Conejo, A.J.; Prieto, F.J. Multimarket optimal bid-ding for a power producer. IEEE Trans. Power Syst. 2005, 20, 2041–2050. [Google Scholar] [CrossRef]
  21. Carrion, M.; Philpott, A.B.; Conejo, A.J.; Arroyo, J.M. A stochastic programming approach to electric energy procurement for large consumers. IEEE Trans. Power Syst. 2007, 22, 744–754. [Google Scholar] [CrossRef]
  22. Dimitroulas, D.K.; Georgilakis, P.S. A new memetic algorithm approach for the price based unit commitment problem. Appl. Energy 2011, 88, 4687–4699. [Google Scholar] [CrossRef]
  23. Granger, C.W.J. Non-linear models: Where do we go next—Time varying parameter models? Stud. Nonlinear Dyn. Econom. 2008, 12. [Google Scholar] [CrossRef]
  24. Cervigón, R. Biomedical Applications of the Discrete Wavelet Transform, Discrete Wavelet Transforms—Biomedical Applications; Olkkonen, H., Ed.; InTech: Rijeka, Croatia, 2011; pp. 1–16. [Google Scholar] [CrossRef]
  25. Galli, A.W.; Heydt, G.T.; Ribeiro, P.F. Exploring the power of wavelet analysis. IEEE Comput. Appl. Power 1996, 9, 37–41. [Google Scholar] [CrossRef]
  26. Conejo, A.J.; Plazas, M.A.; Espinola, R.; Molina, A.B. Day-ahead electricity price forecasting using the wavelet transform and ARIMA models. IEEE Trans. Power Syst. 2005, 20, 1035–1042. [Google Scholar] [CrossRef]
  27. Mallat, S.G. A theory for multiresolution signal decomposition-the wavelet representation. IEEE Trans. Pattern Anal. Mach. Intell. 1989, 11, 674–693. [Google Scholar] [CrossRef]
  28. Tan, Z.; Zhang, J.; Wang, J.; Xu, J. Day-ahead electricity price forecasting using wavelet transform combined with ARIMA and GARCH models. Appl. Energy 2010, 87, 3606–3610. [Google Scholar] [CrossRef]
  29. Box, G.E.P.; Jenkins, G.M. Time Series Analysis. Forecasting and Control; Holden-Day: San Francisco, CA, USA, 1970; pp. 51–60. [Google Scholar]
  30. Brockwell, P.J.; Davis, R.A. Introduction to Time Series and Forecasting; Springer: New York, NY, USA, 1996; pp. 180–185. [Google Scholar]
  31. Catalão, J.P.S.; Mariano, S.J.P.S.; Mendes, V.M.F.; Ferreira, L.A.F.M. Short-term electricity prices forecasting in a competitive market: A neural network approach. Electr. Power Syst. Res. 2007, 77, 1297–1304. [Google Scholar] [CrossRef]
  32. Haykin, S. Neural Networks: A Comprehensive Foundation, 2nd ed.; Prentice-Hall: Englewood Cliffs, NJ, USA, 1999; pp. 109–110. [Google Scholar]
  33. Kittler, J.; Hatef, M.; Duin, R.P.; Matas, J.G. On combining classifiers. IEEE Trans. Patt. Anal. Mach. Int. 1998, 20, 226–239. [Google Scholar] [CrossRef]
  34. Meng, K.; Dong, Z.; Wang, H.; Wang, Y. Comparisons of machine learning methods for electricity regional reference price forecasting. Lect. Notes Comp. Sci. 2009, 5551, 827–835. [Google Scholar]
  35. Huang, D.; Zareipour, H.; Rosehart, W.D.; Amjady, N. Data mining for electricity price classification and the application to demand-side management. IEEE Trans. Smart Grid 2012, 3, 808–817. [Google Scholar] [CrossRef]
  36. Vapnik, V. The Nature of Statistical Learning Theory; Springer: New York, NY, USA, 1995; pp. 138–140. [Google Scholar]
  37. Tipping, M.E. Sparse Bayesian learning and the relevance vector machine. J. Mach. Learn. Res. 2001, 1, 211–244. [Google Scholar]
  38. Ali, J.; Khan, R.; Ahmad, N.; Maqsood, I. Random forests and decision trees. IJCSI Int. J. Compt. Sci. Issues 2012, 9, 272–278. [Google Scholar]
  39. Provost, F.; Domingos, P. Well-Trained PETs: Improving Probability Estimation Trees; Stern School of Business: New York, NY, USA, 2000; pp. 1–26. [Google Scholar]
  40. Duda, R.O.; Hart, P.E.; Stork, D.G. Pattern Classification; Wiley-Interscience: New York, NY, USA, 2001; pp. 164–166. [Google Scholar]
  41. Specht, D.F. Probabilistic Neural Networks for Classification Mapping, or Associative Memory. In Proceedings of the IEEE International Conference on Neural Networks, San Diego, CA, USA, 24–27 July 1988; pp. 525–532.
  42. Lora, A.; Santos, J.; Exposito, A.; Ramos, J.; Santos, J. Electricity market price forecasting based on weighted nearest neighbors techniques. IEEE Trans. Power Syst. 2007, 22, 1294–1301. [Google Scholar] [CrossRef]
  43. Amjady, N.; Keynia, F. Day ahead price forecasting of electricity markets by a mixed data model and hybrid forecast method. Int. J. Electr. Power Energy Syst. 2008, 30, 533–546. [Google Scholar] [CrossRef]
  44. Nogales, F.J.; Contreras, J.; Conejo, A.J.; Espinola, R. Forecasting next-day electricity prices by time series models. IEEE Trans. Power Syst. 2002, 17, 342–348. [Google Scholar] [CrossRef]
  45. Amjady, N.; Keynia, F. Day-ahead price forecasting of electricity markets by mutual information technique and cascaded neuro-evolutionary algorithm. Trans. Power Syst. 2009, 24, 306–318. [Google Scholar] [CrossRef]
  46. Bierbrauer, S.T.; Weron, R. Lecture Notes in Computer Science; Springer: Berlin, Germany, 2004; pp. 859–867. [Google Scholar]
  47. Cartea, A.; Figueroa, M. Pricing in electricity markets: A mean reverting jump diffusion model with seasonality. Appl. Math. Financ. 2005, 12, 313–335. [Google Scholar] [CrossRef]
  48. Vahidinasab, V.; Jadid, S.; Kazemi, A. Day-ahead price forecasting in restructured power systems using artificial neural networks. Electr. Power Syst. Res. 2008, 78, 1332–1342. [Google Scholar] [CrossRef]
  49. Amjady, N.; Daraeepour, A. Mixed price and load forecasting of electricity markets by a new iterative prediction method. Electr. Power Syst. Res. 2009, 79, 1329–1336. [Google Scholar] [CrossRef]
  50. Taylor, J.W.; de Menezes, L.M.; McSharry, P.E. A comparison of univariate methods for forecasting electricity demand up to a day ahead. Int. J. Forecast. 2006, 22, 1–16. [Google Scholar] [CrossRef] [Green Version]

