Energy Analysis of a Student-Designed Solar House

Department of Civil, Architectural and Environmental Engineering, Missouri University of Science and Technology, 1401 Pine Street, Rolla, MO 65409, USA
*
Author to whom correspondence should be addressed.
Energies 2013, 6(12), 6373-6390; https://doi.org/10.3390/en6126373
Submission received: 18 October 2013
/
Revised: 13 November 2013
/
Accepted: 14 November 2013
/
Published: 4 December 2013
Abstract
:This paper presents the findings from an undergraduate research project concerning the energy efficiency, consumption, and generation of a 1000 ft2 (92.9 m2) solar house. The results were compared to a home of similar size and layout, built using traditional construction methods. The solar house was modeled after the Chameleon House: Missouri University of Science and Technology’s 2013 entry in the U.S. Department of Energy Solar Decathlon. The efficiency of the design was analyzed using Energy-10 Version 1.8 software. For this comparison, a fictional American couple was created and a breakdown of their energy-use habits was recorded to accurately depict the magnitude of energy consumption. A 71% energy savings was forecasted using the Energy-10 software through the incorporation of various energy-conserving strategies in the home’s design. In addition, if a 9.1 kW photovoltaic array is also installed on a home of this size, it is possible to fully offset the energy consumption of the home. The forecasted energy usage and production detailed in this report shall be used for analyzing the integrity of the design of the Chameleon House as well as future solar houses constructed by the Missouri S&T Solar House Team.
1. Introduction
Photovoltaic (PV)—electricity-producing solar panels—first came on the market for domestic and commercial use during the 1960s. Since then, solar technology has seen gradual increases in performance, efficiency, and reliability, while the cost of solar panels has generally fallen. Significant investment in research and development and improved manufacturing processes by the major PV solar technology companies means that consumers continue to benefit from competitively-priced PV solar panels [1]. Homeowners looking to reduce or eliminate their electric bill have the opportunity to implement this alternative energy source. Despite these advancements, shrinking family budgets and the high capital costs involved are often a deterrent for many homeowners. As part of the “green initiative” state and federal governments are encouraging homeowners to purchase renewable energy by offering tax incentives [2].
For example, under current laws a taxpayer may claim a federal tax credit of 30% of qualified expenditures for a system that serves a dwelling unit located in the United States that is owned and used as a residence by the taxpayer [2]. This tax credit is applicable to the costs of the renewable energy system’s components, labor to install any equipment, and any piping or wiring required by the system. If the federal tax credit exceeds tax liability, the excess amount may be carried forward to the succeeding taxable year until 2016 [2]. The tax credit is only for systems placed in service between 1 January 2006 and the end of the year 2016.
Utility companies are also becoming pro-solar, by investing in the technology themselves. Sometimes this may be spurred by the desire to be more eco-friendly. Yet, the recent trend is for states to enact laws requiring a certain percentage of energy produced by utilities to come from “clean” sources. Though Congress has failed to enact a nationwide standard, policymakers at the state level have enthusiastically filled the void, with 29 states and the District of Columbia adopting hard targets for renewable energy production and another eight states setting renewable energy goals [3]. However, as more homeowners install PV arrays, utilities lose their customer base and are still left with the cost of maintaining the grid. This is already a major concern in Australia, a country where more than one million homes now have solar PV [4].
Whether the incentive to invest in renewables be the cost savings, concern for the environment, or a requirement by law, it is always important to first evaluate the available methods for implementing renewables in a building’s design. Energy-10 provides many solutions for addressing the need to not only conserve energy, but develop alternative energy in residential and commercial buildings:
|
|
|
2. Solar Decathlon
Since 2002, the U.S. Department of Energy has sponsored a Solar Decathlon involving university-led teams from both the United States and abroad. They are challenged with designing, building, and operating a solar-powered home. The winner of the competition is the team that best blends affordability, consumer appeal, and design excellence with optimal energy production and maximum efficiency [5]. The Chameleon House was exhibited during October 2013, at Orange County Great Park in Irvine, CA, USA. During this competition, each team is scored in ten independent decathlon contests: architecture, market appeal, engineering, communications, affordability, comfort zone, hot water, appliances, home entertainment, and energy balance.
3. Scope of Work
The focus of this research is the energy consumption of a home of traditional construction versus the 2013 Missouri University of Science and Technology Solar House known as the Chameleon House. This simulation is based on the working schedule and energy-use habits of a fictitious couple residing in the solar house. The analysis targets the annual electricity use attributed to internal lights, external lights, hot water, appliances/plug loads, heating, cooling, and fans. Energy-10 also calculates the annual energy cost in $/ft2 for each home as well as their annual SO2, NOx, and CO2 emissions.
4. House Description/Modeling
To model the typical subfloor cross section, the individual components and their thicknesses were recorded in the Energy-10 program to come up with an accurate representation of the Resistance value (R-value) of each layer. The R-value of a construction material indicates how effective that material is as an insulator. The floor system consists of steel jacks which create the equivalent of a 24" crawl space. This acts as the temporary foundation for the competition. The jacks support a layer of plywood as well as two inches of rigid foam insulation. Then two inches of “EZ Floor” insulation provide support for the radiant floor piping. It is then topped off by three inches of concrete and the finished flooring. This custom assemblage of materials has a corresponding thermal transmittance factor (U-factor) of 0.0171. An assembly’s U factor is the reciprocal of its components’ collective R-factors [Equation (1)]:
Similar analyses of the roof and each of the exterior walls leads to a complete picture of the home’s shell when modeled in Energy-10. Another important part of the shell of the Chameleon House is the energy-efficient windows. Low-e, or low emissivity windows are those that have a thin film of metal-oxide applied which blocks ultra-violet and infrared radiation from passing through, yet still admits most visible light. Thus, low-e windows block summer heat and harmful UV rays from entering the interior without blocking the view to the outdoors. During the wintertime, this reflective coating also traps heat inside the home, further impacting energy savings. Data concerning the home’s components were combined with local weather data; the National Weather Service provided historical data for the seasonal conditions of the Columbia, MO area. This information was used to execute two separate simulations of energy consumption and production.
5. Internal Heat Gains
When sizing a heating, ventilation, and air-conditioning (HVAC) system, several contributing factors are taken into account. The sensible and latent heat sources include appliances, lights, water heaters, fans, plug loads (TV, computer, hair dryer, etc.), and occupants. If these heat sources are ignored, the final design may contain a heating system that is too large for the building, thus wasting the owner’s money. In fact, HVAC can contribute up to 15%–20% of new construction costs [6]. Reduced internal heat gains can be achieved through several methods including: more efficient lights and appliances, solar hot water, reduced plug loads, etc.
The first column of Table 1 represents Energy 10’s suggested values for a traditionally constructed home. Correspondingly, the last column of Table 1 shows suggested values in watts per square foot (W/ft2) for an energy-efficient home via Energy-10. Using data from the Solar House Team, it was possible to tabulate the peak wattage of all appliances for the Chameleon House in the second column. The peak wattages for the refrigerator [7], dishwasher [8], range hood [9], induction cooktop [10], oven [11], microwave [12], washer [13], dryer [14], and circulator pump for the solar hot water system [15] were found directly from the corresponding appliance specification sheets (as shown in Table 2). Discrepancies between the suggested ratio of wattage per square foot (column 5) and Solar House Team Data (column 2) can be discerned from Table 1. Since the initial start-up wattages of certain appliances are much higher than their “running” wattage, this was identified as a potential source of error. However, even the W/ft2 calculated based on “running” wattage produced values for internal gains much higher than the suggested values. Minimal information was provided about how the suggested values were obtained; therefore, research was necessary for the typical appliance wattages. Table 2 shows data obtained from the U.S. Department of Energy [16], a GE Data Visualization [17], and About.com [18] under the Traditional Construction column.

| Category | 1. Traditional construction | 2. Solar house team data | 3. Typical value | 4. Chameleon house calculated value | 5. Energy-efficient home |
|---|---|---|---|---|---|
| Hot water | 0.66 * | 6.1 | 6.9 | 0.58 | 0.10 * |
| Other | 0.36 * | 23 | 29 | 0.29 | 0.10 * |
| People | 2.0 | 2.0 | N/A | 2.0 | 2.0 |
| Indoor lights | 0.50 * | 0.46 | N/A | 0.46 | 0.10 * |
| Outdoor lights | 0.04 * | 0.04 | N/A | 0.04 | 0.01 * |
Notes: * Energy-10 suggested value; 990 ft2 was used for all calculations; solarium was subtracted for ease of modeling.
The suggested values were averaged and used as a baseline for comparing Team Missouri’s selected appliances and other loads. As expressed in Table 1, Data Column 4, new internal gains values for Chameleon House were obtained using the following [Equation (2)]:
Where IGC = Internal Gains for Chameleon House; IGT = Internal Gains for Traditional Construction as suggested by Energy-10; WC = Total Watts/ft2 of Chameleon House; WT = Total Watts/ft2 of Traditional Construction based on typical appliance values.
| Solar house team | Traditional construction | |||||
|---|---|---|---|---|---|---|
| energy.gov [16] | GE website [17] | Ave. Watt/sf. traditional construction | ||||
| Hot water | Watts | Watt/sf. solar house team | Watts | Watts | ||
| Electric back-up for WH 60% of need | 4500 | 4.5 | 5000 | * | 5.1 | |
| SDHW pump 40% of need | 150 | 0.15 | * | * | N/A | |
| Frigidaire dishwasher a | 1400 | 1.4 | 1800 | 1800 | 1.8 | |
| Total “Hot Water” | 6050 | 6.1 | 6.9 | |||
| Other | ||||||
| Kitchen | Frigidaire refrigerator a | 540 | 0.5 | 730 | 188 | 0.46 |
| Frigidaire oven | 3500 | 3.5 | * | 2300 | 2.3 | |
| Frigidaire microwave | 1000 | 1.0 | 930 | 1500 | 1.2 | |
| Frigidaire induction cooktop b | 2000 | 2.0 | * | 1000 | 1.0 | |
| Frigidaire vent hood | 520 | 0.52 | 560 | * | 0.57 | |
| Coffee pot | 800 | 0.81 | * | 1,500 | 1.5 | |
| Toaster | 1000 | 1.0 | 1100 | 1,100 | 1.1 | |
| Living Room | TV | 150 | 0.152 | 140 | 275 (ave.) | 0.21 |
| Stereo | 200 | 0.20 | 240 | 60 | 0.15 | |
| Gaming/Blueray | 230 | 0.23 | 45 | 210 | 0.13 | |
| Lamp | 15 | 0.015 | * | 60 | 0.061 | |
| Computer | 150 | 0.15 | 270 | 270 | 0.27 | |
| Bathroom | Washer a | 1400 | 1.4 | 430 | 430 | 0.43 |
| Dryer | 5500 | 5.6 | 3400 | 3400 | 3.4 | |
| Ceiling fan | 30 | 0.030 | * | 75 | 0.076 | |
| Hair dryer | 1000 | 1.0 | 1500 | 1500 | 1.6 | |
| Curling iron | 100 | 0.10 | * | 90 | 0.091 | |
| Razor | 15 | 0.015 | * | 15 | 0.015 | |
| Bed | Clock/Radio | 10 | 0.010 | 10 | 10 | 0.010 |
| Lamp | 15 | 0.015 | * | 60 | 0.061 | |
| Phone | 5 | 0.005 | * | 4 | 0.004 | |
| about.com [18] | ||||||
| HVAC | Furnace Fan | 370 | 0.38 | * | N/A | |
| UniChiller/Heat pump (also cools) | 3000 | 3.0 | N/A | N/A | ||
| Compact energy recovery ventilator | 100 | 0.11 | N/A | N/A | ||
| Electric heat (back-up unit) | 1500 | 1.5 | 9000 | 9.1 | ||
| Central AC | N/A | N/A | 5000 | 5.1 | ||
| Total “Other” | 23,150 | 23 | 29 | |||
Notes: * Figure not available from this source; a: Energy Star certified appliance; b: average of 4 burners; N/A: not applicable; 990 ft2 was used for all calculations; solarium was subtracted for ease of modeling.
6. Solar PV System
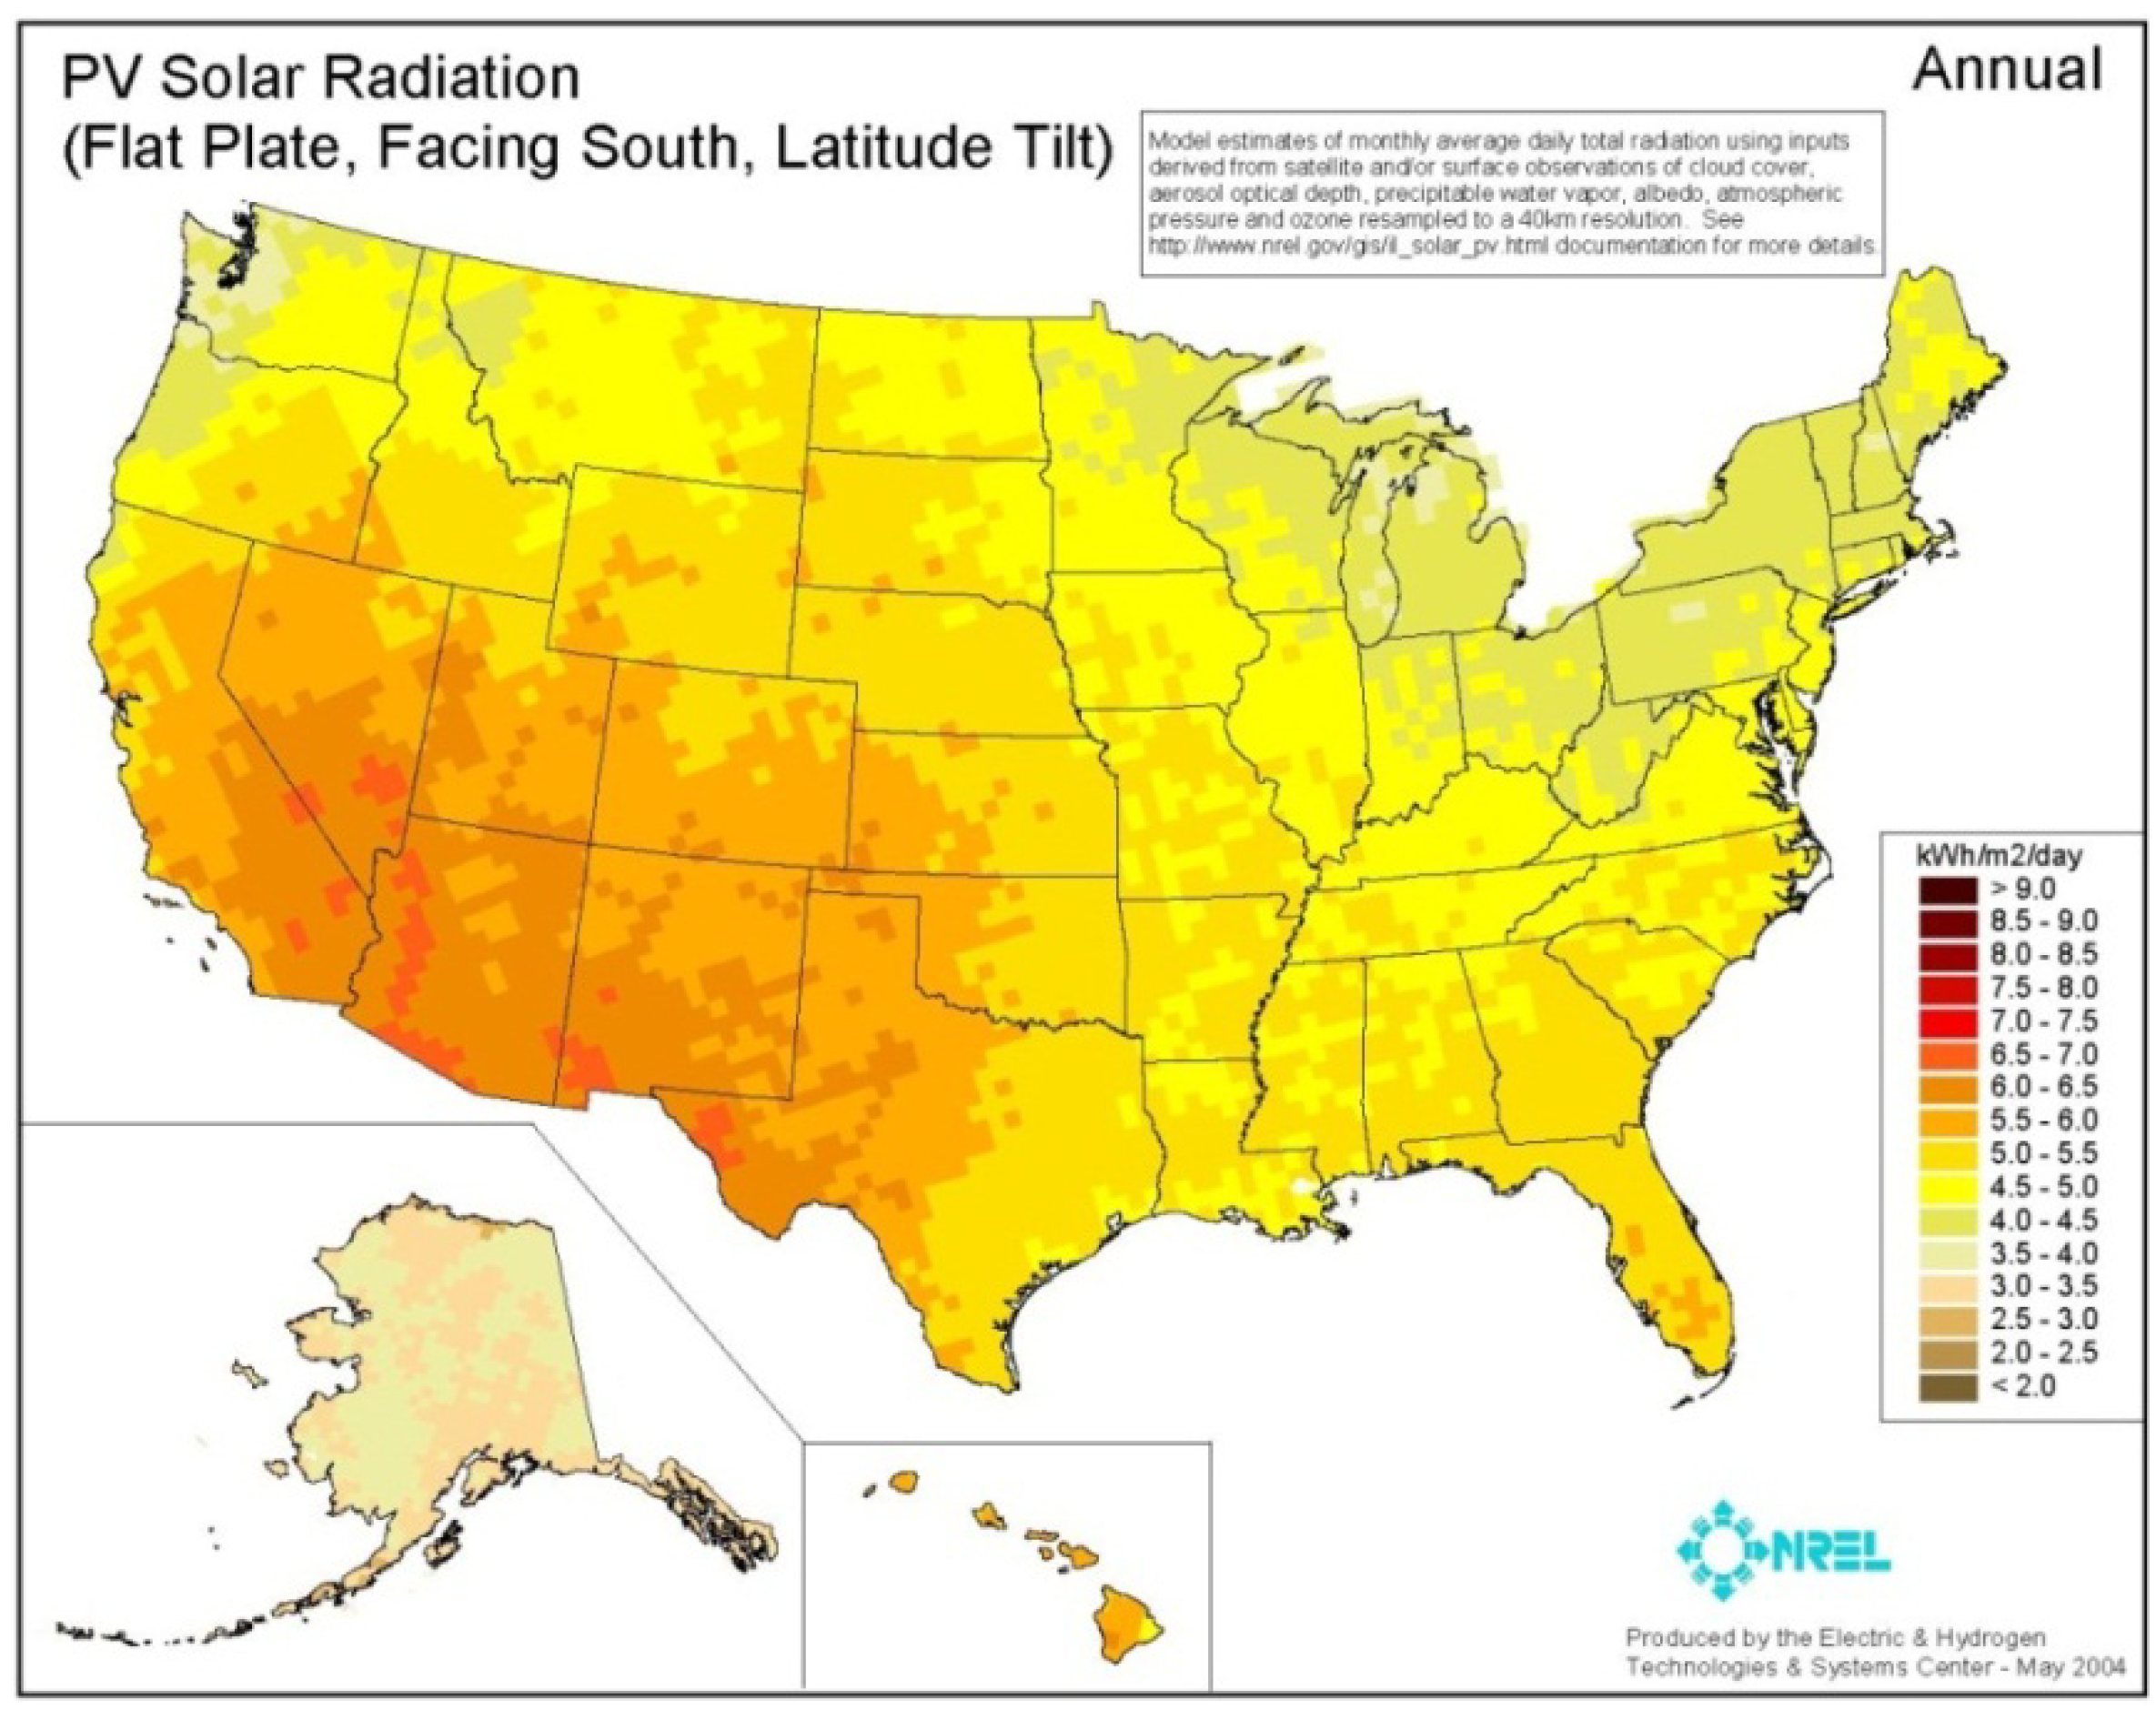
The Traditional Construction home does not incorporate alternative energies, but the Chameleon House has a system of photovoltaic panels located on top of the roof. Because the roof is flat, the panels are tilted upward 38 degrees to catch the optimal amount of sunlight. A stand-alone PV system was modeled in Energy-10 with a system capacity of 9.1 kW and inverter rated capacity of 12 kW.
While the Chameleon House was modeled in the mid-region of the Midwest, the amount of potential sun-hours generally decreases across the continental United States the further North and East a home is located (Figure 1). This affects the amount of potential solar energy that a single family home could produce. According to Figure 1, the amount of sun-hours ranges from as little as 3.5‒4 kWh/m2/day (northern regions) to as much as 6.5‒7 kWh/m2/day (southern regions) [19]. In the case of the Chameleon House, the solar array would have to be sized appropriately based on the hours of potential energy gained.
Figure 1.
Annual PV solar radiation [19].
Figure 1.
Annual PV solar radiation [19].

7. Solar Domestic Hot Water System
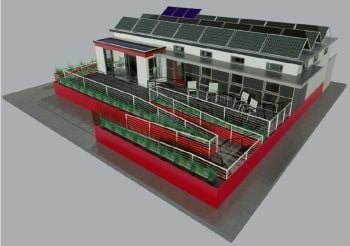
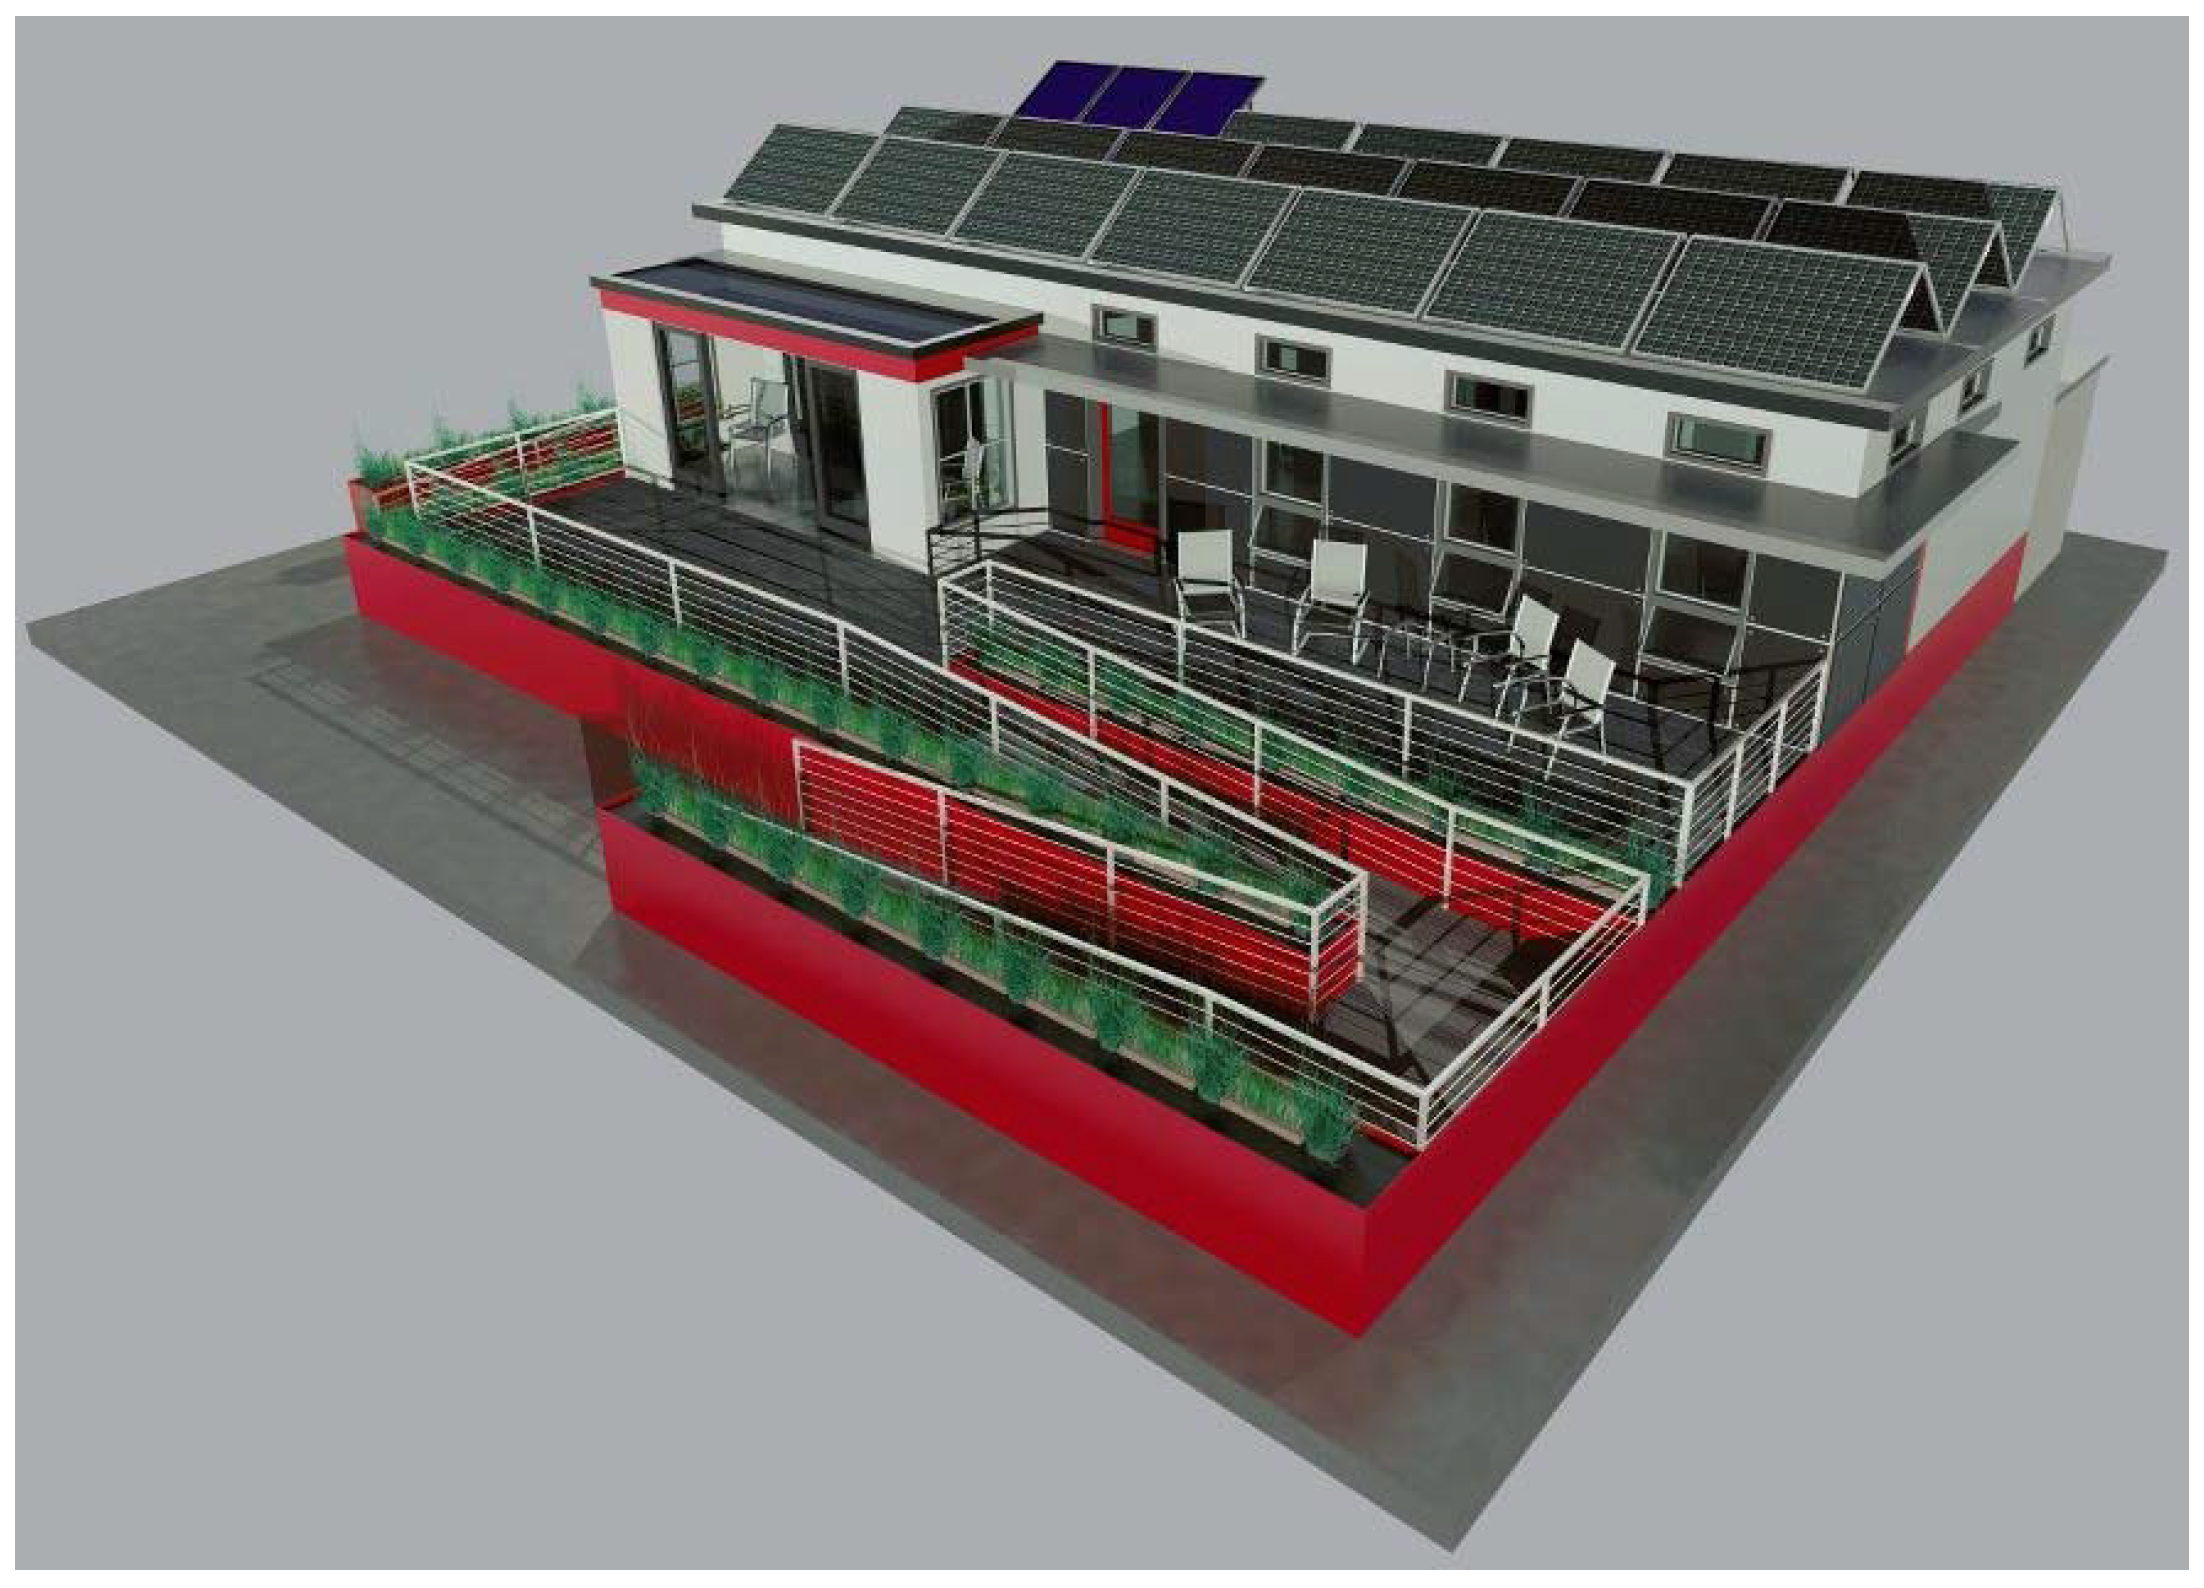
A typical electric hot water tank will provide all domestic hot water needs with the burner on less than two hours a day. If there is no hot water usage, then one or two short bursts per 24 h are effective in maintaining tank temperature [20]. The Solar House Team first considered using an instantaneous electric water heater in conjunction with the solar domestic hot water system (SDHW), but decided against it because of the high amounts of energy involved in “flash heating” the water. Instead, the team chose a combined 110 gal hot water tank which contains an internal heat exchanger that circulates the solar-heated water in addition to an electric back-up. Figure 2 shows the three collector panels for this system are located at the back corner of the roof. The total wattage of the water heater is 4500 W, yet under sunny conditions the maximum wattage required is 150 W. This is based on the usage of a pump to circulate water between the solar panels and the water tank. When modeling this system in Energy-10, a typical week is represented, and then extrapolated for an entire year. This prevents the engineer or architect from highlighting the energy-saving advantages of relying almost entirely on only the SDHW system during the summer months. To compensate for this, it was assumed that throughout a typical year, the SDHW system was able to provide 40% of hot water needs and the electric backup was responsible for providing the remaining 60%, on average.
Figure 2.
Exterior rendering of the Chameleon House.

8. Heating/Cooling Systems
Energy-10 only allows a few options for modeling the type of heating/cooling system. Because an exact system matching the operations and energy consumption was not available, a similar system was selected. As a result, an “Electric Furnace with Direct Expansion Compressor for cooling” was selected for the Chameleon House. In reality, the primary heating systems for this solar house include a heat pump and radiant in-floor heat. The heat pump both heats and cools the space, so there is no need for a separate air-conditioning unit. However, when the outdoor temperature drops below 32 °F, heat pumps become inefficient and should no longer be used [21]. At this point, a supplemental electric heat system will be used to provide adequate heating. The Chameleon House also utilizes a compact energy recovery ventilator located in the air ducts which allows for preliminary heating/cooling by recycling hot/cold exhaust air. Note that in Table 2 under the Mechanical section, “Furnace Fan” denotes indoor fans and ducts, whereas UniChiller refers to outdoor fans and ducts which are actually part of the heat pump. Because Energy-10 extrapolates the energy-usage schedule of a typical week to a 1 year period, differences in the usage of separate systems in their corresponding seasons was modeled by making a few assumptions when creating the “typical week” of the fictional inhabitants. It was anticipated that 80% of the heating needs can be met by the heat pump and radiant in-floor system, while the other 20% comes from the back-up electric furnace.
9. Energy Use Profile
A fictional American couple was created in order to determine an energy usage schedule on a weekly basis. It was assumed that they both work at jobs outside the home Monday through Friday. Also, due to the small size of the home, the couple does not have any children.
For example, during the hour of 9–10 a.m. on the weekend for the “Other” profile, it was estimated which appliances would be on and for how long, and the value for the energy use profile was calculated according to the following Equation (3):
The following appliance wattages were summed after being multiplied by the fraction of the hour that they would actually be drawing energy: HVAC system, clock, television, refrigerator, computer, fan, hair dryer, and clothes washer. This total was then divided by the total wattage of all the appliances in the “Other” category (Table 2). This yielded a value of 0.3, or 30% of the maximum. Thus, a 3 was put into the profile for this time slot (Table 3). This process was repeated for all time slots for both workdays and weekends. A value of “P” represents peak, or maximum capacity—corresponding to 100% of total available wattage being used. The “People” Category is the only one not representing a percentage; instead, the number in that row simply represents the number of people occupying the home at that time.
| Workday | ||||||||||||||||||||||||
| Hour | 1 | 6 | 12 | 18 | 24 | |||||||||||||||||||
| Int. lights | 0 | 0 | 0 | 0 | 0 | 3 | 2 | 0 | 0 | 0 | 0 | 0 | 0 | 0 | 0 | 0 | 2 | 4 | 5 | 5 | 3 | 0 | 0 | 0 |
| Ex. lights | 0 | 0 | 0 | 0 | 0 | 0 | 0 | 0 | 0 | 0 | 0 | 0 | 0 | 0 | 0 | 0 | 0 | 0 | P | P | P | 0 | 0 | 0 |
| People | 2 | 2 | 2 | 2 | 2 | 2 | 2 | 0 | 0 | 0 | 0 | 0 | 0 | 0 | 0 | 0 | 2 | 2 | 2 | 2 | 2 | 2 | 2 | 2 |
| Hot water | 4 | 4 | 4 | 4 | 4 | 4 | 2 | 2 | 2 | 2 | 2 | 2 | 2 | 2 | 2 | 2 | 2 | 2 | P | P | P | P | 6 | 2 |
| Other | 2 | 2 | 2 | 2 | 2 | 2 | 2 | 2 | 2 | 2 | 2 | 2 | 2 | 2 | 2 | 2 | 4 | 2 | 2 | 2 | 2 | 2 | 2 | 2 |
| Weekend | ||||||||||||||||||||||||
| Hour | 1 | 6 | 12 | 18 | 24 | |||||||||||||||||||
| Int. lights | 0 | 0 | 0 | 0 | 0 | 0 | 0 | 1 | 1 | 1 | 2 | 3 | 3 | 2 | 1 | 1 | 1 | 4 | P | P | P | 5 | 3 | 0 |
| Ex. lights | 0 | 0 | 0 | 0 | 0 | 0 | 0 | 0 | 0 | 0 | 0 | 0 | 0 | 0 | 0 | 0 | 0 | 0 | P | P | P | 0 | 0 | 0 |
| People | 2 | 2 | 2 | 2 | 2 | 2 | 2 | 2 | 2 | 2 | 2 | 2 | 2 | 2 | 2 | 2 | 2 | 2 | 4 | 4 | 4 | 4 | 4 | 4 |
| Hot water | 4 | 4 | 4 | 4 | 4 | 4 | 4 | 5 | 6 | 6 | 6 | 6 | 6 | 6 | 6 | 6 | 6 | 5 | 5 | 4 | 4 | 4 | 4 | 4 |
| Other | 2 | 2 | 2 | 2 | 2 | 2 | 2 | 2 | 3 | 4 | 4 | 4 | 2 | 4 | 4 | 4 | 4 | 4 | 2 | 2 | 2 | 2 | 2 | 2 |
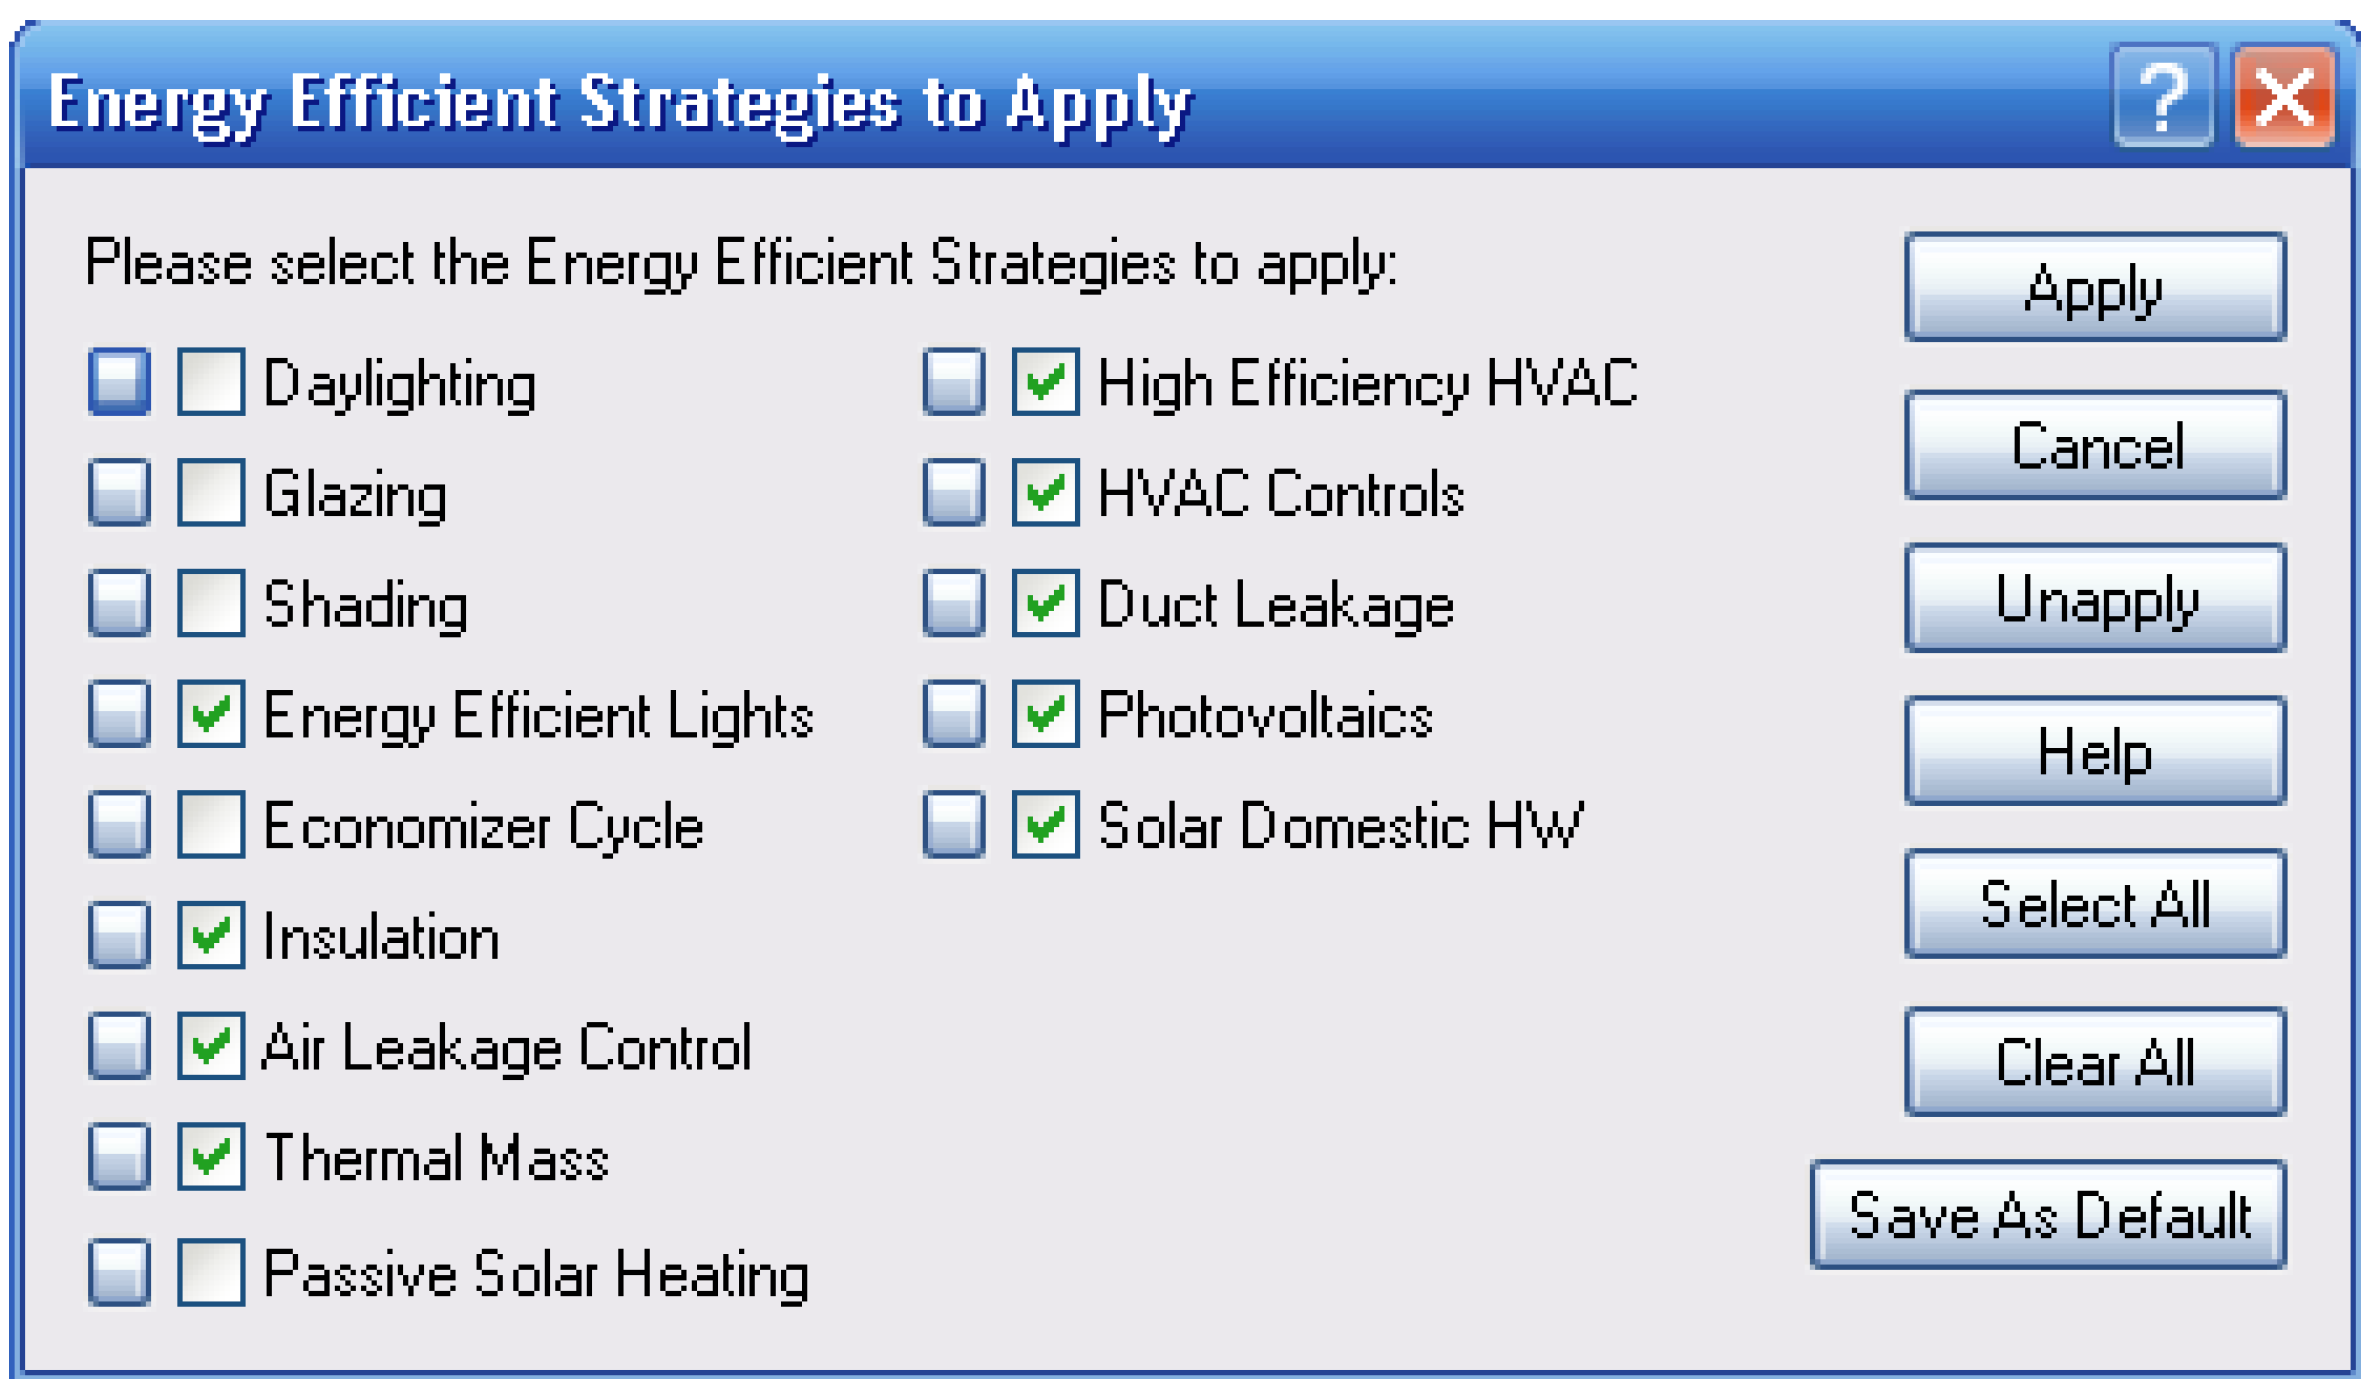
These energy use profiles were used in conjunction with weather data for the closest location of the building—Columbia, MO—to model the energy usage patterns for an entire year. Certain energy-conservation strategies can greatly affect the outcome of this simulation (Figure 3). The Energy-10 program is often utilized by architects and engineers early in the design process to see the potential impact of incorporating these strategies. A fairly accurate projection of energy use can be created by recording a small amount of data. While this particular tool should be implemented prior to a building’s completed design process, this study commenced after most of the design decisions had already been finalized. As a result, some of the design strategies such as daylighting, glazing, shading, and passive solar heating were not checked in the Energy Efficient Strategies dialog box (Figure 3) because they had already been implemented in the design of the Chameleon House and had been specified elsewhere in the program.
Figure 3.
Energy efficient strategies dialog box.
10. Results and Discussion
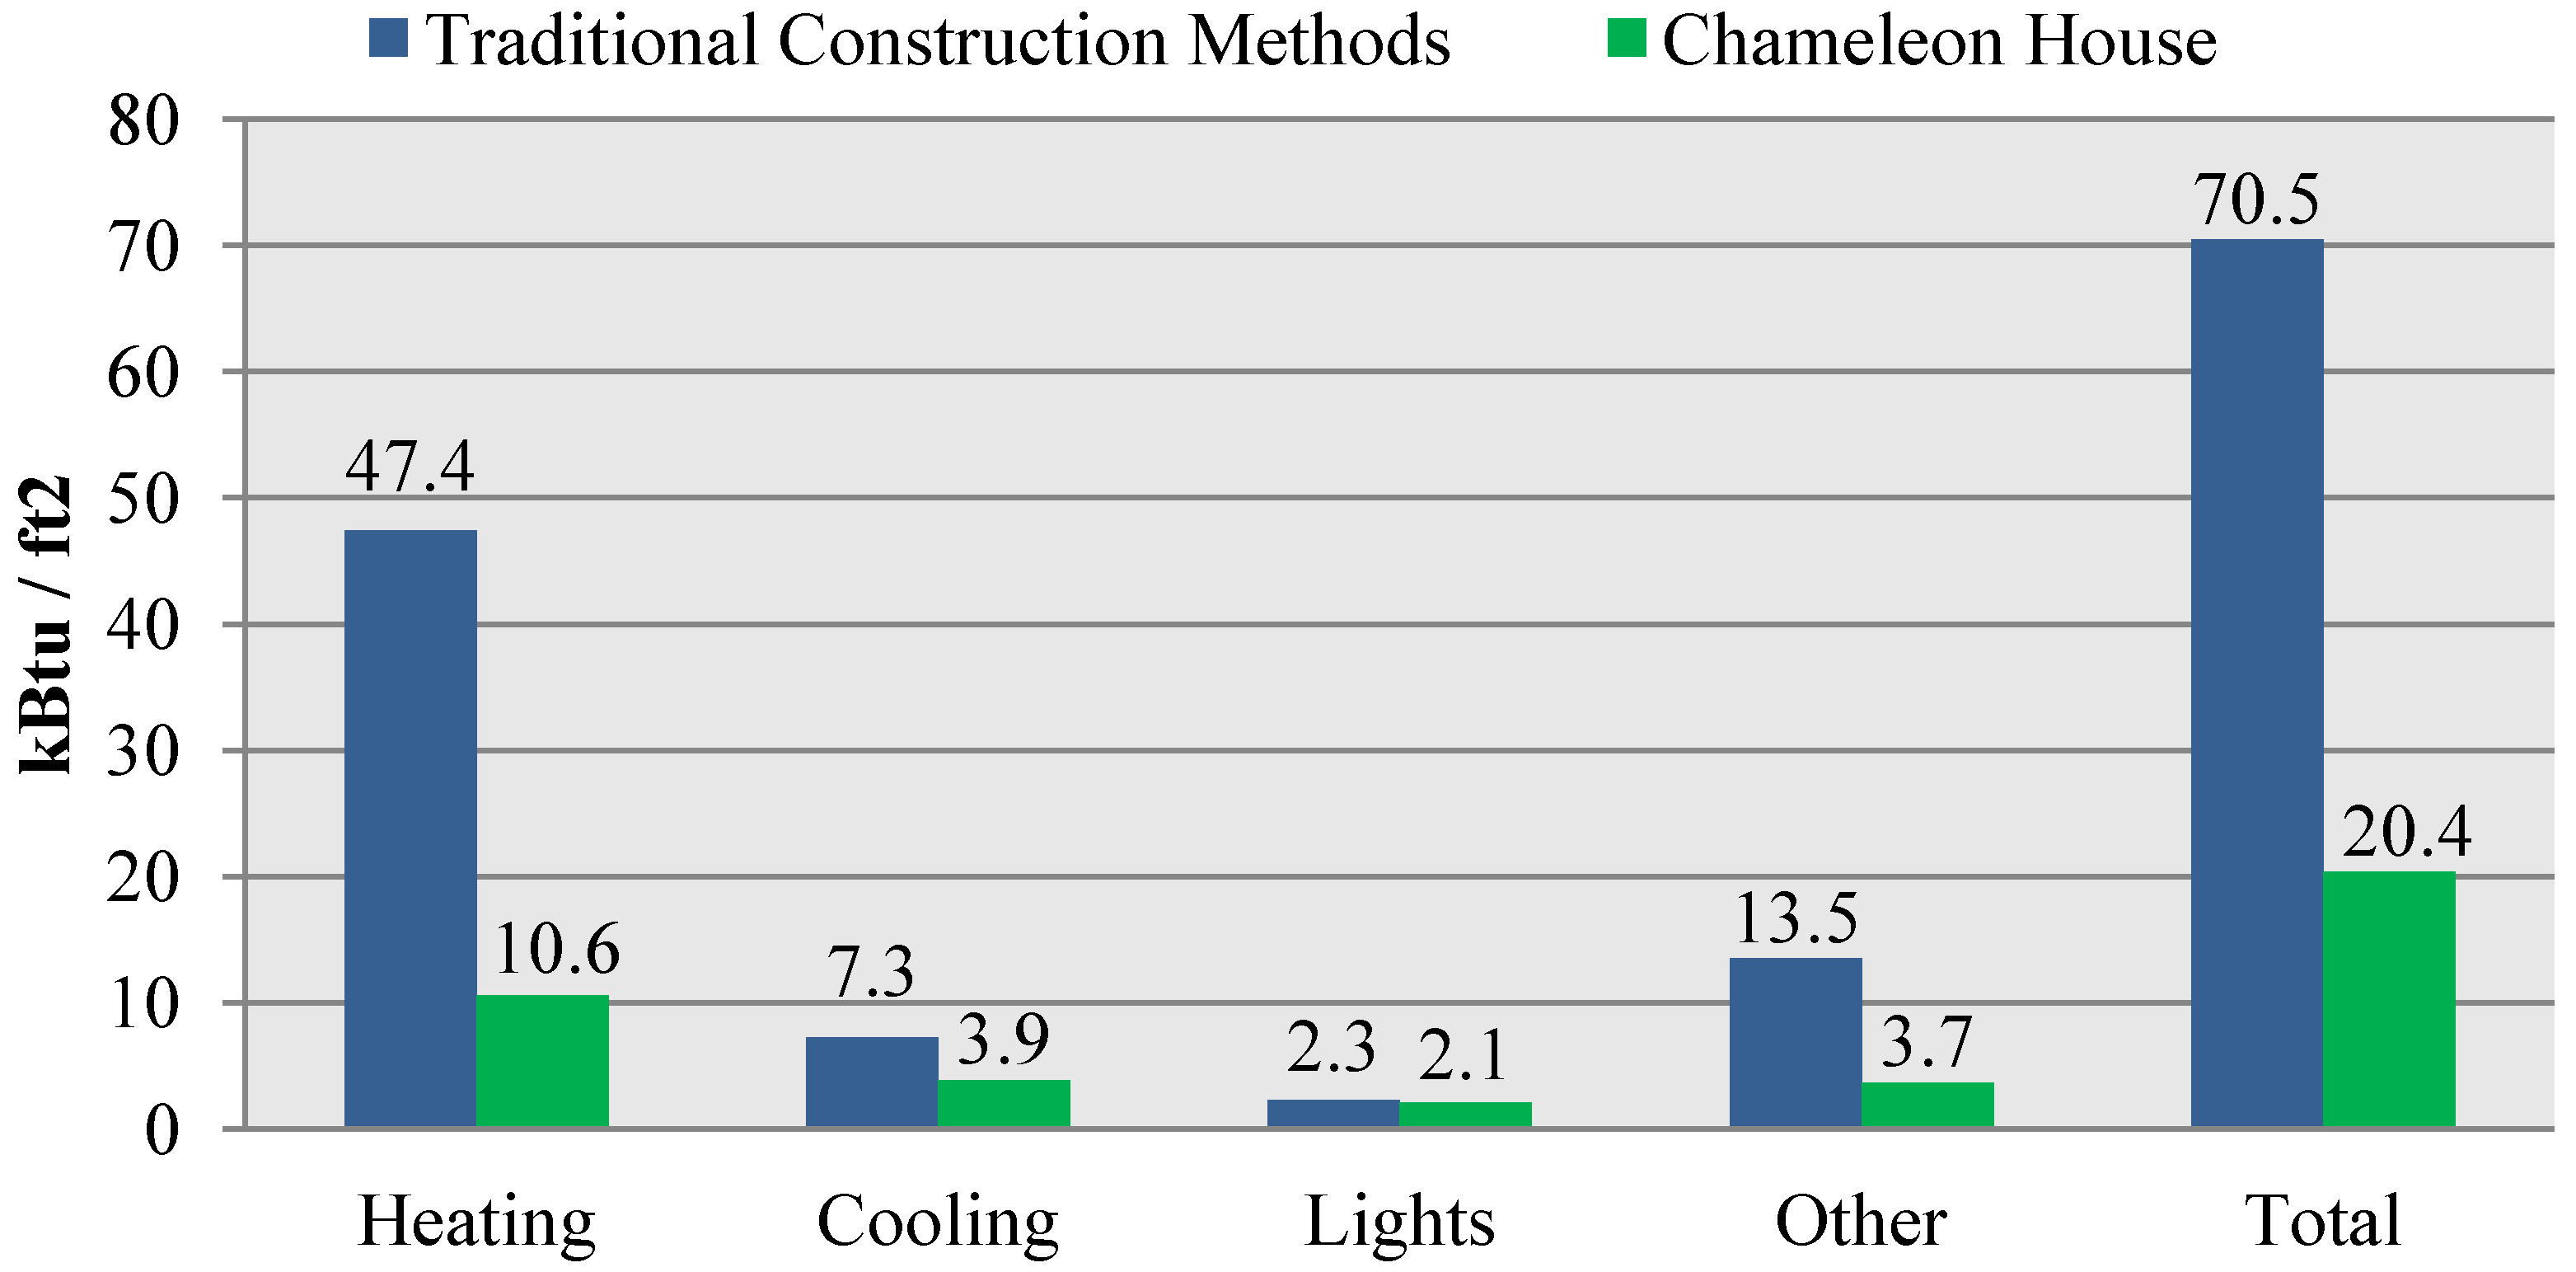
The first simulation ran in Energy-10 compares the home of traditional construction with the Chameleon House model which includes energy conserving strategies such as: energy efficient appliances, lights, and HVAC system; daylighting; low-e windows; thermal mass; air leakage control; insulation; proper HVAC controls; duct leakage; and a solar domestic hot water system. A second simulation was executed which also included the energy production attributed to Chameleon House’s photovoltaic panels. Therefore, the following graphs contain two sets of data. Figure 4, Figure 5, Figure 6 and Figure 7 do not consider the energy consumption offset by having PV panels, while Figure 8, Figure 9, Figure 10 and Figure 11 have PV data included in the Chameleon House calculations.
The annual energy use of the traditional construction is 70.5 kBtu/ft2, while for the Chameleon House it is 20.4 kBtu/ft2 (Figure 4) if no solar panels are considered. This is a 71% annual energy savings. We will later see that adding the PV production data further widens this gap.
Figure 4.
Annual energy use—Not accounting for PV offsets.

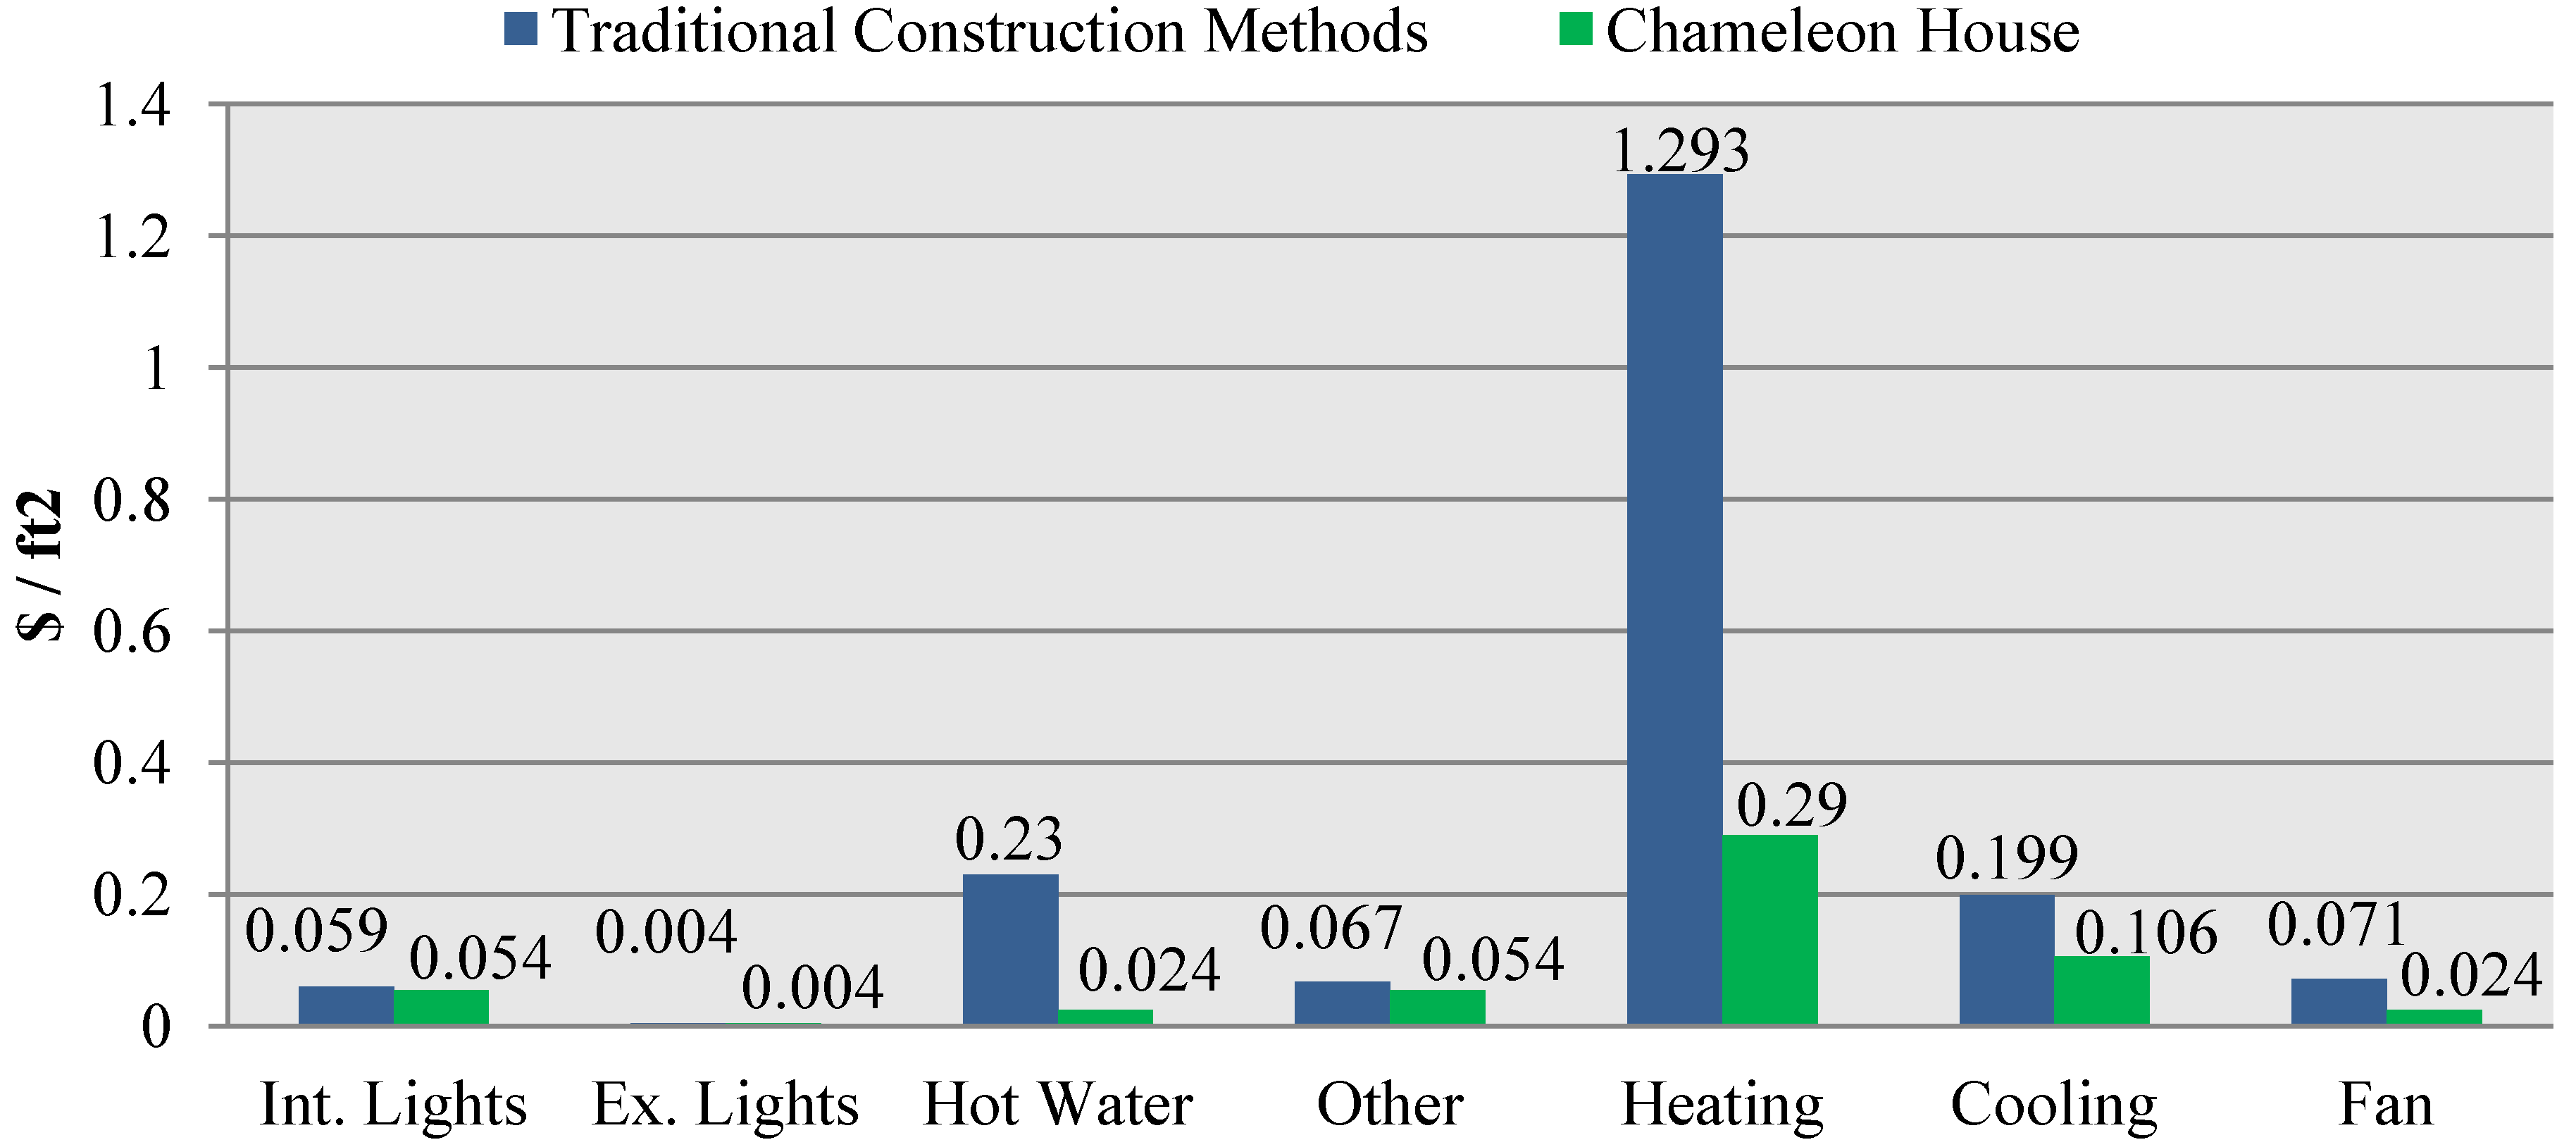
The cost breakdown (Figure 5) reveals that the heating cost for the traditional home is over four times that of the Chameleon House. Higher initial costs of constructing an energy efficient home are offset by savings on utility bills. In addition, using extra insulation or better window glazing will reduce capacity needed for HVAC, and the system can be downgraded. Also note that the “Other” category in Figure 5 is almost as high for the Chameleon House as it is for a traditional construction because the offsets from the solar panels are not included in this set of data.
Figure 5.
Annual cost breakdown—Not accounting for PV offsets.

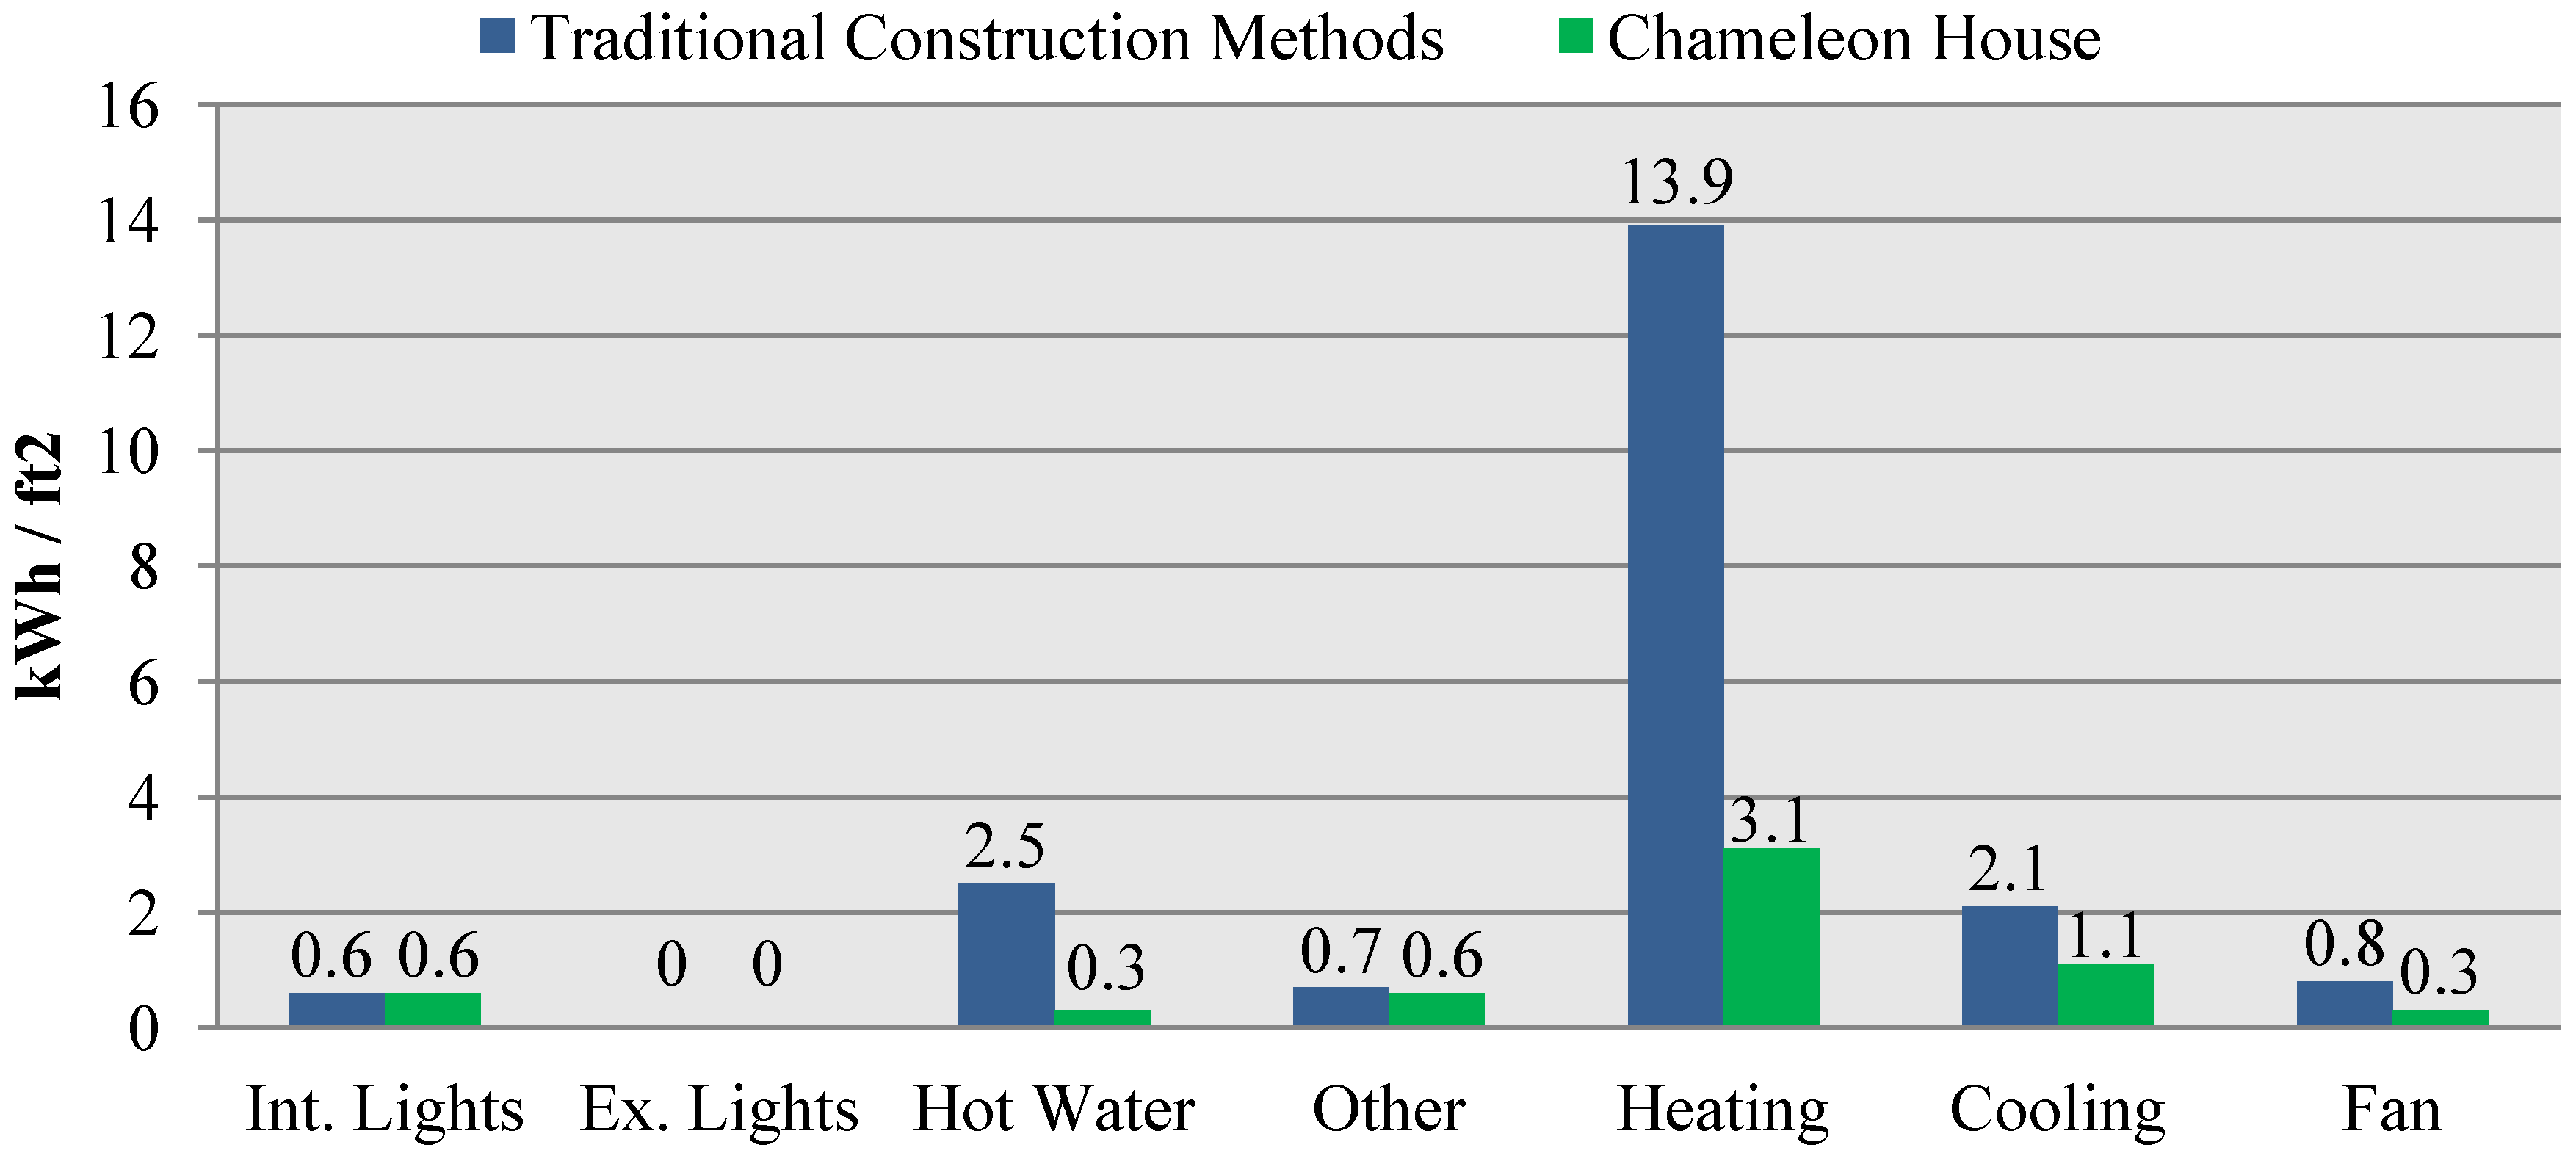
When the annual electric use breakdown is investigated, it appears that the electricity use attributed to external lights on both homes appears to be zero (Figure 6). This is due to the use of only two significant figures being carried. The external lights contributed such a minute amount to the electricity consumption that their values were rounded down. The real value is less than 0.05 kWh/ft2. From this graph we can also see the drastic reduction in electricity required for heating water when a solar domestic hot water system is installed. An 88% savings in this category can be realized by the Chameleon House.
Figure 6.
Annual electric use breakdown—Not accounting for PV offsets.

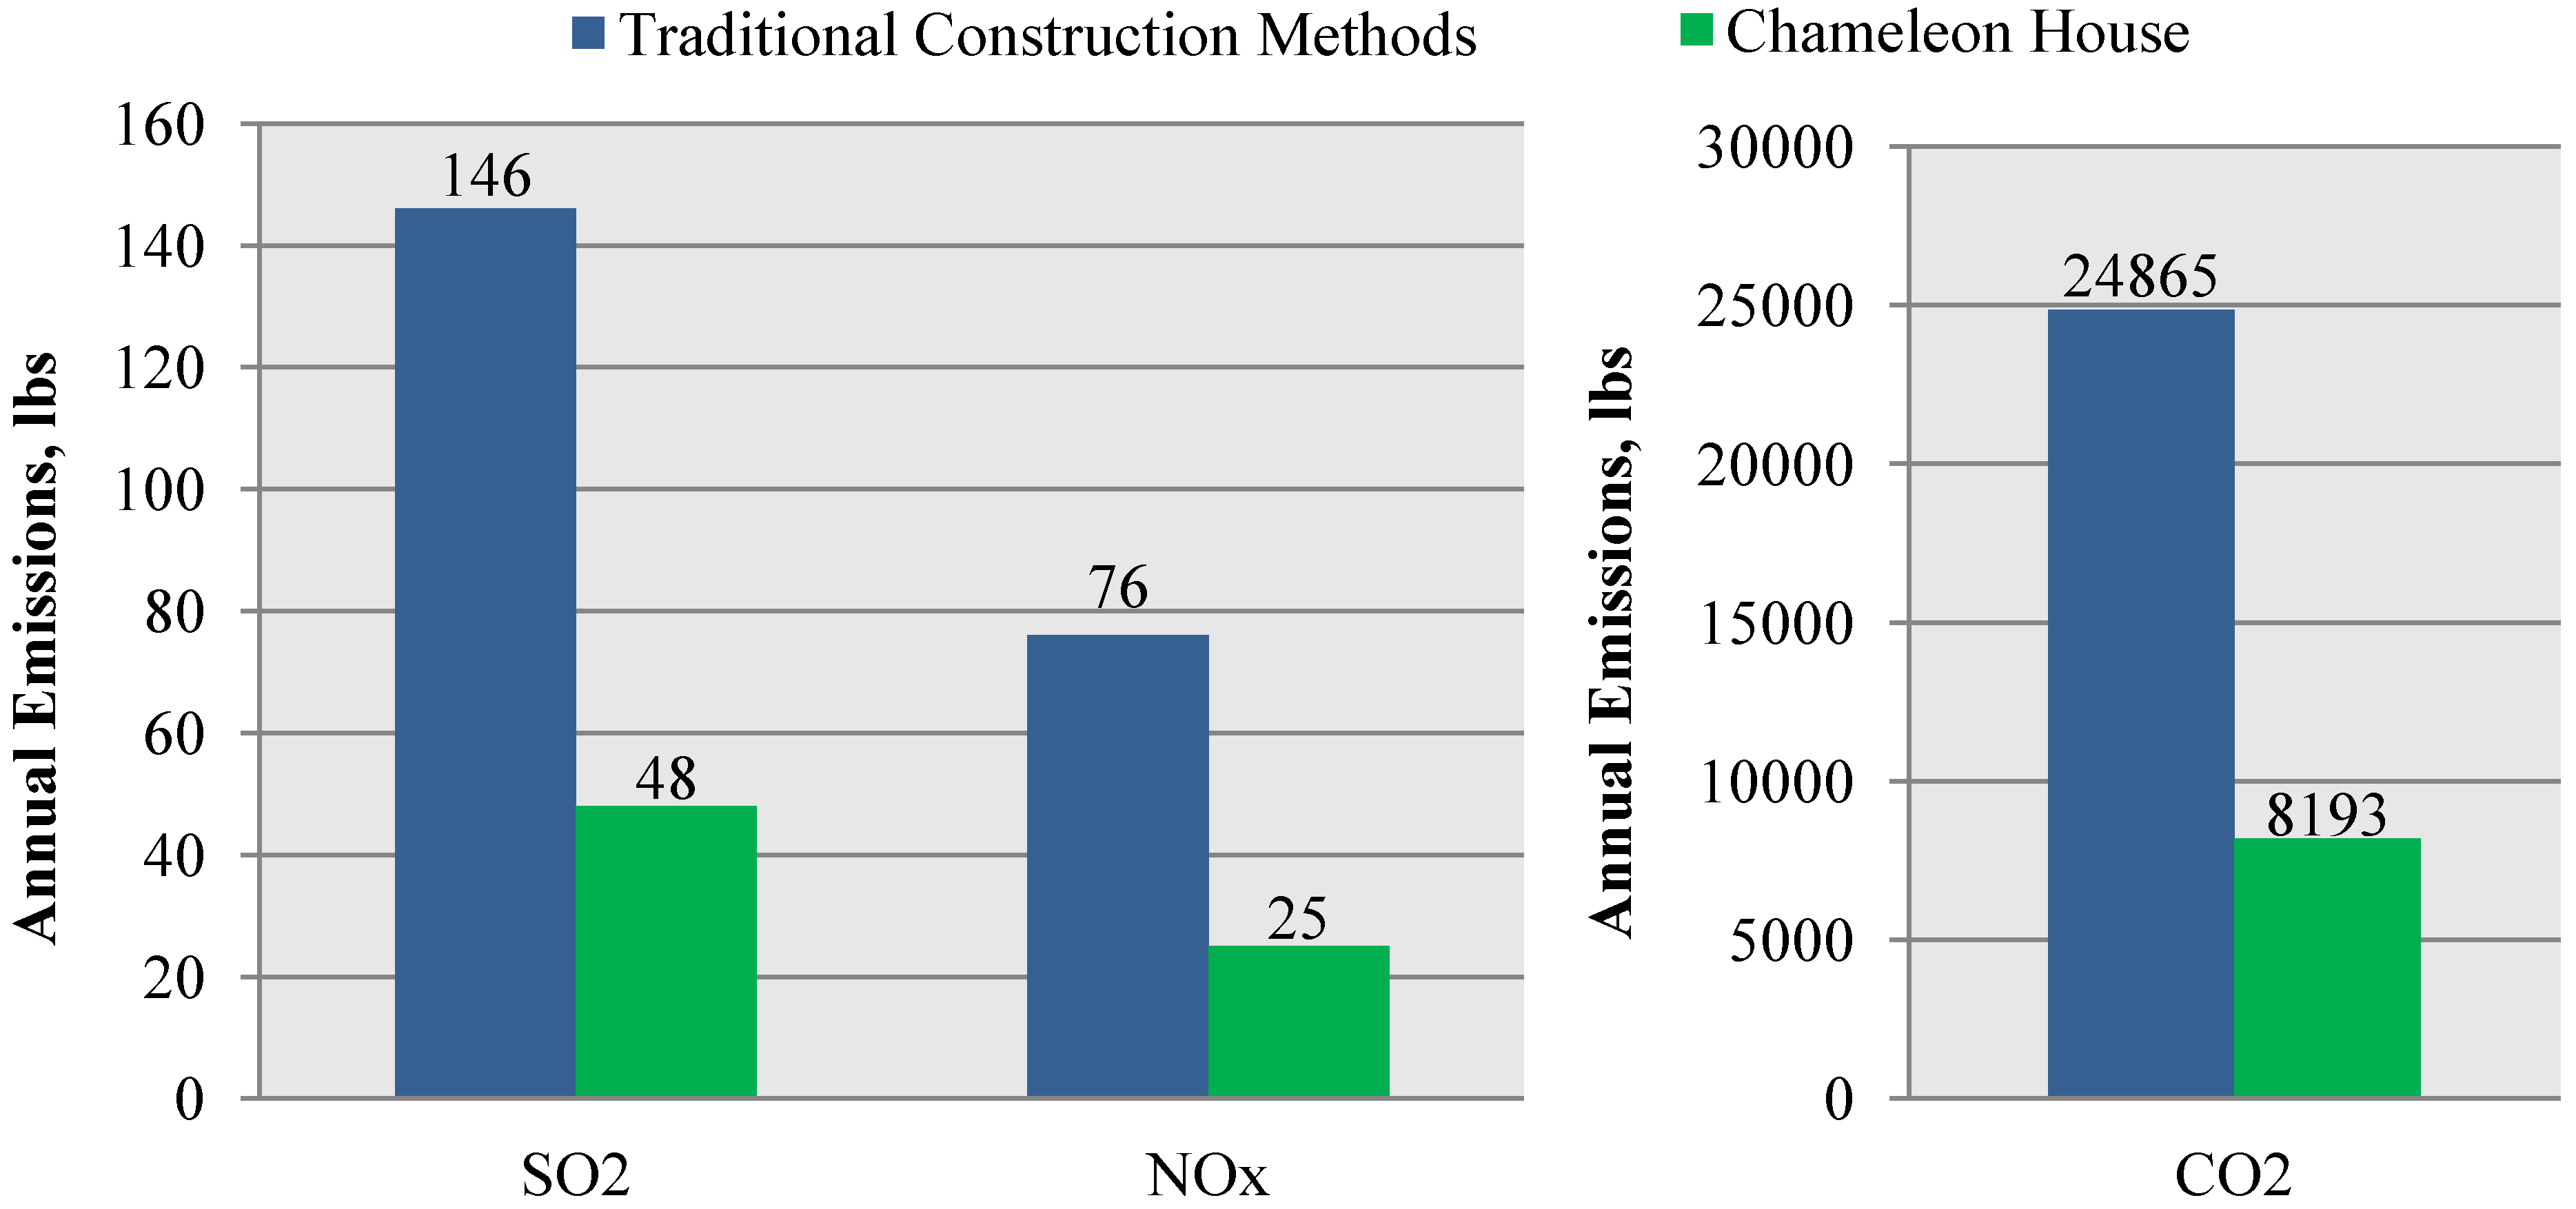
Figure 7 is a comparison of the levels of sulfur-dioxide, nitrogen-oxides, and carbon-dioxide emissions associated with the amount of electricity consumed by each home (not including PV offsets). These include emissions by coal-fired power plants in the production of such electricity. Note that emissions for the Chameleon House are not applicable when PV offsets are included because the total energy consumption is negative—a net production of electricity by means of the sun, a “green” power source.
Figure 7.
Annual emissions results—Not accounting for PV Offsets.
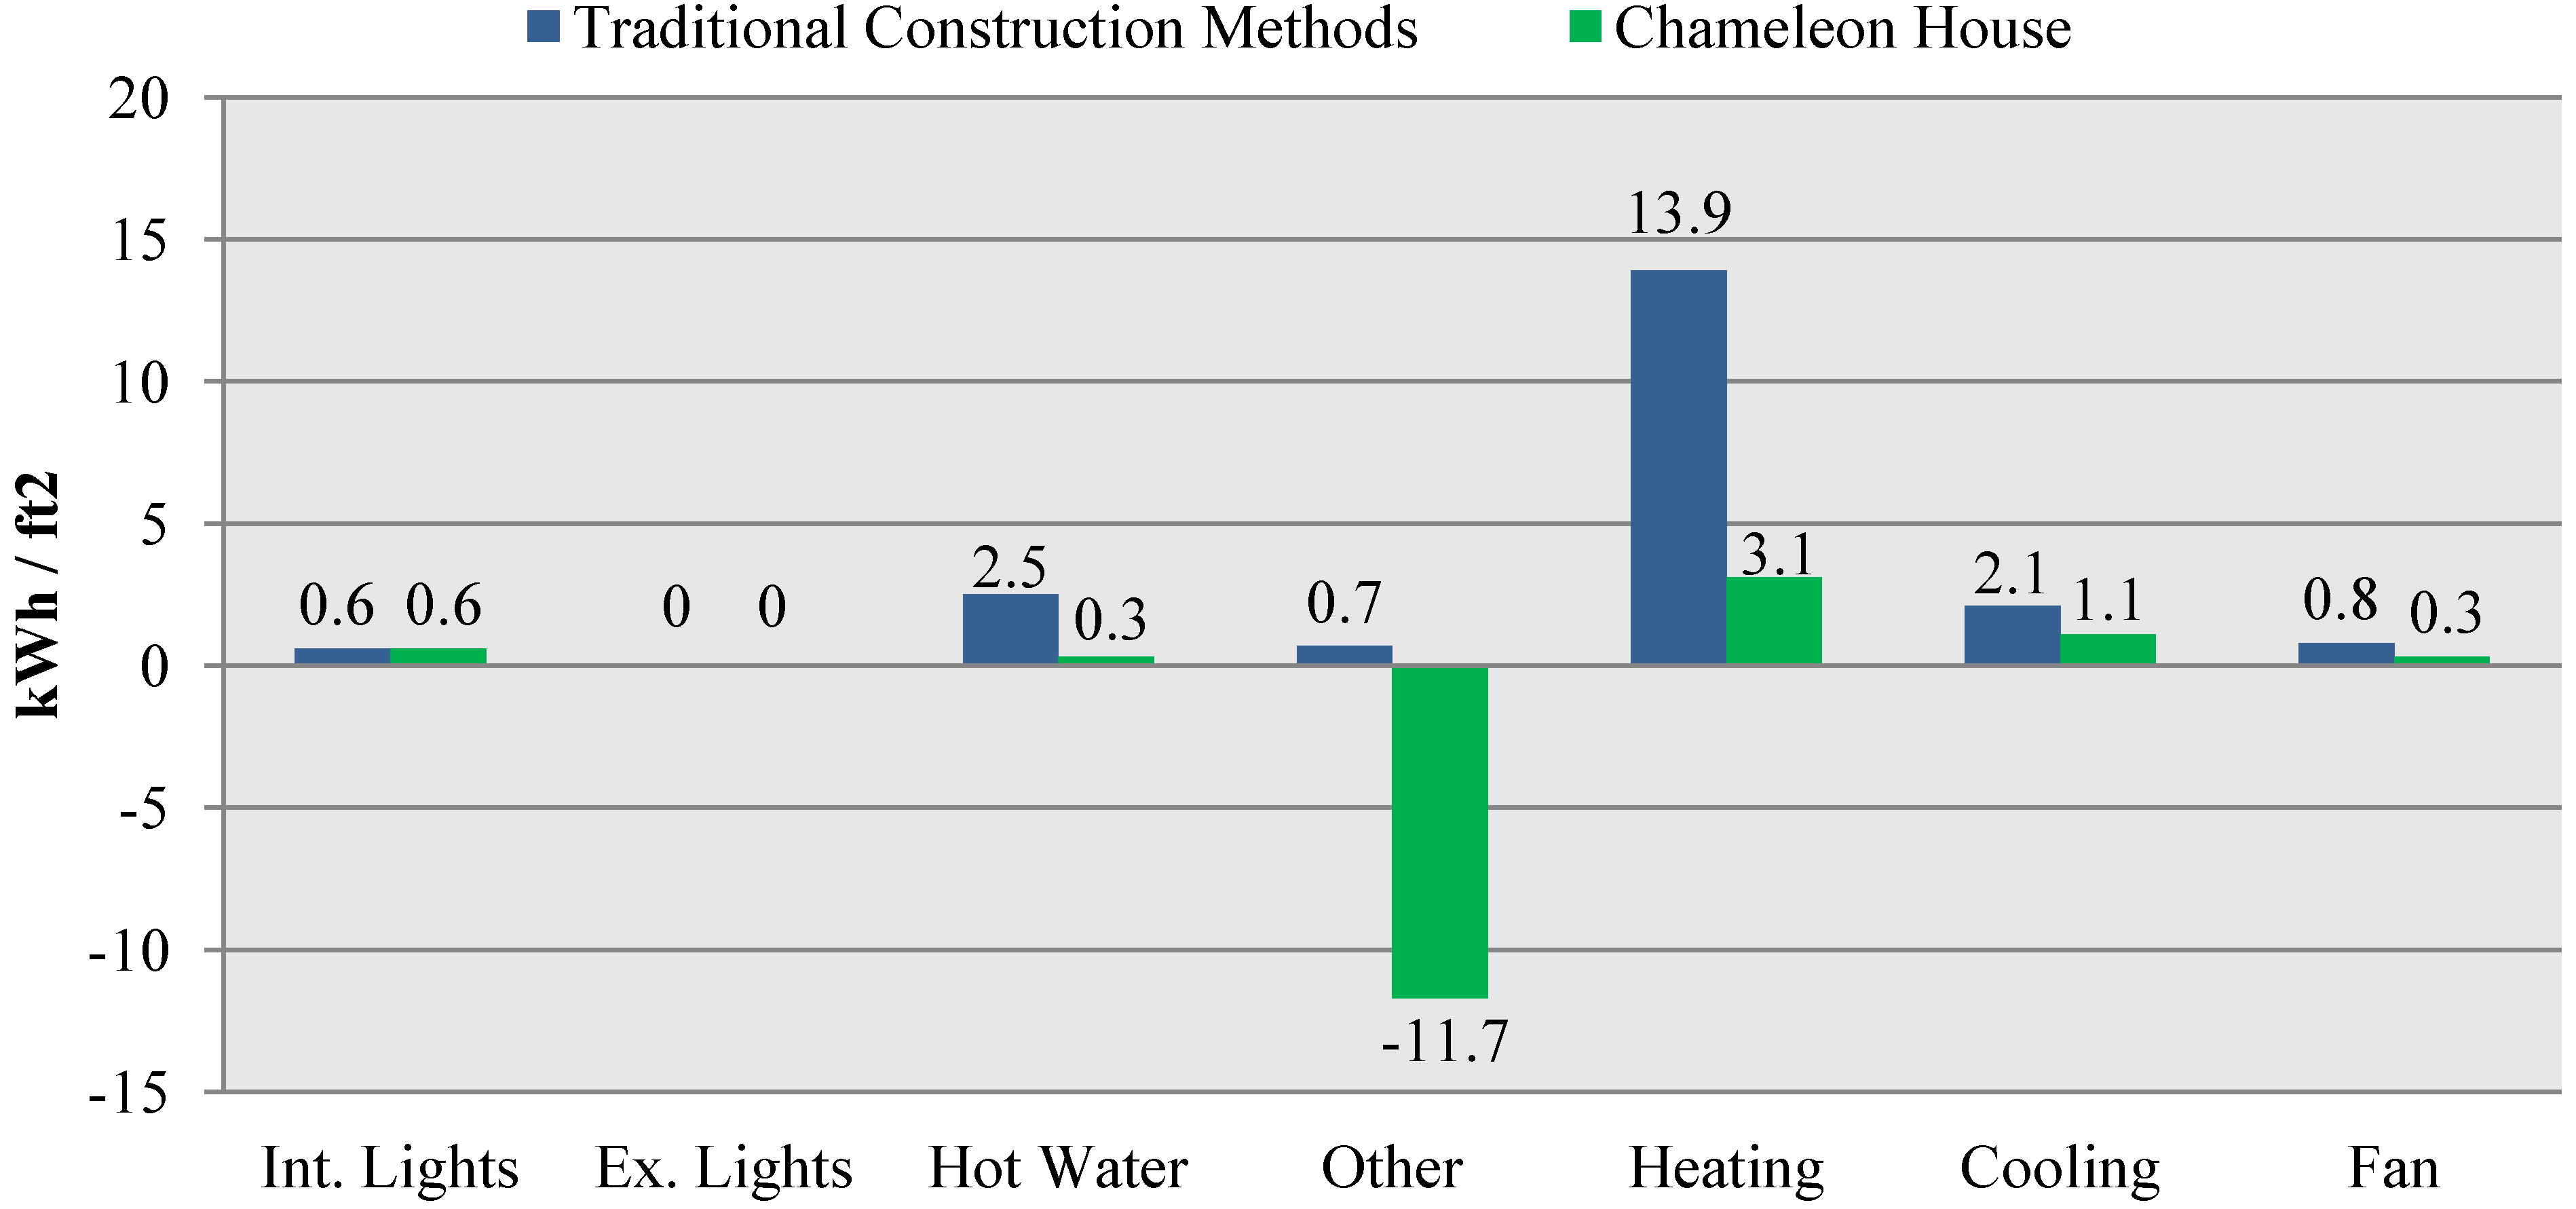
The solar panels belong to the “Other” category; thus, their production of electricity counteracts the use of energy from all appliances and plug loads. This causes the “Other” category to appear negative for the Chameleon House in Figure 8. In fact, the solar panel production outweighs the energy consumed from all categories combined. This leads to a net energy surplus by the Chameleon House—as seen in the last column of data. This will not be true for each day of operation. Cloudy days hinder electricity production and could cause a net consumption of electricity. Also, a spike in electricity use, possibly caused by more than two people occupying the Chameleon House at any one time, could prevent the solar panels from being able to offset consumption. Even so, the Energy-10 simulation predicts that as an average throughout the entire year, a home of Traditional Construction will consume energy in an amount that is over three times that which Chameleon House’s PV panels will produce in excess. Or, when we combine the results of Figure 4 and Figure 8, we can see that the amount of energy used in the Chameleon house without PV panels (20.4 kBtu/ft2) is very close to the amount of surplus energy produced after PV panels are installed (21.4 kBtu/ft2).
Figure 9 and Figure 10 present the Annual Cost Breakdown and Annual Electric Use Breakdown, respectively, of the two modeled homes. Again, note that the “Other” columns in these two figures are negative for the Chameleon House due to the solar panel electricity production being factored into this set of data.
Figure 8.
Annual energy use—Including PV offsets.
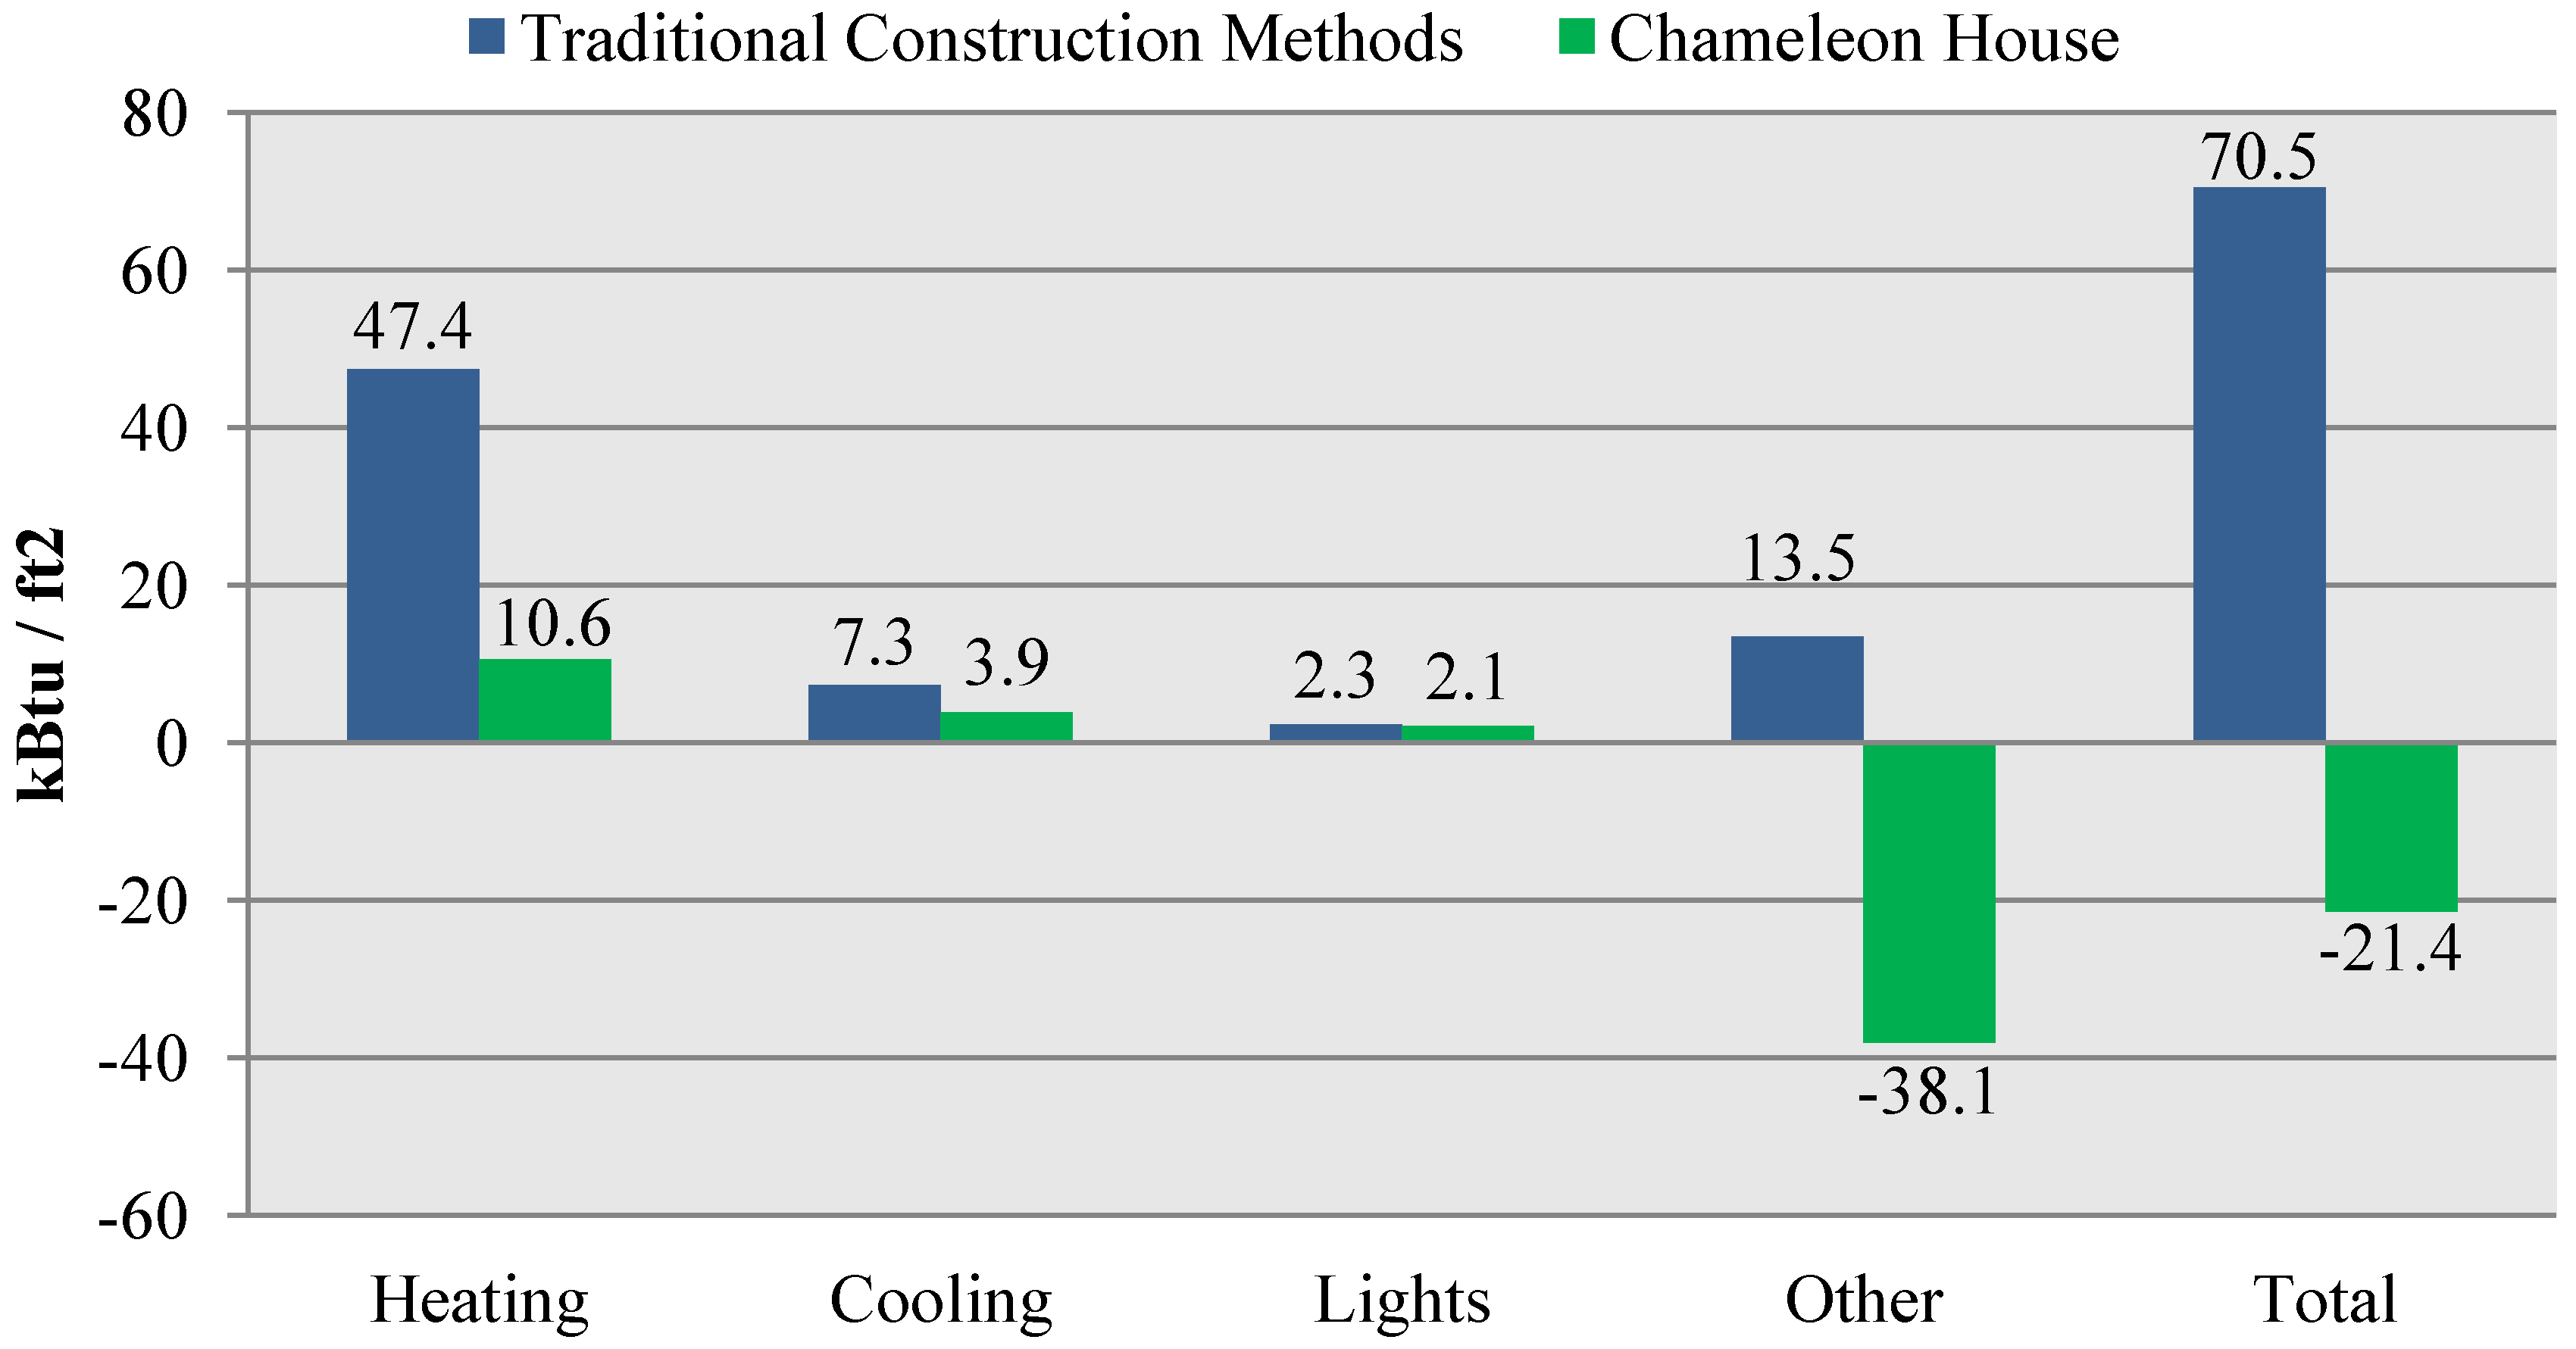
Figure 9.
Annual cost breakdown—Including PV offsets.

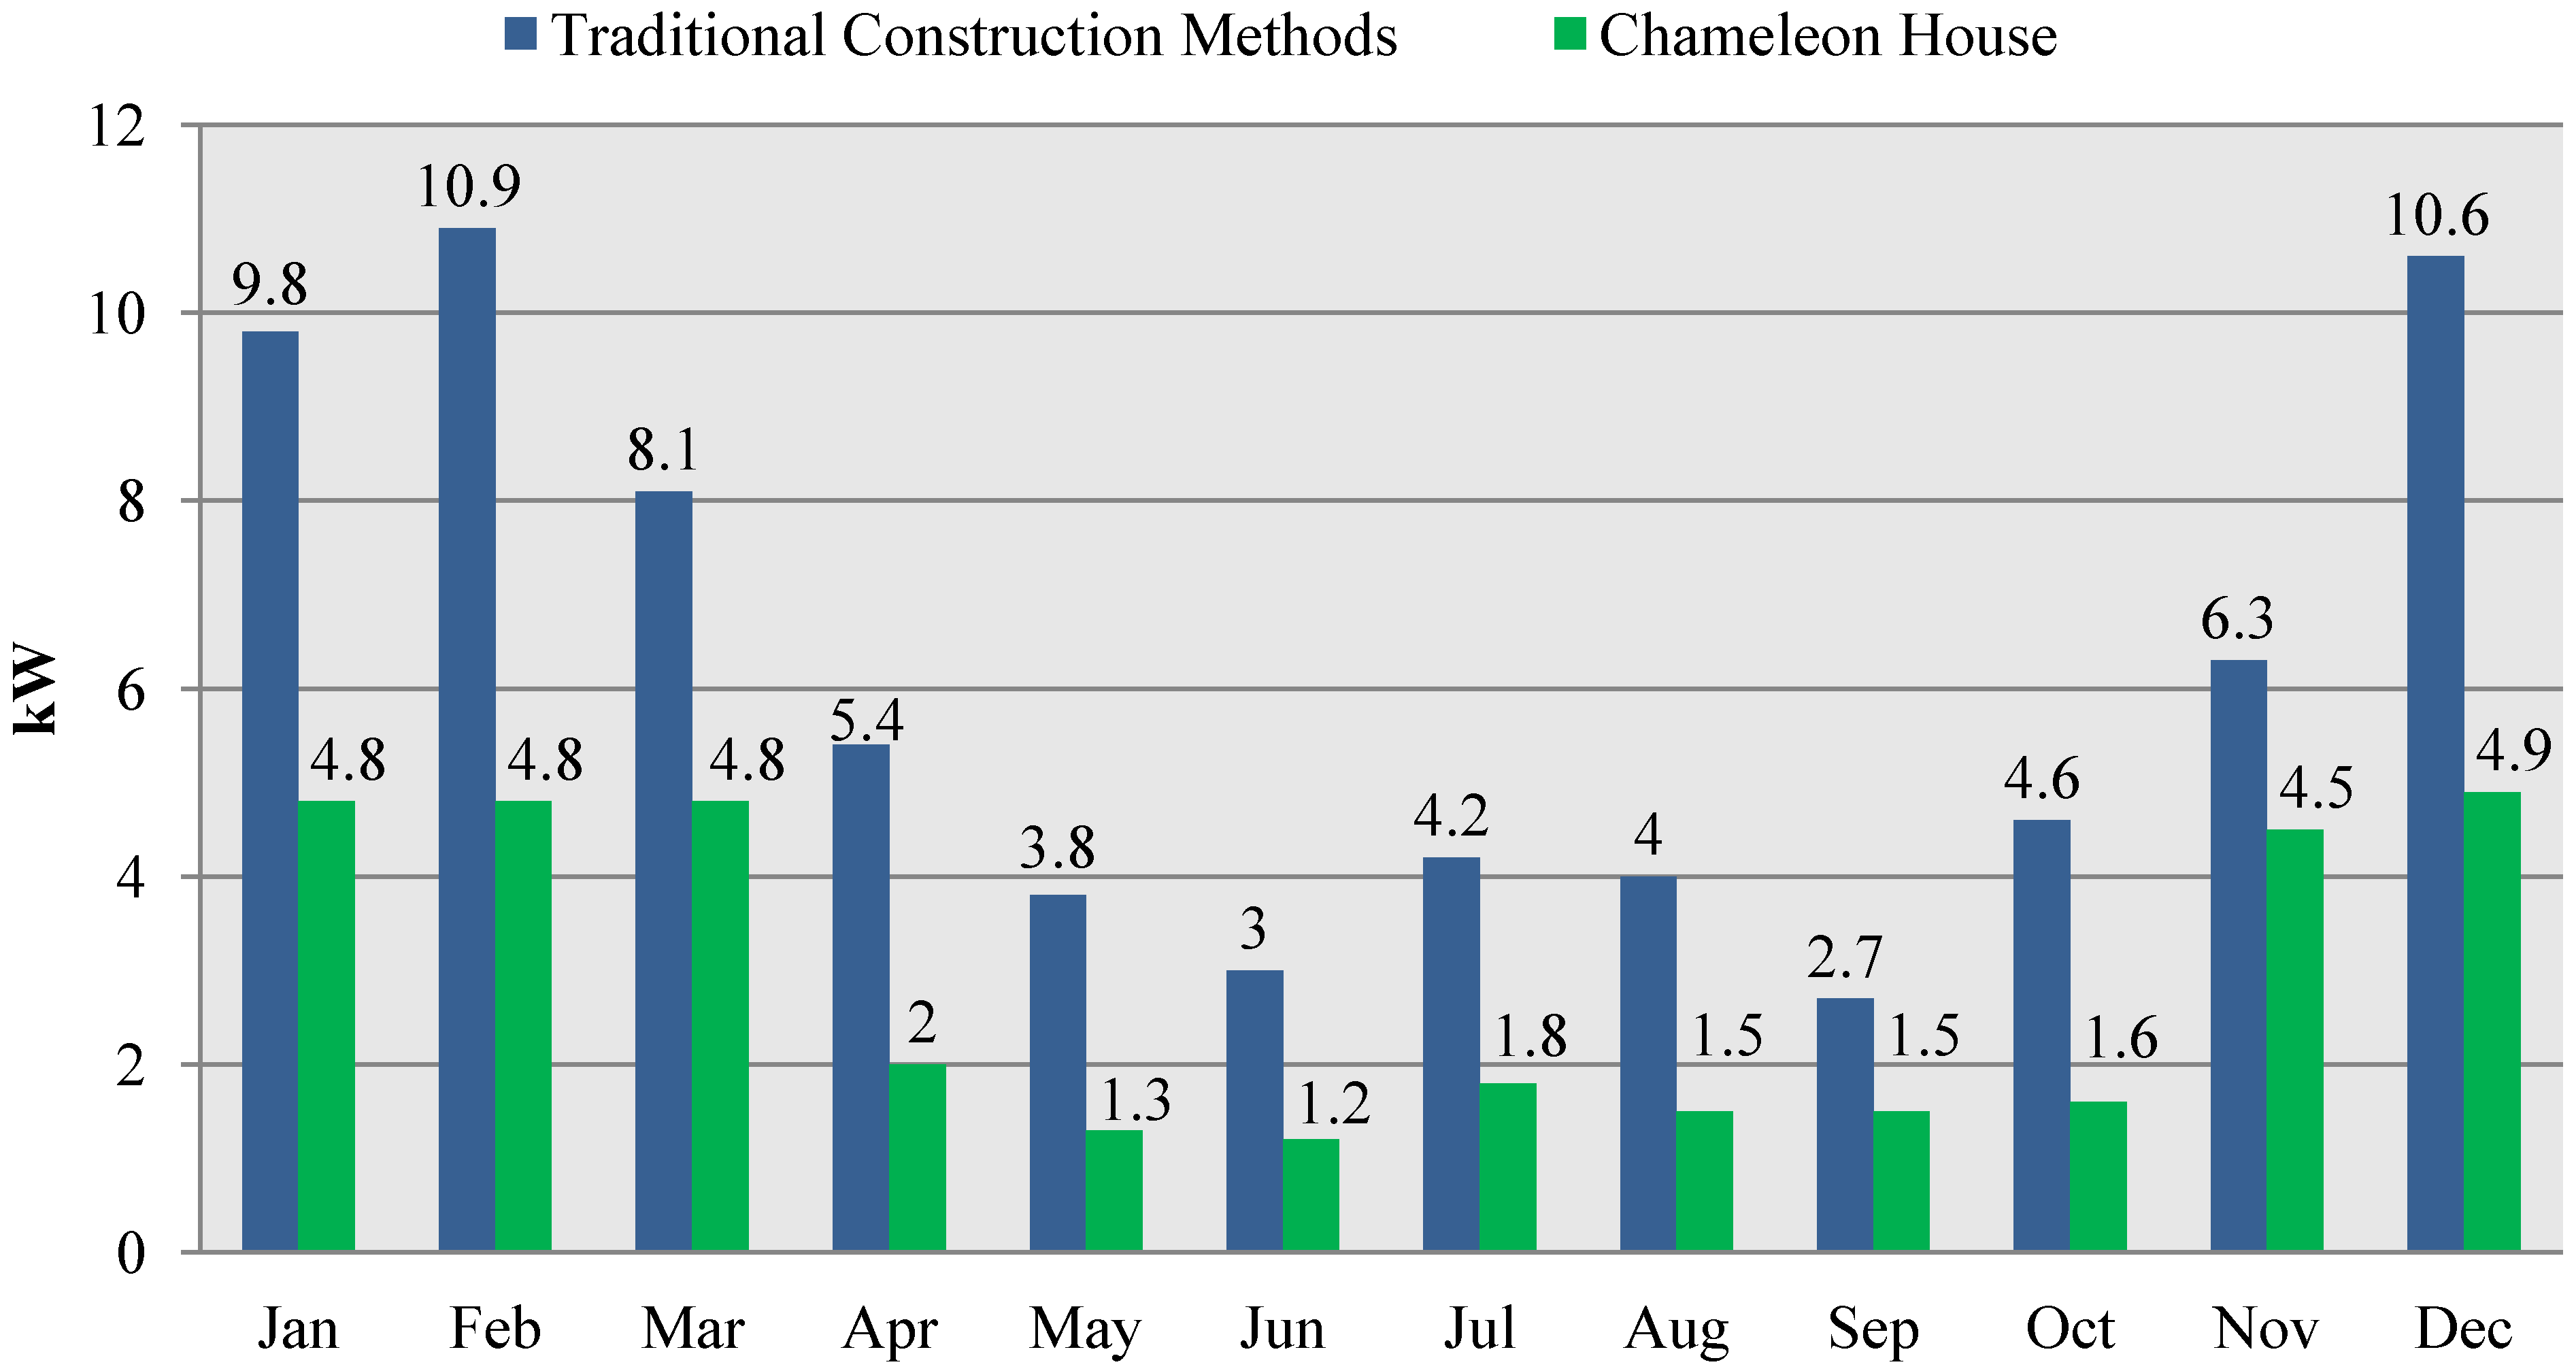
Figure 11 displays the highest consumption of electricity at any one time (data recorded in 15 min intervals) for each month. This would be a significant factor in reducing monthly electric bills in a region with a utility company that charges both a demand rate and a $/kWh rate. Since Rolla Municipal Utilities only charges a $/kWh rate, reducing the monthly demand does not affect the utility bill; only reducing the overall total kWh consumption reduces the bill.
Figure 10.
Annual electric use breakdown—Including PV offsets.

Figure 11.
Monthly electric demand peaks—Including PV offsets.

According to this simulation, the total yearly cost of energy used by lights, heating, cooling, appliances, and other plug loads would be $1,901 per year for the Traditional Construction home. The total yearly surplus of energy in these same categories for the Chameleon House would be $574.
11. Financial Feasibility
Solar-Estimate.org is a website with an intricate online calculator developed for use by contractors and homeowners. The project is supported by several non-profits and government agencies including the California Energy Commission and the U.S. Department of Energy. This tool was created for the purpose of estimating capacity as well as cost of renewable energy systems.
The fictional couple whose energy usage patterns we have modeled in Energy 10 had an annual electricity usage of 20,394 kWh (based on a home of traditional construction). If this couple wished to offset their energy use by 60% through a PV system (without installing any of the other energy-saving equipment previously mentioned), the Solar-Estimate.org calculator predicts that a 9.1 kW PV array will be required [22]. Table 4 lists the basic input factors for this analysis.
| Item | Required data | Input |
|---|---|---|
| 1. | Zip code: | 65401 |
| 2. | Utility: | City of Rolla |
| 3. | Renewable energy system of interest: | Solar electric (PV) |
| 4. | Typical monthly electric bill: | $158 |
| 5. | Annual electricity use: | 20,394 kWh |
| 6. | Price installed: | $5.33/W DC |
| 7. | Percentage of electrical demand provided: | 60% |
| 8. | Electric rate: | $0.093/kWh |
| 9. | Monthly electric usage: | 1,700 kWh/Month |
| 10. | Utility annual inflation rate: | 3.78% |
| 11. | Utility savings method: | Net metering |
| 12. | Utility savings calculated as: | Pre-tax dollars (Gross income) |
| 13. | Federal ITC based upon: | Gross cost |
| 14. | Federal income tax rate: | 28% |
| 15. | State income tax rate: | 5.60% |
| 16. | Loan modeling; borrow: | 80% of est. net cost of PV system |
| 17. | Loan interest rate: | 6.5% (apr) |
| 18. | Loan duration: | 20 years |
Note that 9.1 kW is the same size system designed for the Chameleon house, yet in that case not 60%, but 130% of the annual electricity demand is covered. This equates to all electricity needs being fulfilled for the Chameleon House, with 30% additional power being sold back to the utility company. The vast difference in supplied percentage of electricity comes from the added benefit of implementing certain methods and equipment into the Chameleon House such as: energy efficient lights, extra insulation, air leakage control, low-e windows, thermal mass, HVAC controls, high efficiency HVAC, duct leakage control, and a solar domestic hot water system. This example highlights the importance of including energy-saving methods and equipment early in the design process. It is better to eliminate energy demand in the first place so it does not have to be offset after the fact.
According to the calculator, a PV system of this capacity is able to produce 12,245 kWh of electricity annually. The assumed installation gross cost is $48,130 and when the 30% federal tax credit is applied, this brings the net cost to the homeowner down to $33,691. If the homeowner was able to pay for 20% of the system at the time of installation, and take out a loan for the other 80% with 6.5% interest (apr), the monthly payments would be $201. This is higher than the $158 that the homeowner would typically spend on their monthly utility bill. Yet, when factors such as inflation, rising utility costs, and positive tax effects are included, the cash inflows will eventually overtake the outflows (see Figure 12).
Figure 12.
Cumulative cash flow.
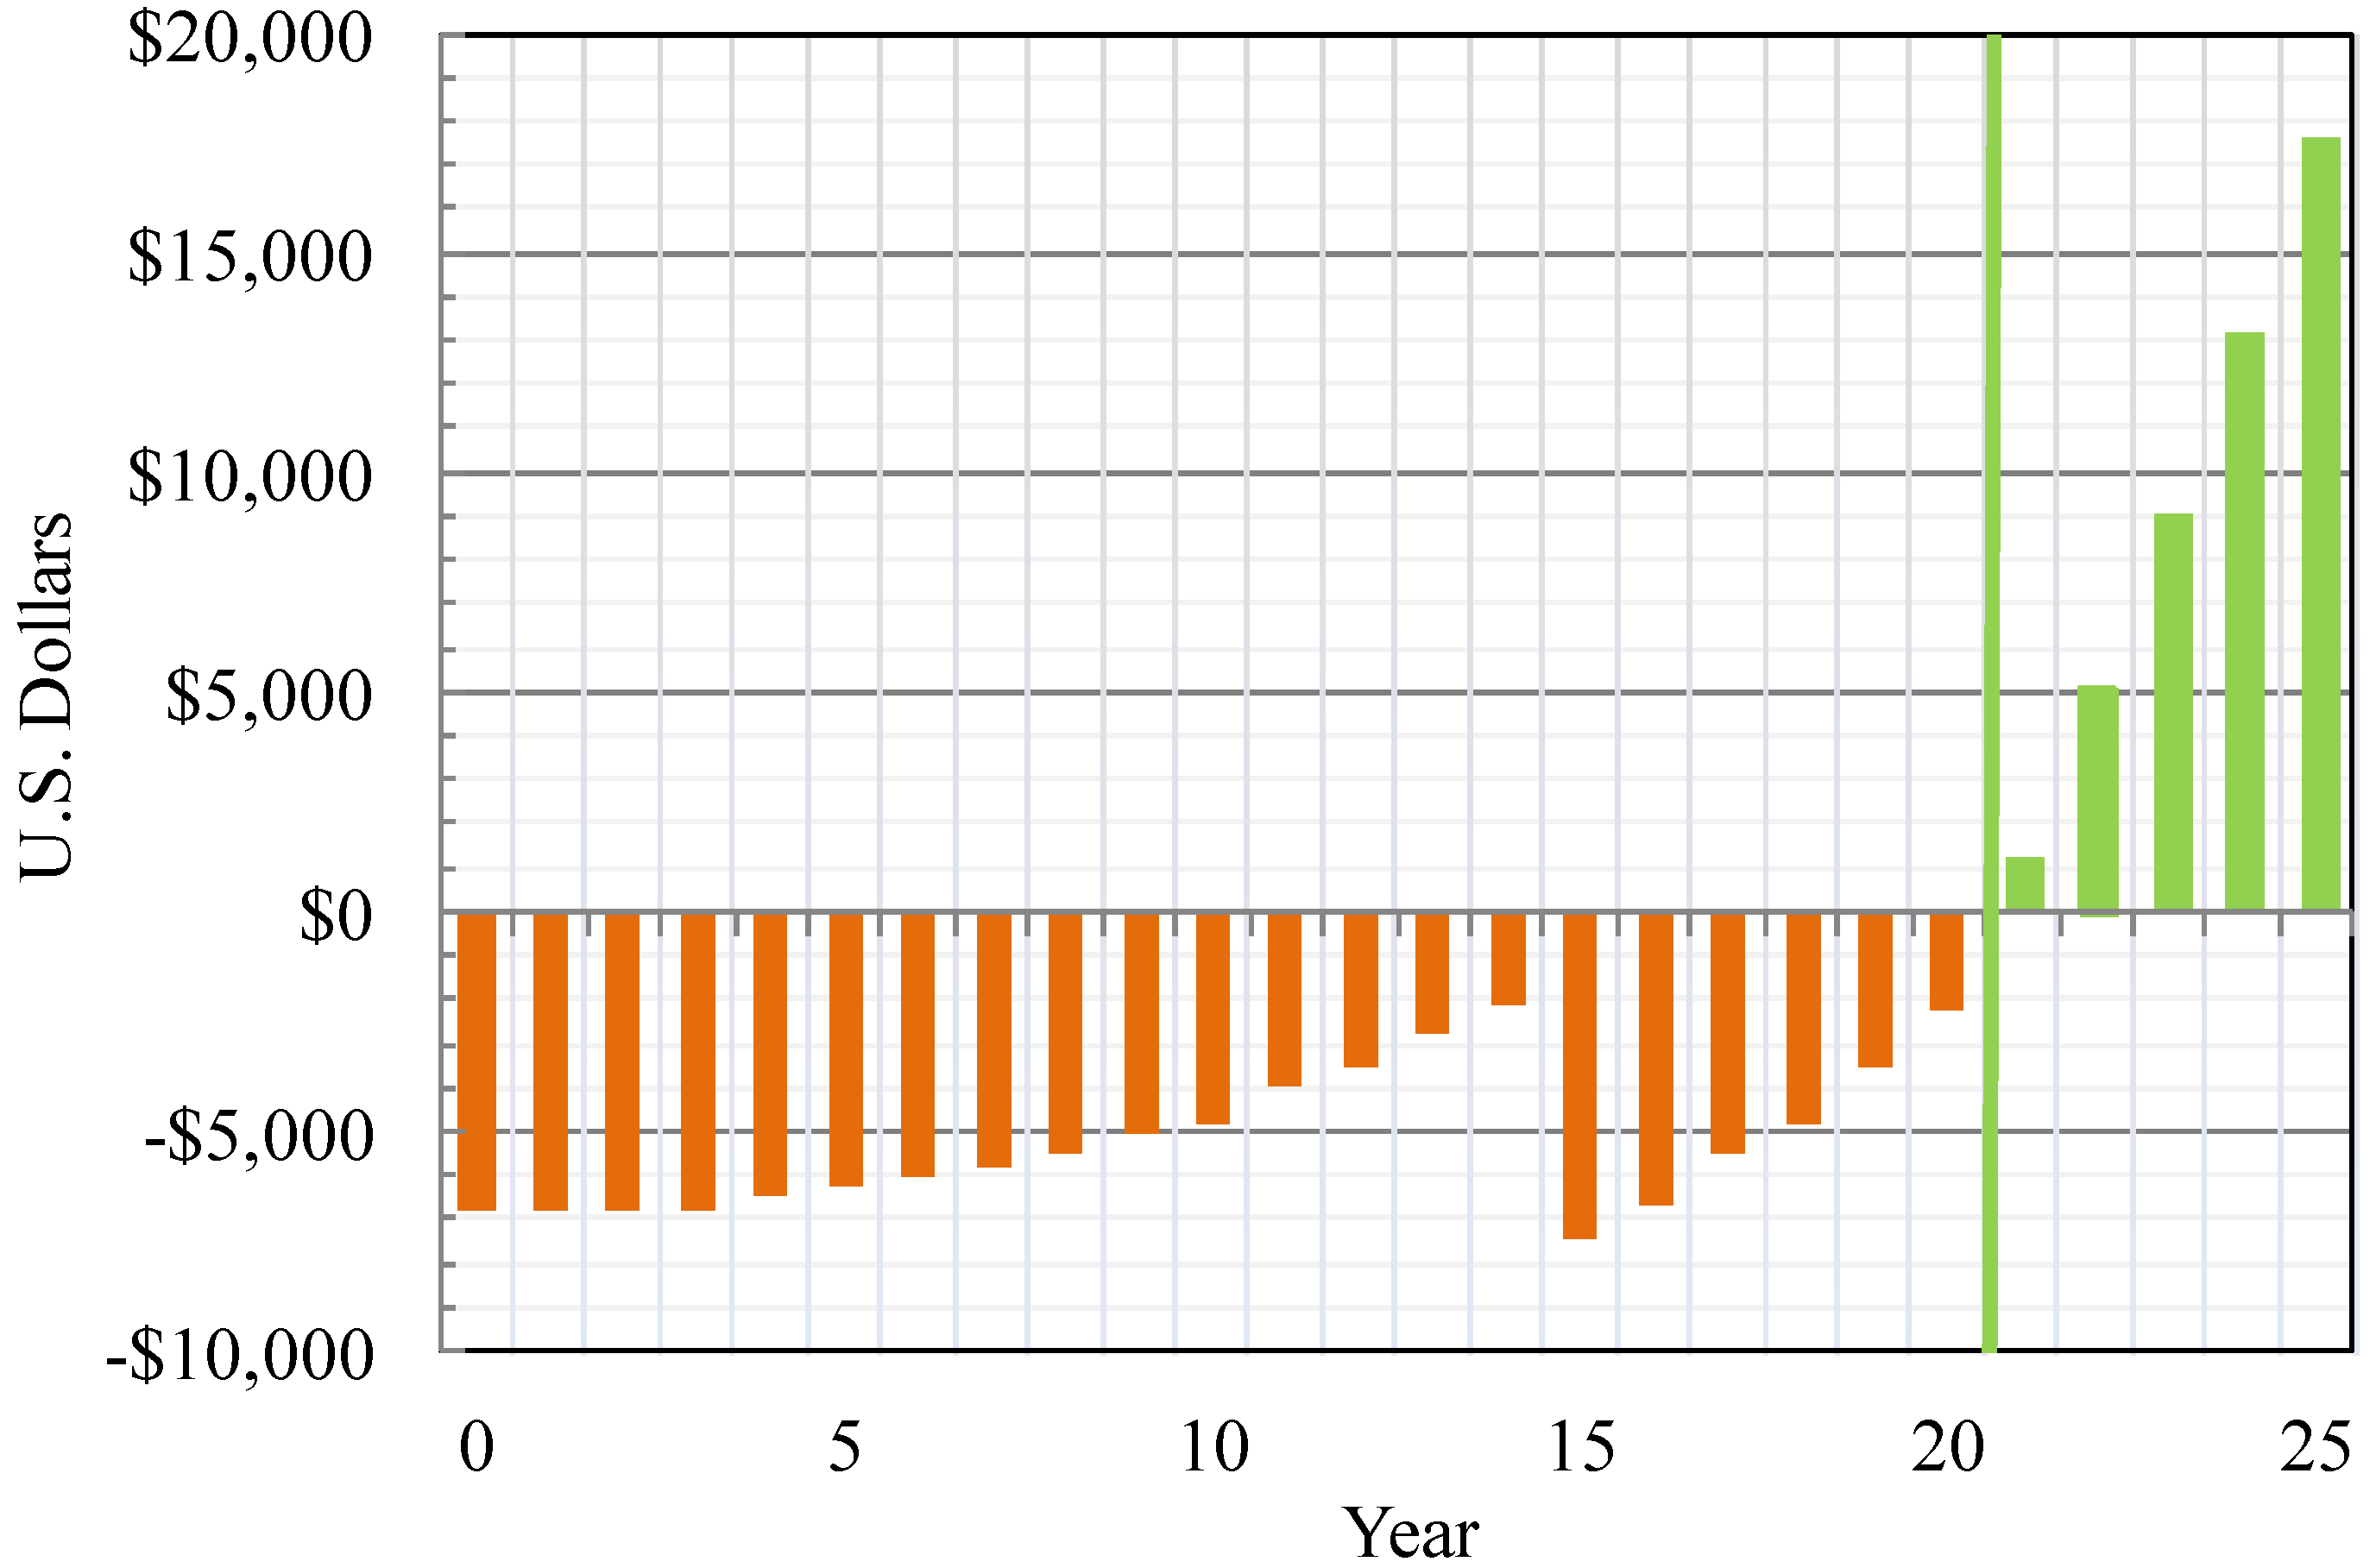
From this graph, we can see that the break-even point of this investment occurs at approximately 21 years. Many homeowners are not interested in this type of long term investment because they may potentially change addresses before this time period is up. Keep in mind, however, that this 21 year period may be reduced if the subsidy level or price of electricity were to rise. Also, depending on local real-estate markets, a home with a solar PV system may be more desirable to interested buyers. This would add value to the home, thereby returning some or all of the initial investment in the case that the owner decided to sell before the payback period was up. In addition, this model assumed that the owner had to take a loan out for 80% of the initial system cost. If the owner had been able to pay more up front, the break-even point would occur sooner than 21 years. Please note that the model also assumes that the inverter will be replaced during year 15. This is the reason for the negative spike in Figure 14. The return on investment, defined as the sum of all returns over the system life divided by the energy system net cost, is 264% for this particular project. This gives an internal rate of return of 6.5% and a net present value of $2,117. Additionally, the total amount of CO2 abated by this system over its lifetime would be 251 tons, or the equivalent of 502,000 auto miles. To see the full results of the Solar Calculator, enter the information from Table 4 into the website found in the References section [22].
If a homeowner wished to install a solar hot water system similar the one utilized by the Chameleon House, it would cost around $5,300 for the roof-top panels, pump station, control panel, and water tank, and about $800 in labor. Yet, when the 30% tax incentive is applied, the grand total for the owner is around $4,100. From Figure 5 we can see that for the 1000 ft2 homes modeled in this experiment, the solar domestic hot water system saves $206 in yearly hot water costs. Therefore, ignoring the effects of inflation and interest, the simple payback period for the solar domestic hot water system is about 20 years. This is comparable to the payback period calculated for the solar PV panels.
12. Conclusions
Solar-Estimator Calculator is a useful tool to help homeowners determine the financial feasability of installing renewable energy systems on their property. Using this calculator in conjuction with the Energy-10 software can also allow home designers to visualize and quantify the advantages of energy-saving strategies. Often, “going green” is seen as an expensive, cumbersome process. Yet, this research clearly shows that embracing green technologies such as a solar PV system can be not only beneficial for the environment, but also financially advantageous to the homeowner.
Based on the simulation results (Figure 8), the surplus power may be sold back to the grid through the use of a net meter. “Net metering” allows grid-tied solar homeowners to use excess electricity to offset their consumption. The meter spins backward, and they essentially sell their energy back to the utility company at retail rates. If net metering is not available from the utility company, a second meter is installed to measure the electricity that flows back to the provider, with the provider purchasing the power at a rate lower than the retail rate [23]. For homes that are not grid-tied, a bank of batteries may be used to store the extra energy harvested during daytime hours until it is needed at night. The use of such a storage device has some inherent downsides. First, the battery banks must be replaced fairly frequently; the lifespan is approximately 4–8 years for the typical deep cycle battery, or 10–20+ years for an industrial grade battery [24]. These life spans are greatly reduced by overcharging, storing in a hot room, discharging frequently, and discharging almost all of the “juice” before recharging. Additionally, they need to be monitored for acid leaks.
As one can imagine, the high initial costs of a photovoltaic system along with the previously mentioned shortcomings act as a deterrent to homeowners. However, by designing a house using energy conserving strategies such as: energy efficient appliances, lights, and HVAC system; daylighting; low-e windows; thermal mass; air leakage control; insulation; proper HVAC controls; duct leakage; and a solar domestic hot water system; a drastic reduction in energy consumption can be realized. It is the expectation that these Energy-10 results, along with the financial analysis from Solar-Estimate.org, will help homeowners and designers to overlook the high initial costs, and convince them to exploit the energy conserving strategies discussed. If more architects and engineers integrate renewable energies in their projects, this puts fewer loads on an already strained energy grid.
Acknowledgments
The authors would like to thank Norm Weaver, an author of Energy-10 and retired employee of the U.S. Department of Energy, for donating a copy of the software along with support materials. It goes without saying that this project could not have been completed without the help of Emily Vandivert, Project Manager of the Chameleon House as well as other members of the Missouri S&T Solar House Team including: Chris Bowe, Charles Wright, Shawn Herrington, Ferdinand Mueller, and Colin Polleys.
Conflicts of Interest
The authors declare no conflict of interest.
References
- The PV Panel Guide Web Page. PV Solar Panel Prices. Available online: http://www.pvpanelguide.co.uk/guides/pv-solar-panel-prices/ (accessed on 22 May 2013).
- DSIRE: Database of State Incentives for Renewable Energy Tax Credit. Available online: http://www.dsireusa.org/incentives/incentive.cfm?Incentive_Code=US37F&re=1&ee=1 (accessed on 3 March 2013).
- Center for American Progress Web Page. States Continue to Realize the Benefits of Renewable Energy Standards. Available online: http://www.americanprogress.org/issues/green/news/2013/01/18/50022/states-continue-to-realize-the-benefits-of-renewable-energy-standards/ (accessed on 22 May 2013).
- RE New Economy Web Page. Tracking the Next Industrial Revolution: Electricity Suppliers Look to EVs to Save Their Business Models. Available online: http://reneweconomy.com.au/2013/electricity-suppliers-look-to-evs-to-save-their-business-models-24550 (accessed on 22 May 2013).
- U.S. Department of Energy Web Page. Solar Decathlon. Available online: http://www.solardecathon.gov (accessed on 5 September 2012).
- Computer Software Support Material. Mastering Energy-10; Version 1.8; U.S. Department of Energy, National Renewable Energy Laboratory: Golden, CO, USA, 2006.
- Frigidaire Web Page. Top Mount Refrigerator FFHT1513L S/W/B/Q 15 Cu. Ft. Top Mount. Available online: http://www.frigidaire.com/en-US/products/Kitchen/Refrigerators/FFHT1513LB.aspx (accessed on 12 December 2012).
- Frigidaire Web Page. Dishwasher FPHD2491K F 24" Built-In. Available online: http://www.frigidaire.com/products/Kitchen/Dishwashers/FPHD2491KF.aspx (accessed on 12 December 2012).
- Frigidaire Web Page. Chimney Wall-Mount Hood FHWC3055l S 30” Stainless Steel. Available online: http://www.frigidaire.com/pro-ducts/Kitchen/range-hoods/FHWC3055LS.aspx (accessed on 12 December 2012).
- Frigidaire Web Page. Built-In Cooktop FGIC3067M B 30 in. Induction. Available online: http://www.frigidaire.com/products/Kitchen/cooktops-stovetops/FGIC3067MB.aspx (accessed on 12 December 2012).
- Frigidaire Web Page. Single Wall Ovens FGEW3045K F/W/B 30” Electric. Available online: http://www.frigidaire.com/en-US/products/Kitchen/Wall-Ovens/FGEW3045KF.aspx (accessed on 12 December 2012).
- Frigidaire Web Page. Microwave FFCM1134L S Countertop. Available online: http://www.frigidaire.com/products/Kitchen/Microwaves/FFCM1134LB.aspx (accessed on 12 December 2012).
- Frigidaire Web Page. Front Load Washers FAFS4474L R/N/A/W 15 Wash Cycles 4.4 Cu. Ft. Available online: http://www.frigidaire.com/products/Laundry/Washers/FAFS4174NW.aspx (accessed on 12 December 2012).
- Frigidaire Web Page. Front Load Dryers FASE7073L R/N/A/W 10 Dry Cycles 7.0 Cu. Ft. Electric. Available online: http://www.frigidaire.com/en-US/products/Laundry/Washers/FAFS4174NR.aspx (accessed on 12 December 2012).
- PEX Supply Web Page. Circulator Pump for SDHW System, 1/8 HP. Available online: www.pexsupply.com/Taco-007-VDTF5-007-Variable-Speed-Delta-T-Cast-Iro-Circulator-Pump-115V (accessed on 13 January 2013).
- Energy.Gov Web Page. Estimating Appliance and Home Electronic Energy Use. Available online: http://energy.gov/energysaver/articles/estimating-appliance-and-home-electronic-energy-use (accessed on 11 January 2013).
- General Electric Company Web Page. Home Appliance Energy Use: GE Data Visualization. Available online: http://visualization.geblogs.com/visuali-zation/appliances/ (accessed on 11 January 2013).
- About.com Web Page. Recommended Electric Heating Wattage and Circuit Size for Living Areas. Available online: http://www.electrical.about.com/od/heatingairconditioning/a/eleheatwattandcircuitsize.htm (accessed on 15 January 2013).
- NREL Web Page. Annual PV Solar Radiation—Flat Plate, Facing South, Latitude Tilt. National Renewable Energy Laboratories, (1998–2005). Available online: http://www.nrel.gov/gis/images/map_pv_us_annual_may2004.jpg (accessed on 10 November 2013). [Google Scholar]
- Hot Water Facts Web Page. Quick Guide to Buying a Water Heater: FAQ. Available online: http://www.hotwaterfacts.com/faq.html (accessed on 3 February 2013).
- HowStuffWorks Web Page; Cowan, L.; Sennebogen, E. How Heat Pumps Work. 13 May 2009. Available online: http://home.howstuffworks.com/home-improvement/heating-and-cooling/heat-pump.htm (accessed on 22 January 2013).
- Solar-Estimate Web Page. Estimate the Cost of Going Solar. Available online: http://solar-estimate.org/index.php?page=estimatoroverview (accessed on 9 September 2013).
- The Green Power Network Web Page. Green Power Markets: Net Metering. Available online: http://apps3.eere.energy.gov/greenpower/markets/net-metering.shtml (accessed on 3 March 2013).
- Northern Arizona Wind & Sun Web Page. Deep Cycle Battery Information and FAQ. Available online: http://www.windsun.com/Batteries/Battery_FAQ.htm#Cycles%20vs%20Life (accessed on 3 March 2013).
© 2013 by the authors. Licensee MDPI, Basel, Switzerland. This article is an open access article distributed under the terms and conditions of the Creative Commons Attribution license ( http://creativecommons.org/licenses/by/3.0/).
Share and Cite
MDPI and ACS Style
Wermager, S.; Baur, S. Energy Analysis of a Student-Designed Solar House. Energies 2013, 6, 6373-6390. https://doi.org/10.3390/en6126373
AMA Style
Wermager S, Baur S. Energy Analysis of a Student-Designed Solar House. Energies. 2013; 6(12):6373-6390. https://doi.org/10.3390/en6126373
Chicago/Turabian StyleWermager, Samantha, and Stuart Baur. 2013. "Energy Analysis of a Student-Designed Solar House" Energies 6, no. 12: 6373-6390. https://doi.org/10.3390/en6126373