A Demonstration of Carbon-Assisted Water Electrolysis

1
Chemical & Biological Engineering Department, University of Sheffield, Mappin Street, Sheffield S1 3JD, UK
2
School of Engineering and Engineering Technology, Federal University of Technology, Gidan Kwano Campus PMB 65, Minna, Niger State, Nigeria
*
Author to whom correspondence should be addressed.
Energies 2013, 6(3), 1657-1668; https://doi.org/10.3390/en6031657
Submission received: 19 December 2012
/
Revised: 22 February 2013
/
Accepted: 5 March 2013
/
Published: 11 March 2013
Abstract
:It is shown that carbon fuel cell technology can be combined with that of high temperature steam electrolysis by the incorporation of carbon fuel at the cell anode, with the resulting reduction of the required electrolysis voltage by around 1 V. The behaviour of the cell current density and applied voltage are shown to be connected with the threshold of electrolysis and the main features are compared with theoretical results from the literature. The advantage arises from the avoidance of efficiency losses associated with electricity generation using thermal cycles, as well as the natural separation of the carbon dioxide product stream for subsequent processing.
1. Introduction
High temperature electrolysis of water has been the subject of a number of studies in recent years [1,2,3] and the benefits derive from the positive entropy change and hence reducing free energy change with temperature. Economic analyses [4] have shown that a significant portion of the cost of hydrogen production by this route derives from the price of the electricity, and the modest electricity consumption savings at higher temperature are an attempt to reduce this element.
Although sustainable electricity generation technologies are increasing (e.g., wind, solar), it has been noted [5] that the major proportion of electricity is still generated from fossil fuel sources, and electricity generation costs from these are inevitably associated with efficiencies of around 40%, which are typical of thermal generation cycles.
In parallel with developments in high temperature electrolyser technology, there have been significant improvements and developments in fuel cell technologies, and high temperature electrolysis has benefited from these through the use of high temperature solid oxide materials such as zirconia [2]. The fuels used for fuel cells cover a range including hydrogen, simple hydrocarbons, alcohols and carbons arising from a range of sources. Given the similarity in the high temperature technologies associated with fuel cells and electrolysis cells, it is natural to consider a combination of these devices into a single unit in which the electricity generated from the fuel cell, rather than the power station, is used directly in the electrolysis process. The work of Pham et al. [5] and Martinez-Frias et al. [6] have demonstrated this principle through the use of natural gas fed to the anode (fuel electrode) of a solid oxide electrolysis cell operating at 900 °C, where a reduction of around 1 V was achieved in the required electrolysis voltage.
For the reaction:
this is consistent with a fuel cell EMF, E° = −ΔG°/nF = 1.04 V (n = number of electrons, F = Faraday constant, 96,487 C/mol).
CH4(g) + 2O2(g) = CO2(g) + 2H2O(g) ΔG° = −800 kJ/mol
The advantage in such an approach to electrolysis is seen to be the avoidance of the efficiency losses associated with burning the fuel in a thermal cycle for electricity production, but also through the natural separation of CO2 product gas from other non-condensable gases in the air supply, which greatly reduces carbon capture costs.
The direct carbon fuel cell (DCFC) is a special kind of high temperature fuel cell that directly uses carbon as fuel supplied to the anode (fuel electrode) and has the potential to reduce the complexities of reforming hydrocarbon raw materials to simpler fuels such as hydrogen. The DCFC has been shown to offer significantly higher thermal efficiencies [7] for electrical power generation compared to combustion routes and even for other fuel cell types using different fuels. The raw materials for powering a DCFC are solid, carbon-rich fuels, and much of the effort in recent years has been devoted to fossil fuel carbon sources, such as coal and petroleum coke.
For the solid oxide fuel cell, since transport is taken to be that of the O2− ion, the cell reactions are:
cathode O2 + 4e− → 2O2−
anode C + 2O2− → CO2 + 4e−
A further development in this approach of using a carbon fuel to aid the water electrolysis process was examined theoretically by Gopalan et al. [8] by the use of coal fuel particles dispersed in a molten silver anode connected to a solid oxide electrolyte. The analysis was aimed at efficiency evaluations under a range of cell operating conditions and including any waste heat recovery. Importantly, the contribution of the carbon oxidation free energy was included, based on the cell operating temperature of 1300 K and the oxidation to carbon monoxide:
C + 0.5O2(g) = CO(g) ΔG° = −226.5 kJ/mol
In this case the predicted reduction in the applied cell voltage becomes 1.17 V.
The relationship between current density i, the required cell voltage Ec, and the area specific resistances (ASR) for the cell (Ri), and due to concentration polarisation (Rp), was given by:
where Ec = Eapp + ENernst and ENernst is the standard cell potential (E°) for the overall reaction, plus a voltage contribution due to the non-standard partial pressures of reactants and products.
For an electrolysis process based on the anode Equation (4), the overall reaction is:
and at 1300 K, ΔG° = −50.5 kJ/mol and E° = 0.262 V. This implies that the overall process should proceed spontaneously, although there are energy losses due to the current resistances in the circuit and a nett applied voltage (Eapp) is required to drive the process.
C + H2O(g) = CO(g) + H2(g)
The authors made estimates of expected efficiencies and Eapp values based on typical values for Ri and Rp. These are discussed further below.
The possible use of carbon to reduce the electrolysis voltage has a particular value due to the wide range of sources available, allowing advantage to be taken of the lowest cost sources.
In general, this approach provides an additional technology option, either for the generation of hydrogen for use in the chemical industry, avoiding the use of premium hydrocarbon fuels, or for the gasification of solid carbons for use in electricity generation using gas turbines.
Gasification processes are of renewed interest for the processing of solid fuels due to the benefits of using gas turbine (GT) technology combined with steam cycles, the so-called combined cycle routes. Such combined cycle processes are capable of achieving 50%+ in energy efficiencies, and gasification of the solid fuel is required in order to take advantage of GT technology.
The present work demonstrates the initial experimental observations in using carbon to assist the electrolysis process and compares these with some of the predictions from the above work.
2. Experimental Section
Results from three separate configurations are presented below, based around a solid oxide supported electrolyte cell geometry and consisting of a direct carbon fuel cell, an electrolysis cell and a combination using a carbon assisted electrolysis cell.
2.1. Solid Oxide Cell Construction and Operation
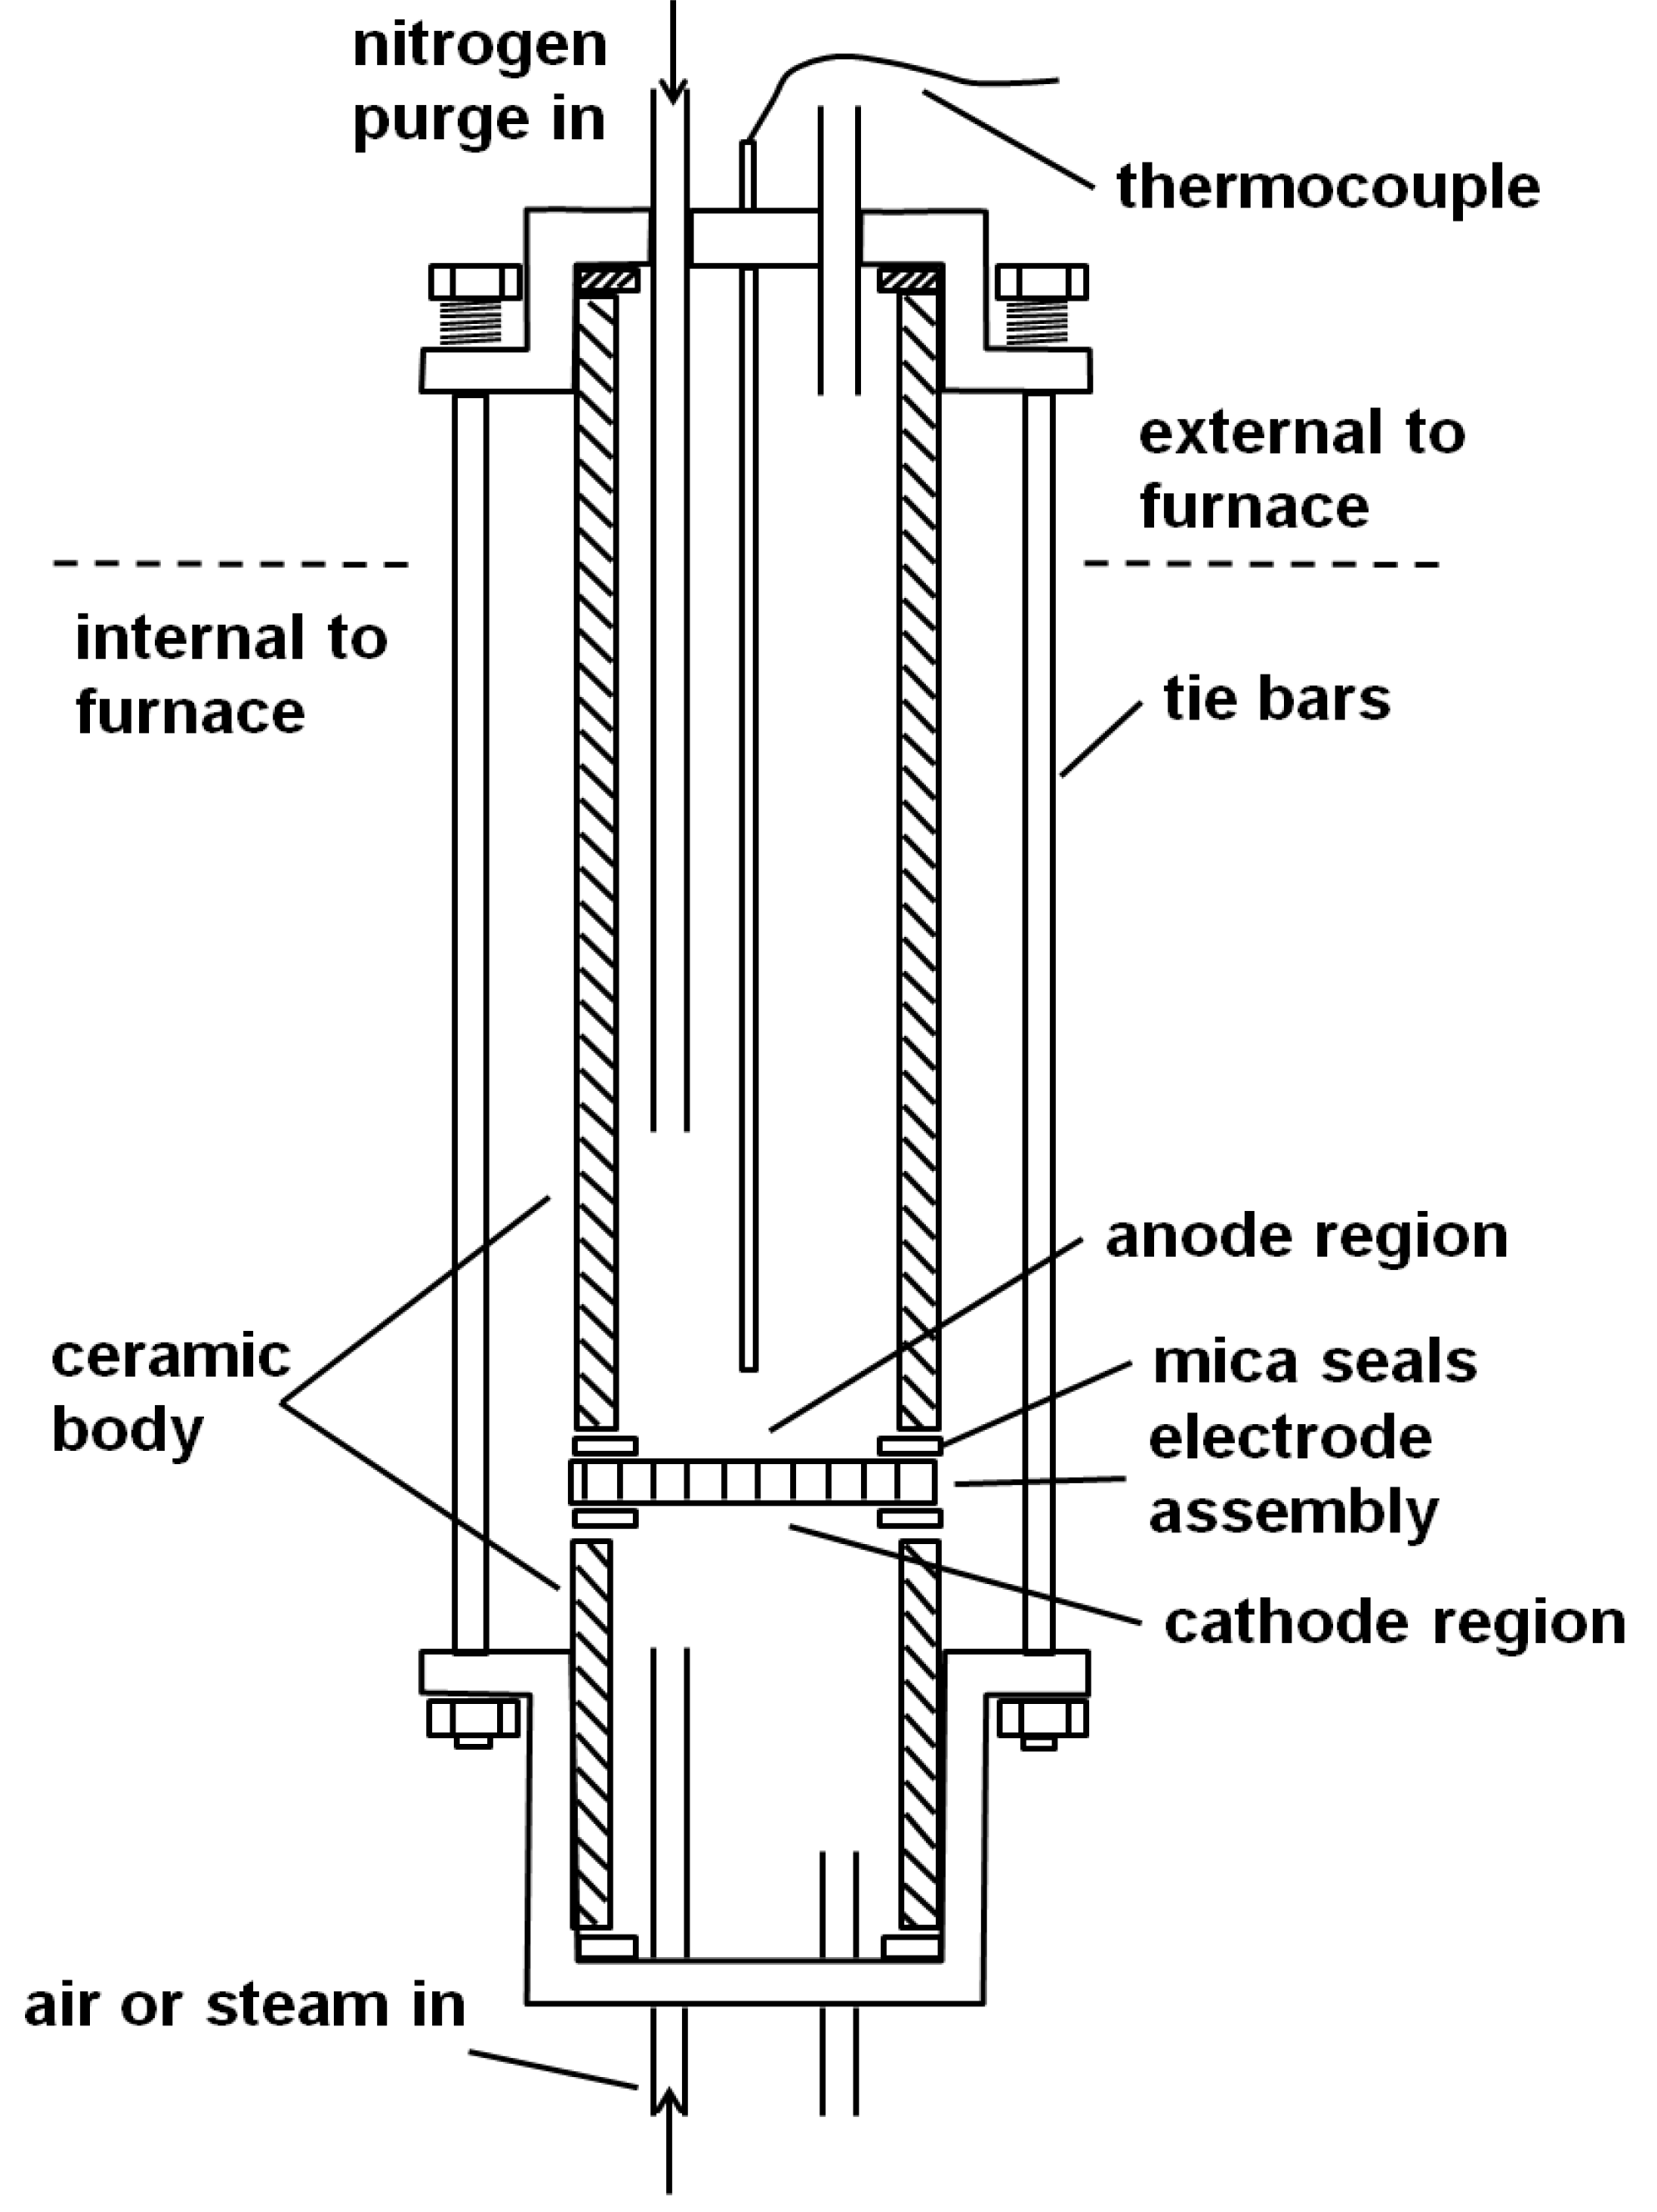
The solid oxide cell used in the experiments consisted of a button cell of stabilised zirconia, where the overall cell containment used is shown in Figure 1.
The electrode assembly shown in Figure 2 was held between two open alumina tubes of 24 mm internal diameter, 3 mm wall, and oriented vertically. The end of each tube was held within a closed metal chamber of stainless steel, which included built-in flanges and allowed steel, spring loaded tie bars to be fixed between each end of the system to hold the electrode assemblies in place. The overall length of the tubular assembly was 280 mm.
Figure 1.
Cell geometry used for insertion into furnace.

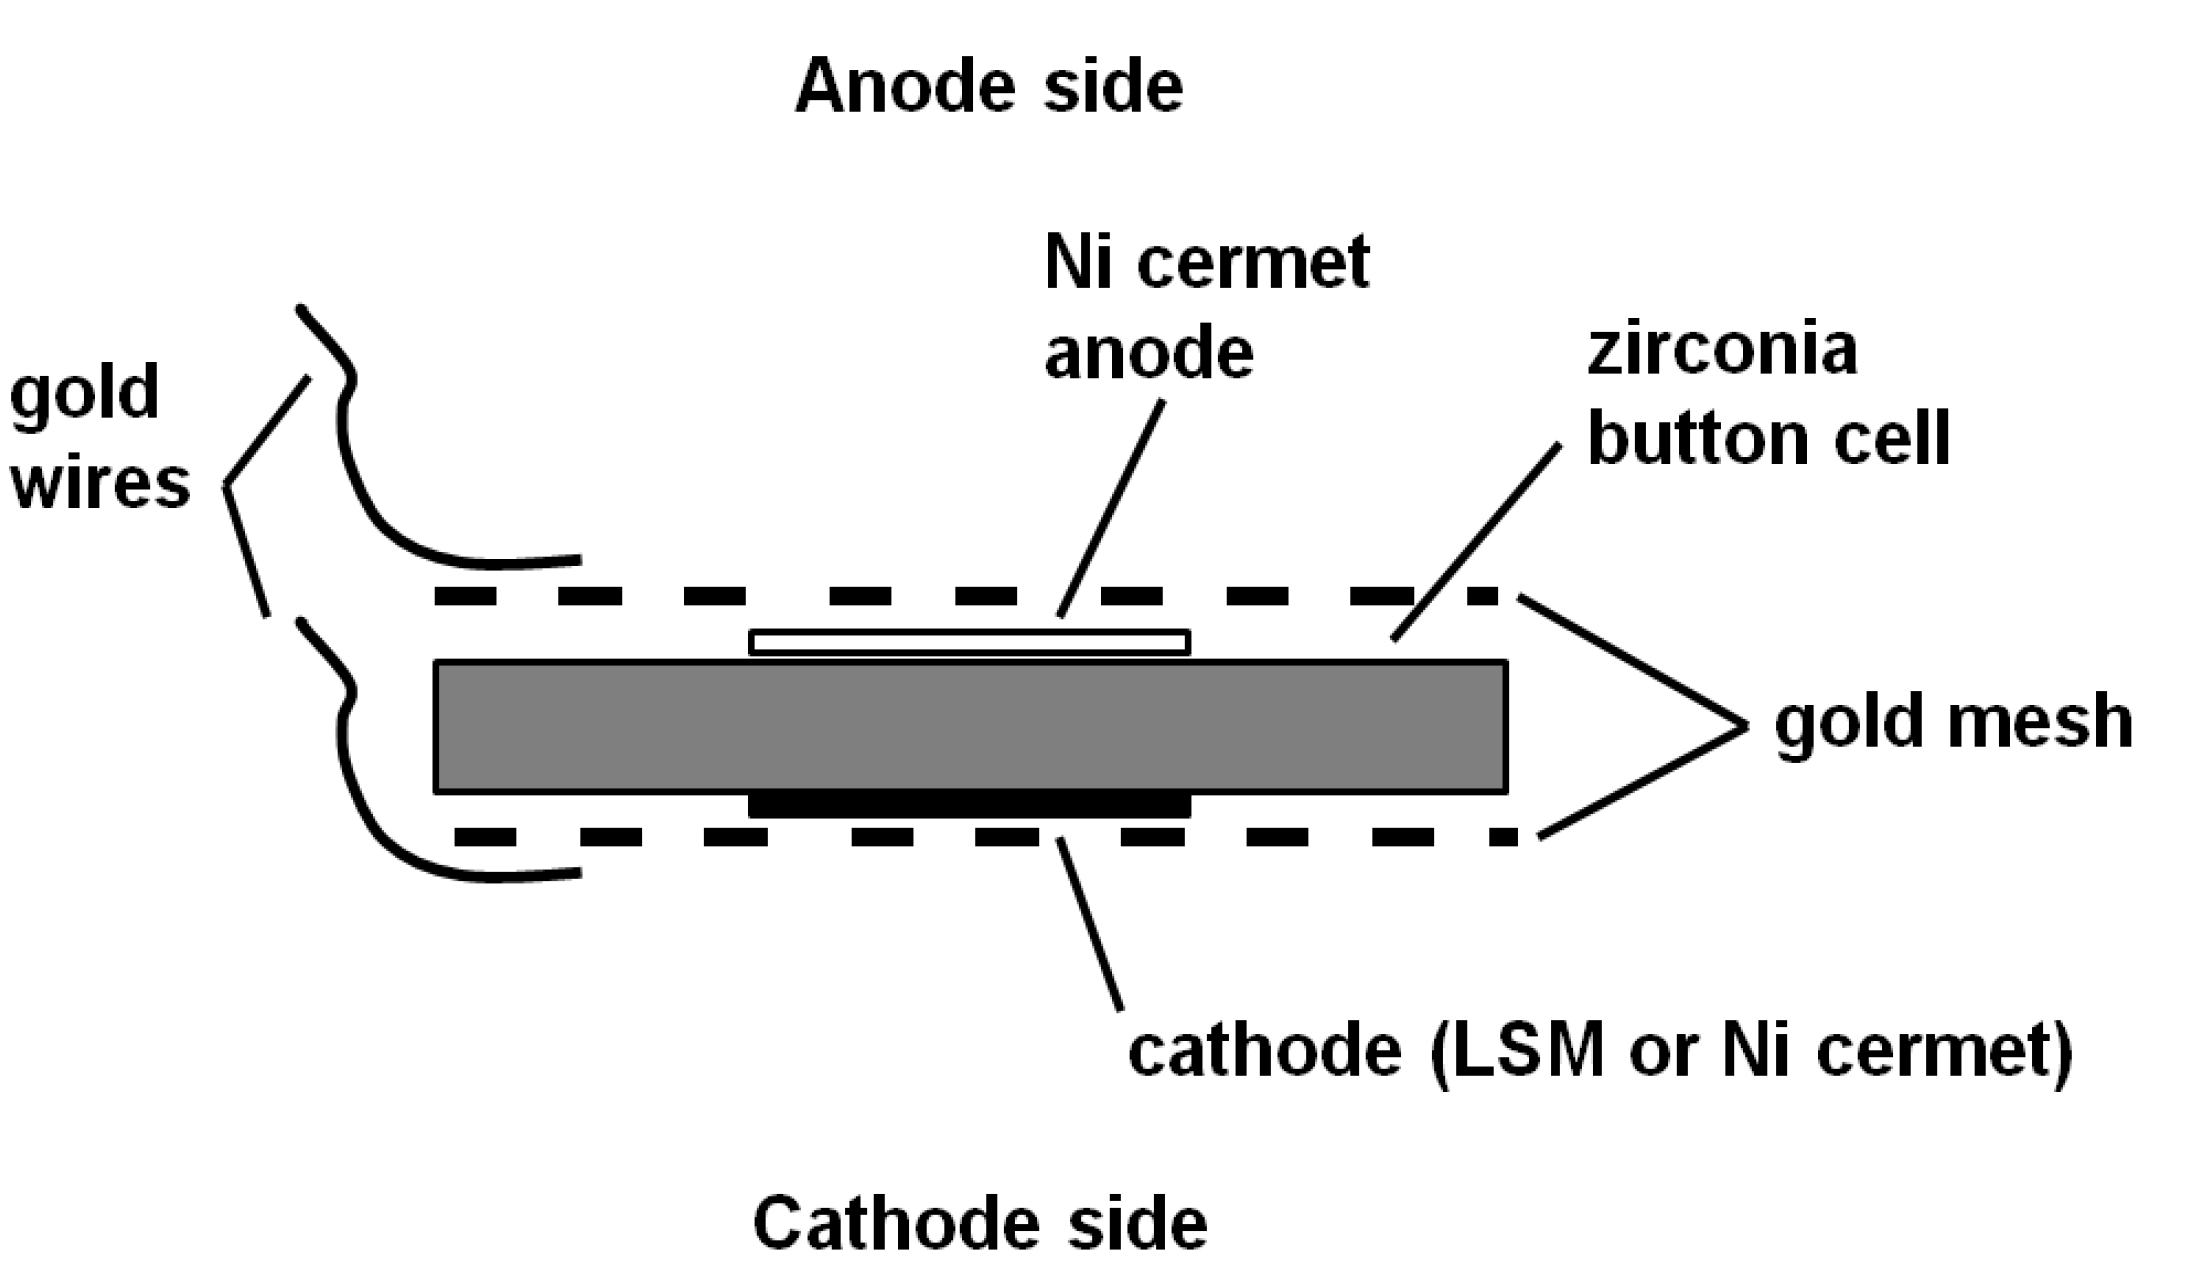
Figure 2.
Electrode assembly used in fuel cell and electrolysis cell.
The lower 80% of the tubular system could then be located within a furnace and the cell operating temperature was monitored locally using a sheathed K-type thermocouple which entered through the upper metal chamber.
Inlet and outlet tubes were provided through the upper and lower metal chambers to allow some purging on the anode side and the required reactant gas on the cathode side (steam side).
The central button cell element was of 25 mm diameter (supplied by Fuel Cell Materials, Lewis Center, OH, USA) and consisted of a Hionic electrolyte (stabilised zirconia, 150 µm in thickness) with a central 12.5 mm diameter active layer (50 µm thickness) on each side. The choice of these active layers depended on the process being investigated as described below.
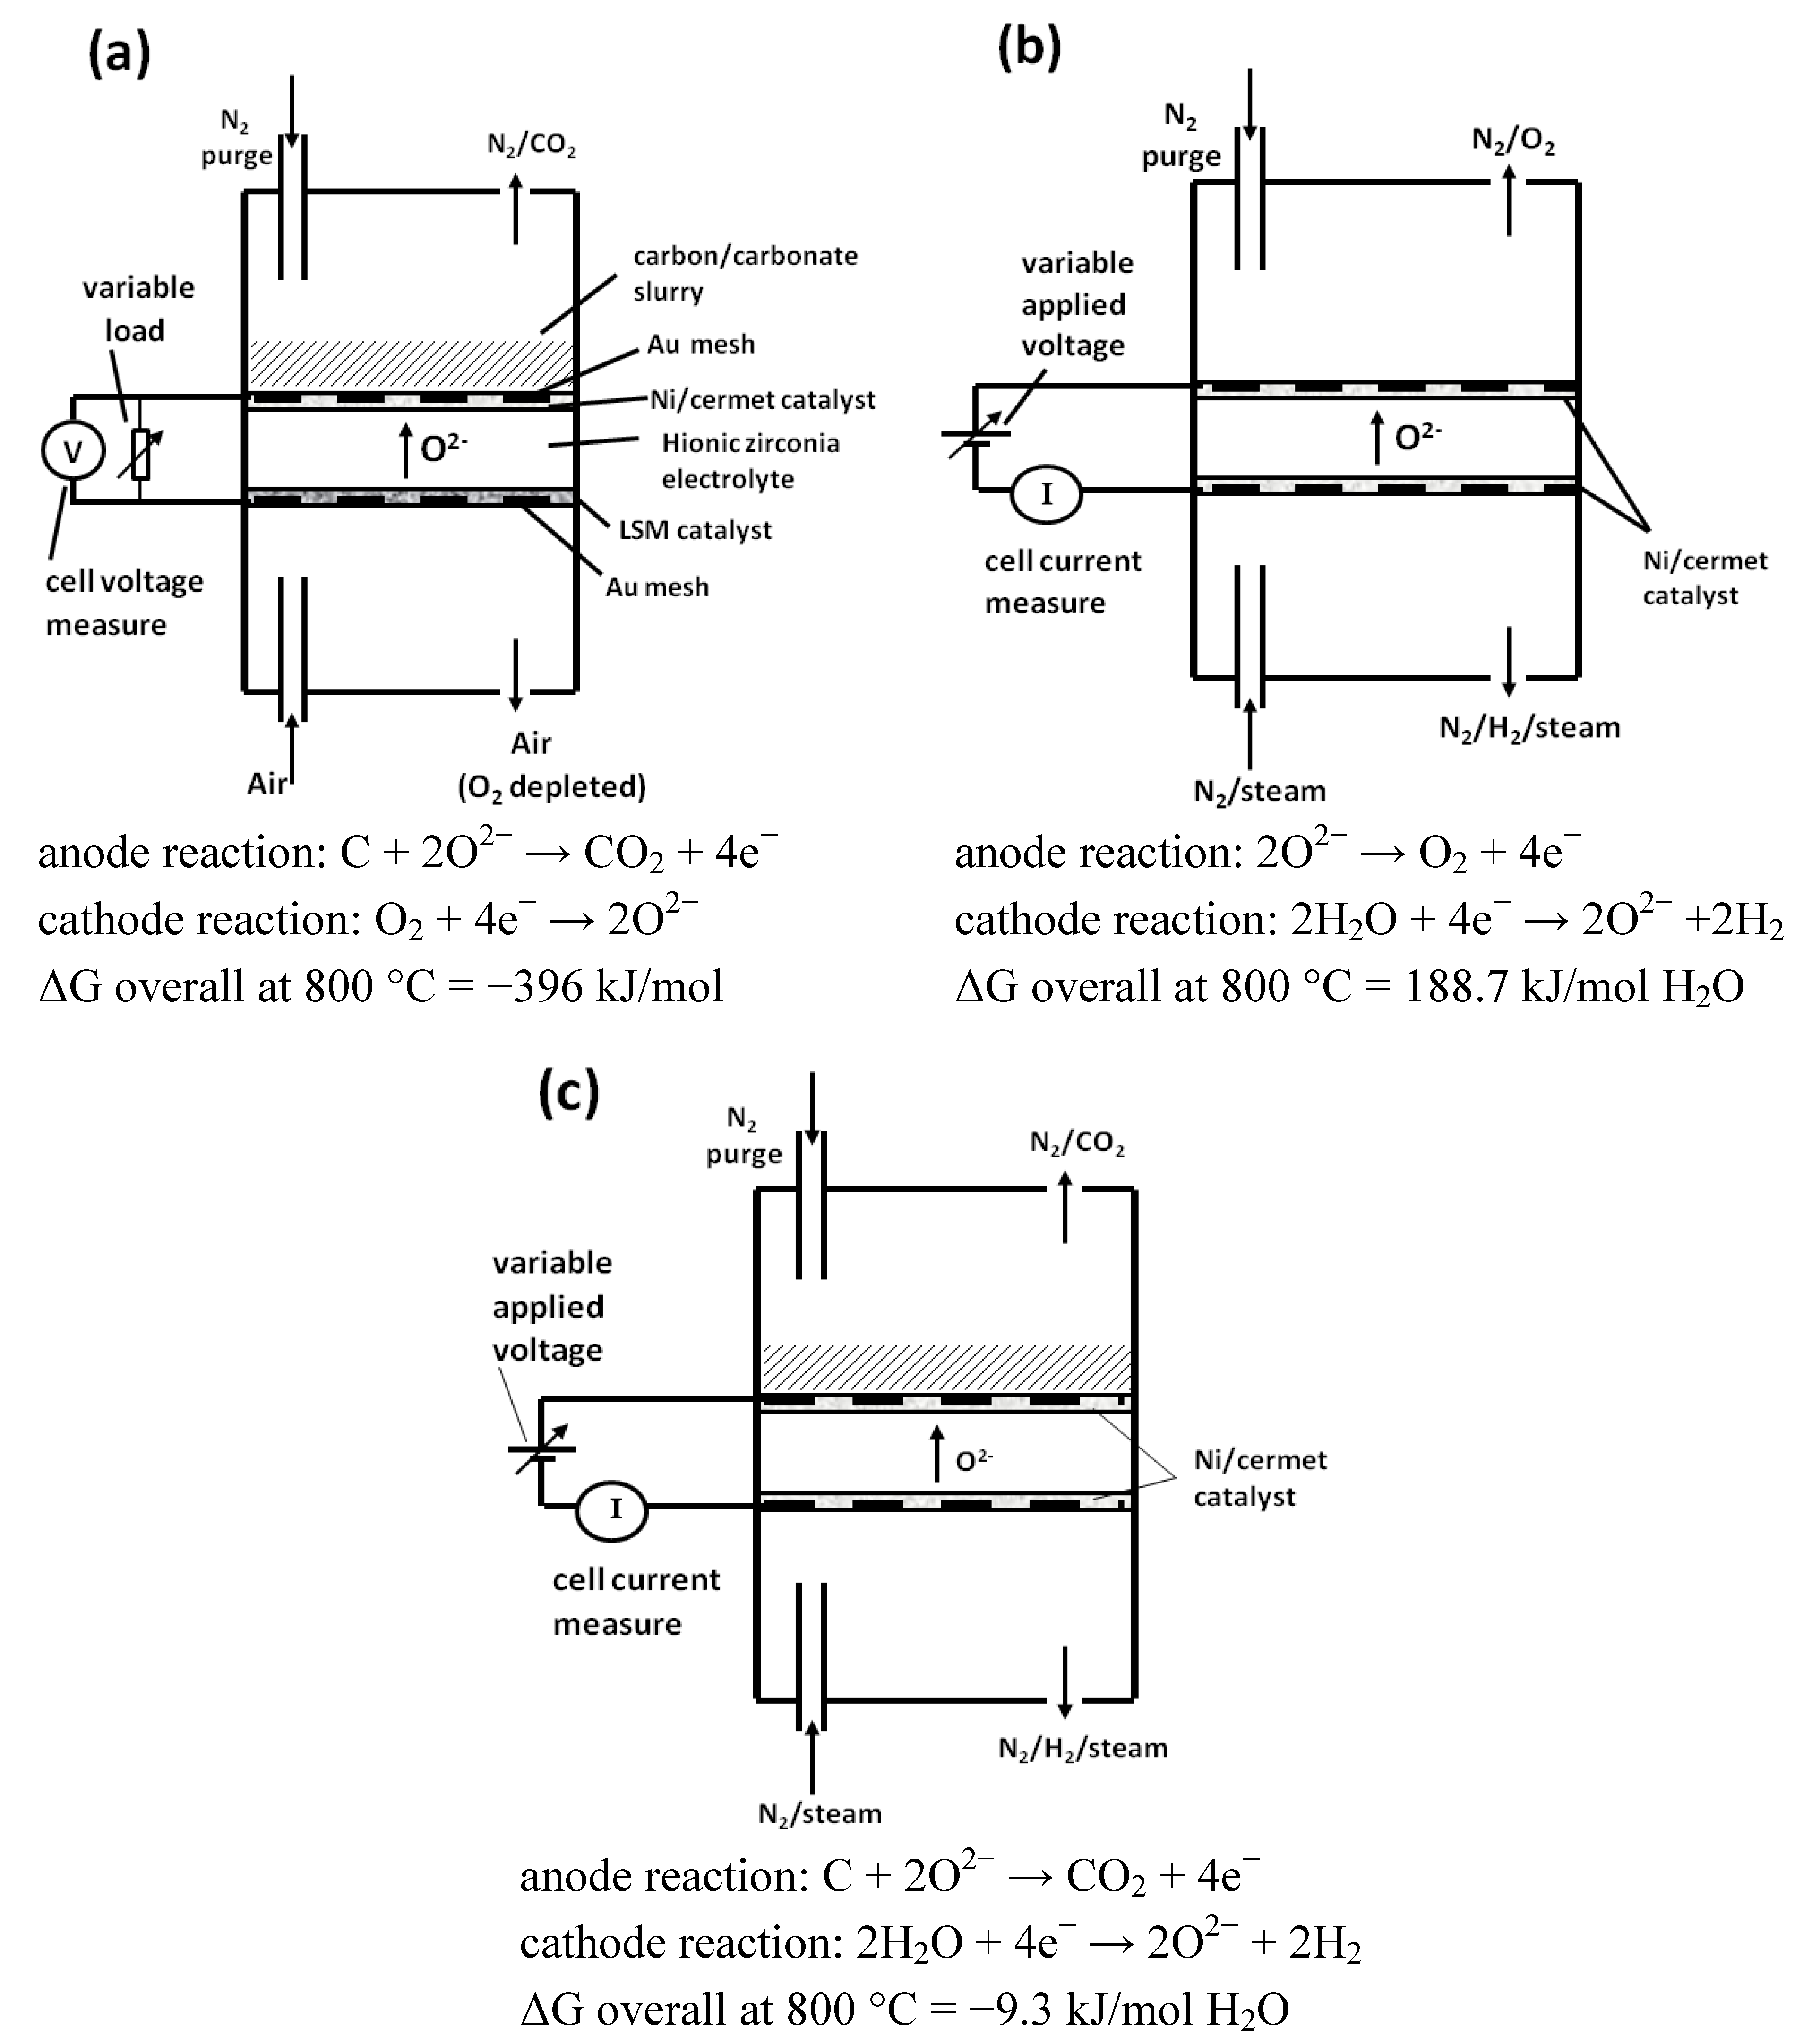
An overall schematic of the operation of the three cell geometries used is shown in Figure 3a–c. This identifies the inlet and outlet gases, location of fuel and electrolyte/catalyst combinations employed.
Figure 3.
Overall schematic of the operation of the three cell geometries used. Each cell body is immersed in a furnace environment. (a) carbon fuel cell; (b) electrolysis cell (EC); (c) carbon assisted a electrolysis cell (CAEC).
Figure 3.
Overall schematic of the operation of the three cell geometries used. Each cell body is immersed in a furnace environment. (a) carbon fuel cell; (b) electrolysis cell (EC); (c) carbon assisted a electrolysis cell (CAEC).
2.2. Carbon Fuel and Preparation
Based on experience in working with biomass materials in carbon fuel cells, the carbon chosen for the demonstration was the char from pyrolysed miscanthus (M. giganteus). The biomass samples of particle size of 0.5 to 1.0 mm, were dried at 100 °C before pyrolysing in a cylindrical, electrically heated furnace at a heating rate of 7 °C/min and up to the operating temperature of 800 °C, where samples were held for 30 min. [9]. Nitrogen gas was used to purge the system during and after the pyrolysis process until it cooled down to 200 °C. The proportion of char produced in each case was in the range 22–24 wt %. Although these chars show some graphitic structure there is also a high degree of amorphous carbon, similar to that observed in many coal samples.
The biomass char was ground by ball milling and size analysis on the samples using laser diffraction sizing showed that 50% of the weight fell within the particle size range 2.2–8.1 µm. At the operating temperature of the fuel cell, the fuel is presented as a slurry of 15 wt %, dispersed in a molten carbonate mixture of Li2CO3/K2CO3 mixed in the ratio of 46.6 wt % Li2CO3 and 53.4 wt % K2CO3, giving a melting point close to 500 °C [10].
Carbon Fuel Cell Operation
In common with several other reported works using SOFCs, the anode side of the cell was chosen for its catalytic behaviour toward oxidation and consisted of a 50 µm bilayer of Ni-yttria stabilised zirconia/Ni-gadolinium doped ceria (Ni-YSZ/Ni-GDC).
The cathode layer consisted of a 50 µm bilayer of lanthanum strontium manganite/lanthanum strontium manganite-gadolinium doped ceria (LSM/LSM-GDC) which was suited to the oxygen reduction step. Cells with these layers already attached are provided by the manufacturer.
As supplied, the Ni on the anode side is in the oxidised form and this was subjected to a reducing atmosphere consisting of 5 vol% hydrogen in nitrogen for 1 h at 900 °C prior to use. Any subsequent processing steps which required elevated temperatures ensured that the same protective reducing atmosphere was provided. This cell element was further processed with the addition of gold mesh current collectors on anode and cathode sides, which were attached using silver ink to the edges and a further heat cycle at 900 °C for 20 min. The silver ink consists of a suspension of fine silver particles in a terpene oil and is available from Fuel Cell Materials. In order to ensure good continuity between the electrode surfaces and their respective gold meshes, nickel ink was then applied sparingly to the anode mesh surface, with any excess removed and LSM ink to the cathode mesh in the same way. The electrode assembly was then dried ready for use. Gold wires (0.4 mm diameter) lead the current from the cells. These wires had flattened ends and were held in contact with the gold mesh elements by the compressive force of the external springs.
The 15 wt % of the carbon fuel in carbonate mixture was supplied to the anode side of the cell at a fixed mass of 3.0 g for all experiments. Air was supplied to the cathode side at a rate of 2 L/min (room temperature and atmospheric pressure) and a light flow of nitrogen gas was connected to the inlet at the anode (to purge the CO2 produced from the system).
2.3. Electrolysis Cell Operation
The anode oxidation process taking place in conventional hydrogen fuelled cells to produce water vapour is reversible and therefore, for the electrolysis process involving proton reduction, the same nickel/zirconia cermet electrode material is an appropriate choice for the active layer of the cathode side of the cell (steam side). For the anode side evolving oxygen, the active layer was LSM, being the reverse reaction involved in oxygen gas transformation during fuel cell operation.
Steam was supplied to the cathode side of the cell by means of nitrogen carrier gas at a concentration of 30 vol% of steam in a nitrogen flow rate of 2 L/min. Trace heating of supply lines was provided to avoid steam condensation.
2.4. Carbon Assisted Electrolysis Cell Operation
The operation of the carbon assisted electrolysis cell was achieved by a combination of the two separate processes, electrolysis and carbon fuel cell. Since the electrode processes involve hydrogen production on the cathode side and carbon oxidation on the anode side, both sides of the zirconia electrolyte are coated with a 50 µm layer of Ni/zirconia cermet. The materials supplied were identical to those used in the separate cell processes, i.e., 30 vol% of steam in a nitrogen flow rate of 2 L/min supplied to the cathode and 3.0 g of char fuel mixture to the anode.
3. Results and Discussion
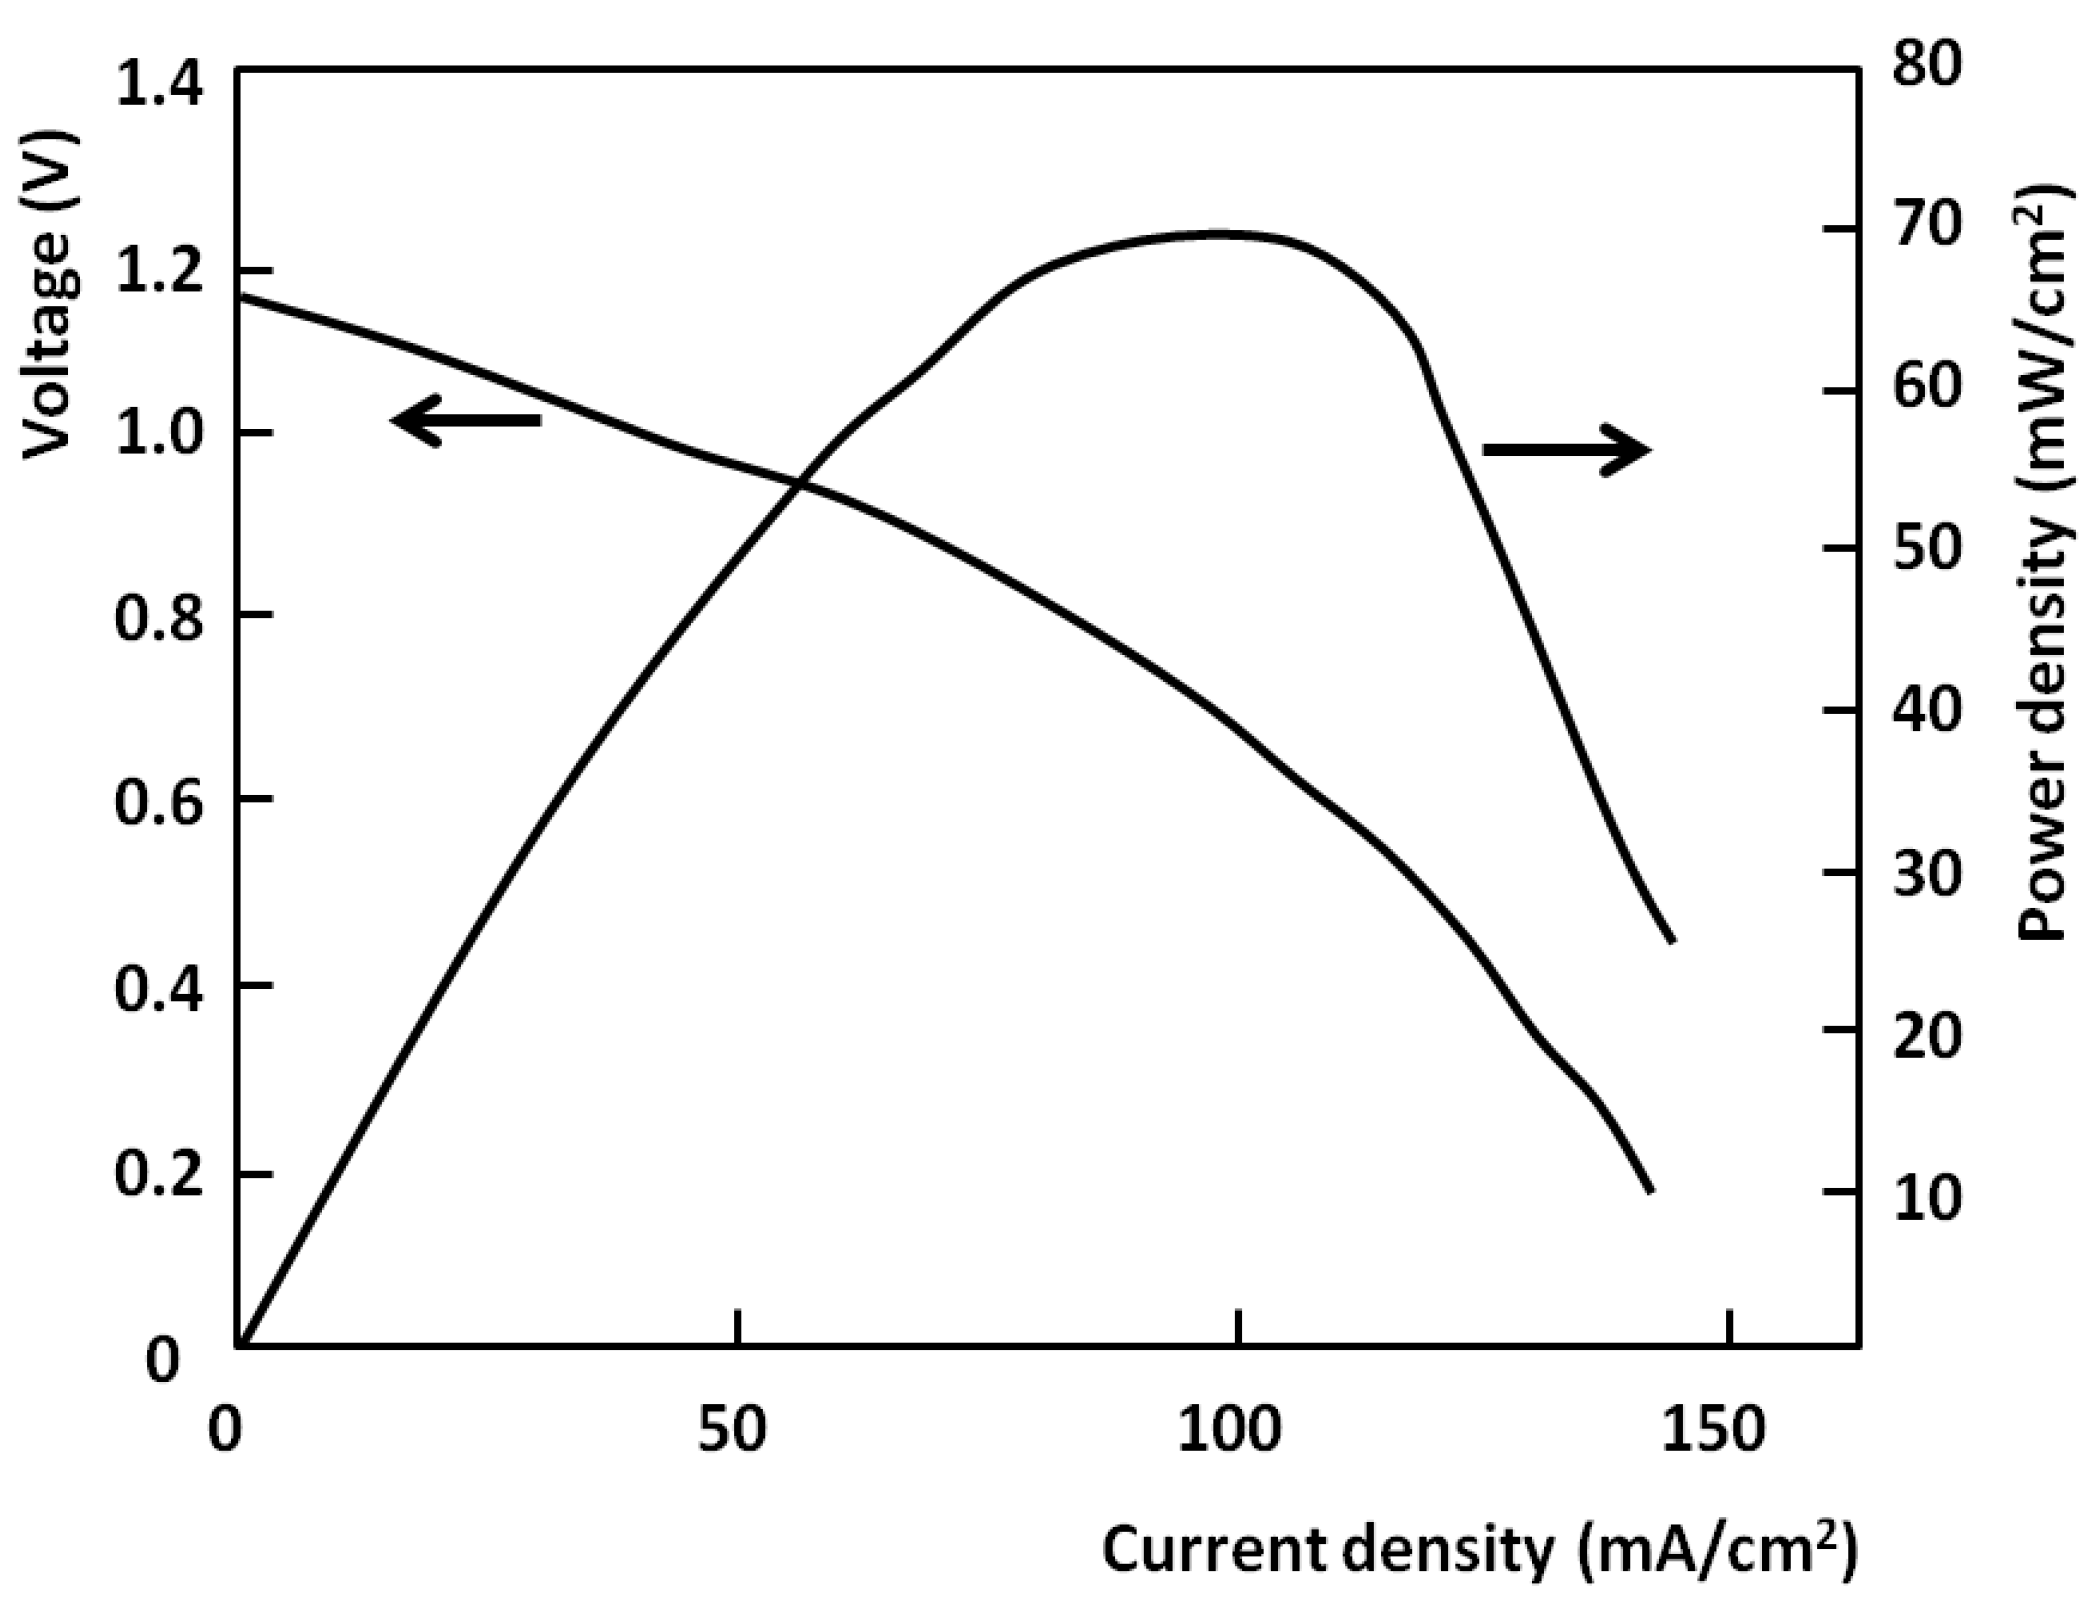
The performance of the carbon fuel cell (DCFC) at 800 °C is shown in Figure 4 in terms of cell voltage developed and power density, where the external load was varied from open circuit to 1.2 Ω. The current-voltage curve shows behaviour which is consistent with that of most direct-carbon fuel cells, i.e., a voltage close to the predicted open circuit value at zero current, falling approximately linearly with increase in current density due to ohmic losses and followed by a more rapid fall at high current densities due to mass transfer polarisation at one or both of the electrodes. The open circuit voltage for this system is found to be in the range 1.15–1.2 V, which is consistent with other recently reported values for carbons, e.g., 1.2 V with petcoke [11] and coal [12] as carbonate/fuel slurries. The current density range shown is typical for this cell geometry and the results with several fabricated cells have shown closely similar behaviour.
Figure 4.
Fuel cell voltage and power vs. current density for cell at 800 °C using miscanthus char.

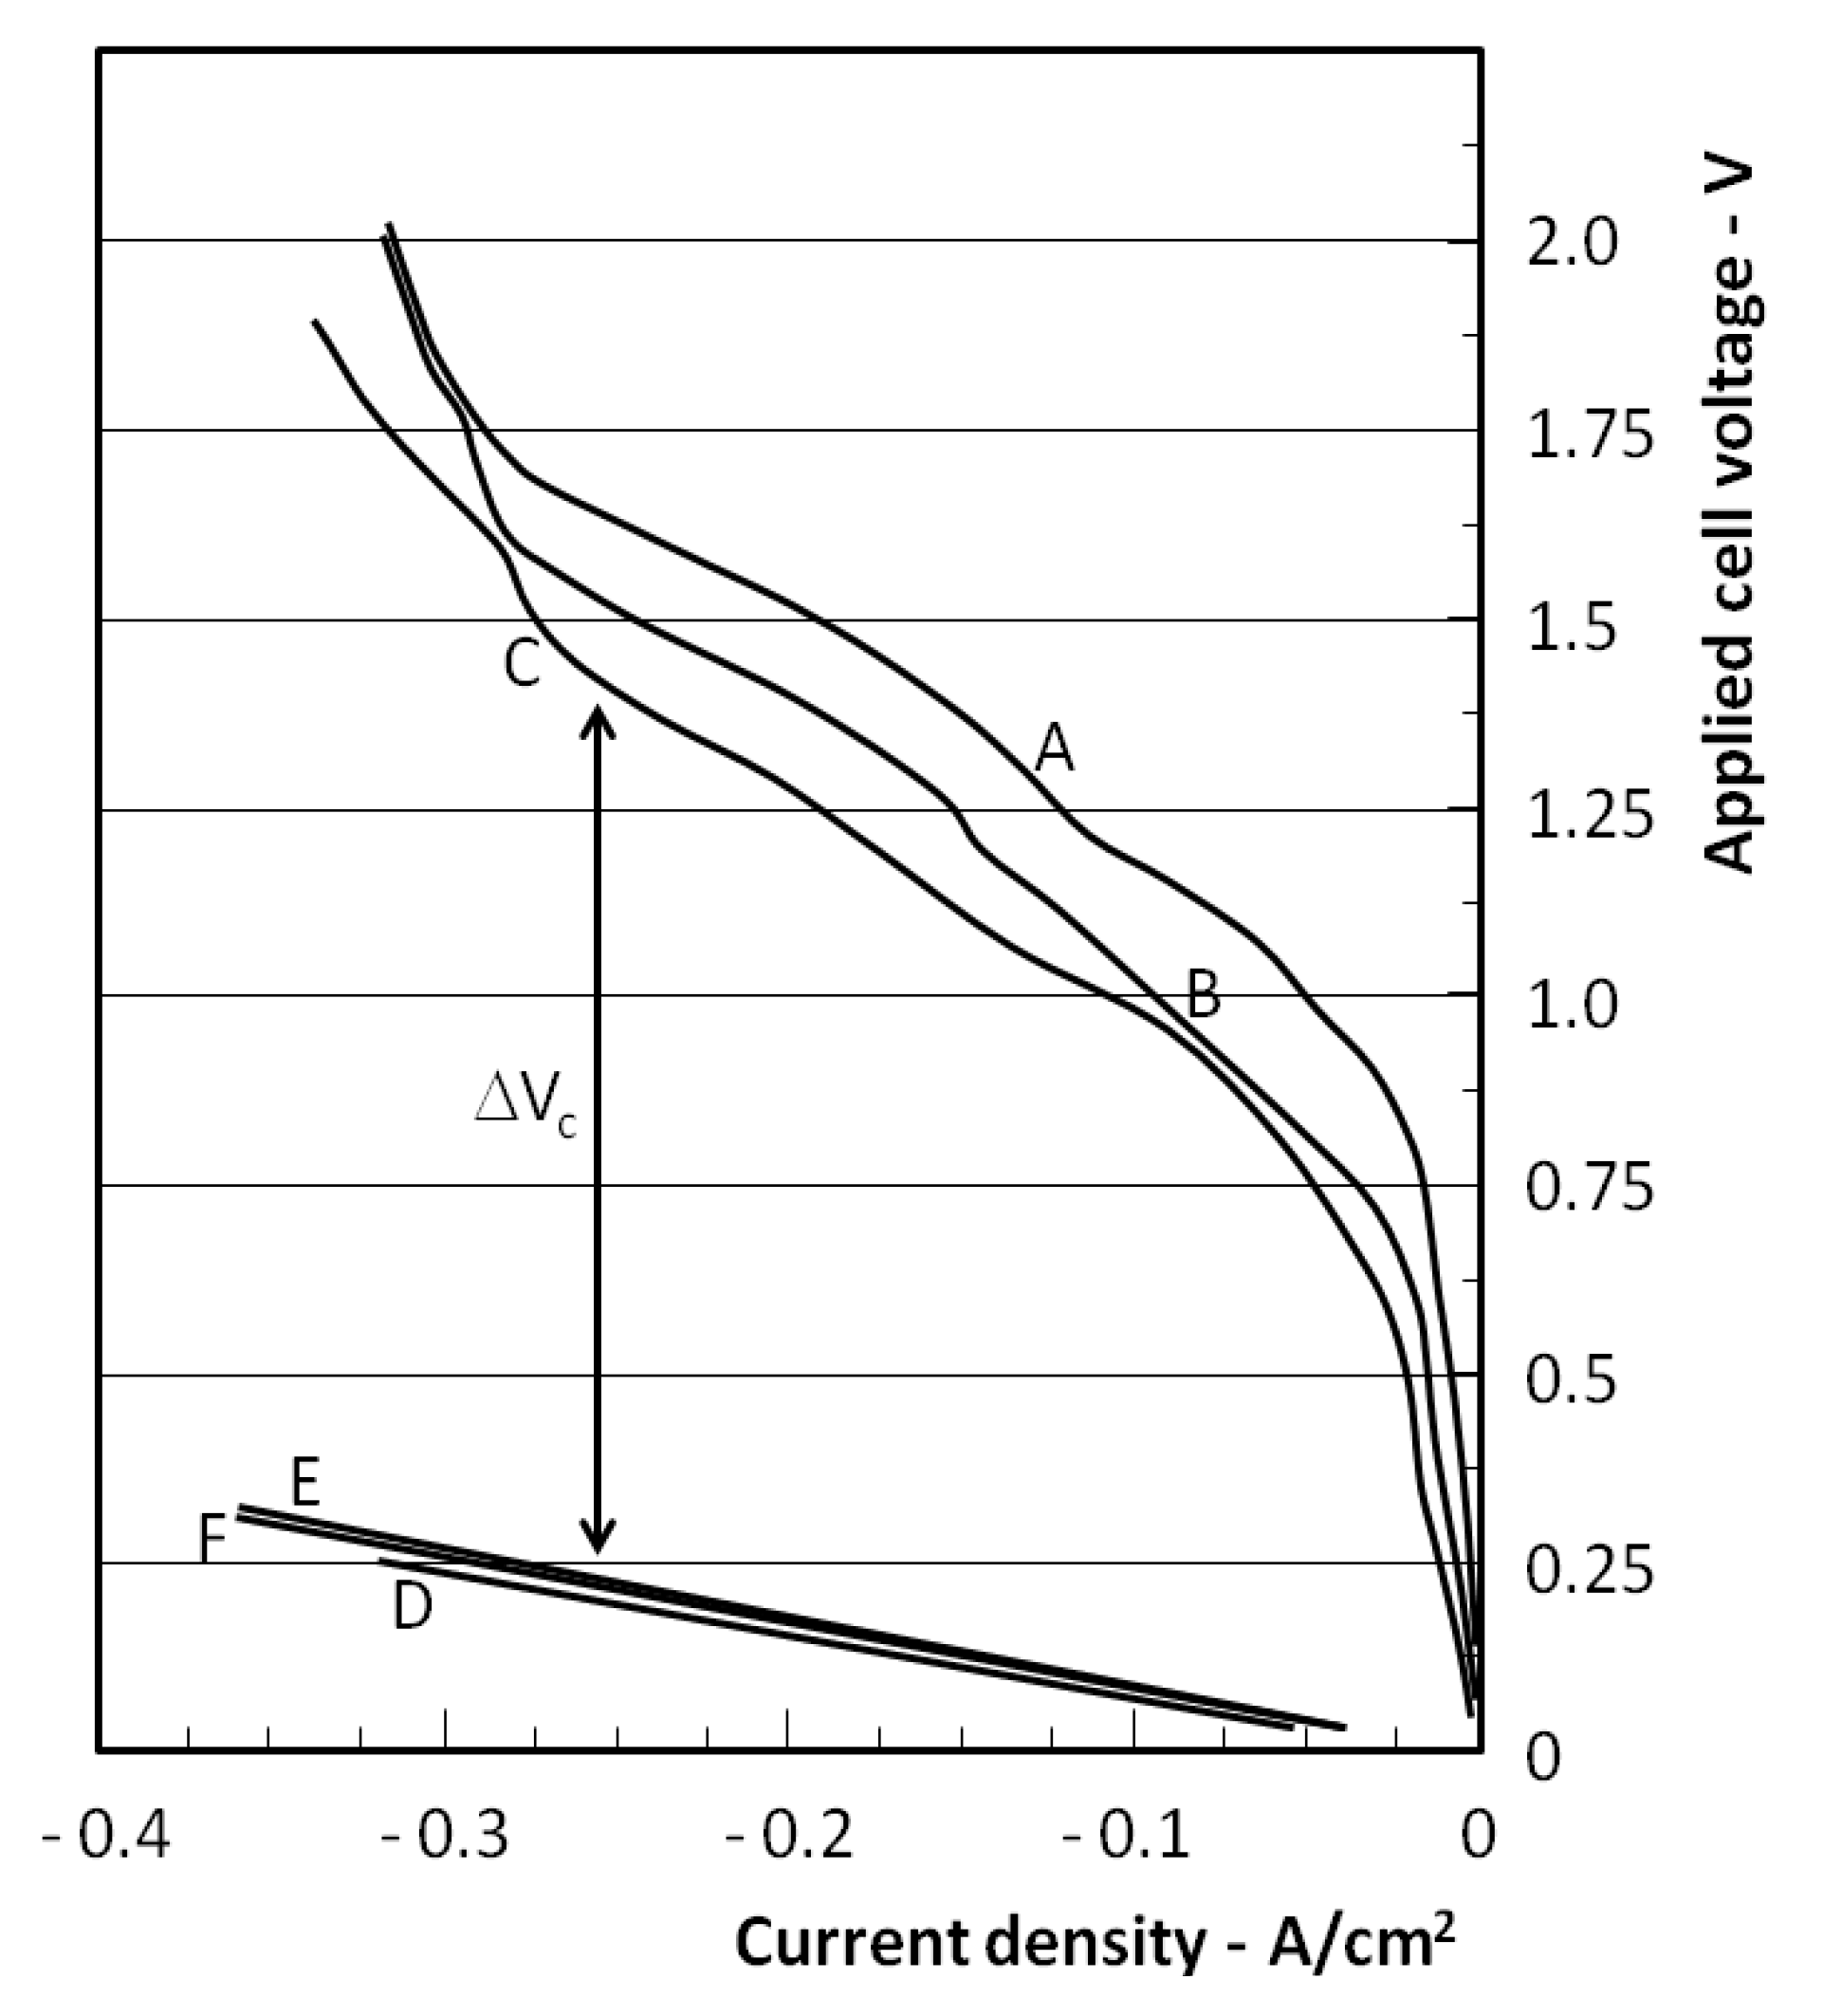
Figure 5 shows the combined results for the electrolysis cell (EC) and the carbon assisted electrolysis cell (CAEC). The EC results are shown at three temperatures of operation 700, 750 and 800 °C (curves A, B and C) and these show the variation of applied cell voltage and measured current density.
Figure 5.
Current density vs. applied voltage during electrolysis. A, B and C correspond to conventional electrolysis at 700, 750 and 800 °C respectively. D, E and F involve electrolysis with carbon at the anode, at 700, 750 and 800 °C respectively.
Figure 5.
Current density vs. applied voltage during electrolysis. A, B and C correspond to conventional electrolysis at 700, 750 and 800 °C respectively. D, E and F involve electrolysis with carbon at the anode, at 700, 750 and 800 °C respectively.

At voltages up to around 0.7 V, the current density is low and increases linearly due to zirconia electrical conductivity, while in the region of the 0.7–0.9 V threshold, the gradient of the curves increases indicating the onset of electrolysis. This is consistent with the expected electrolysis threshold behaviour at elevated temperature and is similar to the behaviour reported by others using the same SOFC materials [13]. At higher current densities, there is evidence of non-linear behaviour, which is attributed to mass transfer effects.
The operation of the CAEC configuration is represented by the curves D, E and F. Curve D was obtained at 700 °C by gradually increasing the applied voltage from 0 V. In some cases during this start up process, the current/voltage relationship would show some unstable behaviour in the region of 0–0.5 V applied to the cell. When the process stabilised, within a 1 min timescale, the current-voltage behaviour would then follow the curve D shown. It was then found that any further changes in voltage would result in current densities which fell on the curve D.
This behaviour is attributed to the onset of electrolysis and the resultant feedback contribution of the carbon oxidation to the driving force of the cell as oxide ion begins to arrive at the anode of the cell. The contribution of the carbon to the electrolysis cell voltage is indicated in Figure 5 as ΔVc. This is in the range 0.8–1.2 V and is consistent with the expected fuel cell voltage contribution associated with the carbon fuel cell. It is noted however, that this ΔVc value is larger than might be expected from the carbon fuel cell at the CAEC current densities used. For example, at 0.1A/cm2, the fuel cell voltage is around 0.7 V and is expected to be lower in the 0.2–0.3 A/cm2 range seen in Figure 5. An important difference with the CAEC system is the removal of the oxygen transformation step at the cathode of the cell (O2 + 4e− → 2O2−), where it is replaced by a water reduction step (H2O + 2e− → H2 + O2−). The oxygen transformation step is known to contribute to significant overvoltage losses (0.4–0.6V), depending on catalyst surface used, whereas the water or H+ reduction process carries a much lower voltage loss (less than 0.1 V). This may account for the fact that much of the open circuit voltage of the carbon fuel cell is available to transfer to the reduction in the electrolysis voltage at the higher current densities used. This may also provide an explanation for the negligible effect of temperature on the curves D–F, which suggest low activation energy processes are involved at both electrodes.
Curves E and F correspond to operation of the CAEC at 750 °C and 800 °C respectively and were obtained by reducing the applied cell voltage and corresponding current to −35 mA/cm2 with the system at 700 °C, and then raising the furnace temperature to the new target value. Raising the applied voltage levels at the target temperature resulted in the strongly linear behaviour shown by curves E and F, which were closely similar to that of curve D obtained following start up. This reduction of the required electrolysis voltage in the presence of carbon is similar to the reported reduction by 1 V using methane as the reducing fuel [6], as depicted in Equation (1).
The behaviour of the EC and CAEC systems can be compared with the predictions of the work of reference [8]. The cell processes in the present work are carried out between 973 and 1073 K compared to 1300 K for the work of reference [8], and the overall standard free energy changes in the lower temperature range are derived from:
C + H2O(g) = CO(g) + H2(g) ΔG° = −7.5 kJ/mol
C + 2H2O(g) = CO2(g) + 2H2(g) ΔG° = −10.4 kJ/mol
Based on the input steam pressure on the cathode side, and making an estimate for the average values of steam (0.25 atm), hydrogen produced (0.075 atm) and CO or CO2 (1 atm) on the anode side, an estimate can be made for the ENernst values for Equation (6) (0.08 V) and Equation (7) (0.05 V) for use with Equation (5).
For the EC operation shown in Figure 5, based on the approximately linear region of the curves, the average value of the ASR for the curves A, B and C is 2.5 Ωcm2, measured between the voltage values of 1.5 and 1.0 and the corresponding current values of −0.25 A and −0.05 A, whereas for the CAEC it is close to 0.83 Ωcm2.
The introduction of carbon on the anode side appears not only to reduce the required electrolysis voltage by around 1 V as expected, but also to significantly reduce the ASR value of the cell, since the cathode side of the cell is the same in both cases. It is noted that the measured ASR values are those for the overall cell and that differences in the electrode processes may have an effect on the resulting values. For the EC, the electrodes employ a Ni/cermet on the hydrogen side and LSM on the oxygen release side, whereas for the CAEC, Ni/cermet is used on both sides. Other studies [13,14] have reported similar ASR values as the present work for the overall cells and have also shown that high temperature electrolysis cells may show significantly different ASR values depending on whether they operate in electrolysis mode or fuel cell mode. The optimisation of the catalyst surfaces for the specific duties required will remain an active area of development for these systems.
Referring to Figure 5 it can be seen that the curves D, E and F, when extrapolated, intercept the voltage axis on the negative side. This corresponds to the open circuit condition (−i = 0), where Eapp = −ENernst and is consistent with the small and negative ΔG° values for Equations (6) and (7) and their corresponding −E° values at the temperature of operation. Due to their similar values it is not clear from the curve positions which of these dominates the anode reaction and will be the subject for further study.
4. Carbon Energy Requirements
The impact of the use of a CAEC system is likely to arise through the energy savings of the primary fossil fuel source and therefore a comparison of the conventional high temperature EC and CAEC systems from this point of view is a useful one to make. The electrolysis systems cannot operate at the minimum thermodynamic voltage since this corresponds to almost zero current and the practical operation voltages can be identified from the many works published in the area of solid oxide electrolysis cells. Examples of such reported work [13,14] indicate that, at 800 °C, typical current densities are 0.2 A/cm2 and operational voltages are 1.3 V. Based on the present work, the direct contribution of the carbon in the cell means that the corresponding operational voltage can be set at 0.4 V. These values are sufficient to enable a comparison of the carbon energy (input to the power station and the CAEC) required to achieve a fixed volume of hydrogen, and Table 1 collects together the key energy parameters for the production of 1 m3 of hydrogen at standard conditions.

Table 1.
Comparison of the primary carbon fuel required to produce 1 m3 of hydrogen at standard conditions for the EC and CAEC systems operating at 800 °C. Carbon fuel energy is taken as 33 MJ/kg.
| Operating parameters | EC system | CAEC system | Units |
|---|---|---|---|
| Moles of H2 /m3 | 44.62 | Moles | |
| Operating current | 0.20 | A | |
| Applied voltage | 1.30 | 0.40 | V |
| Direct electrical power | 0.26 | 0.08 | W |
| Electrical energy/m3 H2 | 3.11 | 0.94 | kWh |
| Source carbon energy at 40% electrical production efficiency | 7.77 | 2.39 | kWh |
| Additional cell carbon | - | 0.27 | kg |
| Cell carbon energy/m3 H2 | - | 2.45 | kWh |
| Total carbon energy used/m3 H2 | 7.77 | 4.84 | kWh |
It can be seen from the table that the CAEC system uses only 62% of the primary carbon fuel compared to the conventional EC system, which will have cost and CO2 emissions implications.
Reference has been made to the analysis provided by Manage et al. [4], which provides a comprehensive review of the relationship between solid oxide electolyser operating parameters and the cost of hydrogen production by steam electrolysis. A key conclusion from this work is the importance of the cost contributions to hydrogen of natural gas in the case of steam reforming (SMR) and electricity in the case of electrolysis. For SMR, the cost of hydrogen is US$2.50/kg which is equivalent to US¢7.5/kWh, whereas the lowest cost of electricity for electrolysis is around US¢4/kWh.
When high temperature electrolysis is used, the energy cost savings associated with the use of a CAEC versus an EC system can be calculated, based on the data from reference [4]. For the EC system the electrical energy cost/m3 of hydrogen is US¢12.44/m3 (3.11 × US¢4). Based on coal costs of US$65/tonne for low sulphur coal (30 MJ/kg, 8.33kWh/kg), then for the CAEC system, the electricity and carbon energy costs are calculated as US¢5.52/m3 (0.94 × US¢4 + 0.27 × US¢6.5). This cost saving reflects both the reduced amount of electricity used and the lower cost of the substitute carbon fuel used directly in the cell.
5. Conclusions
Carbon-assisted electrolysis has an equivalence to an electrochemical gasification process and has some advantages over conventional thermal gasification processes, in particular the automatic separation of products, which is particularly useful given the continued interest in CCS technologies, in which existing CO2 separation stages carry a severe energy penalty.
The demonstration has shown that existing solid oxide technologies are very able to handle carbon char within an EC configuration, providing the full thermodynamic advantage associated with the chemical energy of the carbon, and avoiding Carnot type losses associated with thermal routes to electricity generation.
From other reported works on carbon fuel cells, a wide range of carbons also become potential sources for gasification by this route, enabling a wider carbon ‘catchment area’ for the conversion of solid to gaseous fuels for use in gas turbines and combined cycles, where hydrogen is increasingly being used in combination with other gaseous fuels. Some tailoring of the products may also be possible based on the temperature of operation, since, at lower temperatures (below 1000 K) the H2/CO2 couple is favored while at higher temperatures the H2/CO pair is favored, offering a route to syngas. Although the large scale solid oxide technology is not yet available to take advantage of this cost saving, it is clear that further work in this area has potential benefits for the hydrogen and syngas markets.
References
- Brisse, A.; Schefold, J.; Zahid, M. High temperature water electrolysis in solid oxide cells. Int. J. Hydrogen Energy 2008, 33, 5375–5382. [Google Scholar] [CrossRef]
- Ni, M.; Leung, M.K.H.; Leung, D.Y.C. Technological development of hydrogen production by solid oxide elecrolyzer cell (SOEC). Int. J. Hydrogen Energy 2008, 33, 2337–2354. [Google Scholar] [CrossRef]
- Mingyi, L.; Bo, Y.; Jingming, X.; Jing, C. Thermodynamic analysis of the efficiency of high-temperature steam electrolysis for hydrogen production. J. Power Sources 2008, 177, 493–499. [Google Scholar] [CrossRef]
- Manage, M.N.; Hodgson, D.; Milligan, N.; Simons, S.J.R.; Brett, D.J.L. A techno-economic appraisal of hydrogen generation and the case for solid oxide electrolyser cells. Int. J. Hydrogen Energy 2011, 36, 5782–5796. [Google Scholar] [CrossRef]
- Pham, A.Q.; Wallman, H.; Glass, R.S. Natural Gas-Assisted Steam Electrolyzer. US Patent No. 6051125, April 2000. [Google Scholar]
- Martinez-Frias, J.; Pham, A.-Q.; Aceves, S.M. A natural gas-assisted steam electrolyzer for high-efficiency production of hydrogen. Int. J. Hydrogen Energy 2003, 28, 483–490. [Google Scholar] [CrossRef]
- Cao, D.; Sun, Y.; Wang, G. Direct carbon fuel cell: Fundamentals and recent developments. J. Power Sources 2007, 167, 250–257. [Google Scholar] [CrossRef]
- Gopalan, S.; Ye, G.; Pal, U.B. Regenerative, coal-based solid oxide fuel cell-electrolysers. J. Power Sources 2006, 162, 74–80. [Google Scholar] [CrossRef]
- Sensöz, S. Slow pyrolysis of wood barks from Pinus brutia Ten. and product composition. Bioresour. Technol. 2003, 89, 307–311. [Google Scholar] [CrossRef] [PubMed]
- Cherepy, N.J.; Krueger, R.; Fiet, K.J.; Jankowski, A.F.; Cooper, J.F. Direct conversion of carbon fuels in a molten carbonate fuel cell. J. Electrochem. Soc. 2005, 152, A80–A87. [Google Scholar] [CrossRef]
- Kouchachvili, L.; Ikura, M. Performance of a direct carbon fuel cell. Int. J. Hydrogen Energy 2011, 36, 10263–10268. [Google Scholar] [CrossRef]
- Li, X.; Zhu, Z.; de Marco, R.; Bradley, J.; Dicks, A. Evaluation of raw coals as fuel for direct carbon fuel cells. J. Power Sources 2010, 195, 4051–4058. [Google Scholar] [CrossRef]
- Yu, B.; Zhang, W.; Xu, J.; Chen, J. Status and research of highly efficient hydrogen production through high temperature steam electrolysis at INET. Int. J. Hydrogen Energy 2010, 35, 2829–2835. [Google Scholar] [CrossRef]
- Stoots, C.M.; O’Brien, J.E.; Condie, K.G.; Hartvigsen, J.J. High-temperature electrolysis for large-scale hydrogen production from nuclear energy—Experimental investigations. Int. J. Hydrogen Energy 2010, 35, 4861–4870. [Google Scholar] [CrossRef]
© 2013 by the authors; licensee MDPI, Basel, Switzerland. This article is an open access article distributed under the terms and conditions of the Creative Commons Attribution license (http://creativecommons.org/licenses/by/3.0/).
Share and Cite
MDPI and ACS Style
Ewan, B.C.R.; Adeniyi, O.D. A Demonstration of Carbon-Assisted Water Electrolysis. Energies 2013, 6, 1657-1668. https://doi.org/10.3390/en6031657
AMA Style
Ewan BCR, Adeniyi OD. A Demonstration of Carbon-Assisted Water Electrolysis. Energies. 2013; 6(3):1657-1668. https://doi.org/10.3390/en6031657
Chicago/Turabian StyleEwan, Bruce C.R., and Olalekan D. Adeniyi. 2013. "A Demonstration of Carbon-Assisted Water Electrolysis" Energies 6, no. 3: 1657-1668. https://doi.org/10.3390/en6031657