1. Introduction
Reducing the displacement of a spark-ignited (SI) engine reduces both engine friction [
1] and pumping [
2] losses in part-load engine operation. Since in every day driving as well as in various drive cycles the engine is mostly operated in part load, this measure reduces the overall fuel consumption. The combination of downsizing and turbocharging results in smaller engines with an improved fuel economy without compromising the maximum power. Numerous downsized and turbocharged engines are already available on the market. Ongoing developments in this technology will further exploit its CO
reduction potential [
3].
Turbocharged engines have slower response times than naturally aspirated engines, i.e., it takes more time until a demanded torque can be provided. This loss in driveability is due to the additional inertia that the turbocharger adds to the system and is a major drawback of downsized and turbocharged engines.
The turbo lag is a temporary lack of air in transients due to the low rotational speed of the turbocharger as present in part-load engine operation. There are several possibilities to deal with this problem. One possibility is to supply additional power to the drivetrain during the phase of the turbo lag, e.g., with an electric machine as in hybrid electric vehicles. Another possibility is to modify the turbocharging, e.g., by adding a second, smaller turbocharger to the system that has a lower inertia or by adding a compressor. A third possibility is to provide the air that cannot be delivered by the compressor by other means. In the research described in [
4] additional air was injected directly into the combustion chamber by an additional valve placed in the cylinder head. With the so-called in-cylinder boosting the response time thus was significantly reduced. However, placing an additional valve and a valve actuator in the cylinder head requires extensive and costly modifications thereof.
To compensate the turbo lag, additional air can also be injected into the intake manifold. In [
5] this approach is studied for heavy duty diesel engines. A significant improvement of the transient response by air injection into the intake manifold is reported in [
6] for a
diesel engine. In [
7] a
diesel engine is used. Air is injected either into the compressor or into the intake manifold or into both. The authors conclude that all three approaches can improve engine performance. Air injection into the compressor is also considered in [
8]. There the engine model of a medium speed diesel engine shows considerable improvements in transient response when applying air injection into the compressor at the onset of a load.
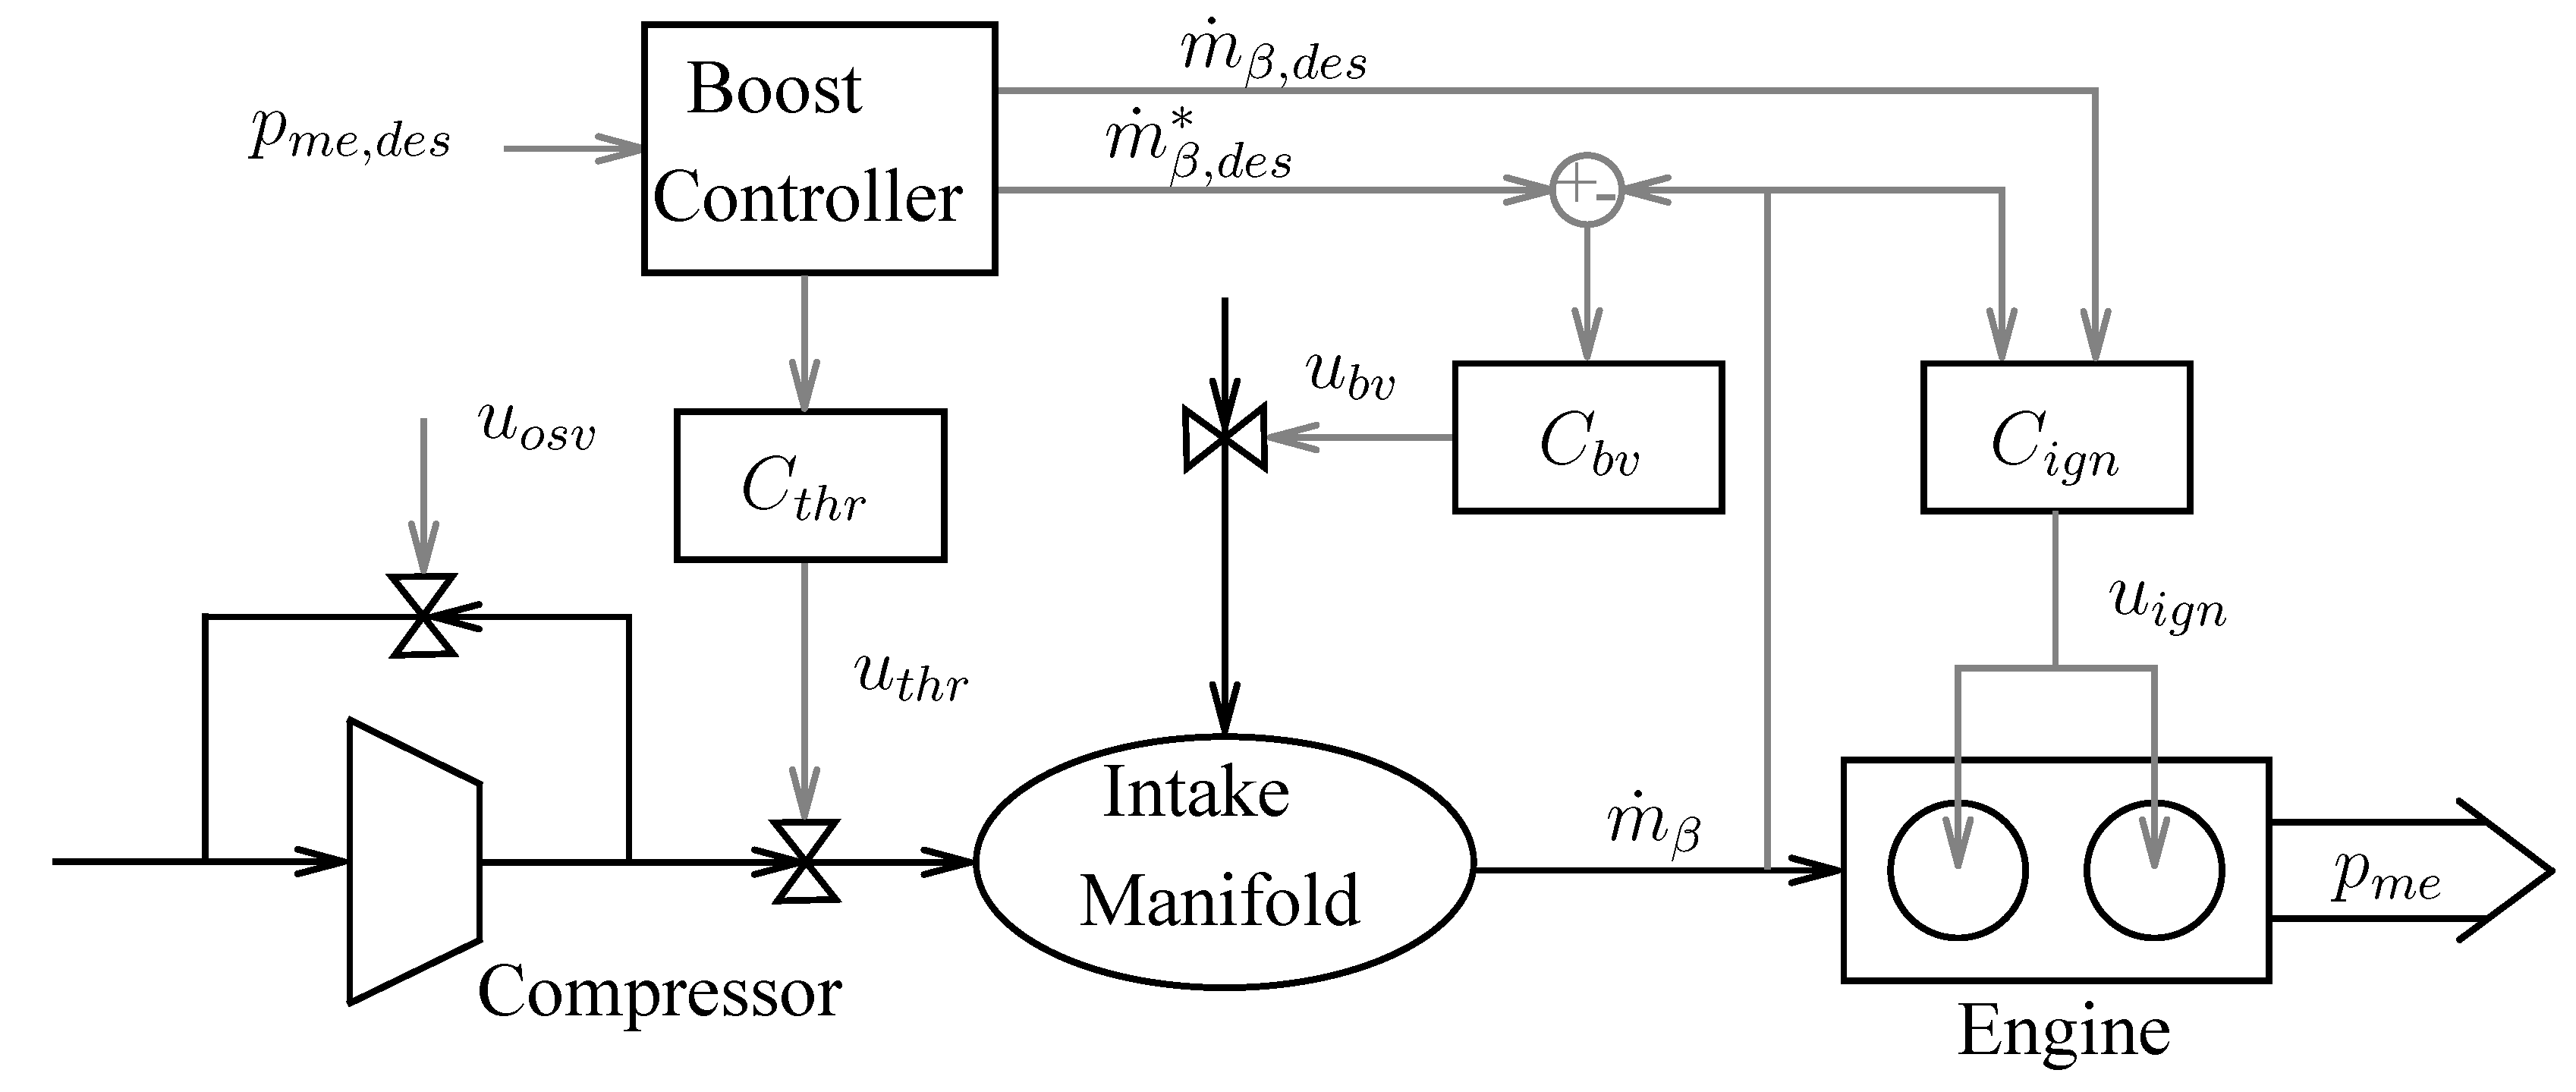
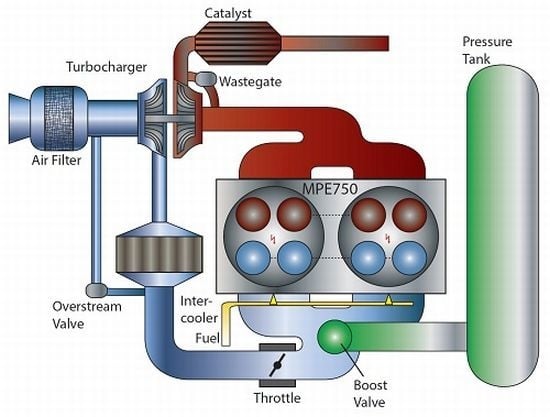
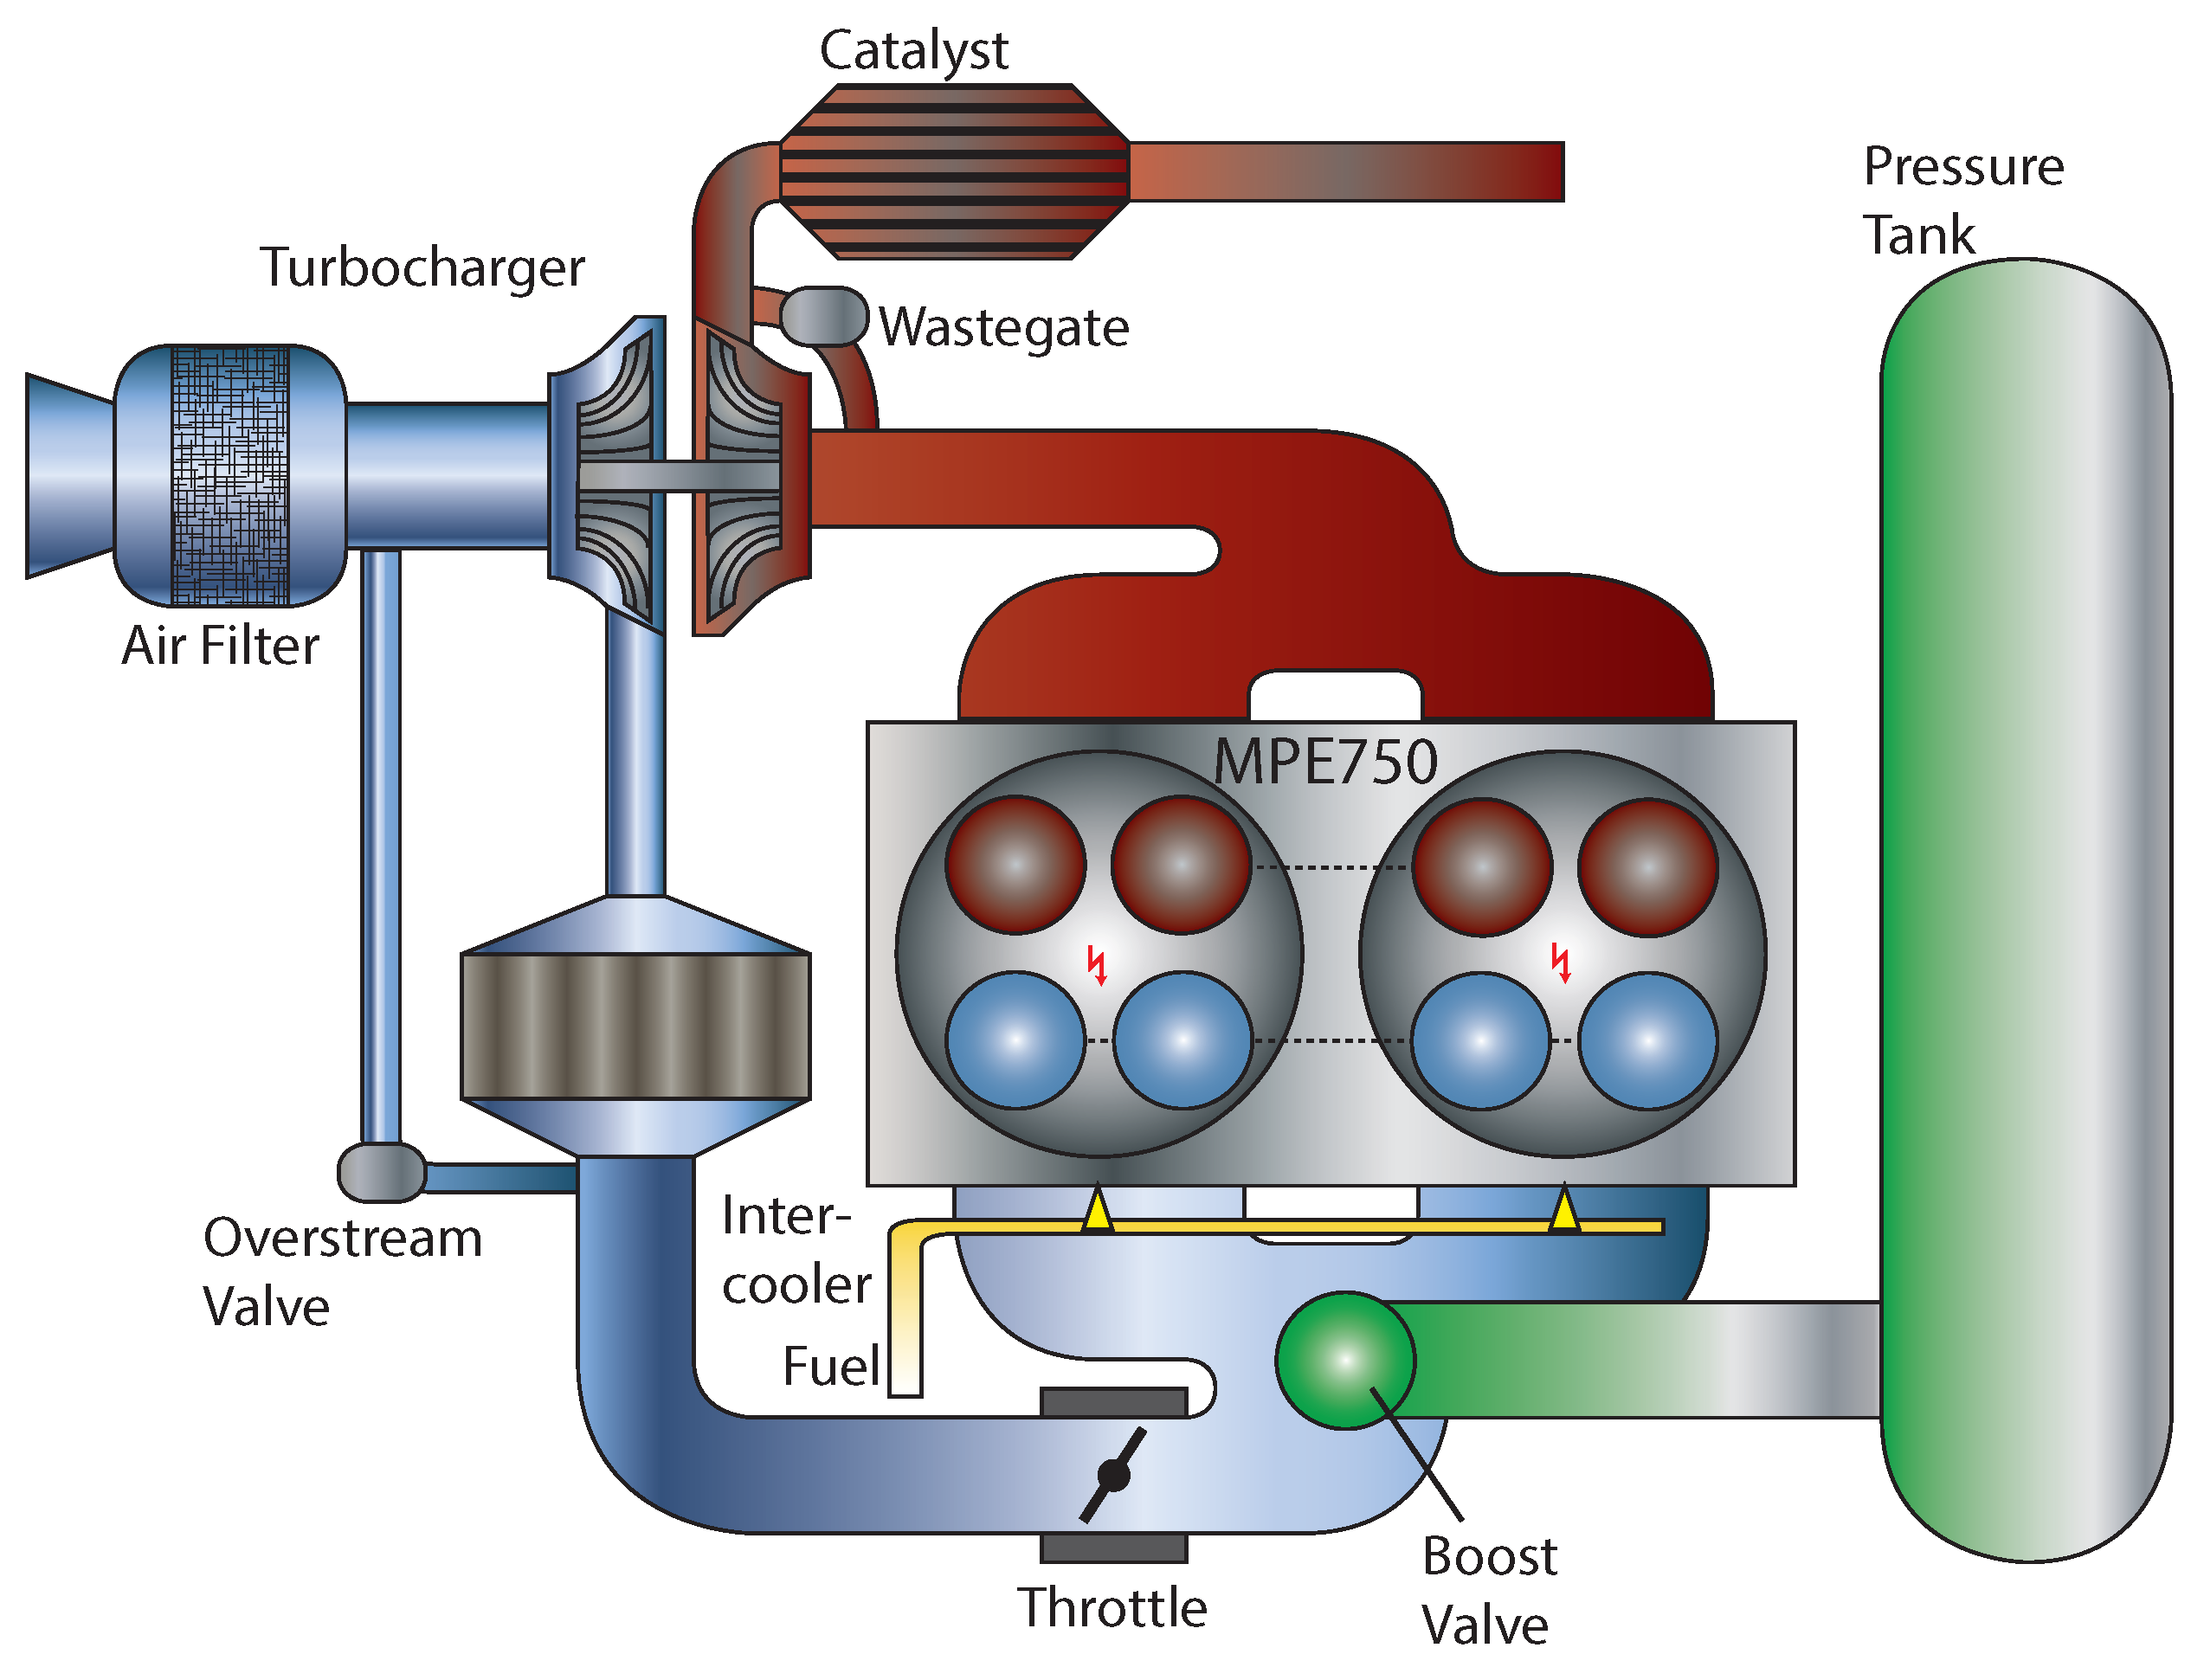
Figure 1 shows a schematic overview of an intake manifold boosting system. Using this approach, the well-established configuration of today’s turbocharged engines can remain almost unchanged. With this setup the intake manifold pressure can be increased during transients independently of the turbocharger speed. This turbo lag compensation method is referred to as intake manifold boosting. The air used can be made available by an external compressor. However, the filling of the pressure tank is not addressed in this paper. The focus of this paper is on intake manifold boosting of turbocharged SI engines. In contrast to diesel engines, SI engines are operated stoichiometrically, which poses a constraint on the control.
The paper is structured as follows. In
Section 2, the model is briefly discussed and a model-based system analysis is performed. Guidelines for the dimensioning of the boost valve are given as well. In
Section 3, the torque control problem is stated, a controller structure is proposed, and a torque control strategy is presented for the turbo lag compensation. In
Section 4, simulation results of turbo lag compensations are presented for various settings. In
Section 5, the feasibility and the transient performance are demonstrated on a test bench. Finally in
Section 6, the characteristics and the performance of intake manifold and in-cylinder boosting are compared.
Figure 1.
System structure of a turbocharged SI engine with intake manifold boosting. A pressure tank is connected to the intake manifold.
Figure 1.
System structure of a turbocharged SI engine with intake manifold boosting. A pressure tank is connected to the intake manifold.
2. Model-Based System Analysis
For the following investigations the same downsized and turbocharged SI engine is used as in [
9]. The basic parameters of the engine are listed in
Table 1.
Table 1.
Engine data.
| Parameter | Symbol | Value | Parameter | Symbol | Value |
|---|
| engine type | | gasoline SI | displacement | | |
| injection | | port fuel injection | bore, stroke | | |
| turbocharger | | Garrett GT12 | connecting rod | | |
| rated power | | at | compression ratio | ϵ | |
| rated torque | | at | number of cylinders | N | parallel twin |
For the simulation of intake manifold boosting, a mean value engine model (MVM) is used. The approach used to build the MVM is well described in [
10]. Several details on the modifications required for intake manifold boosting are given in the next subsection.
2.1. Mean Value Engine Model
Intake manifold boosting requires an inflow from the boost valve to the intake manifold. The boost valve is modeled as a compressible flow restriction. Furthermore a pressure tank is included in the model and connected to the boost valve. The throttle is modeled in a way that allows backflow out of the intake manifold. Since the first part of this work presents a potential study, no actuator dynamics are considered. Also the throttle is assumed to have no leakage when fully closed and the tank pressure remains constant.
The torque generation is modeled using the Willans approximation [
10]. For a stoichiometrically operated engine the mean effective pressure
is calculated by
where
is an efficiency term depending on the engine speed
,
is the lower heating value of the fuel,
is the engine displacement,
is the stoichiometric air-to-fuel mass ratio,
represents the air mass flow from the intake into the engine,
accounts for friction losses and pumping losses, and
represents the ignition efficiency depending on the retardation
of the ignition angle from the ignition angle that yields the maximum brake torque (MBT ignition angle). The terms torque and mean effective pressure are used interchangeably in this paper.
The engine is approximated as a volumetric pump. A typical formulation for the air mass flow through a four-stroke engine is
where
denotes the volumetric efficiency of the engine,
is the intake manifold pressure,
R is the gas constant of air,
is the intake manifold temperature and
is the engine displacement.
2.2. System Dynamics
In this section the system dynamics with intake manifold boosting are studied. When the boost valve is opened, air flows into the intake manifold and the pressure rises. If the throttle is open, the pressure downstream of the compressor also rises and possibly drives the compressor into surge. If the throttle remains closed, there is no outflow from the manifold downstream of the compressor, and surge can also occur. However, to prevent surge, an additional valve called overstream valve is installed, which connects the outlet of the compressor with its inlet (see
Figure 1). With an appropriate controller, surge can be avoided by controlling the pressure through the actuation of the overstream valve. With this architecture the surge avoidance control and the boost control can be decoupled.
For the boosting process the intake manifold dynamics are important. For an adiabatic intake manifold and a closed throttle, the intake manifold dynamics during the boosting process become
where
κ represents the heat capacity ratio of air,
is the volume of the intake manifold,
is the mass flow through the boost valve, and
is the tank temperature.
Equation (4) clearly shows that for a given boost valve mass flow, the intake manifold pressure increases faster at lower engine speeds. The torque build-up thus is also faster at lower engine speeds where the turbo lag is more pronounced. This is advantageous for a turbo lag compensation system.
2.3. Dimensioning of the Boost Valve
The flow through the boost valve is assumed to be isentropic and is thus calculated by
where Ψ is the flow function,
is the boost valve control signal, and
is the effective flow area, which combines the geometric area and the discharge coefficient.
As a result of the closed throttle, the boost valve has to supply the complete engine mass flow during the entire boosting process. Hence, the engine operating point with the highest engine speed and the highest engine load to which boosting is conducted should be used to size the boost valve. This engine speed can be chosen by considering below which engine speed the turbo lag becomes a problem for the particular engine. Thus, in this work the maximum boost valve mass flow is chosen to be equal to the engine mass flow
at the operating point 4000 rpm and 17 bar mean effective pressure, which is close to full load. By setting Equation (
5) equal to
, appropriate values for the valve size and the tank pressure can be found.
Following the described design procedure, the boost valve is sized using a criterion that depends on the specific operating parameters, i.e., engine speed and engine load, of a defined engine. Therefore this design procedure is suitable for various types and sizes of engines.
3. Control Strategy
In this section the control problem is formulated, the controller structure is presented and the individual controllers are discussed. The section ends with the presentation of a control strategy.
3.1. Formulation of the Control Problem
The purpose of the controller is to cause the engine to quickly reach a desired torque and maintain it. Since the throttle remains closed during the intake manifold boosting process, as discussed in
Section 2.2, two actuators are involved in the torque control, which are:
the boost valve opening : It can increase or decrease the torque by varying the air mass flow into the intake manifold and hence the engine air mass flow. This takes place within several engine cycles due to the intake manifold dynamics. It is limited by the maximum boost valve mass flow;
the ignition angle : It can only decrease the torque and this happens within less than one engine cycle. The ignition angle cannot be arbitrarily delayed due to the occurrence of ignition failures.
An engine air mass flow that is too high can be counterbalanced by a reduced ignition efficiency, as indicated in Equation (
1). Thus, the solution to the control problem is not unique.
3.2. Controller Structure
The controller structure shown in
Figure 2 comprises four controllers. During a boosting process, the boost valve controller and the ignition controller are required. The controller structure also includes a throttle controller and an overstream valve controller, as mentioned earlier. The throttle controller is only used in steady-state operation and during slow transients. If the operating point of the compressor moves beyond the surge line, the overstream valve controller is used to reduce the pressure downstream of the compressor. This pressure is referred to as boost pressure
. In this work the wastegate is closed at all times. Hence, no wastegate controller is used.
Figure 2.
Controller structure.
Figure 2.
Controller structure.
3.3. Boost Valve Controller
The boost valve is used to control the engine air mass flow during boosting. The mass flow necessary to maintain a desired torque is
Inserting the maximum possible value for the ignition efficiency,
i.e.,
, yields the minimum engine air mass flow necessary to produce a desired torque
. This mass flow is referred to as
.
Operating the engine with a higher mass flow than
while reducing the ignition efficiency is referred to as overboosting. This leads to a reduced overall engine efficiency and hence to an increased fuel consumption. However, since the exhaust gas enthalpy is increased, a faster acceleration of the turbocharger can be achieved. This effect is advantageous in terms of the amount of pressurized air used during the turbo lag compensation, as will be shown in
Section 4.3.
To quantify the degree of overboosting, an overboosting factor
is introduced. It is defined as
where
is the mass flow the boost valve has to supply.
The boost valve controller determines the effective flow area required to realize the engine air mass flow
. It comprises a feed-forward path, which consists of the inversion of Equation (
5), and a feedback path, which eliminates the error
.
3.4. Ignition Controller
The ignition controller is used to reduce the ignition efficiency whenever the engine air mass flow is higher than
to prevent an overshoot of the torque. The required ignition efficiency is calculated as follows:
According to [
10], the required retardation of the ignition angle to achieve a desired ignition efficiency is obtained as follows:
where
depends on the engine design and is independent of the operating point of the engine [
11].
A very low ignition efficiency leads to a large retardation of the ignition angle. This may lead to ignition failure on the real engine. For this work, ignition efficiencies lower than are avoided. Hence, overboosting is limited. With Equations (7) and (8), the maximum overboosting factor is found to be .
3.5. Control Strategy
When a step in the desired torque occurs, the throttle closes. The load is then controlled by the boost valve controller and the ignition controller. The boost valve supplies the mass flow to the engine. To prevent an overshoot of the torque the ignition controller delays the ignition angle. When a certain threshold turbocharger speed is reached, the boost valve is closed and the intake manifold pressure decreases. Once it reaches the value of the boost pressure, the throttle is opened and used to control the load again while the ignition angle is set back to the MBT ignition angle.
The value of the threshold turbocharger speed
is found iteratively and is calculated as a fraction
of the steady-state turbocharger speeds before the load step,
, and after the load step
The possibility of opening the throttle at the step time and letting the intake manifold pressure increase to ambient pressure and then closing it again to start boosting is neglected here. To enable this process a very fast throttle actuator would be necessary. The throttle used on the test bench is too slow to realize such a strategy.
4. Simulation Results and Discussion
In this section simulation results of the described control strategy are shown and discussed. After presenting the results for the turbo lag compensation, the topic of compressor surge is addressed. Finally, the influence of the overboosting factor is shown.
4.1. Turbo Lag Compensation
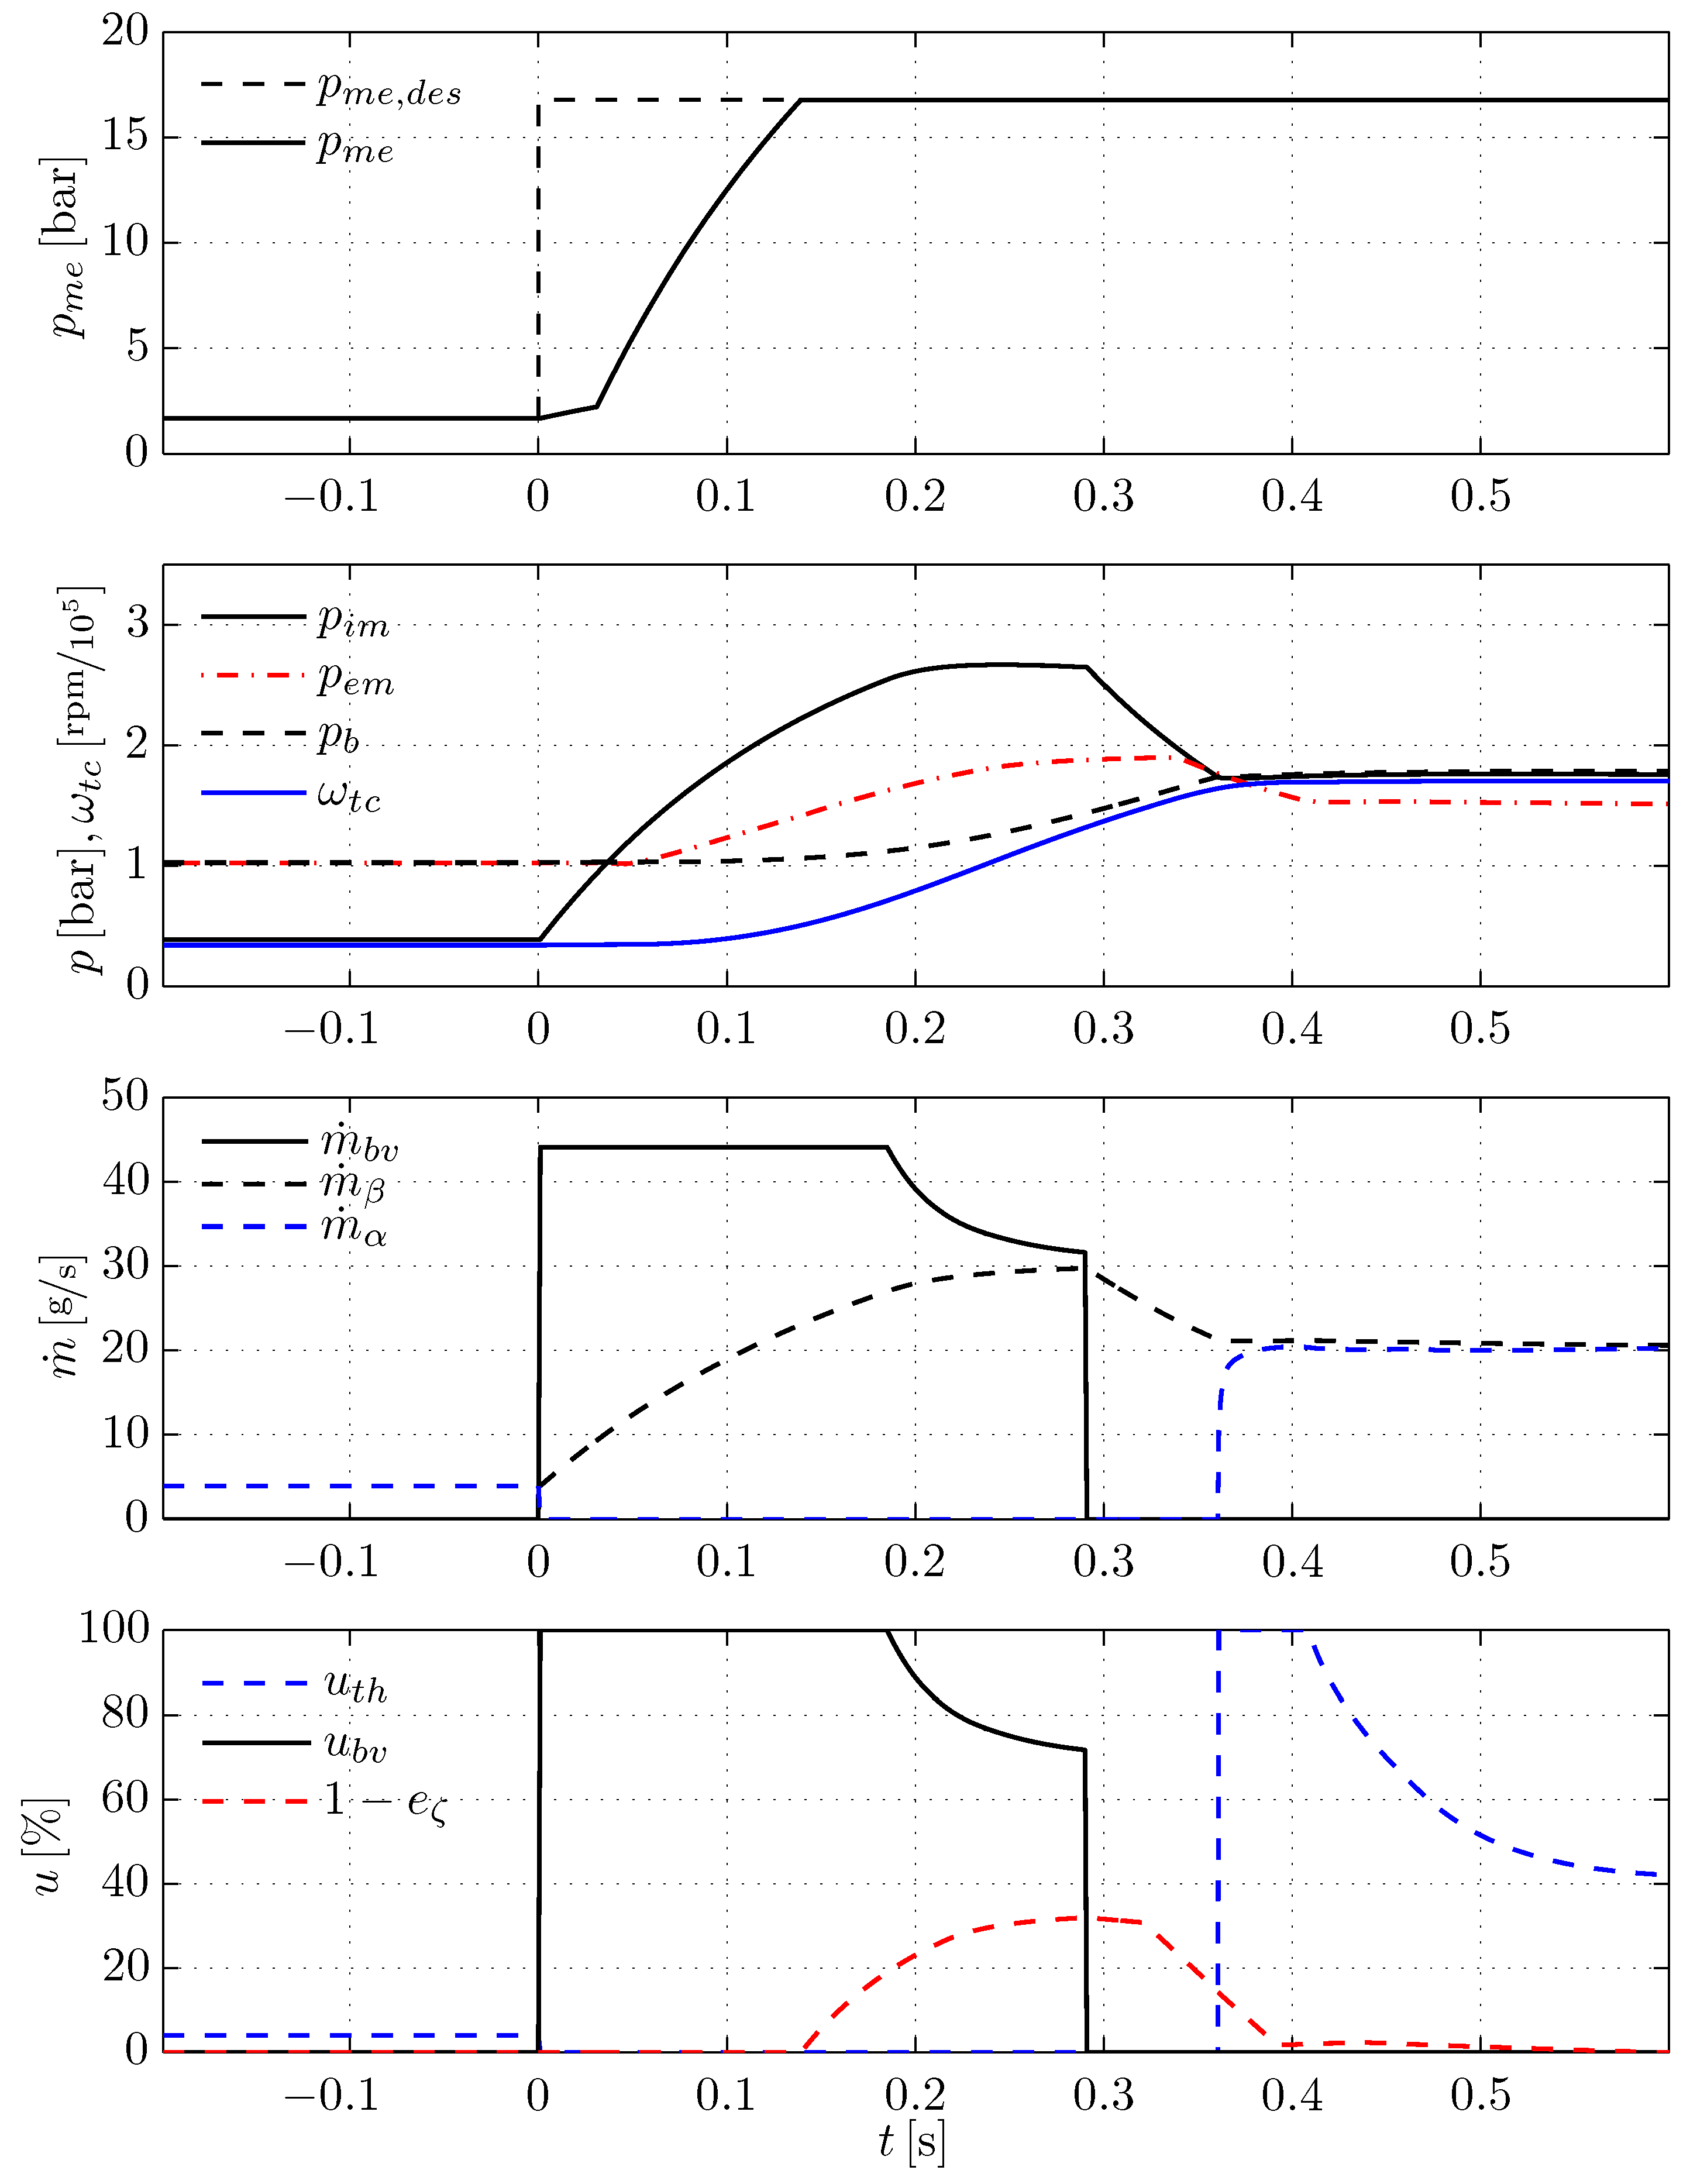
Figure 3 shows the results of the control strategy presented above for a load step from 1.7 bar to 16.7 bar mean effective pressure at 2000 rpm, with an overboosting factor of
. The first plot shows the trajectories of the desired and the actual mean effective pressure. The second plot shows the intake manifold pressure, the boost pressure
, the pressure before the turbine
and the turbocharger speed. In the third plot the boost valve mass flow
, the engine air mass flow
and the throttle mass flow
are shown. The bottom plot shows the control signals of the boost valve
and of the throttle
, and the reduction of the ignition efficiency
.
Figure 3.
Simulation of a turbo lag compensation with intake manifold boosting for a load step from 1.7 bar to 16.7 bar at 2000 rpm, with .
Figure 3.
Simulation of a turbo lag compensation with intake manifold boosting for a load step from 1.7 bar to 16.7 bar at 2000 rpm, with .
When a step in the torque demand occurs the throttle closes and the boost valve is opened. As a result the intake manifold pressure and the torque rise. The boost valve remains completely open until the engine mass flow has reached the value of . As a result of the overboosting the intake manifold pressure becomes substantially higher than its steady-state value after the load step. Once the desired torque is reached at , the engine air mass flow is higher than necessary. Hence, the ignition efficiency is reduced to prevent an overshoot of the torque. At the threshold turbocharger speed is reached and thus the boost valve is closed. Until there is no inflow to the intake manifold, and its pressure decreases. Once the intake manifold pressure is equal to the boost pressure, the throttle opens and takes over the torque control.
The amount of air used during the boosting process
is equal to the integral of the boost valve mass flow:
The speed-up of the turbocharger is very fast because of the high exhaust gas enthalpy. On one hand, this is due to the increased exhaust gas mass flow resulting from overboosting. On the other hand, the reduced ignition efficiency increases the exhaust gas temperature.
The torque rises very quickly, which may lead to oscillations in the drivetrain. These oscillations should be avoided because they can cause high mechanical stress [
12]. The rise time can be decreased by reducing the boost valve mass flow at the beginning of the boosting process or by retarding the ignition angle during the torque rise. A combination of both approaches is also possible.
4.2. Compressor Surge
In this section, compressor surge is analyzed. Since the compressor mass flow
is released into a receiver that has no outflow, surge might occur.
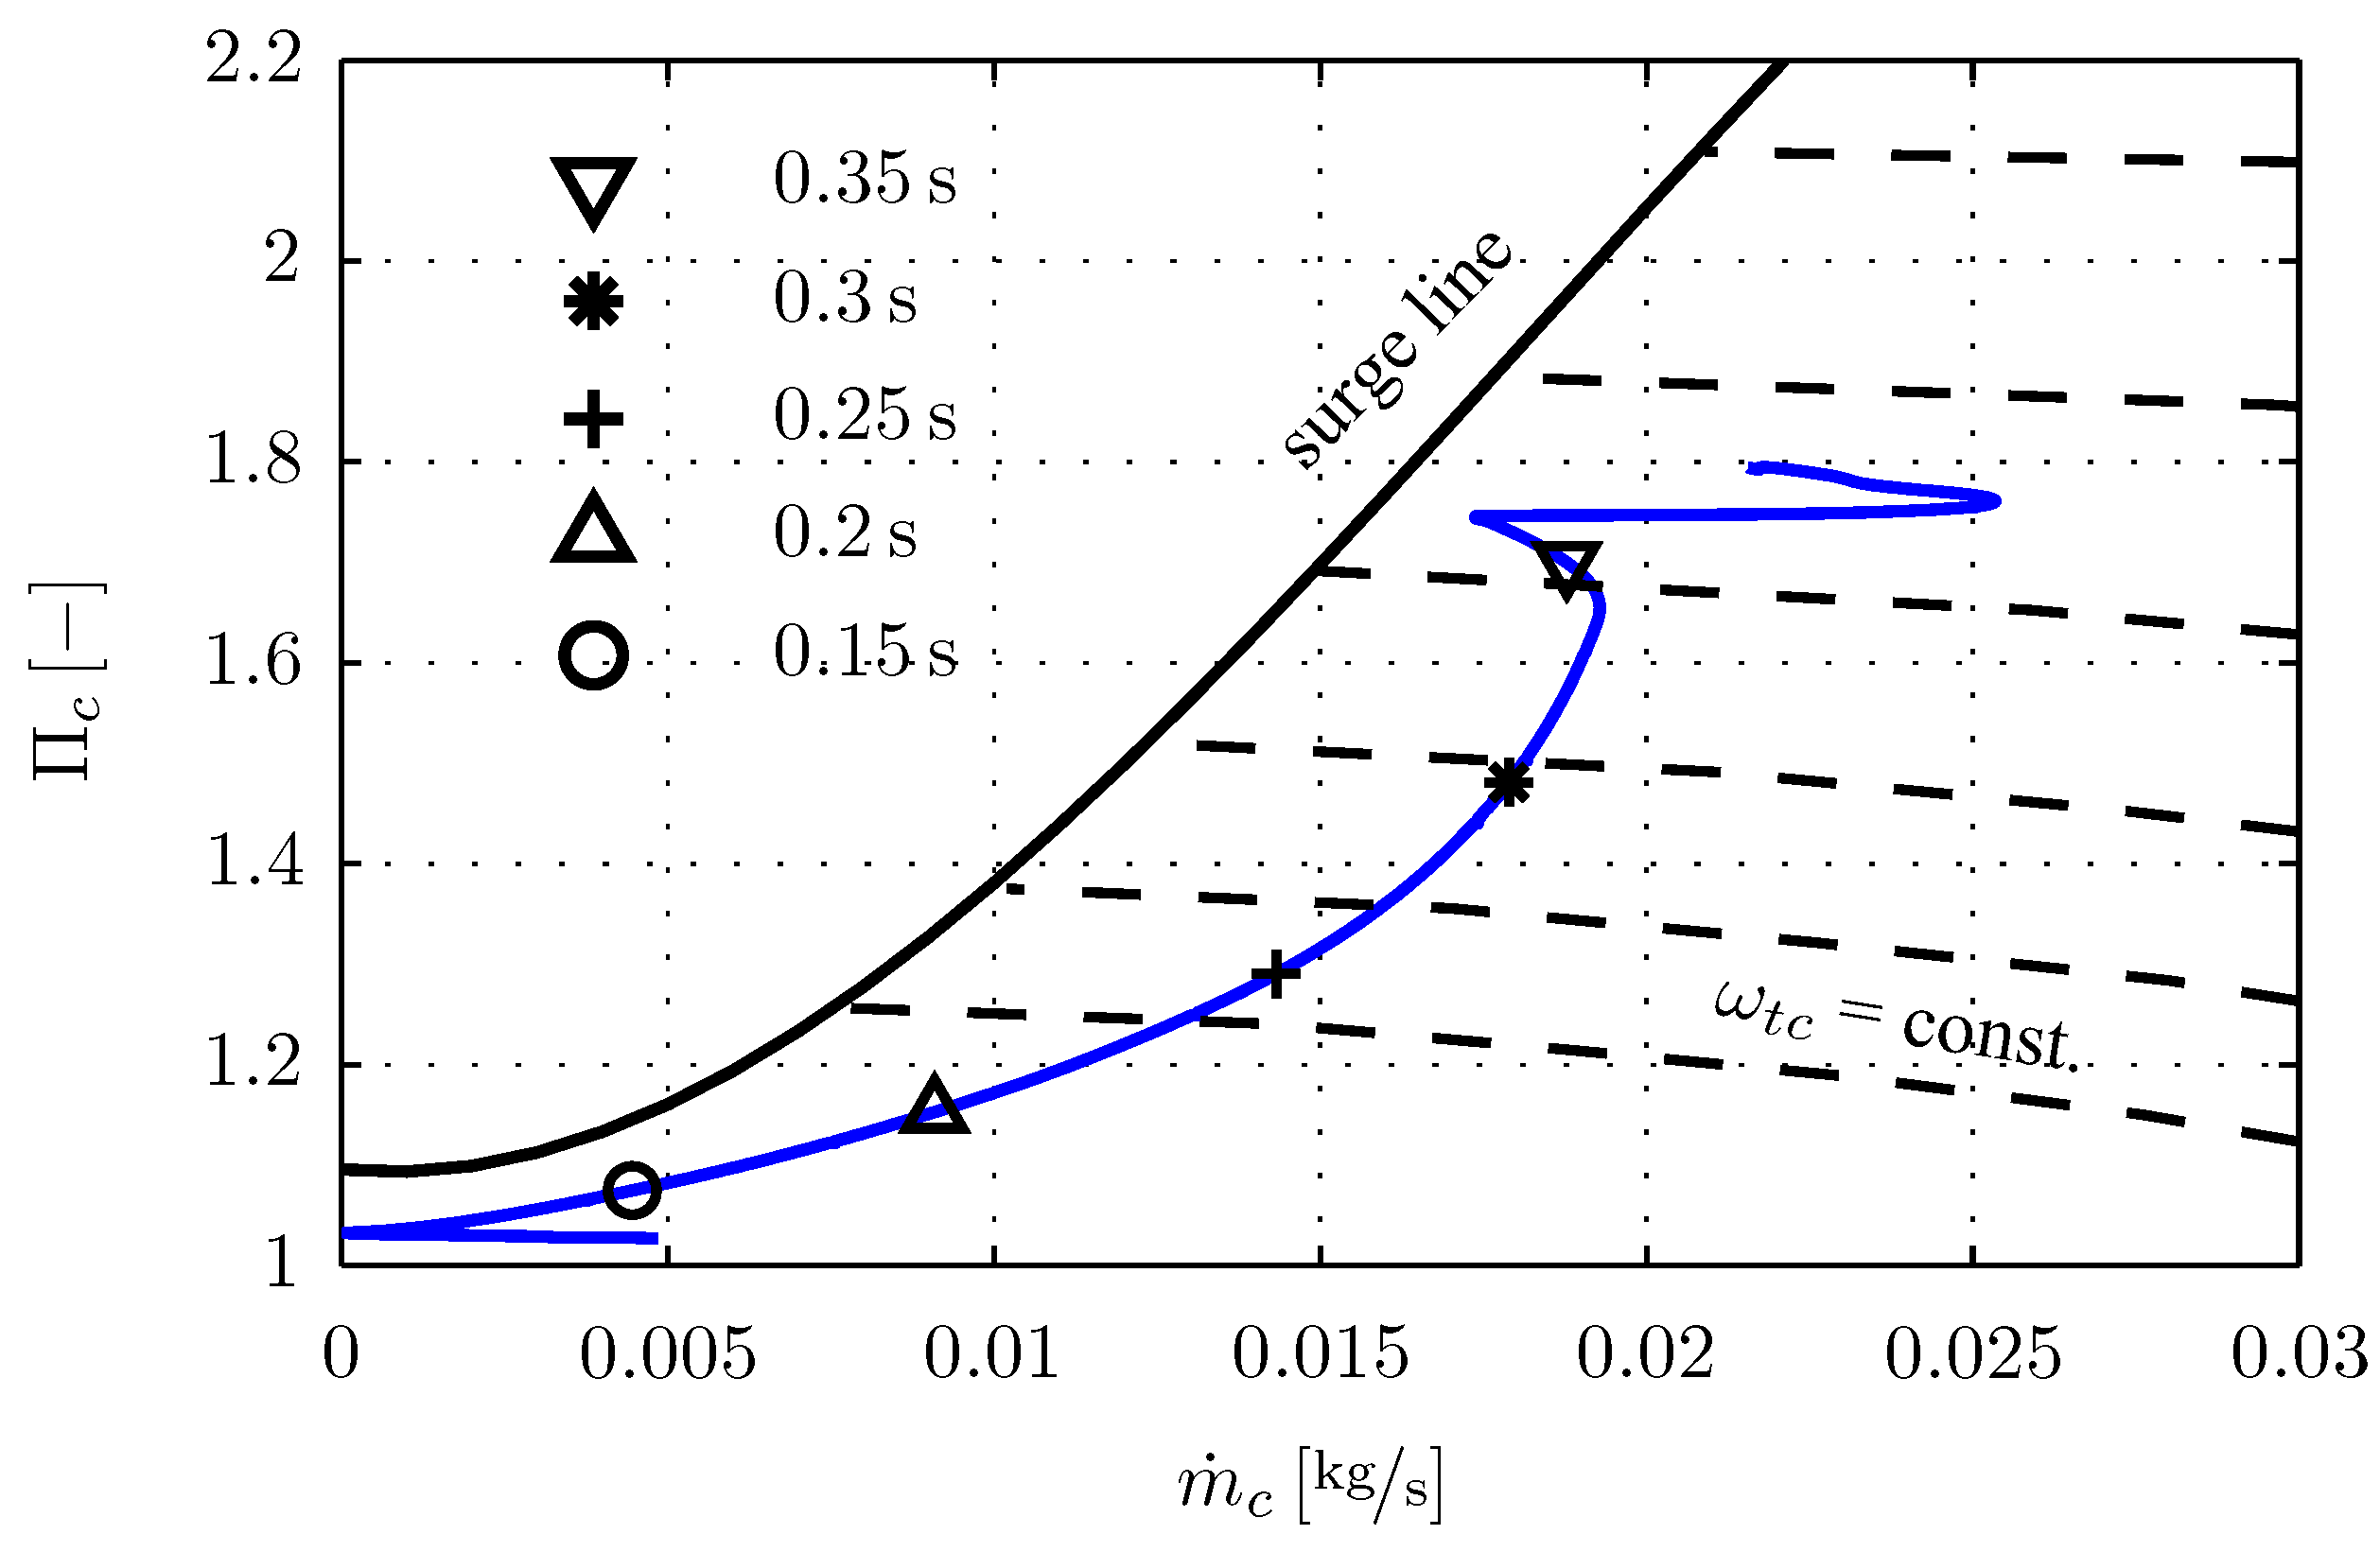
Figure 4 shows the trajectory of the compressor operating points during the boosting process. The variable
denotes the pressure ratio across the compressor. The overstream valve remains closed during the entire boosting process.
Figure 4.
Trajectory of the compressor operating point in simulation during a load step with intake manifold boosting from 1.7 bar to 16.7 bar at 2000 rpm. The markers indicate the time elapsed after the load step.
Figure 4.
Trajectory of the compressor operating point in simulation during a load step with intake manifold boosting from 1.7 bar to 16.7 bar at 2000 rpm. The markers indicate the time elapsed after the load step.
Since the surge line is never crossed, surge does not occur. On one hand, this can be explained by the rapid speed-up of the turbocharger, which leads to a short duration of the throttle being closed. On the other hand, the relatively large volume of the receiver between compressor and throttle () allows a slow enough increase of the pressure ratio. Increasing moves the trajectory of the operating point further away from the surge line and vice versa.
4.3. Overboosting and Air-Fuel Trade-off
Overboosting leads to a high exhaust enthalpy and thus to a fast speed-up of the turbocharger.
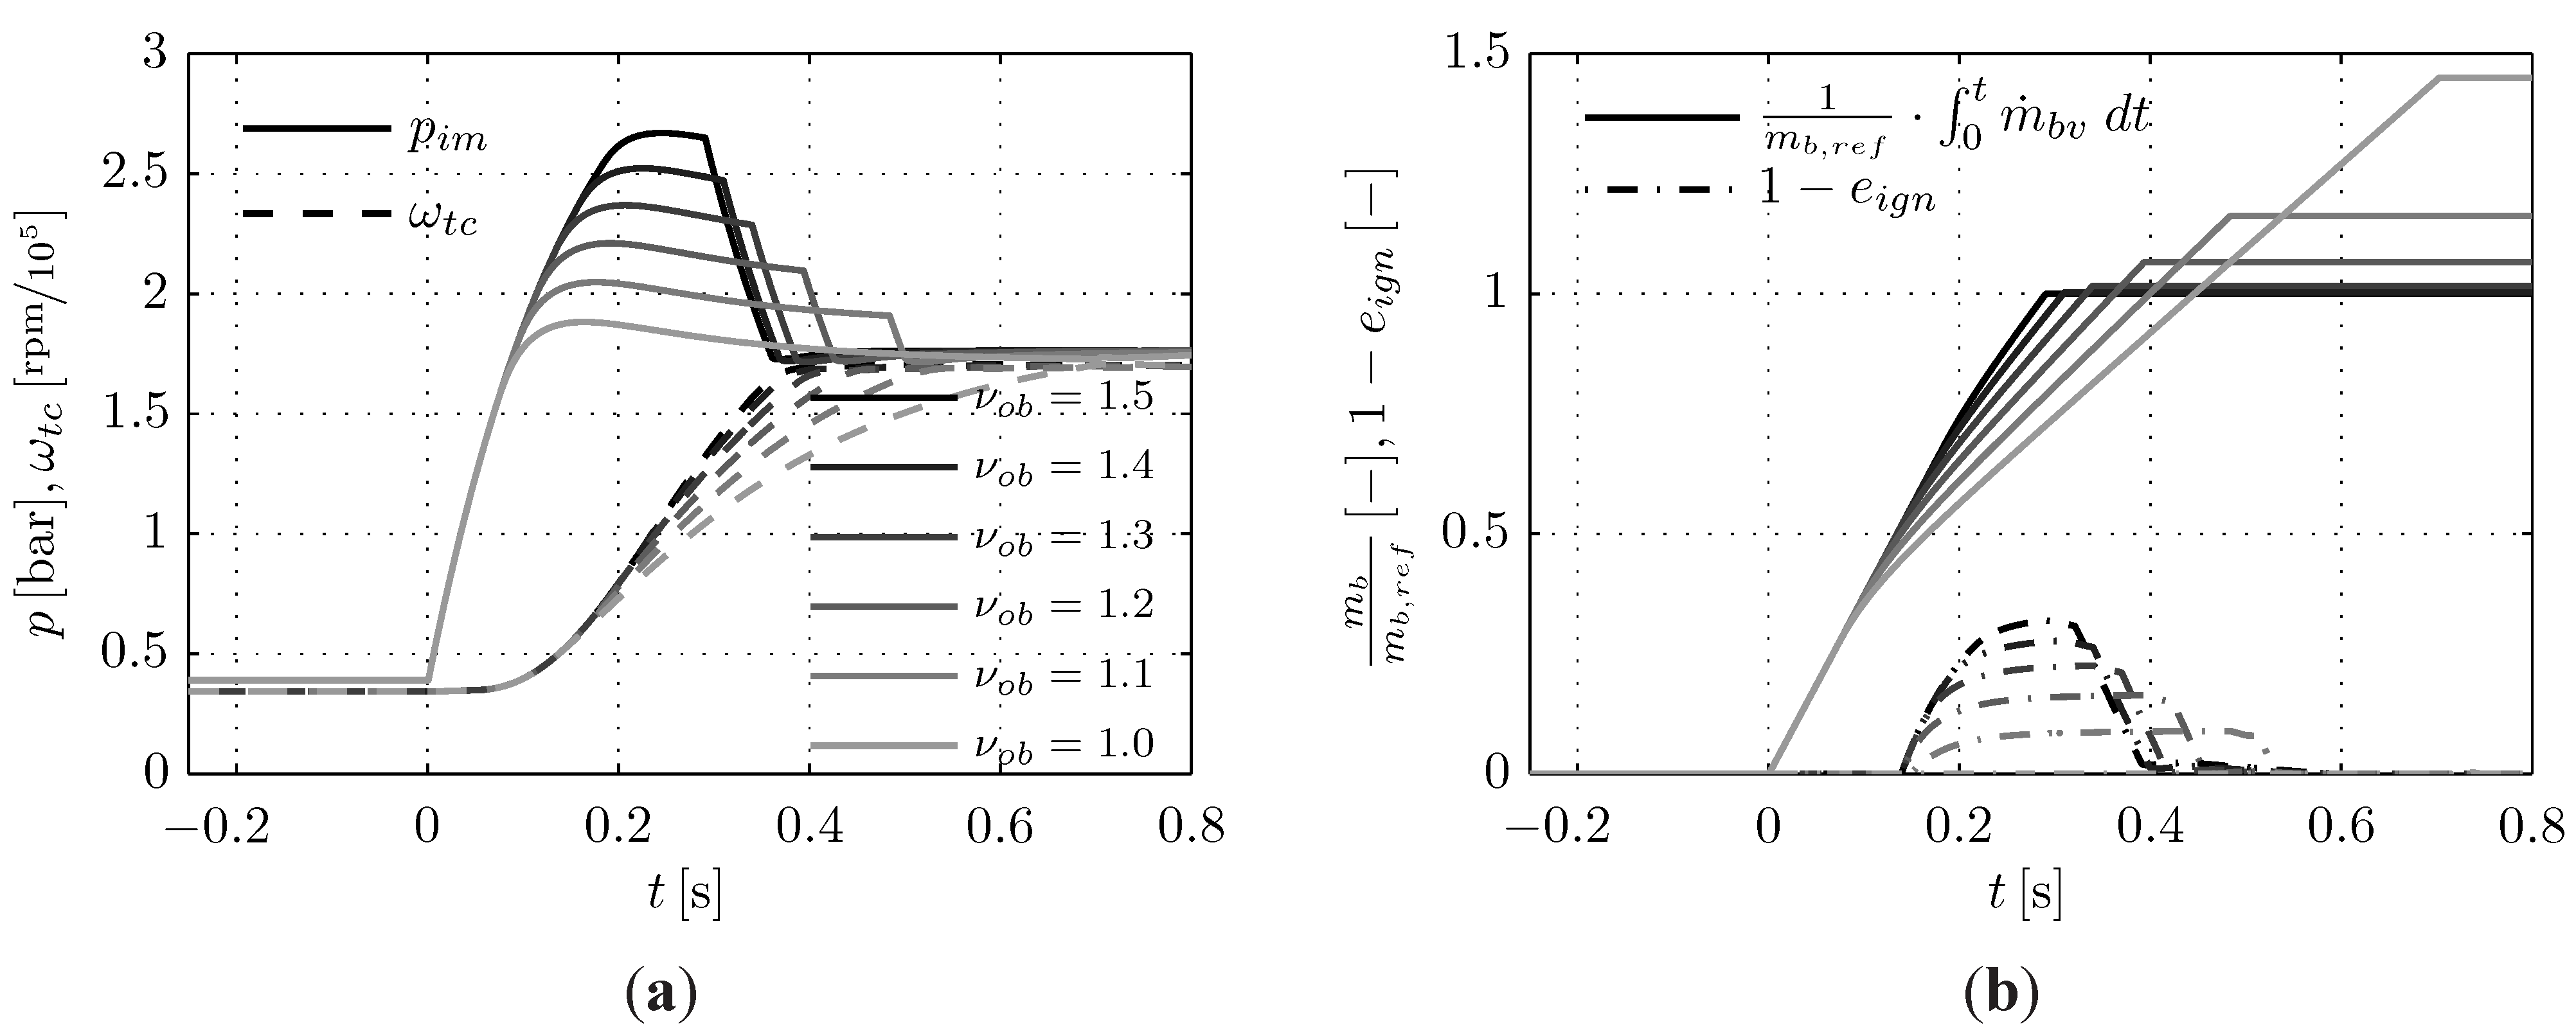
Figure 5 shows the boosting process for smaller overboosting factors. Due to a reduced turbocharger speed-up, the boosting process clearly requires more time. However, the mass flow through the boost valve is smaller. The right-hand plot of
Figure 5 shows that the increased boost time outweighs the lower boost valve mass flow. Hence, the air consumption is higher with a lower overboosting factor.
Figure 5.
Results for a load step from 1.7 bar to 16.7 bar at 2000 rpm in simulation using various overboosting factors . (a) Trajectories of the intake manifold pressure and the turbocharger speed ; (b) Consumed air mass and the reduction of the ignition efficiency , with .
Figure 5.
Results for a load step from 1.7 bar to 16.7 bar at 2000 rpm in simulation using various overboosting factors . (a) Trajectories of the intake manifold pressure and the turbocharger speed ; (b) Consumed air mass and the reduction of the ignition efficiency , with .
The disadvantage of overboosting is the fact that additional fuel is needed during the short period of time when the ignition efficiency is reduced. The amount of extra fuel used
is calculated as follows:
where
is the fuel mass flow.
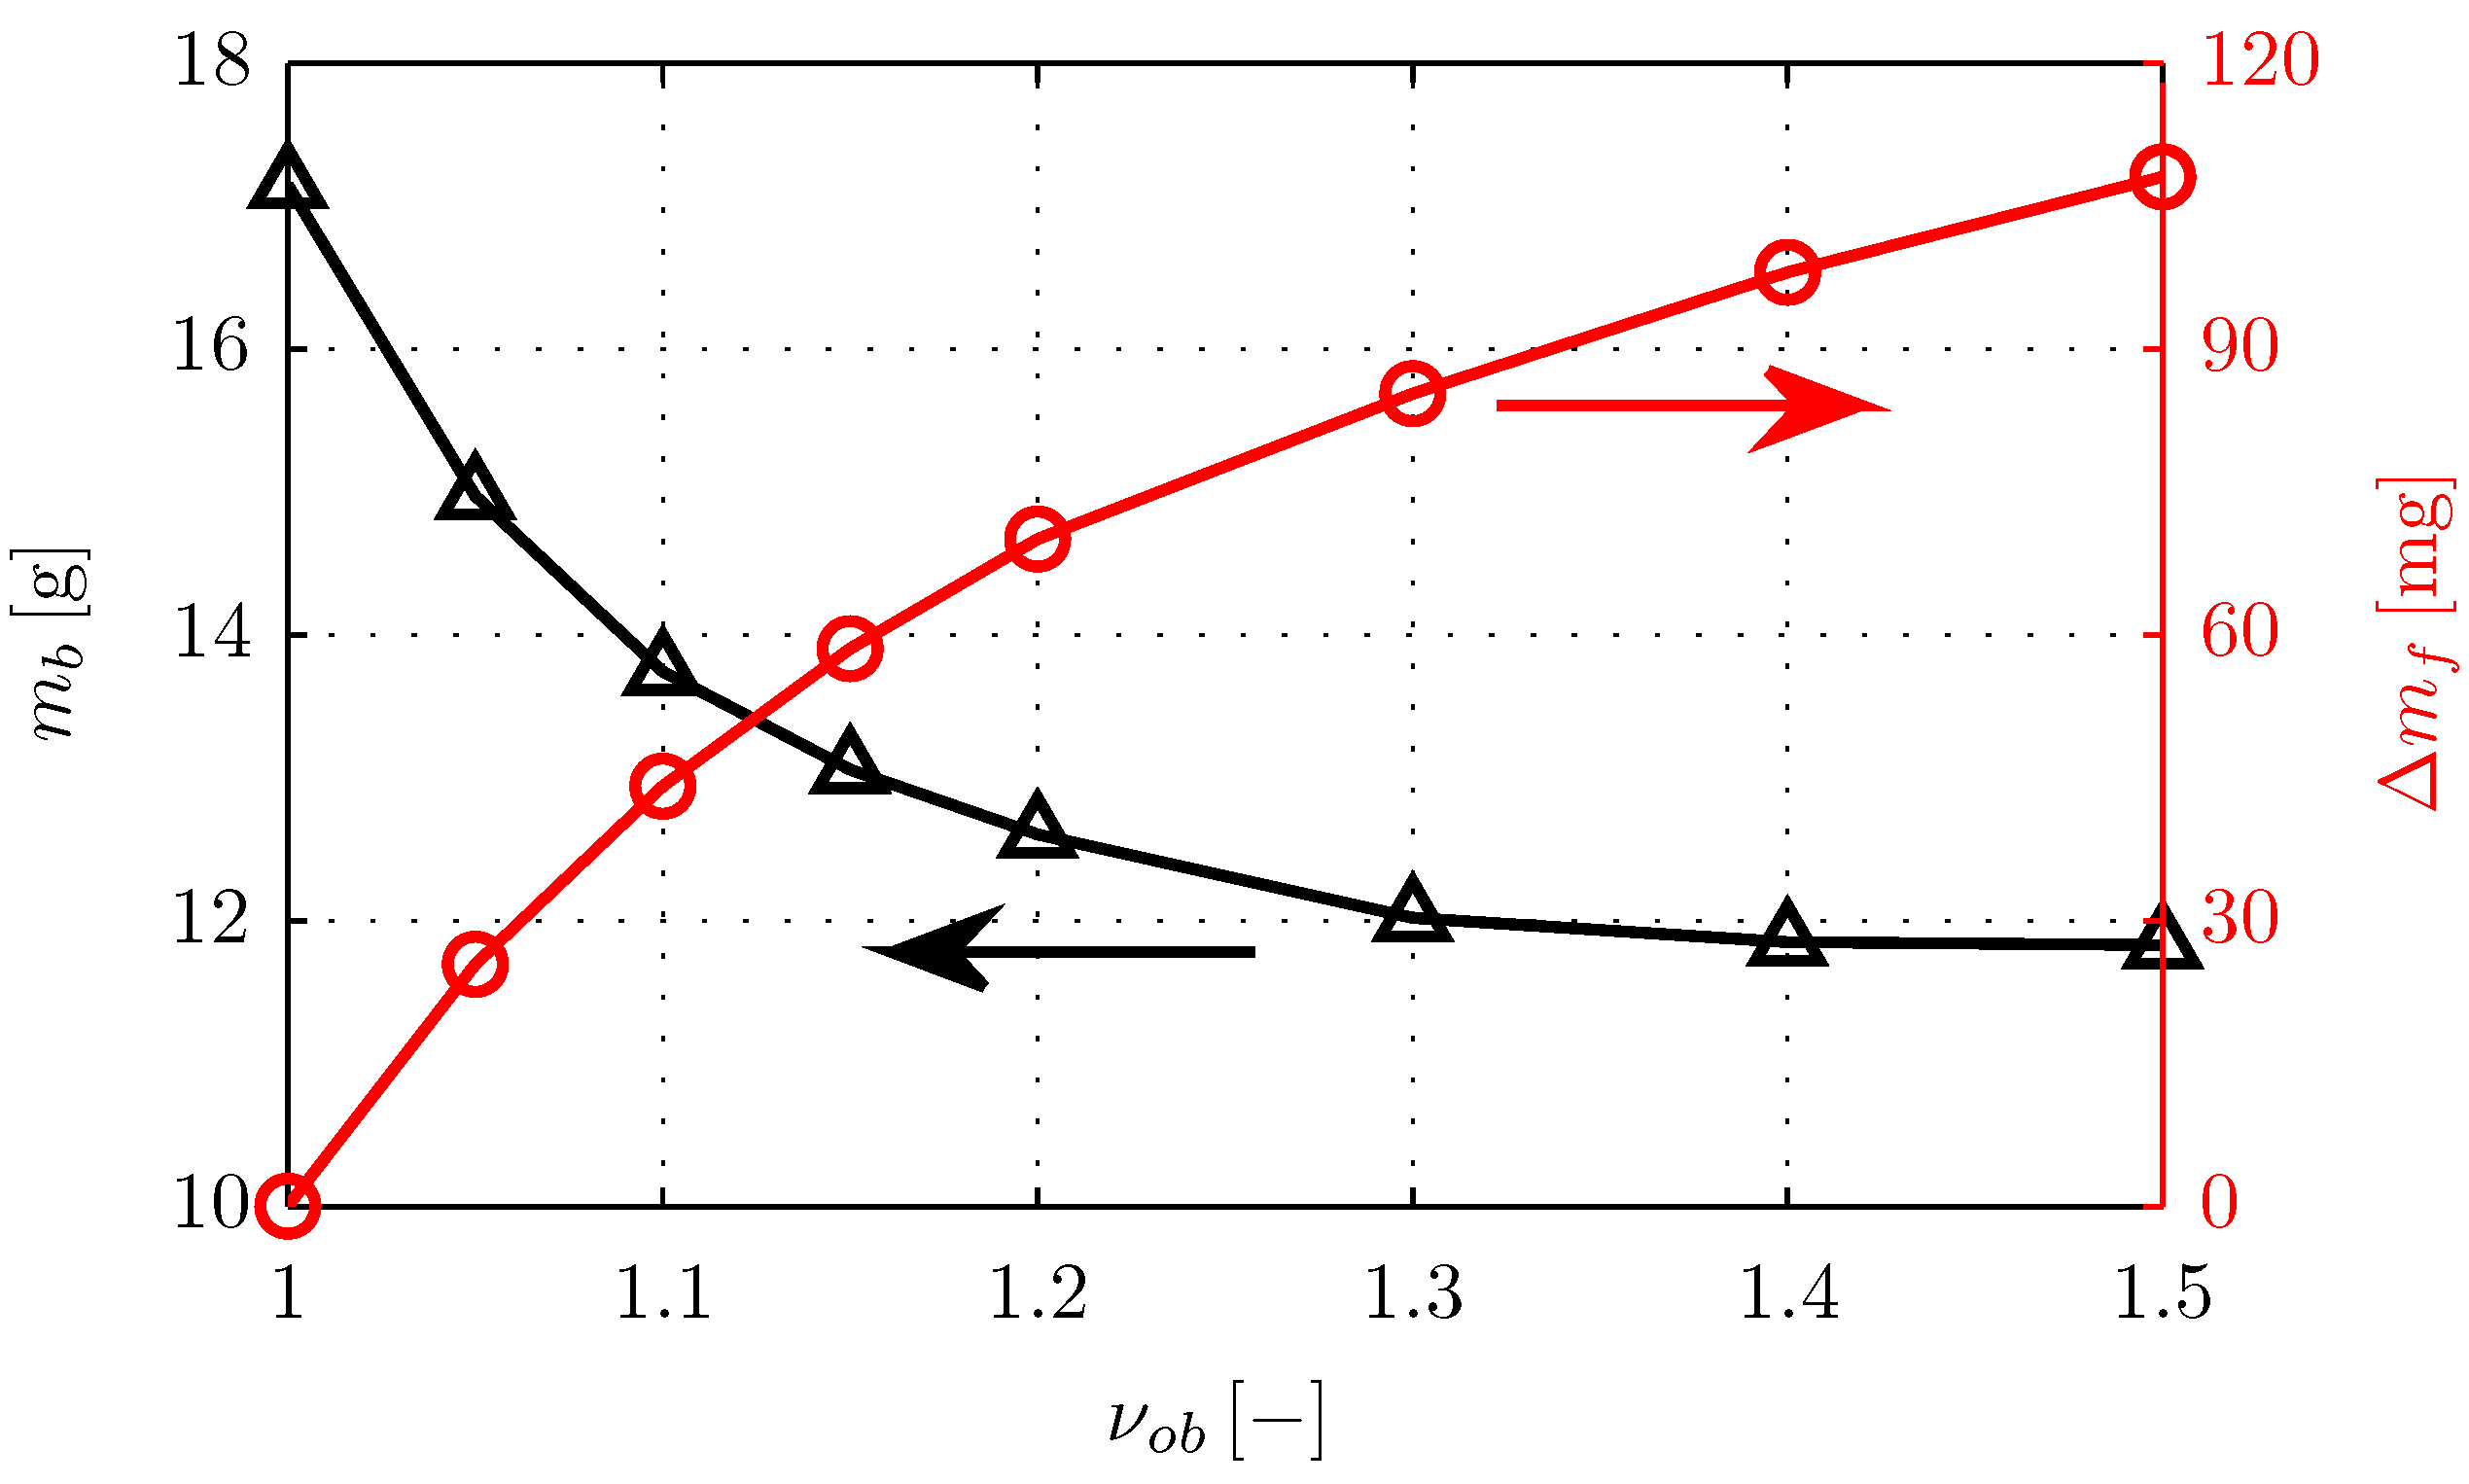
Figure 6 shows the consumption of air and extra fuel for various overboosting factors. For smaller overboosting factors, the ignition efficiency is reduced less, but over a longer period of time. For the extra fuel consumption, the smaller efficiency reduction outweighs the longer time period. Hence, the amount of extra fuel required becomes smaller for a smaller overboosting factor.
Figure 6.
Simulation result of the consumption of pressurized air and extra fuel due to the retardation of the ignition angle for various overboosting factors for a load step from 1.7 bar to 16.7 bar at 2000 rpm.
Figure 6.
Simulation result of the consumption of pressurized air and extra fuel due to the retardation of the ignition angle for various overboosting factors for a load step from 1.7 bar to 16.7 bar at 2000 rpm.
5. Experimental Verification
This section presents the experimental implementation and the test bench results obtained with intake manifold boosting for two load steps.
5.1. Test Bench Implementation
For the implementation of the boost valve on the engine, a solenoid proportional valve is used, which is installed on top of the intake manifold. The opening and closing of the boost valve can be approximated well with a first-order element with a time constant of 15 ms and a time delay of 5 ms.
The ignition control is very important. The control signal denotes the retardation from the MBT ignition angle. However, at low engine speeds and high loads the MBT ignition angle cannot be attained due to knock limitations. The ignition angle has to be retarded to avoid damaging of the engine. In order to calculate the number of degrees by which the ignition angle has to be retarded to accomplish a desired reduction of the ignition efficiency, the offset from the MBT ignition angle has to be taken into account.
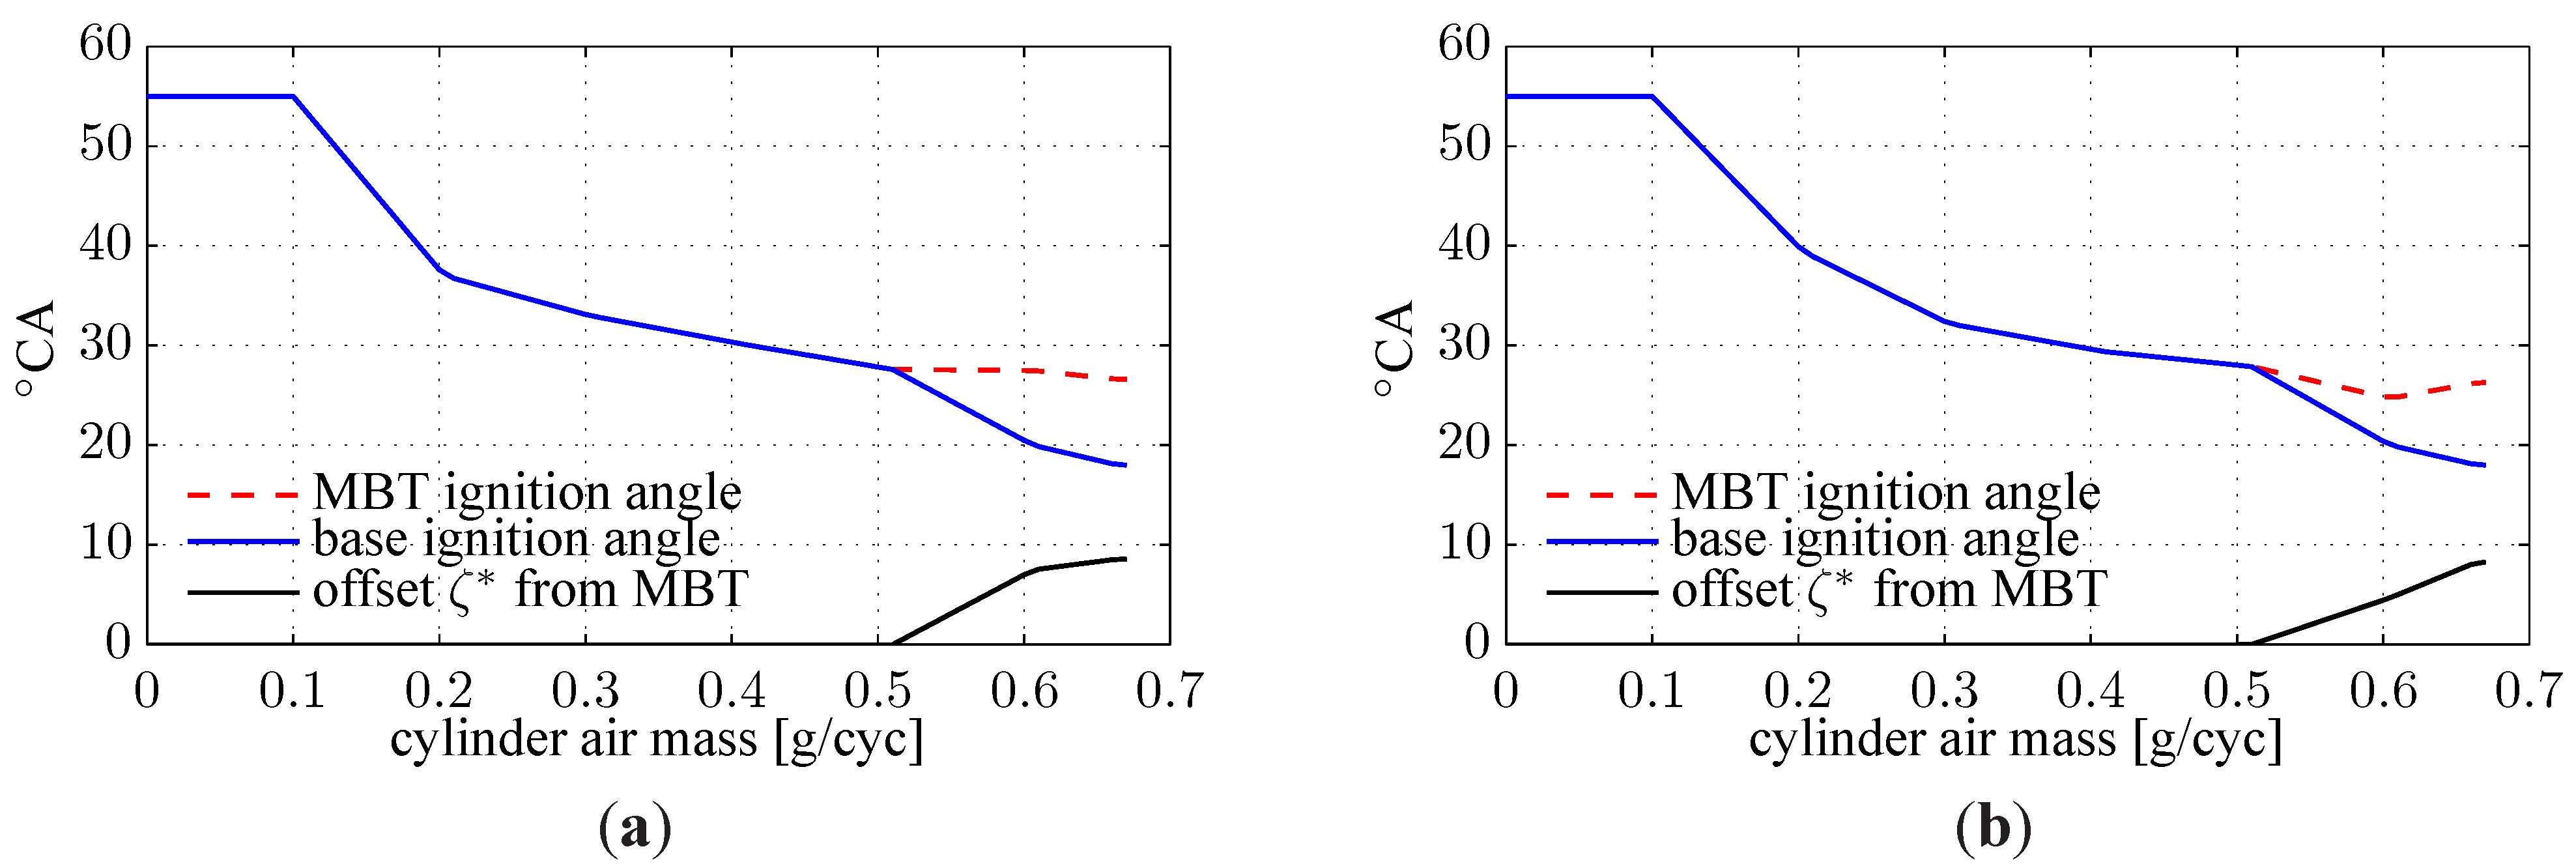
Figure 7 shows the base ignition angles for the engine that was used for both cylinders at 2000 rpm. The base ignition angles are such that engine knock is avoided. At low and medium engine loads (
i.e., cylinder air masses) the MBT ignition angle can be measured for each cylinder air mass by varying the ignition angle over a broad range. There, the base ignition angle is equal to the MBT ignition angle. As measurement results shown in [
11] indicate, the decrease in torque for ignition angles other than MBT can be well approximated with a second order function. At high engine loads the ignition angle can only be retarded because engine knock must be avoided. In those cases the MBT ignition angle is extrapolated by fitting a second order function to the measured torque values. The offset
from the MBT ignition angle is the difference between the base ignition angle and the MBT ignition angle. If a retardation of the ignition angle by the knock controller is present, this retardation must be added to
since this can also be seen as an offset from the MBT ignition angle.
Figure 7.
Ignition angles before top dead center and offset from MBT ignition angles at 2000 rpm. (a) cylinder 1; (b) cylinder 2.
Figure 7.
Ignition angles before top dead center and offset from MBT ignition angles at 2000 rpm. (a) cylinder 1; (b) cylinder 2.
With information on this offset, the additional retardation by the ignition controller to accomplish a desired ignition efficiency is calculated as follows:
If the offset from the MBT ignition angle is neglected,
i.e., if it is assumed to be zero, the ignition controller retards the ignition more than necessary, causing the ignition efficiency to be too low and hence the torque to be too low as well.
5.2. Results and Discussion
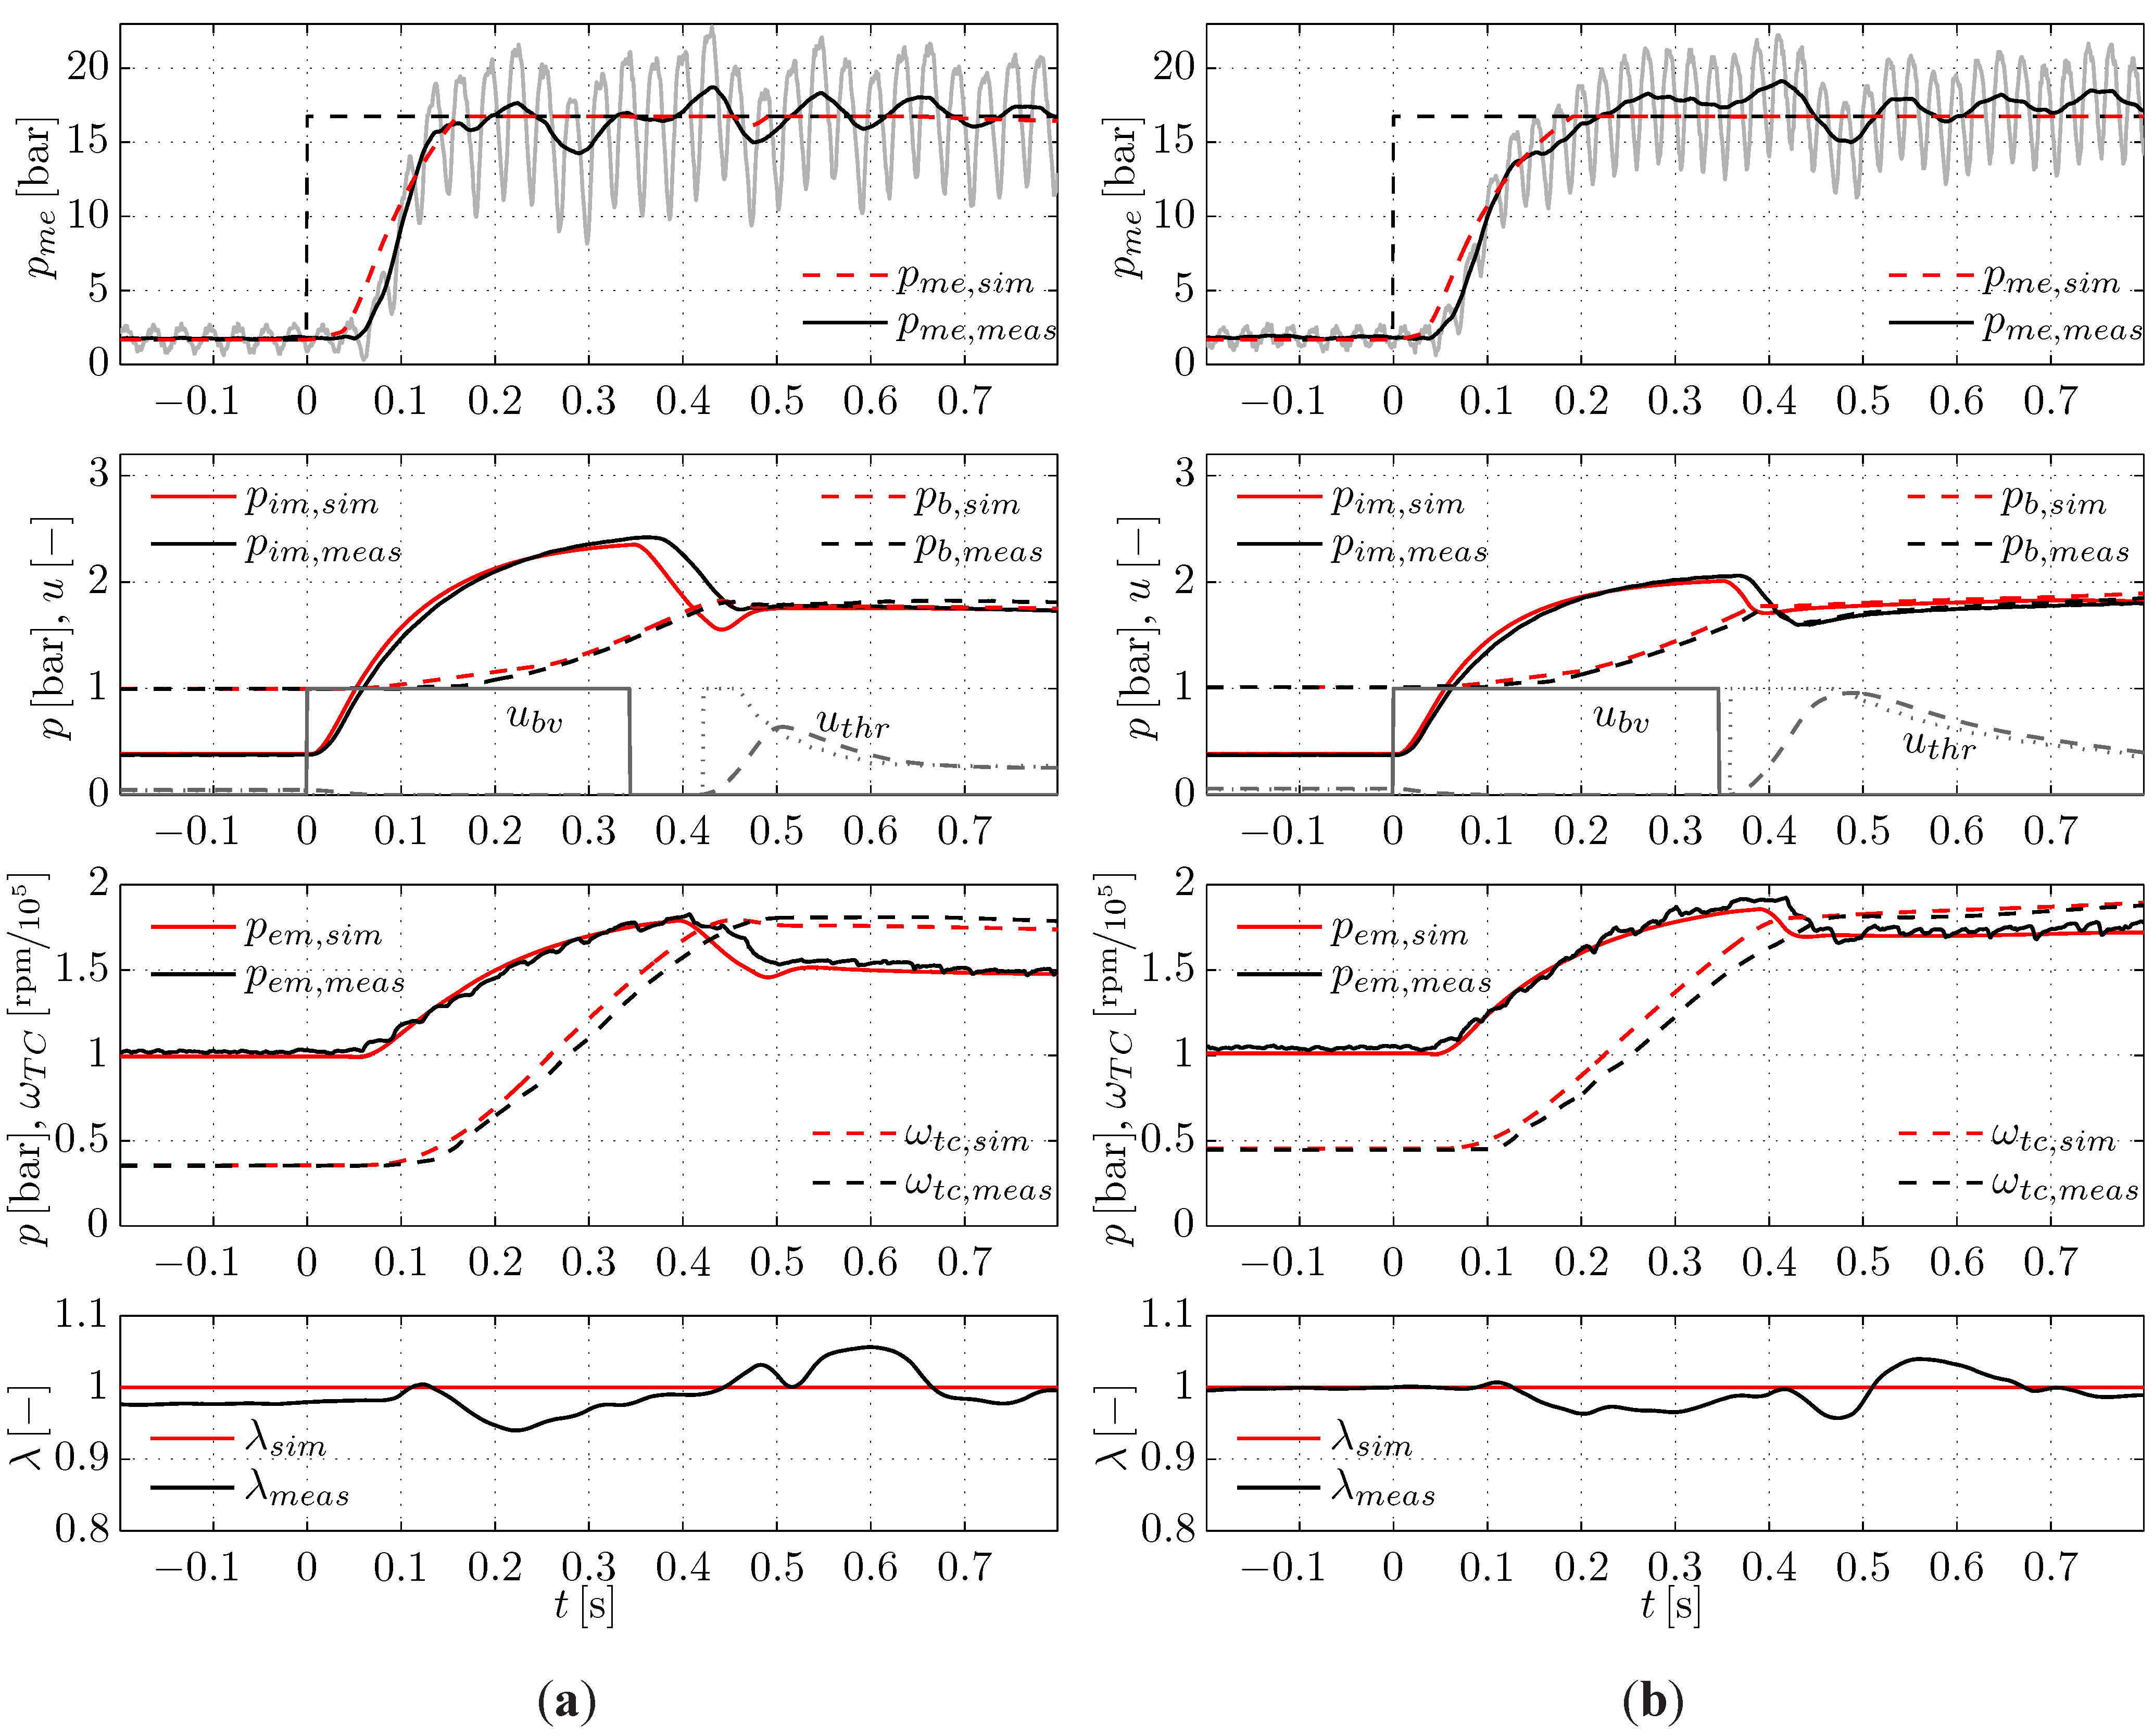
The left-hand plots of
Figure 8 show the result for a load step from 1.7 bar to 16.7 bar
at 2000 rpm. The measurement data is depicted in black. The measurements are averaged over one engine revolution and the resulting phase lag is corrected. The upper plot shows that at
the desired torque is reached. The controller then is able to keep the torque constant. The second plot shows the intake manifold and boost pressure trajectories as well as the signals of the boost valve and the throttle. The intake manifold pressure during the turbo lag compensation increases above the steady-state value after the load step. The boost valve remains completely open during the entire boosting process. After the boost valve closes at
, the intake manifold pressure reduces and the boost pressure increases to their steady-state values. At
the throttle starts to open. The third plot shows the trajectories of the pressure before the turbine
and the turbocharger speed
. Analogously to the intake manifold pressure, the pressure before the turbine also increases above its steady-state value during the turbo lag compensation and decreases again at the end of the boosting process. The bottom plot shows the measurement data of air-to-fuel ratio after the turbine. The deviation of the
λ value remains below
even though the
λ controller is turned off.
Figure 8.
Comparison of measurement (black) and simulation (red) for load steps from 1.7 bar to 16.7 bar . (a): ; (b): . The measurement data are averaged over one engine revolution. In addition, the unfiltered value of is shown in gray.
Figure 8.
Comparison of measurement (black) and simulation (red) for load steps from 1.7 bar to 16.7 bar . (a): ; (b): . The measurement data are averaged over one engine revolution. In addition, the unfiltered value of is shown in gray.
The simulation results are shown in red in these plots. The simulation very well reproduces the behavior of the real engine. All major signals are reproduced with a deviation of . It is higher only in the phase where the intake manifold pressure reduces after the boost valve is closed.
The right-hand plots of
Figure 8 show the results for a load step from 1.7 bar to 16.7 bar
at 2500 rpm. Again, the load step can be realized on the engine, and the simulation agrees well with the measurement results. Due to the slow opening of the throttle, the intake manifold pressure decreases to a value slightly lower than the steady-state intake manifold pressure. For two reasons at 2000 rpm this effect does not occur. First, the discharge of the intake manifold is slower at lower engine speeds. Second, the required throttle opening for the desired torque increases with the engine speed. Thus, a fast throttle is advantageous for intake manifold boosting.
Table 2 lists the air mass consumption obtained by measurement and in the simulation. They differ by less than
.
Table 2.
Air mass consumption data from measurements and simulations.
Table 2.
Air mass consumption data from measurements and simulations.
| Engine speed | | | Error |
|---|
| | | |
| | | |
The measurement results show that the control strategy developed is suitable for intake manifold boosting. They also demonstrate the effectiveness of this turbo lag compensation method.
5.2.1. Model Modifications
The model used to reproduce the measurement results shown in
Figure 8 includes several modifications. First, the actuator dynamics of the boost valve and the throttle are included. As a result of the slow throttle opening shown in the second plot of
Figure 8, the throttle already opens when the intake manifold pressure is higher than the boost pressure by less than 500 mbar. When a lower value is chosen for this pressure difference the torque collapses.
Furthermore, during the boosting process the intake manifold pressure is higher than the boost pressure. Since the throttle is not tight, air escapes out of the intake manifold. Simulations show that there is a net outflow in the order of 1 g of air during the entire boosting process. This leakage is now included in the model.
Finally, the finite size of the pressure tank is now taken into account,
i.e., the pressure is not considered to be constant during a boosting process. The pressure drop leads to a smaller boost valve mass flow. In contrast to the simulations shown in
Section 4, the boost valve thus remains fully open.
6. Simulation-Based Comparison of Intake Manifold and in-Cylinder Boosting
The engine used to study intake manifold boosting was used to investigate in-cylinder boosting and was described in [
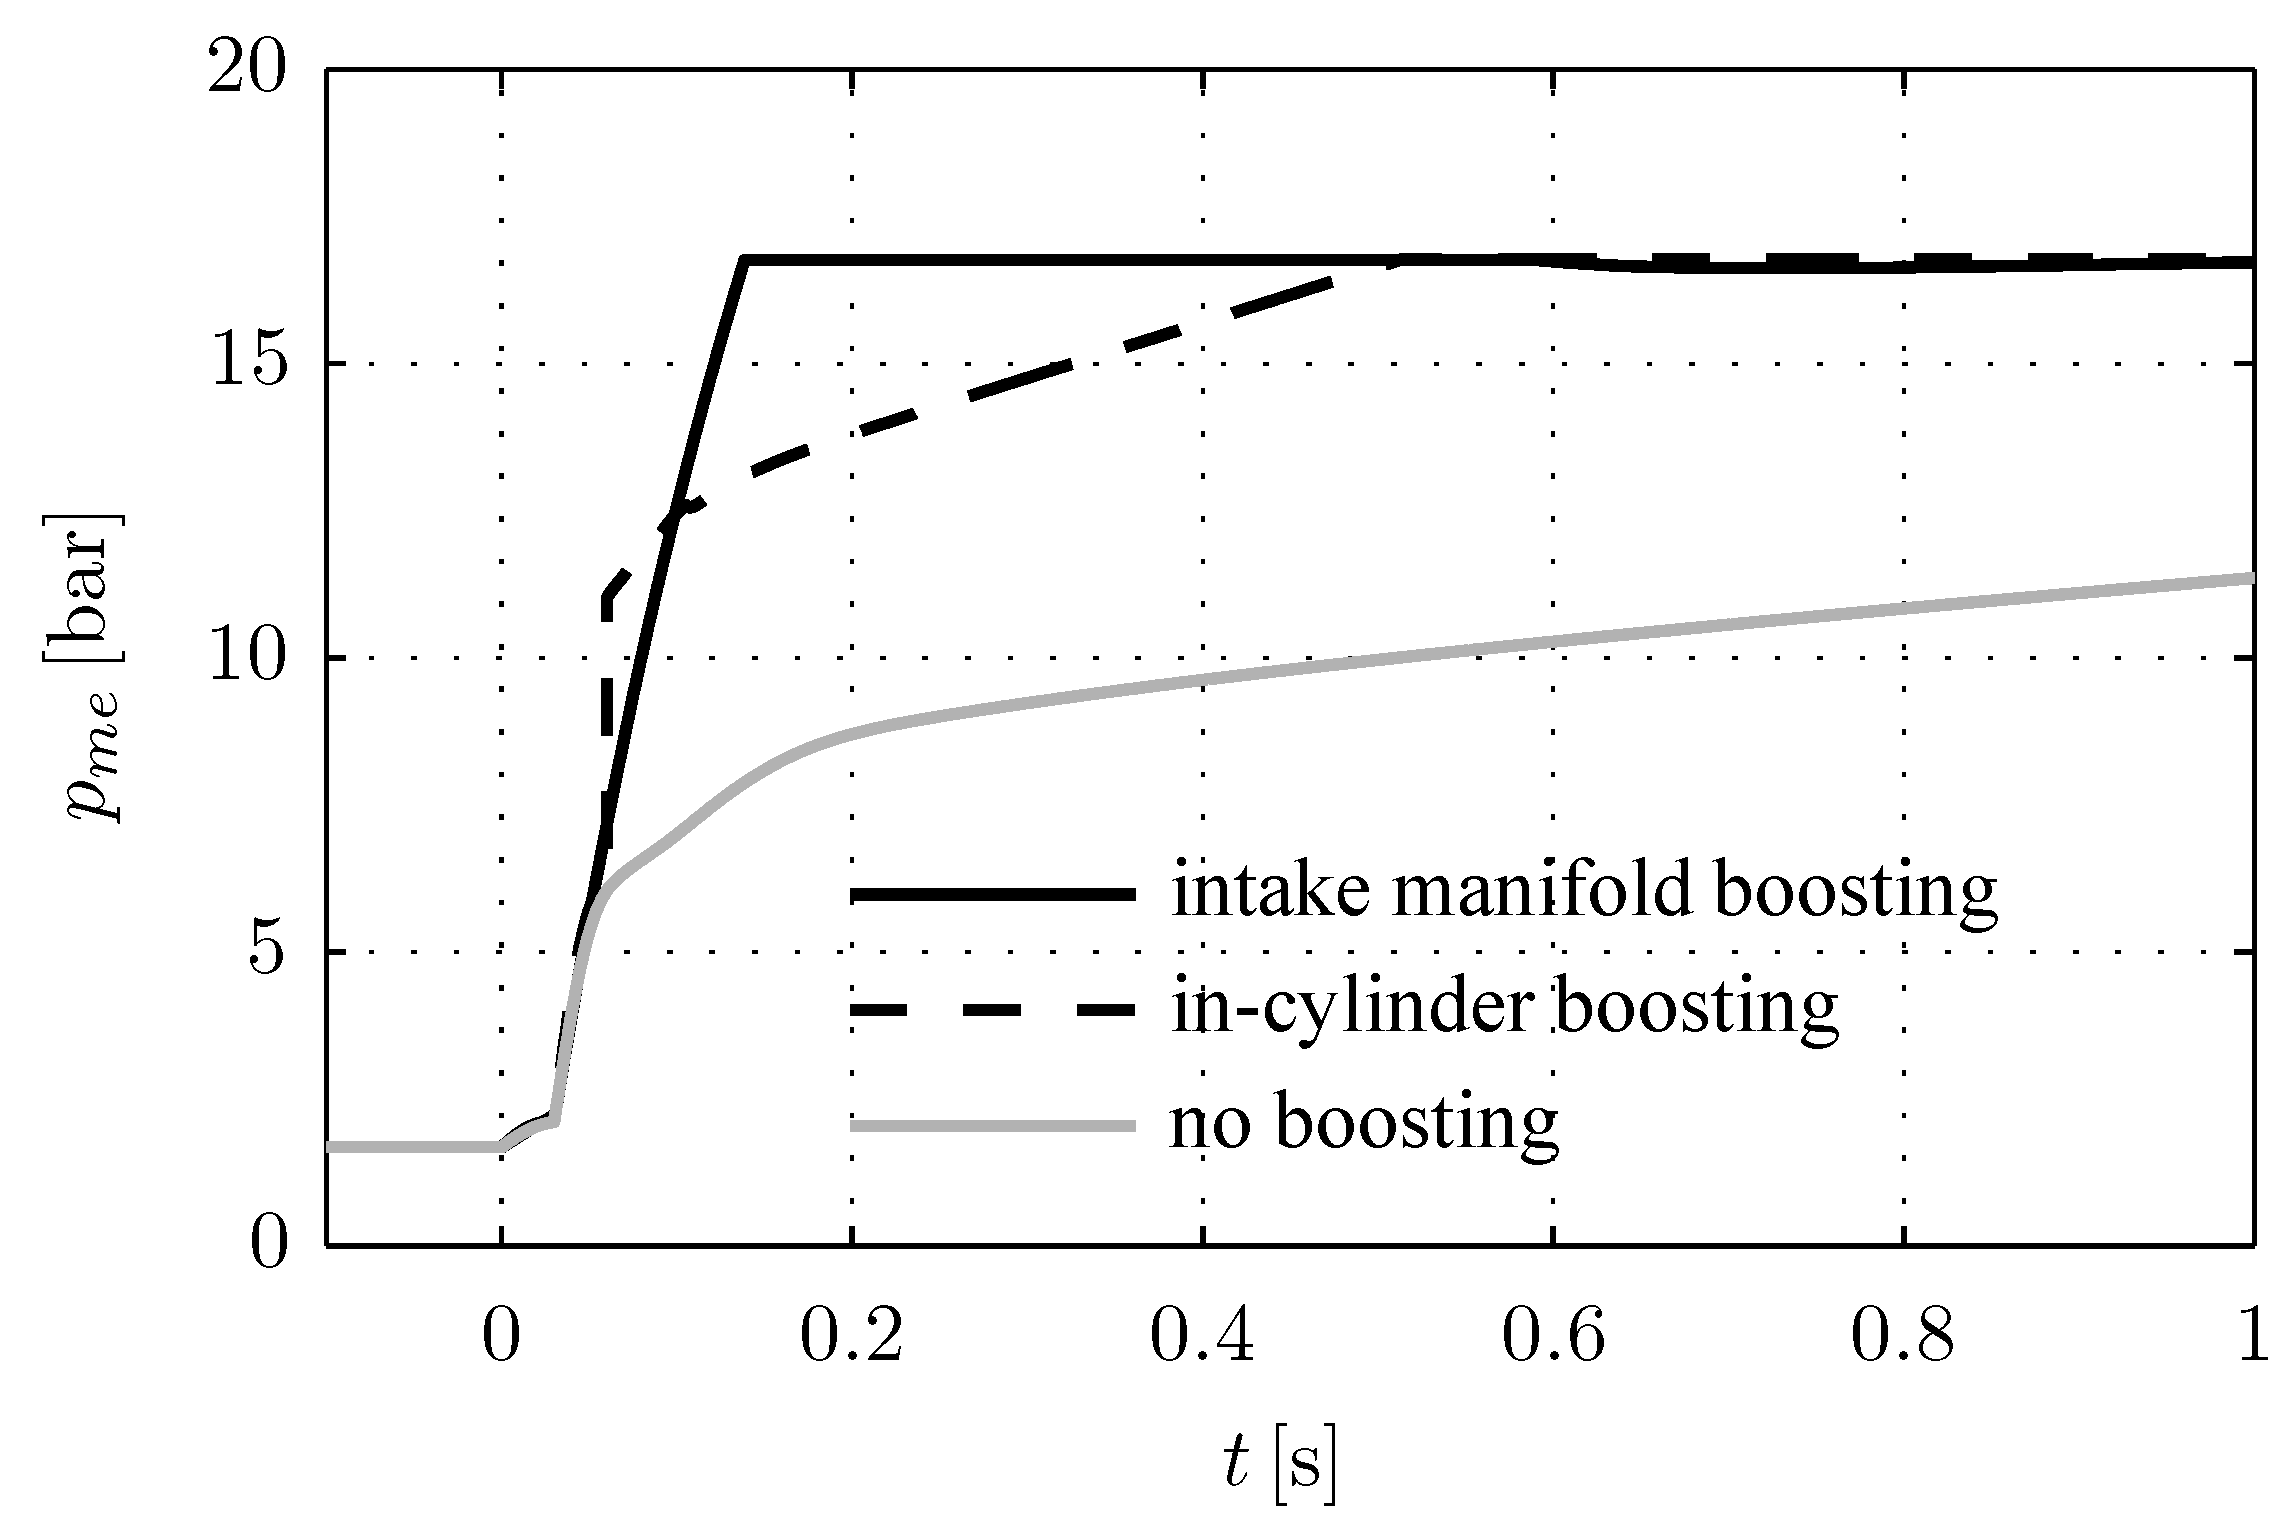
9]. Those results are now used for a comparison of the performance during transients and the air demand of the two boosting approaches. The major difference between the two approaches is the fact that with intake manifold boosting the complete engine mass flow is supplied from the tank. With in-cylinder boosting only an additional mass flow is supplied directly into the combustion chamber. Thus, with intake manifold boosting the torque rises with an almost constant gradient whereas with in-cylinder boosting the gradient decreases.
Figure 9 illustrates this difference for a load step at 2000 rpm from 1.7 bar to 16.7 bar mean effective pressure.
For the comparison of the two approaches, the control strategy is applied that yields the lowest possible air mass consumption. Also, in both cases, the actuator dynamics are neglected in order to allow the potential of the boosting approaches to be compared.
Figure 9.
Simulated trajectories for intake manifold boosting and in-cylinder boosting for a load step from 1.7 bar to 16.7 bar at 2000 rpm.
Figure 9.
Simulated trajectories for intake manifold boosting and in-cylinder boosting for a load step from 1.7 bar to 16.7 bar at 2000 rpm.
6.1. Design
One major difference between in-cylinder boosting and intake manifold boosting is the design point. Intake manifold boosting is designed such that the complete engine mass flow can be delivered at the highest engine speed and at the highest torque where boosting takes place. For in-cylinder boosting there is a criterion on the torque response at a low engine speed, where the turbo lag is an issue [
4].
With this in mind, the comparison is always somewhat unfair for one of the two approaches since they cannot be designed following the same criteria. However, each system is designed in such a way that satisfactory results are obtained over the entire operating range. A comparison of the two boosting approaches thus is still appropriate.
6.2. Torque Response
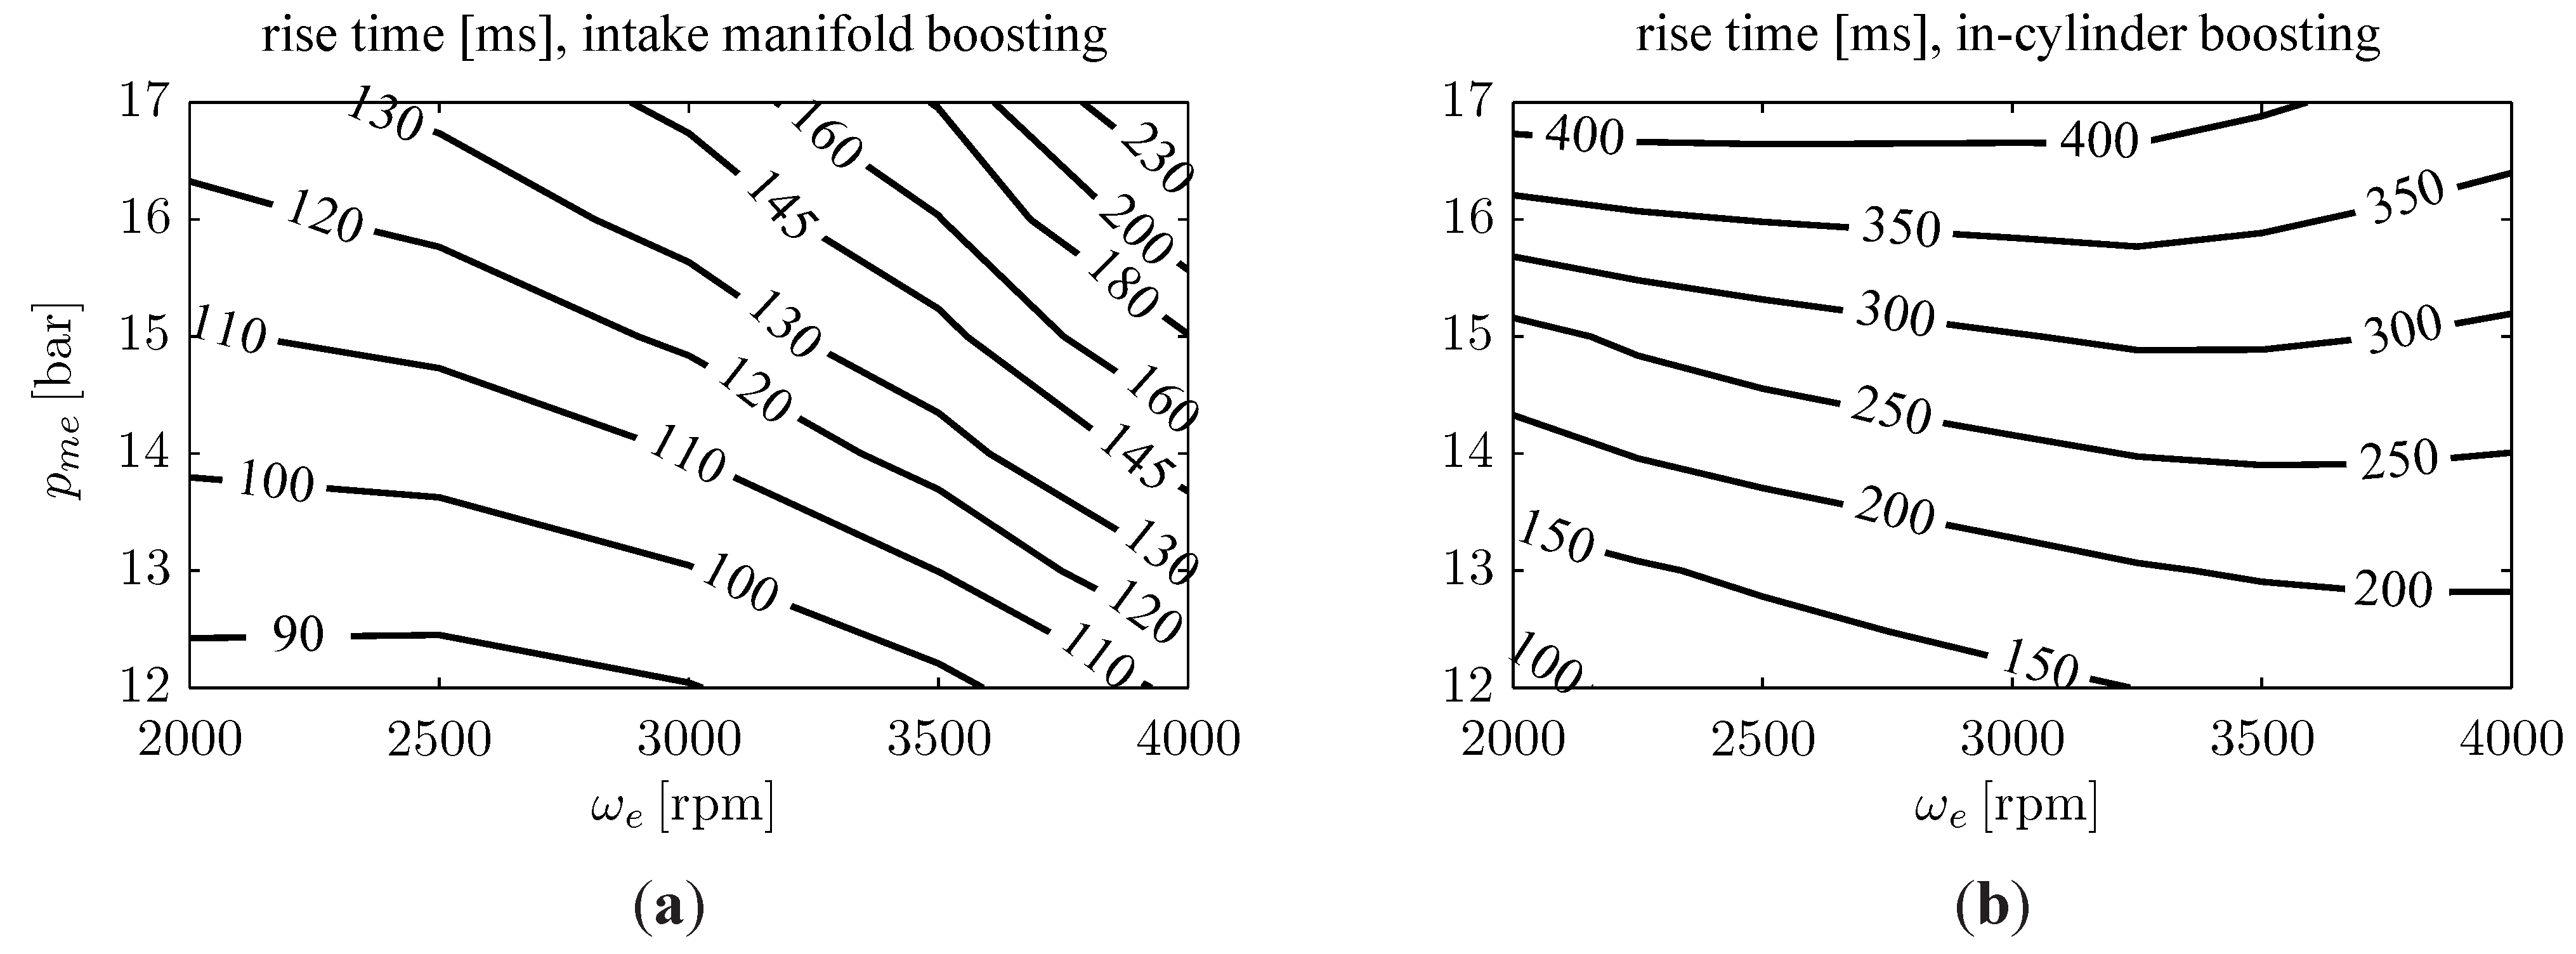
Figure 10 shows the rise times of the two boosting approaches in the entire operating range. With intake manifold boosting a faster response is achieved. However, both approaches lead to fast torque responses. As derived in
Section 2.2, the rise time for intake manifold boosting decreases for increasing engine speeds as the left plot shows. For in-cylinder boosting, shown in the right plot, the rise time increases with the engine load, but is rather independent of the engine speed.
6.3. Air Mass Consumption
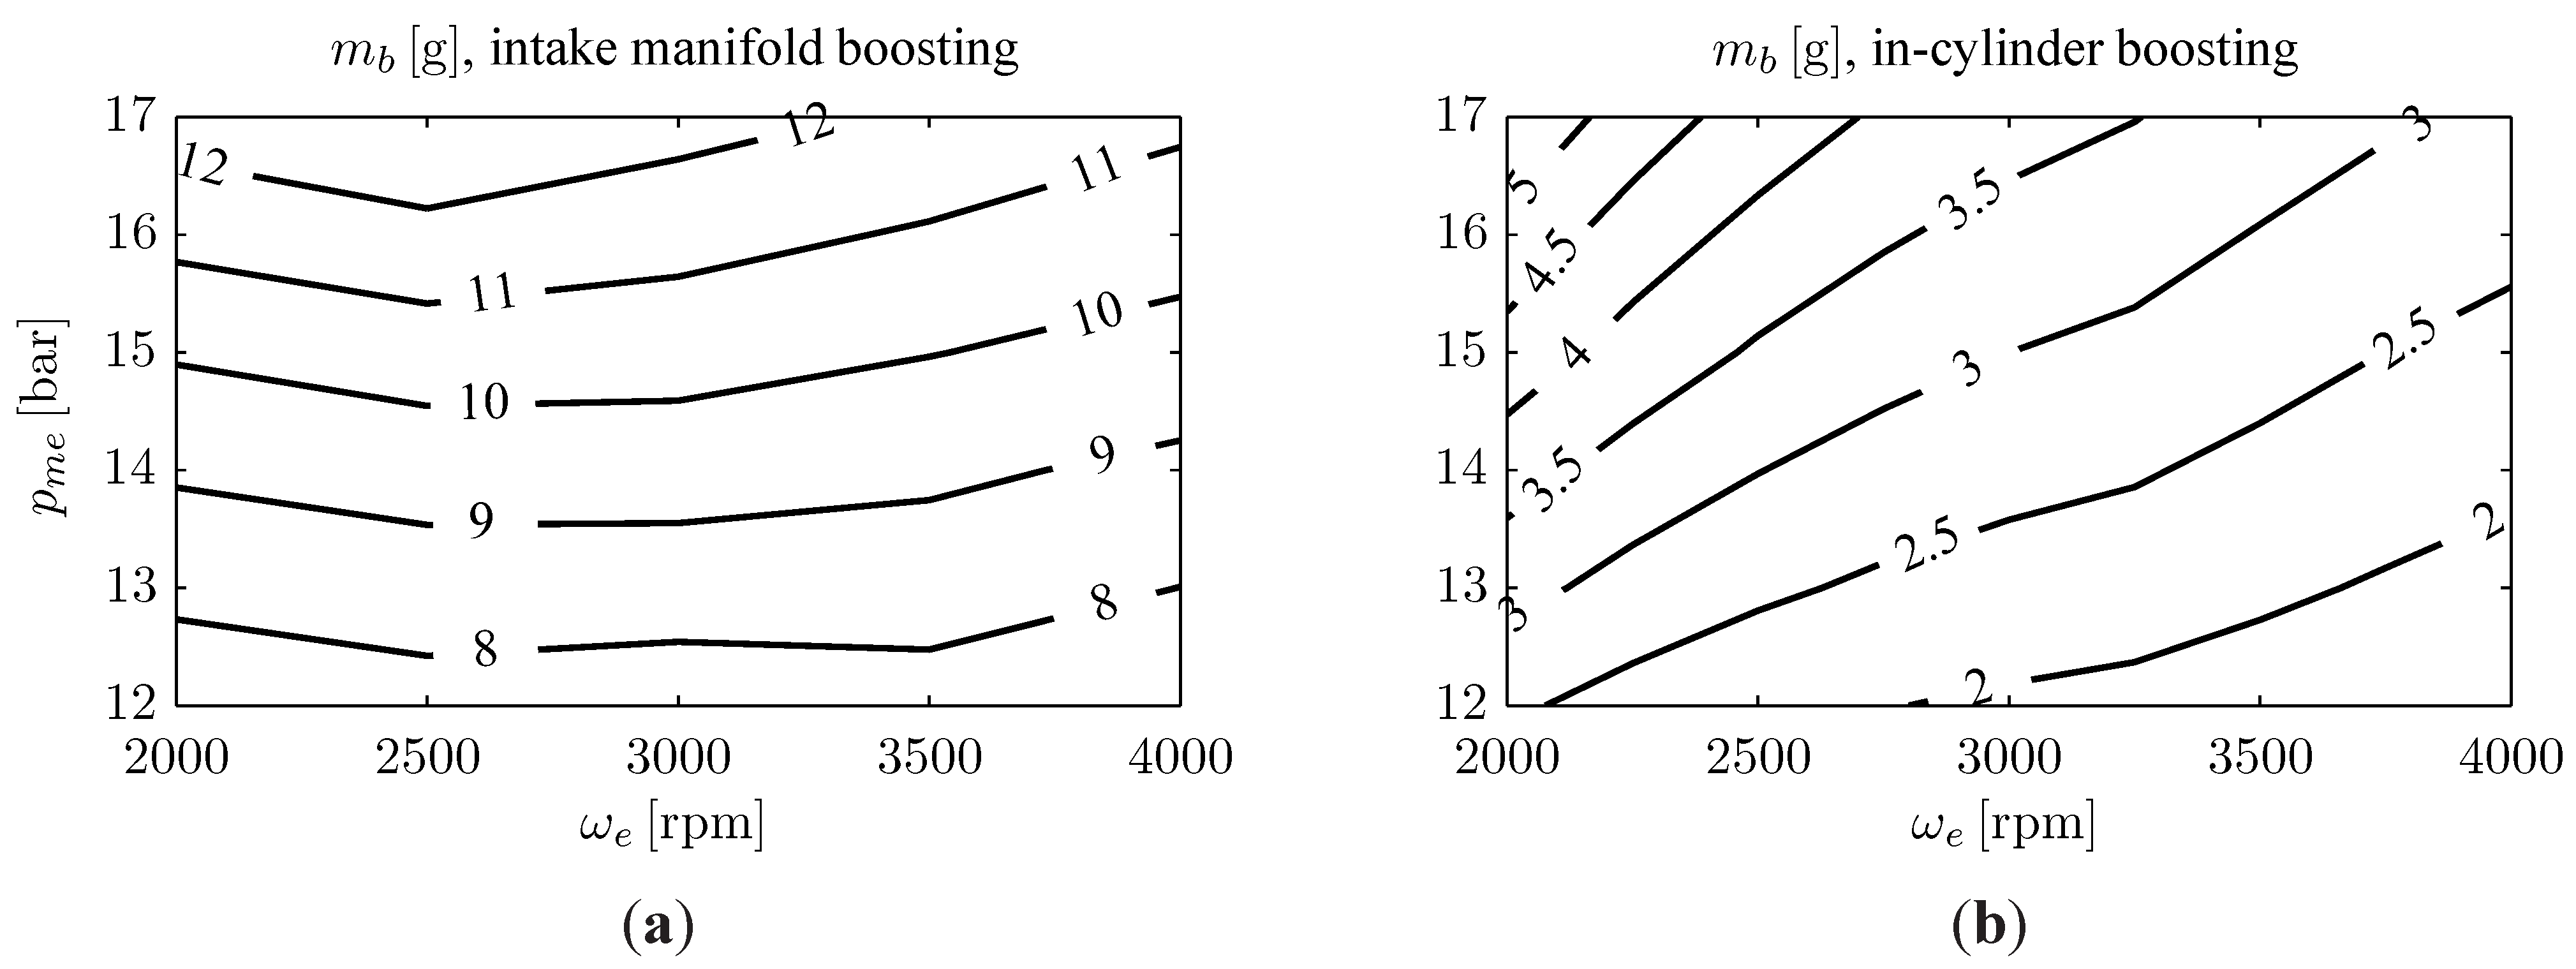
Figure 11 shows the simulation results for the air mass consumption
for load steps from 1.7 bar
to the indicated load at the indicated engine speed for intake manifold boosting (a) and in-cylinder boosting (b).
The comparison of the air mass consumption data shows that for intake manifold boosting the consumption is 2.3 to 4.6 times higher. The reason for this increase is the fact that in-cylinder boosting only supplies an additional air mass, while intake manifold boosting must supply the complete engine mass flow. A low air mass consumption is advantageous because a smaller tank can be used, which is good for the packaging. Furthermore, less energy is required for the supply of compressed air.
Figure 10.
Simulation results for the rise times for a turbo lag compensation for load steps from 1.7 bar
to the indicated
at the indicated engine speed
. (
a) With intake manifold boosting; (
b) With in-cylinder boosting (values taken from [
9]).
Figure 10.
Simulation results for the rise times for a turbo lag compensation for load steps from 1.7 bar
to the indicated
at the indicated engine speed
. (
a) With intake manifold boosting; (
b) With in-cylinder boosting (values taken from [
9]).
Figure 11.
Simulation results for the consumed air mass
for a turbo lag compensation for load steps from 1.7 bar
to the indicated
at the indicated engine speed
. (
a) With intake manifold boosting; (
b) With in-cylinder boosting (values taken from [
9]).
Figure 11.
Simulation results for the consumed air mass
for a turbo lag compensation for load steps from 1.7 bar
to the indicated
at the indicated engine speed
. (
a) With intake manifold boosting; (
b) With in-cylinder boosting (values taken from [
9]).
6.4. Concluding Comparison
Further implications for both approaches are listed in
Table 3. The reduced hardware modifications in the case of intake manifold boosting are accompanied by the disadvantage of a significantly higher air consumption. The fact that an additional compressor is necessary to fill the pressure tank in order to realize intake manifold boosting reduces the advantage of this boosting approach. Especially when the additional operating modes are taken into account the performance of intake manifold boosting is worse.
Table 3.
Comparison of intake manifold and in-cylinder boosting.
Table 3.
Comparison of intake manifold and in-cylinder boosting.
| Criterion | In-cylinder boosting | Intake manifold boosting |
|---|
| hardware modifications | additional valve in cylinder head additional valve actuation (camshaft driven, electrohydraulic,…) pressure tank
| |
| throttle | no modifications | a fast throttle with low leakage is advantageous |
| additional operating modes of the engine | boost mode pneumatic motor mode pneumatic pump mode pneumatic start
| |
| air tank filling | by the engine itself using the pneumatic pump mode | by an additional compressor |
| torque response | fast | faster |
| air consumption | moderate | higher |
| surge problems | none | can be avoided with overboosting for this engine |
7. Conclusions
In this work, the implementation of intake manifold boosting on an SI engine is presented. It is shown how the boost valve must be dimensioned in order to be able to carry out load steps over a desired operating range of the engine. The control strategy presented leads to a low consumption of pressurized air. For the engine considered, surge can be avoided without the use of an overstream valve.
The realizability of intake manifold boosting and the transient performance are demonstrated in experiments at two engine speeds. It is shown how the ignition controller must be set up when an offset from the MBT ignition angle is present in order to accurately achieve a desired reduction of the ignition efficiency. With intake manifold boosting, the turbo lag is shown to be overcome effectively. For a load step at the rise time can be reduced from to . This result shows that intake manifold boosting can substantially improve the transient performance of a downsized and turbocharged engine and can hence be used as an enabler of strong downsizing.
The comparison of intake manifold and in-cylinder boosting shows that the reduced complexity of hardware modifications for intake manifold boosting is accompanied by a significantly higher consumption of pressurized air. Intake manifold boosting has a 2.3 to 4.6 times higher air mass consumption than in-cylinder boosting. This disadvantage is accompanied by the need for an additional compressor to fill the pressure tank.


