Article

Experimental Update of the Overtopping Model Used for the Wave Dragon Wave Energy Converter

by
Stefano Parmeggiani
1,2,*,
Jens Peter Kofoed
2 and
Erik Friis-Madsen
1
1
Wave Dragon Ltd., 869 High Road, London N12 8QA, UK
2
Department of Civil Engineering, Aalborg University, Sohngaardsholmsvej 57, DK-9000 Aalborg, Denmark
*
Author to whom correspondence should be addressed.
Energies 2013, 6(4), 1961-1992; https://doi.org/10.3390/en6041961
Submission received: 5 February 2013 / Revised: 15 March 2013 / Accepted: 26 March 2013 / Published: 3 April 2013
(This article belongs to the Special Issue Energy from the Ocean - Wave and Tidal Energy)

Abstract

:
An overtopping model specifically suited for Wave Dragon is needed in order to improve the reliability of its performance estimates. The model shall be comprehensive of all relevant physical processes that affect overtopping and flexible to adapt to any local conditions and device configuration. An experimental investigation is carried out to update an existing formulation suited for 2D draft-limited, low-crested structures, in order to include the effects on the overtopping flow of the wave steepness, the 3D geometry of Wave Dragon, the wing reflectors, the device motions and the non-rigid connection between platform and reflectors. The study is carried out in four phases, each of them specifically targeted at quantifying one of these effects through a sensitivity analysis and at modeling it through custom-made parameters. These are depending on features of the wave or the device configuration, all of which can be measured in real-time. Instead of using new fitting coefficients, this approach allows a broader applicability of the model beyond the Wave Dragon case, to any overtopping WEC or structure within the range of tested conditions. Predictions reliability of overtopping over Wave Dragon increased, as the updated model allows improved accuracy and precision respect to the former version.

1. Introduction

The Wave Dragon is a floating, offshore Wave Energy Converter (WEC) of the overtopping type. Incoming waves are focused by two wing reflectors towards a doubly-curved ramp, by which they surge up into a reservoir placed above the mean water level. The Power Take-Off (PTO) system of the device consists of several variable speed low-head hydro-turbines directly coupled to Permanent Magnet Generators (PMGs). The power production takes place as the water stored in the reservoir is led back to the sea through the turbines (Figure 1). The turbines are of axial type with fixed propeller blades and guide vanes. The rotational speed of the turbines is controlled in accordance to the available pressure head by means of a back-to back frequency converter system. The turbines are activated in a cascade fashion by the control system depending on the water level in the reservoir. The PTO system has been proved to maintain a very high efficiency across the whole span of working conditions.
Figure 1. The Wave Dragon wave energy converter: (a) 3D model of the Wave Dragon, showing the main components of the device; and (b) Wave Dragon working principle.
Energies 06 01961 g001
A commercial unit of Wave Dragon suitable for North Sea conditions (yearly average wave power of 24 kW/m) is a 22,000 t reinforced concrete structure, occupying an area of around 150 m × 260 m. With 4 MW installed power, it can produce up to 12 GWh/year.
After more than 20 years of development, which have included a large number of wave tank tests of a reduced scale model [1] and the sea trials of a pre-commercial demonstrator of a North Sea unit at 1:4.5 scale [2,3], Wave Dragon is currently being up-scaled to commercial size. With regard to this, the structural design of a 1.5 MW pre-commercial demonstrator unit to be deployed at the DanWEC test site in Hanstholm, Northern Denmark, [4] is being carried out together with the related feasibility analysis.

1.1. Wave-to-Wire Model

The power conversion from wave-to-wire of Wave Dragon can be described in four stages:
1. Overtopping power, the time averaged potential energy of the overtopping waves:
Pcrest (kW) = ρ ∙ g ∙ Rc ∙ q
It is proportional to the crest level Rc (m), the height of the crest freeboard above the mean water level, and to the mean overtopping discharge q (m3/s). ρ = 1025 kg/m3 is the salt water density and g is the gravity acceleration (m/s2).
2. Hydraulic power, the time averaged potential energy stored in the reservoir:
Phyd (kW) = ρ ∙ g ∙ Ht ∙ q
It is proportional to the working head of the turbines, Ht (m), defined as the difference between the water level in the reservoir and the mean water level. As Ht is necessarily lower than Rc, the water stored in the reservoir has less potential energy than when overtopping the ramp, the excess being progressively dissipated by cross-waves within the reservoir itself.
3. Estimated power, the power produced by the turbines working at their optimal speed:
Pest (kW) = Phyd ∙ ηturb
where ηturb(-) is the turbine’s efficiency. The turbine’s optimal speed can be derived from their characteristic curve by knowing Ht.
4. Actual power, the power delivered to the grid. It depends on the efficiencies of the generators, ηPMG(-), and the frequency converters, ηfc(-). Assuming optimal turbine speed:
Pact (kW) = Pest ∙ ηPMG ∙ ηfc
As the overtopping is the first level of the wave-to-wire power conversion, its predictions have to be reliable in order not to compromise the quality of the overall performance assessment. Moreover, being the primary energy extraction mechanism, it expresses the interaction between the device and the waves. Therefore a reliable overtopping model has to be flexible enough to adapt to the local conditions at any deployment location as well as to any configuration of the device; it also has to be comprehensive enough to consider all physical processes influencing the overtopping performance of the device.

1.2. Mean Overtopping Discharge over Coastal Defense Structures

Due to the complex and non-linear nature of the phenomenon, overtopping flow predictions are normally based on empirical methods, mainly derived from experimental tests of reduced scale models. The applicability of the resulting formulation is limited to the range of wave conditions and setup configurations tested. These models relate the average overtopping discharge, q (m3/s), to the crest freeboard height above the mean water level, Rc (m), usually in a non-dimensional way, through key wave and structure parameters [5]. Mostly, a negative exponential function is used:
Q = q W g H m 0 3 = A e ( B R c H m 0 )
Q(-) is the non-dimensional average overtopping flow per crest meter width and R(-) = Rc/Hm0 is the non-dimensional crest level. Hm0 (m) is the significant wave height based on the spectral moment of zero-order, W (m) is the crest width. On a semi-logarithmic plot, this relationship is expressed by a linear trend; in this sense A(-) can be defined as the product of all “offset-correcting factors”, as they would shift the intercept with the y-axis from the original value, while B(-) as the product of all the “gain-correcting factors”, changing the gain of the trend-line in the same plot.
The formulation used as a baseline for the development of Wave Dragon overtopping model has been experimentally developed in 1995 by Van der Meer and Janssen [6] for dykes and breakwaters in the case of non-breaking waves (Figure 2):
Q = 0.2 e ( 2.6 R 1 γ b γ h γ f γ β )
where γb(-), γh(-), γf(-) and γβ(-) are gain-correcting factors accounting respectively for the effects of a berm, a shallow foreshore, the slope roughness and the angle of wave attack. The non-breaking wave criteria refers to wave conditions with ξ0p ≥ 2, being ξ0p(-) = tan α / S 0 p the breaking parameter based on the slope angle, α (°), and the deep-water peak wave steepness S0p(-) = Hm0/L0p. L0p is the deep-water wavelength referred to the peak period, Tp (s).
Figure 2. Overtopping process on dykes, as investigated by [6] and described in Equation (6).
Energies 06 01961 g002
The range of application of Equation (6) is for 1 ≤ cot(α) ≤ 4 and 0.5 ≤ R ≤ 3.5, typical of coastal defense structures with the aim of preventing overtopping. Other empirical formulas have been developed for the same application by Owen [7] and Goda [8], whereas a prediction tool based on a neural network has been provided among the results of the CLASH project [9]. Respect to these however, overtopping WECs have the opposite goal of maximizing the overtopping discharge to optimize power production; in this case the range of typical working conditions is different, involving normally lower R and steeper slopes, for which the applicability of the above mentioned model is limited.

1.3. Overtopping Models for WECs

In 2001, Kofoed adapted Equation (6) to the generic case of a floating overtopping WEC by assessing on a fixed 2D test rig, among others, the effects on Q of very low Rc and limited drafts, dr (m), extending the applicability of the model to 0.58 ≤ cot(α) ≤ 2.75 and 0.15 ≤ R ≤ 2 [10]. Being not relevant for the application under study, all gain-correcting factors were assumed equal to 1. The choice was made to keep the same fitting coefficients as in Equation (6) and to rather describe these effects by introducing in the model some dedicated offset-correcting factors depending on features of the structure and the waves:
Q = 0.2 λ d r λ s e ( 2.6 R )
λdr(-) represents the proportion of energy the device is able to intercept due to its limited draft. In linear theory, this can be described by the average ratio over a wave period of the mean energy flux between the water surface and the draft of the device, Ef,dr (W/m), and the same mean energy flux through the whole water depth, Ef,d (W/m):
E f , d r E f , d = d r 0 p + u d z d 0 p + u d z = 1 sinh ( 2 k p d ( 1 d r d ) ) + 2 k p d ( 1 d r d ) sinh ( 2 k p d ) + 2 k p d
where kp (m−1) = 2π/Lp is the wave number based on the peak wave length; Lp (m), and d (m) is the water depth; λdr has been derived from this formulation by adding a fitting parameter κ(-), originally proposed to be 0.4 by Kofoed:
λ d r = 1 κ sinh ( 2 k p d ( 1 d r d ) ) + 2 k p d ( 1 d r d ) sinh ( 2 k p d ) + 2 k p d
For a given value of the dr/d (i.e., relative draft) λdr still depends on d, expressing the fact that the percentage of incoming wave energy the device is able to intercept progressively increases in deeper waters. This makes offshore installations more attractive to floating overtopping WECs, although linked to a progressive up-scaling of the device to keep a constant ratio dr/d.
λs(-) is a correcting factor introduced to model more precisely Q below the range of R considered by Equation (6), which becomes important in the case of overtopping WECs:
{ λ s = 0.4 sin ( 2 π 3 R ) + 0.6 for  R < 0.75 λ s = 1 for  R 0.75
In 2011 a set of four formulations suited for low-crested, bottom-fixed overtopping WECs with simple slope was developed by Victor [11], based on a broad range of tested slope angles and wave steepness. Which formulation to use can be determined based on the range of R and cot(α) considered for the application, for which discriminating values are R = 0.8 and cot(α) = 1.43. In the case of the Wave Dragon, an average ramp slope of 38.3° corresponds to a cot(α) = 1.27, while a range of 0.2 < R < 1.5 is normally considered for operational conditions. This narrows the model to the two following formulations, suitable for cot(α) < 1.43:
{ Q = [ 0.033 cot ( α ) + 0.062 ] e [ ( 1.08 cot ( α ) 3.45 R ] for  R < 0.8 Q = 0.2 e [ ( 1.57 cot ( α ) 4.88 R ] for  R 0.8

1.4. Development of an Overtopping Model Specifically Suited to Wave Dragon

Although models presented in Section 1.3 have been developed for overtopping WECs, they are not fully representative of the Wave Dragon geometry. The best suited is the one from Equation (7), which has been used up to now for Wave Dragon, with a κ = 1 as suggested by the analysis of data from the prototype sea trials [12]. Nevertheless the experimental setup used in its determination did not account for the specific 3D geometry of Wave Dragon, for the effect of the reflector wings or the dynamic response to waves. In order to develop a tool allowing for more accurate predictions of Wave Dragon power production, all these factors have to be taken into account. The aim of the research presented here has been therefore to develop an updated overtopping model based on Equation (7), specifically suited for the Wave Dragon case although with as large applicability as possible.
A series of tank testing experiments on a 1:51.8 scale model of a 4 MW Wave Dragon was carried out in 2011–2012 to fulfill this purpose. The study included four different phases, in any of which a different sensitivity analysis was carried out to identify the influence of a specific feature of the setup or of the waves on Q: the effect of Sp and the real 3D geometry of Wave Dragon (phase 1), the enhancing effect of the reflector wings (phase 2), the effect of the motions of the device (phase 3) and of the variable rigidity of the connection between the wings reflectors and the main platform (phase 4). Following the approach used by Kofoed and outlined by the authors in a previous publication [13], the setup tested in each phase differed from the previous one only in that changes were applied to the feature under study, so that differences in the measured q could be fully ascribed to it and the influence on q quantified by performing sensitivity analyses. The effects considered could be therefore individually modeled through custom-made correcting factors, depending on physical features of the setup geometry or the wave field, inserted in the model formulation described by Equation (7). This approach resulted in a formulation with a broader applicability than if would have been by simply using new fitting coefficients.
The paper describes the setup used in the tank testing and relative data analysis methodology used in each of the four phases, describing the process that led to the development of the updated version of the overtopping model. Predictions are compared to the experimental measurements, showing an increased accuracy and precision in the case of the updated version of the model respect to the other models suitable for overtopping WECs [Equations (7) and (11)]. A discussion on the reliability of the model and its applicability is finally carried out and further work required is outlined

2. Experimental Setup

The tests were carried out between 2011 and 2012 at the deep water basin of the Hydraulic and Coastal Laboratories at the Department of Civil Engineering of Aalborg University. They were performed on the 1:51.8 scale model of a full-scale Wave Dragon suitable for deployment in the North Sea, with rated power of 4 MW in a wave climate of 24 kW/m.
Full-scale values can be derived from the measurements by applying Froude scaling law, accounting for the effects of gravity forces as the most relevant in defining the wave motion. Effects from friction and surface tension have been avoided for waves by preventing the generation of very small waves, although related scale effects cannot be completely excluded regarding the overtopping process. Validation of the results at a larger scale will be therefore required in the future.
Under different wave conditions and for different configurations of the model the average overtopping flow q (m3/s) has been measured. The water overtopping the ramp of the model into the reservoir was led through flexible pipes into an external tank (Figure 3).
Figure 3. Sketch of the setup used in the tank testing.
Energies 06 01961 g003
Here a calibrated pump controlled by a wave gauge was activated any time the water level reached a pre-set value. By counting the number of cycles of the pump and by measuring the water level in the external tank at the beginning and end of each test, it was possible to calculate the water volumes coming into it over the duration of a test. Being a closed system, these corresponded also to the volumes of water overtopping the ramp into the Wave Dragon reservoir. The average overtopping flow over the duration of the test has been derived by dividing the overtopped volume by the duration of the test, 30 min.
All waves have been generated irregular according to a JONSWAP spectrum describing fetch-limited seas, for which wave energy is more concentrated around the peak frequency. This is described through a peak enhancement factor γ, which is normally assumed to be 3.3 for the Danish North Sea. Waves generated have been recorded by a rig of seven wave gauges in a 2D array placed between the wave paddles and the WD model (Figure 3). A wave analysis was performed on the recordings, which allowed determining the incident and reflected components as well as their directionality. Wave features used in the data analysis refer to the incident component. The five standard Wave States (WS) listed in Table 1, which describe operational conditions in the Danish part of the North Sea [14], have been considered as target wave conditions in the study.
Table 1. Standard WS describing operational conditions in the Danish part of the North Sea [14].
Wave stateHm0 (m)Tp (s)Energy flux (kW/m)Probability of occurrence (%)
11.05.62.146.8
22.07.011.622.6
33.08.432.010.8
44.09.865.65.1
55.011.2114.02.4
Additional Hm0-Tp combinations have also been tested, resulting in wave conditions with an increased range of peak wave steepness of 0.011 < Sp < 0.039 and mean value Sp,mean = 0.02. For the average slope of the Wave Dragon ramp this corresponds to a range of the peak breaking parameter of 4 < ξp < 7.5, with ξp,mean = 5.6. These values refer to the actual Lp at the water depth considered for the study, corresponding to a full-scale value of d = 33.5 m (mostly transitional waters). The choice of considering the peak value is made for consistency with the notation used by Kofoed [(Equations (8) and (9)]. At the same time different values of the ramp crest height Rc (m) have been considered, corresponding to 4, 3, 2, 1 and 0.5 m at full scale. Only combinations leading to 0.2 < R < 1.5, typical of operational conditions, have been actually tested. The above mentioned wave conditions and R have been varied in every phase of the study. On top of these, additional variables have been considered in specific phases of the study, an overview of which is given in Table 2 together with a summary of tested setup and research aim. The part of research performed by Kofoed [10] relevant for this study is also included as a reference (i.e., phase 0), as it is considered as baseline for the development of the updated model.

3. Results

3.1. Phase 1—WDOTph1: Reference Formulation for Wave Dragon Overtopping Model

Phase 1 was aimed at establishing a reference formulation of the overtopping model as an updated version of Equation (7), which would be specifically suited for the case of Wave Dragon and used as basis for further improvements of the model in the next phases of the investigation.
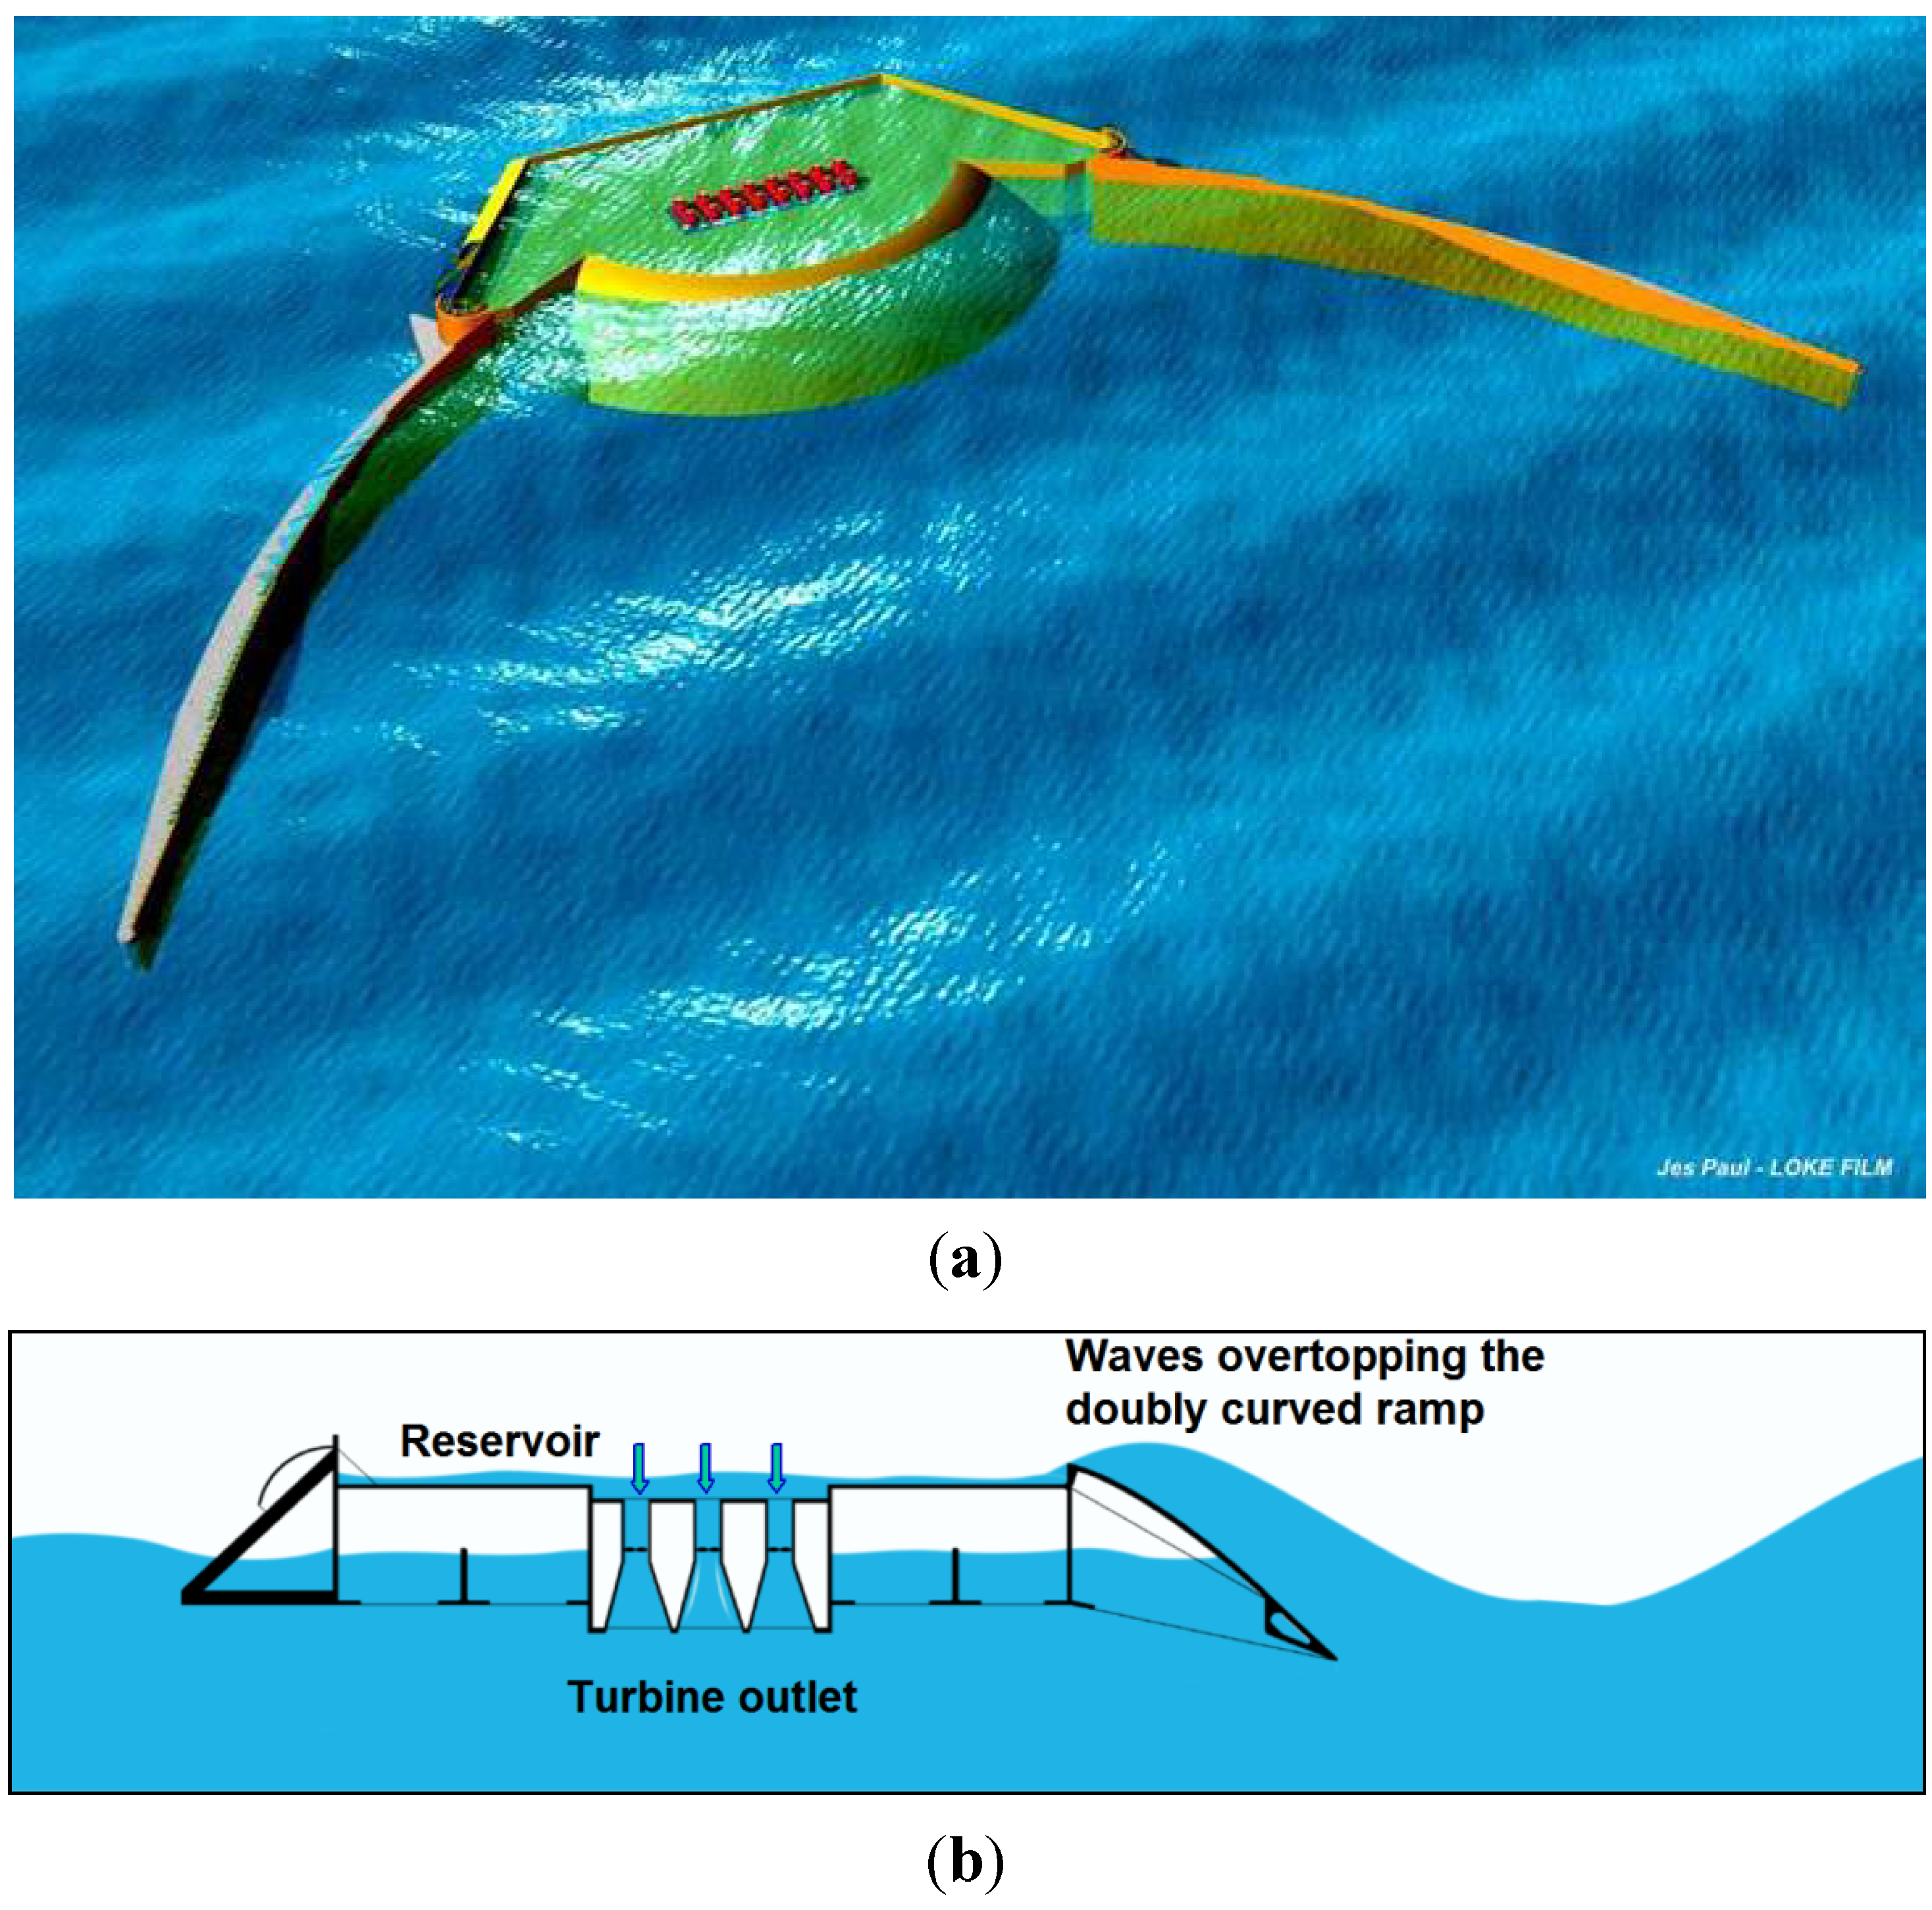
In order to do so, a setup including the main platform of Wave Dragon only was tested, fixed to a rigid rig in order to avoid any dynamic response to waves. Respect to the setup tested by Kofoed the only difference is therefore that here the real 3D geometry of the device was accounted for (Figure 4). In the following this version of the model is referred to as the Wave Dragon overtopping formulation from phase 1 (WDOTph1).
Literature about overtopping over coastal defense structures considers the effect of the breaking parameter only for breaking conditions: here Q increases with ξ−1,0 until reaching a maximum in non-breaking conditions, when the dependency no longer holds [5]. Due to the design of the ramp, wave breaking never occurs with Wave Dragon; nonetheless, the geometrical differences existing with respect to traditional coastal defense structures, especially with respect to the lower R generally considered, allowed the effect of Sp on Q to be investigated here.
Table 2. Summary of the four investigation phases, including: a description of the setup tested, the additional variables investigated and the range of values considered in the each sensitivity analysis, the correcting factor introduced in the model and the effect described. A qualitative analysis is carried out if no correcting factor is introduced; correcting factors for which no sensitivity analysis has been performed are fitting coefficients. Part of the research from Kofoed [10] is also included as a phase 0.
Phase #SetupVariables investigated (sensitivity analyses)Range (full-scale)Correcting factor introducedEffect described
02D slope with limited draft and low Rc, fixeddr/d (-)0–1λdr(-)Limited draft
low R(-)0–0.75 λs(-)Low Rc
1Main platform only, fixedSp(-)0.011–0.039ξp(-)Peak wave steepness
--λwd, γwd3D WD geometry
s2, 10, 20-Wave spreading through cos2s function
γ1, 3.3, 7-Wave spectral shape through peak enhancement factor
2Main platform + reflectors, all fixedop (°)26.8, 33.6, 38.7ζopReflectors opening angle
drR (m)(14–Rc), (13–Rc), (11.4–Rc)ζdrRReflectors draft
--aReflectors maximum wave amplifying effect
3Main platform + reflectors, free floating as a rigid bodySurge, heave and pitchResponse to operational conditions, restrained by mooring line with k = 1260 kN/mλφPitch oscillation
4Main platform fixed; reflectors connected to the platform through a ball joint allowing roll motion, free floating at the tipRigidity in the connection between main platform and reflectorsThree friction levels at the joint connection (qualitative)ζstEnergy dissipated through the reflectors roll motion
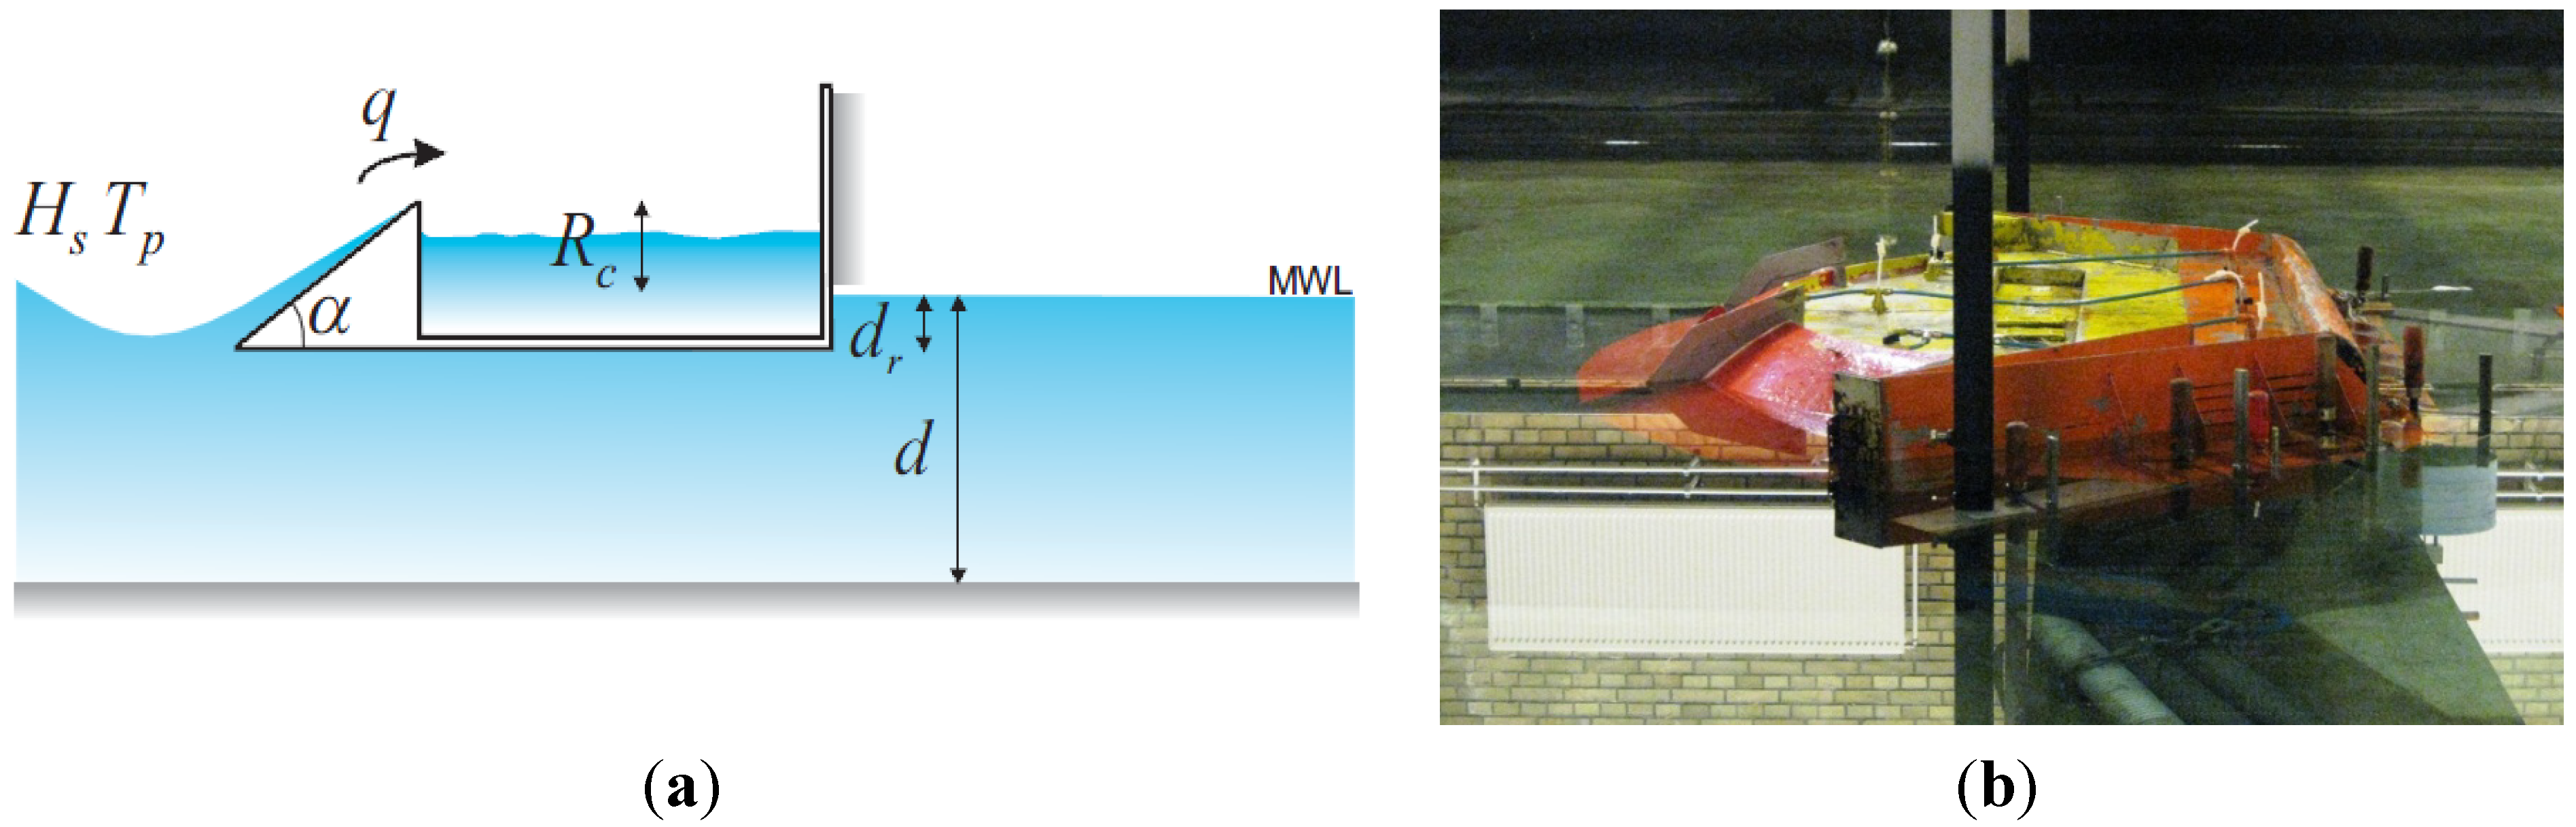
Figure 4. Setups tested by (a) Kofoed [7]; and (b) in the determination of WDOTph1.
Energies 06 01961 g004
By including in the model formulation the peak breaking parameter ξp a significant improvement could be achieved on the predictions quality. This can be assessed by considering the normalized response Qnorm(-) = Q/A [
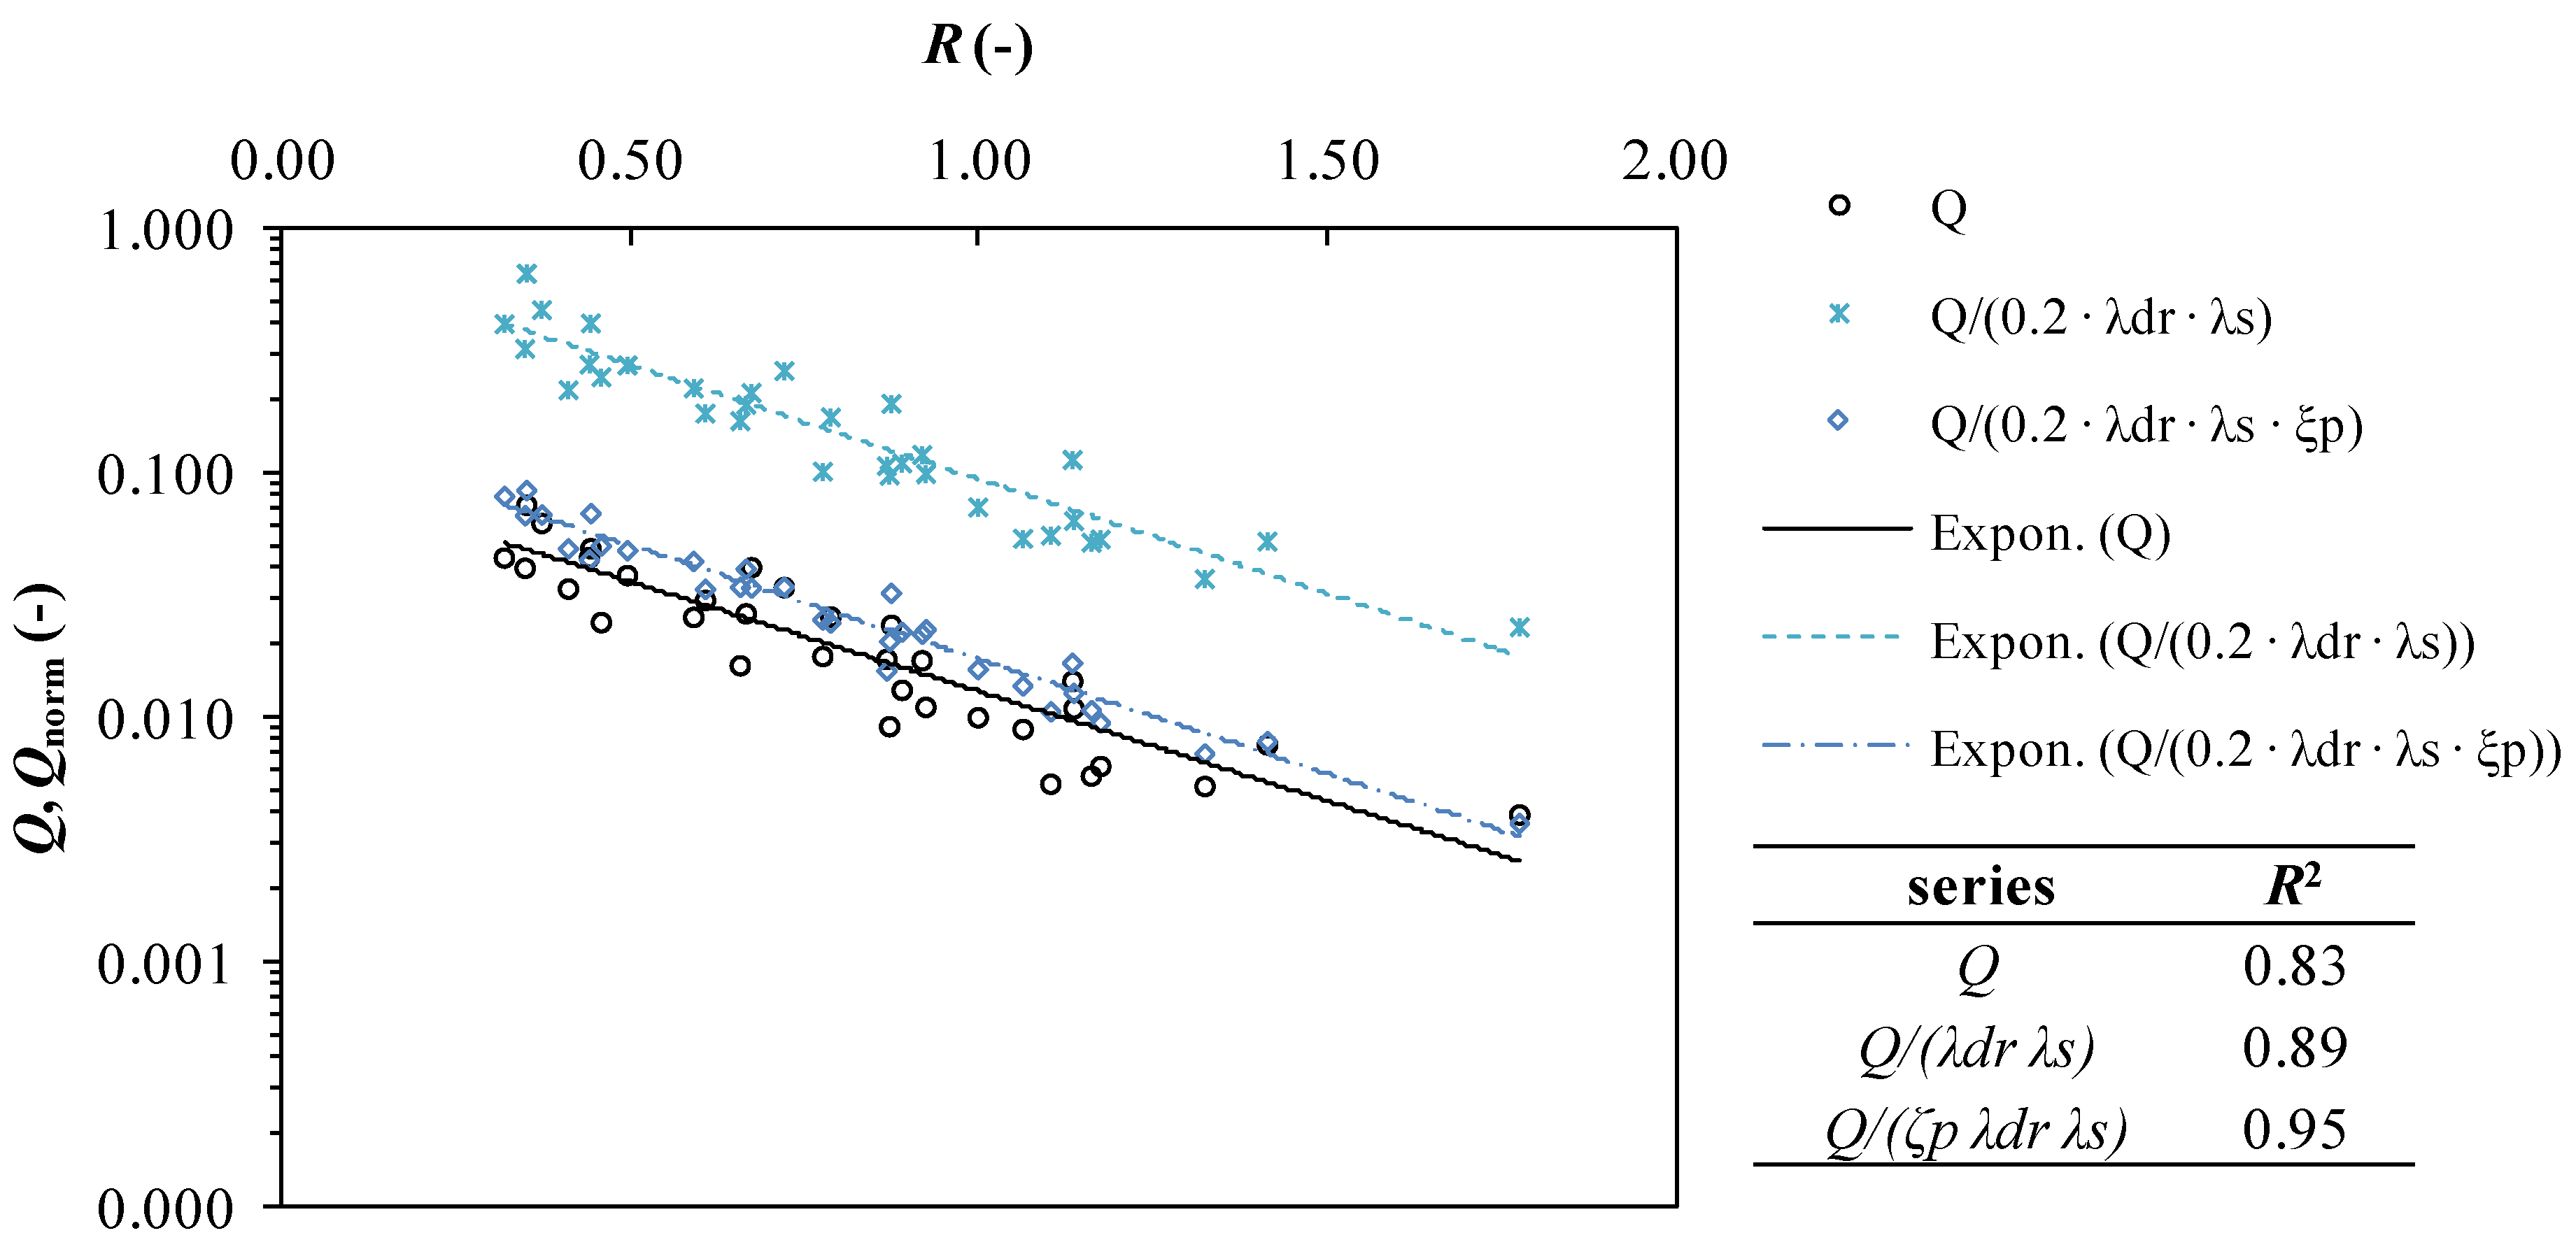
i.e., the product of all the offset-correcting factors of the exponential function Equation (5)] As can be seen in Figure 5 the correlation coefficient of the predictions (R2) increased as Qnorm is considered, as in this case the right side of Equation (5) is more similar to a pure exponential function. This means that the overtopping process can be better described by taking the considered correcting factors into account. The improvement is more evident as ξp is introduced among the offset-correcting factors.
Figure 5. Increased precision showed through the R2 of the model as the offset-correcting factors are included. Measured Q are in black dots, normalized response from Equation (7) in light blue stars, normalized response from WDOTph1 (including ξp) in blue diamonds. Exponential trend-lines are shown for each dataset, y-axis in logarithmic unit
Energies 06 01961 g005
The choice was made to keep the same fitting coefficient used in Equation (7). In this way, having already accounted for the effects of limited draft, low Rc and ξp through the introduced offset-correcting factors, the gap between measurements and predictions can be fully ascribed to geometrical differences between Wave Dragon and the setup previously tested by Kofoed (Figure 4). A set of complementary fitting coefficients was therefore derived to fill this gap, describing the effect of the 3D Wave Dragon geometry on Q: λwd(-) = 0.1502 is an offset-correcting factor and γwd(-) = 0.8275 is a gain-correcting factor.
The resulting WDOTph1 model formulation is therefore Equation (12). Here λdr and λs are still provided by Equations (9) and (10), with κ = 1:
Q = 0.2 λ d r λ s ξ p λ w d e ( 2.6 γ w d R )
All the correction factors introduced describe a physical process, depending either on the wave features or on the setup configuration. This extends the applicability of the model to any configuration within the range of tested conditions. Respect to Equation (7) the effects of Sp and of the 3D geometry are included. The latter is defined through complementary fitting coefficients which shall be determined on a case-by-case basis for any specific geometry, as done here for the case of Wave Dragon.
The effect of spectral shape and wave spreading were also qualitatively assessed in this phase through sensitivity analyses. The spectrum peak enhancement factor γ was varied from the standard value of 3.3 (normally used for the North Sea), testing values of γ = 1 and γ = 7, representative respectively of fully developed seas (Pierson-Moskovitz spectrum) and narrow banded spectrum typical of very short fetch lengths. The spreading coefficient s of the cos2s spreading function was also varied from the standard value of s = 20 (almost 2D waves), testing s = 2 (highly 3D waves) and s = 10 (mildly 3D waves). From the results it was concluded that the spectral shape has no influence on Q, which instead increases as waves become long crested [15].

3.2. Phase 2—WDOTph2: Effect of the Wing Reflectors

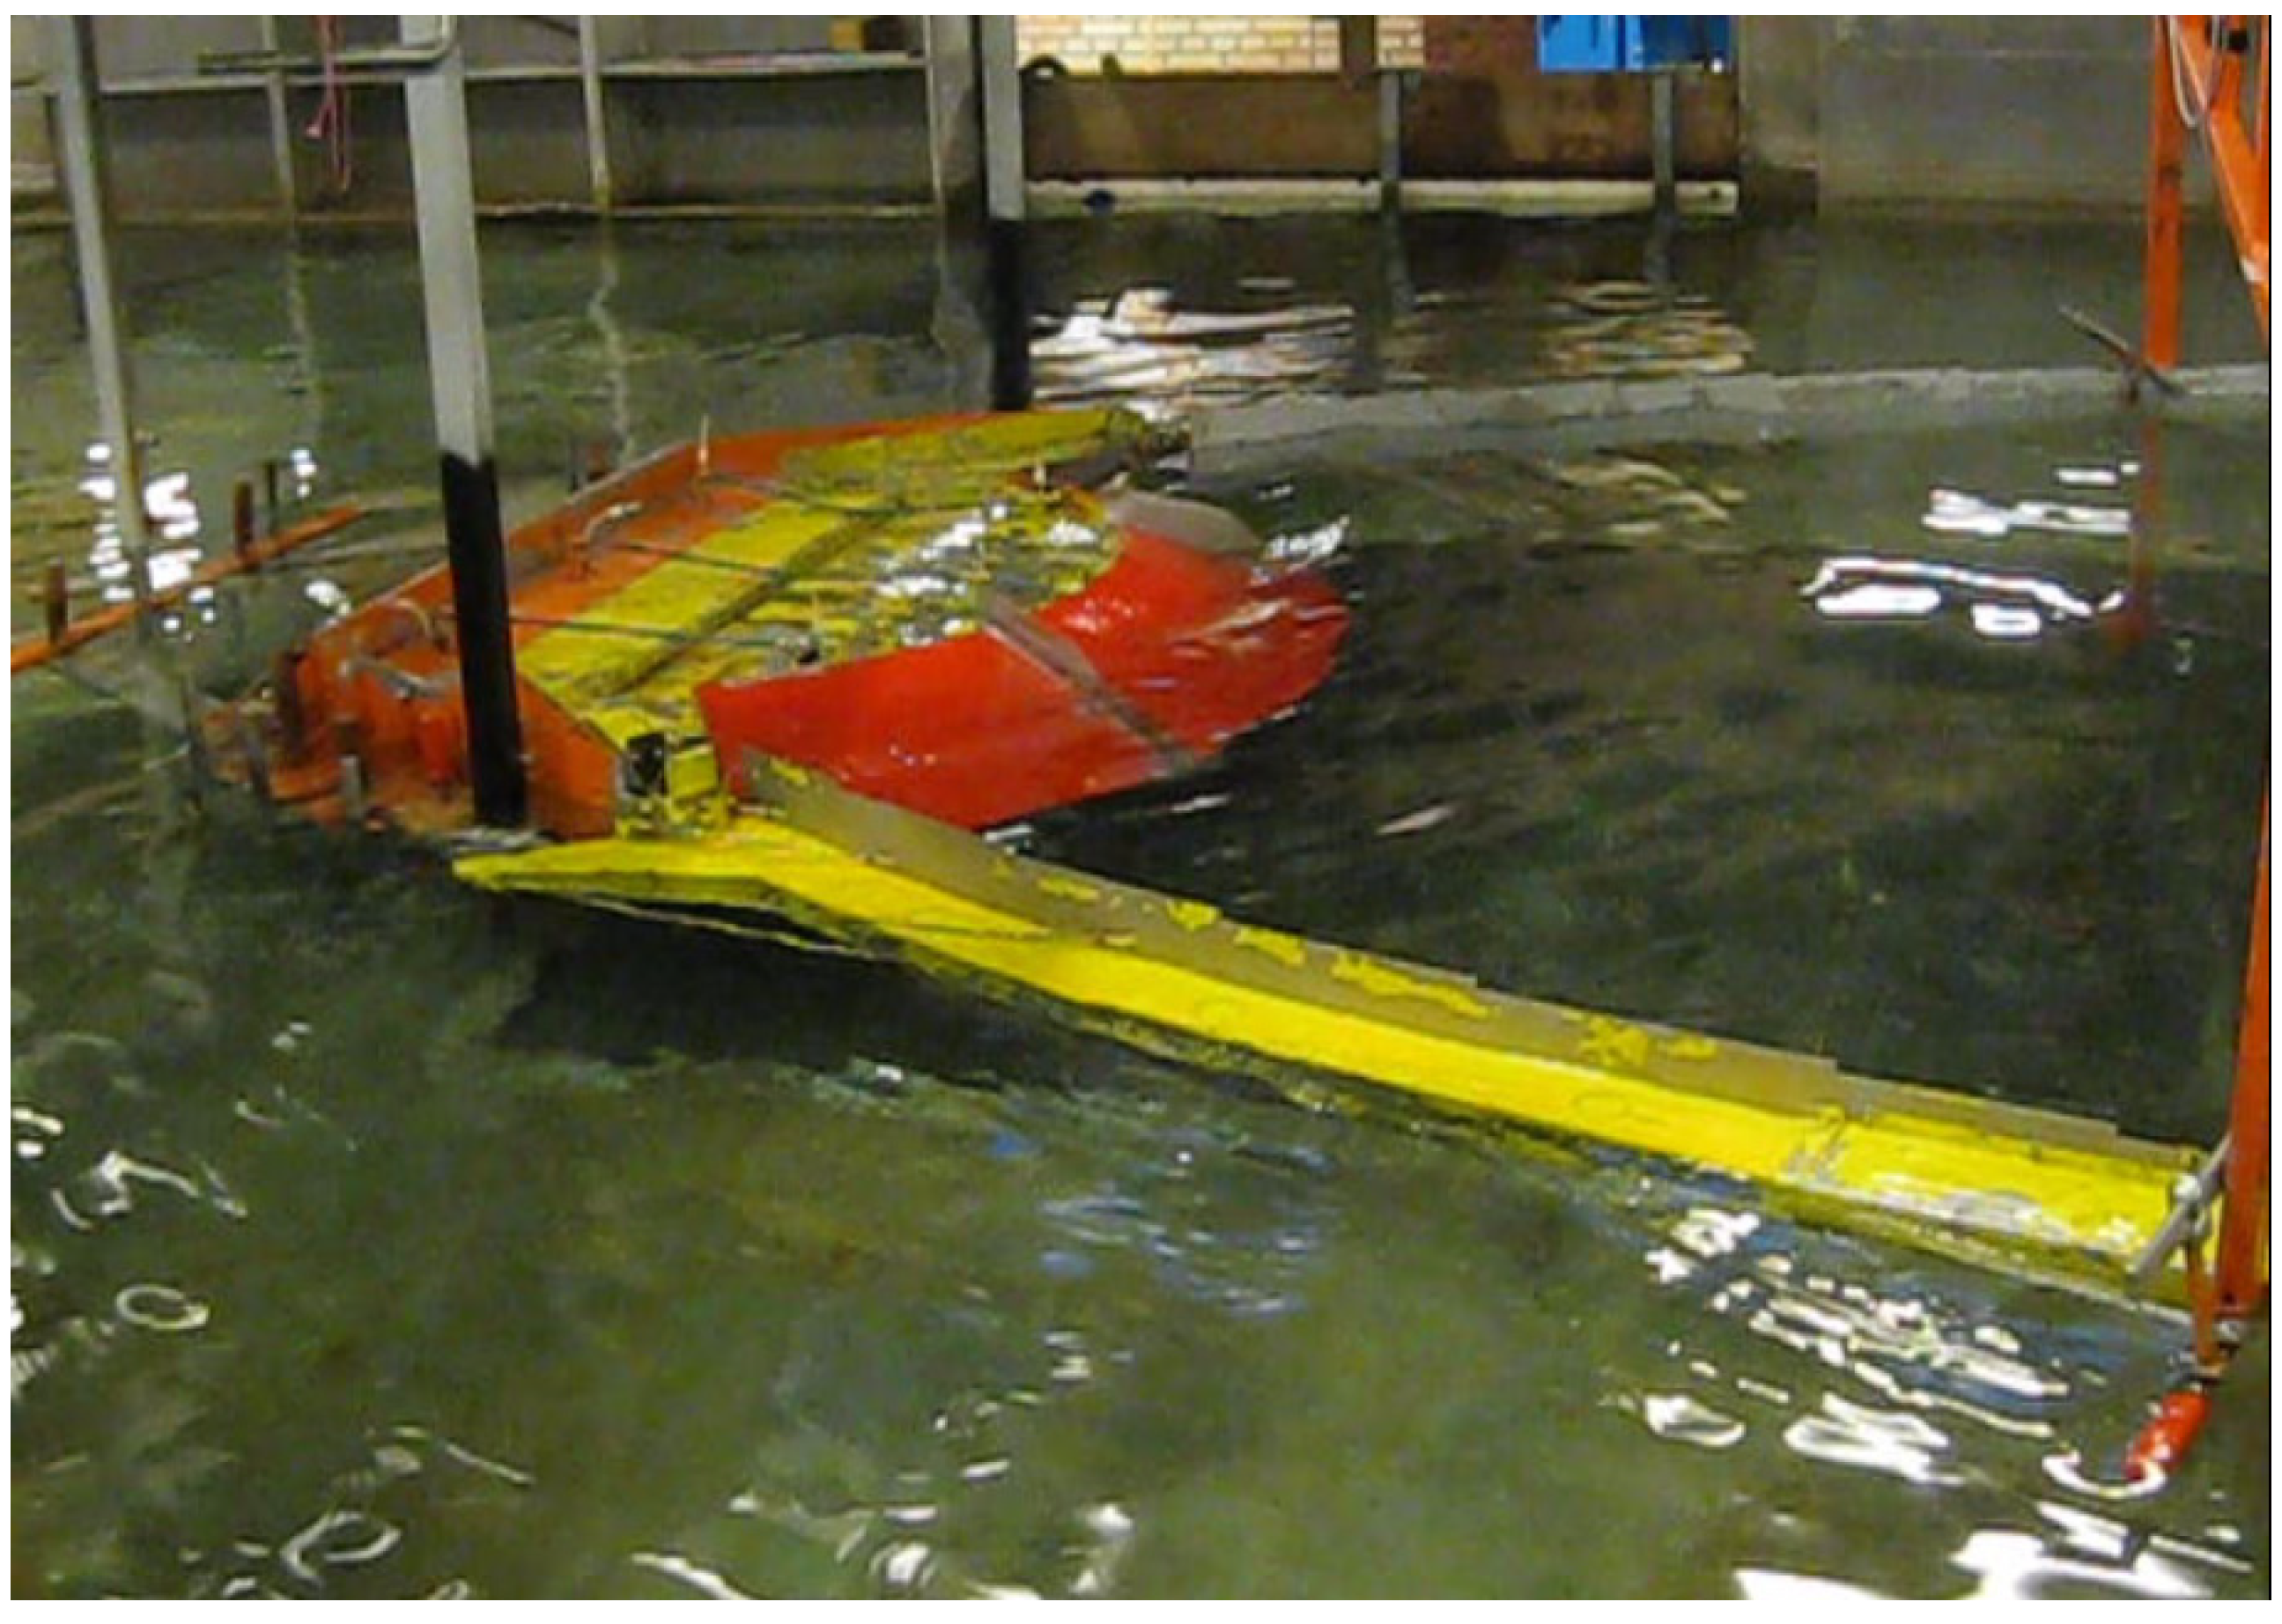
In phase 2 the effect of the reflectors has been investigated, resulting in the model formulation called WDOTph2. Respect to phase 1, the reflectors were included in the setup, rigidly fixed to the platform in order to avoid any relative motion (Figure 6). Any difference between measurements and predictions from WDOTph1 model can be therefore ascribed exclusively to the effect of the reflectors.
Figure 6. The model tested in phase 2. Both platform and reflectors were restrained from motions.
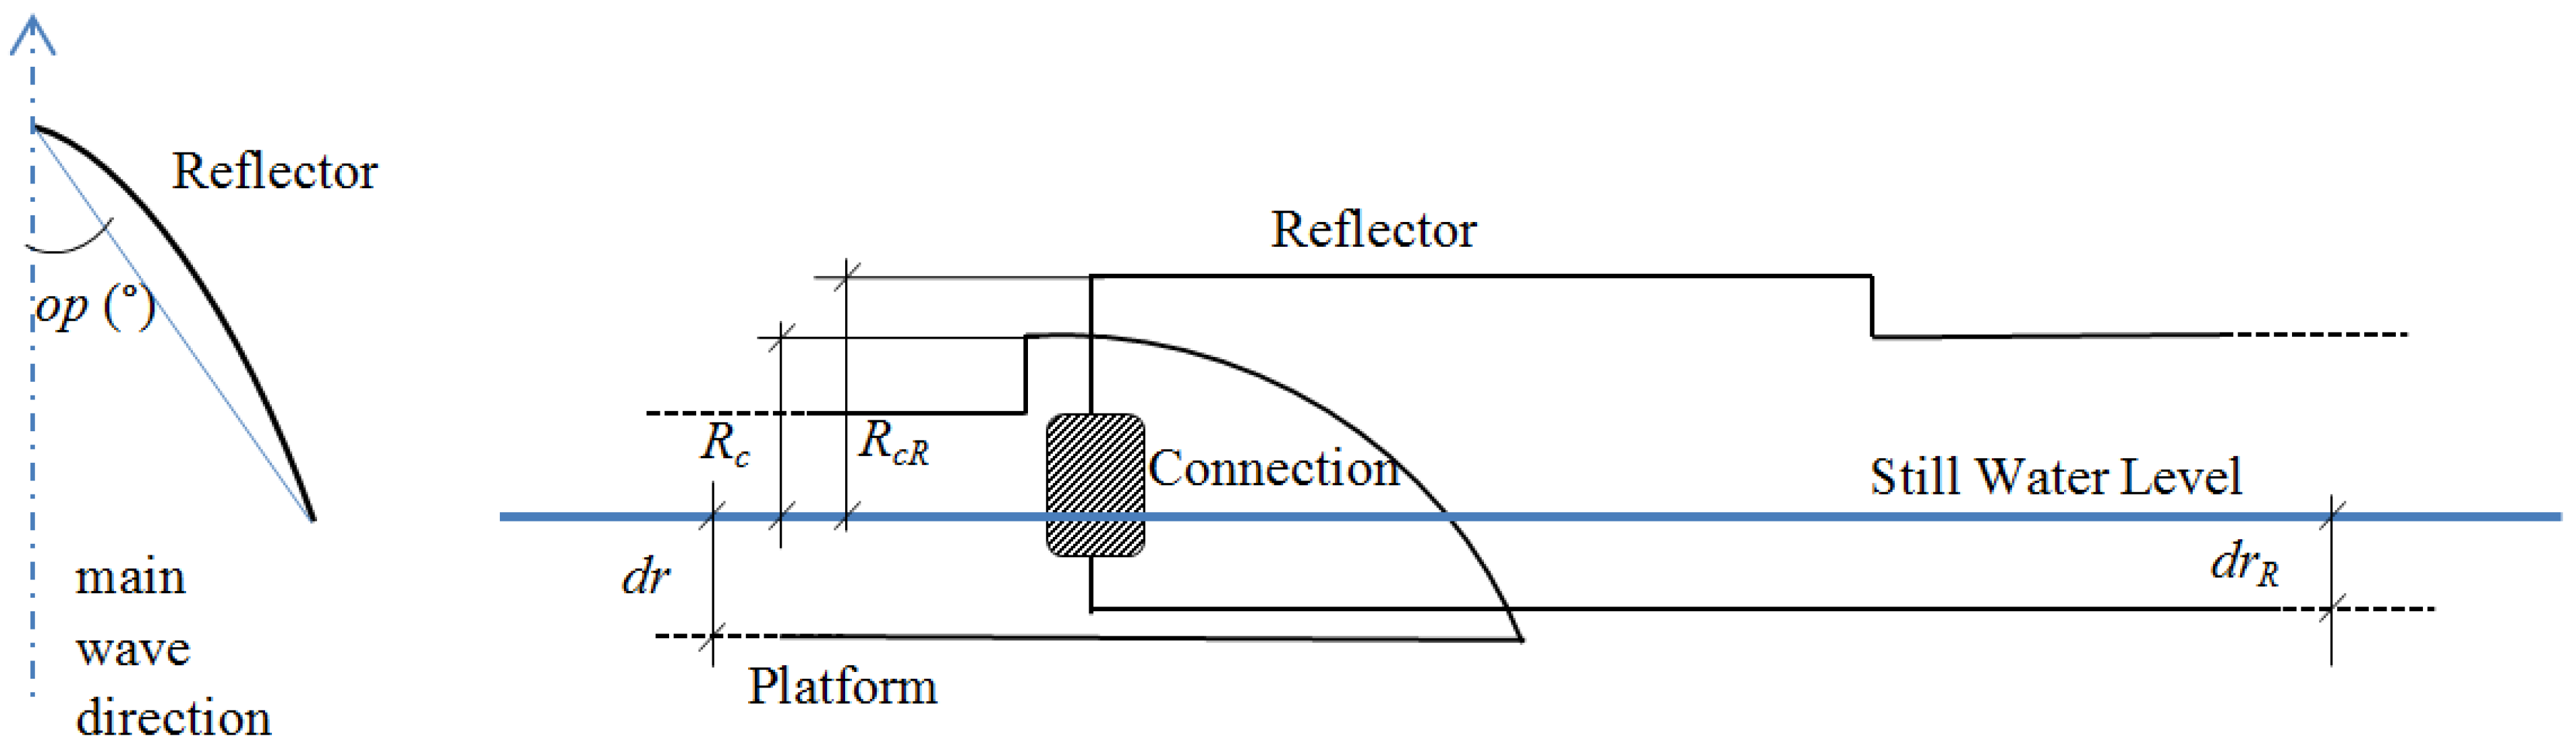
Energies 06 01961 g006
Their draft, drR (m), and opening, op (°), were varied throughout the study to assess their influence through a sensitivity analysis (Figure 7). The opening of the reflectors is considered as the angle the main wave direction forms with the straight line between their tip and connection with the platform. Tested values have been referred to as op0 = 33.6°, op+1 = 38.7° and op−1 = 28.6°.
drR has been progressively increased by lowering the reflectors connection with the platform. Values tested have been drR,0, drR,−1 and drR,−2, corresponding respectively to the freeboard of the reflector being 2 m higher, 1 m higher and 0.5 m lower than Rc at full scale.
Figure 7. Sketch showing how reflectors features (op and drR) have been considered in phase 2.
Energies 06 01961 g007
A different approach than in phase 1 was used to update the model in phase 2. The rationale is that the reflectors act on the incoming wave field rather than modifying the overtopping itself. This effect is accounted for through a wave amplification model (WAM) to be used in the case reflectors are included in the setup; this provides an amplified significant wave height at the ramp, Hm0' (m), which depends on the undisturbed Hm0 and the reflectors setup:
H m 0 = H m 0 a ζ d r , R ζ o p
here a = 1.13 is a fitting coefficient representing the maximum wave amplification achievable, while ζdr,R(-) and ζop(-) are non-dimensional correcting parameters accounting for the effects of drR and op on the wave amplification, both ranging from 0 to 1.
ζdr,R is still provided by Equation (9) using κ = 0.1 and drR in place of dr. The opening effect is accounted for through ζop = cos (opKop), where Kop (°) represents the optimal opening angle at which the wave amplification is maximum. By best fit Kop = 40°, hence very close to op+1 [15].
With this approach the formal definition of Equation (12) can still be used as WDOTph2, but it shall be applied on the Hm0' provided by the WAM [Equation (13)]. To do so, all factors depending on Hm0 (hence Q, λs, ξp, R) have to be re-calculated from the formulations above based on Hm0'. To distinguish them from the original ones used in WDOTph1, they are also marked with a superscript:
Q = 0.2 λ d r λ s ξ p λ w d e ( 2.6 γ w d R )
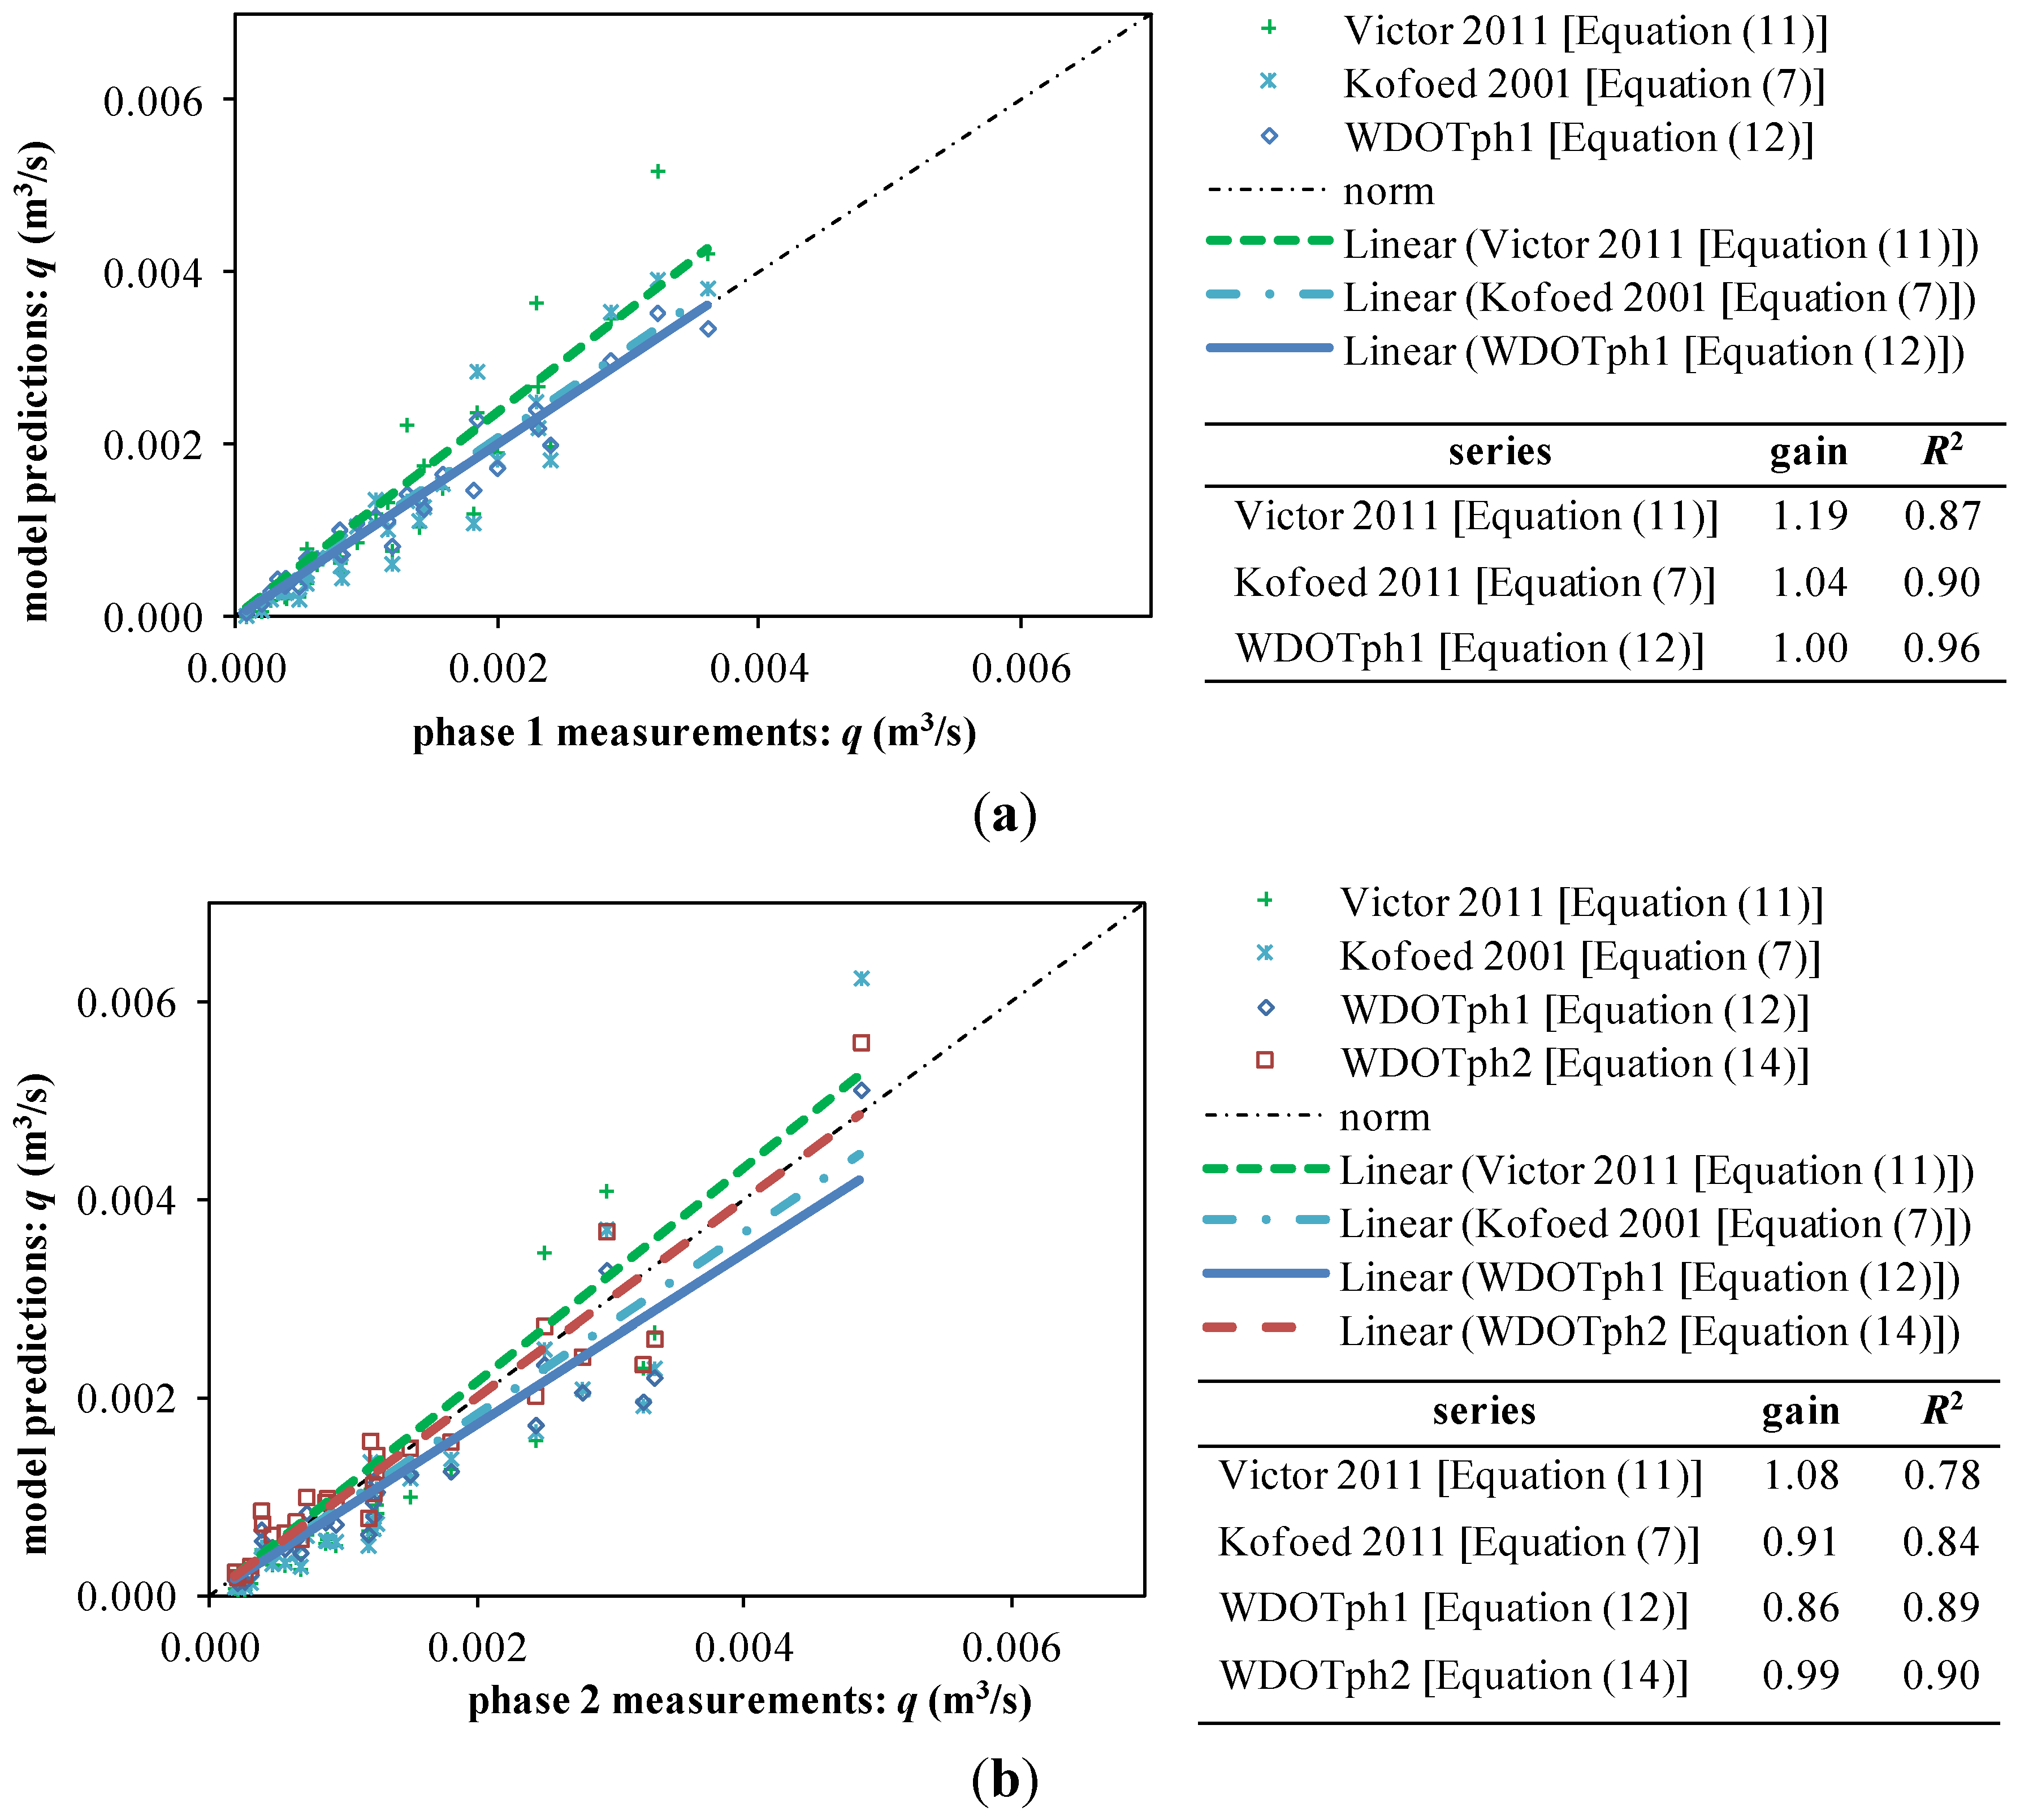
Model improvements from these first two phases can be seen in Figure 8, where the q (m3/s) predicted from each model are plotted against the values of q measured in the relative phase. WDOTph1 and WDOTph2 are shown, together with the three reference models described in Section 1.2 for comparison. The gain of the linear trend-line indicates the model’s accuracy (i.e., its ability to predict the measured data), while the correlation coefficient R2 indicates the model’s precision (i.e., its ability of reproducing the same results for the same input conditions). The overall quality of the model increases as these two values get closer to 1.
Figure 8. Average overtopping discharge, q (m3/s): predictions from the models vs. measurements. Updated WDOT models as well as compared models from literature are shown. Models accuracies are measured by the gain of their linear trend-line (a target gain = 1 is shown as a black dash-dot line); their precisions by the trend-line R2 coefficients. (a) Quality of WDOTph1 and reference models, based on phase 1 measurements; and (b) quality of WDOT and reference models, based on phase 2 measurements.
Energies 06 01961 g008

3.3. Phase 3—WDOTph3: Dynamic Response to Waves

In phase 3 the same setup used in phase 2 was tested, but it was left free to move as a rigid body (i.e., the relative motion between main platform and reflectors being still restrained). Direct comparison between measurements and WDOTph2 predictions allows accounting for the effect of Wave Dragon’s motions on its overtopping performance. drR was set equal to dr and op to the optimal value of 40°.
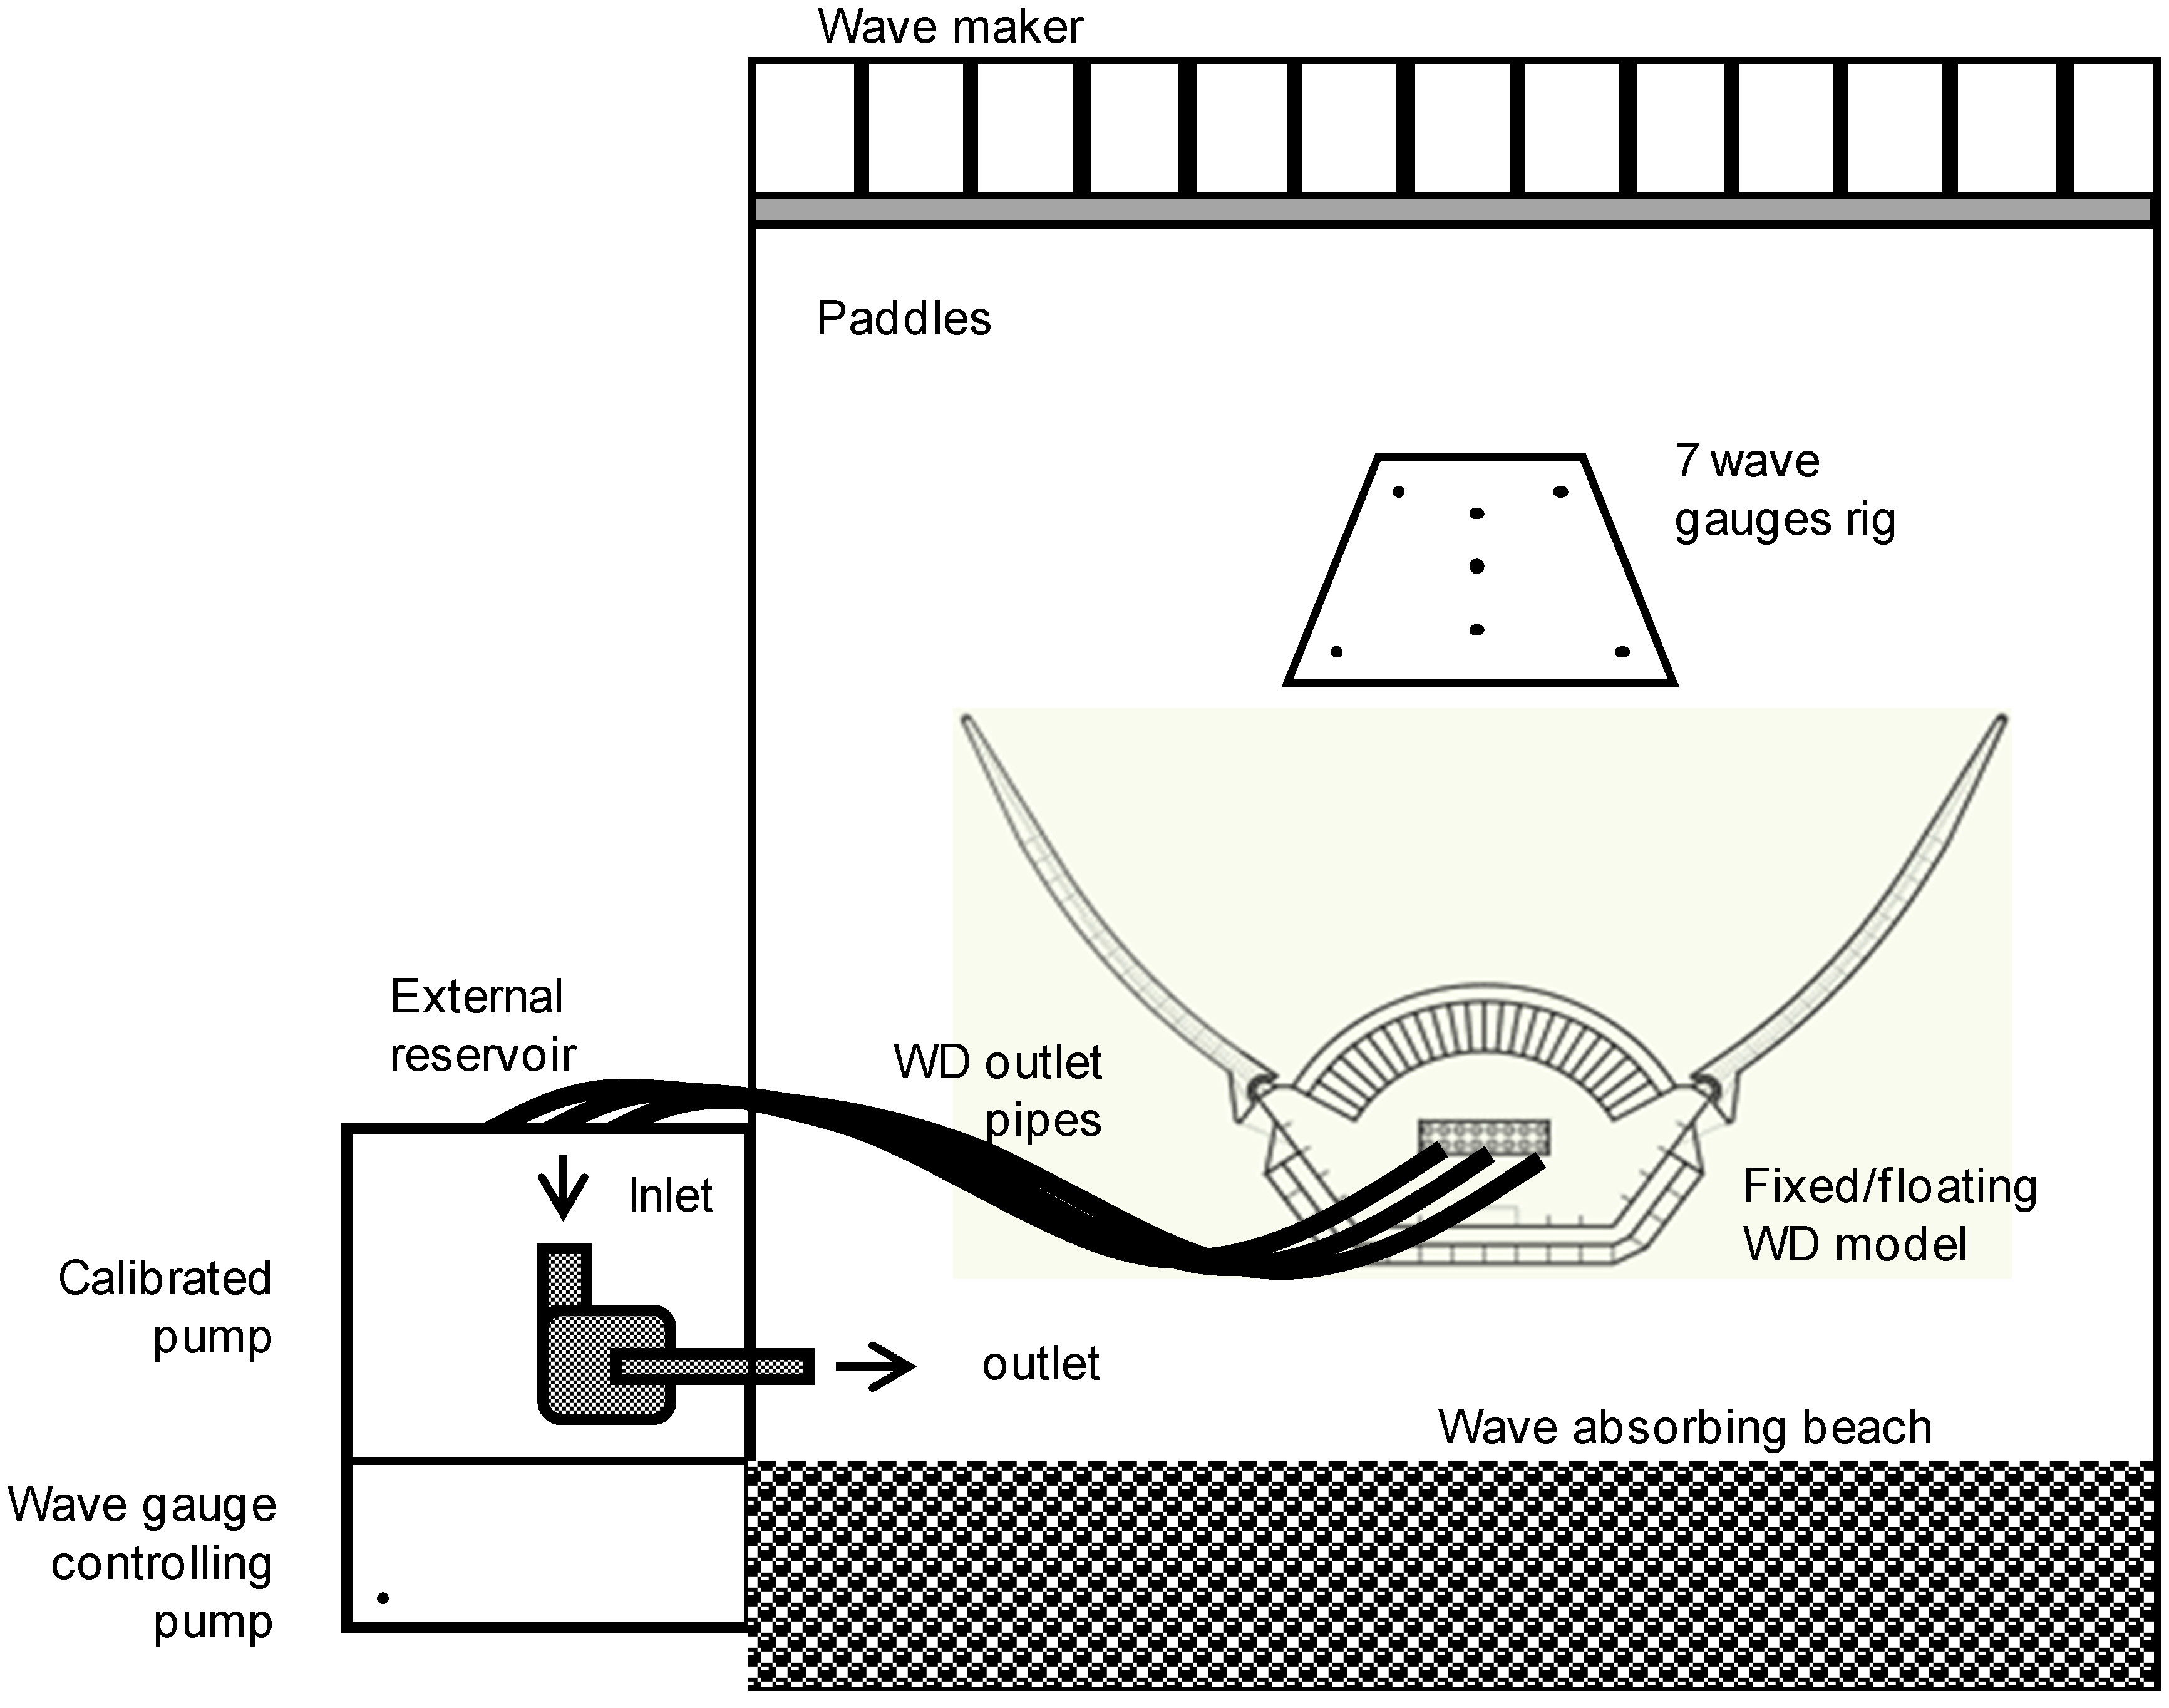
The model was moored to a vertical beam through a front line which stiffness was modeled through a piece of rubber line conveniently chosen; its stress-deformation curve was linear in the range of tensions tested and has previously been calibrated providing a stiffness coefficient of 470 N/m, corresponding to about 1260 kN/m at full-scale (Figure 9).
Figure 9. 
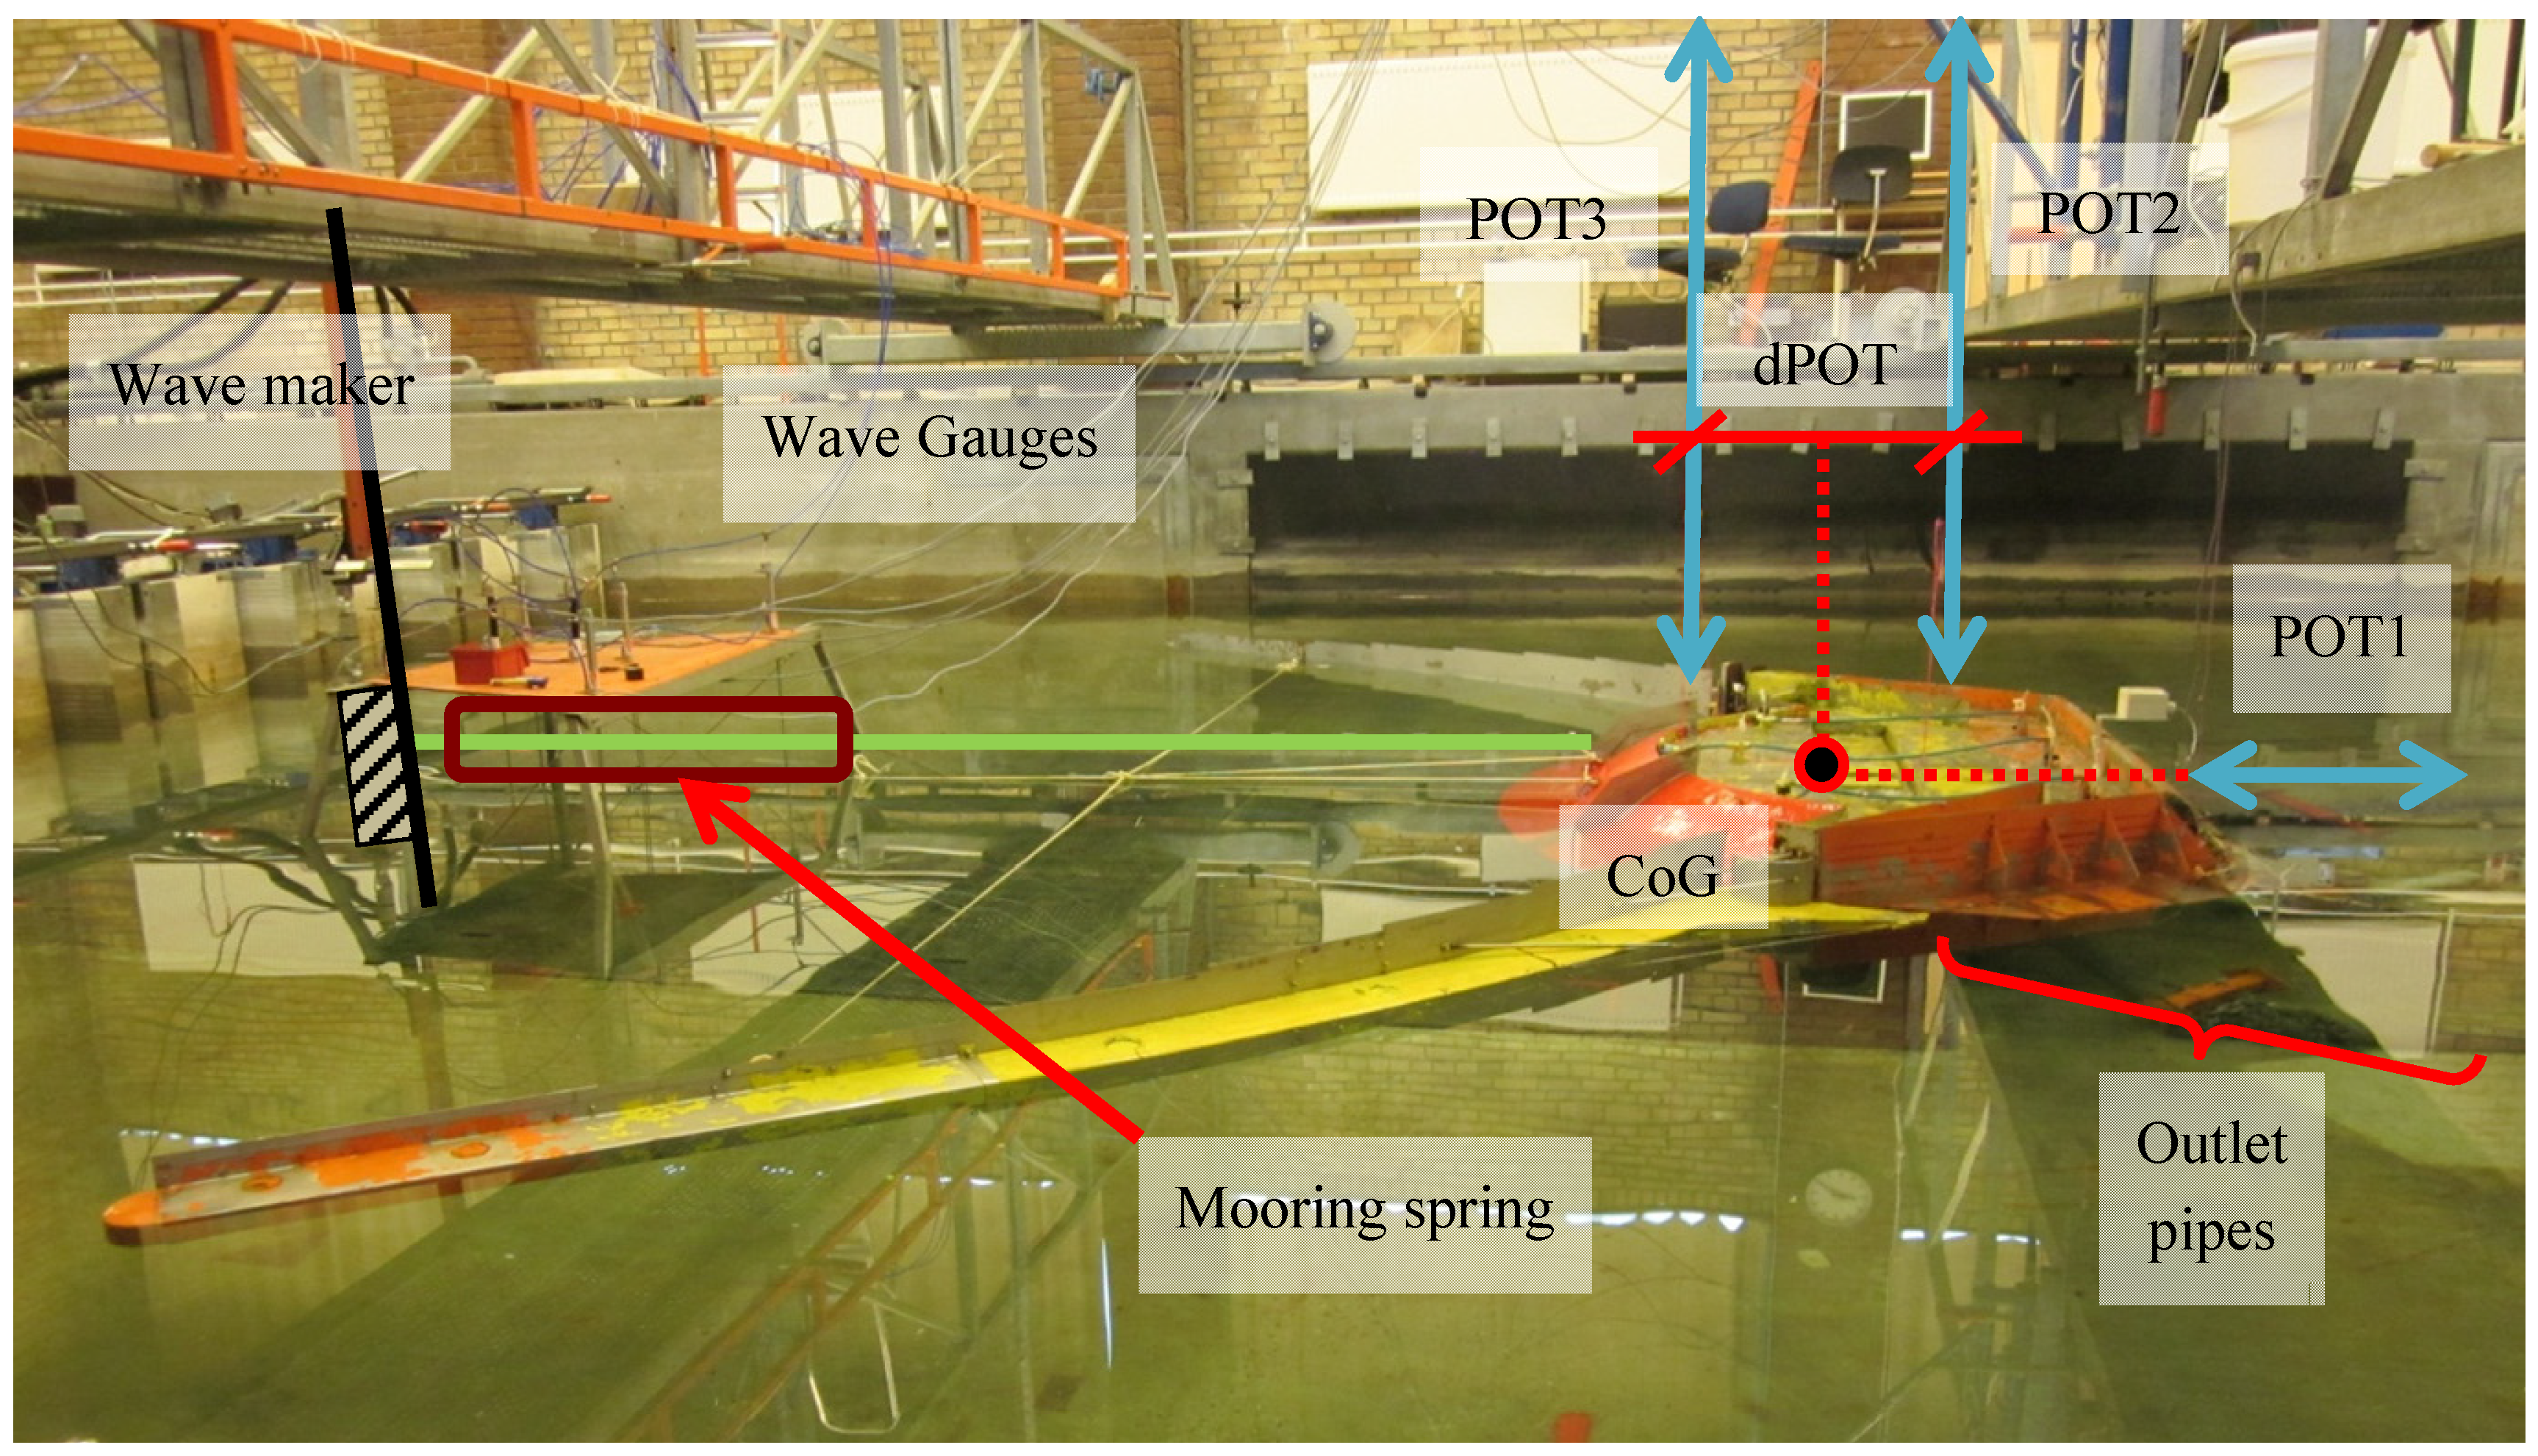
Phase 3 setup, the following is shown: wave maker on the left; fixed vertical beam used as anchoring point; mooring line (green) with spring modeling the required stiffness (brown box); wave gauges rig; potentiometer (POT) set used to measure the model displacements and Rc (blue arrows); Centre of Gravity (CoG) estimated position (black dot); outlet pipes leading overtopped water to the external reservoir.
Energies 06 01961 g009
Motions in pitch, θ (°), heave, Z (m), and surge, X (m), were measured by a set of potentiometers; correlation between motions has been accounted for by knowing the position of the center of gravity, which was estimated to be at half the distance between the two vertical potentiometers POT2 and POT3, called dPOT (m), and at the same height as the horizontal potentiometer attachment to the platform, POT1 (Figure 9). This also allowed correcting the target crest height, Rc,t, according to the mean heave motion and pitch, so that the mean value of the instantaneous Rc was considered in the following data analysis:
θ (°) = atan (POT3 − POT2)/dPOT
Z (m) = − (POT2 + POT3)/2
X (m) = − POT1+ X0 ∙ (1 − cos (θ))
Rc (m) = Rc,t + mean (Z) – dRc ∙ sin (θ)
being X0 (m) the horizontal distance between the attachment of POT1 and CoG, and dRc (m) halfway the horizontal distance between the CoG and Rc, measured at the centerline (Figure 9). According to Equation (15) pitch is positive as the ramp lowers, heave upwards and surge in the wave direction.
The average response has been described by analyzing the motion signals in frequency domain, deriving the standard deviation σ = m 0 and mean frequency of oscillation from spectral analysis ϕ0,2 = 2π/T0,2; the extreme response has been derived from time domain analysis as average of the 1/250 highest values, i.e., θ1/250 for pitch. The choice is made to consider a full oscillation rather than the maxima as it better represents the motion of the device around a mean position, as both motions in the positive and negative direction affects q. The following offset-correcting factors are therefore introduced:
λ X = 1 φ 0 , 2 ω 0 , 2
λ Z = 1 4 σ Z H m 0
λ ϑ = 1 4 σ ϑ m a x ( ϑ 1 / 250 )
where ω0,2 (rad/s) = 2π/T0,2 is the wave mean angular frequency. Equations (16)–(18) express the fact that the correcting factors, hence q, are reduced as much as the motion response of the device increases; this is expressed in a non-dimensional way, referred to features of the wave in the case of surge and heave, or to a maximum value recorded in the case of pitch. These factors are derived as a linear interpolation considering as boundary conditions the case of large response, for which the value of the correcting factor approaches 0 and q decreases, and low response, for which the correcting factor approaches 1 and q is not affected by the motion. In particular they express that:
  • q decreases as much as the surge mean frequency approaches the wave frequency, i.e., the device enter in resonance with waves; in this case the relative motion of the device respect to waves increases;
  • q decreases as much as the heave significant oscillation from spectral analysis 4 ∙ σZ approaches the significant wave height Hm0, when the relative motion of the device in waves also increases;
  • q decreases as much as the pitch significant oscillation 4 ∙ σθ increases; this is referred to a fixed value, the maximum extreme pitch oscillation in operational conditions recorded during the tests: max(θ1/250) = 8°. It shall be stressed here that λθ > 0 as the significant pitch oscillation will necessarily always be smaller than the maximum among the extreme values; as a proof of this, in phase 3 the range was 0.45 < λθ < 0.92.
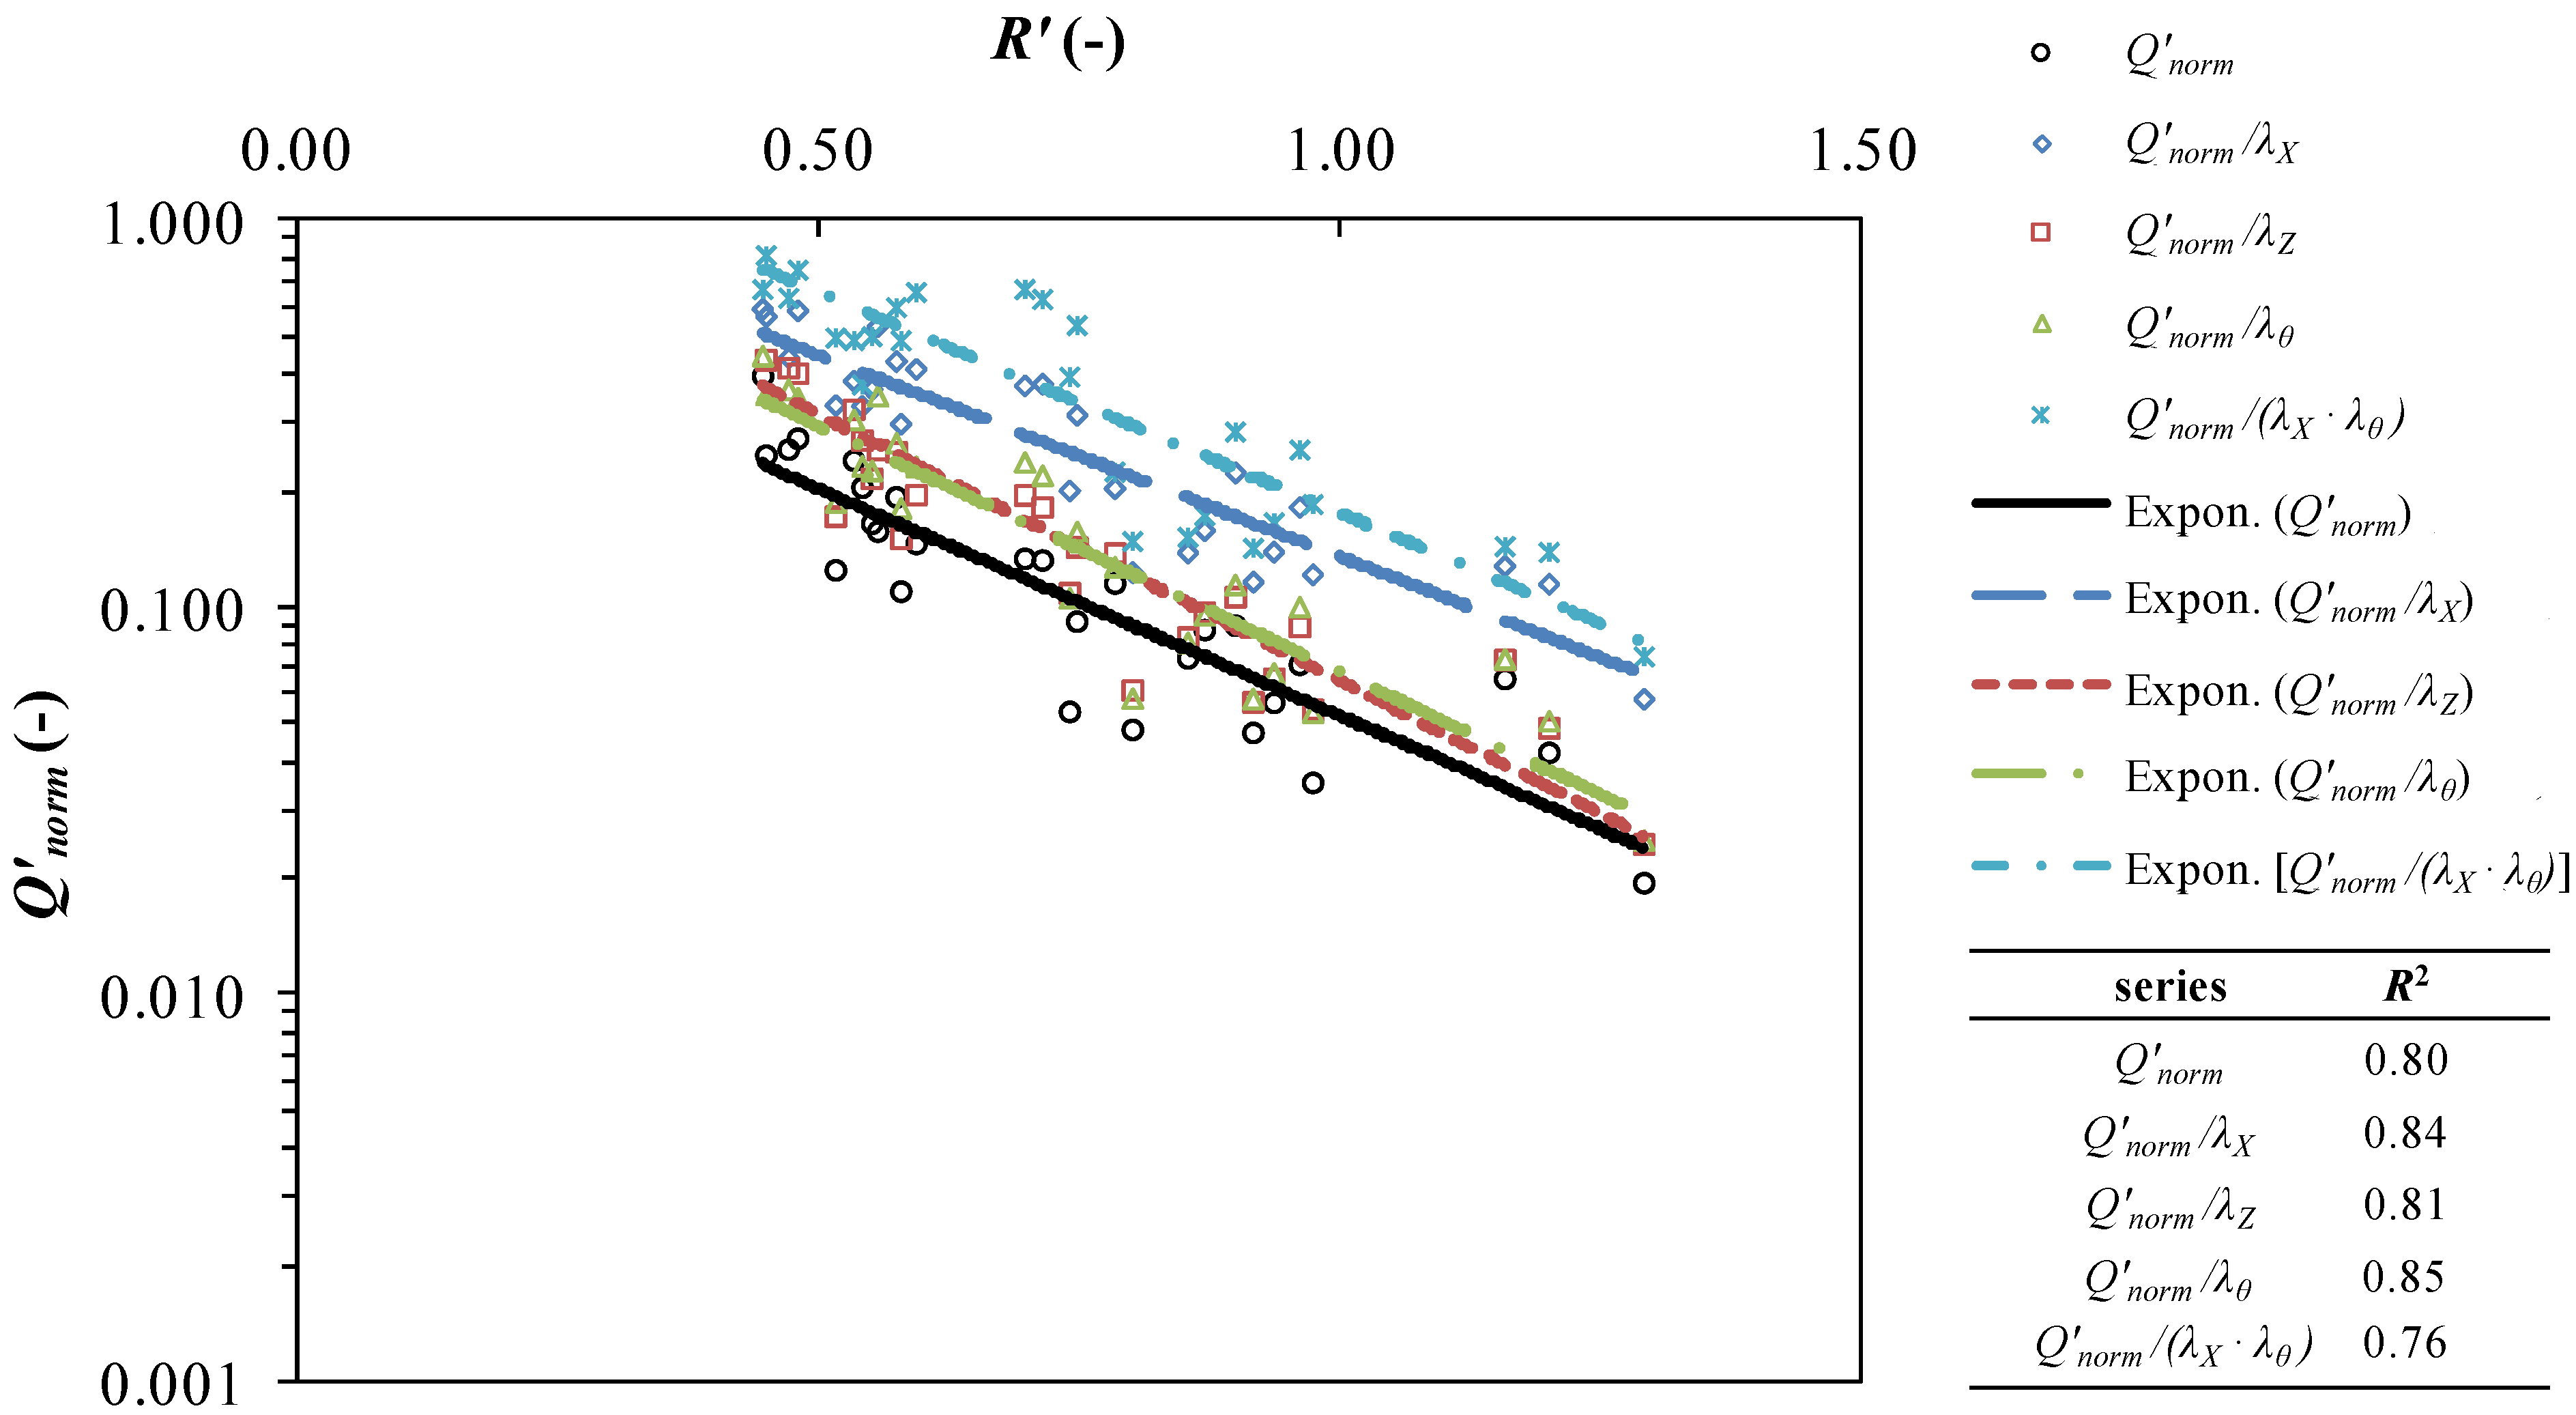
The data analysis technique used here has been similar as in phase 1, but built onto WDOTph2 results: the normalized response Q'norm = Q'/(0.2 ∙ λdrλs' ∙ ξp'λwd), where all parameters are based on the amplified Hm0' as described in Equation (13), was considered to see if by introducing the new offset-correcting factors depending on the motions the R2 would increase (Figure 10).
As shown in Figure 10 the introduction of both λX and λθ improved the model precision which on the other hand, decreases as both are considered at the same time. This can be explained by the fact that surge and pitch effects on q are mostly correlated, as a larger σθ occurs in correspondence to a larger surge response as discussed in Section 4.3. The choice is made therefore to consider only λθ in phase 3 model, as pitch is more easily measureable in practice and likely to be the main cause of q reduction as it lowers the ability of the water stored to be effectively processed by the turbines or draft holes, increasing spill from the reservoir. As a result, the following formulation is provided for the WDOTph3 model:
Q = 0.2 λ d r λ s ξ p λ w d λ ϑ e ( 2.6 γ w d R )
Figure 10. Increased precision showed through the R2 of the model as the offset-correcting factors accounting from the effects of the device motions are included. Values of Q'(-) and R'(-) refer to the amplified Hm0' due to the reflectors action, as from Equation (13). Exponential trend-lines are shown and relative R2 resumed in table. y-axis in logarithmic unit.
Energies 06 01961 g010
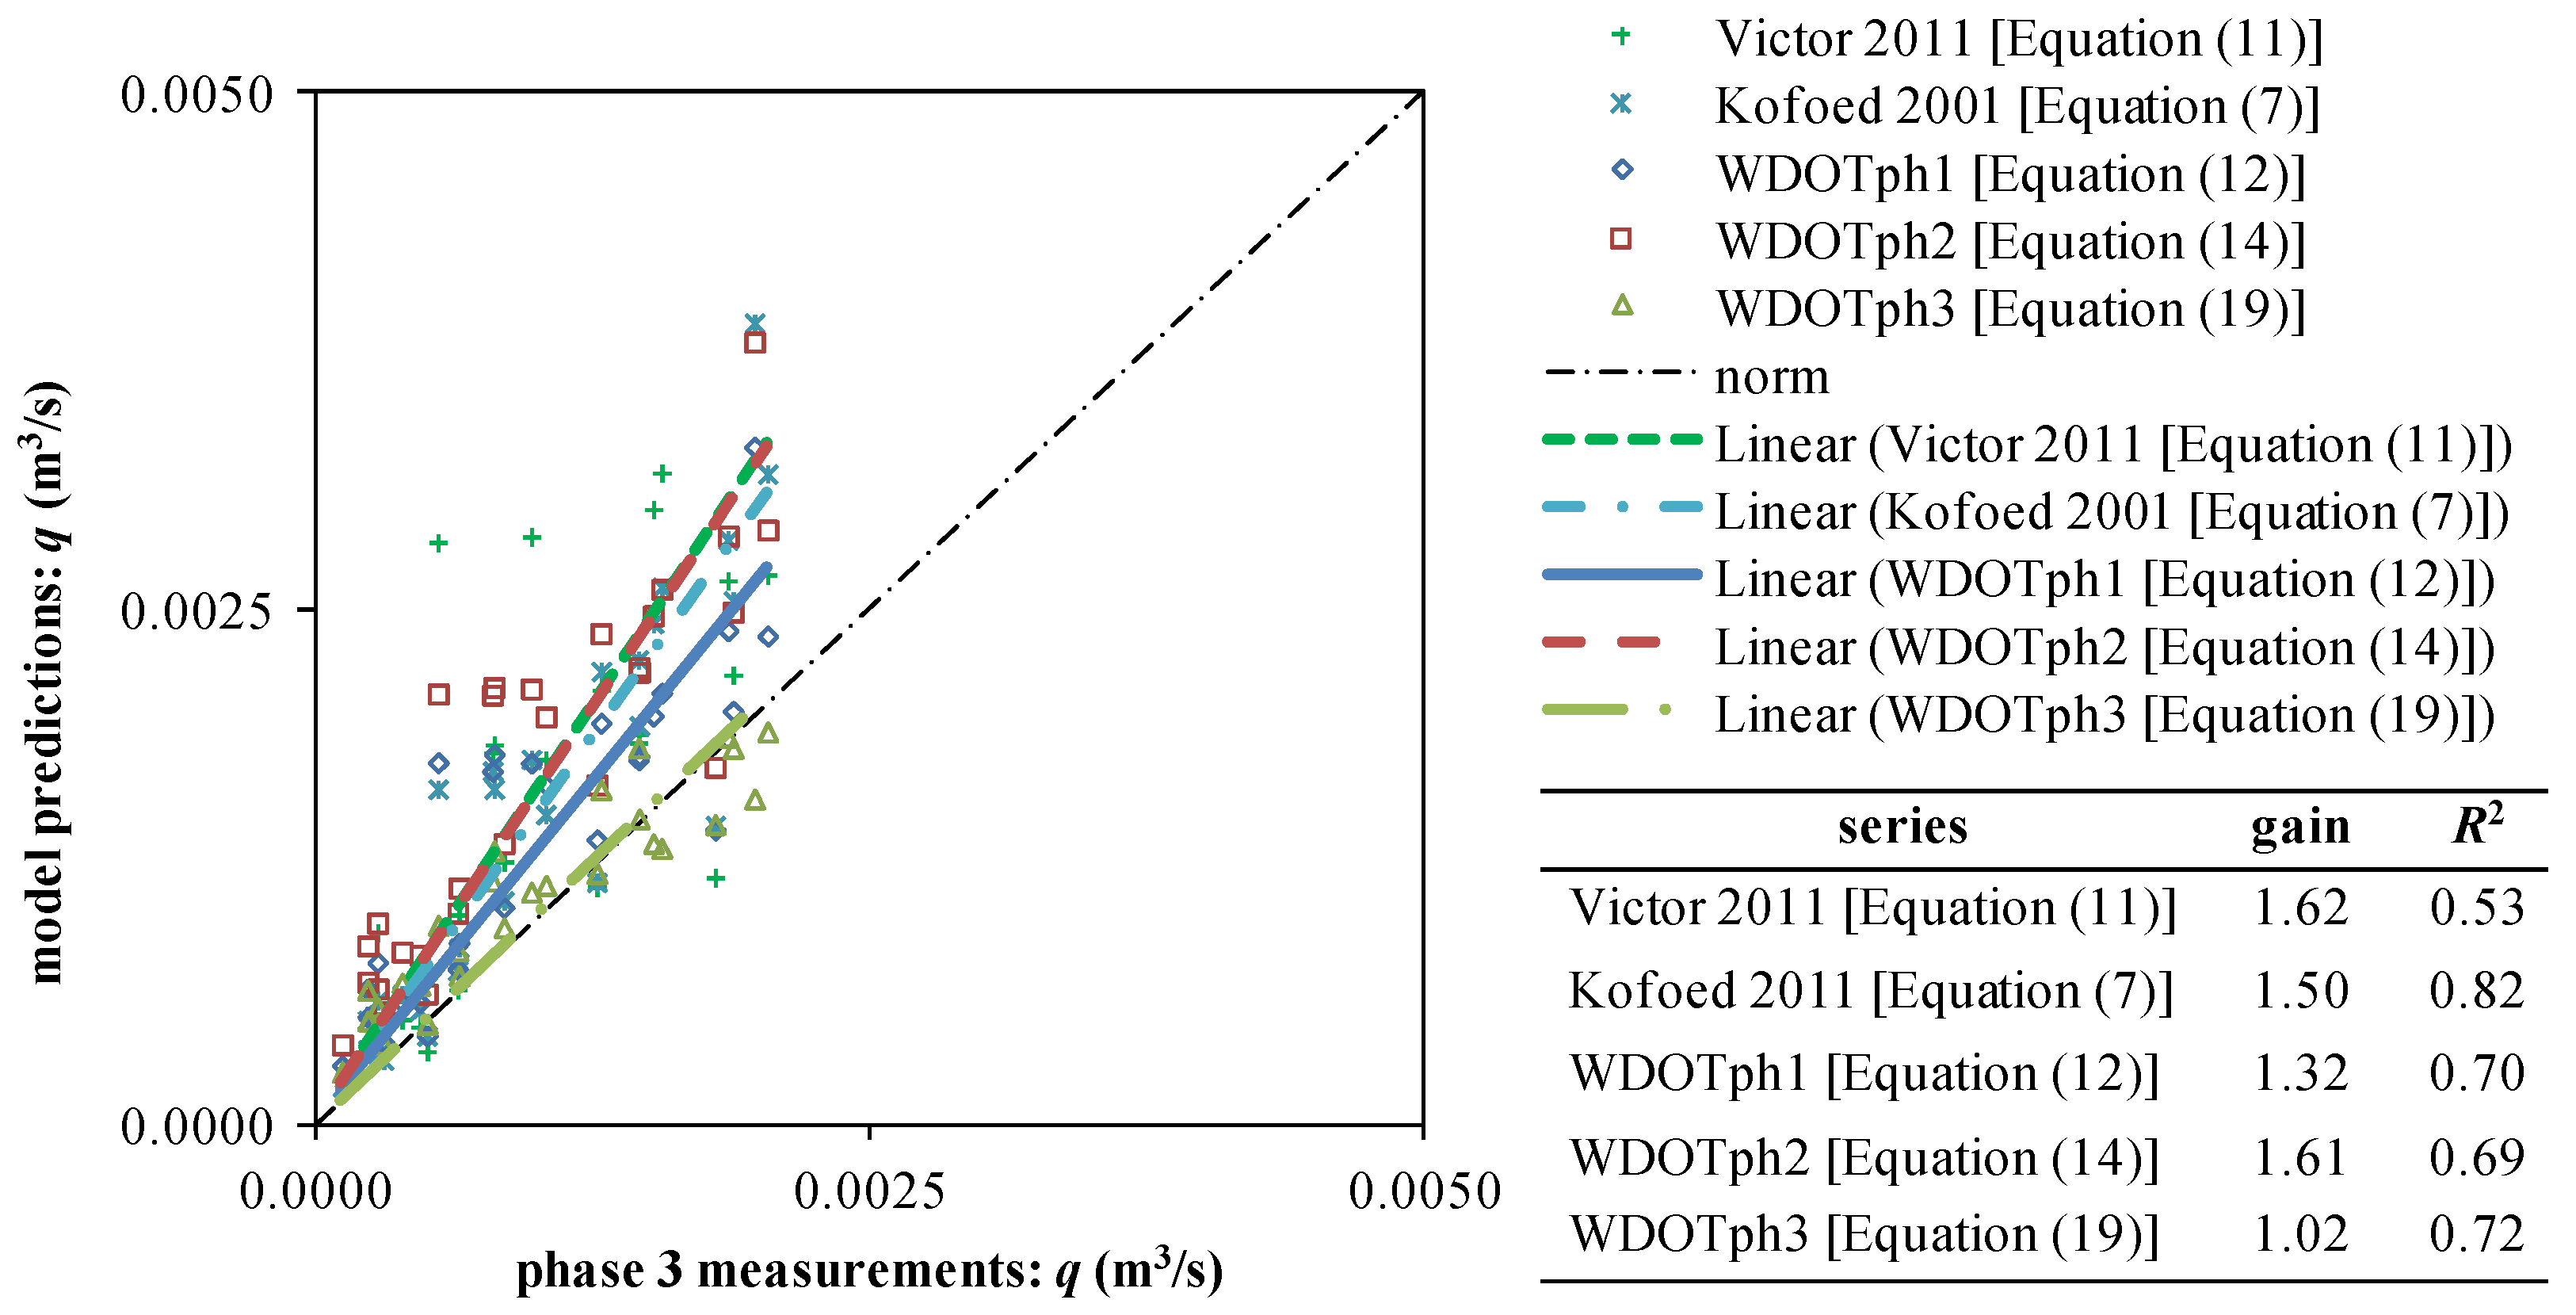
As done in previous phases, predictions of the model have been compared to measurements of phase 3, showing an improved accuracy respect to previous versions of WDOT as well as Equations (7) and (11); in general WDOTph3 also allows better precision, except when compared to Equation (7) which shows a 10% better R2 (Figure 11).
Figure 11. Average overtopping discharge, q (m3/s): predictions from the models vs. measurements in phase 3. Updated WDOT models as well as compared models from literature are shown. Models accuracies are measured by the gain of their linear trend-line (a target gain = 1 is shown as a black dash-dot line); their precisions by the trend-line R2 coefficients.
Energies 06 01961 g011

3.4. Phase 4—WDOTph4: Effect of Non-Rigid Connection between Reflectors and Platform

The last phase of the investigation considers the effect of the stiffness of the connection between the main platform and the reflectors. The connection is realized through a ball and socket joint allowing relative rotations but restraining relative translations. The inner mooring system limits the yaw excursion of the reflectors through a cable connecting them (Figure 9), while pitch is naturally limited by their own buoyancy. Therefore the most evident motion is roll, Φ (rad), which may decrease the wave amplification effect of the reflectors as it dissipates energy and generates transmitted waves on the lee side of Wave Dragon. The methodology followed in this phase is therefore to assess such a negative effect, to formulate a frame for describing it through an energy balance and then to take it into account in the WAM [Equation (13)] through a correcting factor.
The setup used in this phase is similar to the one used in phase 2, with the main platform fixed, except that the reflectors are free to rotate at the joint connection and to move at the tip. The reflectors stiffness could be changed during the study by employing different rubber rings inside of the piston, which allowed varying its friction (Figure 12). 3 different friction levels have been tested. However, the behavior on the two reflectors was not symmetrical and therefore their true stiffness had to be measured by recording the roll motion and torque. These signals have been analyzed identifying the mean of the 1/3 highest torque peaks in the outward direction (i.e., towards the rear of Wave Dragon), called M1/3 (N ∙ m), and the standard deviation of the roll oscillation, σΦ (rad). The significant roll amplitude has been considered in the following analysis, i.e., 2 ∙ σΦ, in order to account for the motions in both directions.
Figure 12. 
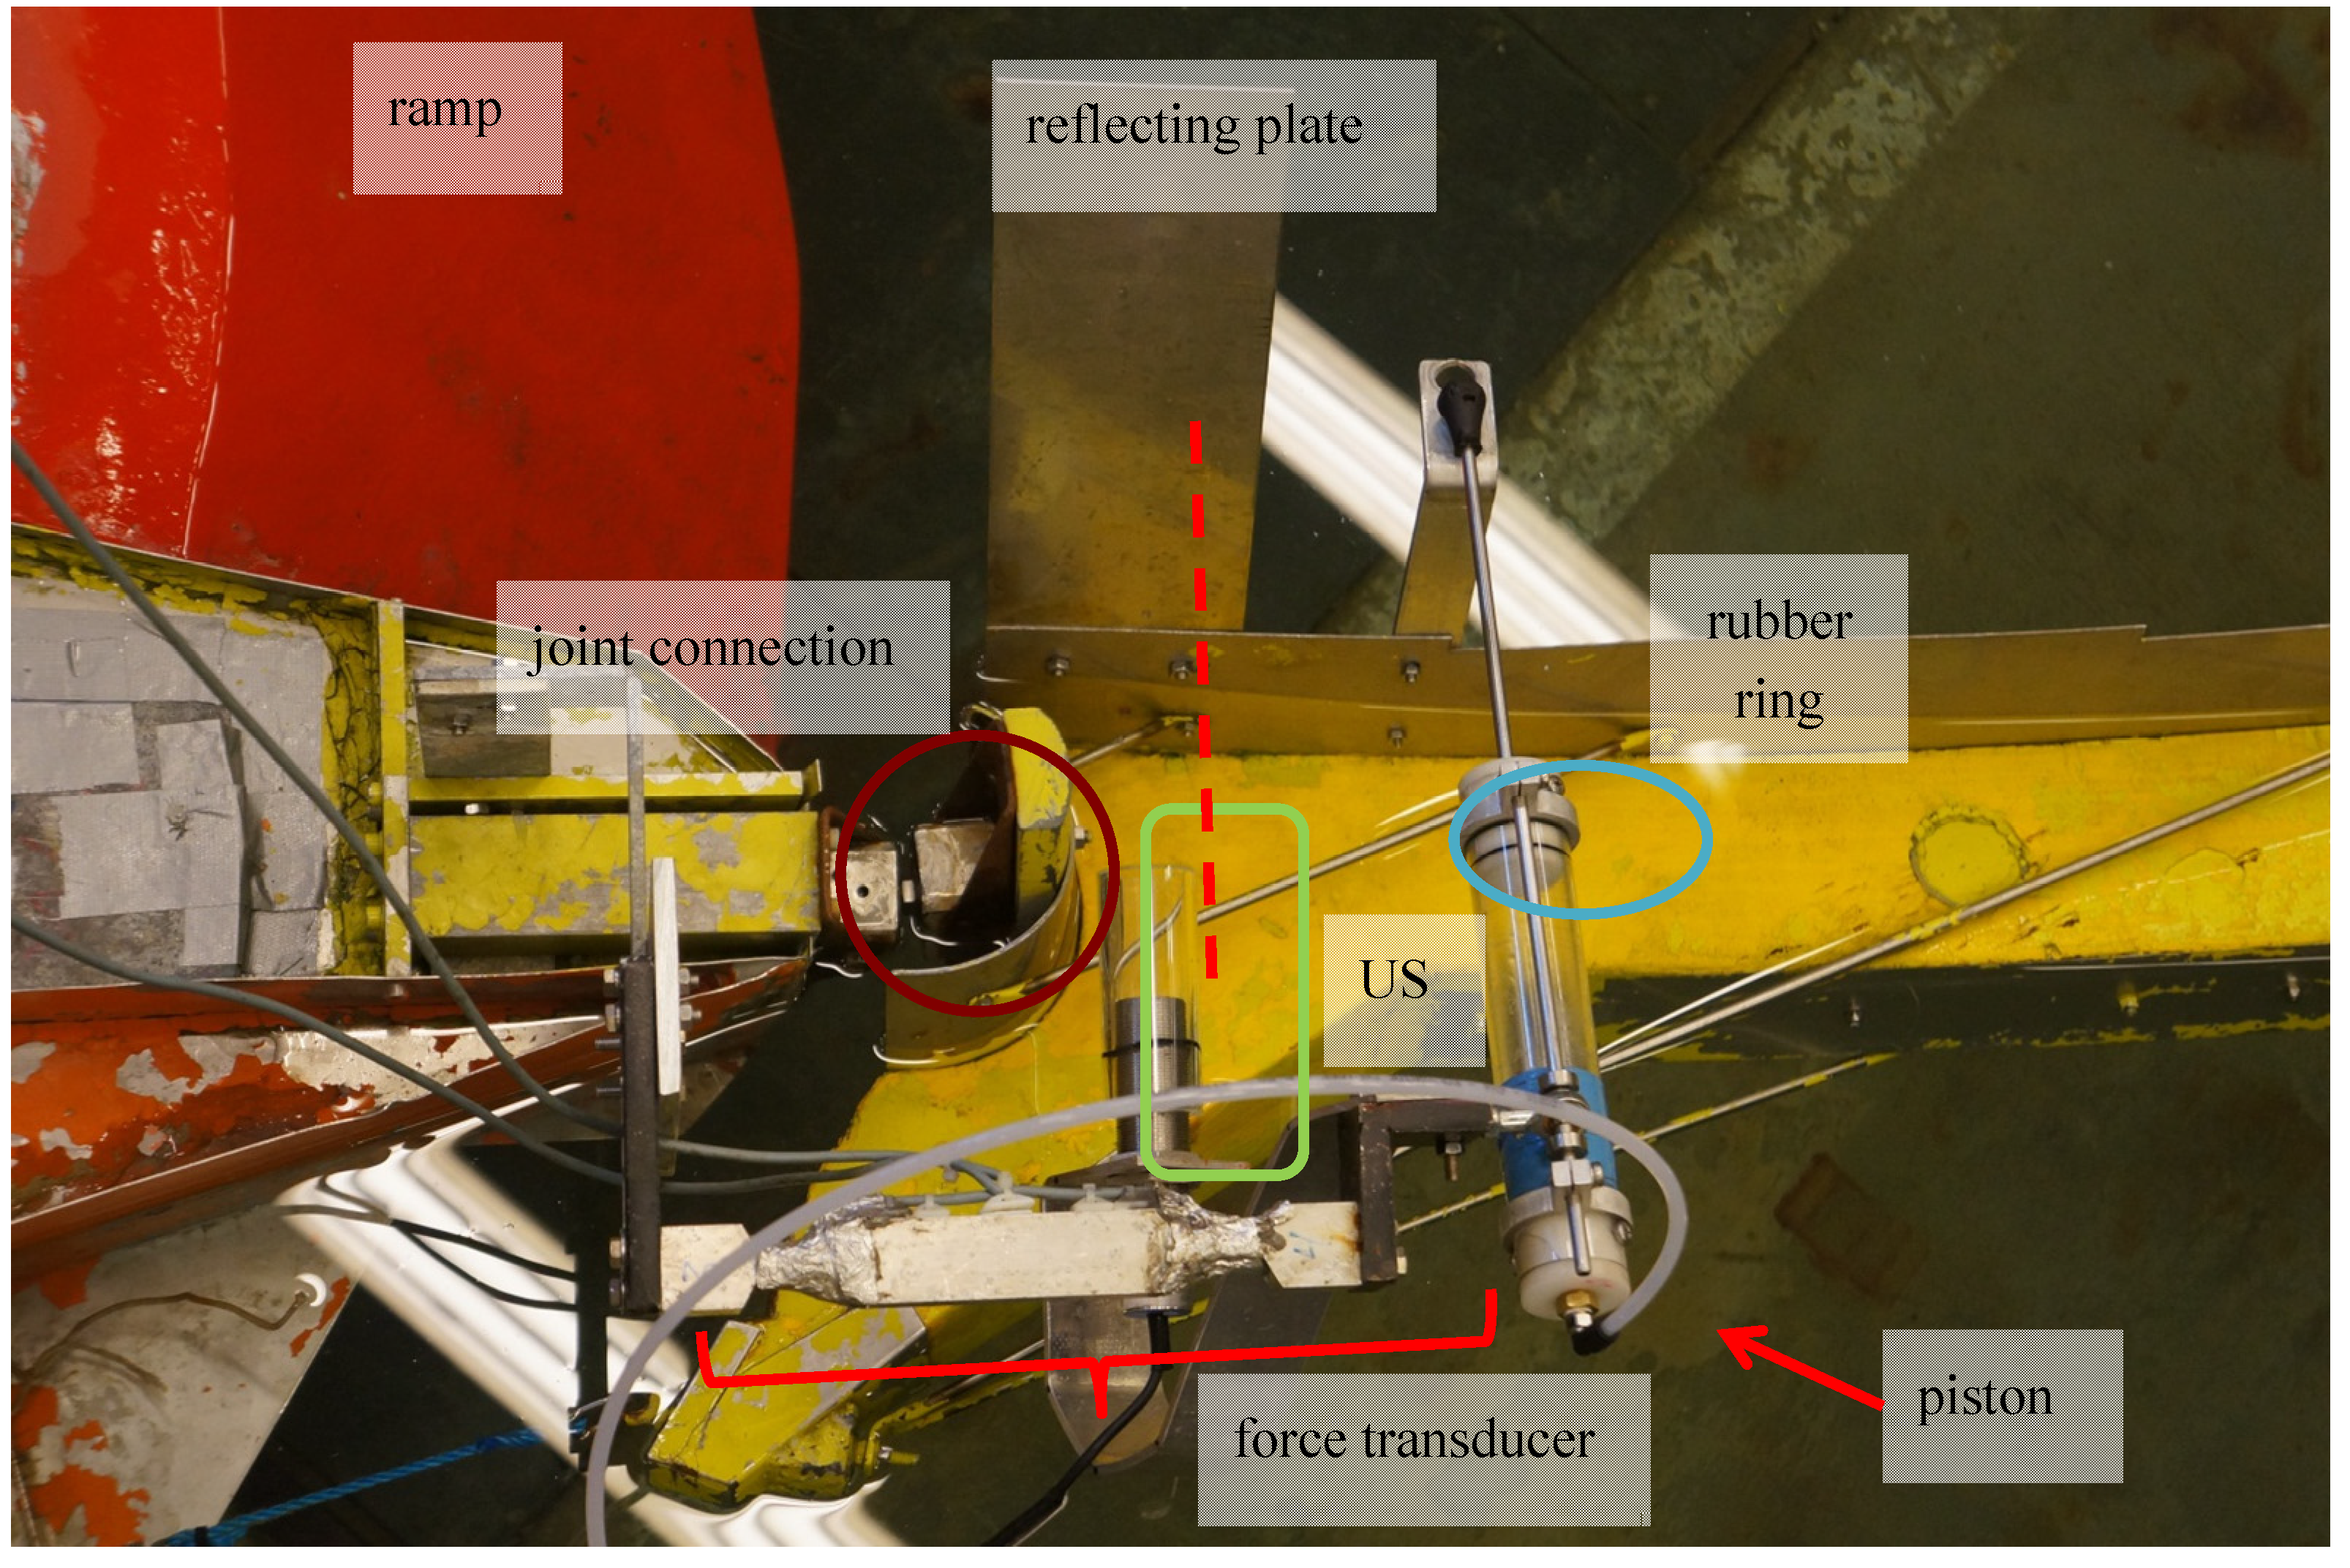
Setup used to measure the reflectors stiffness st in phase 4 (detail of the right reflector). Highlighted are: connection with ball and socket joint (brown circle), force transducer, ultrasonic sensor (US, green circle) with reflecting plate used to measure the roll (on the left side a potentiometer was used instead), piston with rubber ring (blue circle) used to vary the stiffness.
Energies 06 01961 g012
The reflectors stiffness could be calculated as st (N ∙ m /rad) = M1/3/(2 ∙ σΦ). Due to the lack of symmetry of the system however, the data analysis was rather referred to the energy dissipated by the roll motion of the reflectors, Ed (kJ) = M1/3 2 ∙ σΦ, as in this case the contributions from left and right reflectors could be summed up.
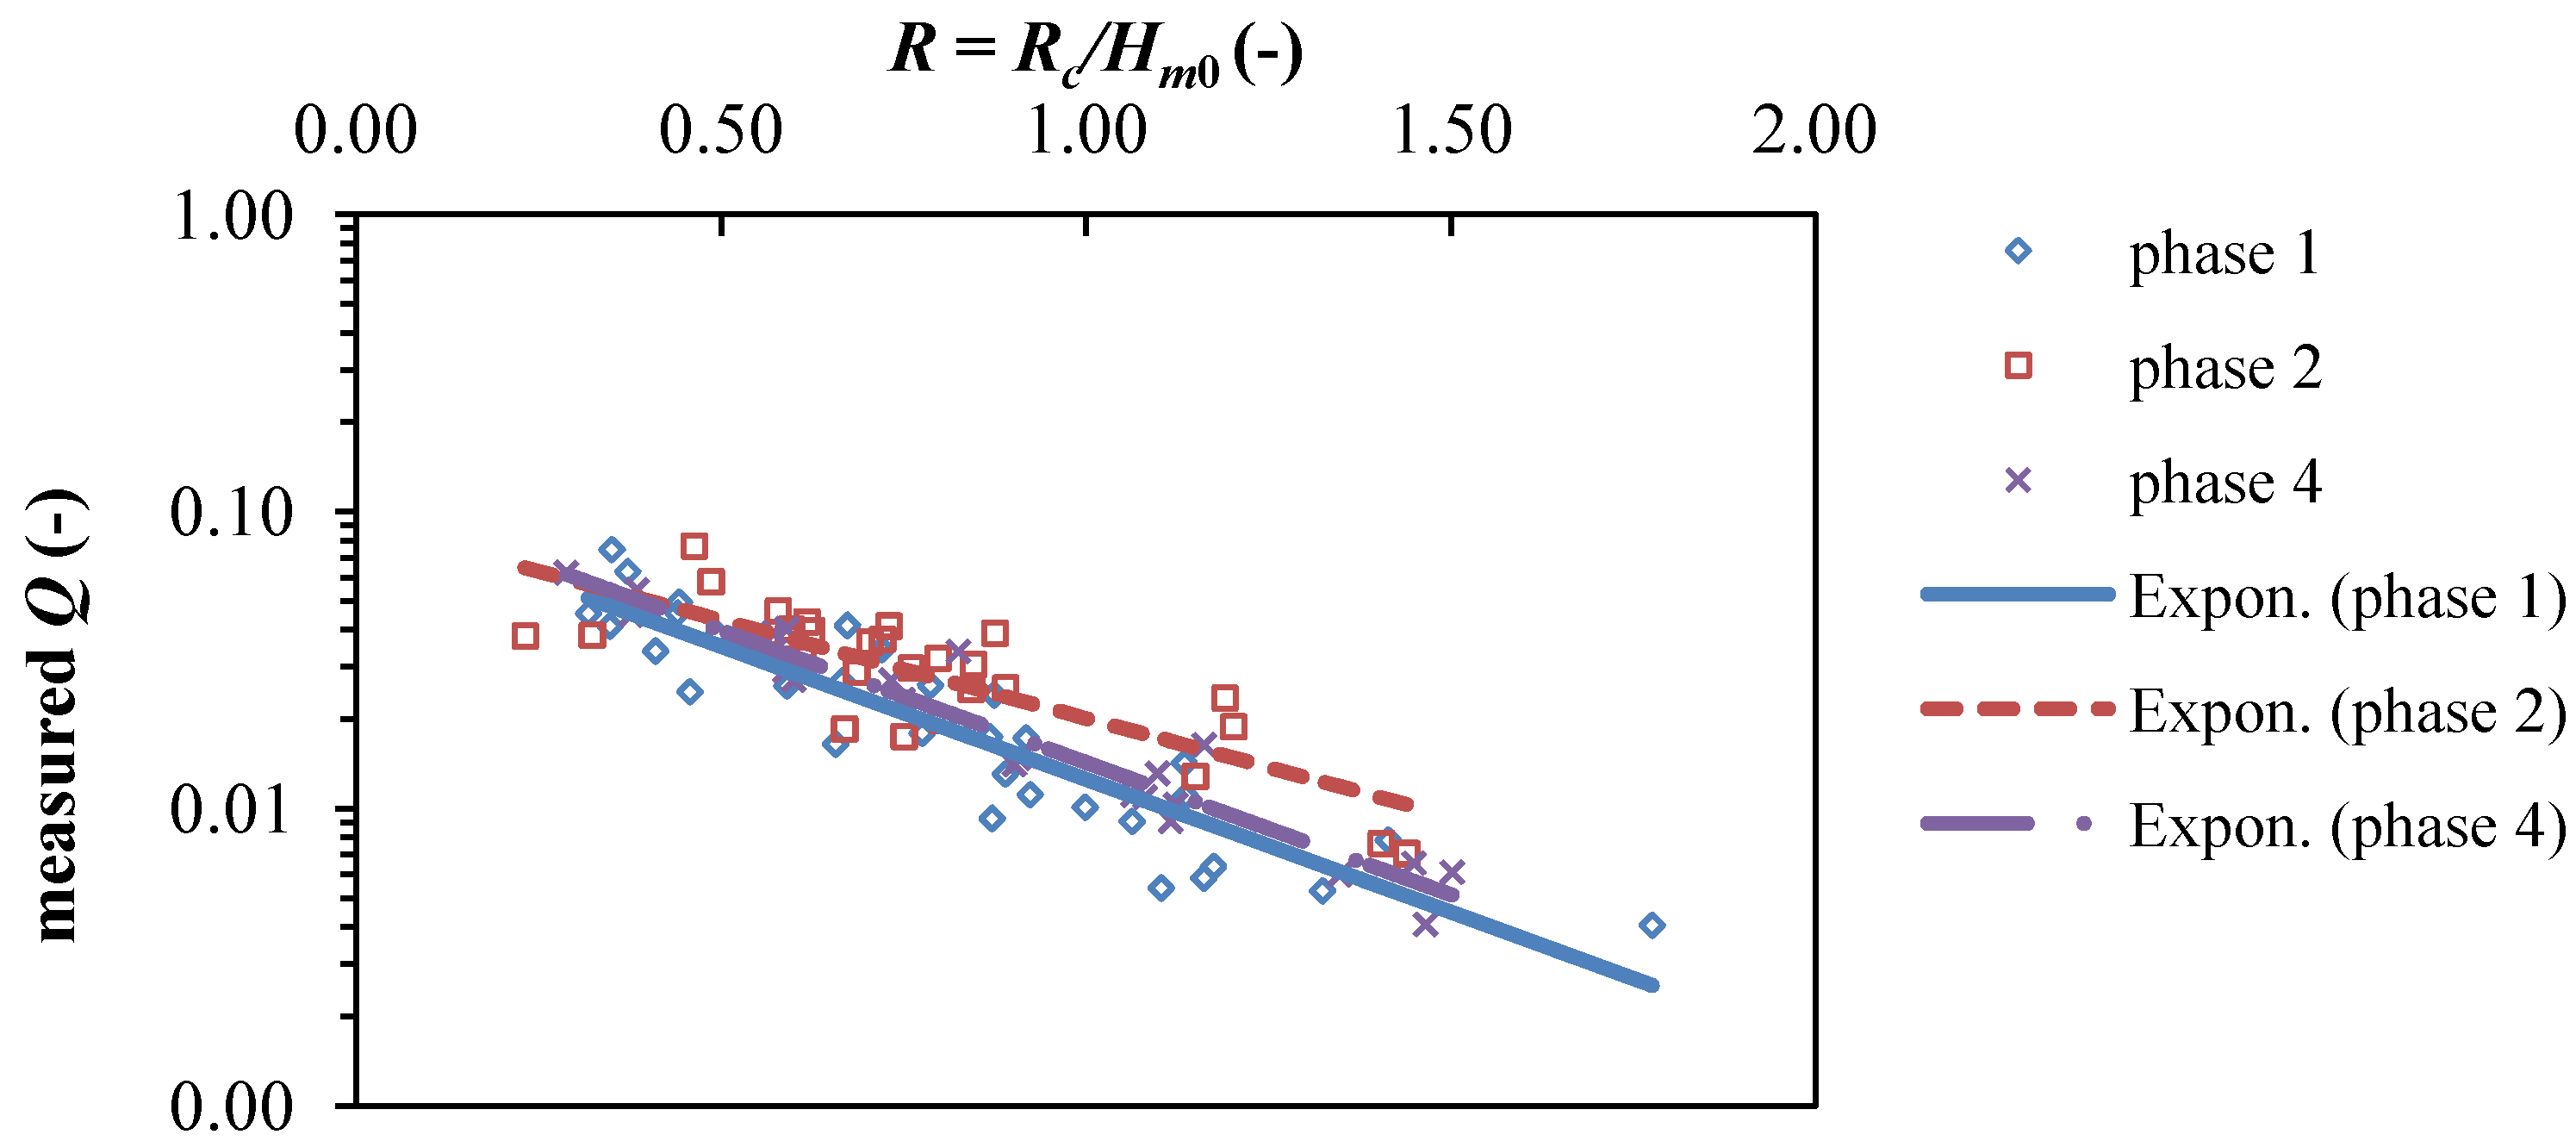
Referring to R and Q, data shown in Figure 13 are independent on the reflectors features as they are both based on the undisturbed Hm0; this allows comparing data from different phases, showing that measured Q decreased from phase 2 to phase 4 and confirming the hypothesis made on the dissipative effect of the reflectors roll.
To better understand this effect, the energy balance of the system was performed (Figure 14). Energy flows have all been considered in kJ, referring to the 30 minutes of test and to the full width of the Wave Dragon with the reflectors, Wtot (m).
Figure 13. Measured non-dimensional overtopping discharge, Q, as function of the non-dimensional crest level, R, in phase 1, 2 and 4. Values shown do not account for reflectors effect, neglecting the WAM and referring to measured q and undisturbed Hm0. y-axis in logarithmic unit.
Energies 06 01961 g013
Figure 14. 
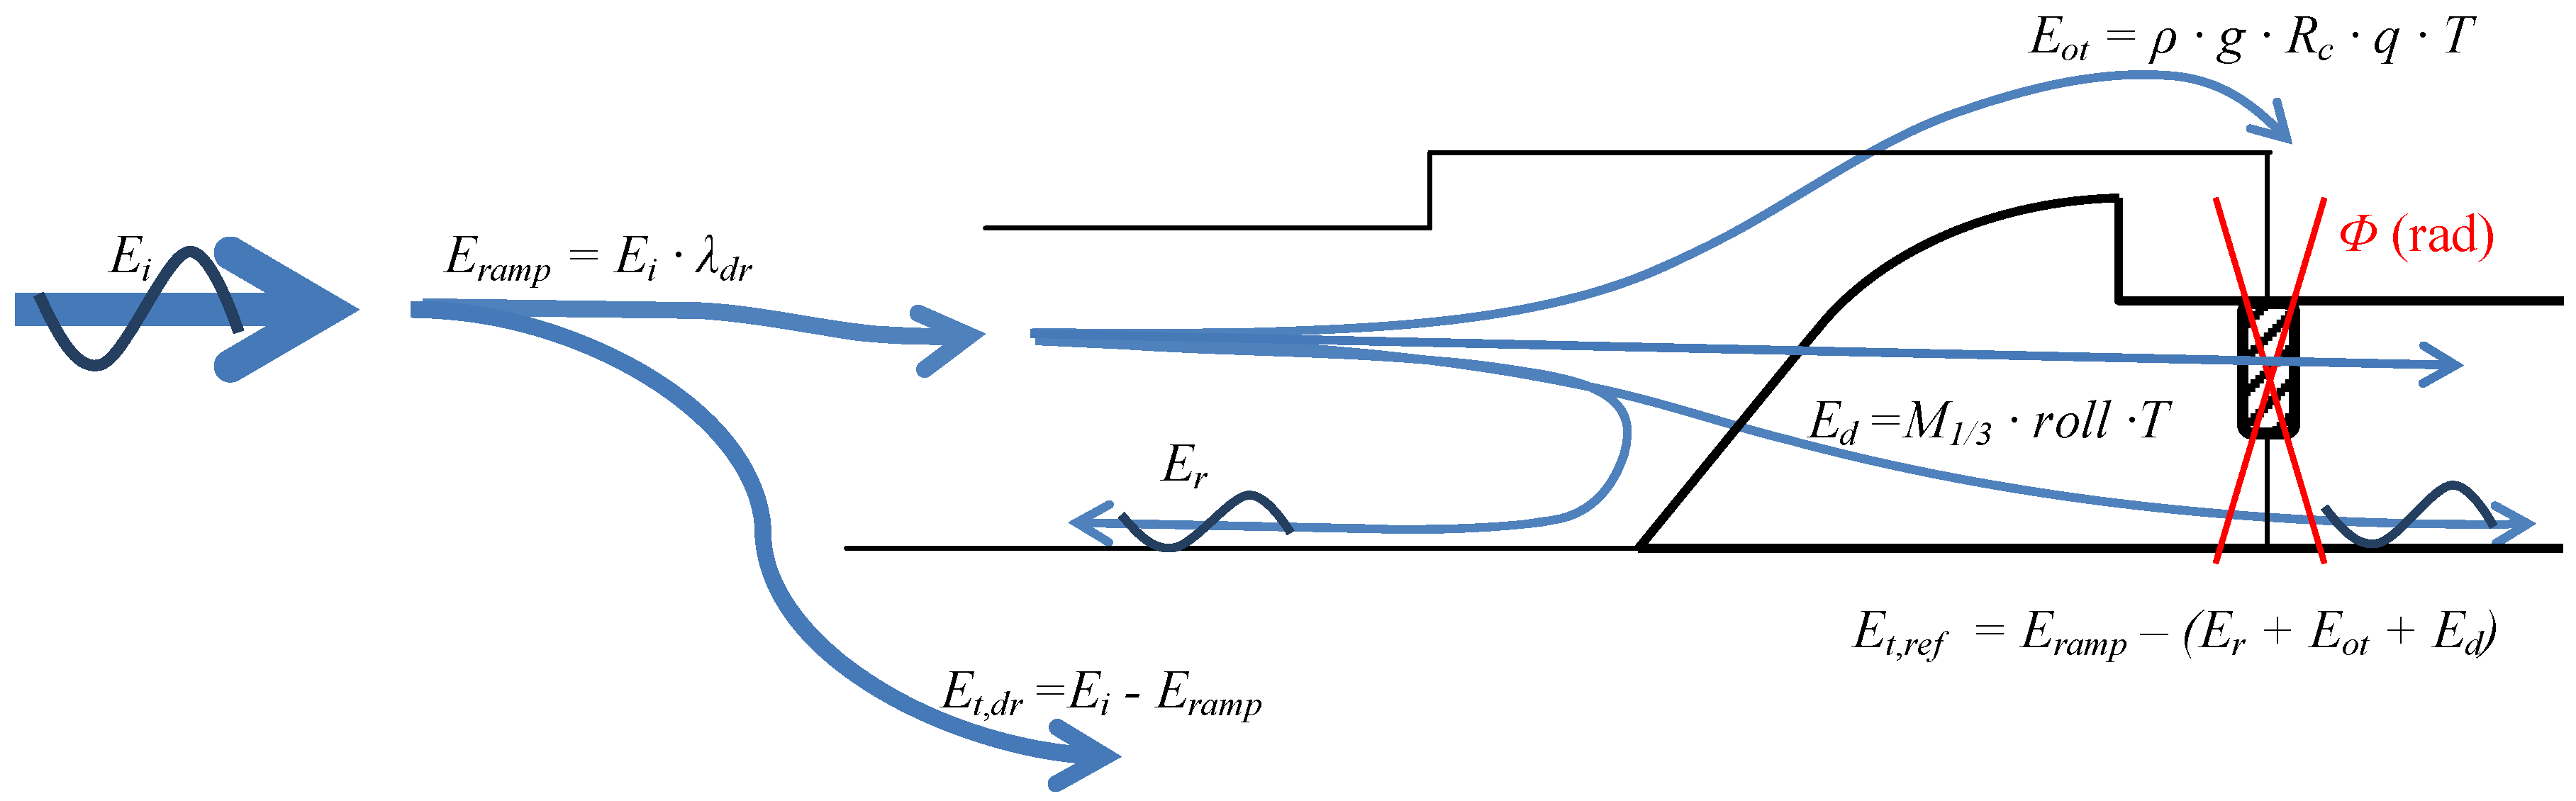
Energy balance of the system in phase 4. All energy components considered are in kJ and referred to 30 min of tests (T) and full width of the model (Wtot = 4.6 m). Included are: incident wave energy Ei; reflected energy Er; energy transmitted below the ramp Et,dr; energy intercepted by the device Eramp; energy overtopped Eot; energy dissipated by the reflectors roll motion Ed; energy transmitted on the lee of the reflectors by roll-generated waves Et,ref. Ei, Er and Et,ref propagate in waves.
Energies 06 01961 g014
The incident wave energy, Ei, as well as the reflected wave energy, Er, have been derived from the 3D wave analysis performed on the wave recordings; λdr has been used to evaluate the proportion of the incident energy intercepted by the device, Eramp, the rest is transmitted below the draft, Et,dr; the energy overtopping the ramp over the test duration is calculated from the measured q and Rc [see Equation (1)]; the energy dissipated by the reflectors roll motion, Ed, is calculated as described above; the transmitted energy to the lee of the reflectors by the wave generated from their roll motion, Et,ref, is the residual energy that complements the energy balance. The relative proportions of the energy flows are shown in Figure 15.
Figure 15. 
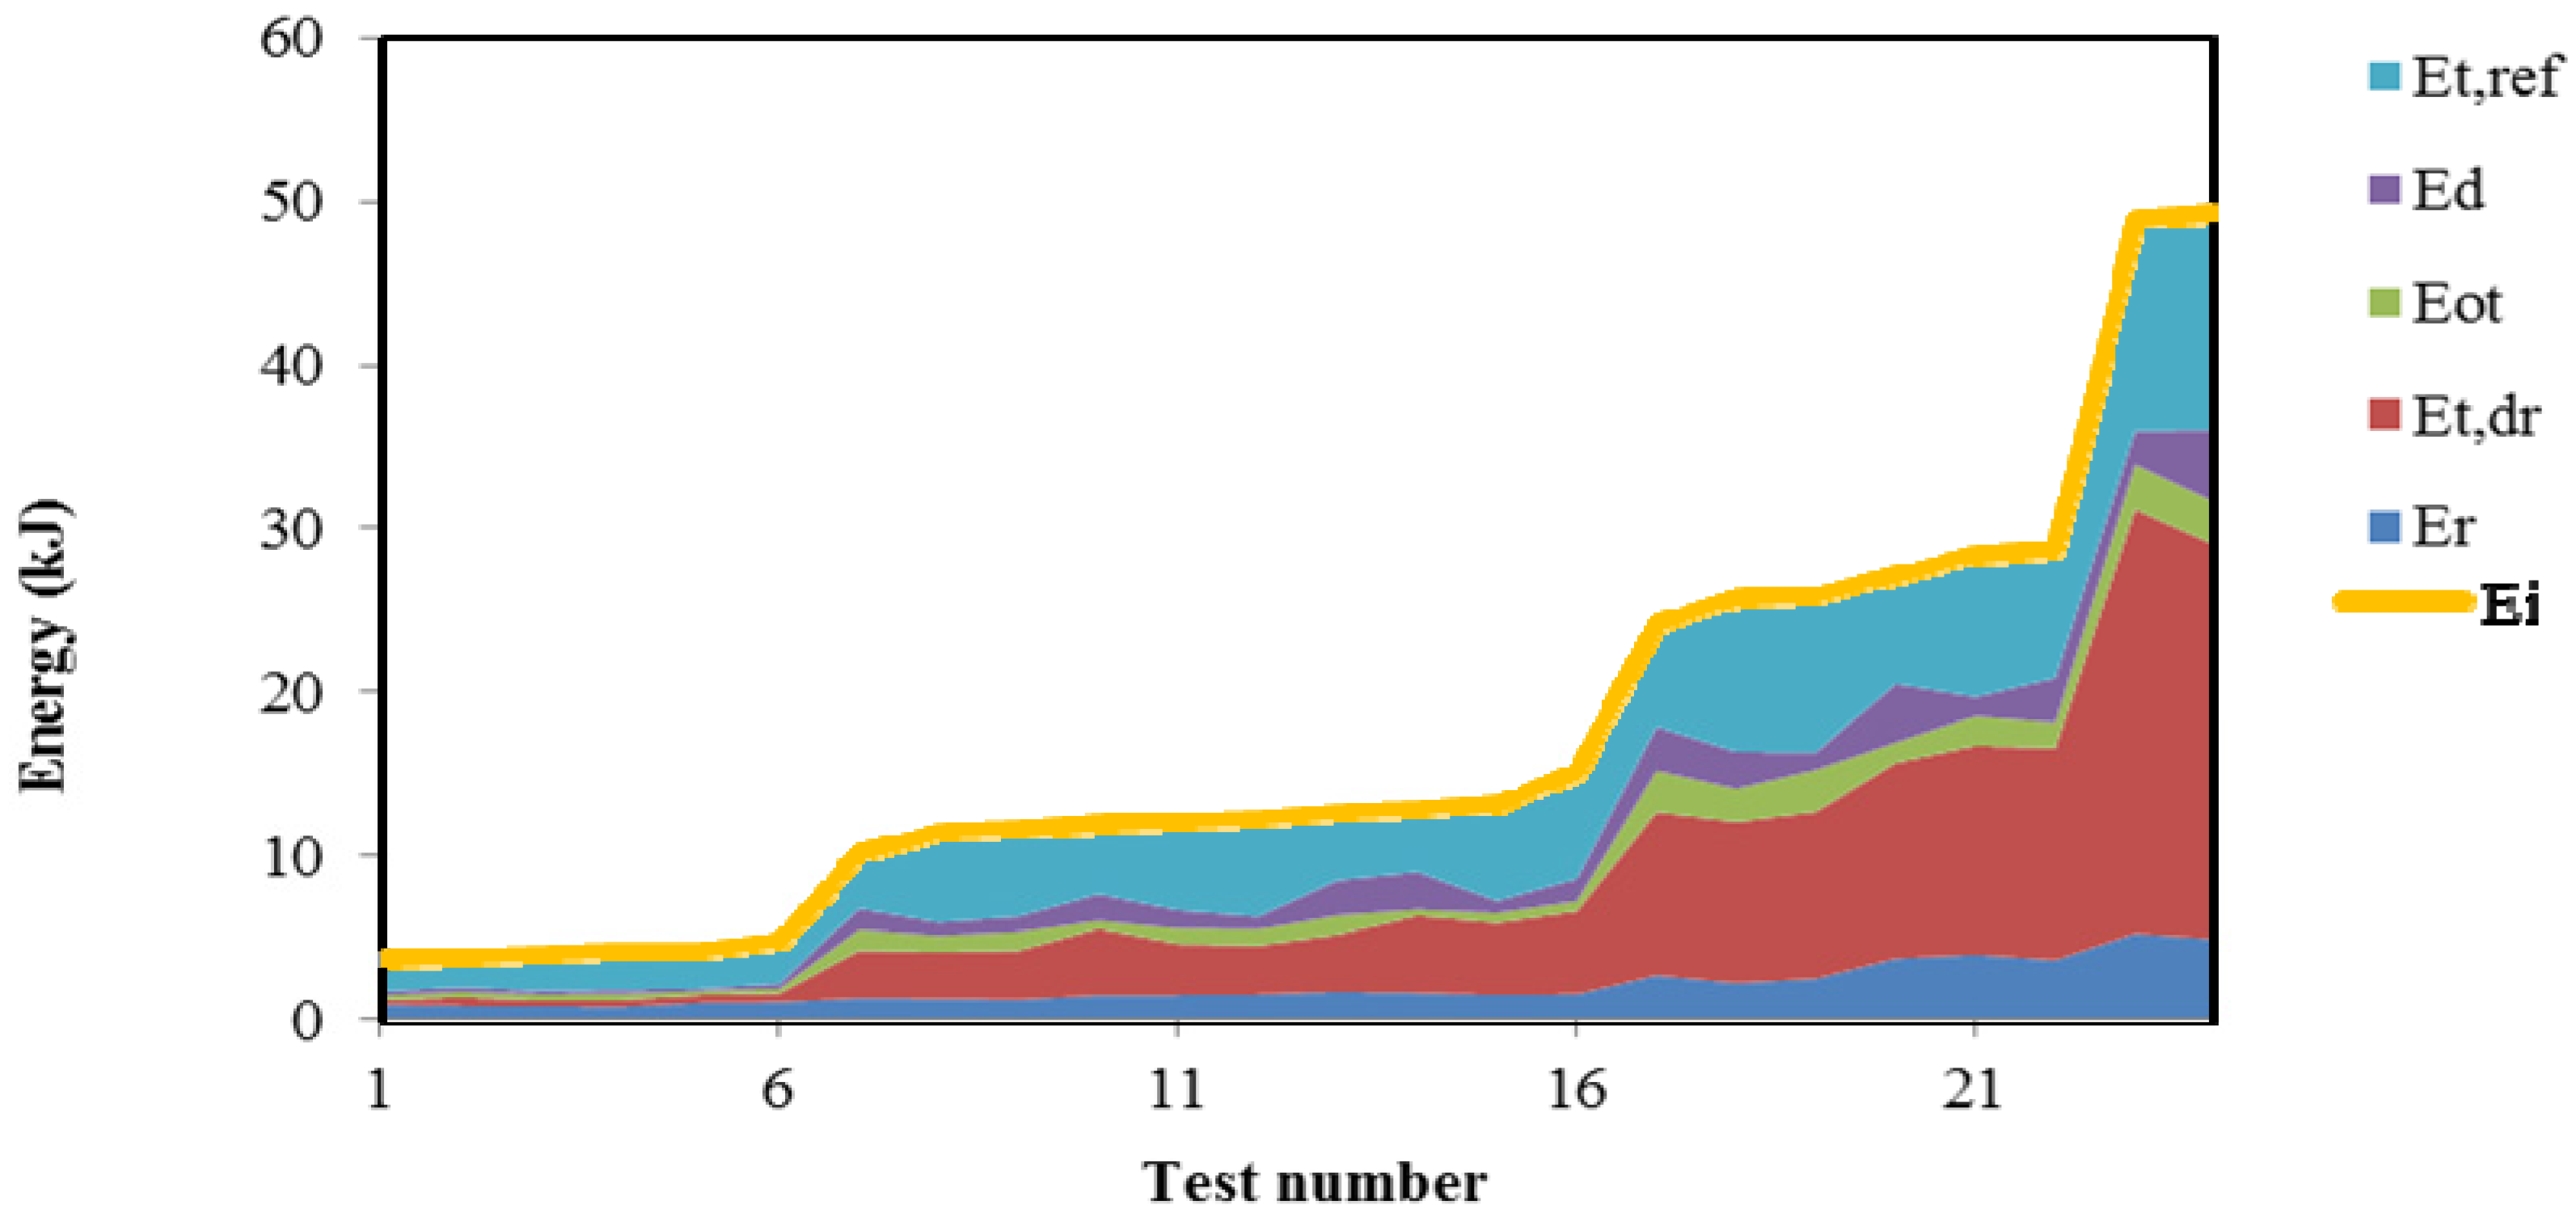
Relative proportion of the various energy components. On the x-axis are the different tests, sorted accordingly to Ei in ascending order.
Energies 06 01961 g015
Here it can be seen that as Ei grows the proportion of energy that cannot be intercepted by the device due to its limited draft, Et,dr, becomes larger, which also reduces the overtopping efficiency of the device. With regard to this, it must be stressed that here non-optimal conditions were tested (i.e., non-rigid reflectors) as the purpose was not to assess the maximum overtopping achievable but the effect of unfavorable conditions. In optimal conditions the energy loss would be very much reduced and the corresponding term (i.e., Ed + Et,ref) would be partly added to Eot. According to this—and in view of the design of a 1.5 MW North Sea demonstrator—the joint connection has been recently revised respect to the one considered here and tested by the authors [16]. Moreover it shall be mentioned that at full-scale the turbines capacity to process the overtopping volumes would be larger, while in the tests the drainage may have been insufficient in some cases with large Ei.
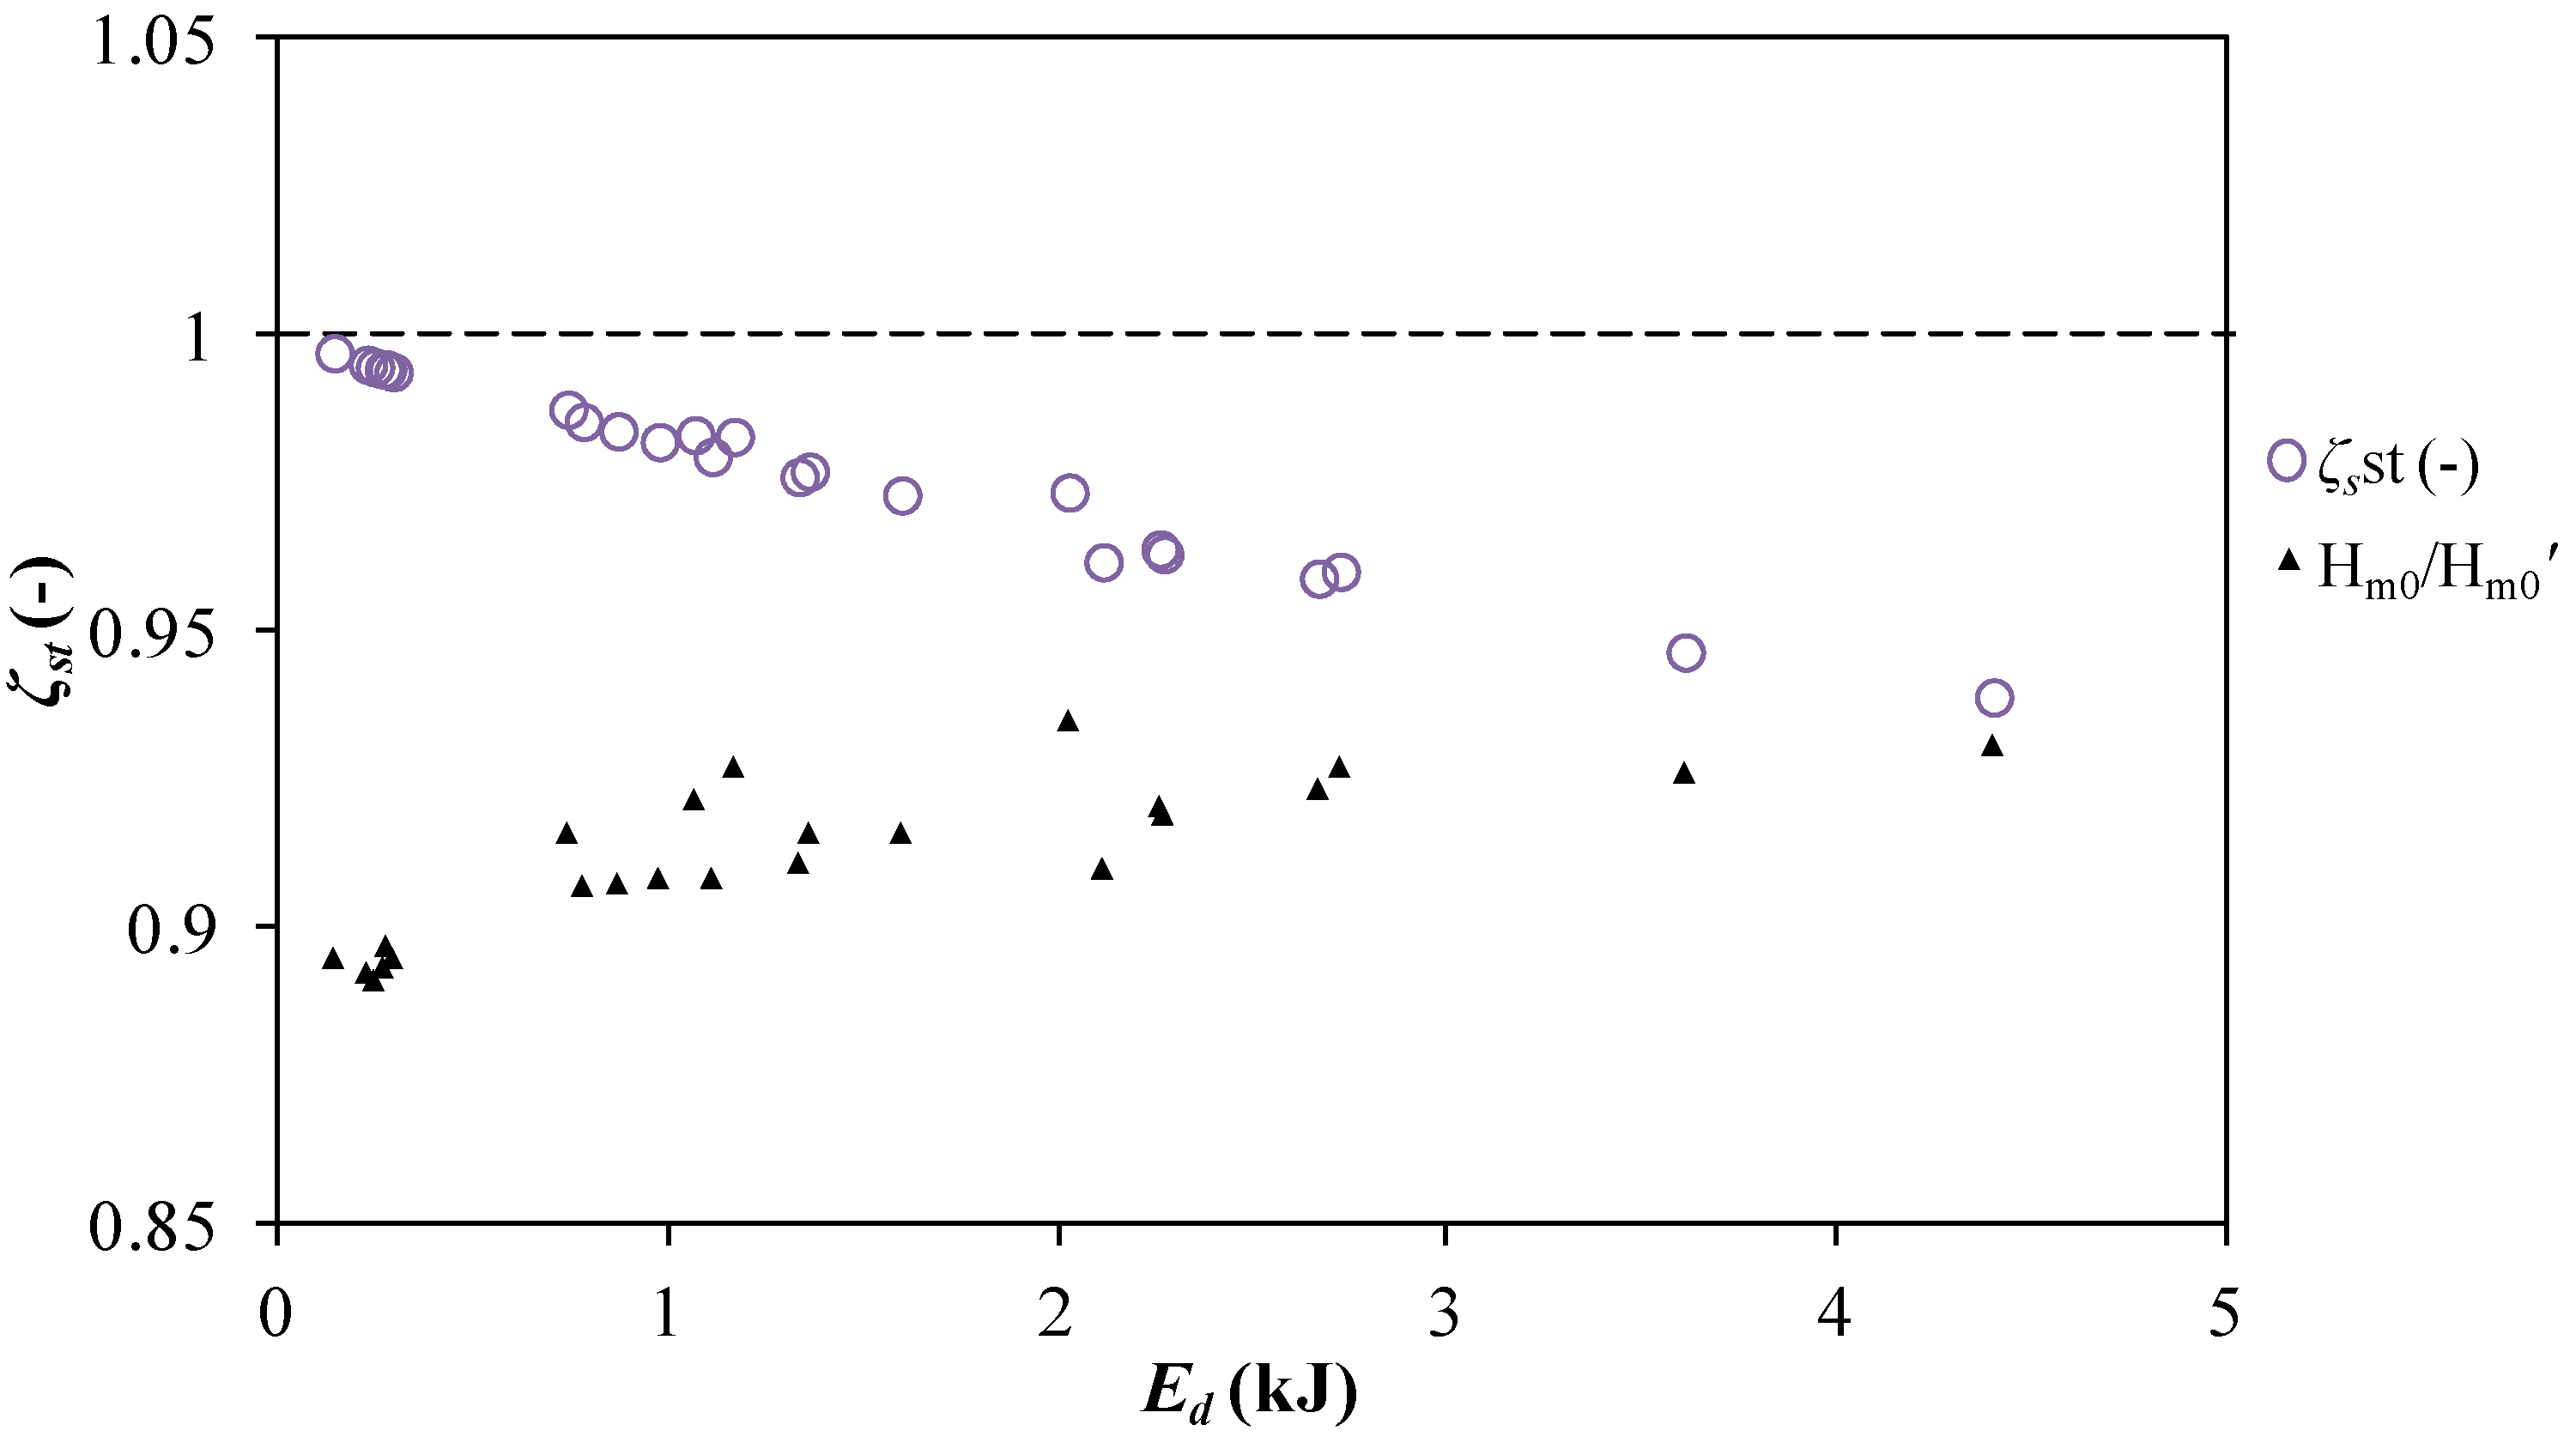
As for the consequence of the reflectors roll on the WAM, a correcting factor ζst(-) is introduced respect to Equation (13):
H m 0 = H m 0 a ζ d r , R ζ o p ζ s t
ζst shall work as weighting factor between two cases:
  • If the reflectors are rigidly fixed, as in phase 2, the energy lost in their roll motion Ed → 0; then Equation (13) is valid and ζst = 1;
  • If energy dissipation is maximum, EdEd,max, then Hm0'Hm0 and ζst ≈ (a ∙ ζdrR ∙ ζop)−1.
In order to correctly represent this behavior, these two cases are interpolated through an atan function, which is able to represent the asymptotic behavior of ζst:
ζst = atan (− bEd ) + 1
b = −tan (Hm0'/ Hm0 – 1) / Ed,max
Considering all tested cases Ed,max = 4.4 kJ, hence 5 kJ is a good approximation for operational conditions. Assuming a conservative value for Ed,max respect to what is tested acknowledges the fact that, although st was very low in some case, as expected the reflectors still had a wave amplifying effect (Figure 13). The results are shown in Figure 16, where ζst and Hm0/Hm0' are shown depending on Ed. It can be seen that for growing Ed the two tend to converge, meaning that Hm0' tends to Hm0 and the amplification effect of the reflectors disappear [Equation (21)]. On the other hand, as Ed decreases (i.e., reflectors become increasingly stiff), ζst tends to 1 and Equation (21) becomes equal to Equation (13).
Figure 16. ζst and Hm0/Hm0' depending on the dissipated energy, for Ed = 0 kJ and Ed,max = 5 kJ. ζst is defined as interpolating function between 1 for Ed = 0 and Hm0/Hm0' for Ed,max. Due to this, the two functions converge for Ed increasingly high, showing that reflectors loose efficiency.
Energies 06 01961 g016
The resulting WDOTph4 model is shown in Equation (22). In order to distinguish it from WDOTph2, where the st effect is not included, a double superscript is used here meaning that all relevant parameters have been calculated based on Hm0":
Q = 0.2 λ d r λ s ξ p λ w d e ( 2.6 γ w d R )

3.4.1. Problems with WDOTph4 Representation

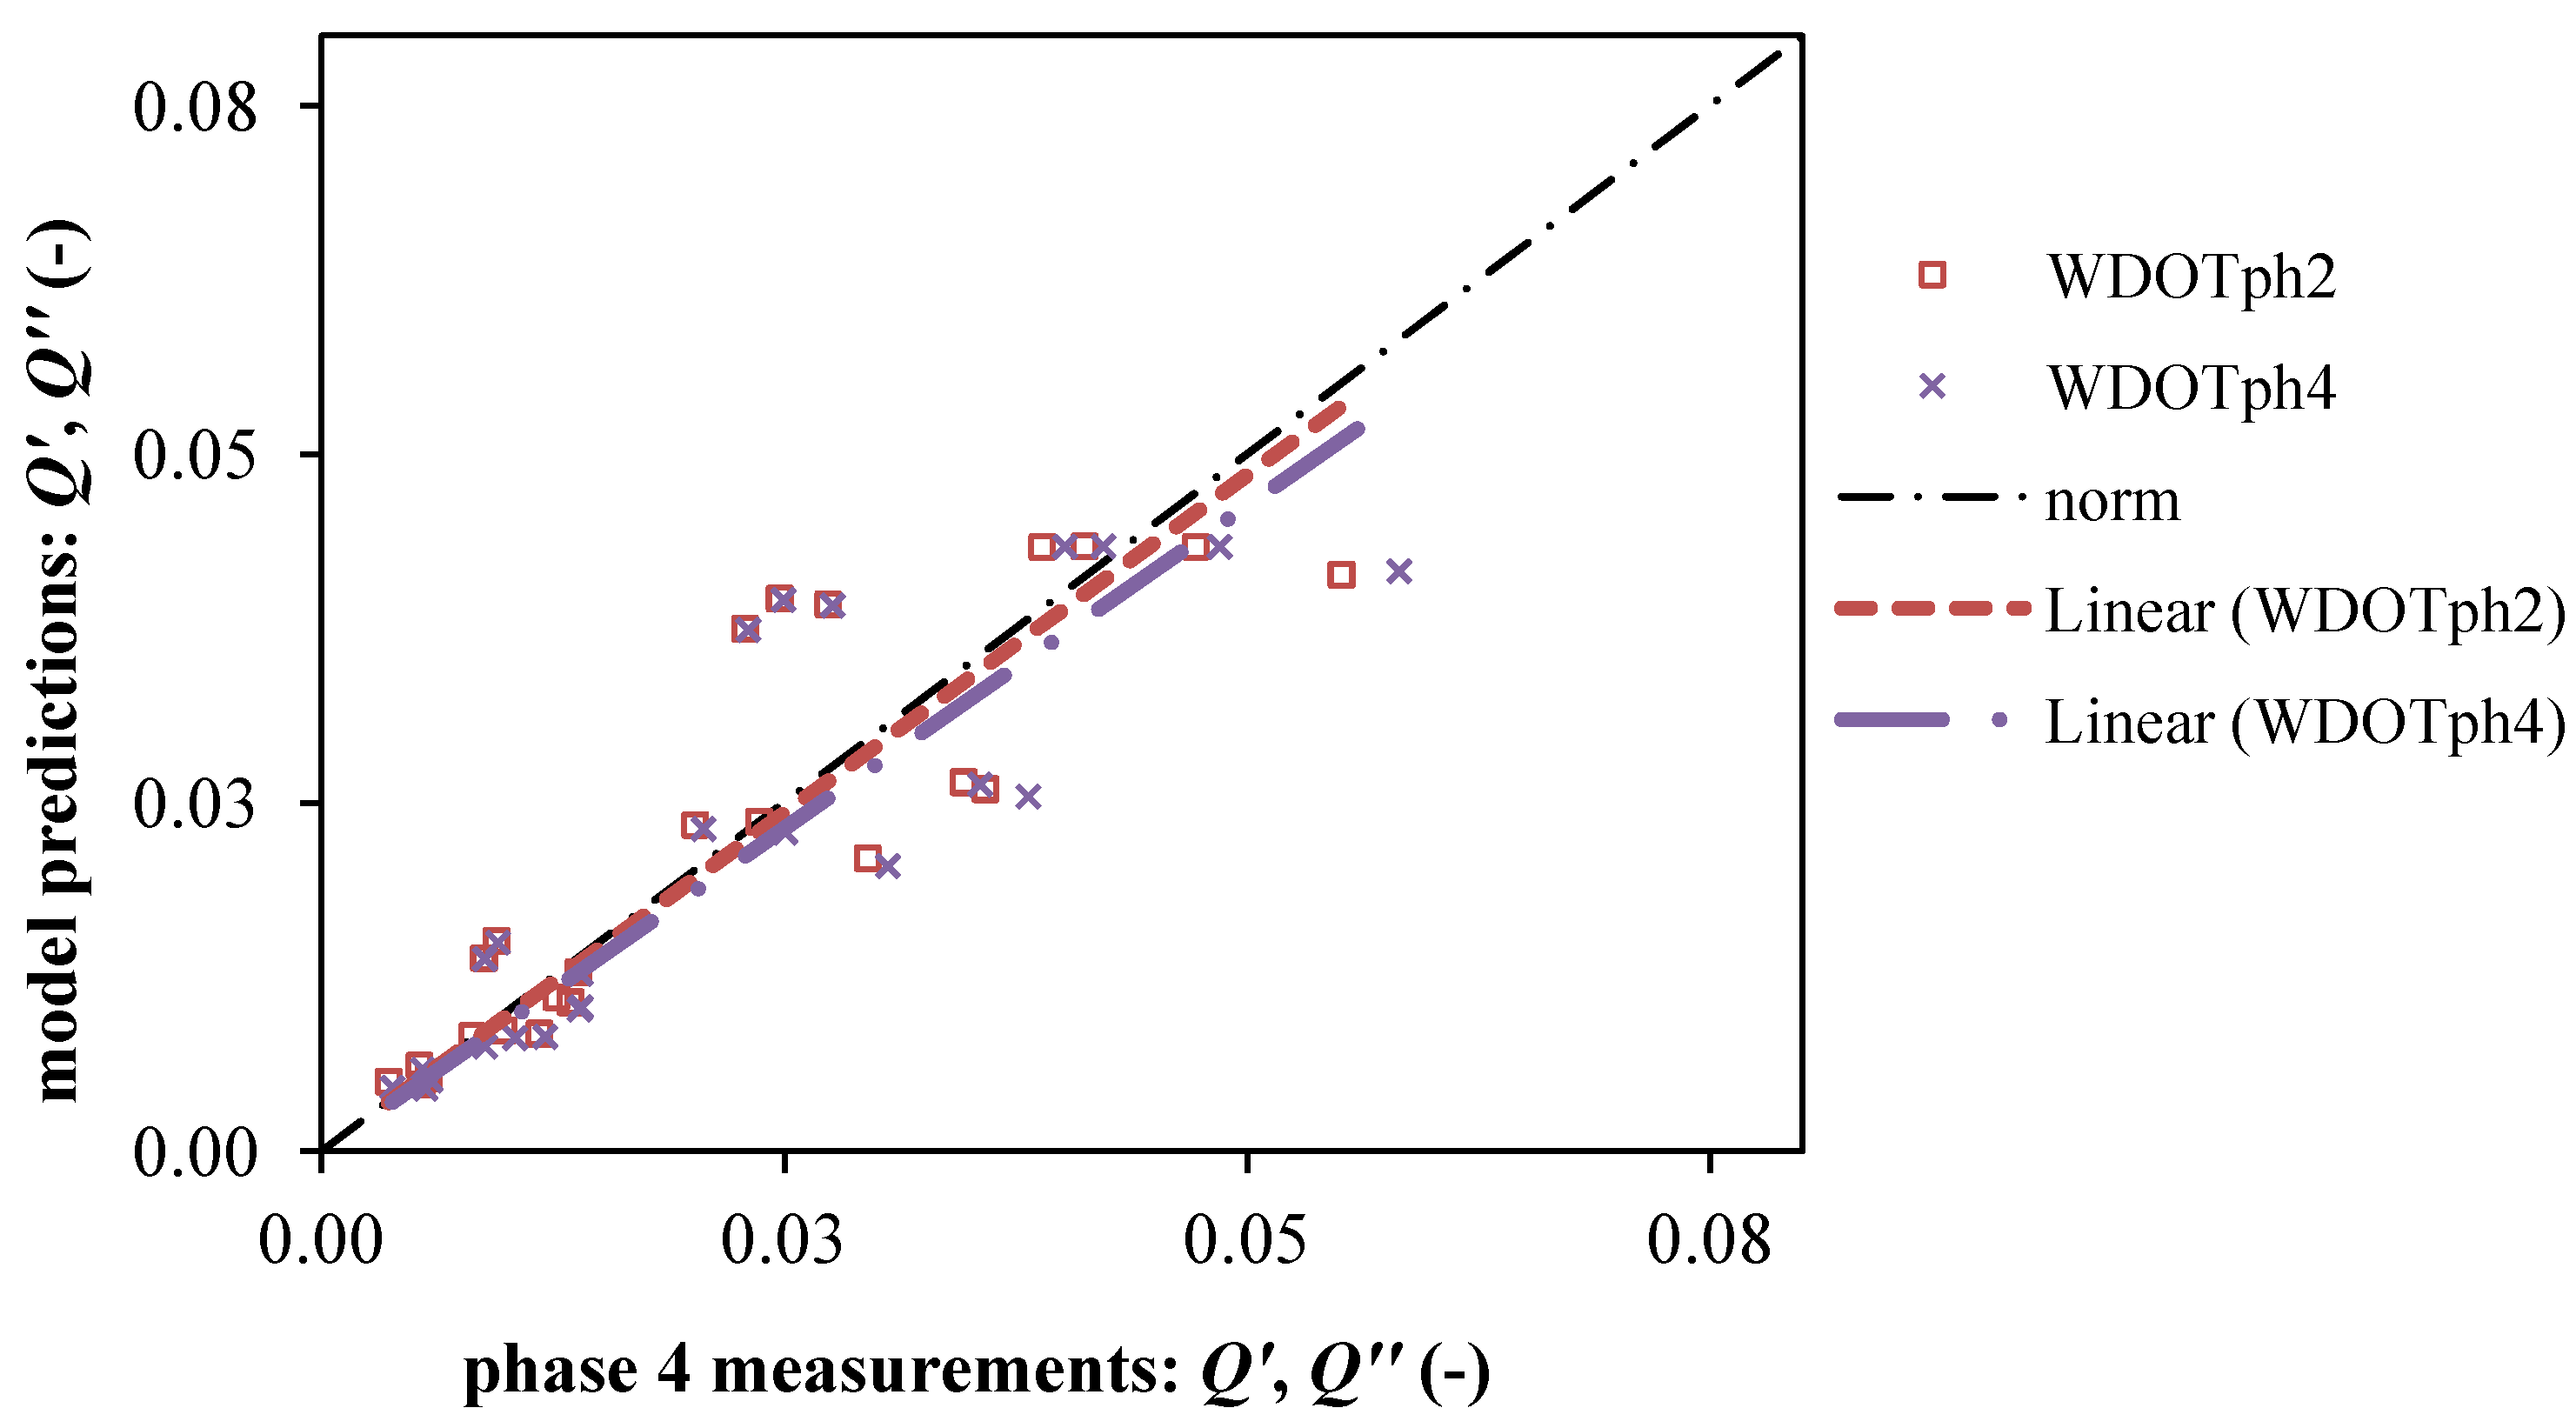
According to the assumptions made above, WDOTph2 predictions shall overestimate phase 4 measurements, as they do not account for the dissipation of energy caused by the reflectors’ motion. As shown in Figure 17 this does not happen, as WDOTph2 predictions are actually quite accurate in predicting phase 4 measurements, with a gain of 0.97. As a consequence, due to its construction, WDOTph4 underestimate phase 4 measurements.
The reason could be that some of the offset-correcting factors used in WDOTph2 are also influenced by the reflectors roll in such a way that they determine a reduction of the model predictions comparable to the decrease in the measured Q'. In this case WDOTph2 would already be accounting for the dissipative effect of the reflectors roll indirectly.
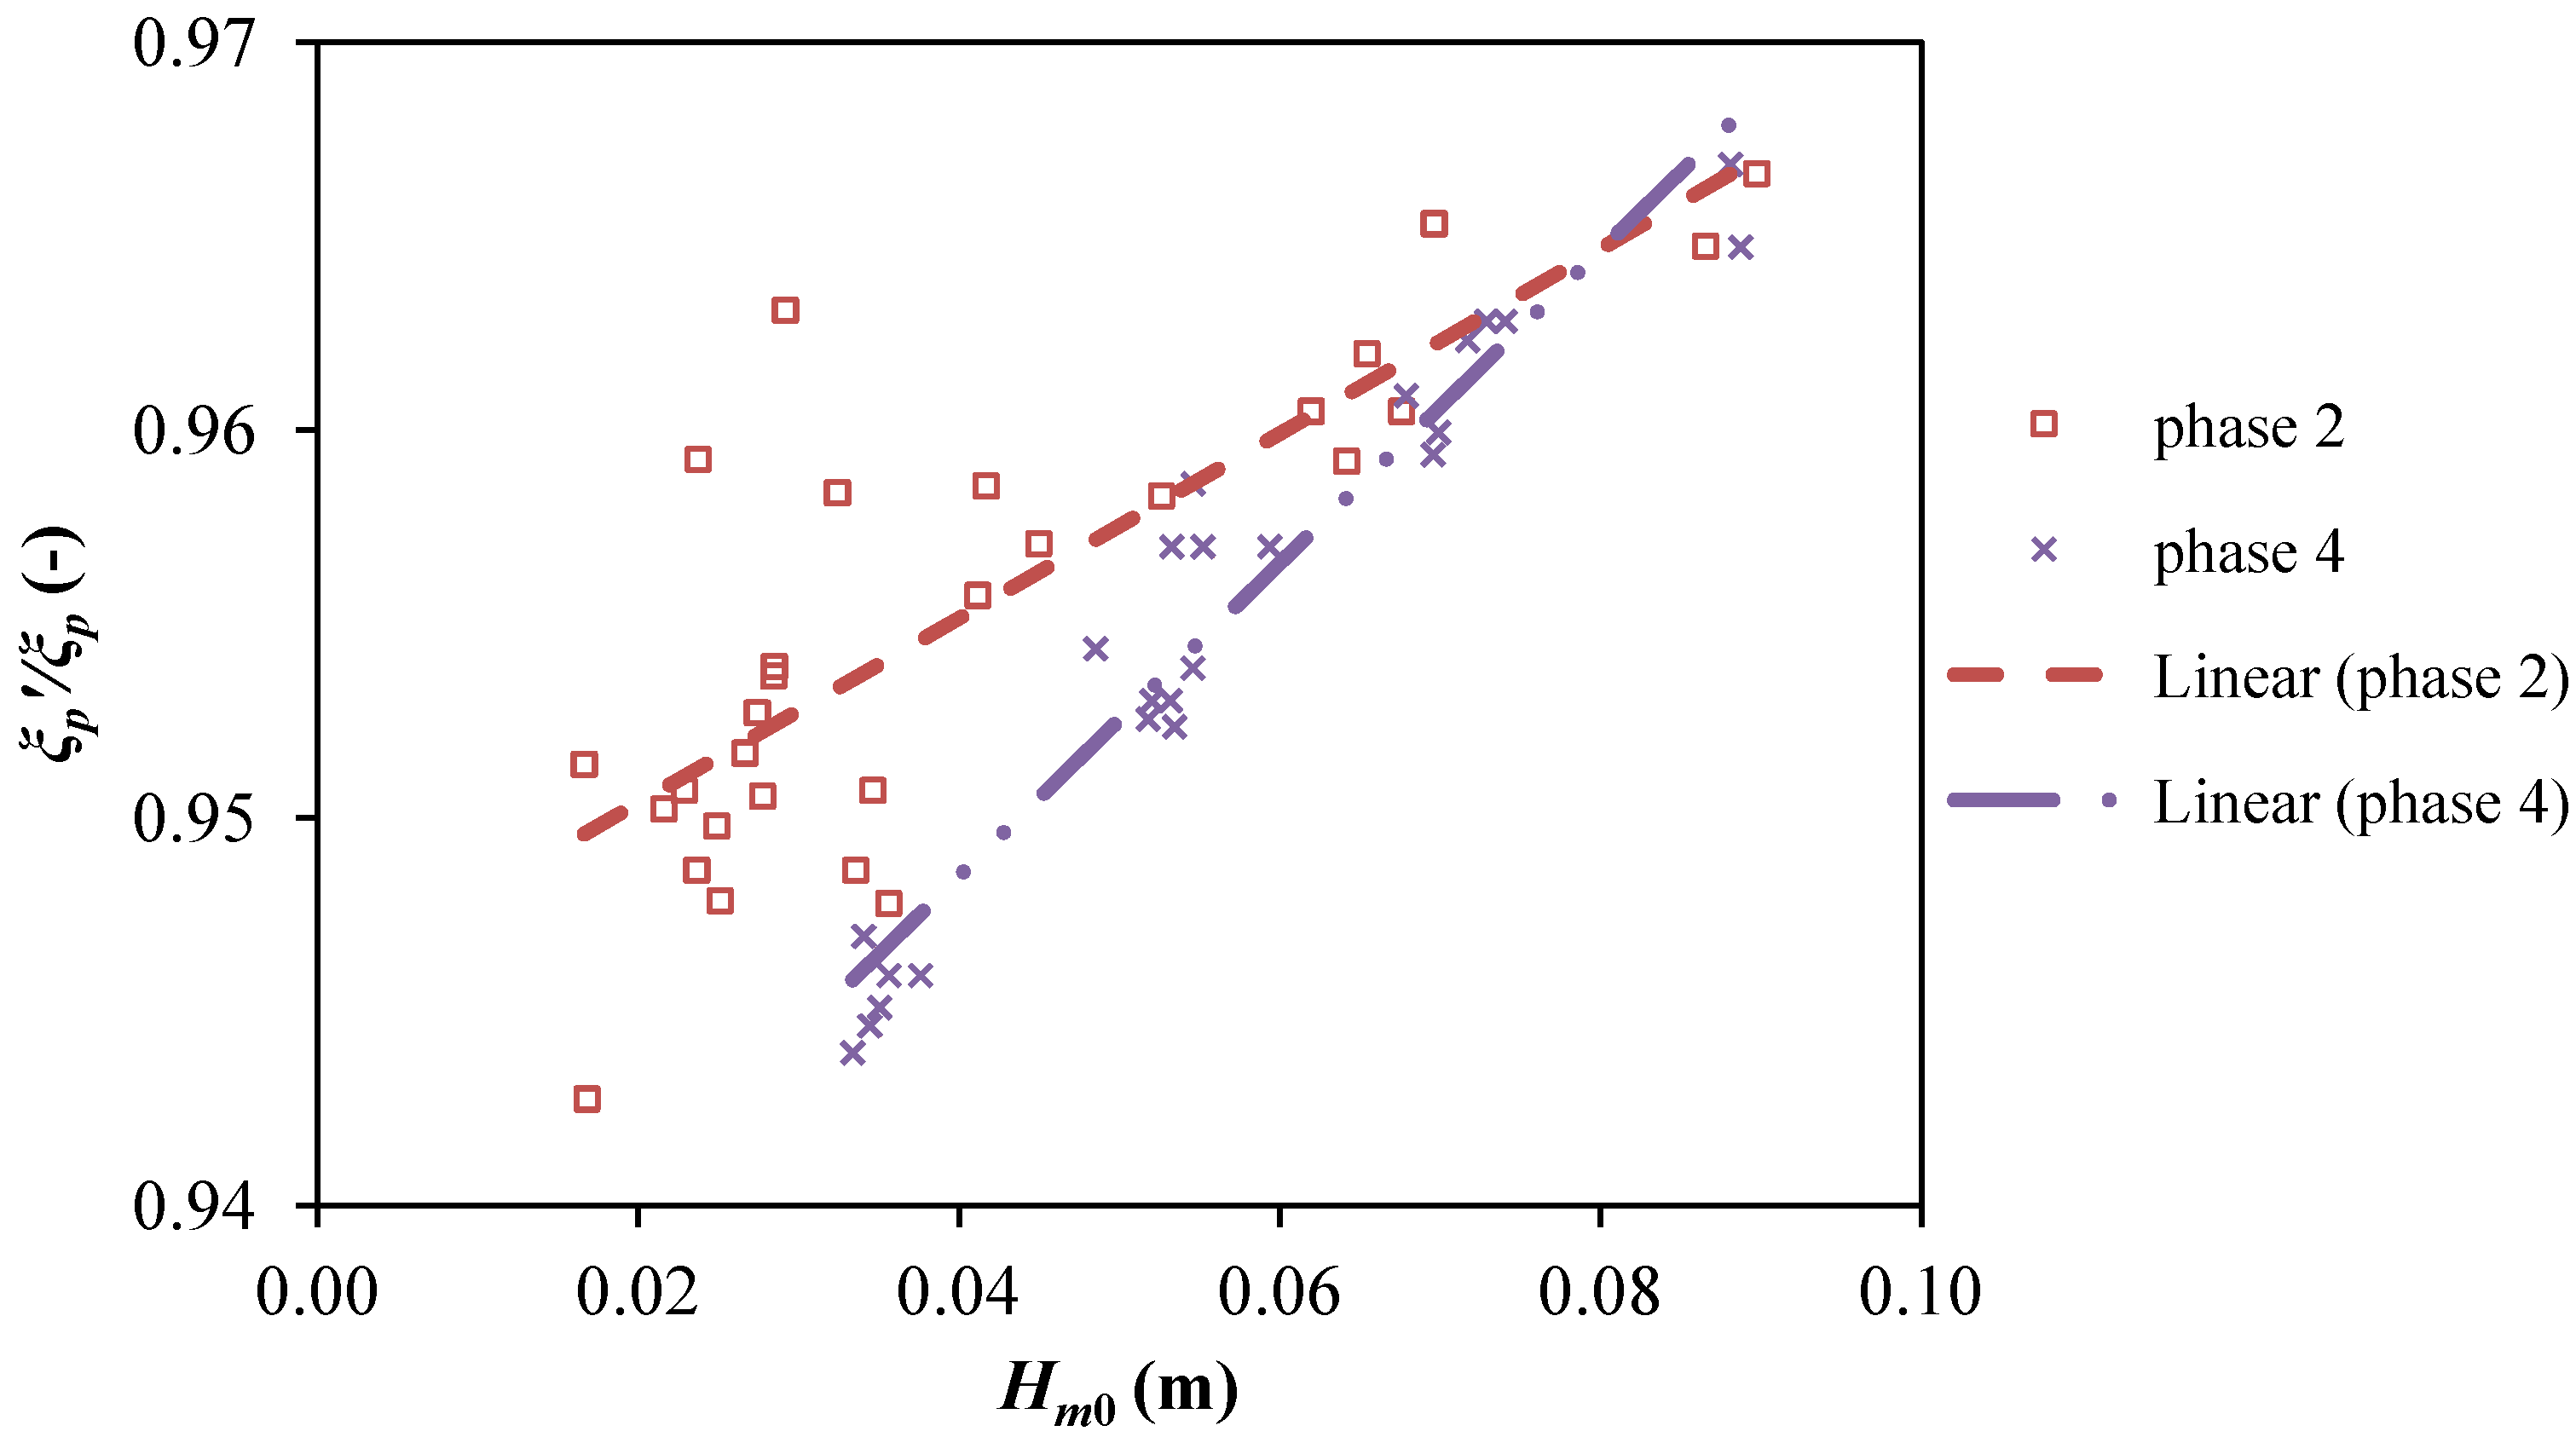
Figure 18 shows that the effect of the reflectors in reducing the breaking parameter from ξp to ξp' is more evident in phase 4 than in phase 2. Due to this, as WDOTph2 is applied on data from phase 4 it predicts lower Q' than for phase 2. This is congruent to the hypothesis made above: the effect of reflectors roll may already be accounted for in WDOTph2 model through the lower ξp', making the use of ζst redundant.
Figure 17. Average overtopping discharge, q (m3/s): predictions from the models vs. measurements in phase 4. Updated WDOTph2 and WDOTph4 models are shown. Models accuracies are measured by the gain of their linear trend-line (a target gain = 1 is shown as a black dash-dot line); their precisions by the trend-line R2 coefficients.
Energies 06 01961 g017
Figure 18. Effect of wing reflectors in decreasing ξp, measured in the cases of phase 2 and phase 4.
Energies 06 01961 g018
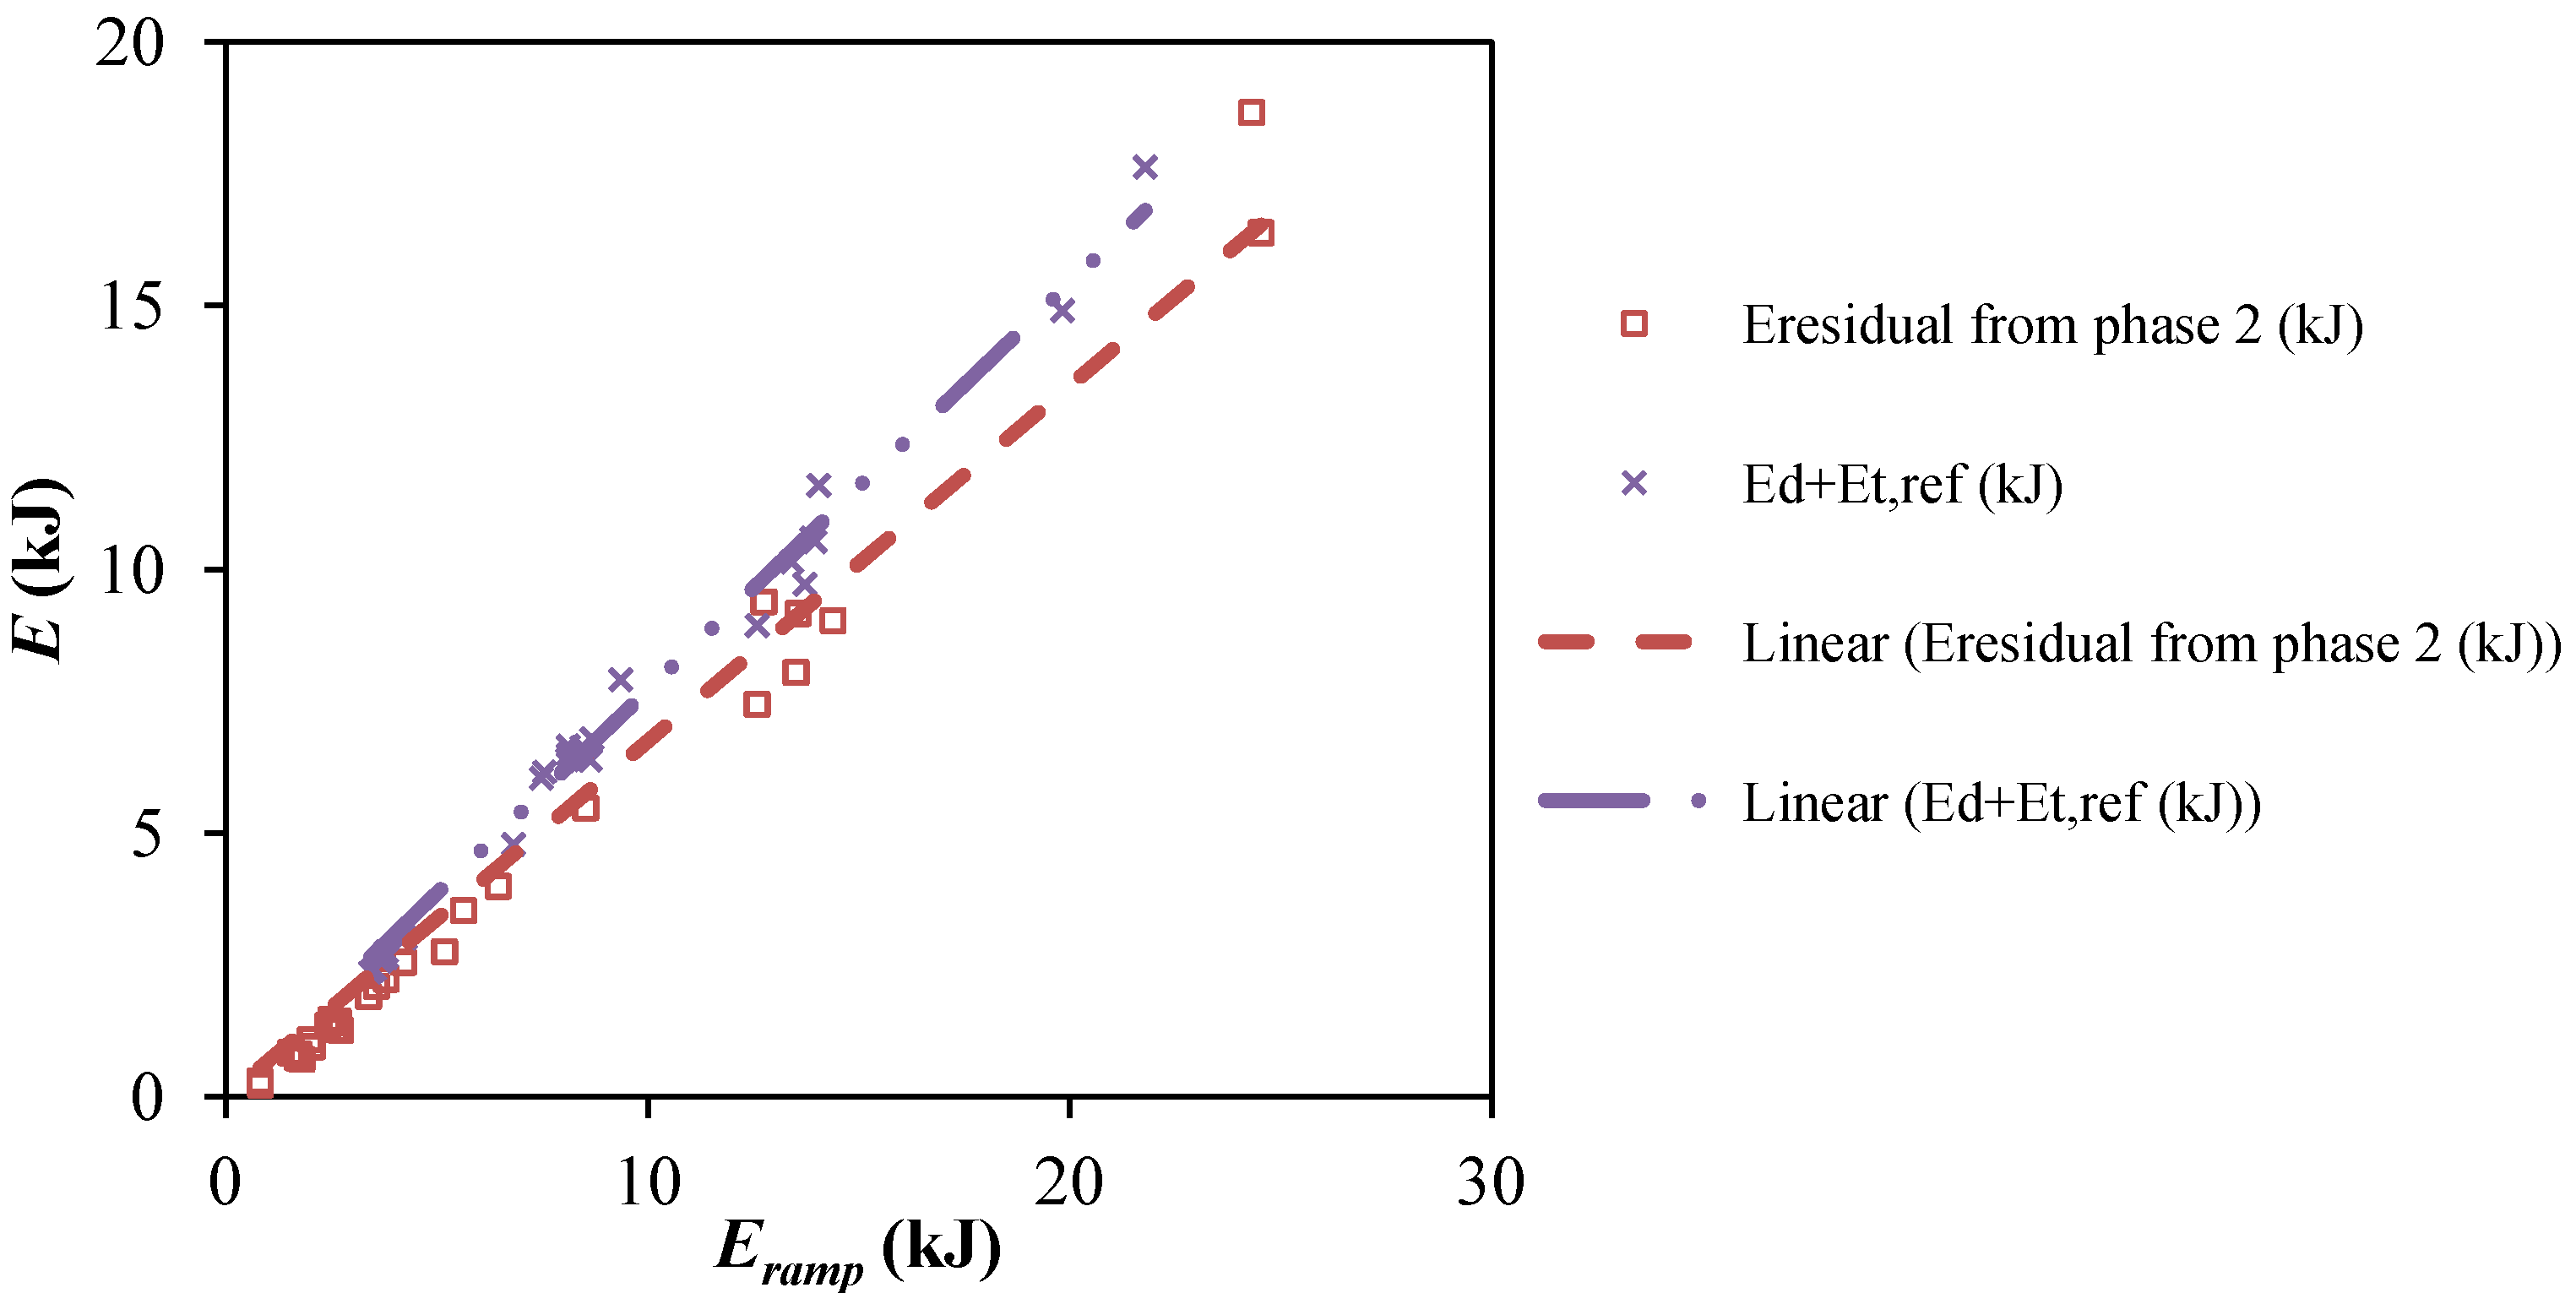
It can also be noted that the energy balance of phase 2 requires the existence of a residual energy term too, Eresidual = Eramp – (Er + Eot). This is comparable in magnitude to the energy lost in phase 4 through the reflectors roll, Ed + Et,ref, but cannot be ascribed to it (Figure 19). This poses the question whether it may be correct having considered in phase 4 all such residual energy as lost (see Figure 14 and Figure 15). Overall, in the case reflectors are not rigidly fixed a deeper analysis of the energy flows and wave field in front of the ramp shall be performed before including this effect in the overtopping model.
Figure 19. Residual energy from energy balance in phases 2 and 4, the latter having been referred to as energy lost in the reflectors motion.
Energies 06 01961 g019

4. Discussion

4.1. Usefulness of the Method Used

The rigorous methodology used in this paper is useful any time the effect of a given physical process on a system has to be quantified. Similar setups of the system can be tested, varying only the feature under study; in this way its effect on the output of the system becomes evident from a comparison of the results relative to the two different setups. This effect can be quantified through a sensitivity analysis in which the feature under investigation is varied, so that a dedicated parameter can be defined and calibrated through interpolation of the relative outputs. This approach, first used by Kofoed in assessing the effects of limited draft and low Rc on the overtopping [7], has been adopted in this research 4 times to individually asses specific effects identified as relevant for the Wave Dragon overtopping performance, such as the specific 3D shape of Wave Dragon, the wing reflectors, the device motions and the non-rigid connection.

4.2. Applicability of the Updated Model

The proposed model shall be applied to the range of tested conditions, including 0.2 < R < 1.5 and 0.011 < Sp < 0.039. Due to the average ramp slope of 38.3°, where the latter correspond to the case of Wave Dragon where 4 < ξp < 7.5. Within these ranges, the updated Wave Dragon overtopping model (WDOT) is able to account for the variability of the wave features (Hm0, Tp and Sp) and device configurations (floating level and draft, low crest height, reflectors features, pitch stability). All these parameters can be effectively measured onboard a commercial device, allowing for a real-time practical implementation of the model.
On the other hand, the use of physical parameters to express the dependency on each considered processes instead of providing new fitting coefficients allows a greater applicability to the proposed model, beyond the case of Wave Dragon considered here. The use of WDOT can be therefore easily extended to other floating overtopping wave energy converters, using reflectors or not to focus incoming wave energy.
Besides this, WDOT is specifically suited to the Wave Dragon through the introduction of geometrical coefficients. In any configuration considered, they shall be used in combination with the breaking parameter as shown in the model Equations (12), (14) and (19). In any other case (i.e., a device with different geometry or a different range of ξp is considered) new geometrical coefficients shall be determined by best fit of WDOT predictions with experimental results from tank testing of the setup under study.

4.3. Improvements Allowed by the Updated Model

The existing models considered for comparison in this paper [Equations (7) and (11)] have been determined relatively to configurations with less variability than Wave Dragon. Due to this, WDOT is better suited and more accurate for the Wave Dragon case as shown by the increased ability of the model to predict the experimental measurements, i.e., the model accuracy. This is shown in Figure 8 and Figure 11 by the gain of the linear trend-line being closer to 1 than for the other models. The precision of the model, measured by the R2 coefficient associated to the trend-line, is also generally higher for WDOT; however, it decreases progressively in phases 2 and 3 as much as the setup becomes more complex and variability of the process grows (Figure 8 and Figure 11).
The effect of Sp, which is normally neglected in overtopping literature for non-breaking waves [5], is accounted for since phase 1 through the introduction of ξp [Equation (12)]. This is due to Wave Dragon being typically characterized by lower R than coastal defense structures. The introduction of ξp in the model allowed a significant increase in the model quality by reducing the spread of data points and therefore improving its precision (Figure 5). Equation (7) accounts for the dependency of the overtopping on Tp for a draft-limited device through the λdr parameter, expressing the fact that short waves concentrate a larger portion of their energy close to the surface; in relative terms, this increases the wave energy that can be effectively harnessed by a draft-limited device, hence its overtopping efficiency. This effect is maintained by WDOT, which by including ξp also describes the fact that, Hm0 being equal, longer waves are more energetic and able to produce more overtopping in absolute terms.
In phase 2 the a coefficient describes the maximum wave amplification effect allowed by the reflectors; this is 13% on Hm0 (28% on the incident wave energy), achievable in case an optimal opening of about 40° and very short waves; this is due to the amplification effect of the reflectors also being frequency dependent through the ζdrR parameter [15].
With regard to this, previous research showed that the wave amplification achievable through wave reflectors can reach up to 36% [17]. The mentioned study considered wave reflectors alone in the wave field, the wave elevation being recorded directly in between them at the end section; in this study the main platform was also included instead, the wave amplification being derived indirectly from the measurements of the overtopping flow. Overall, it can be concluded that the wave amplification effect achievable using wave reflectors can be higher than shown in this study, but somehow not all the focused energy can be efficiently converted into overtopping. This can be due the particular reflection pattern taking place in front of the ramp, which shall be investigated in future research.
In phase 3 the beneficial effect of pitch stability is shown. Maximum extreme pitch in operational conditions has been assessed in 8° from the tests, referring to a full oscillation (i.e., pitch amplitude being roughly the half of it). Previous research from the authors has shown that pitch stability is also very important in lowering mooring forces, and can be passively achieved by means of the correct distribution of weight and buoyancy elements on the device [16].
Although not used in WDOT, the parameter λX is useful to make some consideration about the dynamic behavior of Wave Dragon. First, it expresses the fact that also in dynamic conditions Wave Dragon is more efficient in short waves (i.e., with low T0,2), which represent by far the most frequent conditions during the year. In this case, the surge motion is reduced and the device is almost still relatively to the waves, reproducing the situation described in phases 1 and 2. In longer waves, due to the increase in surge motion, wave energy is not harnessed as efficiently; however the larger incoming wave energy widely compensates this effect in absolute terms, also due to the low R typical of these conditions. Reaching up to extreme conditions, surge further increases and, if the mooring system is compliant enough (as suggested to lower mooring forces [16]), Wave Dragon tends to “follow” the surface elevation in its motions, avoiding impacts with large waves on the deck and improving its survivability. A large correlation effect with pitch derives from this, so that for the sake of overtopping modeling it was not necessary to account for both these effects and λθ only has been included in Equation (19).
The effect of the variable rigidity in the reflectors connection has been modeled as a dependency on their roll motion and torque. As for the other parameters proposed, these can also be measured in real-time through a gyroscope and a force transducer on a full-scale deployment. A parameter ζst expressing a reduction of the wave amplification effect of the reflectors in this case has been proposed. However, results show conflicting predictions about overtopping in phase 4, as measurements are underestimated. This is probably due to an incomplete quantification of the energy balance of the system and, again, of the complex wave pattern originating in front of the ramp. In particular, results suggest that the reflectors motion might induce a reduction of ξp' in front of the ramp, which could already indirectly account for the model underestimation of the overtopping flow. In case this is confirmed it would be a further proof of the usefulness of a model based on physical-related parameters rather than on constant fitting coefficients. Besides this, the system used to measure the dissipated energy needs to be improved too, while measurements of the transmitted energy Et,ref can be expected to improve the quality of the model.
Due to these limitations it is deemed reasonable to currently refer WDOT to the results of phase 3 [Equation (21)], although the approach used in phase 4 and the formulation proposed in Equation (21), are regarded as a good basis to account for the effect of non-rigid reflectors.

4.4. Predicted Overtopping Performance of a Full-Scale Unit

The overtopping performance of a 4 MW Wave Dragon unit suitable for deployment in the North Sea have been assessed based both on the model previously used [Equation (7)] and the updated versions of the model from the first three phases [Equations (12), (14) and (19)]. The assessment was carried out considering the five standard operational wave states of the Danish North Sea [14], with optimal opening of the reflectors (op = 38.7°), drR = dr and 0.2 < R < 1.5. Pitch motion was estimated based on the relationship with the incident Hm0 derived from phase 3 measurements, as σθ = 0.42 ∙ Hm0. The overtopping power has also been calculated accordingly, based on Equation (1). Results are shown in Figure 20, normalized per meter of crest width in order for the comparison to be independent on the presence of the reflectors. In average (i.e., from the trend-lines in Figure 20) WDOT predicts 0.2 < R < 0.8 as the optimal range for overtopping power production, with best value R = 0.5 in all three cases; predictions from Equation (7) set this to lower values instead, which is in contrast with previous findings [3,13].
When a setup with no reflectors is considered WDOT predictions are higher respect to those from Equation (7) for R > 0.75. This could be explained by the occurrence of water spill on the model at low R, which would determine lower measured q than actually occurring. However, although not measured, this eventuality can be discarded from visual observations. Therefore a possible explanation is that Equation (7) is based on a 2D setup, resembling an infinite width structure, on which overtopping density q/W is normally greater than on a 3D one; the difference becomes progressively less evident for increasing R, as less overtopping occurs.
The addition of reflectors confirms to be very beneficial, as shown by WDOTph2 predictions being in average larger than those from Equation (7) already for R > 0.4, hence including a large part of the optimal range for power production. The average increase in overtopping power production is 7% in the range of 0.4 < R < 0.6 and growing then exponentially with R, up to 30% for R = 0.8 and 50% for R = 1.
Predictions from WDOTph3 show a dramatic decrease in overtopping performance, in the order of 10%–40%, for even low pitch oscillations with σθ ranging from 0.2° to 0.9°, which further confirms the importance for the device of being as stable as possible. Pitch stability could be significantly improved by adopting a better distribution of the weight and buoyant elements of the platform, as shown by the recent testing of a 3rd generation scaled model of Wave Dragon [16] which is more closely representative of a full-scale device. Furthermore, a scale effect exists in that the compressibility of the air in the open-bottom chambers below the platform cannot be down-scaled; this provided in phase 3 a stiffer hydrostatic restoring coefficient to the model in the vertical direction, making it less stable in heave and pitch than it would be at full-scale.
Figure 20. Overtopping performance assessment of a 4 MW Wave Dragon in the Danish North Sea, based on predictions from the model previously used [Equation (7)] and the updated WDOT model from the first three phases [Equation (12), (14) and (19)]. Values are normalized per meter of crest width, including: (a) Predicted average overtopping flow per meter of crest width, q/W (m3∙m−1∙s−1); and (b) Predicted overtopping power per meter of crest width, Pcrest/W (kW/m).
Energies 06 01961 g020

5. Conclusions and Further Work

Wave overtopping is the stage of the wave-to-wire energy conversion where interactions of Wave Dragon with the local environment and the effect of its configuration can be accounted for. The need for an updated overtopping model specifically suited for Wave Dragon emerged in view of the need for more reliable performance assessment of the device, easily adaptable to any deployment location.
Built on a previously used formulation [Equation (7)], the updated Wave Dragon overtopping model (WDOT) allows this kind of flexibility by including a set of parameters accounting for the effect on the average overtopping discharge of the wave steepness, the device geometry, the wing reflectors and the motions of the device. These parameters have been experimentally determined through dedicated sensitivity analyses in a 4-phase research in which a scaled version of the device have been tested in different configurations with added degree of complexity. A proposal for further inclusion of a parameter accounting for the effect of a non-rigid connection between the reflectors and the main platform is also included in this study, but requires further research before being adopted in the model.
With regard to this, a revised joint connection limiting the roll motion of the reflectors (hence improving the overtopping efficiency) has been tested in view of the design of the Wave Dragon 1.5 MW North Sea pre-commercial demonstrator [16].
Predictions from the WDOT model has been compared to those from two models from the literature suited for overtopping WECs, specifically a generic low-crested, draft limited device [10] and a low-crested bottom-fixed one [11]. Results showed that in each phase of the research WDOT was able to improve the quality of predictions respect to the reference models, by increasing their accuracy (convergence to the experimental measurements) and precision (repeatability of the results). Model’s accuracy has been quantified by the gain of linear trend-line between overtopping measurements and predictions; precision by its correlation coefficient with data, R2.
The model formulation previously used for Wave Dragon [Equation (7)] provides good predictions in phase 1, but underestimates performances when reflectors are included (phase 2) and overestimates performances when motions are accounted for (phase 3). Results presented confirm the beneficial effect of reflectors on q, with increased predictions from WDOTph2 than from WDOTph1; the gain in q grows with R at a rate of 5% in the optimal range of 0.2 < R < 1 considered. The importance of avoiding pitch motions is also confirmed, as pitch significant oscillations in the order of 1°–4° may determine an average q reduction in the order of 30%.
Further work would require the validation of the updated model against overtopping measurements from a different dataset than the one presented here and on which it has been derived. Although data are available from the sea trials of the 1:4.5 scale prototype in Nissum Bredning [2], wave conditions here are typically in the range of 0.02 < Sp < 0.07 and with Sp,mean = 0.04, significantly different than in the offshore North Sea. As from the recommendations made in Section 2 and Section 4.2, this makes it presently not possible to correctly apply the WDOT at this location, since typical Sp are not included in the range of tested conditions on which the model is based. Further research is therefore required to assess the applicability of the model outside the range of tested Sp, hence to locations characterized by different mean wave climates, either through additional tank testing or by drawing indications on how account for possible effects from similar models available in literature.
A detailed analysis of the wave field in front of the ramp is also required, especially in presence of the wave reflectors, as discussed in Section 4.3. A more detailed analysis of the energy flow through the system would be also beneficial for a more precise assessment of the energy loss due to the reflectors motion.

Nomenclature:

AProduct of all offset-correcting factors in the overtopping formulation(-)
BProduct of all gain-correcting factors in the overtopping formulation(-)
CoGCentre of gravity
EdEnergy dissipated by the reflectors roll motion(kJ)
Ef,dAverage energy flux per meter width integrated from free surface to sea bottom, as used in λdr formulation(W/m)
Ef,drAverage energy flux per meter width integrated from free surface to Wave Dragon draft, as used in λdr formulation(W/m)
EiIncident wave energy calculated on Wtot on the 30 min test(kJ)
EotPotential energy of water overtopping the ramp(kJ)
ErEnergy reflected by Wave Dragon(kJ)
ErampPortion of incident wave energy intercepted by Wave Dragon (from free surface to draft)(kJ)
EresidualResidual portion of incident wave energy not reflected, overtopping, transmitted below the draft or dissipated by reflectors roll(kJ)
Et,drPortion of incident wave energy transmitted below the draft of Wave Dragon(kJ)
Et,refEnergy transmitted on the lee of Wave Dragon by the reflectors roll motion as transmitted waves(kJ)
H1/250Extreme wave height, calculated from time-domain analysis as average of the 1/250 highest waves(m)
Hm0Undisturbed significant wave height from spectral analysis(m)
Hm0'Amplified Hm0 at the ramp due to effect of wing reflectors(m)
Hm0''Amplified Hm0 at the ramp due to effect of wing reflectors with non-rigid connection(m)
HtTurbines working head(m)
KopOptimal reflectors opening angle, as used in ζop formulation(°)
LpWave length based on Tp(m)
M1/3Significant torque acting on wing reflectors in the roll direction, calculated as average of the highest 1/3 peaks(N · m)
PactActual power delivered to the grid(kW)
PestEstimated power produced by turbines at optimal speed(kW)
PhydPotential power of water stored in the reservoir(kW)
PcrestPotential power of water overtopping the ramp(kW)
POT1Horizontal potentiometer used in phase 3 for surge measurements
POT2Vertical rear potentiometer used in phase 3 for heave and pitch measurements
POT3Vertical front potentiometer used in phase 3 for heave and pitch measurements
QNon-dimensional mean overtopping discharge per crest meter width(-)
QnormNon-dimensional mean overtopping discharge per crest meter width, normalized by A(-)
R2Correlation coefficient between data and fitting curve(-)
RNon-dimensional crest level(-)
RcCrest level above the mean water level(m)
Rc,tTarget crest level above the mean water level(m)
SpWave steepness based on Tp(-)
T0,2Spectral mean wave period, calculated as square root of ratio between spectral moments of order 0 and 2(s)
TpPeak wave period(s)
WCrest width(m)
WtotWave Dragon total width from tip to tip of the wing reflectors(m)
WAMWave Amplification Model, expressing the effect of the wing reflectors on Hm0
WDOTUpdated version of the Wave Dragon overtopping model
WDOTph1Updated version of the Wave Dragon overtopping model from phase 1 of this study, including the effects of Wave Dragon 3D geometry and wave steepness
WDOTph2Updated version of the Wave Dragon overtopping model from phase 2 of this study, adding to WDOTph1 the effect of the wing reflectors
WDOTph3Updated version of the Wave Dragon overtopping model from phase 3 of this study, adding to WDOTph2 the effect of Wave Dragon motions
WDOTph4Updated version of the Wave Dragon overtopping model from phase 4 of this study, adding to WDOTph2 the effect of a non-rigid connection between main platform and wing reflectors
X0Horizontal distance between attachment point of POT1 and CoG, used in phase 3 to calculate the surge motion(m)
XSurge motion of Wave Dragon(m)
ZHeave motion of Wave Dragon(m)
aGain coefficient of the WAM(-)
dWater depth(m)
dPOTHorizontal distance between vertical POT used in phase 3(m)
dRcHalfway the horizontal distance between the CoG and Rc, measured at the centerline, used to calculate the instantaneous Rc in phase 3(m)
drWave Dragon draft(m)
drRWing reflectors draft(m)
gGravity acceleration(m/s2)
kpWave number based on Lp(m−1)
opReflectors opening: angle between the longitudinal line and reflectors chord (tip-to-connection)(°)
qOvertopping mean discharge (m3/s)
sCoefficient of cos 2s spreading function(-)
stReflectors stiffness(N m/rad)
αSlope angle to horizontal plane(°)
γPeak enhancement factor of the JONSWAP spectrum(-)
γxGeneric gain-correcting factors of the overtopping model(-)
γwdGain-correcting factor accounting for the effect of Wave Dragon geometry(-)
ζxGeneric correcting factors of the WAM(-)
ζdrRCorrecting factor of the WAM accounting for limited draft of the wing reflectors(-)
ζopCorrecting factor of the WAM due to reflectors opening(-)
ζstCorrecting factors of the WAM due to non-rigid connection between main platform and wing reflectors(-)
ηfcFrequency converter efficicency(-)
ηPMGPermanent Magnet Generators efficiency(-)
ηturbTurbines efficiency(-)
κFitting coefficient used in λdr formula(-)
λxGeneric offset-correcting factors of the overtopping model(-)
λdrOffset-correcting factor accounting for effect of limited draft(-)
λsOffset-correcting factor accounting for effect of low crest(-)
λwdOffset-correcting factor accounting for effect of Wave Dragon geometry(-)
λZOffset-correcting factor accounting for effect of heave motion(-)
λXOffset-correcting factor accounting for effect of surge motion(-)
λθOffset-correcting factor accounting for effect of pitch motion(-)
ξpBreaking parameter based on Tp(-)
ρWater density(kg/m3)
θPitch motion of Wave Dragon(°)
σStandard deviation from spectral analysis
ϕSurge motion angular frequency from spectral analysis(rad/s)
ΦRoll motion of reflectors(rad)
ωWave angular frequency(rad/s)

Superscripts:

'Indicates the parameter is calculated based on Hm0', accounting for wave amplification effect due to wing reflectors
''Indicates the parameter is calculated based on Hm0'', accounting for wave amplification effect due to wing reflectors with non-rigid connection to the main platform

Subscripts:

0 Indicates the parameter is based on deep-water approximation
−1,0 Indicates the parameter is based on the energy period from spectral analysis, T1,0
0,2 Indicates the parameter is based on the average period from spectral analysis, T0,2
1/250Indicates extreme parameter based on the average of the highest 1/250 values
pIndicates the parameter is based on the peak period from spectral analysis, Tp

Acknowledgments

The first author gratefully acknowledges the financial support from the European Commission through the 7th Framework Programme (the Marie Curie Initial Training Network WaveTrain2 project, Grant agreement number 215414).

References

  1. Frigaard, P.; Hald, T. Forces and Overtopping on 2nd generation Wave Dragon for Nissum Bredning; Technical Report; Hydraulic and Coastal Engineering Laboratory, Department of Civil Engineering, Aalborg University: Aalborg, Denmark, 2001. [Google Scholar]
  2. Kofoed, J.P.; Frigaard, P.; Friis-Madsen, E.; Soerensen, H.C. Prototype testing of the wave energy converter Wave Dragon. Renew. Energy 2006, 31, 181–189. [Google Scholar] [CrossRef]
  3. Tedd, J. Testing, Analysis and Control of Wave Dragon, Wave Energy Converter. Ph.D. Dissertation, Hydraulic and Coastal Engineering Laboratory, Department of Civil Engineering, Aalborg University, Aalborg, Denmark, 2007. [Google Scholar]
  4. Danish Wave Energy Centre, Hanstholm Home Page. Available online: http://www.danwec.com (accessed on 10 January 2013).
  5. EurOTop. In Wave Overtopping of Sea Defences and Related Structures: Assessment Manual; Environment Agency (EA): Rotherham, UK; Expertise Netwerk Waterkeren: Lelystad, The Netherlands; Kuratorium für Forschung im Küsteningenieurwesen (KFKI): Hamburg, Germany, 2007.
  6. Van der Meer, J.W.; Janssen, J.P.F.M. Wave run-up and wave overtopping at dikes. In Wave Forces on Inclined and Vertical Wall Structures; Kobayashi, N., Demirbilek, Z., Eds.; American Society of Civil Engineers: Reston, VA, USA, 1995; pp. 1–27. [Google Scholar]
  7. Owen, M.W. Design of Sea Walls Allowing for Wave Overtopping; Report EX 924; Hydraulics Research: Wallingford, UK, 1980. [Google Scholar]
  8. Goda, Y. Derivation of unified wave overtopping formulas for seawalls with smooth, impermeable surfaces based on selected CLASH datasets. Coast. Eng. 2009, 56, 385–399. [Google Scholar] [CrossRef]
  9. Van Gent, M.R.A.; Van den Boogaard, H.F.P.; Pozueta, B.; Medina, J.R. Neural network modelling of wave overtopping at coastal structures. Coast. Eng. 2007, 54, 586–593. [Google Scholar]
  10. Kofoed, J.P. Wave Overtopping of Marine Structures—Utilization of Wave Energy. Ph.D. Dissertation, Hydraulic and Coastal Engineering Laboratory, Department of Civil Engineering, Aalborg University, Aalborg, Denmark, 2002. [Google Scholar]
  11. Victor, L. Optimization of the Hydrodynamic Performance of Overtopping Wave Energy Converters: Experimental Study of Optimal Geometry and Probability Distribution of Overtopping Volumes. Ph.D. Dissertation, Department of Civil Engineering, Coastal Engineering Division, Faculty of Engineering and Architecture, Ghent University, Ghent, Belgium, 2012. [Google Scholar]
  12. Tedd, J.; Friis-Madsen, E.; Kofoed, J.P.; Knapp, W. Wave Dragon. In Ocean Wave Energy; Cruz, J., Ed.; Springer-Verlag: Berlin, Germany, 2008; Chapter 7.4; pp. 321–335. [Google Scholar]
  13. Parmeggiani, S.; Pecher, A.; Kofoed, J.P.; Friis-Madsen, E. Modeling of the Overtopping Flow on the Wave Dragon Wave Energy Converter. In Proceedings from the Third International Conference on Ocean Energy, Bilbao, Spain, 6−8 October 2010.
  14. Kofoed, J.P.; Frigaard, P. Development of Wave Energy converters: The Danish case. J. Ocean Technol. 2009, 4, 83–96. [Google Scholar]
  15. Parmeggiani, S.; Kofoed, J.P.; Friis-Madsen, E. Experimental Modeling of the Overtopping Flow on the Wave Dragon Wave Energy Converter. In Proceedings from the 21st International Offshore and Polar Engineering Conference, Maui, HI, USA, 22 June 2011.
  16. Parmeggiani, S.; Kofoed, J.P.; Friis-Madsen, E. Experimental study related to the mooring design for the 1.5 MW Wave Dragon WEC demonstrator at DanWEC. Energies 2013, 6, 1863–1886. [Google Scholar] [CrossRef]
  17. Kramer, M.; Frigaard, P. Reflectors to Focus Wave Energy. In Proceedings of the Sixth European Wave and Tidal Energy Conference, Glasgow, UK, 29 August–2 September 2005.

