Article

Modeling Evaluation of Tidal Stream Energy and the Impacts of Energy Extraction on Hydrodynamics in the Taiwan Strait

1
National Science and Technology Center for Disaster Reduction, New Taipei City 23143, Taiwan
2
Department of Civil and Disaster Prevention Engineering, National United University, Miaoli 36003, Taiwan
3
Department of Bioenvironmental Systems Engineering, National Taiwan University, Taipei 10617, Taiwan
*
Author to whom correspondence should be addressed.
Energies 2013, 6(4), 2191-2203; https://doi.org/10.3390/en6042191
Submission received: 7 February 2013 / Revised: 13 April 2013 / Accepted: 14 April 2013 / Published: 18 April 2013
(This article belongs to the Special Issue Energy from the Ocean - Wave and Tidal Energy)

Abstract

:
Tidal stream speeds in straits are accelerated because of geographic and bathymetric features. For instance, narrow channels and shallows can cause high tidal stream energy. In this study, water level and tidal current were simulated using a three-dimensional semi-implicit Eulerian-Lagrangian finite-element model to investigate the complex tidal characteristics in the Taiwan Strait and to determine potential locations for harnessing tidal stream energy. The model was driven by nine tidal components (M2, S2, N2, K2, K1, O1, P1, Q1, and M4) at open boundaries. The modeling results were validated with the measured data, including water level and tidal current. Through the model simulations, we found that the highest tidal currents occurred at the Penghu Channel in the Taiwan Strait. The Penghu Channel is an appropriate location for the deployment of a tidal turbine array because of its deep and flat bathymetry. The impacts of energy extraction on hydrodynamics were assessed by considering the momentum sink approach. The simulated results indicate that only minimal impacts would occur on water level and tidal current in the Taiwan Strait if a turbine array (55 turbines) was installed in the Penghu Channel.

1. Introduction

Traditional fossil fuel energy sources, such as oil, natural gas, and coal, have been explored and used in great amounts since the Industrial Revolution and are therefore gradually depleting. Additionally, traditional energy sources can cause environmental impacts, such as the greenhouse effect and environmental pollution, making reduced dependence on these sources a widespread goal. Renewable energies are sustainable and clean energy sources that offer the potential to mitigate the depletion of traditional fossil fuels and their associated environmental impacts, while also resolving the issues of economic development and environmental protection. During the last decade, the development and application of renewable energies have accelerated [1,2].
The development of renewable energy may be necessary to solve these energy issues. The renewable energy reserves of Taiwan are actually rich. The potential renewable energies include solar, wind, biomass, ocean, geothermal, and hydropower [
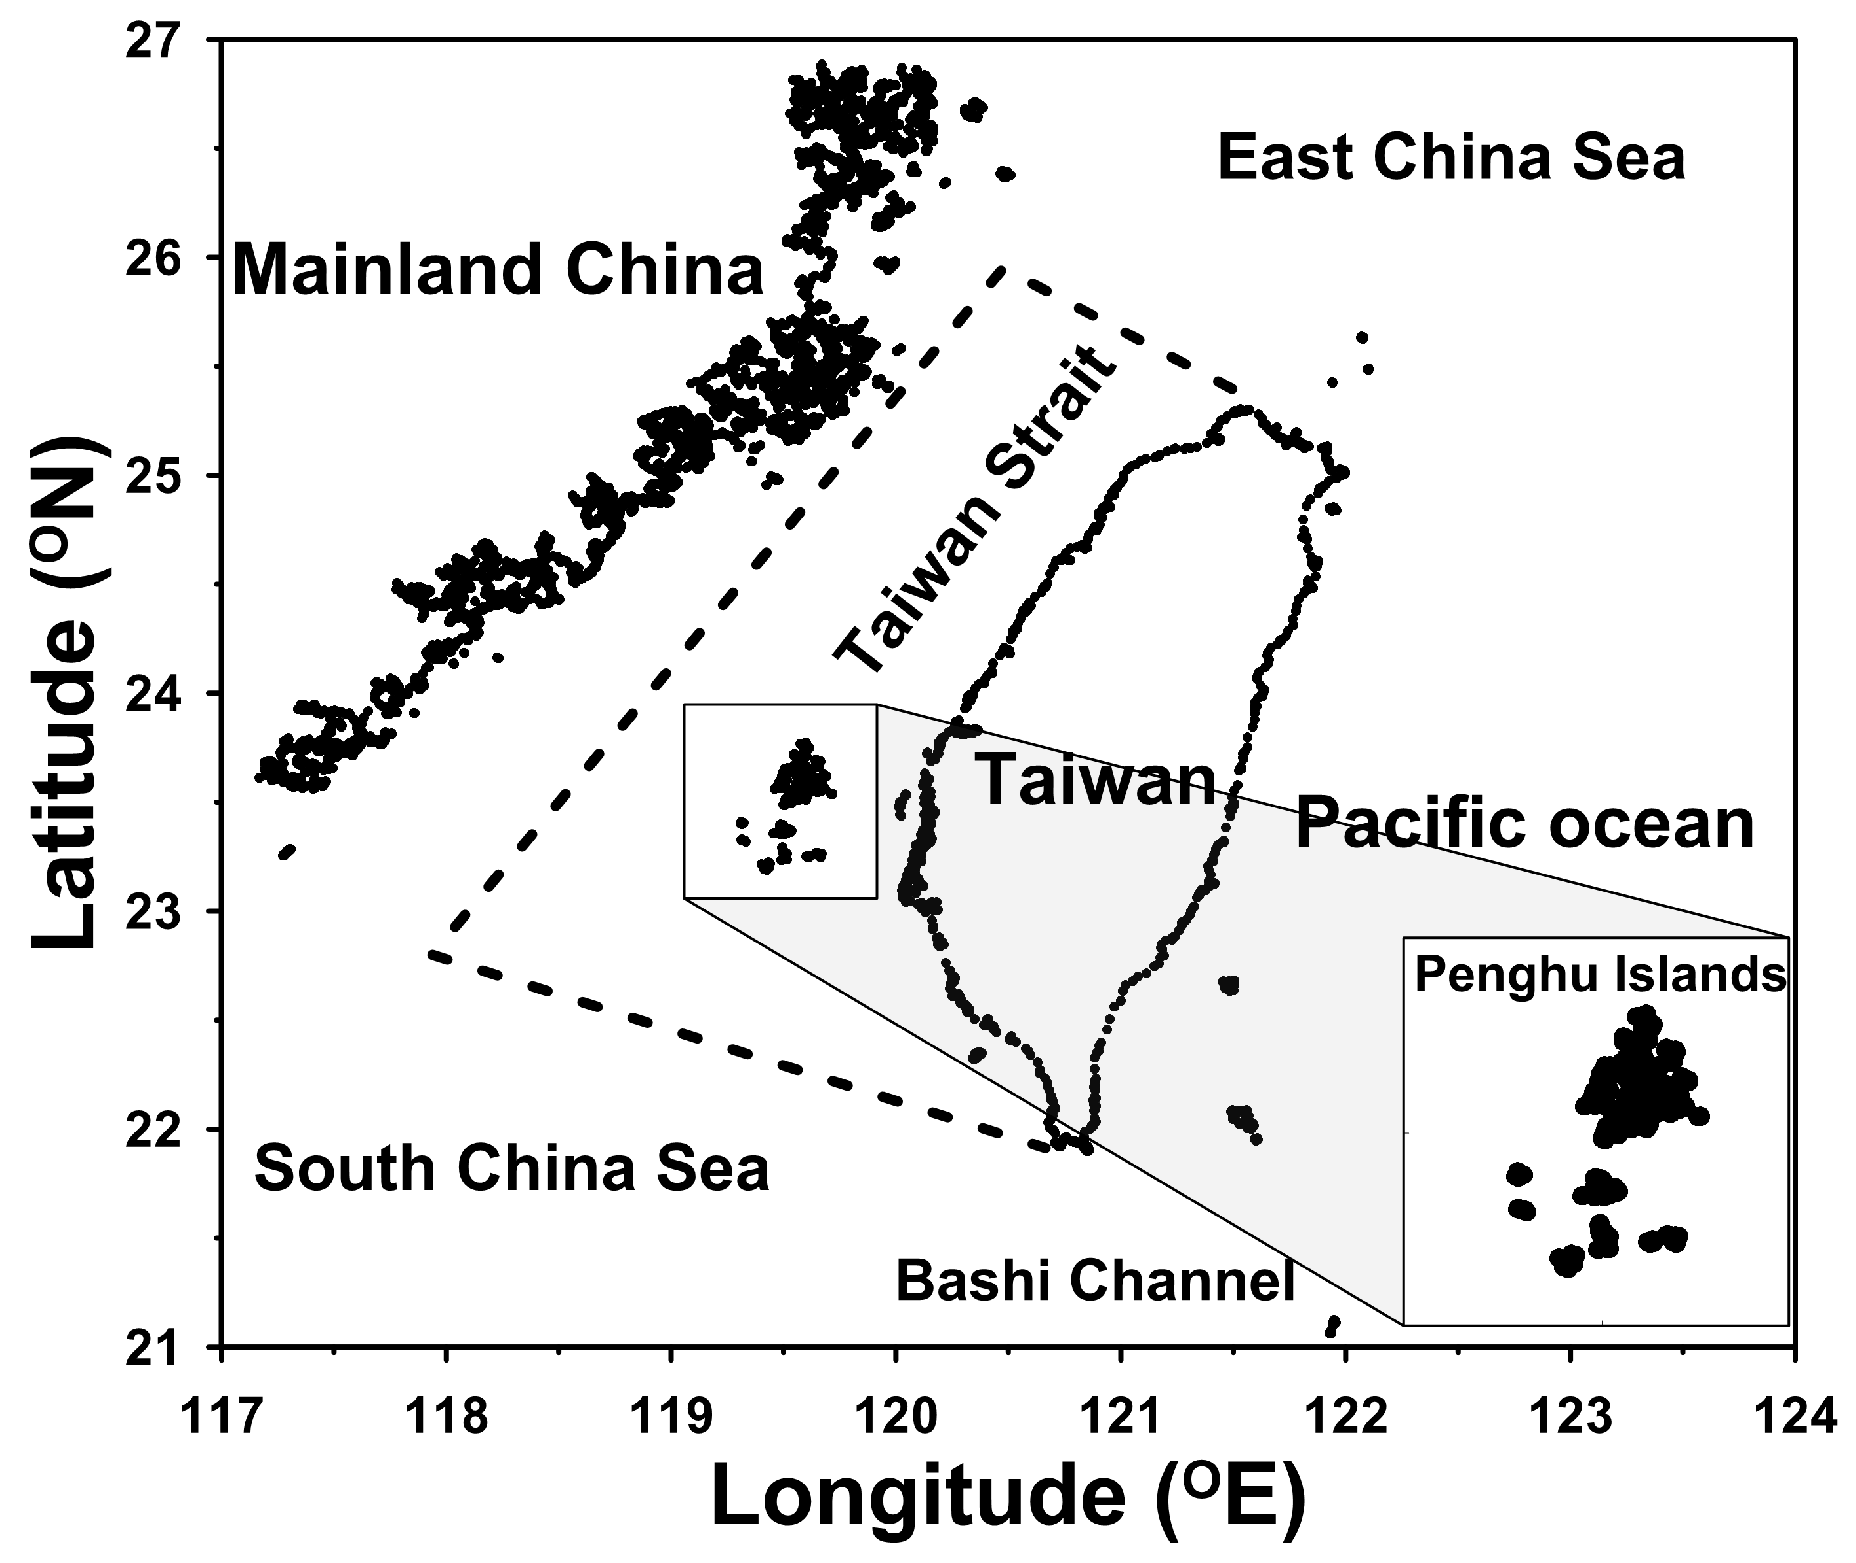
2]. Taiwan is surrounded by sea and has a coastline of over 1500 km. An abundance of wave and tidal stream energy may be available. In this paper, we limit our discussion to tidal stream energy.
Tidal energy has two components. The first is the potential energy due to sea level variations, and the second is the kinetic energy of tidal streams. Tidal barrages have been successfully employed for some time. There are several commercially operational tidal power plants: La Rance, France (240 MW capacity, built in 1966); Kislata Guba Bay, Russia (1.7 MW, 1968); Jiangxia, China (3.2 MV, 1980); Annapolis, Canada (20 MW, 1985); Stranglord Lough, Northern Ireland (1.2 MV, 2008); Uldolmok, South Korea (1.0 MV, 2009), and South Korea (254 MV, 2011). Tidal current energy technologies, however, is only now reaching a stage where commercial viability might be achieved and so far no arrays of tidal turbines have been deployed anywhere. For tidal turbines there have been a number of deployments at the European Marine Energy Centre, where electricity was generated and fed into the grid. Strangford Lough device, which uses twin 16 m diameter rotors [3], and the Uldolmok device [4] are therefore not the only operational large-scale tidal stream turbines. None of these tidal stream devices are commercially viable yet. Projects using tidal barrages to produce energy result in extensive environmental impacts, including potential effects on coastal ecosystems and fisheries, disruption of navigation, and high capital costs.
This situation has changed with recent developments in turbine technology, which allow the production of electricity using tidal streams. The kinetic energy of the flow is used, whereas tidal barrages use potential energy. Tidal current energy has several advantages, including the high predictability of tides, the high power density of water flow, the development of turbine technology, the lower investment relative to barrage structures, and the lower ecological impact compared with large hydraulic structures [5].
Several researchers have used numerical modeling to assess tidal stream energy resources. Blunden and Bahaj [6] applied a two-dimensional tidally driven hydrodynamic numerical model (TELEMAC-2D) to estimate the available tidal stream energy resources at Portland Bill, UK. Sutherland et al. [7] adopted a two-dimensional finite element model (TIDE2D) to evaluate the maximum tidal power potential of the Johnstone Strait, BC, Canada. Carballo et al. [5] applied a two-dimensional horizontal finite element model to evaluate the tidal stream energy resources in the Ria de Muros, which is in the northwestern coast of Spain. Xia et al. [8] used a refined depth-integrated two-dimensional hydrodynamic model to assess the potential tidal stream energy resources with and without the Severn Barrage in the Severn Estuary, UK. Chen et al. [9] refined a three-dimensional hydrodynamic model to evaluate the tidal stream energy at Kinmen Island in Taiwan. Yang et al. [10] presented a three-dimensional model to study in-stream tidal energy extraction and assess its effects on the hydrodynamics and transport processes in a tidal channel and bay system connected to a coastal ocean. They demonstrated that tidal energy extraction had a greater effect on the flushing time than on the volume flux reduction, which could negatively affect the biogeochemical processes in estuarine and coastal waters.
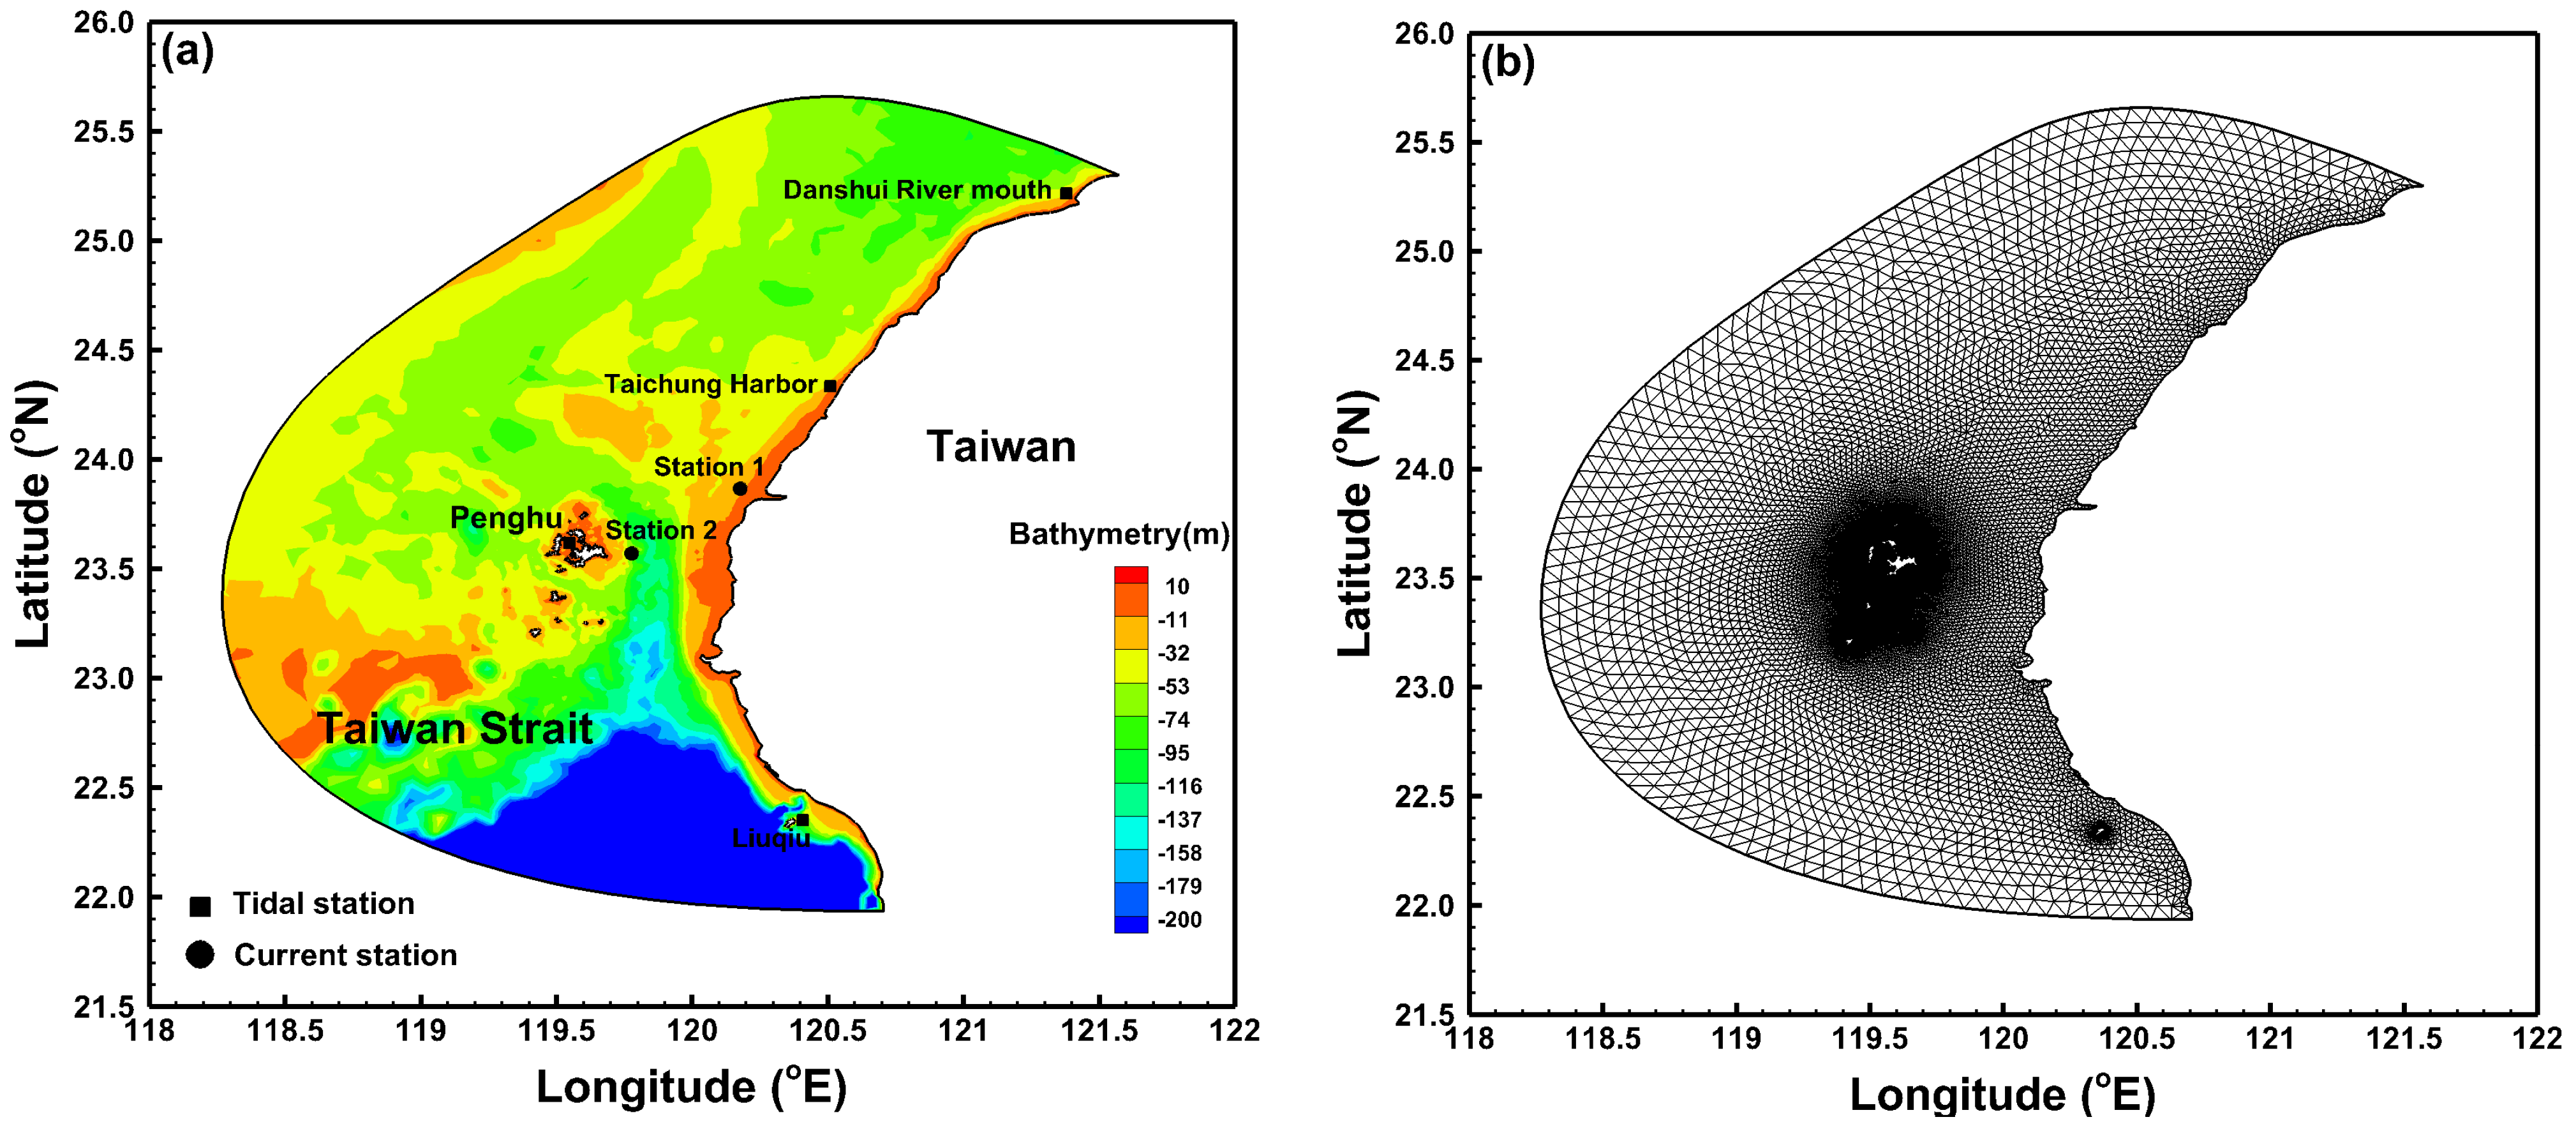
The objective of the present study is to evaluate the tidal stream energy resources around the Penghu Islands and the impacts of energy extraction on hydrodynamics in the Taiwan Strait using a refined three-dimensional hydrodynamic model. The model was validated with the observed water level and tidal current to ascertain the model’s accuracy. The model was then applied to calculate the distributions of current and power density over a spring-neap cycle and to evaluate the tidal stream energy resources around the Penghu Islands.

2. Description of the Numerical Model

2.1. Hydrodynamic Model

A three-dimensional semi-implicit Eulerian-Lagrangian finite-element model (SELFE, Zhang and Baptista [11]) was refined to simulate the hydrodynamics and tidal current energy around the Penghu Islands. SELFE solves the Reynolds stress-averaged Navier-Stokes equations, which consist of conservation laws for mass and momentum, along with the hydrostatic and Boussinesq approximations, to yield the free-surface elevation and three-dimensional water velocity.
SELFE uses the generic length-scale (GLS) turbulence closure approach of Umlauf and Burchard [12], which has the advantage of incorporating most of the 2.5-equation closure model. SELFE treats advection in the momentum equation using an Euler-Lagrange methodology. A detailed description of the turbulence closure model, the vertical boundary conditions for the momentum equation, and the numerical solution methods can be found in Zhang and Baptista [11].

2.2. Estimation of Momentum Loss

The near-field and possibly the far-field flow patterns may be affected by deploying a turbine array in a free-stream flow [13]. It can be expected that the current speed will slow when water flows through the turbine blades. To simplify the total momentum sink rate, the tidal energy dissipation caused by the drag of the turbines’ support poles and foundation was not considered. Therefore, the momentum sink approach (with a retarding force in the momentum equation) was adopted in this study for estimating the magnitudes of speed that would be reduced due to tidal energy extraction by the turbines [10,13,14,15]. The equation can be expressed as [10]:
F s x = 1 2 V N [ ( C t + C b ) A ] u 2 + v 2 u
F s y = 1 2 V N [ ( C t + C b ) A ] u 2 + v 2 v
where Fsx and Fsy are the x and y directions of the momentum sink; V is the control volume; N is the total number of turbine; Ct is the turbine efficiency coefficient; Cb is the drag coefficient of the turbine blades; A is the swept area; and u and v are the x and y directions of the tidal current. In the present study, the Ct and Cb values were set to be 0.33 and 0.5, respectively, based on previous studies [10,16,17].
The government equations of momentum in SELFE with added momentum sink terms due to energy extraction can be given as following form:
u t + u u x + v u x + w u x = f v 1 ρ 0 p x + z ( v u z ) F s x
v t + u u x + v u x + w u x = f u 1 ρ 0 p x + z ( v v z ) F s y
where (x, y) are horizontal Cartesian coordinates; z is vertical coordinate; (u, v, w) are velocity components in (x, y, z) directions; f is Coriolis parameter; ρ0 is water density; p is pressure; and Fsx, Fsy are the added momentum sink terms in (x, y) directions.

2.3. Formulation of Tidal Stream Energy

The tidal stream energy and its potential losses from power extraction can be calculated by the kinetic power density from the tidal current as:
P = 1 2 C t ρ U 3
where P is the tidal stream power per unit area (tidal stream power density); Ct is the turbine efficient coefficient; ρ is the density of sea water; and U is the speed of the tidal current.
The potential mean tidal stream power density Pm over an arbitrary period T can be expressed as:
P m = 1 T 0 T 1 2 C t ρ U ( t ) 3 d t

2.4. Model Implementation

The Penghu Islands (Figure 1) are situated in the middle of the Taiwan Strait between Taiwan and China. Bottom topography is an important factor affecting the tidal level and flow properties in modeling. Hence, an accurate representation of the bottom topography in the model grid is critical to successful coastal and ocean modeling [18]. The bathymetry data used in this study were obtained from the ocean data bank of the National Science Council, Taiwan (Figure 2a). The wetting and drying processes were simulated in the model domain. To save time, coarse-grid resolution was adopted in the Taiwan Strait, while fine-grid resolution was used around the Penghu Islands. The resolution of mesh varies from 8 km at the ocean boundaries to 250 m near the Penghu Islands. The model domain contained over 30,000 elements and 15,000 nodes (Figure 2b). Ten sigma layers were adopted in the vertical direction. To ensure numerical stability, the model was run with a time step of 30 s.
Figure 1. Map of the study area shown in the dashed line box.
Energies 06 02191 g001
Figure 2. (a) Bathymetry of the study area; and (b) the unstructured grid for computational domain. Note that negative values in the bathymetry scale are below mean sea level and positive values are above mean sea level.
Energies 06 02191 g002

3. Model Validation

To ascertain the model capability, a set of observational data including water levels and tidal currents were adopted to validate the model, the validated model was then applied to assess tidal stream energy resources.

3.1. Validation of Water Levels

To drive the model in the present study, nine tidal components (M2, S2, N2, K2, K1, O1, P1, Q1, and M4) were adopted as forcing functions to calculate water level at open boundaries [19]. The initial conditions of hydrodynamics were null velocity and level water throughout the grid. The initial salinities of 33.6 psu (practical salinity unit) were used to drive the model simulation. The salinity and water temperature were specified according to monthly average data collected from the ocean data bank of the National Science Council. However water temperature simulation was not executed in this study. The meteorological conditions including wind, precipitation, air temperature, and air pressure and river discharges were excluded in the model simulation. A spin-up period is essential for confirming that the model results are not affected by initial conditions. A duration of 15 days was chosen for the spin-up period. The model ran from 16 April to 20 May 2009.
Water levels measured at the Danshui River mouth, Taichung Harbor, Penghu, and Liuqiu Port (shown in Figure 2a) in May 2009 were adopted for model validation. Figure 3 shows the comparison of computed water level and measured data over time at four tidal stations. Generally, the modeling results mimicked tidal level variations. At Liuqiu Port, the minimum mean absolute error (MAE) and the minimum root mean square error (RMSE) were 0.04 m and 0.05 m respectively. The highest value of coefficient of determination (R2) was 0.94 at the Taichung Harbor and Penghu. Table 1 illustrates the model’s accuracy in predicting the water level at the different tidal stations. A roughness height of 5 × 10⁻⁴ m was chosen throughout the validation procedure.
Figure 3. Comparisons between simulated and observed water levels at different tidal stations (shown in Figure 2a).
Energies 06 02191 g003
Table 1. Statistical error of the difference between the computed and observed water level.
Tidal stationMAE (m)RMSE (m)R2
Danshuei River mouth0.090.110.92
Taichung Harbor0.100.120.94
Penghu0.080.100.94
Liuqui Port0.040.050.91

3.2. Validation of Tidal Currents

The tidal currents used for model validation were measured with ADCP (Acoustic Doppler Current Profilers) at Station 1 and Station 2 (shown in Figure 2a), close to the coast of central Taiwan and east of Penghu from 11 May to 20 May 2009. Figure 4 shows the comparison between the modeled and measured depth-averaged tidal currents. It can be observed that current peaks and phases were faithfully reproduced by the numerical model. At Station 1, the minimum mean absolute error (MAE), the minimum root mean square error (RMSE) and the highest value of coefficient of determination (R2) are 0.05 m, 0.06 m, and 0.91, respectively (shown in Table 2).
Figure 4. Comparisons between simulated and observed depth-averaged tidal current speeds at station 1 and station 2.
Energies 06 02191 g004
Table 2. Statistical error of the difference between the computed and observed tidal current.
Current stationMAE (m/s)RMSE (m/s)R2
Station 10.050.060.91
Station 20.100.120.90
Note: MAE: mean absolute error; RMSE: root mean square error; R2: coefficient of determination.

4. Assessment of the Tidal Stream Energy Resources and Impact on Hydrodynamics

The validated model was applied to evaluate potential tidal stream energy around the Penghu Islands and in the Taiwan Strait as well as the impact of energy extraction on hydrodynamics. For this purpose, the model was run without including wind among the forcing functions. In this work, running the salinity transport model coupled with the hydrodynamics model allows us to compute not only the velocity magnitude at each element in space and time, but also the water density. However, the water temperature module is not included in model simulation.

4.1. Distributions of Power Density and Mean Power Density

Energy extraction was considered to be within a single momentum control element and was included in the modeling. The momentum sink approach used in the modeling can be referred to Yang et al. [10]. The diameter of the turbine blade was specified as 11 m, resulting in a swept area of 95.03 m2. We assumed that the tidal turbine only occupied two vertical layers (
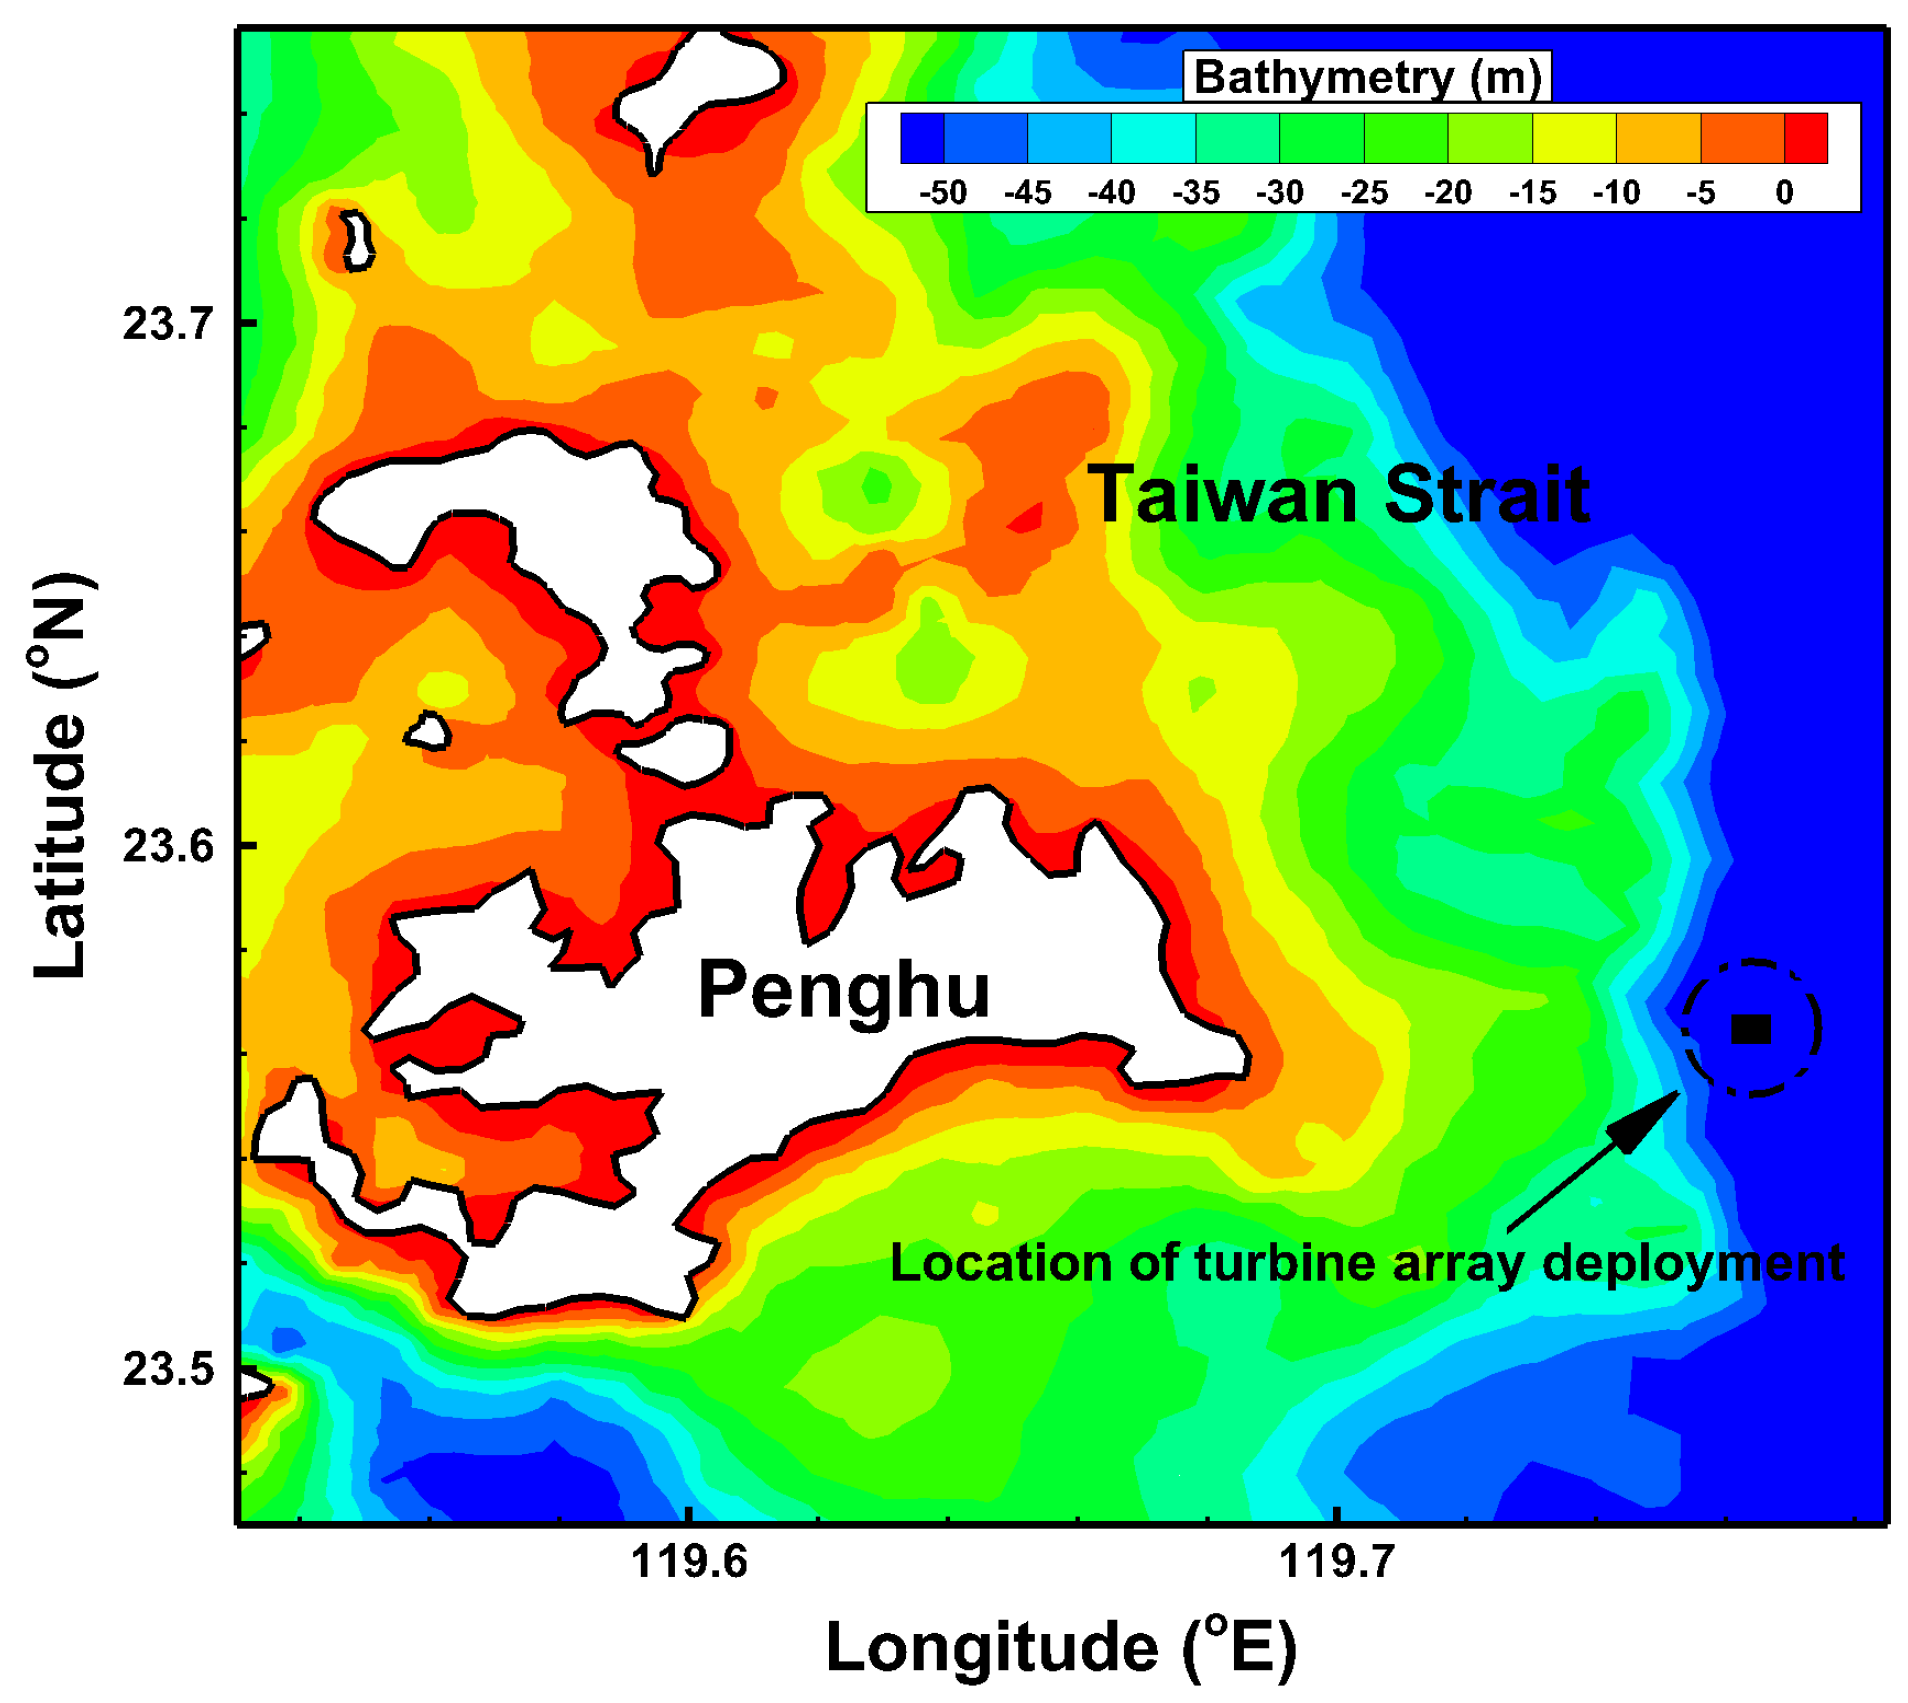
i.e., the 5th and 6th layer, 24–36 m below the water’s surface). A model simulation without turbines was first run to establish a baseline. To determine the conditions with turbines, 55 turbines were assumed to have been installed in one row (approximately 720 m long) in the Penghu Channel (shown in Figure 5). The 720 m long of turbine array refers to the size length which is the distance in the west-west direction. Because the location of turbine array deployment is 8 km far from coastline of the Penghu Islands, the turbine array is located at the coarse meshes used for model simulation.
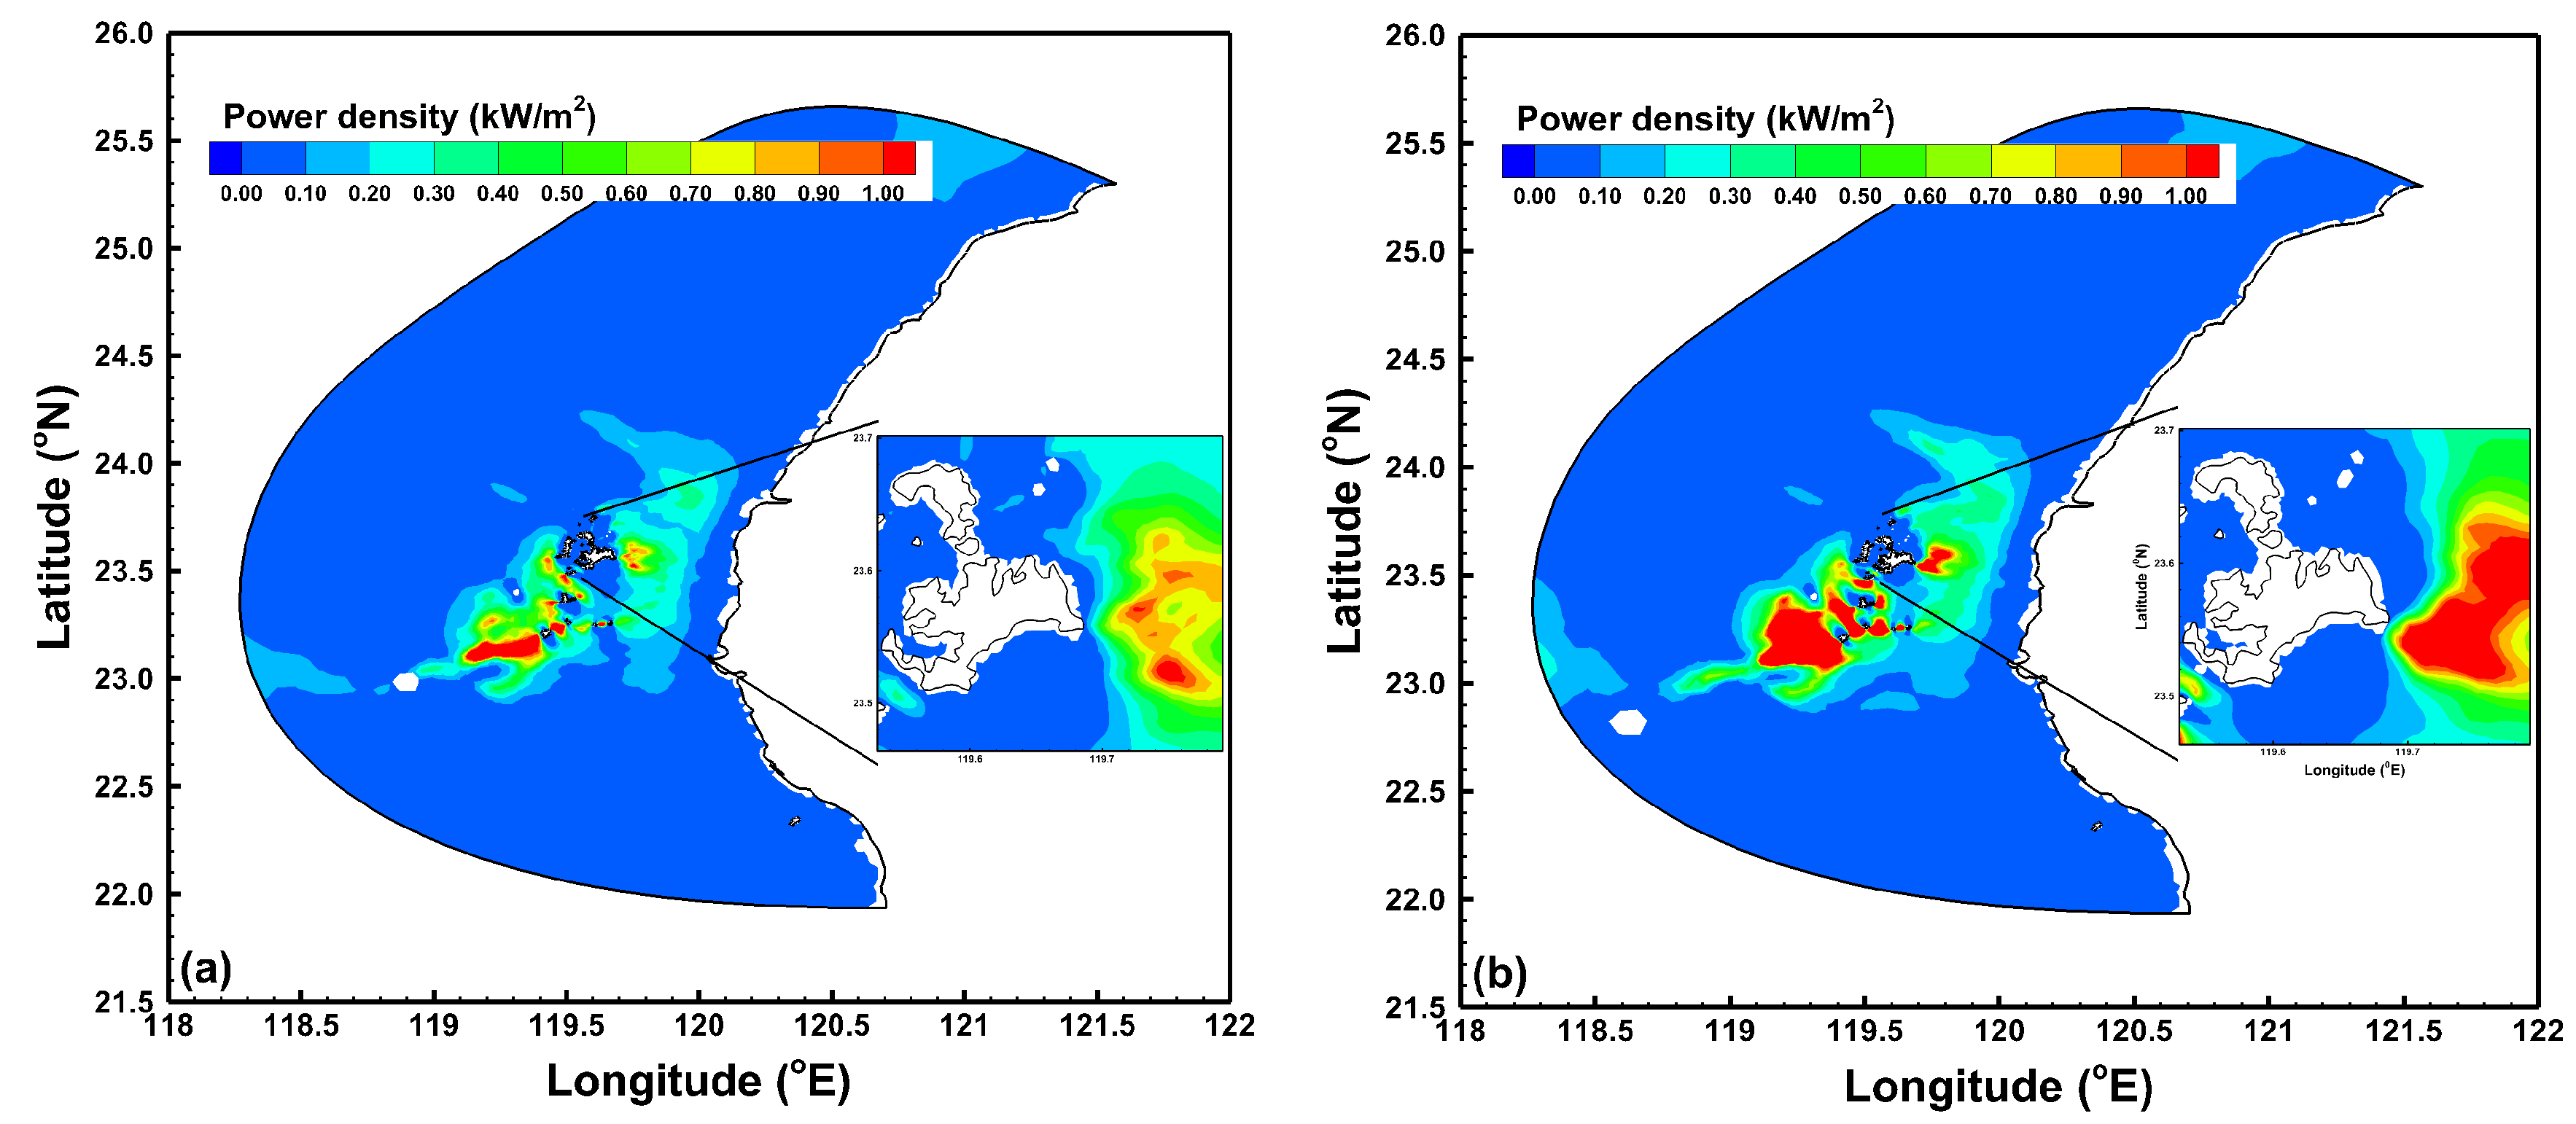
Figure 6 shows the power density in the Taiwan Strait at the mid-flood (Figure 6a) and mid-ebb (Figure 6b) of a mean spring tide. The highest power density at the mid-ebb of a mean spring tide was higher than that at the mid-flood tide. It can be observed that the highest power density exceeded 0.9 W/m2 southwest of the Penghu Islands and the Penghu Channel. 
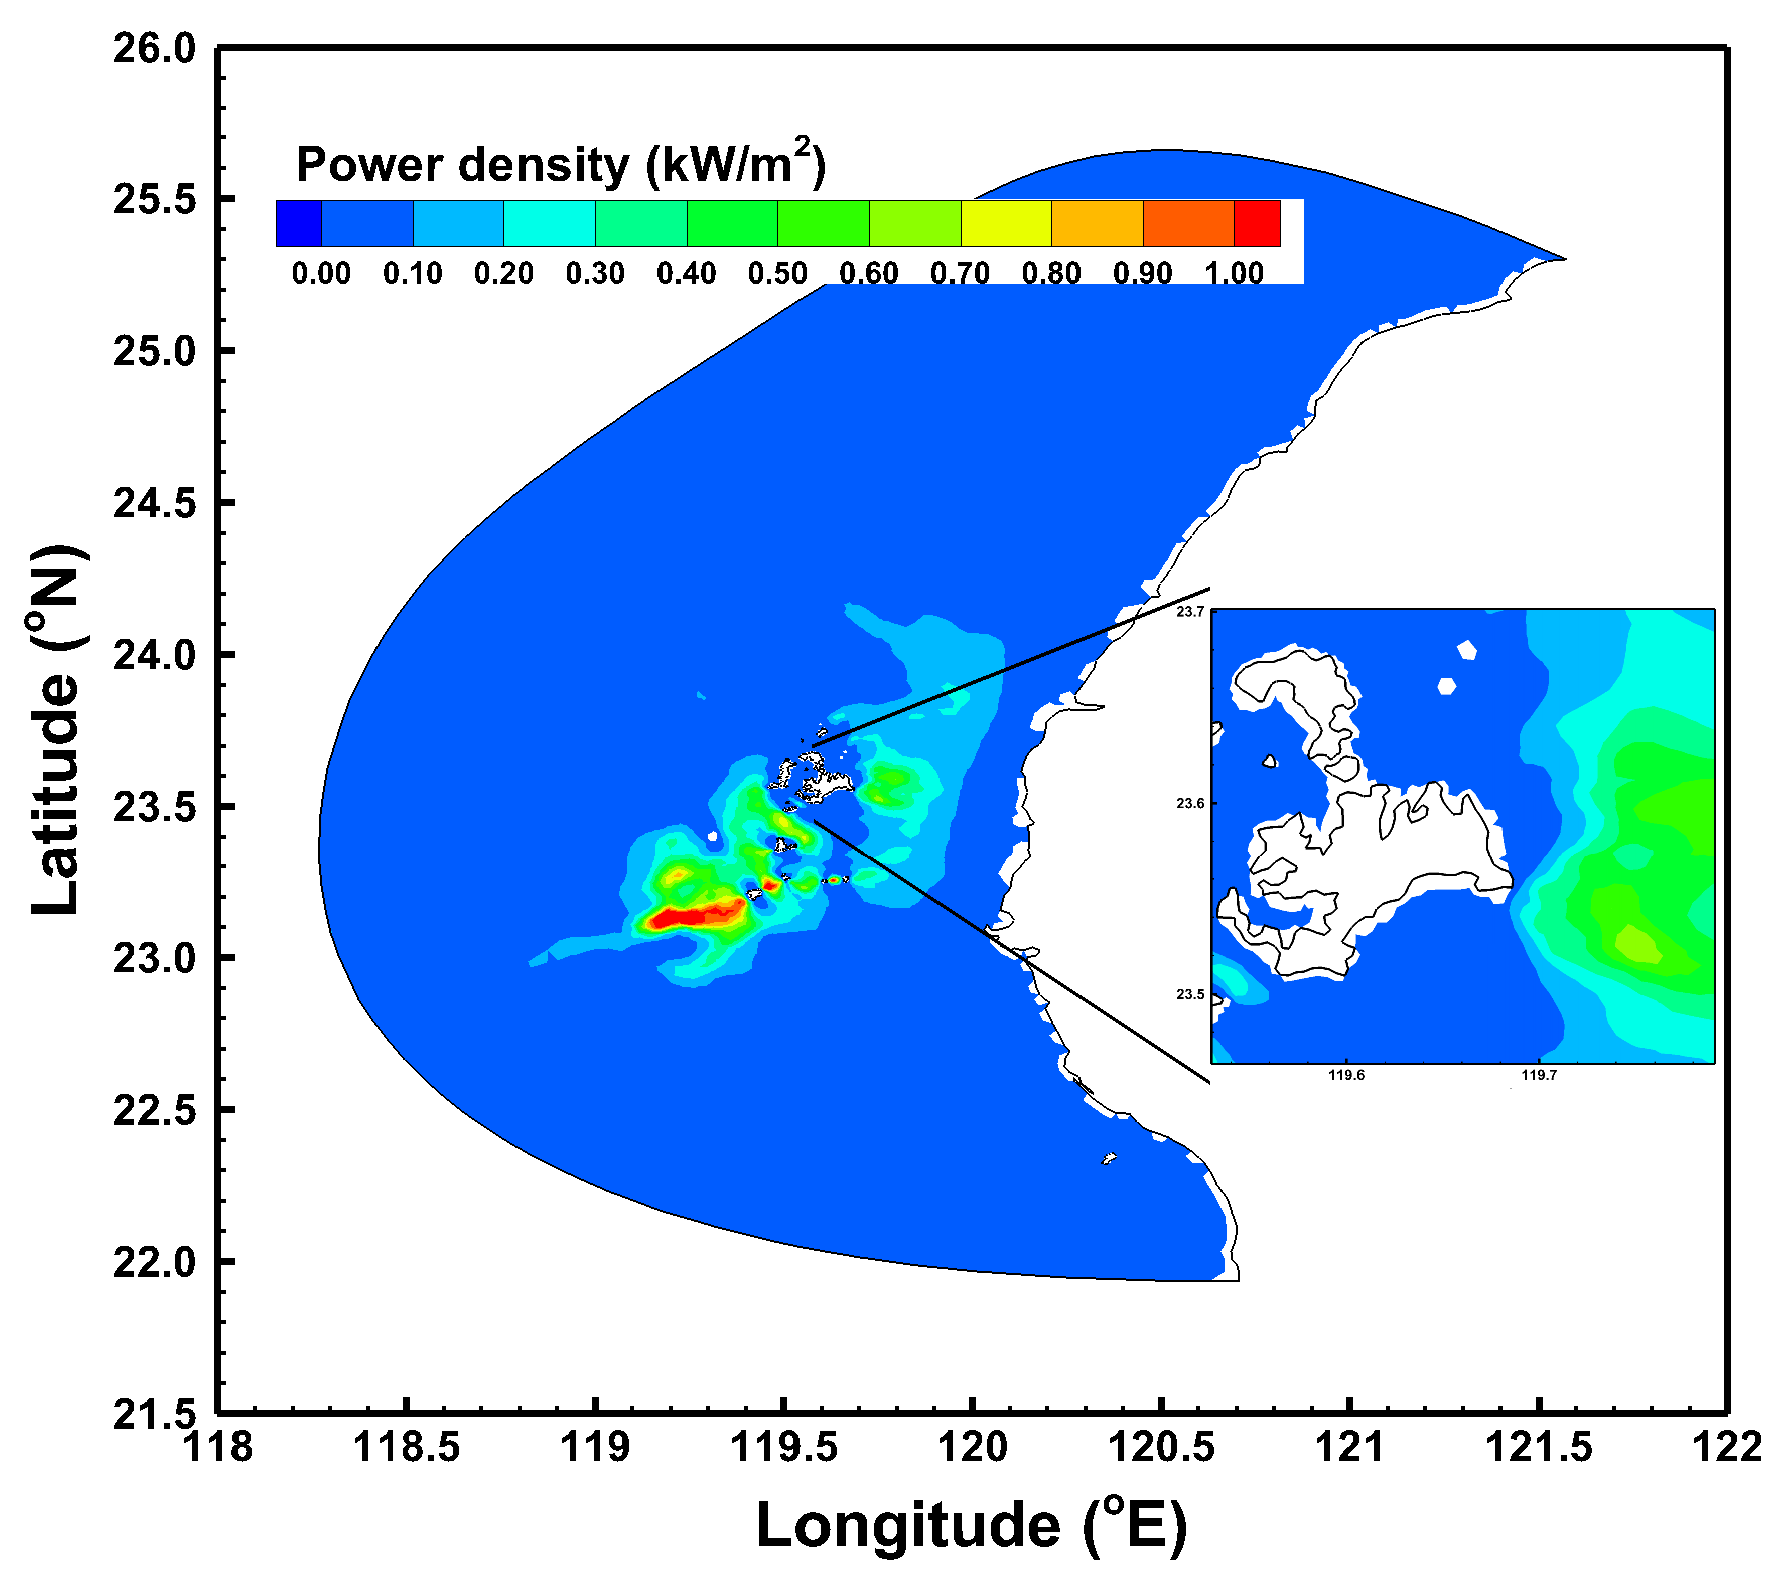
Figure 7 presents the contours for the potential mean power density over a mean spring tide. It reveals that that there is higher power density southwest of the Penghu Islands and the Penghu Channel. However, the Penghu Channel is most appropriate for the deployment of a tidal turbine array than the location of Penghu Islands (Figure 5) because of its deeper and flatter bathymetry and high power density for tidal stream power generation.
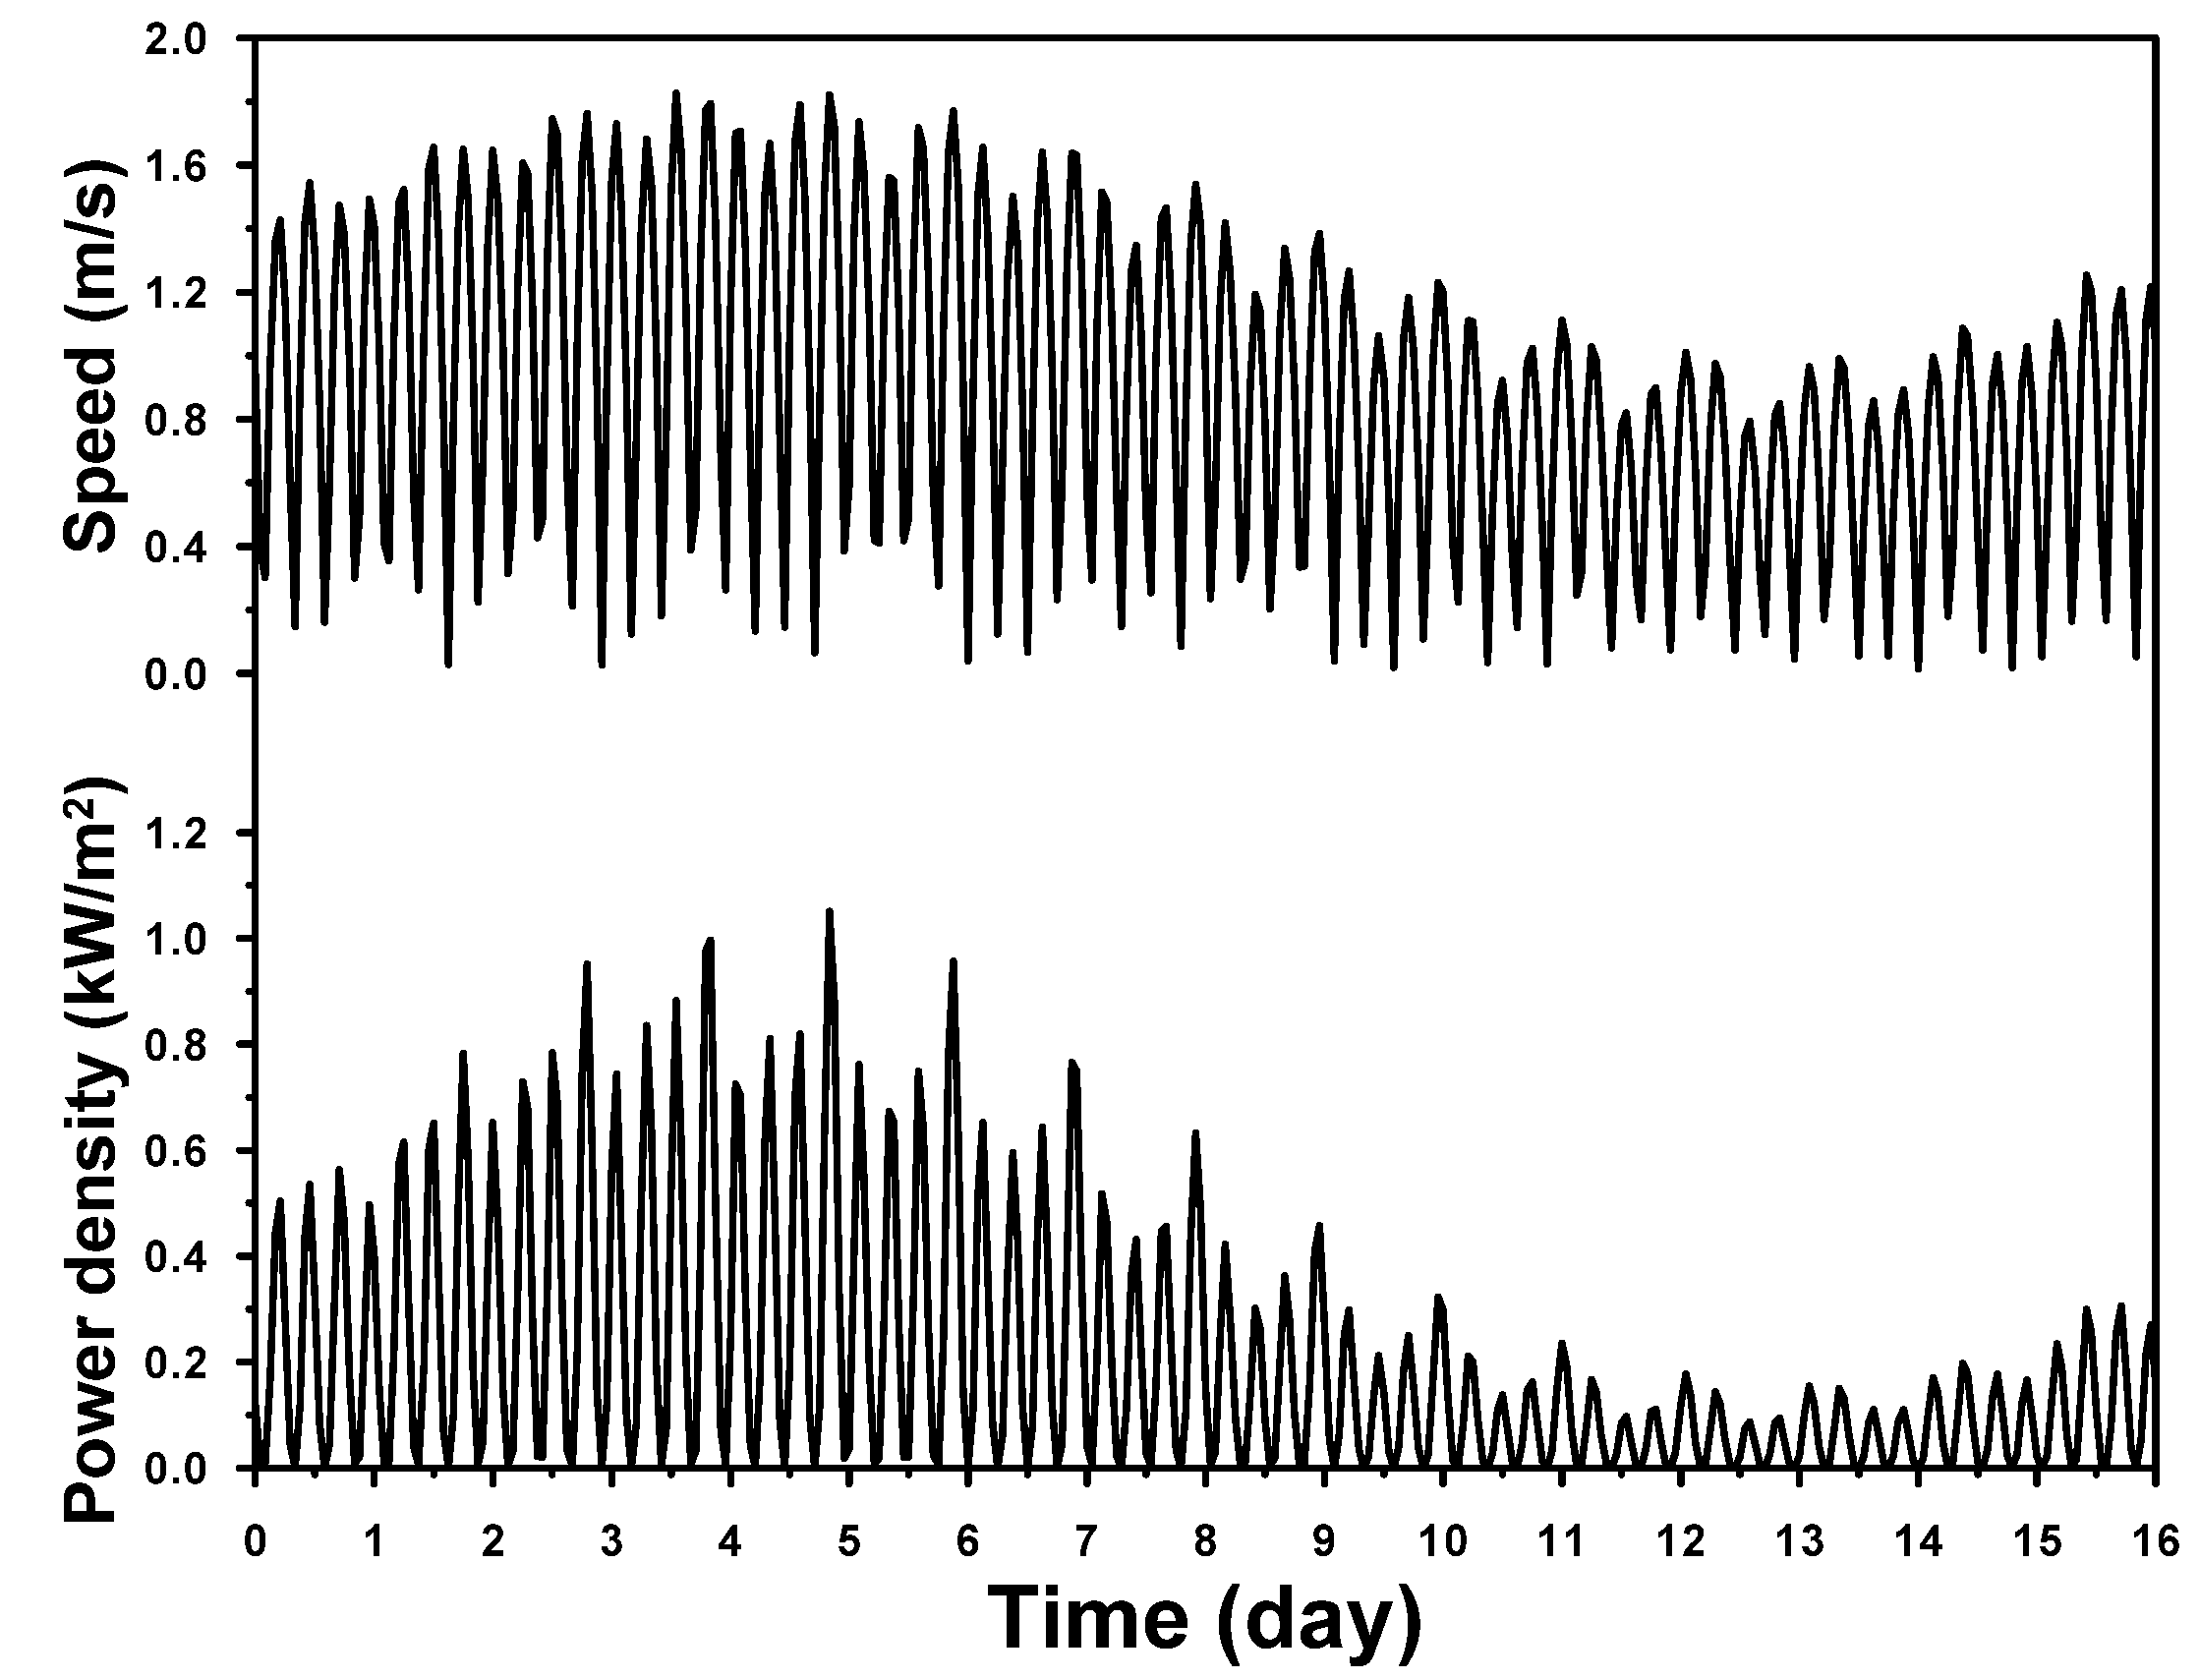
Figure 8 shows the time distribution of depth-averaged tidal current and the depth-averaged power density due to the presence of one turbine over a spring-neap cycle. Maximum current and maximum power density approached 1.8 m/s and 1.0 kW/m2, respectively. For the 16-day period considered, the energy density, or energy per square meter of turbine aperture is shown in Figure 8. A numerical integration for 16-day period yields 79.37 kWh/m2. The annual energy output would be 1810 kWh/m2 per turbine. If a turbine rotor has a diameter of 11 m which has the swept area of a turbine, 95.03 m2, the annual energy output would be 172 MWh per turbine. Assuming that 55 turbines are deployed in one row (approximately 720 m long), the total tidal energy output by all turbines would be 9.46 GWh per year.
The annual energy density per turbine in the Penghu Channel is less than that in the Ria de Muros (Spain) [5], but higher than that in the Severn Estuary (UK) [8].
Figure 5. Location of the turbine array.
Energies 06 02191 g005
Figure 6. Power density distribution around Taiwan Strait at the (a) mid-flood; and (b) mid-ebb of the mean spring tide.
Energies 06 02191 g006
Figure 7. Mean power density distribution around Taiwan Strait.
Energies 06 02191 g007
Figure 8. Simulated time distribution of tidal speed and power density with one turbine at the location of the turbine array over a spring-neap cycle.
Energies 06 02191 g008

4.2. Impact on Water Level

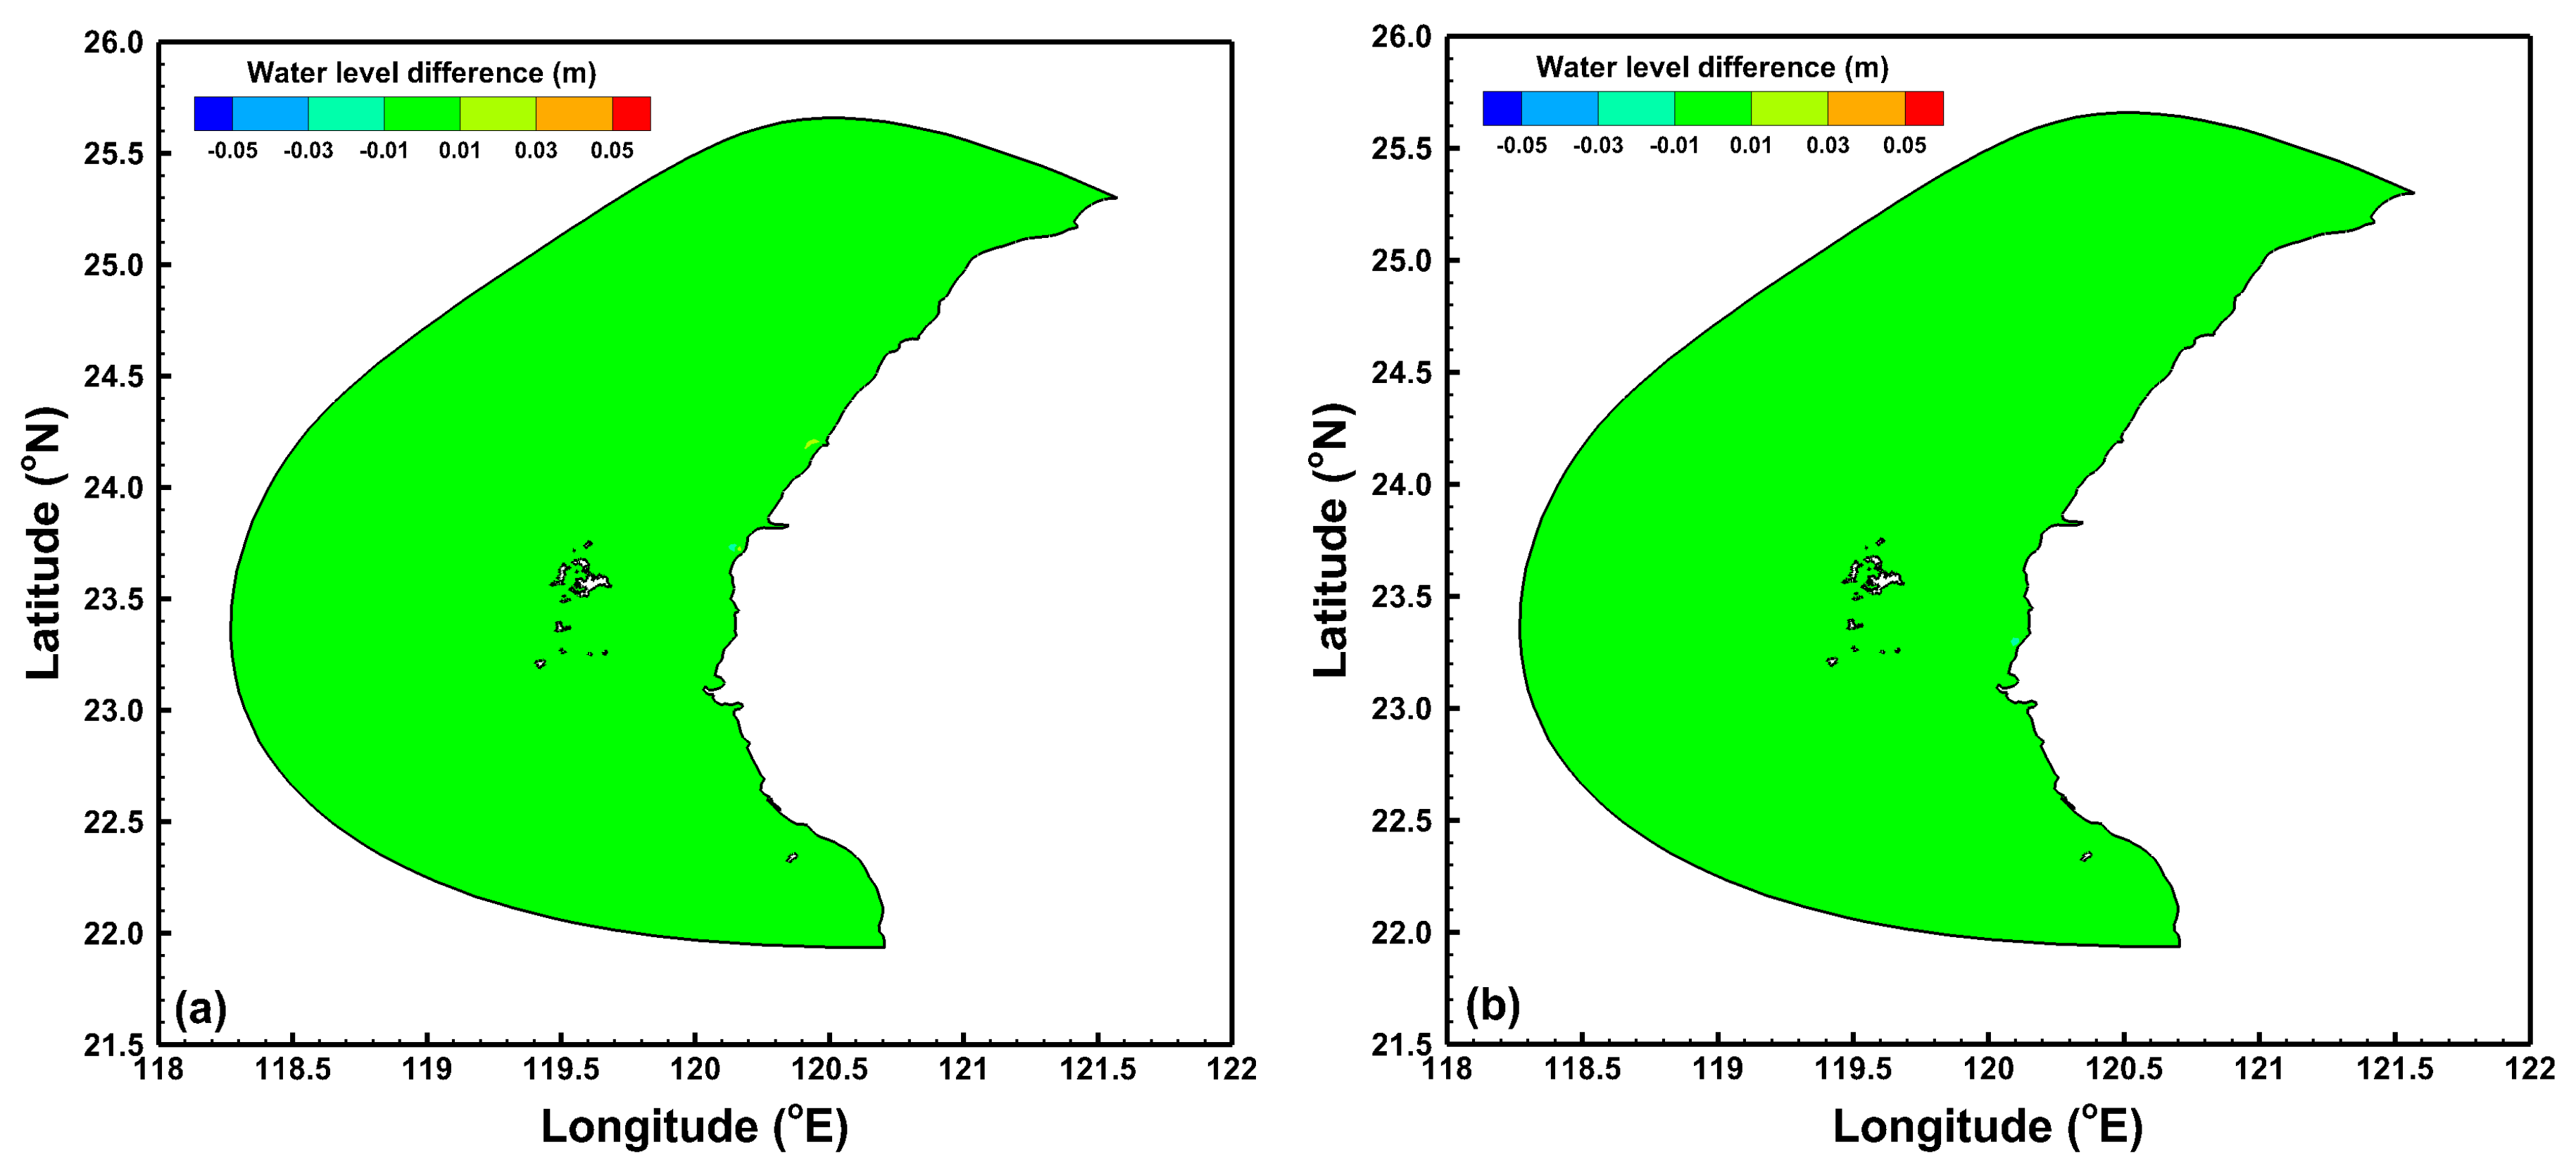
The modeling results with and without a turbine array in maximum and minimum water levels are shown in Figure 9. There was no significant change in water level at either the energy extraction location or in the whole modeling domain. The difference in water level was less than 0.01 m. Ahmadian and Falconer [20] used a hydro-environmental model (Depth Integrated Velocities and Solute Transport or DIVAST) to simulate the impact of an array of turbines in a coastal environment. They found that the impact of the array on water levels and the maximum water levels that were associated with flood risk were very small. Their modeling results and their assessment of the impact on water levels are similar to the findings from our study. However, other studies [10,21] have also found potentially very large impacts depending on the relative size of the turbine array compared to the tidal channel.
Figure 9. Difference in the (a) maximum water level; and (b) minimum water level with and without a turbine array.
Energies 06 02191 g009

4.3. Impact on Tidal Current

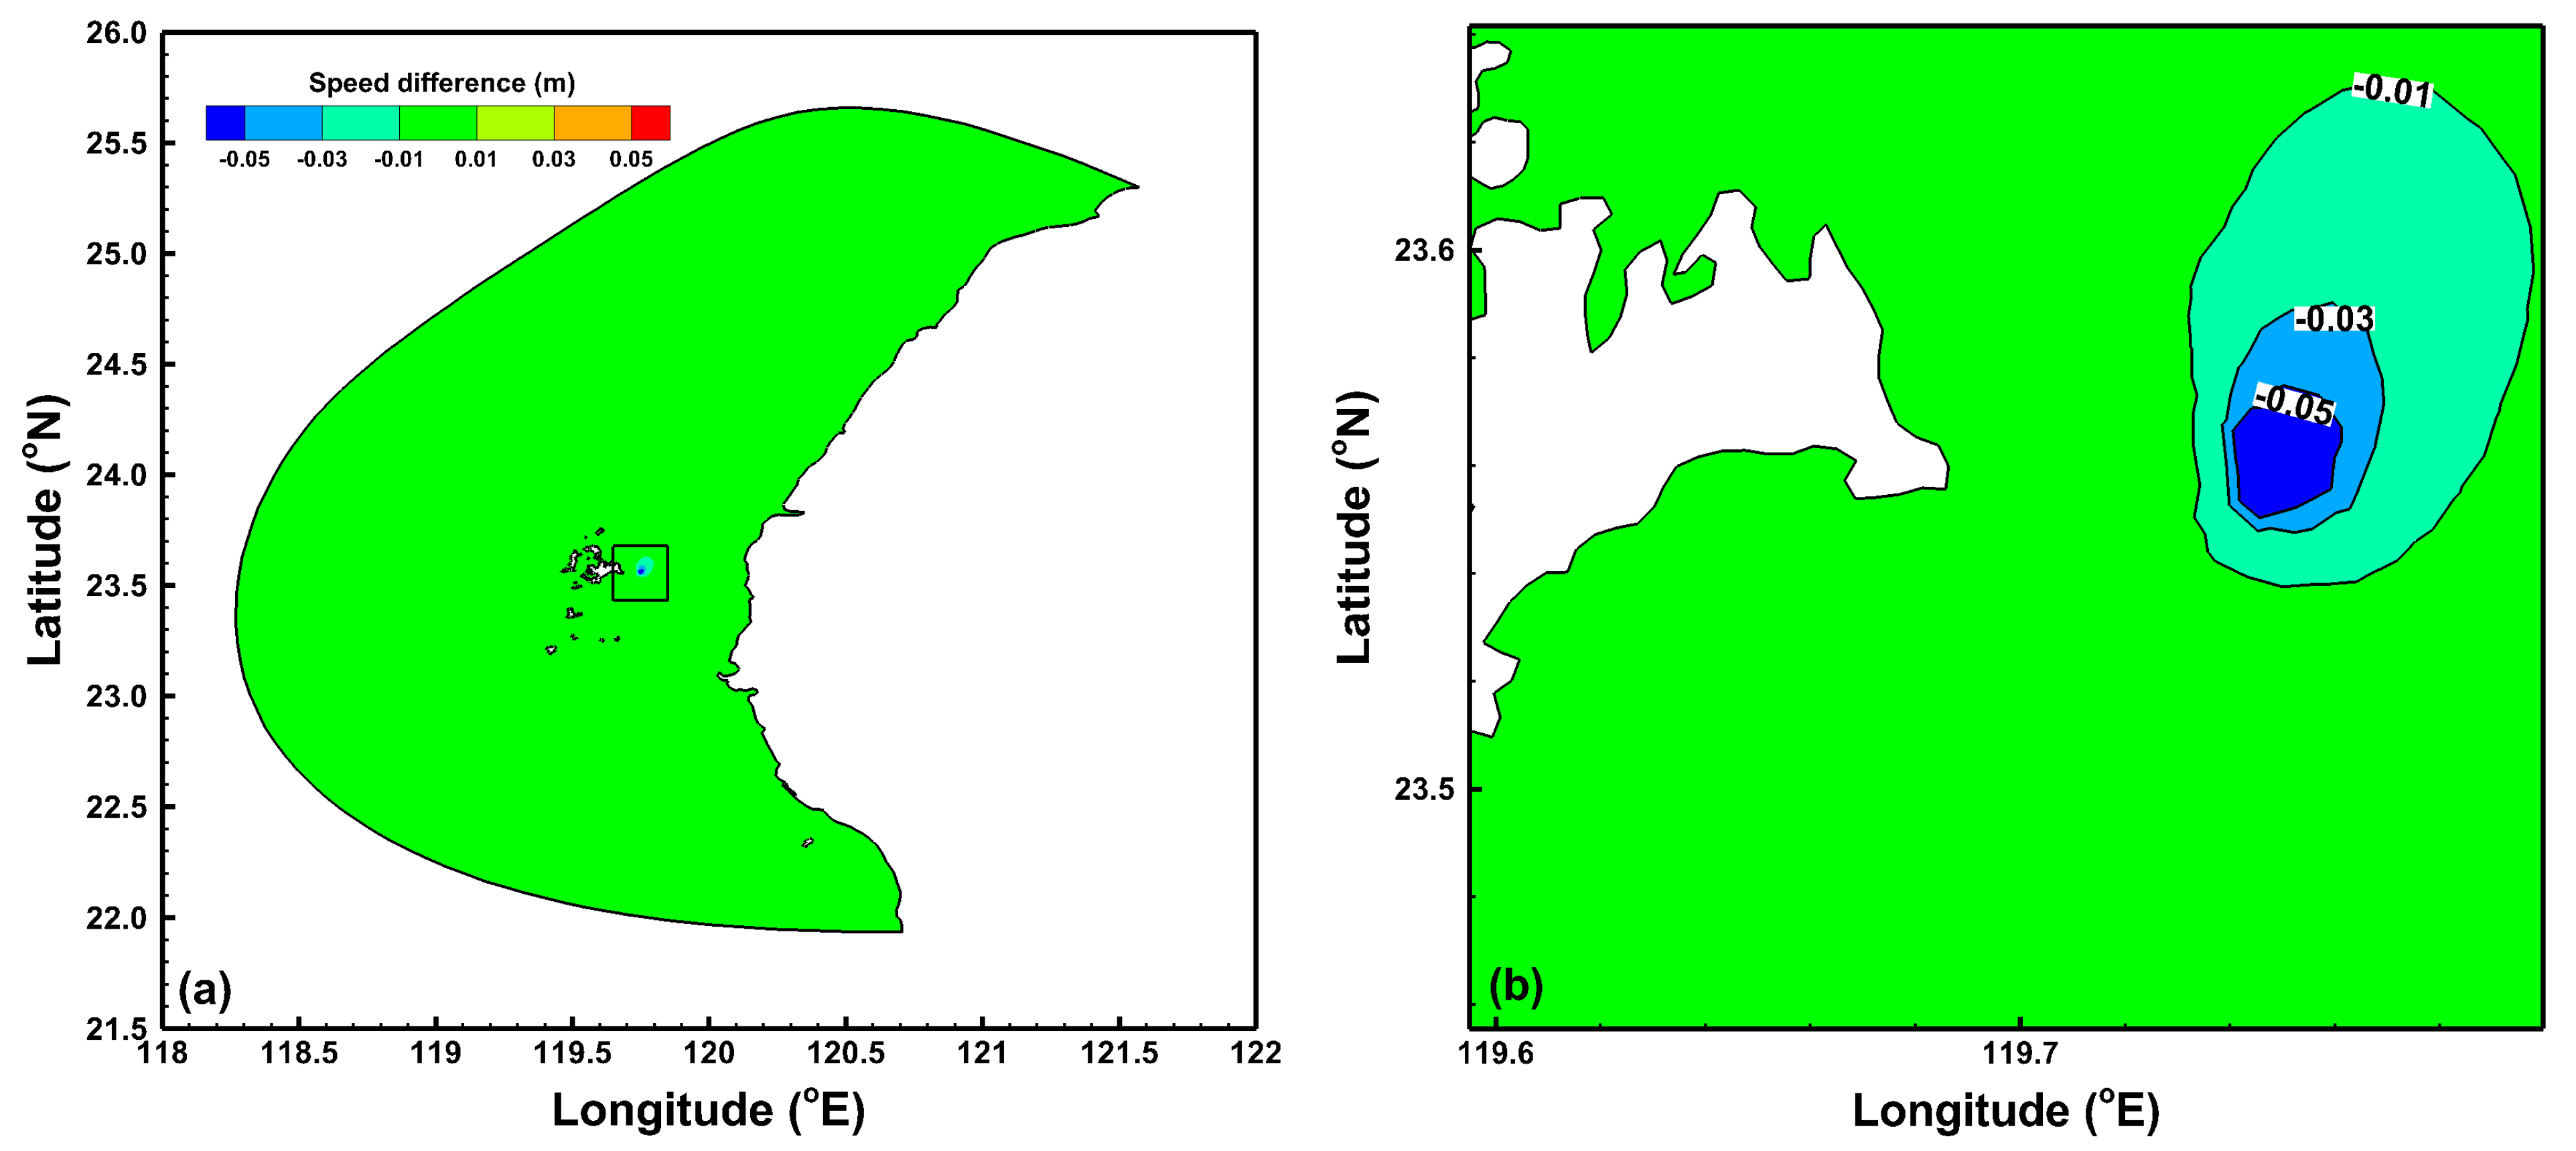
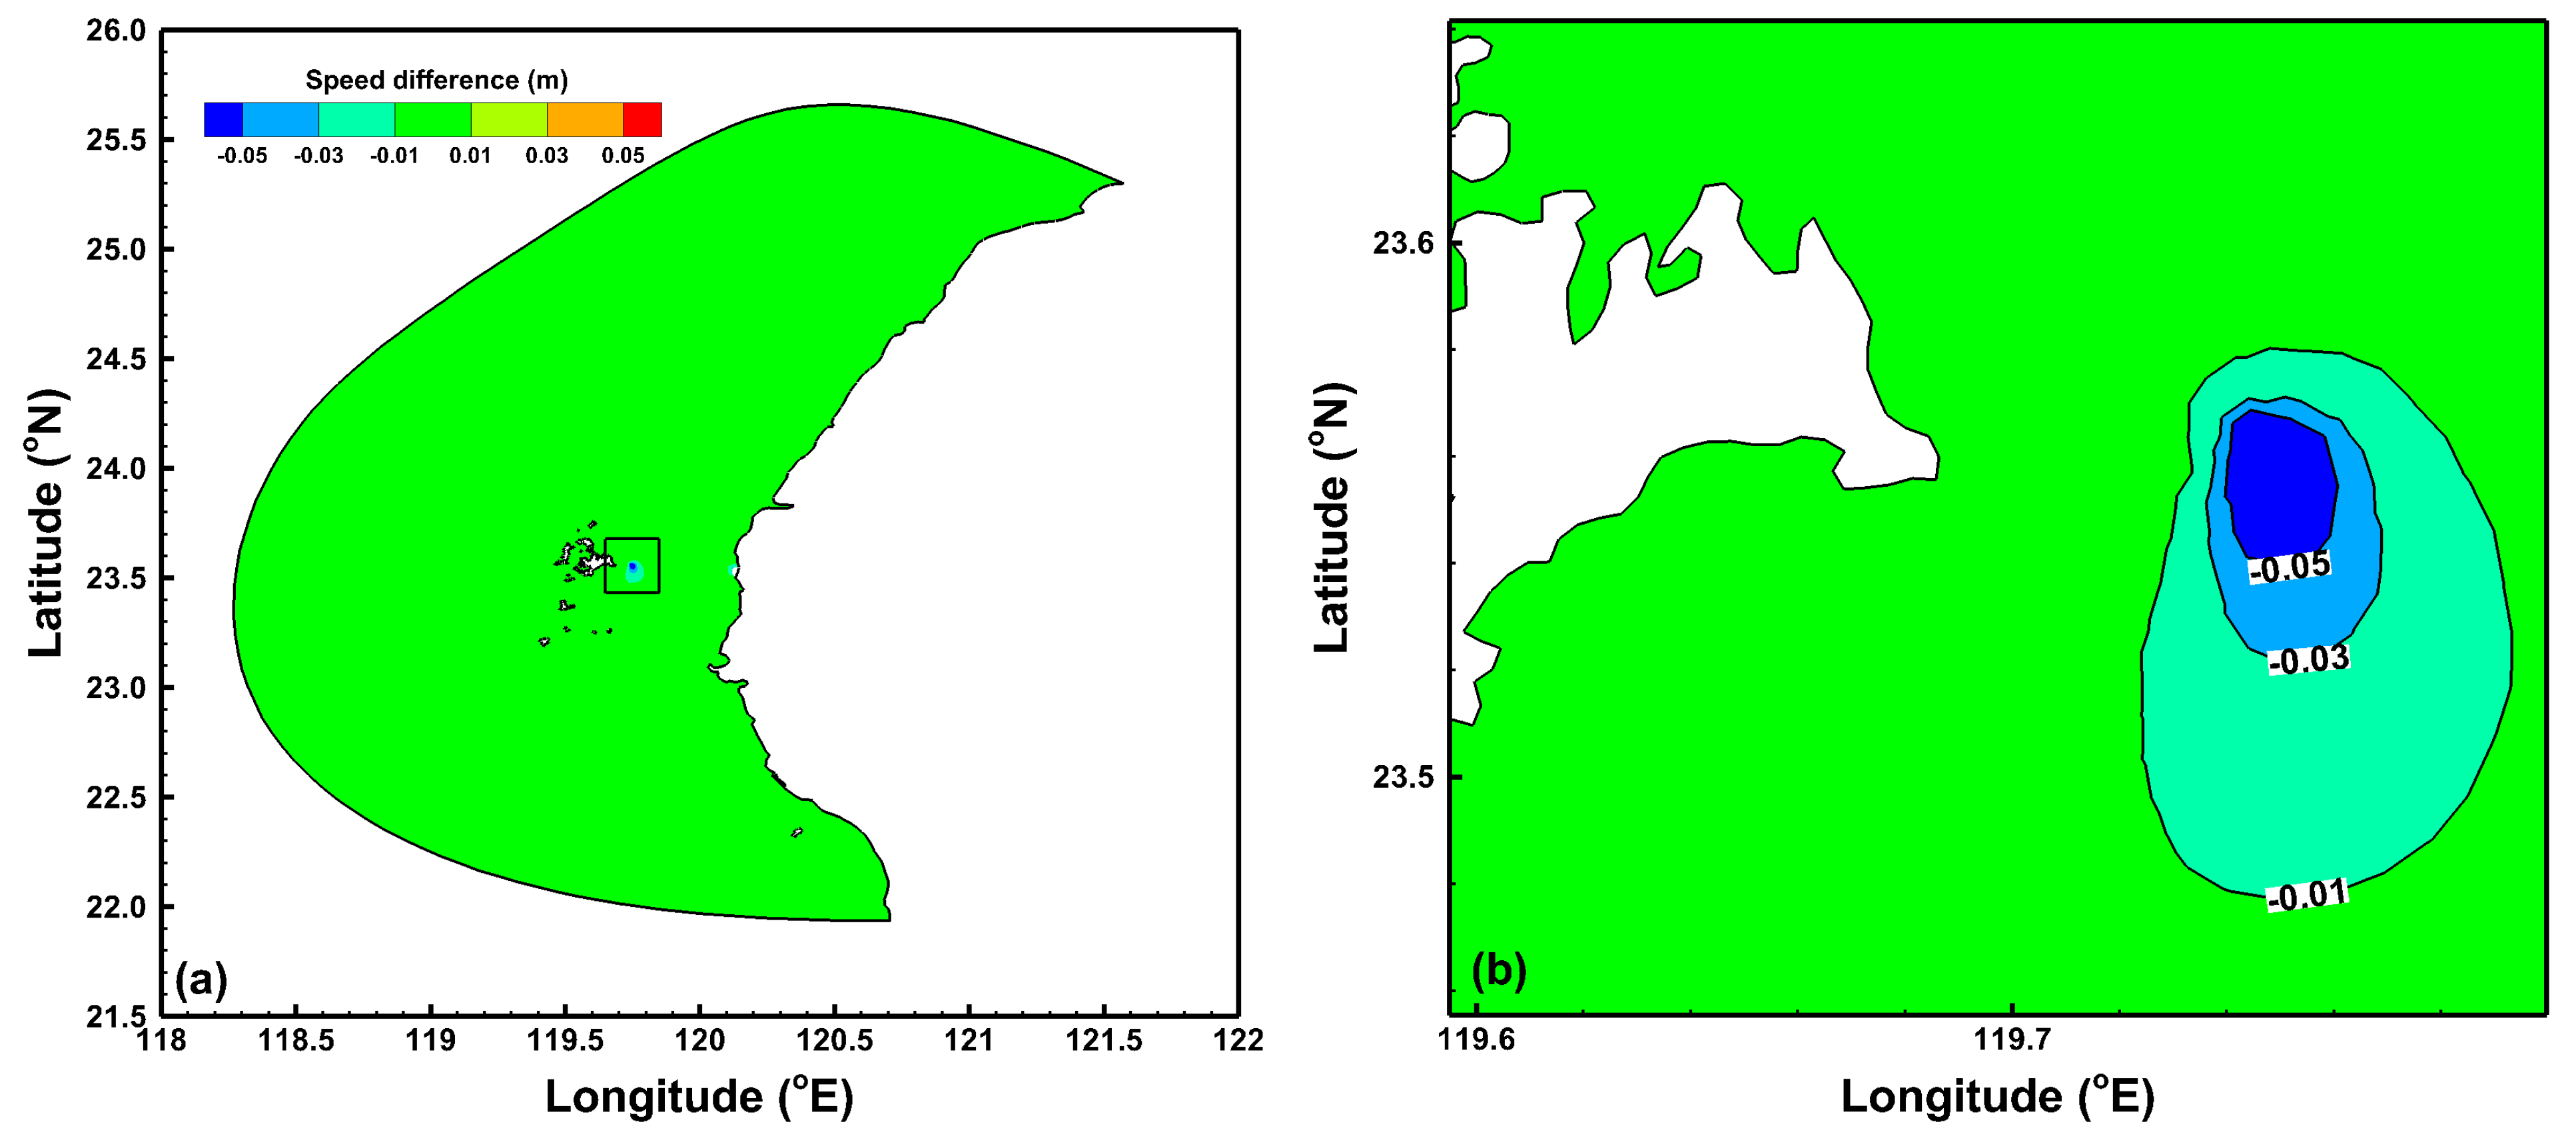
The differences between current magnitudes with and without a turbine array during mid-flood and mid-ebb are shown in Figure 10 and Figure 11 for the far-field and near-field, respectively. With a turbine array, the current magnitude decreased from 0.05 to 0.01 m/s depending on the distance from the energy extraction location. The area of impact on the tidal current for the far-field was approximately 11 km long and 6.6 km wide at both mid-flood and mid-ebb. It is represented by a −0.01 m/s contour line (shown in Figure 10b and Figure 11b). The modeling results also showed that only near-field currents were influenced by a turbine array (Figure 10a and Figure 11a).
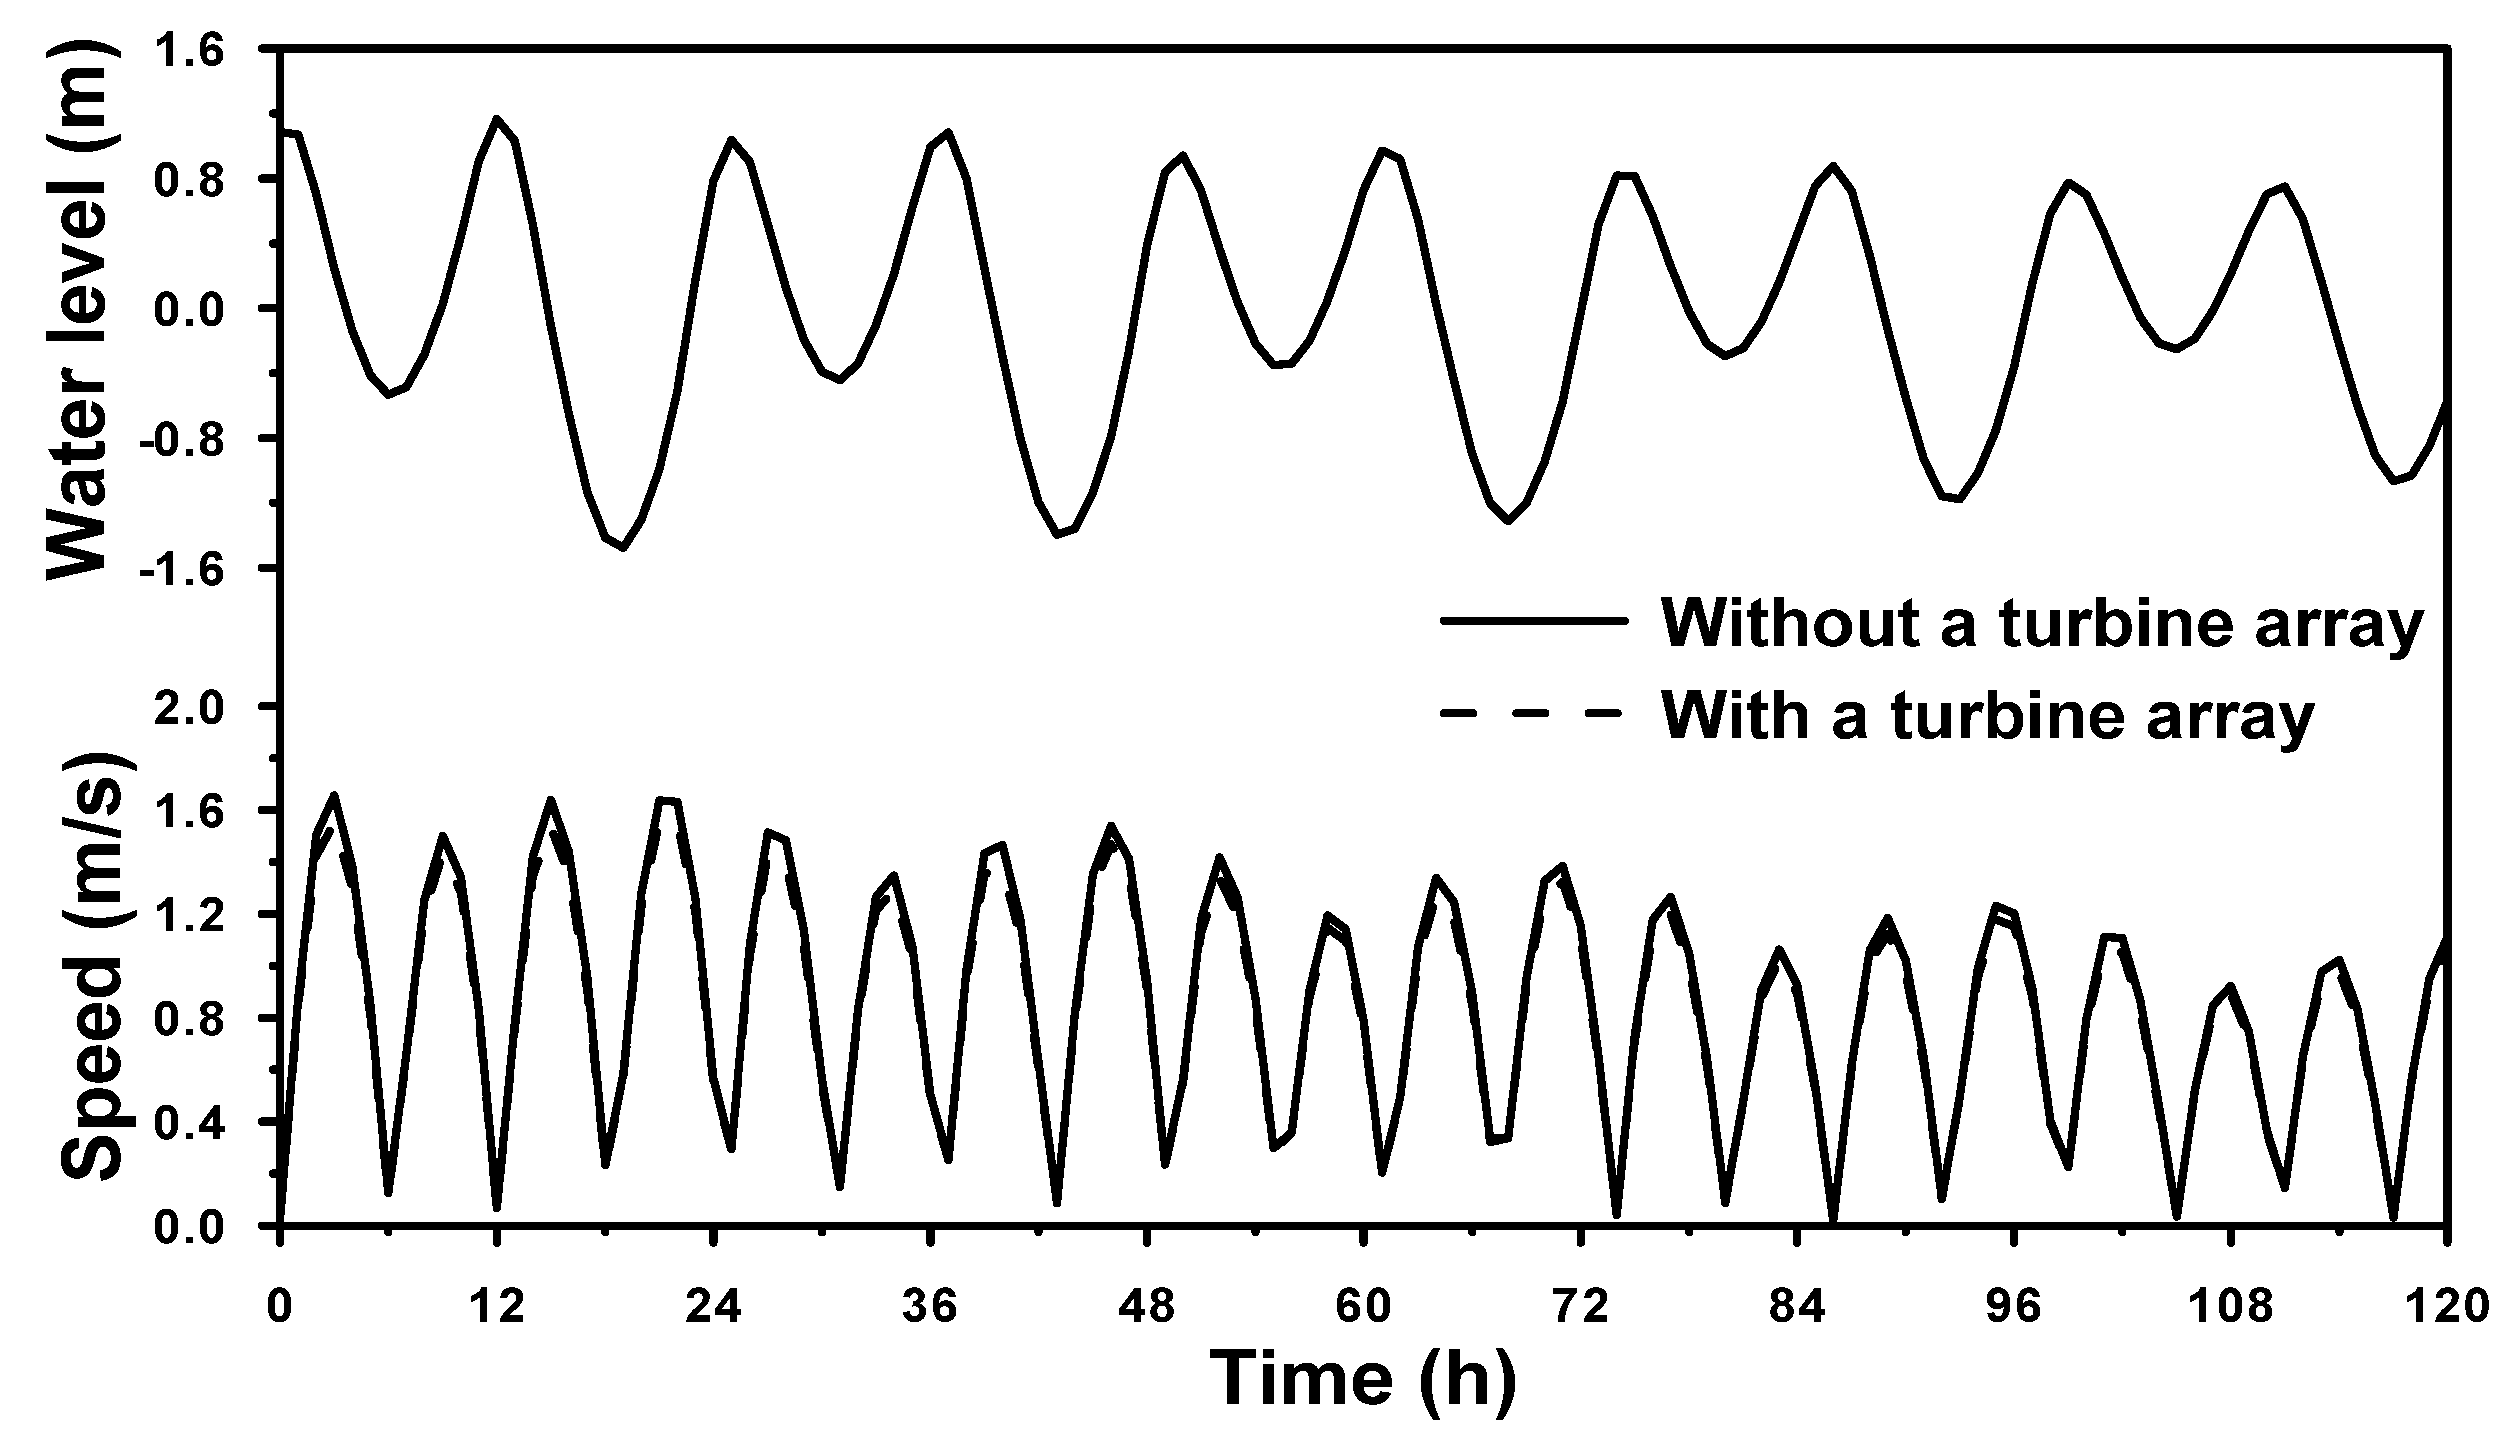
Figure 12 presents the time-series water level and tidal current with and without a turbine array. It shows that there is no difference in water level and only slight changes in tidal current due to a turbine array at the energy extraction location.
According to the model results, the current decreased with a maximum value of 0.05 m/s when a turbine array (55 turbines) was deployed in the Penghu Channel. It resulted in diminishing the power density, 0.02 kWh/m2. Therefore the flow effects are negligible for estimating energy output.
Figure 10. Difference in the mid-flood tidal current for the (a) far-field and (b) near-field with and without a turbine array.
Energies 06 02191 g010
Figure 11. Difference in the mid-ebb tidal current for the (a) far-field and (b) near-field with and without a turbine array.
Energies 06 02191 g011
Figure 12. Time-series water level and tidal current with and without a turbine array.
Energies 06 02191 g012

5. Conclusions

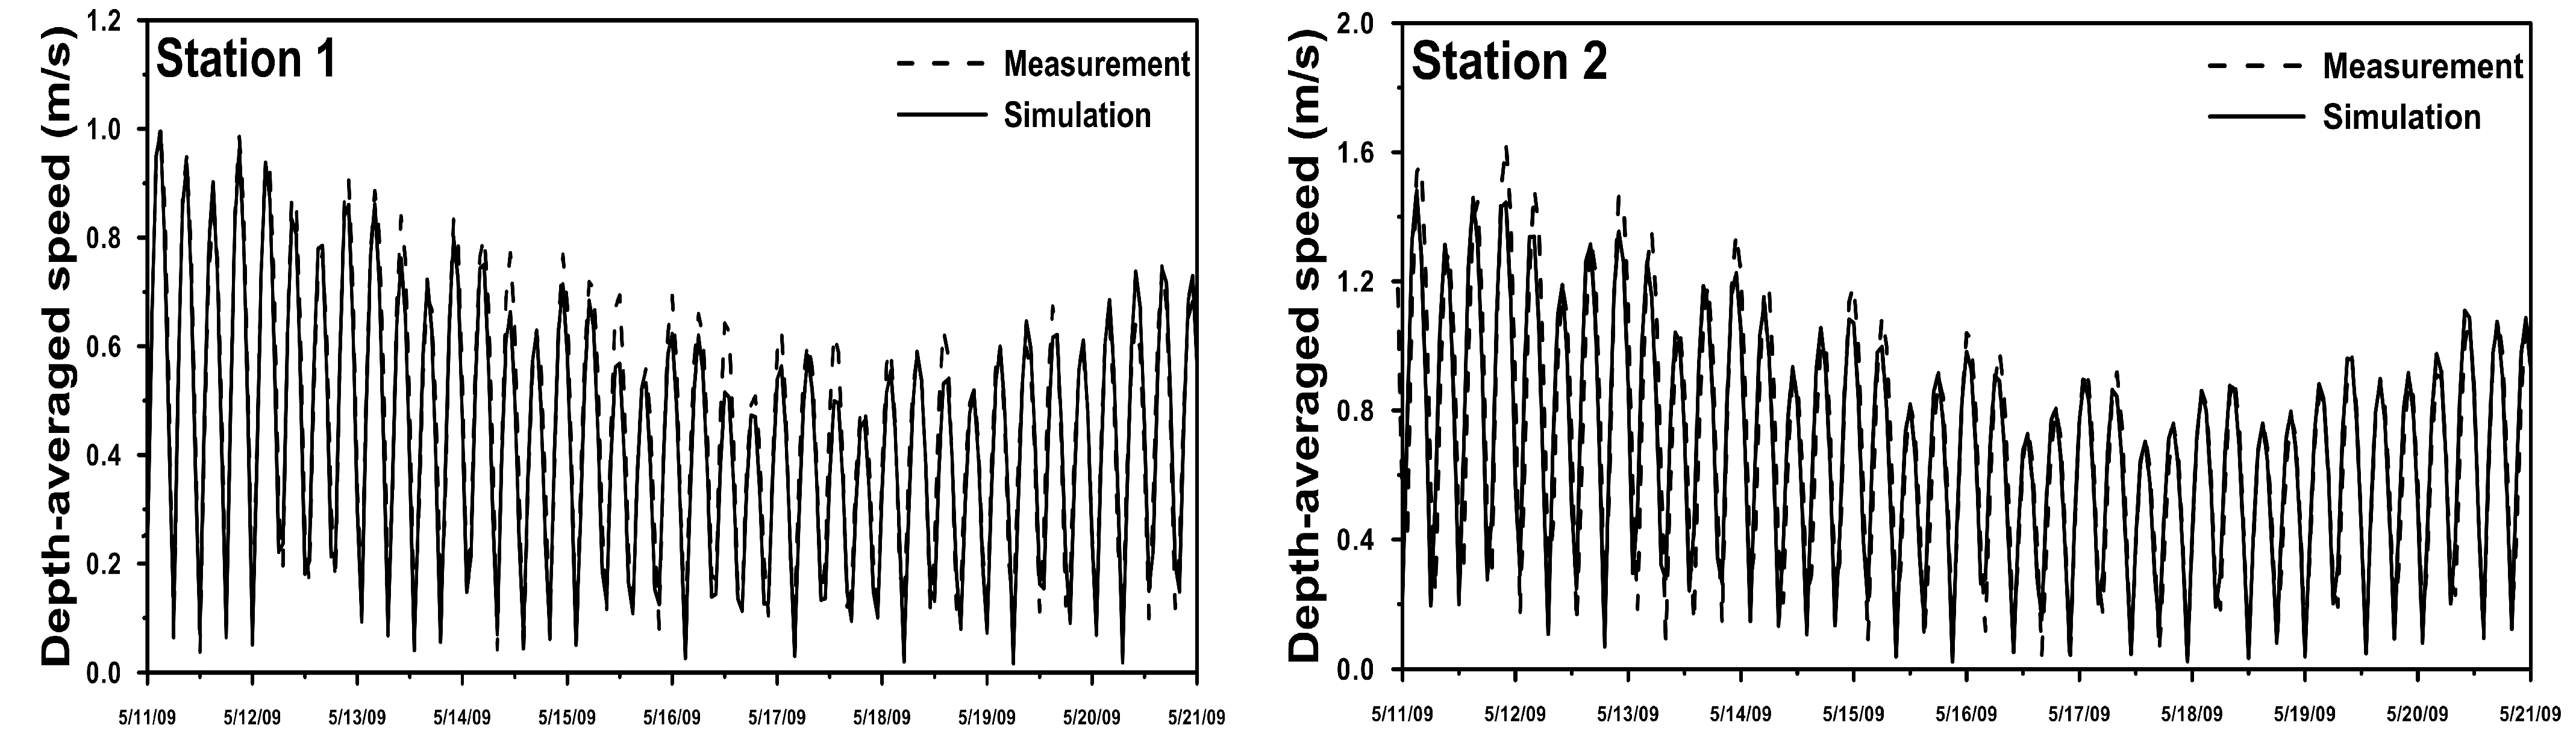
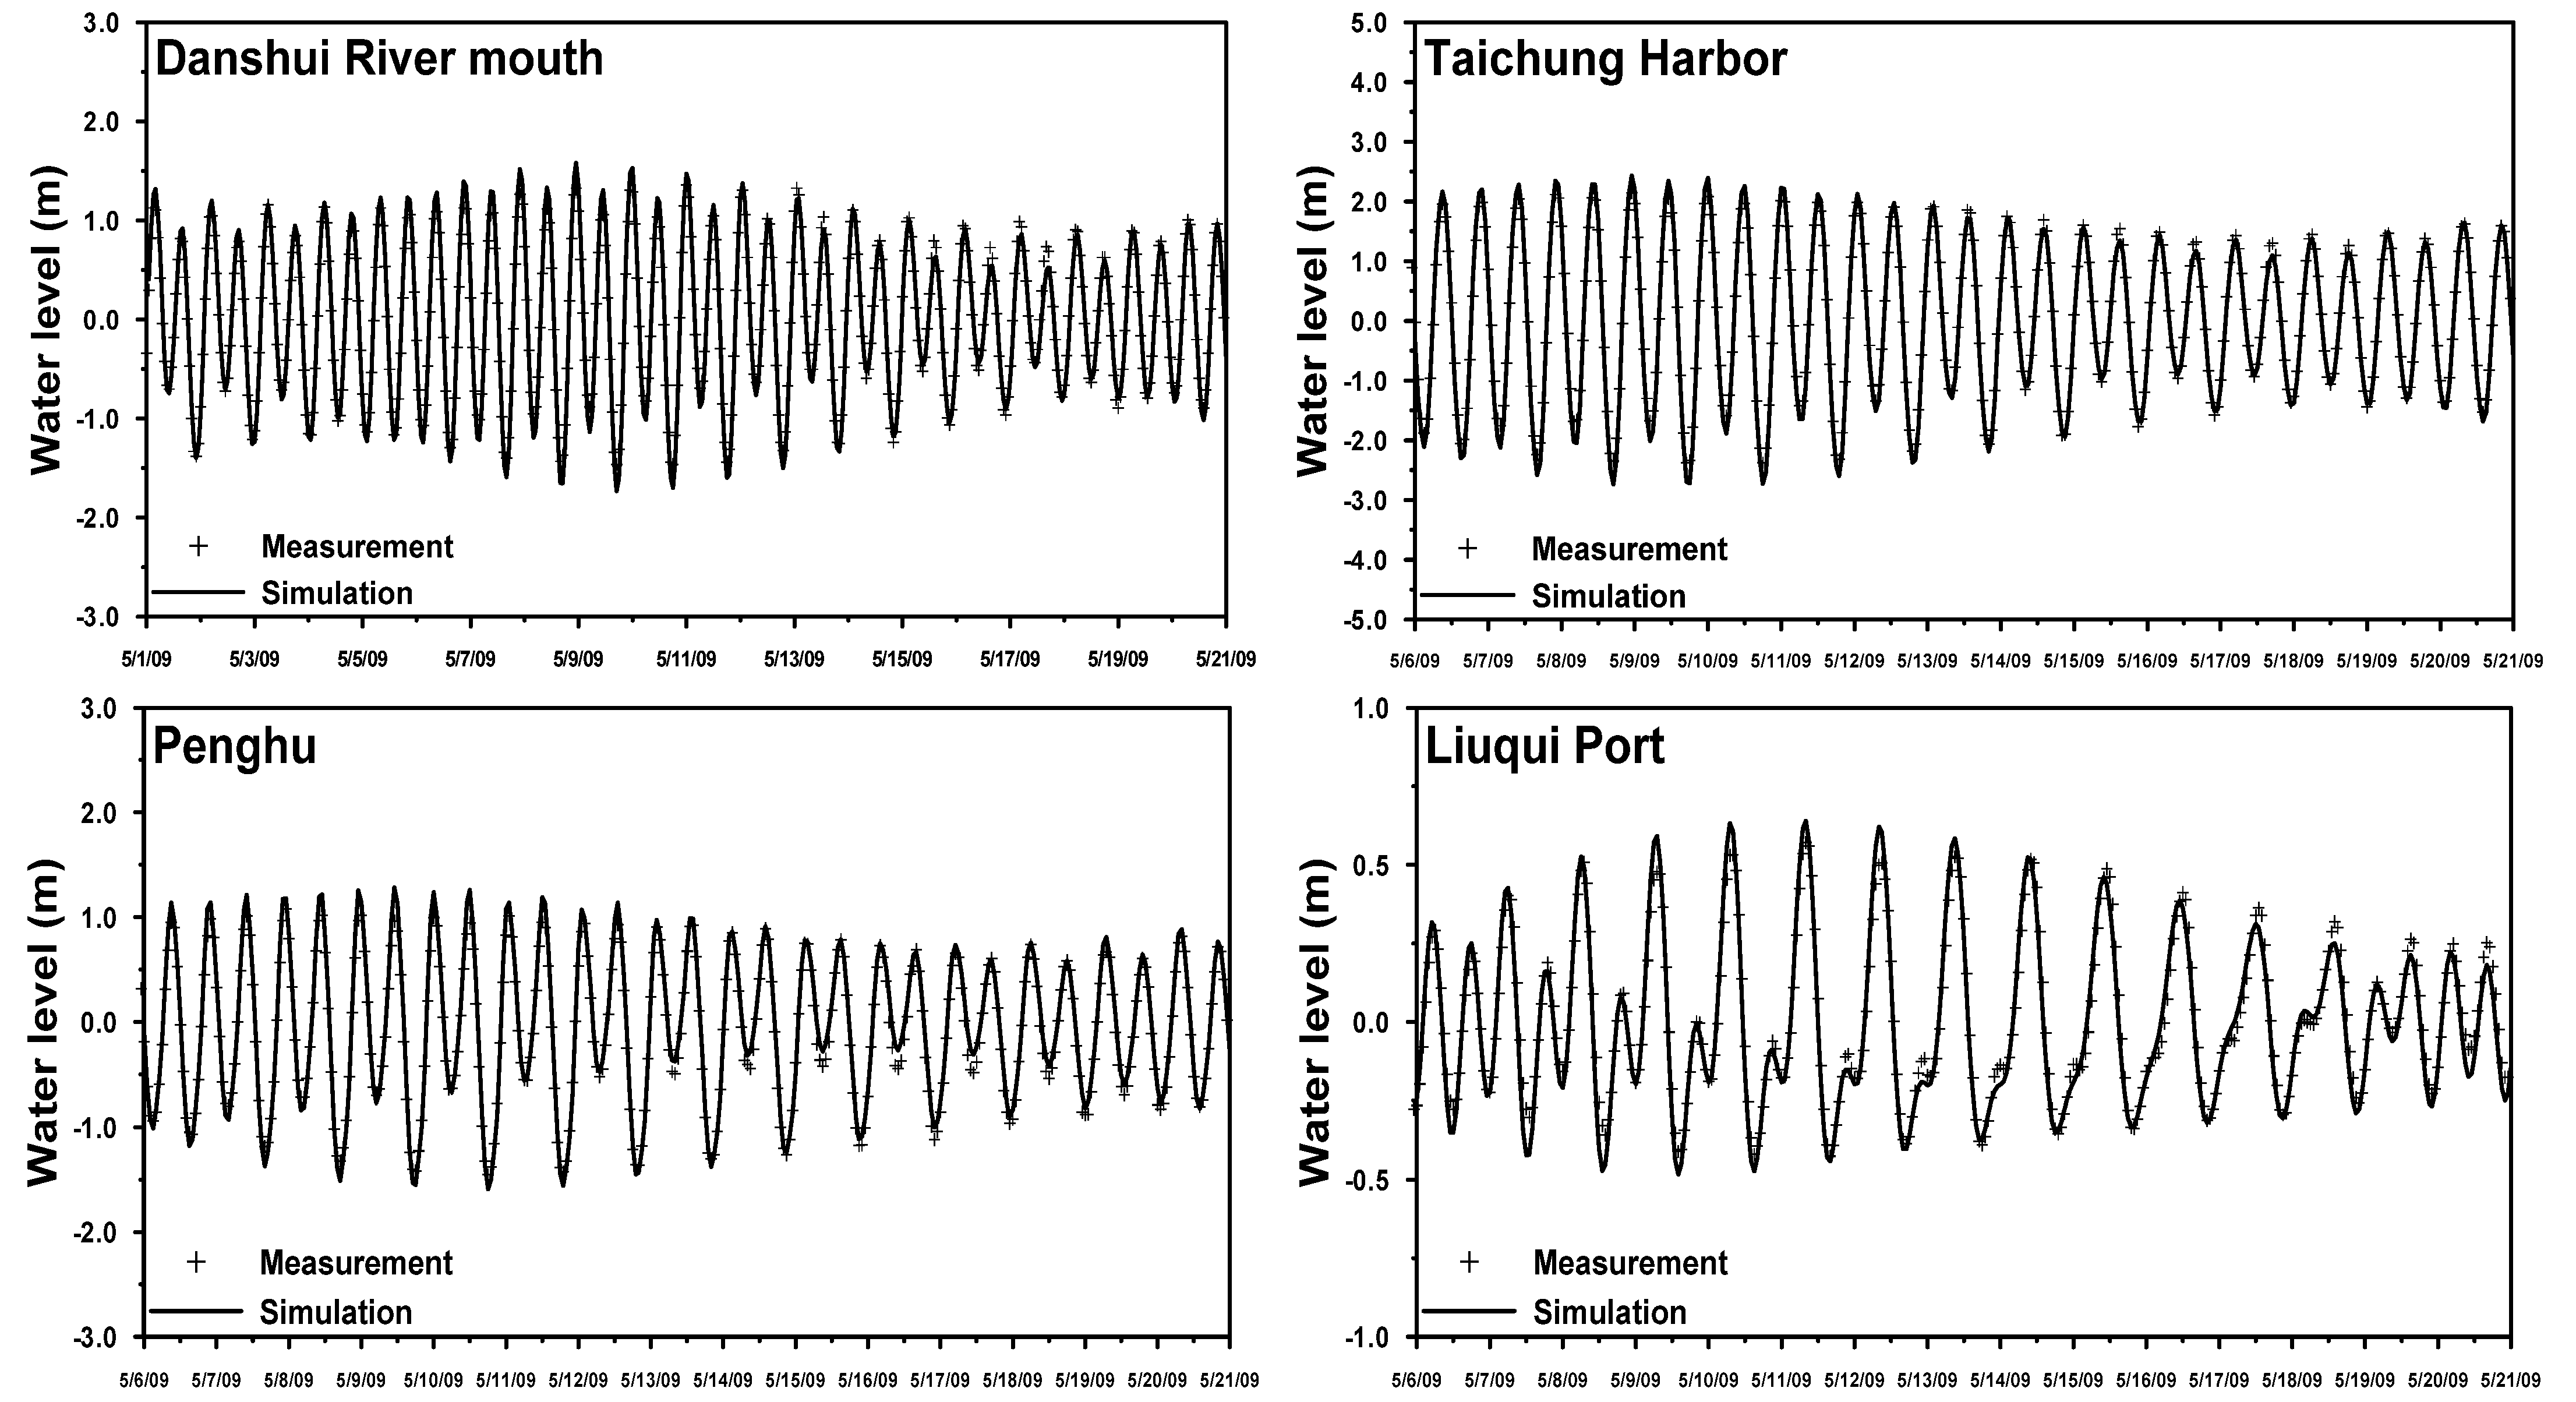
An existing finite element numerical model was refined by adding an algorithm to compute the power density and assess the influence of a turbine array on the hydrodynamics. The model was validated with measured data. The results showed that the simulated water levels and velocities reproduced the measured data. The validated model was then applied to estimate the tidal stream energy resources around the Penghu Islands and in the Taiwan Strait.
The modeling results revealed that the highest power density exceeded 0.9 kW/m2 southwest of the Penghu Islands and the Penghu Channel. The highest power density during mid-flood of a mean spring tide was less than that during mid-ebb tide. Considering the bathymetric and topographic factors, the Penghu Channel may be a potential location for a tidal turbine array. If 55 turbines were deployed in one row (approximately 720 m long), the total tidal energy output by all turbines would be 9.46 GWh/year.
To assess the impacts of energy extraction on water level and tidal current, the momentum sink approach was considered in the momentum equation. The simulated results indicate that only minimal impacts would occur on water level and tidal current in the Taiwan Strait, even if a turbine array was installed at the Penghu Channel.

Acknowledgments

This study was partially funded by the National Science Council, Taiwan, under grant Nos. 100-2625-M-239-001 and 101-2625-M-239-001. The authors would like to express their appreciation to the Taiwan Center Weather Bureau for providing the observational data.

References

  1. Chen, F.; Lu, S.M.; Chang, Y.L. Renewable energy in Taiwan: Its developing status and strategy. Energy 2007, 32, 1634–1646. [Google Scholar] [CrossRef]
  2. Chen, F.; Lu, S.M.; Tseng, K.T.; Lee, S.C.; Wang, E. Assessment of renewable energy in Taiwan. Renew. Sustain. Energy Rev. 2010, 14, 2511–2528. [Google Scholar] [CrossRef]
  3. Marine Current Turbines Home Page. Available online: http://www.marineturbines.com (accessed on 15 April 2013).
  4. Gorlov, A.M. Tidal energy. In Encyclopedia of Ocean Sciences; Academic Press: Oxford, UK, 2001; pp. 2955–2960. [Google Scholar]
  5. Carballo, R.; Iglesias, G.; Castro, A. Numerical model evaluation of tidal stream energy resources in the Ria de Muros (NW Spain). Renew. Energy 2009, 34, 1517–1524. [Google Scholar] [CrossRef]
  6. Blunden, L.S.; Bahaj, A.S. Initial evaluation of tidal stream energy resources at Portland Bill, UK. Renew. Energy 2006, 31, 121–132. [Google Scholar] [CrossRef]
  7. Sutherland, G.; Foreman, M.; Garrett, C. Tidal current energy assessment for Johnstone Strait, Vancouver Island. Proc. Inst. Mech. Eng. Part A J. Power Energy 2007, 221, 147–157. [Google Scholar] [CrossRef]
  8. Xia, J.Q.; Falconer, R.A.; Lin, B.L. Impact of different tidal power projects on the hydrodynamic processes in the Severn Estuary. Ocean Model. 2010, 32, 86–104. [Google Scholar] [CrossRef]
  9. Chen, W.B.; Liu, W.C.; Hsu, M.H. Modeling assessment of tidal current energy at Kinmen Island, Taiwan. Renew. Energy 2013, 50, 1073–1082. [Google Scholar] [CrossRef]
  10. Yang, Z.; Wang, T.; Copping, A.E. Modeling tidal stream energy extraction and its effects on transport processes in a tidal channel and bay system using a three-dimensional coastal ocean model. Renew. Energy 2013, 50, 605–613. [Google Scholar] [CrossRef]
  11. Zhang, Y.L.; Baptista, A.M. SELFE: A semi-implicit Eulerian-Lagrangian finite-element model for cross-scale ocean circulation. Ocean Model. 2008, 21, 71–96. [Google Scholar] [CrossRef]
  12. Umlauf, L.; Buchard, H. A generic length-scale equation for geophysical turbulence models. J. Mar. Res. 2003, 61, 235–265. [Google Scholar] [CrossRef]
  13. Defne, Z.; Hass, K.A.; Fritz, H.M. Numerical modeling of tidal currents and the effects of power extraction on estuarine hydrodynamics along the Georgia coast, USA. Renew. Energy 2011, 36, 3461–3471. [Google Scholar] [CrossRef]
  14. Shapiro, G.I. Effect of tidal stream power generation on the region-wide circulation in a shallow sea. Ocean Sci. Discuss. 2011, 7, 165–174. [Google Scholar] [CrossRef]
  15. Hasegawa, D.; Sheng, J.; Greenburg, D.A.; Thompson, K.R. Far-field effects of tidal energy extraction in the Minas Passage on tidal circulation in the Bay of Fundy and Gulf of Maine using a nested-grid coastal circulation model. Ocean Dyn. 2011, 61, 1845–1868. [Google Scholar] [CrossRef]
  16. Goban, A.N.; Gorlov, A.M.; Silantyev, A.M. Limits of the turbine efficiency for free fluid flow. J. Energy Resour. Tech. 2001, 123, 311–317. [Google Scholar] [CrossRef]
  17. Ainsworth, D.; Thake, J. Final Report on Preliminary Works Associated with 1MW Tidal Turbine; Marine Current Turbines Ltd.: Bristol, UK, 2006. [Google Scholar]
  18. Liu, W.C.; Chen, W.C.; Hsu, M.H. Different turbulence models for stratified flow and salinity. Proc. Inst. Civil Eng. Marit. Eng. 2010, 163, 117–133. [Google Scholar]
  19. Hsu, M.H.; Kuo, A.Y.; Kuo, J.T.; Liu, W.C. Procedure to calibrate and verify numerical models of estuarine hydrodynamics. J. Hydraul. Eng. ASCE 1999, 125, 166–182. [Google Scholar] [CrossRef]
  20. Ahmadian, R.; Falconer, R.A. Assessment of array shape of tidal stream turbines on hydro-environmental impacts and power output. Renew. Energy 2012, 44, 318–327. [Google Scholar] [CrossRef]
  21. Vennell, R. Estimating the power potential of tidal currents and the impact of power extraction on flow speeds. Renew. Energy 2011, 36, 3558–3565. [Google Scholar] [CrossRef]

