1. Introduction
The European Union is positioned as one of the most active economic areas in terms of measures for combating climate change. The importance of energy consumption in this issue is reflected by the fact that 80% of greenhouse gas emissions in Europe are currently due to the use and production of energy. The Stern report [
1] emphasizes that, in the World as a whole, almost 65% of said emissions are due to energy use. An important agreement was signed in December of 2008 (the so called 20/20/20 plan), by which EU member countries committed to reducing emissions and primary energy consumption in 2020 by 20% with respect to 1990 levels (see [
2,
3] for a description of the European environmental policy in shape with energy and emission targets for the 2020 horizon and Kyoto protocol). The different greenhouse gas emission scenarios depend largely on changes in the energy use and on the extent to which future energy sources limit their emissions of these types of contaminant. Thus, improving energy efficiency is regarded as one of the most important options for reducing the emissions of greenhouse gases and the dependence of countries on energy imports [
4].
Energy intensity (
EI) measures the relationship between final energy consumption and real GDP.
EI has commonly been used as an indicator of energy efficiency.
EI can be measured for individual economic sectors or jointly, and it can be calculated at both the national and regional level. Moreover, by using homogeneous statistical sources, their values are comparable between countries or regions. As a measure of a country’s energy efficiency, however,
EI has some significant drawbacks since it is not only improvements in each sector’s efficiency of energy use that determines its trend, but also the relative importance of different economic activities [
5]. While the common wisdom in the literature is that energy efficiency is the main driving force behind the evolution of
EI across countries (see [
6,
7]), recent papers have shown that, over the last decade, changes in the sectoral composition have become increasingly important in explaining cross-country
EI differences (see [
8,
9]). Therefore, for a particular level of disaggregation, a rigorous energy intensity and energy efficiency analysis should consider a suitable decomposition method to separate energy efficiency (efficiency component) from other factors not related to efficiency, such as those related with sectoral changes (structural component). Other works consider that energy intensity could also be affected by the changes in fuel mix because of the differences in economic productivity among different energy types (see [
10]). This line of research requires disaggregated data for final consumption (by energy source) for each sector, which is a promising extension of the paper.
Since the 1980s a large theoretical and empirical literature has related the change in
EI with the degree of a country’s economic development by decomposing the
EI into its constituent factors (see [
11] for a survey). While initial studies were country-specific and focused on the industry (see [
12,
13,
14]), most recent papers have extended the analysis to the aggregate economy by using sectoral data. Meanwhile, decomposition studies that include a cross-country perspective are usually limited in terms of sector detail and often focus on a single sector with special emphasis on heavy industries (see, for example, [
7,
15]). Some exception is [
16] that analyzes the convergence of world energy intensity on the global and regional scales or [
9] that compute and evaluate energy intensity across 18 OECD (Organization for Economic Co-operation and Development) countries and 50 sectors over the 1970–2005 period. For the industrial sector, some exceptions are [
17], which compares the UK with Germany, and [
18], which compares China, Japan and Korea ([
6] compares the changes of EI within US states; See [
19] for a detailed analysis of the
EI in the industrial sector and the role of the construction boom in Spain.)
Our paper contributes to this literature of
EI decomposition in cross-country comparisons. Using homogeneous criteria, we decompose and analyze the evolution of
EI in activity sectors for a set of EU15 countries for the 1991–2005 period. There exists few papers that make a cross country analysis for EU15 for the aggregate economy using sectoral and homogeneous data, and we contribute to cover this gap (see [
20,
21] which compare the evolution of
EI and their components of Spain with respect to Europe; [
9], as a cluster inside the OECD, analyzes the
EI evolution for a set of 10 European countries.) The 1991–2005 period corresponds to the implementation of the majority of environmental and energy directives both in Europe and around the world. It is precisely the initial of this period, the early 90s, which serves as the reference point for the emission reduction goals of plans such as the Kyoto Protocol in 1997; 2005 is of particular importance, since it was in this period when CO
2 emissions markets went into operation. We want to analyze a homogeneous period, where not deep structural changes have occurred. An interesting extension of the paper would be precisely to compare the performance of the
EI previous 2005 and post-2005. However, in doing so, we will face with an additional problem, which is the structural break induced by the Great Depression starting in 2008 and with different impacts depending on the country. This study would require a special econometric treatment of the series, which goes beyond the scope of this paper. In addition, we focus on economic sectors, distinguishing between industry, construction, services and agriculture, which represents approximately 45% of the final energy consumption in EU15 by 2005. As will be discussed in further detail in
Section 2, the transport and the residential sectors should be analyzed separately because of their particular features. This analysis goes beyond the scope of this paper and is left as a further extension.
For each country, the change in
EI is decomposed into a structural and an efficiency component. To perform this decomposition, we employ a
Divisia index method proposed by [
22]. As pointed out by [
23], the LMDI is the best decomposition method providing complete decomposition results with no residual effects among the various alternatives commonly used in the literature. Based on the change in
EI and on its decomposition, the countries are divided into groups exhibiting similar patterns, distinguishing between Nordic, Continental and Southern EU countries.
Although a cross-country perspective is usually limited in terms of sector detail, we are able to provide evidence on which sectors drive trends in aggregate energy intensity. Moreover, from the decomposition results and using simple statistical analysis, we identified certain behaviors of industry and services that affect the differential trends in European countries’ energy intensity. The results indicate that the change and analysis of aggregate EI, without distinguishing among its components, can lead to misleading conclusions, as well as to improperly designed Energy Policies. Thus, it is very important to identify those economic activities that, due to their special impact on energy, are fundamental to reducing energy consumption, as well as possible measures which can improve the efficiency of the final energy use. One of the purposes of this article is precisely to identify the foundations for future research into the determinants of EI within the EU in recent decades.
The rest of the paper is organized as follows:
Section 2 describes both the energy and economic activity data used, taken from Eurostat. This section analyzes the benefits of the index decomposition analysis methods and also offers a detailed presentation of the method used herein. In
Section 3 we present the decomposition results and classify the behavior of
EI by country, classified by typology.
Section 4 includes an analysis of the results and of the reasons which explain the change in
EI and in each of its components. Finally, the last section summarizes the main findings and highlights some questions of interest in the design of Energy Policy.
2. Energy Intensity Data and Decomposition Models
In this section we describe data and the decomposition method used in this paper.
2.1. Data
The data are from Eurostat, which establishes common criteria for energy, environmental and final output statistics within the EU. Eurostat energy data follow the rules of the International Energy Agency (IEA). According to these rules, all final energies are considered (oil derivatives, natural gas, electricity, etc.), including the so-called free fuels (biomass, wood, thermal solar, among others) in the category of renewable energy commodities. Every country in the EU15 is considered except for Luxembourg. As commented in the Introduction, the time period analyzed ranges from 1991 to 2005, and the level of disaggregation is directly related to the global nature of this study, as well as to the availability of data. For some countries, the time period is more restricted: the Gross Value Added (GVA) series start in 1999 for France and in 1995 for Greece and Ireland. For the remaining countries the period from 1991 to 2005 is used.
A broad classification of economic sectors is considered: primary (agriculture, farming and fishing), industrial, construction and services. We follow the Classification of Economic Activities used by the European Community and Eurostat (NACE). Thus, industrial production comprises the output of industrial establishments, covering: mining and quarrying (of energy and non-energy products); manufacturing (manufactures of food, beverage, textil, refined petroleum products, chemicals, plastic, machinery, non-metalic mineral products, etc.) and electricity, gas and water supply (groups c, d and e, respectively, in the NACE classification). Services activities comprise: wholesale and retail trade, hotel and restaurants, transport and communications, real state and renting, financial intermediation, education, health and others.
In order to decompose energy intensity in its efficiency and structural components, we need a measure of the level of activity and of energy consumption associated with each sector. The GVA is a measure in economics of the value of goods and services produced in a particular area or sector of an economy. GVA and Gross Domestic Product (GDP) are both measures of final output, and they are related by the following formula: GDP = GVA + taxes on products − subsidies on products. As taxes and subsidies on products are only available at the whole economy level, GVA is used for measuring gross domestic product (final output) for regions and for the output of entities smaller than a whole economy, such as the in the agriculture, construction, industry or service sectors. For this reason, for the economic sectors in question, we use its GVA, measured in millions of Euros at 1995 prices is our proxy of each sector’s real output. It is worth noting that while GVA is the best way to measure the level of activity in productive sectors, such as those considered in this paper, it is not a good proxy to measure activity in other sectors such as the transport or the residential.
Final energy consumption measured in Tons of Oil Equivalent (TOE) is considered to measure the level of energy consumption in each sector. Final energy consumption covers energy supplied to the final consumer for all energy uses, but we focus on those activity sectors commented above. In this sense, it is worth noting that energy use by the transportation sector is not considered within the services sector because, firstly, a percentage of this use is due to domestic transportation, which is not directly associated with any specific production activity; secondly, transport consumption is not comparable to the GVA of the transport sector since the energy use attributed to transportation is part of the companies and activities included in all economic sectors. Nor do we consider the energy consumption in the domestic sector apart from transportation, since it is not directly related to any concrete production process. Both cases merit a more specific study which is beyond the scope of this paper. Focusing on activity sectors and leaving aside the transport and the residency, we avoid problems in defining sectors consistently across energy and economic variables. For example, [
21] uses the GVA of the transport sector to decompose
EI for Spain and the entire EU region, but this is a bad proxy of its level of activity ([
20] already warmed about this). This inconsistently in sector definitions may cause large errors despite the use of the most precise index-number procedure [
24], which may lead to misleading conclusions.
Table 1 summarizes GVA and energy data (in relative terms) for the 14 EU countries considered in the paper. We show the average ratios in the whole sample considered. The GVA shares indicate the relative size of each sector in the economy, while the final energy consumption ratios highlight a country’s sectoral needs in terms of final energy demand. A general regularity is that the service sector is the highest in term of GVA (representing, on average, almost a 66% of the total), followed by the industry (with a 24% of average), the construction sector (with almost a 6% of average) and the agriculture (with an average of almost 4%). However, this ranking changes slightly when we look at energy consumption. Now the regularity is that the industry represents the sector with the highest share of final energy demand (with a 58% of the total, on average), followed by the services (with a 25% on average), the construction sector (with almost a 9% on average) and finally the agriculture (with an average of almost 8%). As already discussed, the sectoral composition of an economy constitutes a crucial determinant of each country’s final energy consumption and its intensity. Precisely, the procedure proposed below distinguishes between those changes in
EI caused by the sectoral composition from those changes associated to variations in the efficiency use of energy.
Our measure of overall
EI in the activity sectors is the sum of the final energy consumption divided by the sum of GVA values for the sectors considered.
Table 2 shows the 1991 and 2005 aggregate
EI levels in the 14 countries being analyzed (toe/thousands Euro). In relationship to its change since 1991, we can state that the
EI decreased in most countries and in the EU15 as a whole. It only increased in Austria, Italy, Portugal and, in particular, Spain. One of the main goals of this paper is precisely to highlight the reasons of these differences.
Table 1.
Gross Value Added (GVA) and Final Energy Consumption shares (%) in activity sectors in EU15: 1991–2005 (yearly average for the entire period).
Table 1.
Gross Value Added (GVA) and Final Energy Consumption shares (%) in activity sectors in EU15: 1991–2005 (yearly average for the entire period).
| | GVA shares (%): GVAi/sum(GVAi) | Energy shares (%): Ei/sum(Ei) |
|---|
| Agric. | Indus. | Const. | Serv. | Agric. | Indus. | Const. | Serv. |
|---|
| Austria | 2.6 | 23.4 | 7.5 | 66.4 | 6.0 | 56.4 | 11.7 | 25.9 |
| Belgium | 1.5 | 23.4 | 5.0 | 70.1 | 4.9 | 63.2 | 10.4 | 21.5 |
| Denmark | 3.3 | 19.6 | 4.8 | 72.4 | 16.7 | 41.9 | 9.1 | 32.3 |
| Germany | 1.3 | 25.7 | 5.7 | 67.3 | 3.2 | 61.4 | 6.4 | 29.1 |
| Italy | 3.3 | 23.5 | 5.5 | 67.7 | 6.3 | 67.9 | 5.5 | 20.3 |
| France ** | 3.2 | 20.0 | 4.6 | 72.0 | 5.1 | 53.5 | 7.6 | 33.8 |
| Finland | 3.9 | 30.3 | 4.9 | 61.3 | 5.9 | 70.4 | 13.3 | 10.3 |
| Netherlands | 3.2 | 20.9 | 5.2 | 70.7 | 16.0 | 50.6 | 2.8 | 30.6 |
| Greece * | 12.1 | 22.9 | 10.4 | 54.6 | 17.0 | 54.0 | 10.5 | 18.5 |
| Spain | 4.9 | 22.0 | 7.8 | 65.2 | 7.3 | 67.4 | 7.7 | 17.6 |
| Portugal | 4.9 | 22.6 | 6.3 | 66.3 | 7.2 | 68.2 | 8.0 | 16.6 |
| Ireland * | 5.1 | 36.5 | 5.6 | 52.4 | 6.9 | 48.3 | 7.5 | 37.4 |
| Sweden | 2.6 | 27.4 | 4.2 | 66.2 | 4.7 | 59.7 | 10.4 | 25.2 |
| United Kingdom | 1.8 | 23.7 | 4.9 | 69.7 | 2.3 | 53.6 | 13.6 | 30.6 |
| Average | 3.8 | 24.4 | 5.9 | 65.9 | 7.8 | 58.3 | 8.9 | 25.0 |
| Std. | 2.7 | 4.5 | 1.7 | 6.0 | 5.0 | 8.6 | 3.0 | 7.8 |
| Min. | 1.3 | 19.6 | 4.2 | 52.4 | 2.3 | 41.9 | 2.8 | 10.3 |
| Max. | 12.1 | 36.5 | 10.4 | 72.4 | 17.0 | 70.4 | 13.6 | 37.4 |
Table 2.
Energy Intensity (TOE/thousands Euro) in activity sectors in EU15: 1991–2005.
Table 2.
Energy Intensity (TOE/thousands Euro) in activity sectors in EU15: 1991–2005.
| Country | 1991 | 2005 | 2005/91 |
|---|
| Austria | 0.060 | 0.062 | 1.033 |
| Belgium | 0.085 | 0.069 | 0.813 |
| Denmark | 0.053 | 0.039 | 0.733 |
| Germany | 0.058 | 0.041 | 0.700 |
| Italy | 0.063 | 0.067 | 1.051 |
| France ** | 0.052 | 0.046 | 0.899 |
| Finland | 0.129 | 0.117 | 0.907 |
| Netherlands | 0.090 | 0.070 | 0.775 |
| Greece * | 0.073 | 0.061 | 0.840 |
| Spain | 0.061 | 0.071 | 1.167 |
| Portugal | 0.081 | 0.088 | 1.081 |
| Ireland * | 0.072 | 0.049 | 0.679 |
| Sweden | 0.105 | 0.077 | 0.741 |
2.2. Decomposition Method
At this point, the key issue lies in understanding the reasons behind the different changes in EI. To this end, we propose a procedure that will allow us to decompose the causes of the changes in energy intensity, distinguishing between those reasons solely associated with a change in the production structure and those derived from changes in the technological-energy efficiency in the final consumption.
The Index Decomposition Analysis (IDA) is an area of research that has gained prominence in the last 25 years as a tool to aid in designing energy and environmental policy. Researchers have used this method to explain the behavior of energy demand by quantifying the relative contribution of the impacts resulting from structural change and energy intensity. The advantages of this procedure are its simplicity and flexibility, since its theoretical base is grounded in index number theory. [
11] provides an extensive survey of the energy decomposition literature.
Intuitively, the starting point of these decomposition methods is the following formula (a more detailed description of this procedure is shown in the
appendix)
where
i is a sector-specific index;
n is the number of sectors considered (n = 4 in our case);
t is a temporal index that goes from
t = 1991 to
2005 in our case;
E and
Y are, respectively, the total final energy consumption (measured in TOE) and the total GVA (measured in millions of Euros at 1995 prices) of all activity sectors considered; hence;
Ei and
Yi are, respectively, the final energy consumption and production level in the
i-th sector. For each sector
i, we denote the sectoral energy intensity
ei = Ei/Yi and the production share
si = Yi/Y. Hence, the above equation indicates that a change in
EI can be due to changes in the sectoral energy intensity,
ei, and/or the product mix
si. The primary objective of an energy decomposition analysis is to quantify these two effects and to interpret their energy policy implications. In sum, we will decompose the changes in
EI between the variations in the weight of the economic sectors (
structural component) and the variations resulting from efficiency improvements in each specific activity (
efficiency component).
Different methods can be used to achieve this decomposition. Reference [
22] proposed a method that results in a perfect decomposition of the
EI, thus solving the problems of previous procedures, as discussed in [
25]. Their proposal is based on the logarithmic mean of the weights, the procedure being referred to as the Log Mean Divisia Index (LDMI). This is the procedure used in this paper. The LDMI has been used in many studies mainly since the year 2000. [
25,
26] offer a summary of the different methods used by researchers and some national and international energy agencies. These studies conclude that LDMI is the most advisable method, in its additive or multiplicative forms, because of its theoretical properties and the ease with which it can be used and its results interpreted. In the
appendix, we describe in detail the mathematical formulation of the methodology of decomposition used in this paper.
3. Energy Intensity Decomposition for EU15 Countries
In this section we show the main results of the
EI decomposition analysis for EU15 countries between 1991 and 2005 by using the multiplicative LMDI proposed by [
22]. We then classify the EU15 countries by the change in
EI and by the importance of the changes in the structural and efficiency components.
For each country,
Table 3 shows the annual change in EI and distinguishes between the variations due to the structural and the efficiency component. The last two columns show the importance that changes in each component have on the total. With the exception of Austria, the one country where the weight of both components was similar, the efficiency component was much more important than the structural component in explaining the changes in total intensity. This result is according to [
14] conclusions about industrialized nations. A distinction is also made in the table between the annual variations for the entire time period analyzed (1991–2005) and for the pre- (1991–1996) and post-Kyoto (1997–2005) periods.
Table 3.
Final Energy Intensity annual change (%) in activity sectors in EU15 excluding transports and households: total, structural and efficiency.
Table 3.
Final Energy Intensity annual change (%) in activity sectors in EU15 excluding transports and households: total, structural and efficiency.
| Country | Total | Structural | Efficiciency. | St/tot | Ef/tot |
|---|
| 91/05 | 91/96 | 96/05 | 91/05 | 91/96 | 96/05 | 91/05 | 91/96 | 96/05 |
|---|
| Austria | 0.23 | 0.12 | 0.3 | 0.12 | −0.31 | 0.35 | 0.12 | 0.43 | −0.05 | 0.5 | 0.5 |
| Belgium | −1.48 | 0.14 | −2.38 | −0.35 | −0.29 | −0.38 | −1.13 | 0.43 | −1.99 | 0.24 | 0.76 |
| Denmark | −2.22 | −1.57 | −2.58 | 0.1 | 0.45 | −0.09 | −2.32 | −2.03 | −2.49 | −0.05 | 1.05 |
| Germany | −2.54 | −2.41 | −2.62 | −0.68 | −1.75 | −0.08 | −1.86 | −0.65 | −2.54 | 0.27 | 0.73 |
| Italy | 0.35 | −0.33 | 0.73 | −0.58 | 0.05 | −0.94 | 0.94 | −0.37 | 1.67 | −1.65 | 2.65 |
| France ** | −1.78 | - | - | −0.15 | - | - | −1.63 | - | - | 0.08 | 0.92 |
| Finland | −0.7 | 1.04 | −1.66 | 1.43 | 1.65 | 1.31 | −2.13 | −0.61 | −2.98 | −2.06 | 3.06 |
| Netherlands | −1.82 | −0.7 | −2.44 | −0.48 | −0.26 | −0.6 | −1.34 | −0.44 | −1.84 | 0.26 | 0.74 |
| Greece * | −1.75 | - | −2.32 | −0.62 | - | −0.75 | −1.13 | - | −1.57 | 0.35 | 0.65 |
| Spain | 1.1 | 0.23 | 1.59 | −0.42 | −0.3 | −0.49 | 1.52 | 0.52 | 2.08 | −0.38 | 1.38 |
| Portugal | 0.55 | 0.02 | 0.85 | −0.5 | −0.07 | −0.74 | 1.05 | 0.09 | 1.59 | −0.9 | 1.9 |
| Ireland * | −3.87 | - | −3.33 | 0.03 | - | 0.06 | −3.91 | - | −3.39 | −0.01 | 1.01 |
| Sweden | −2.14 | 1.26 | −4.03 | 0.92 | 0.96 | 0.9 | −3.06 | 0.3 | −4.93 | −0.43 | 1.43 |
| Un. King. | −2.7 | −0.98 | −3.66 | −1.01 | −0.39 | −1.35 | −1.69 | −0.59 | −2.31 | 0.37 | 0.63 |
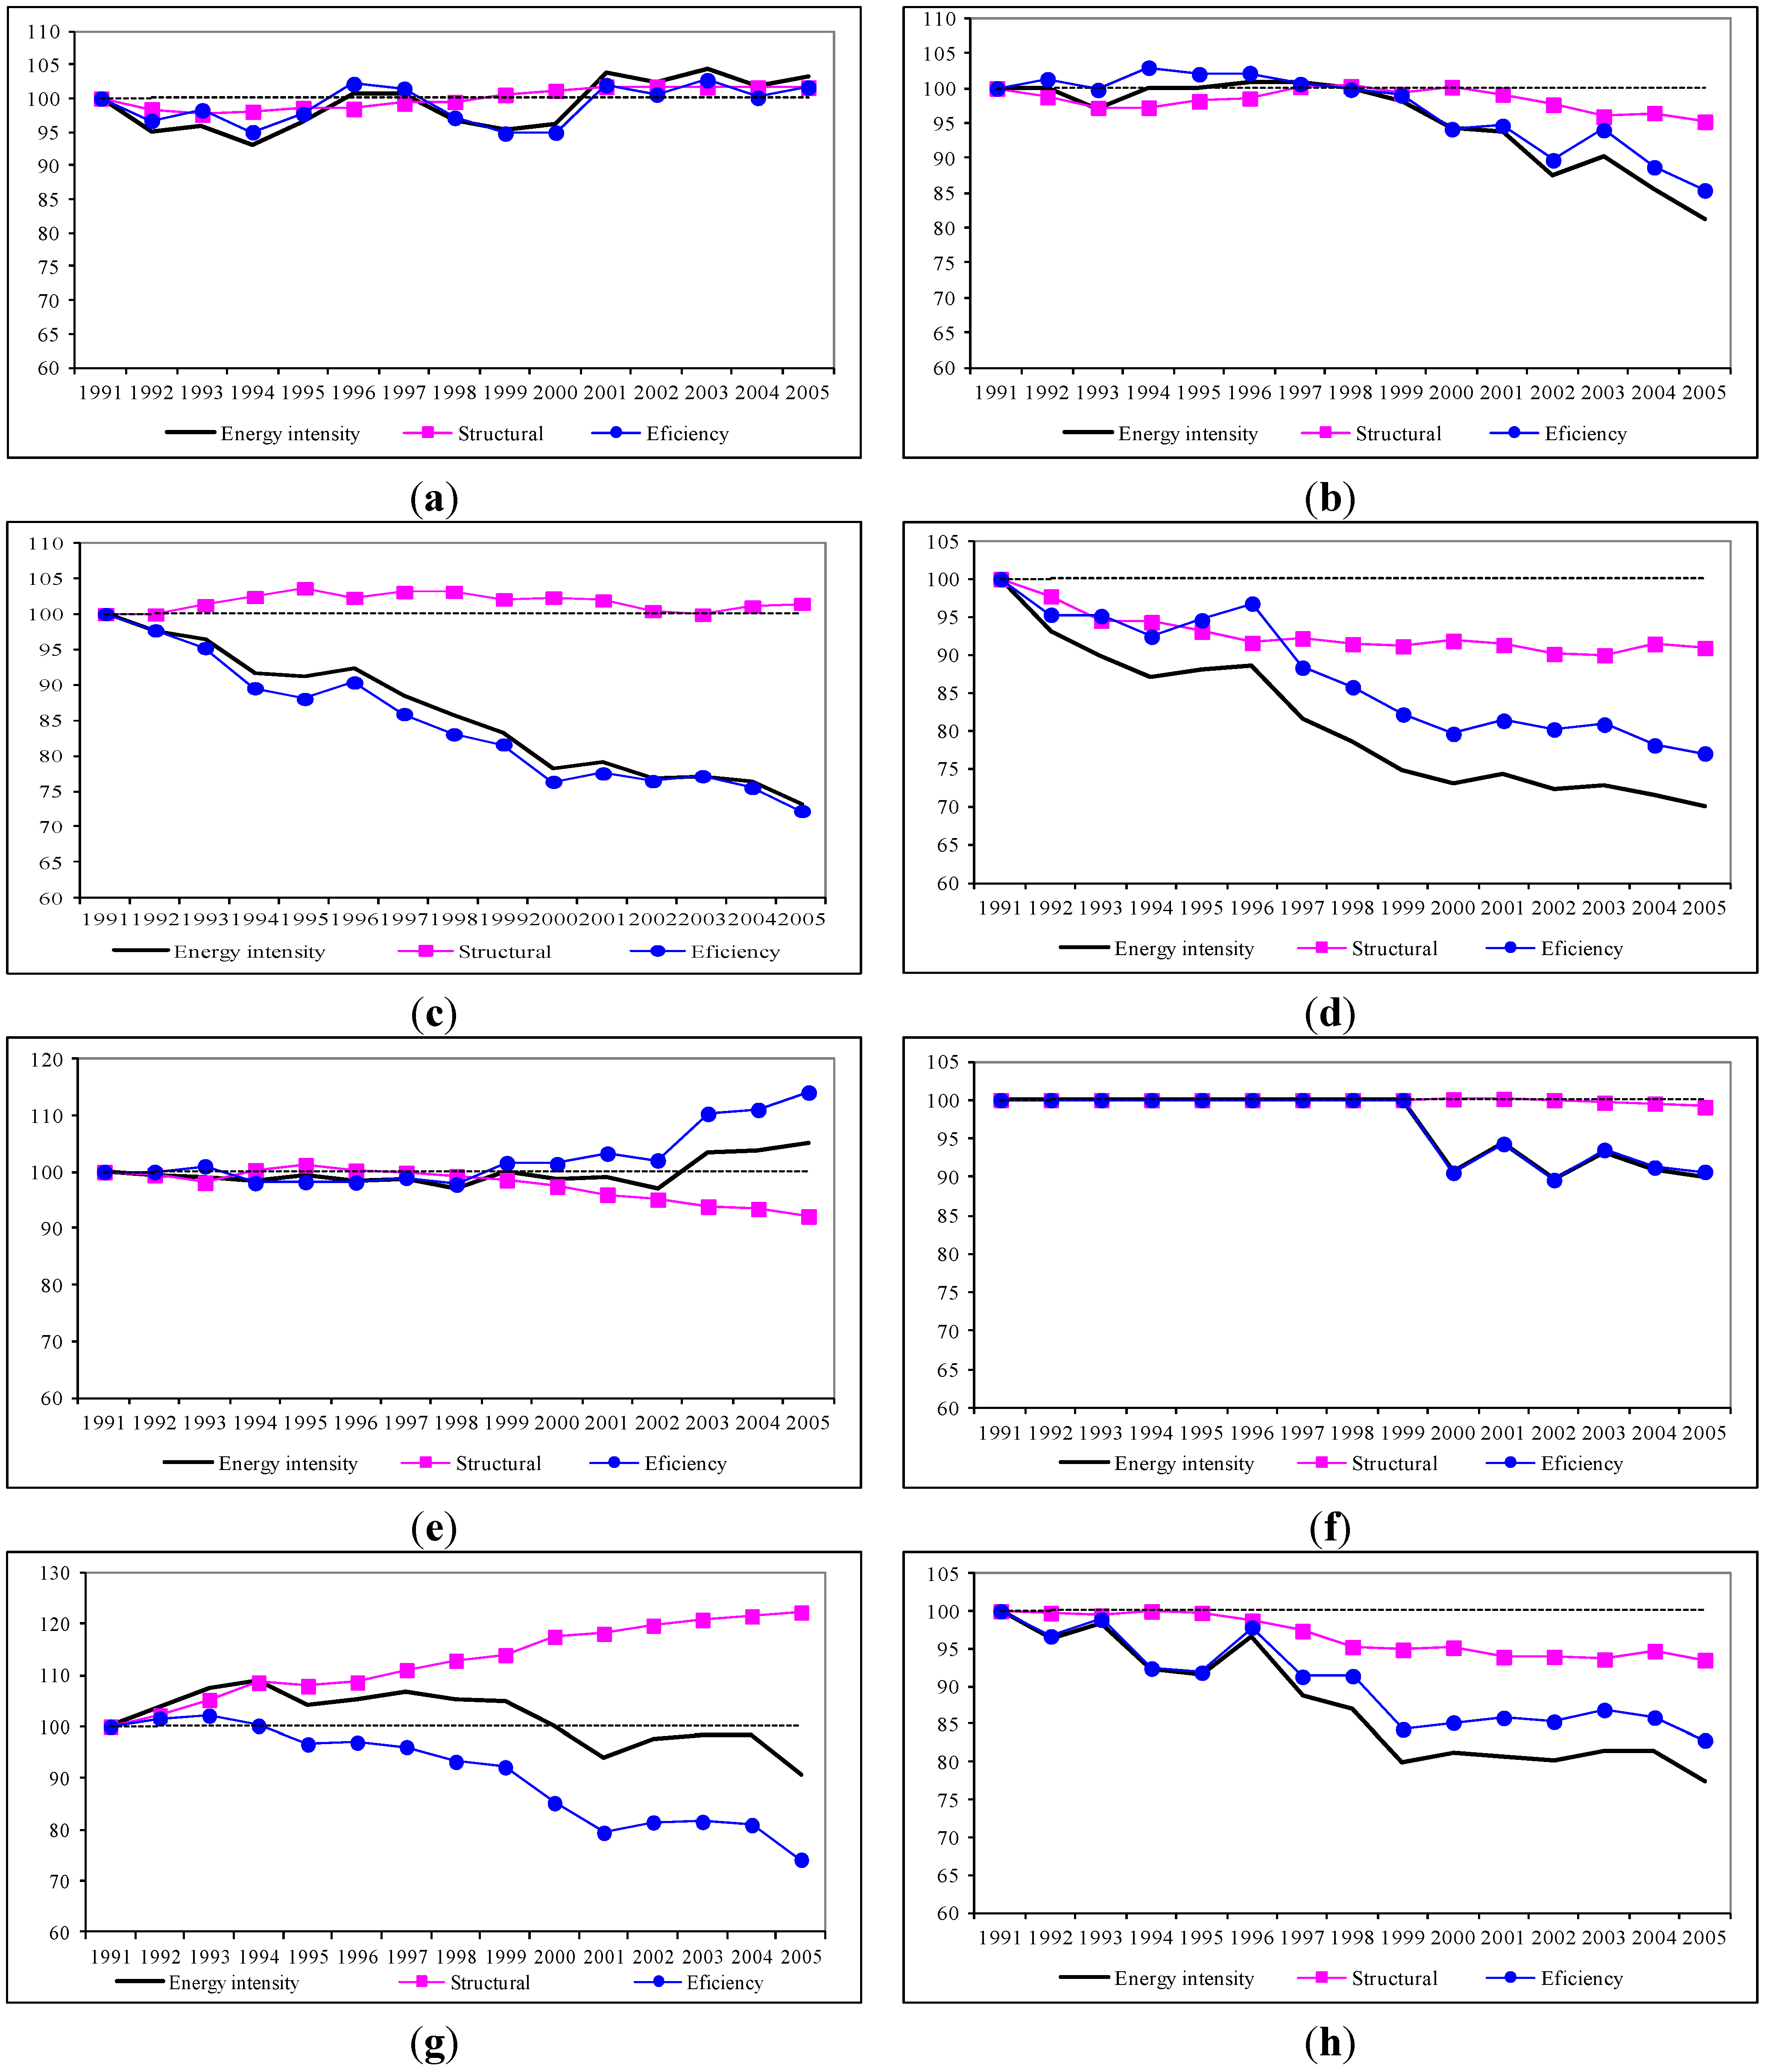
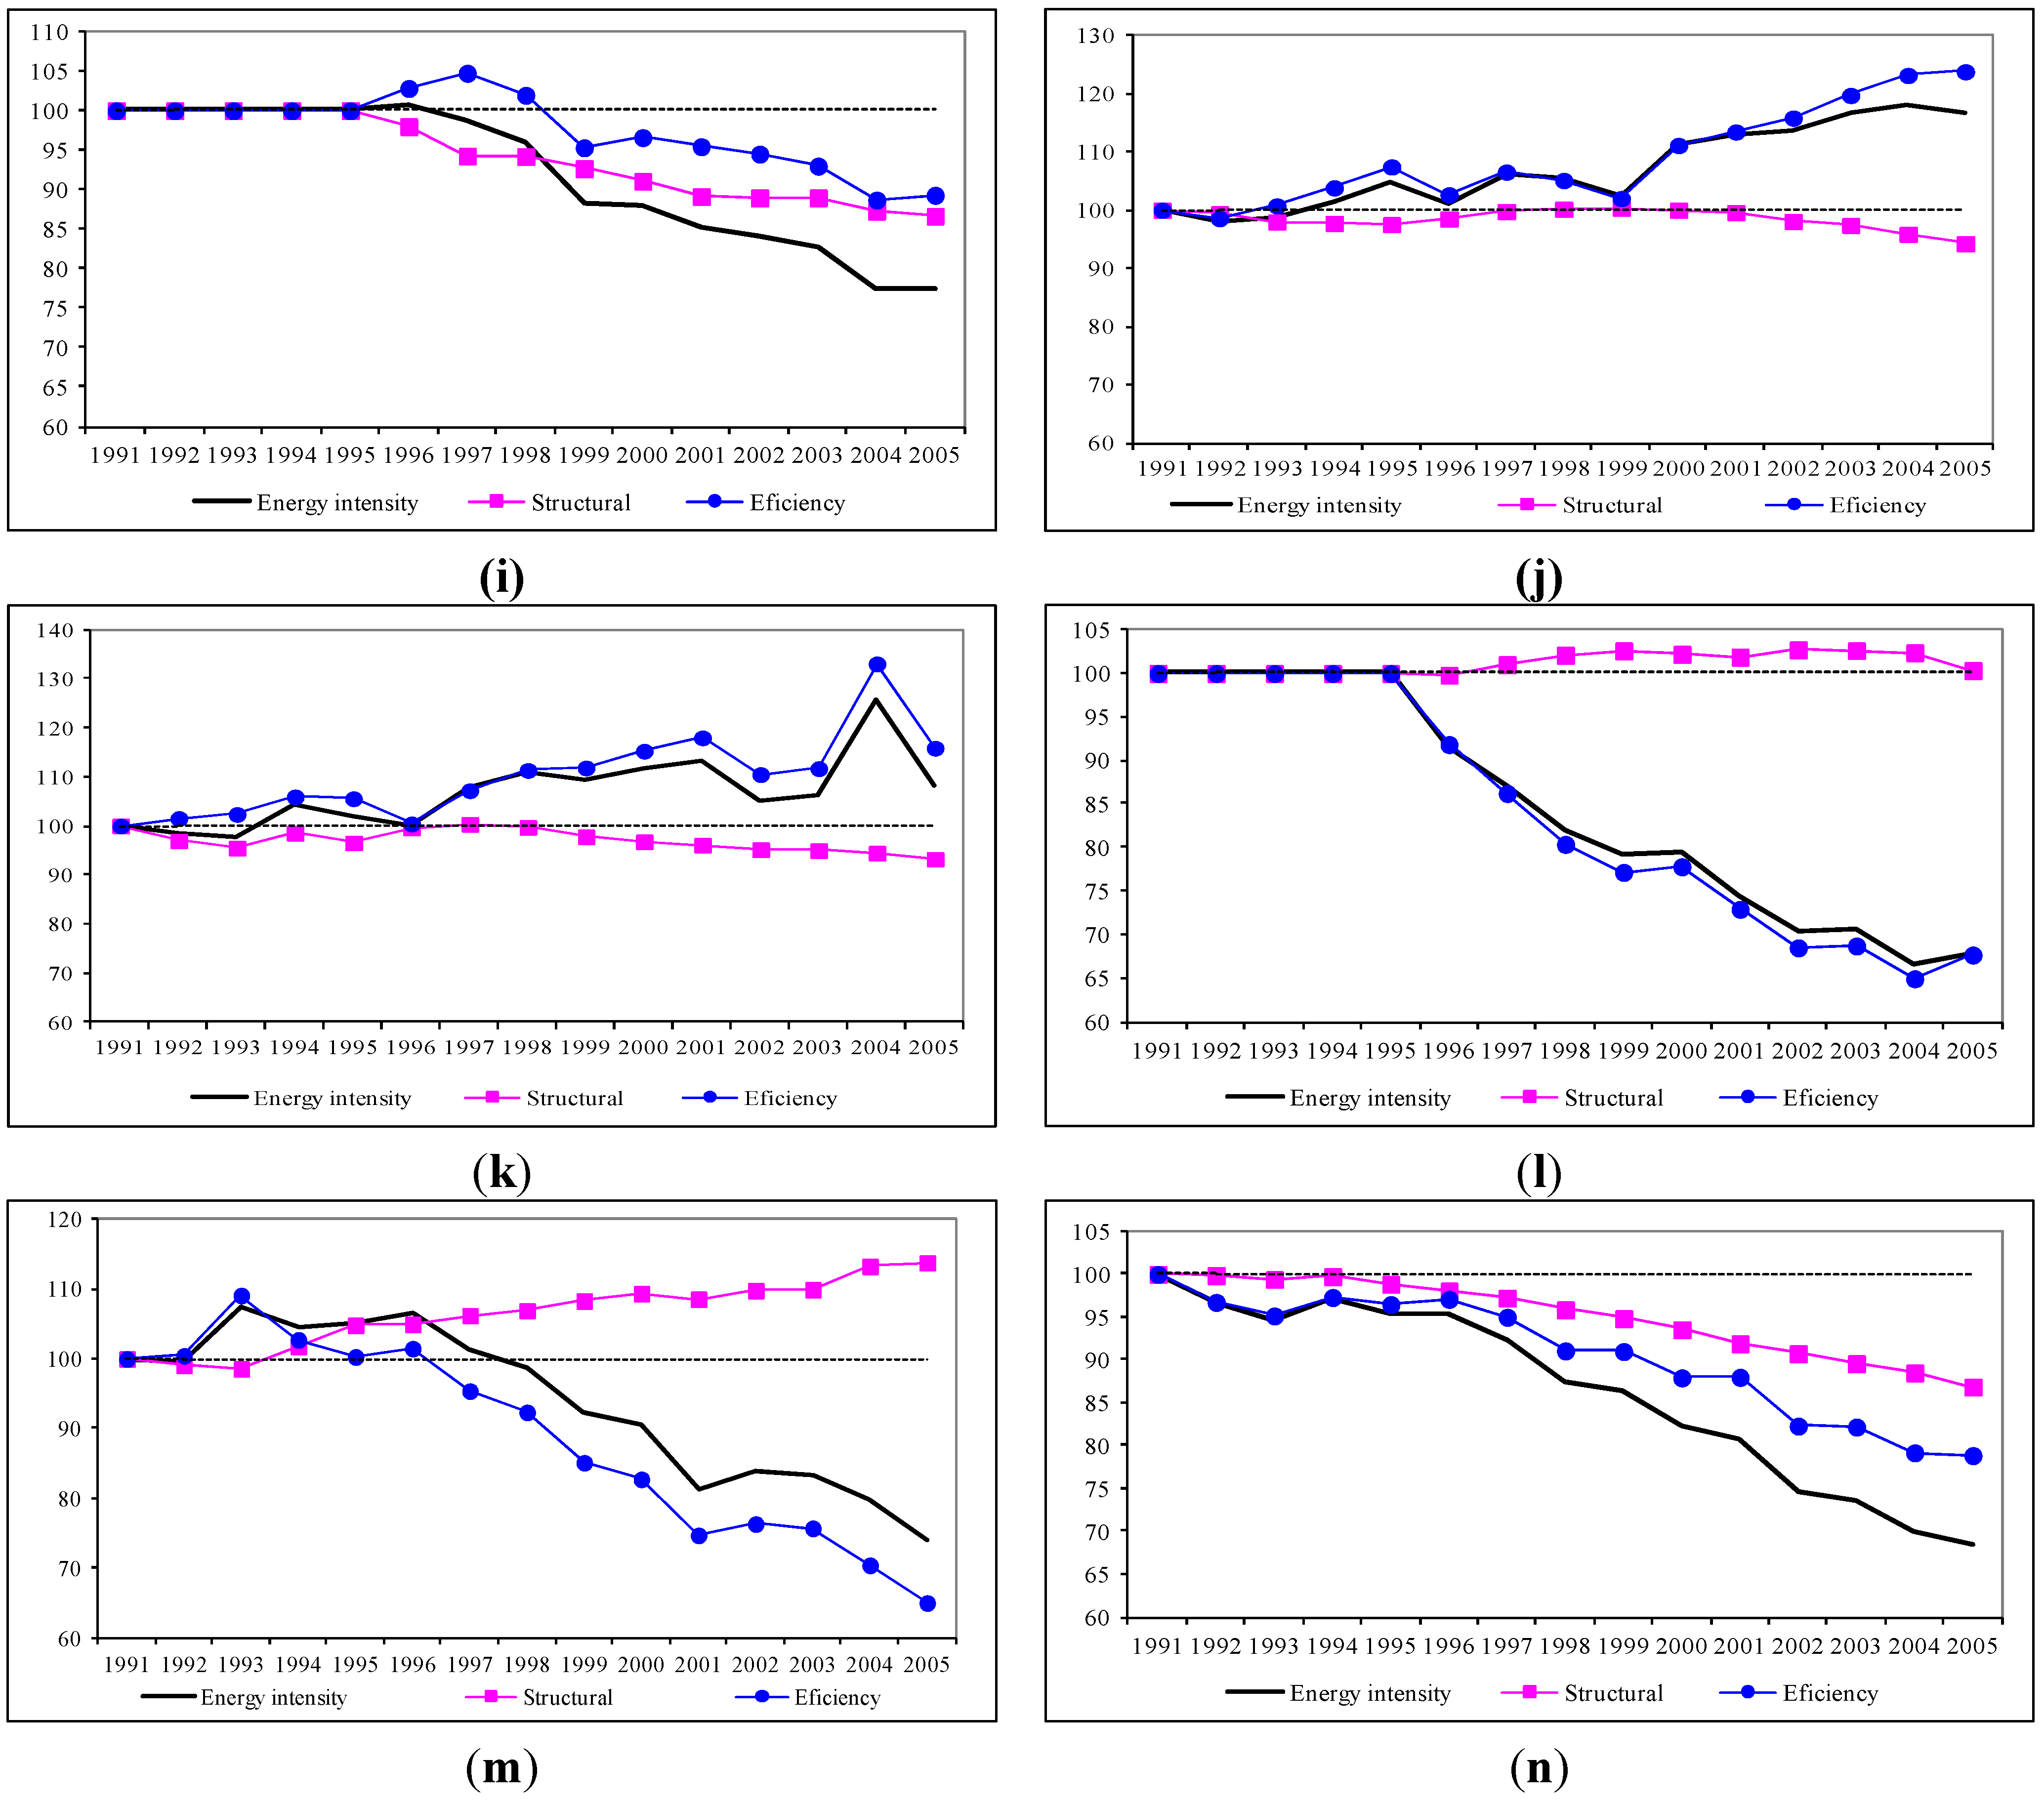
Figure 1 complements
Table 3 by showing, for each country, the change over time of the energy intensity indices (set to base 100 at the start of the period) and the estimates of the two components.
Based on these results, the countries can be categorized into the four groups, arranged by their behavior profiles. One group includes Belgium, Germany, the Netherlands and the United Kingdom. Greece and France could also be included in this group, though fewer data are available for these countries. The second group would encompass the Scandinavian countries: Finland, Sweden and Denmark. The third group is unique in that it only has Ireland. Lastly, the fourth group contains Austria, Italy, Portugal and Spain.
All the countries in the first group experienced a considerable reduction in EI: 1.5% annual in Belgium, 2.5% in Germany, 1.8% in the Netherlands, 2.7% in the United Kingdom, 1.8% in Greece and 1.8% in France. They are also characterized by having both their structural and efficiency components contribute positively to this achievement. The efficiency component is more prominent, however, contributing an average of 75% versus the 25% for the structural component.
Figure 1.
Final Energy Intensity (TOE/thousands Euro) decomposition in activity sectors in EU15 excluding transports and households: 1991–2005. (a) Austria; (b) Belgium; (c) Denmark; (d) Germany; (e) Italy; (f) France; (g) Finland; (h) The Netherlands; (i) Greece; (j) Spain; (k) Portugal; (l) Ireland; (m) Sweden; (n) United Kingdom.
The EI also fell in the second group of countries (Finland, Sweden and Denmark): 0.7% annual in Finland, 2.1% in Sweden and 2.2% in Denmark. Sweden and Denmark are among the countries whose EI decreased the most, while Finland is in the group with the lowest drop. Nevertheless, they are classified in the same group because these countries exhibited the most uneven changes in their components: the structural component contributed to increase aggregate IE, while the efficiency component did the opposite by a higher amount. Among those countries whose EI decreased, the Irish case is noteworthy due to its peculiar behavior. From 1995 to 2005, its EI decreased by 3.9% annually, the largest rate of all the countries analyzed. Moreover, this change was due entirely to improvements in the efficiency component.
Lastly, we consider the group of countries whose EI grew: Austria (0.23% annual), Italy (0.35%), Portugal (0.55%) and Spain (1.10%). There are certain differences within this group also. The upturn in Italy occurred at the end of the period, while in Austria the increase was small and also at the end. In general, the EI trend in Austria was very stable and near its 1991 value. Portugal and Spain are the two countries which experienced a greater growth in EI. In both cases, the structural component contributed positively to reducing EI, meaning the decrease resulted from a worse use of energy as compared to the production increases in the activity sectors considered. The Portuguese and Spanish economies differ from the remaining EU members both due to the increase in EI and to the deterioration of the energy efficiency component.
In comparing the changes in EI by sub-periods, we see that for the first three groups of countries in question, the gains in energy efficiency were particularly significant after the signing of the Kyoto accord, which highlights the commitment of these countries to comply with the protocol’s objectives and also places them in an advantageous position in any future emissions market. A common trend emerges in the cases of Belgium, Finland and Sweden. The EI in these countries grew at rates of 0.1%, 1.0% and 1.3%, respectively, from 1991 to 1996, while drops of 2.4%, 1.7% and 4.0%, respectively, were recorded between 1997 and 2005.The differences in the rates of change were also striking in the Netherlands and the United Kingdom. The EI in the Netherlands fell 0.7% between 1991 and 1997, and 2.4% thereafter, while in the United Kingdom the drops were 1% and 3.7% for the same periods. Finally, we note the case of Germany, where the decrease remained steady throughout the period: 2.4% before 1997 and 2.6% from then until 2005.
The increases in EI were larger in the post-Kyoto period among the countries of the fourth group. Between 1991 and 2006, according to our estimates, EI went up by 0.1% in Austria, fell by 0.3% in Italy, remained stable in Portugal and grew by 0.2% in Spain. In the post-Kyoto period, for these same countries, the annual increases were 0.3%, 0.7%. 0.9% and 1.6%, respectively.
4. Analysis of Results: The Relative Importance of Certain Activity Sectors
In this section we provide a more detailed analysis of the previous section’s results. Although we use a very simple statistic methodology, we can identify some key factors and their influence on the changes in each of the EI components. For example, we find strong evidence confirming that the tertiarization process can explain the trend of the structural component. However, this process does not appear to be related with the trend of the efficiency component. Indeed, the worsen evolution of the efficiency component in southern EU countries seems to be related to a process of convergence of the EI in the service sector. While we find strong significant evidences of EI convergence in the service sector, this evidence is null for the industry. This analysis also allows us to identify the bases for future research into the study of these determinants of EI within the EU nations.
Based on the results, we can highlight certain common trends to all countries. First of all, the relevance of the services sector became more important over the time period analyzed, to the detriment of industry, agriculture and construction, which are, in that order, the most intensive energy users. We can also state that, on average,
EI in the EU15 improved for agriculture and industry, while it worsened for services and construction as found by [
9] for OECD countries between 1970–2005.
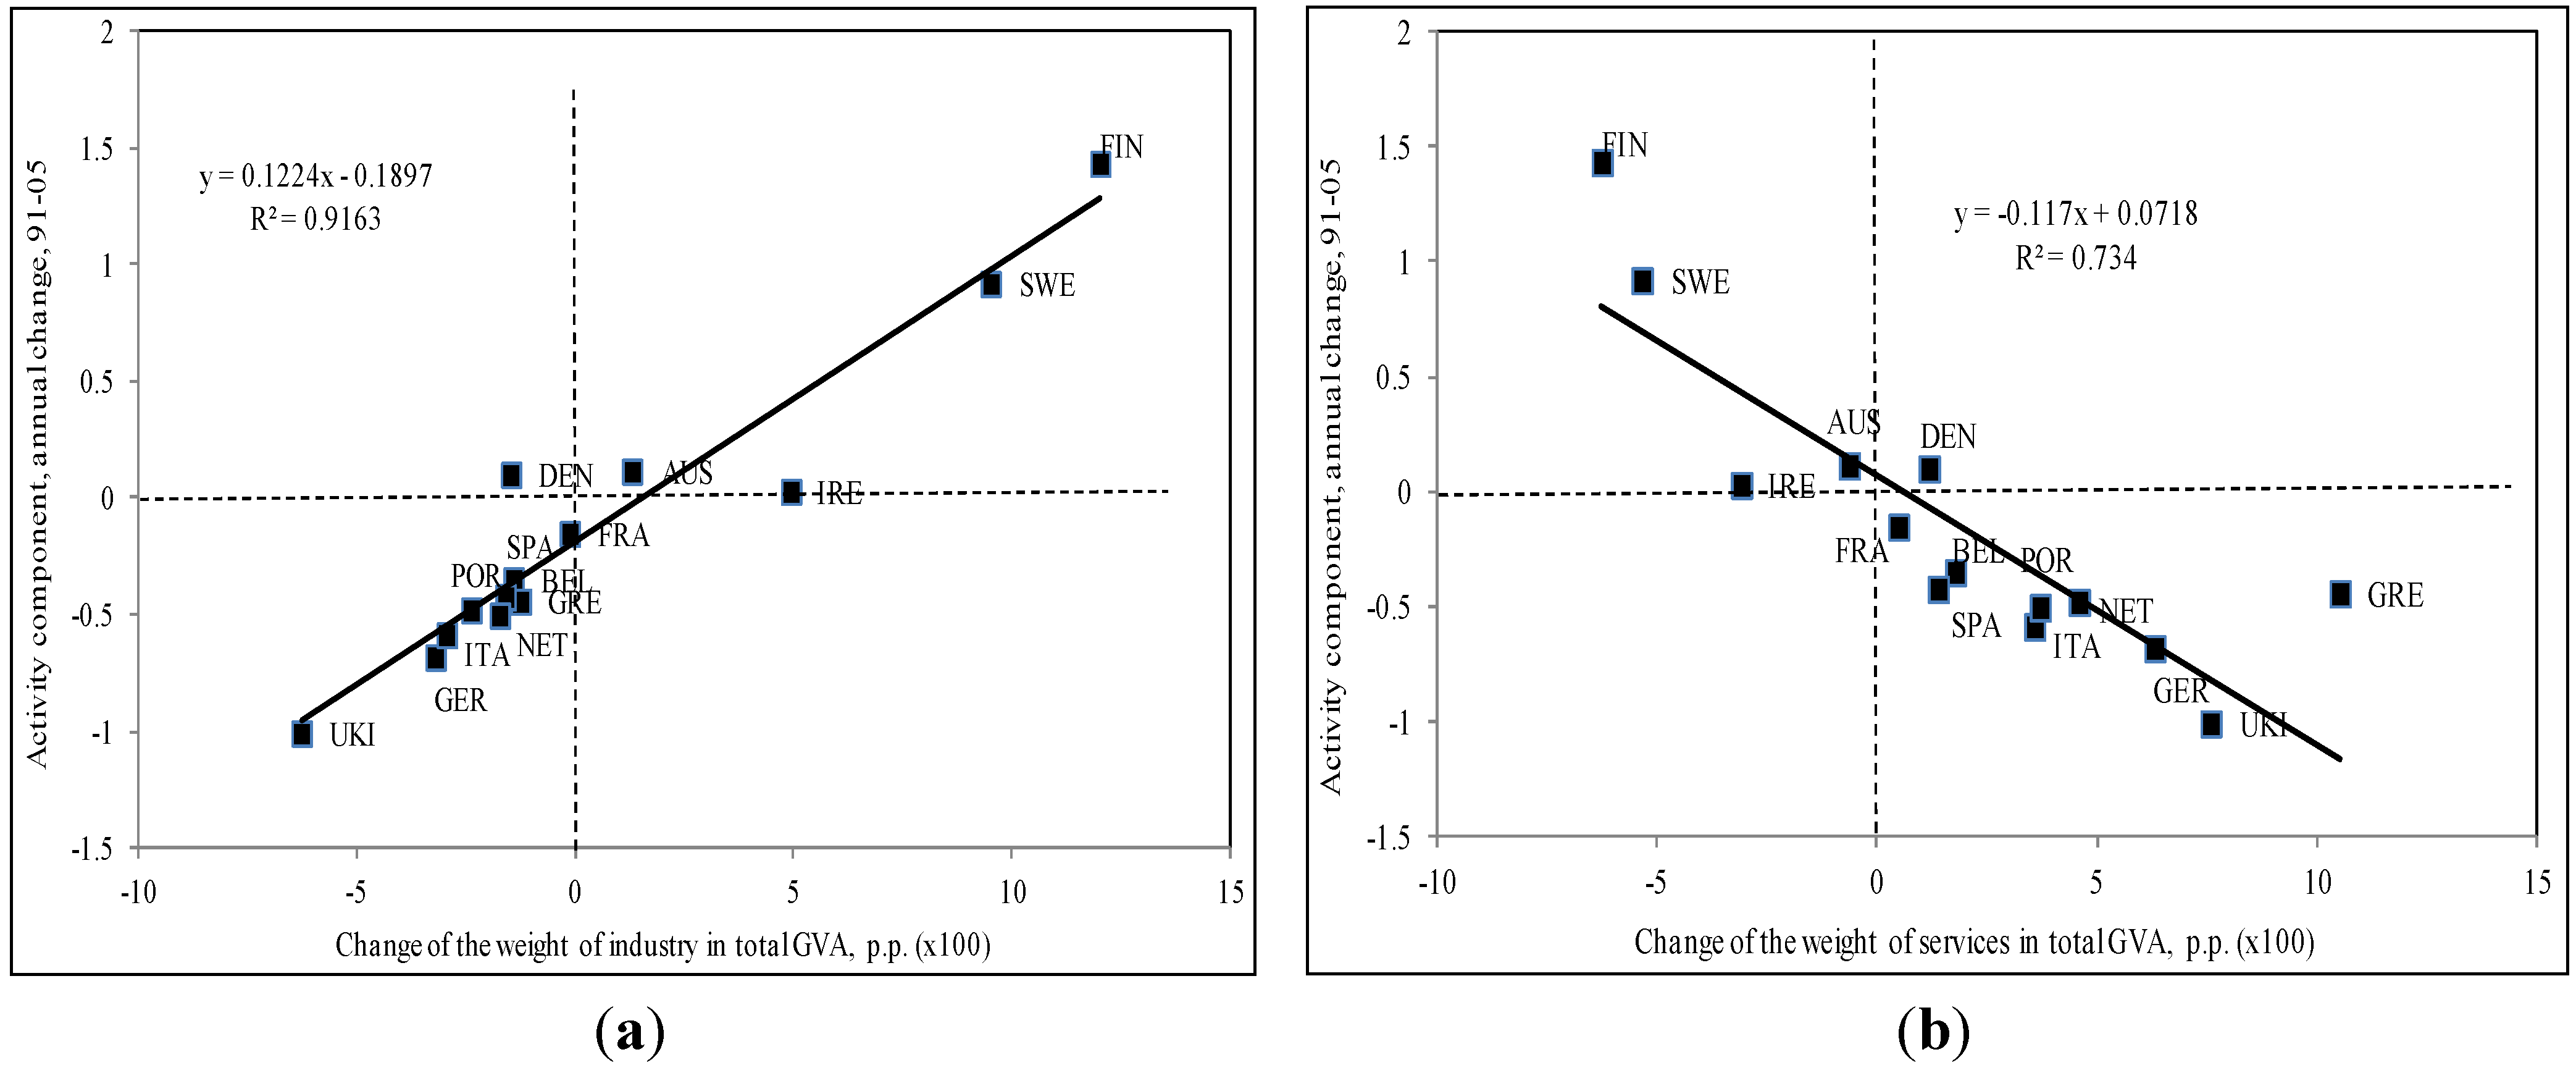
Since the sum of the GVA of industry and services accounts for more than 80% of the total in most EU15 countries, it would be reasonable to expect the EI structural component to depend, to a large extent, on the activity changes in these two sectors. To illustrate this point, we will do a simple exercise. Let us take all the countries in the time period analyzed and measure the relationship that exists between the annual variations in the structural and efficiency components with respect to the changes in the weights of the GVA for the services and industrial sectors as a whole. Each figure makes pair wise comparisons between the variables of interest. It also shows the estimated regression line and the linear correlation coefficient.
Figure 2 show the relationship that exists between the annual variations in the structural component and the changes in the weight of the GVA for the industrial and services sectors, respectively. In both cases the correlation is significant and, as one would expect, positive in the case of industry and negative in the case of services. Moreover, the magnitudes of the slopes in the estimated regressions are practically identical: the estimates are 0.1223 for industry and −0.1217 for services. This shows that the changes in the
EI structural component are due in large part to a transformation process in which the importance of industry in a country’s total economic activity drops, while that of services increases. As we have emphasized in the Introduction, this is a common finding in the literature.
Figure 2.
(a) Structural component and the GVA in the industry sector; (b) Structural component and the GVA in the service sector.
Figure 2.
(a) Structural component and the GVA in the industry sector; (b) Structural component and the GVA in the service sector.
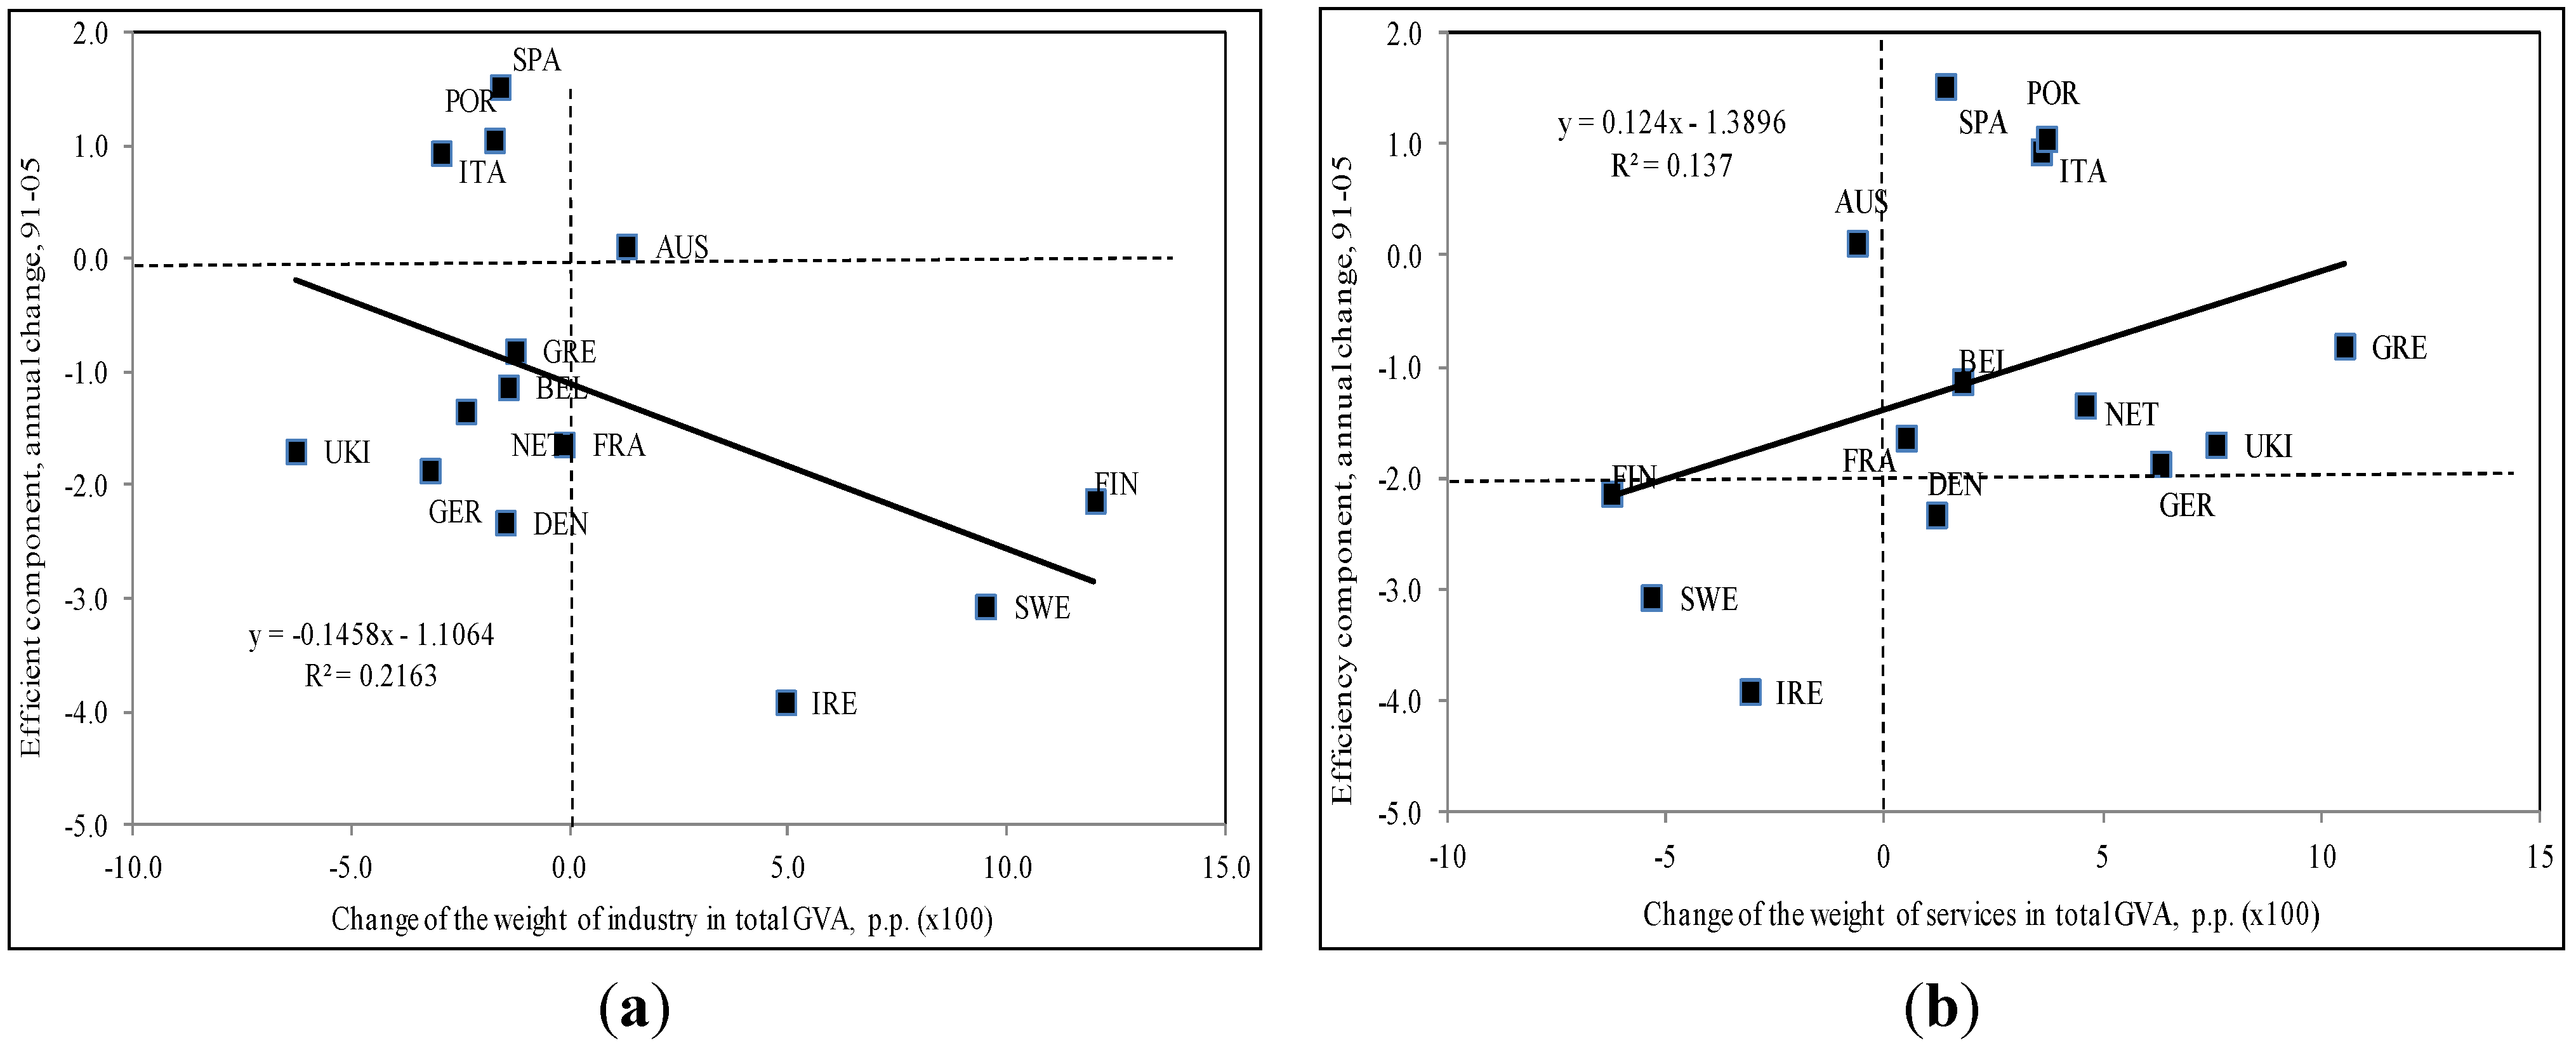
However, this well-defined relationship that is seen for the changes in the structure of a country’s GVA disappears when instead of looking at the structural component we focus on the efficiency component.
Figure 3 show graphs similar to those in
Figure 2a,b but in which the efficiency component is considered instead of that of structure.
Results are now very different, both in the significance as well as in the sign of the relationship. In both cases, the significance is very low, as evidenced by the high dispersion in the scatter plot around the regression line. This is a clear indicative that the changes in the efficiency component do not appear to be related with the fact that most European economies are undergoing a tertiarization process.
Just as the relationship between a greater weight for the services and the structural component was expected, this second fact is not as obvious beforehand. If the services sector had surpassed the industrial sector in energy efficiency gains, the results of
Figure 3a,bwould be similar, at least qualitatively, to those of
Figure 2a,b. But our results imply that this fact seems not to be the case in the EU15 between 1991 and 2005. It does not appear as though the services sector resulted in a more efficient use of final energy. What could be behind the evolution of energy intensity in the service sector?
Figure 3.
(a) Efficiency component and the GVA in the industry sector; (b) Efficiency component and the GVA in the service sector.
Figure 3.
(a) Efficiency component and the GVA in the industry sector; (b) Efficiency component and the GVA in the service sector.
One possible explanation of this lack of gain in energy efficiency in the service sector is its little foreign competition, which contrasts with the high degree of competition in the industry between European countries. However, a complementary explanation is that countries started (by 1990) with lower levels of
EI in the service sector have experienced faster posterior growth of this variable (between 1990 and 2005). That is, there should be evidence of absolute convergence in
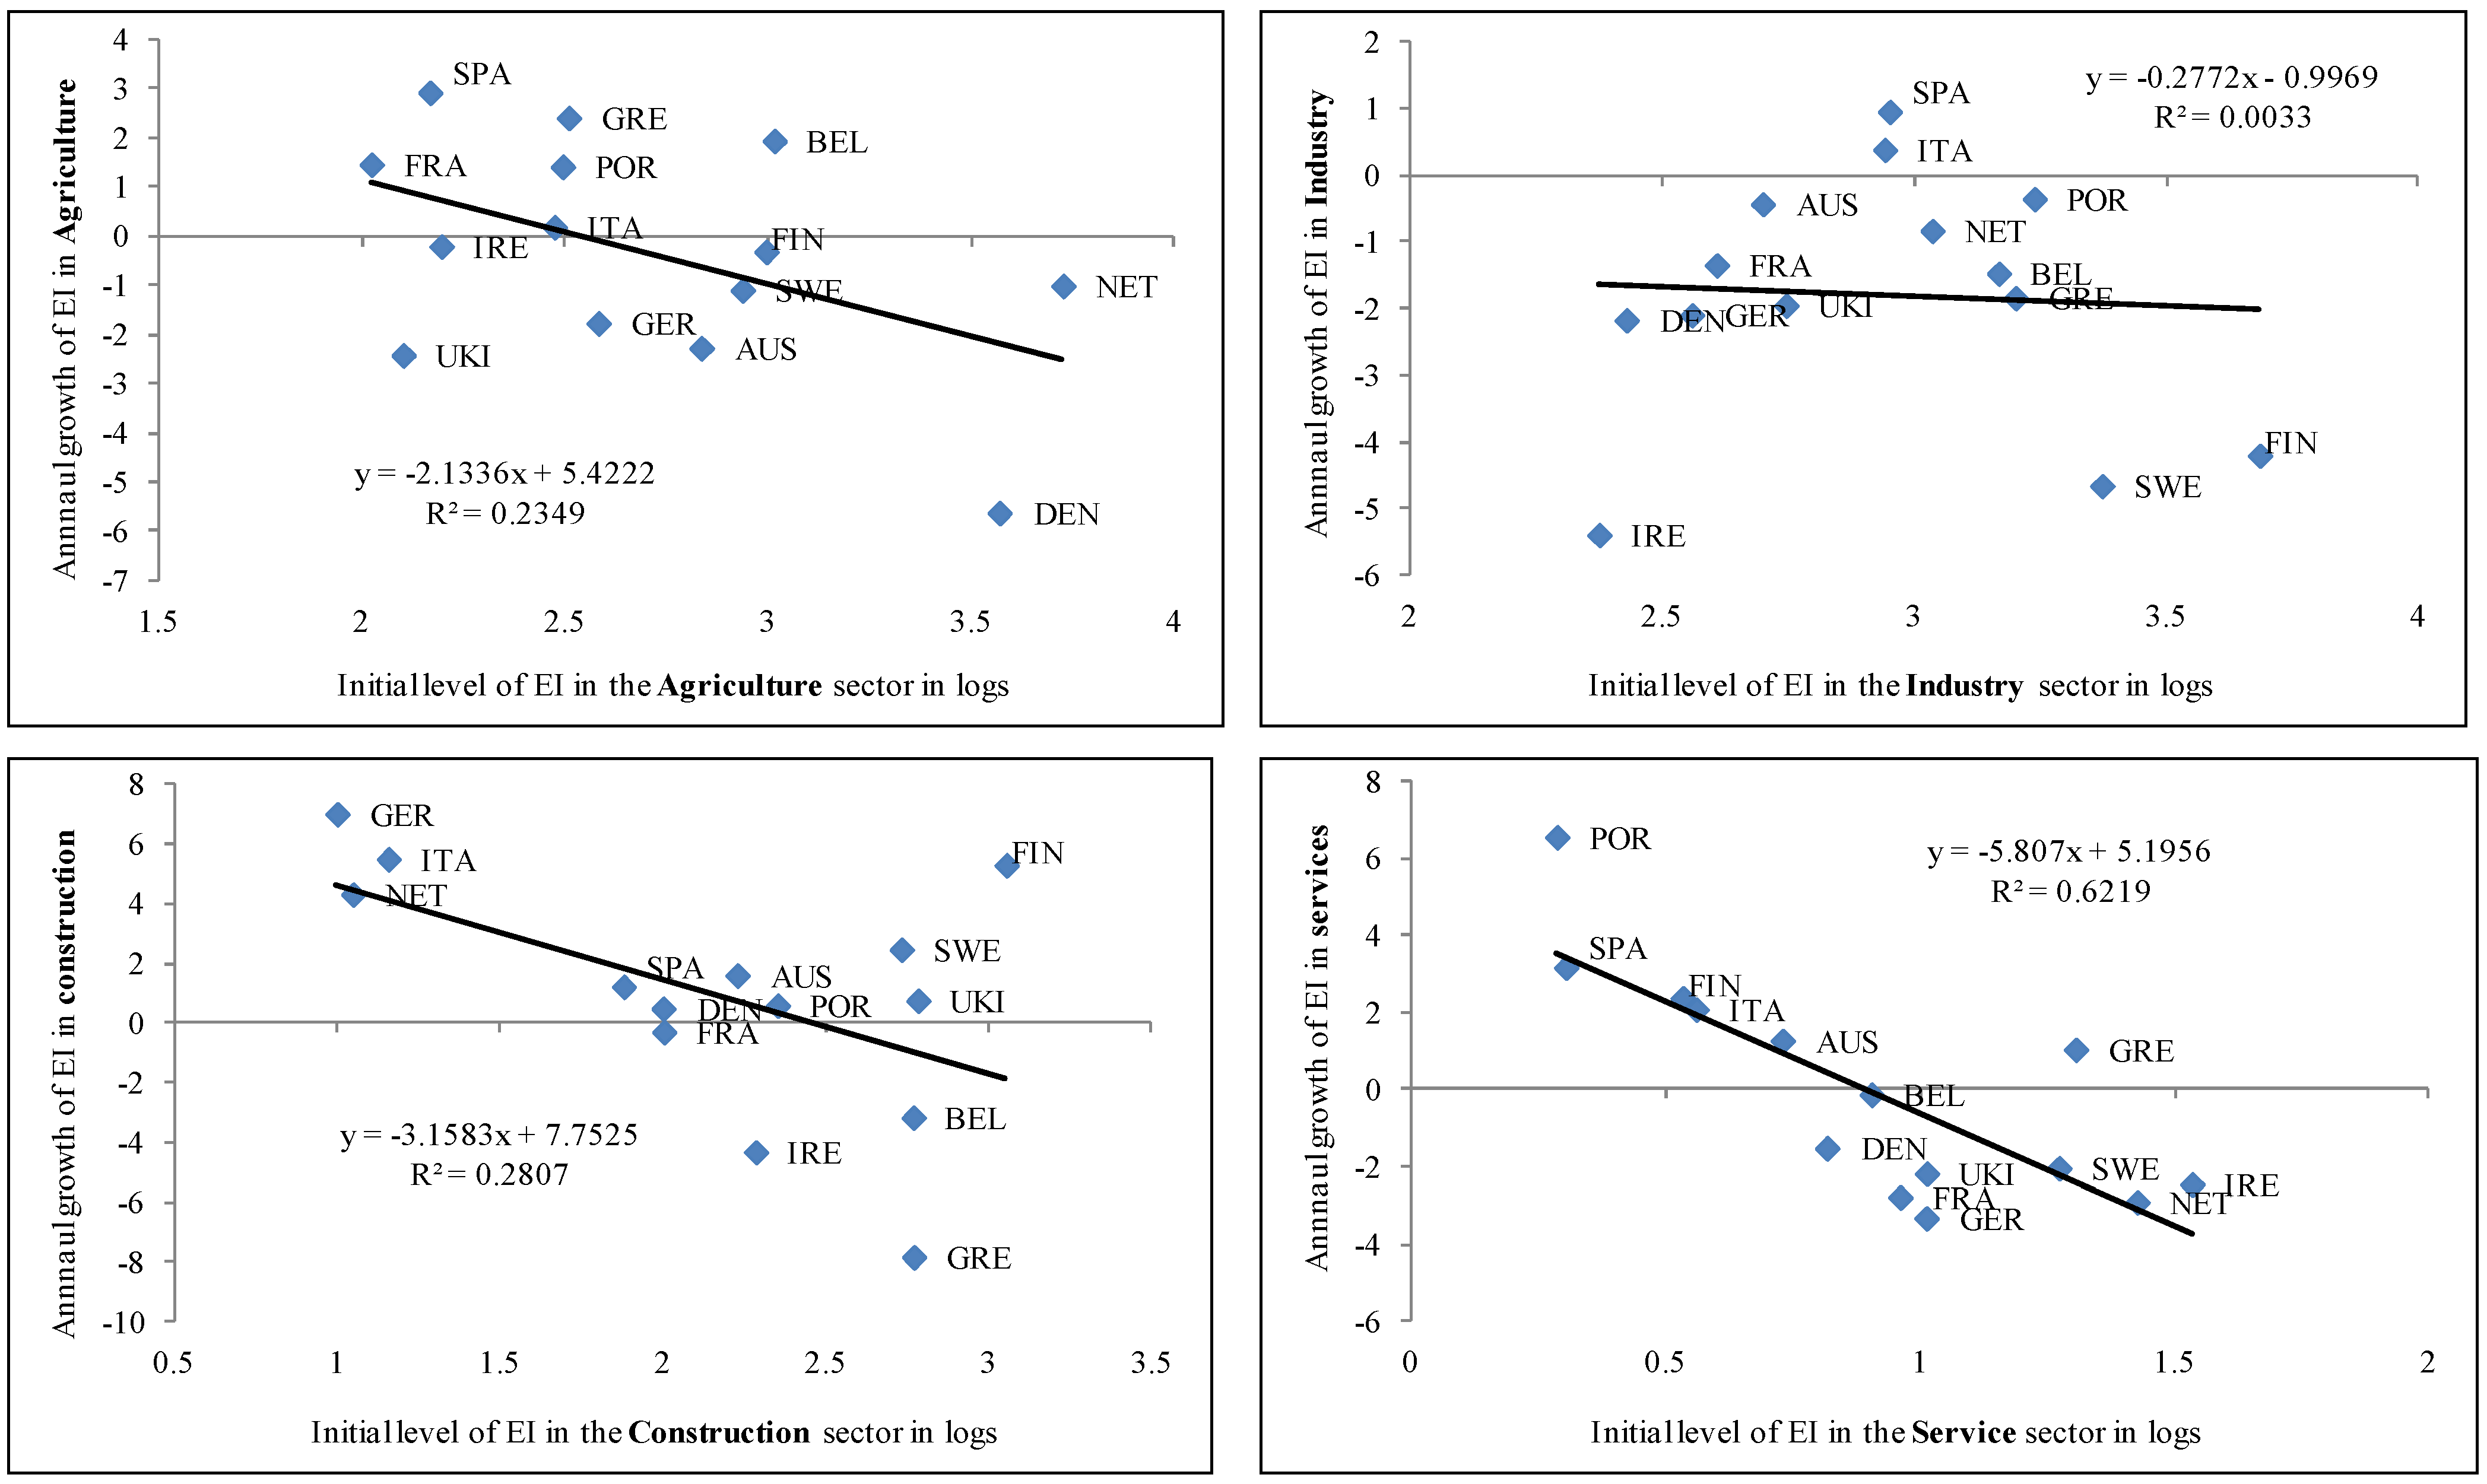
EI at least in the service sector. To test this hypothesis,
Figure 4 shows, for each sector, the scatter plot between the initial levels of
EI (the x-axes) and the
EI annual growth for the whole period (the y-axes). A negative slope in this relationship would be a clear symptom of absolute convergence. This negative relationship is precisely found for agriculture, construction but particularly for the service sector, while no negative relationship is found for the industry. These convergence results agree with those found by [
9] for 18 OECD countries in the 1970–2005 period.
This significant evidence of convergence for
EI in the service sector would help to understand the recent worsen evolution of
EI in this sector (and of overall
EI) of Southern European countries. Throughout the nineties and until the arrival of the recent crisis, the southern European economies experienced a large increase in their living standards. Among other things, this has been reflected in a very large renovation of hotel facilities and a massive shift of many offices and buildings associated with the service sector, which has resulted in higher levels of comfort (heating and cooling use) and thus higher energy consumption. Precisely, the report “Europe Building under the Microscope” [
27] emphasizes the important gains in energy consumption that can be achieved with appropriate energy efficiency measures in the construction of buildings. One target of this report is to encourage a wider debate on how stakeholders in the building sector can collaborate to transform the European building stock into a highly efficient living and working environment which enables society to become more sustainable. This analysis and debate can also be applied to energy consumption in the residential sector, but this sector is not studied in this article. As for the case of the transport sector, it deserves a particular analysis that goes beyond the scope of this paper. This transformation process would have not been apparent in most of richer EU countries because these comfort levels were already assured since the seventies. Summing up, the largest increase in the intensity in the service sector in the southern European countries could be explained, at least in part, as the result of a process of convergence.
Figure 4.
The relationship between EI changes and initial levels in activity sectors in EU15.
Figure 4.
The relationship between EI changes and initial levels in activity sectors in EU15.
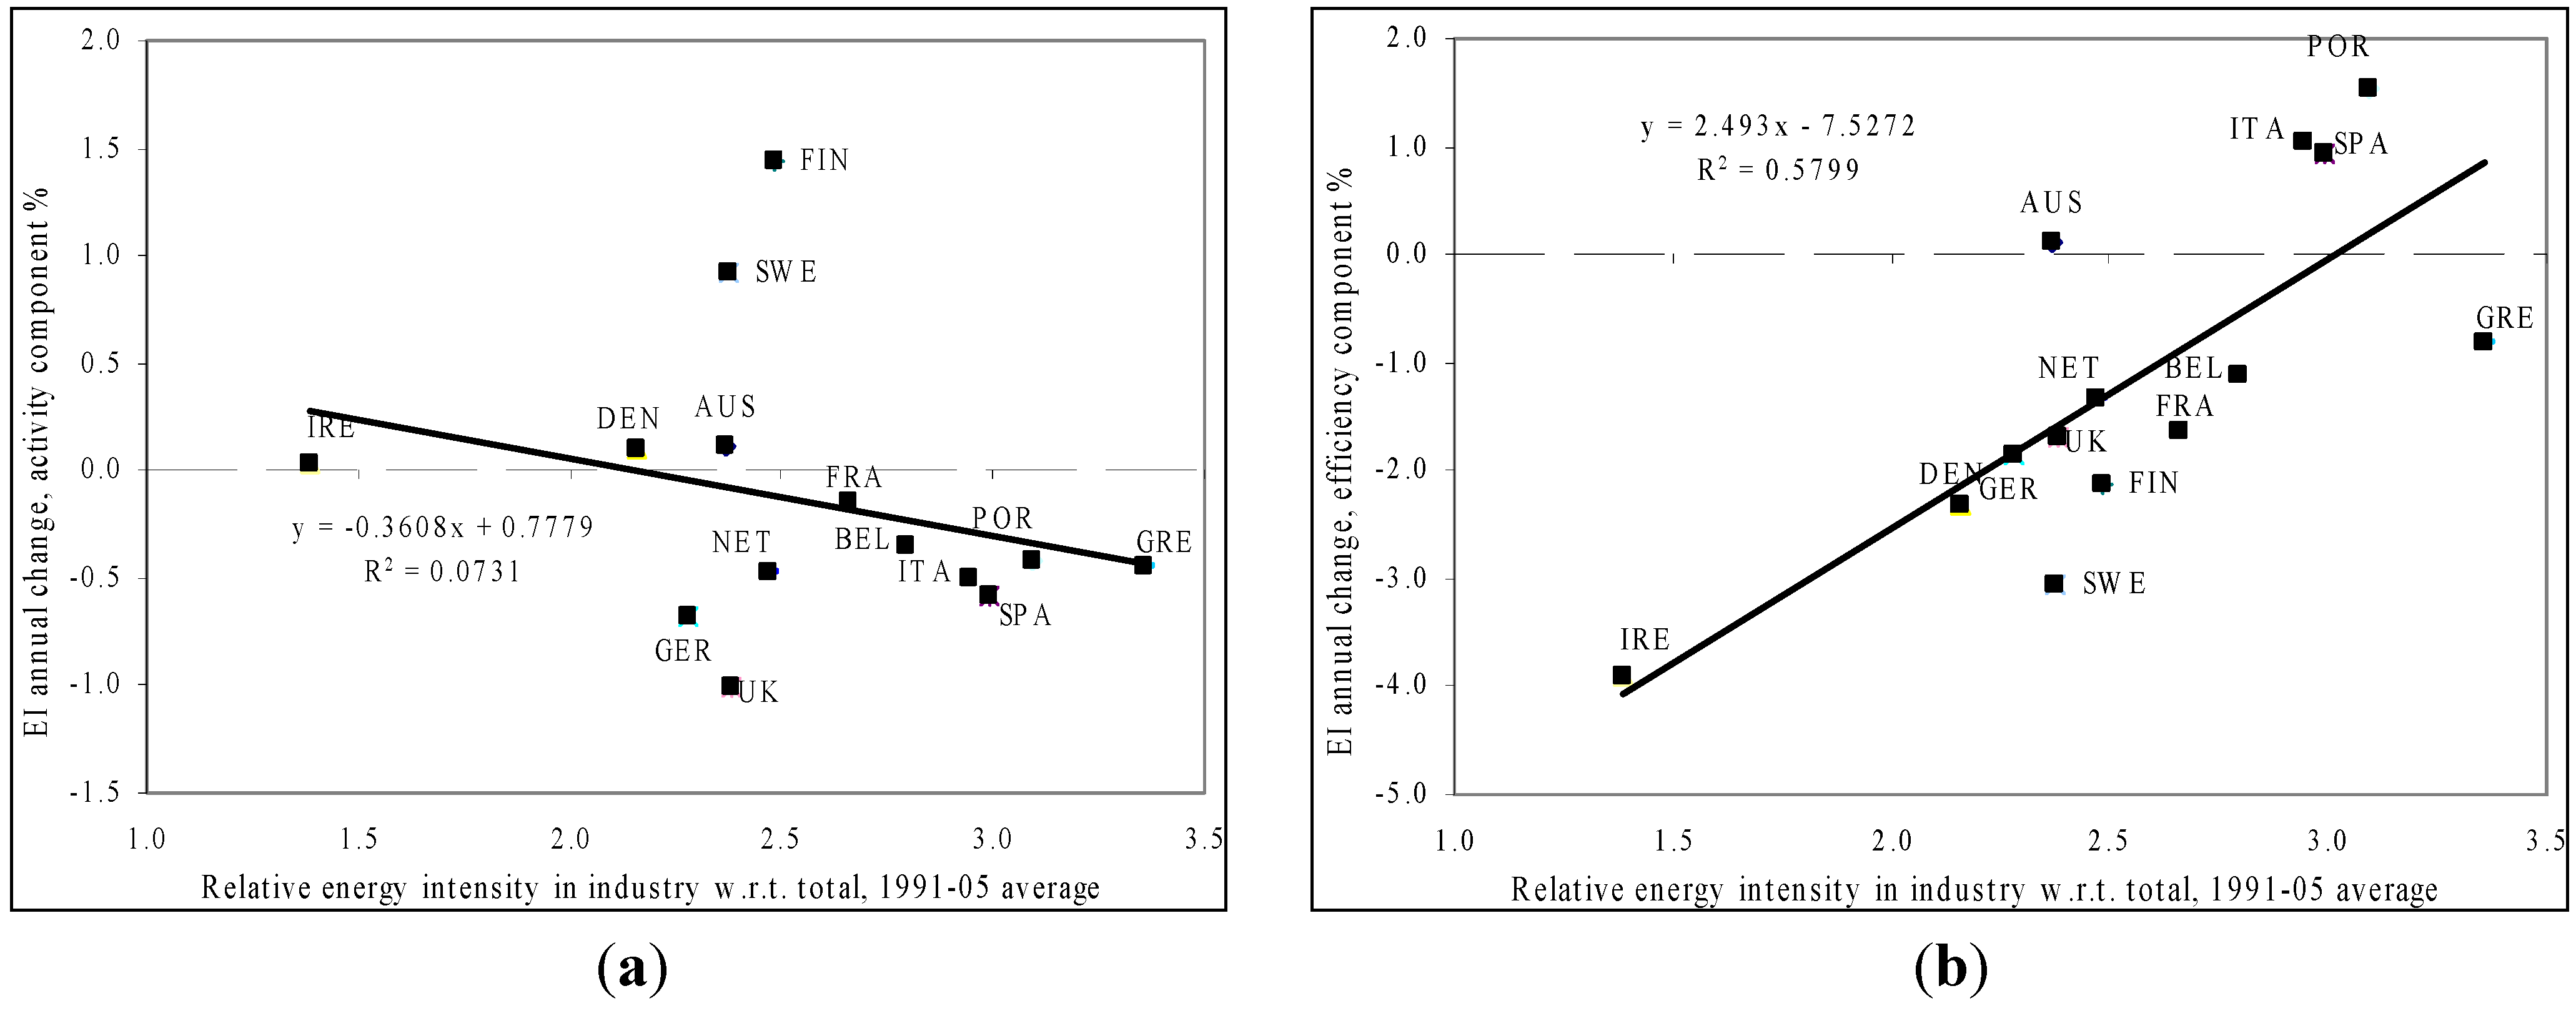
The trend in industry, however, cannot be explained by a process of convergence. Thus, an alternative explanation to the
EI evolution in the industry is that while some countries have changed and renewed its industry towards a more energy-efficient industry (
i.e., TIC industries), some others have not. Thus, the size of the energy intensity in the industry could be influencing the global energy efficiency of the countries analyzed. To look for evidences in favor of this argument, we consider the changes in the structural and efficiency components with respect to the industry-specific
EI index (on average and in relative terms to the remaining sectors). The results are shown in
Figures 5a,b, respectively.
Figure 5a does not reveal a significant correlation, while
Figure 5b clearly shows that the energy efficient component in those countries with an energy-intensive industry exhibited worse behavior. In this sense, those countries that still have very energy-intensive industries (such as metal, iron and steel, cement,
etc.), even if their importance is reduced relative to the services sector, had a difficult time improving their energy efficiency, and it may even have worsened. The gains in energy efficiency may be realized through the renovation of each country’s industrial sector. Studies on the change in
EI in industry by sub-activity can be of great interest to gain more insight into these issues, since changes in the efficiency component could be partially due to changes in activity within the own industry.
Figure 5.
(a) Structural component and the Energy Intensity in the industry; (b) Efficiency component and the Energy Intensity in the industry.
Figure 5.
(a) Structural component and the Energy Intensity in the industry; (b) Efficiency component and the Energy Intensity in the industry.
Finally, we must emphasize that the evolution of both sectors (the industry and the services) can be interrelated. Thus, that the changes in the efficiency component do not appear to be related with the tertiarization process can be related with those works of [
28,
29]. These works highlight that a shift to a service-oriented economy entails a decrease in energy and emissions intensity per unit of GDP, but an increase in overall energy/emissions in absolute terms. The intensive growth and diversification of the service activities could imply an indirect rapid increase in some industrial processes as well as in the energy costs in the provision of the services. To properly understand this relationship, a detailed input-output analysis that interconnects the service sector and the industry would be needed. But this study goes beyond the scope of this paper. Taking into account all these facts related to the tertiarization process is a key issue to properly design an effective energy and climate change policy.
5. Summary and Energy Policy Implications
This paper studies the change in EI for the EU15 countries (except Luxembourg) and for the main economic sectors (industry, construction, services and primary), which represents approximately 45% of final energy consumption. The objective is to measure, first, the different behaviors in countries by establishing differentiated typologies. This type of comparison is not very common in the literature. Second, we analyze the reasons that explain the different trends by country. To achieve this goal, the changes in EI are decomposed into a structural and efficiency component for the countries in question for the period from 1991–2005.
Based on the results obtained from the decomposition, the countries are classified into various groups. First are the countries which have reduced their EI thanks to an improvement in both the structural and efficiency components. These countries are Belgium, Germany, France, the Netherlands, Greece and the United Kingdom. These reductions were particularly noteworthy between 1997 and 2005, after the signing of the Kyoto accord. The second group of countries includes the Scandinavian states, Denmark, Sweden and Finland. In these countries industry gained prominence at the expense of services which, in principle, does not contribute to a reduction in EI. Despite this, advances in energy-technological efficiency offset the deterioration caused by the structural change.
As for Ireland, since 1995 it has recorded the largest drops in EI, these drops coming exclusively as a result of improvements in the efficiency of its industrial base. Finally there are those countries whose EI increased: Austria, Italy, Portugal and Spain. The first two kept an almost constant value over the entire period, only increasing toward the end, possibly due to the crisis experienced in these countries at the start of this century. As for Portugal and Spain, especially the latter, these were the only two countries in the EU15 whose EI grew steadily from 1991 to 2005. Moreover, the increases were more pronounced between 1997 and 2005, after the signing of the Kyoto accord.
Using a very simple statistic methodology, we have identified some key factors and their influence on the changes in each of the EI components. Changes in the structural component are due mainly to a transformative process in which the importance of industry in the economy as a whole drops, while the opposite happens for services. However, changes in the efficiency component do not seem to be linked to this same process. The growth of the services sector, possibly due to its high heterogeneity and lower degree of competition from abroad, did not result in a more efficient use of final energy. Moreover, we have detected significant evidence of convergence for EI in the service sector that would help to understand the recent worsen evolution of energy efficiency (and overall EI) of Southern European countries. The behavior of industry, however, does appear to be the predominant factor in the evolution of the EI efficiency component for the countries analyzed. While we find strong significant evidences of EI convergence in the service sector, this evidence is null for the industry. Thus, one explanation to the EI evolution in the industry is that while some countries have changed and renewed its industry towards a more energy-efficient industry, some others have not.
The results of this work serve to highlight the usefulness of this type of research in identifying behavior patterns among countries. Considering the change in the global EI without distinguishing between its components could lead to erroneous findings and to inadequately conceived energy policies. For example, the tertiarization process of the economy would tend to reduce energy intensity by improving the structural component, but not necessarily would improve the efficiency component. In fact, our evidence suggests otherwise. In this regard, we believe that increasing competition in the services sector at European level would help improve efficiency in the sector, as seems to have happened in the industrial sector in most countries.
This analysis also allows us to detect the bases for future research into the study of these determinants of
EI within the EU nations. Further extensions of our analysis would serve policy makers to identify the explanatory causes behind final energy consumption. In this sense, it is very important to identify those economic activities that, due to their impact, are essential to reducing energy consumption, as well as potential strategies and measures for improving the efficiency of final energy use. But, in order to obtain more precise knowledge of the efficiency of energy end uses for sub-activities, we need detailed energy consumption databases. However, a detailed breakdown of data does not seem to be available for the services sector, which is one of the main engines of global economic activity. As [
30] points out, the service sector is the most heterogeneous sector of the economy, made up of many small energy consumers. Thus, statistical assessment of this sector is complex and varies according to country. These characteristics explain why there has been a lack of investigation in this sector. However, rapid growth in service sector energy consumption makes it necessary to attain a more thorough understanding of this sector, particularly in the context of strengthening energy efficiency policies.
This lack of detail does not reveal what is happening with specific end-uses in such important sector. Moreover, as pointed out by [
28,
29], the relationship found between the service sector size and the evolution of the energy efficiency component might be partially explained by the increased demand of industrial components by the service sector. Thus, to properly identify the reasons behind the evolution of the energy efficiency component, we need to better understand the relationship between the industry and the service sectors, which is clearly an important challenge of energy and climate policy in developed countries. Finally, other promising extension of this paper is to take into account the fuel mix as the third component of
EI trend. This line of research requires disaggregated data for final consumption (by energy source) for each sector.

