Article

The Effect of Effluent Recirculation in a Semi-Continuous Two-Stage Anaerobic Digestion System

by
Solmaz Aslanzadeh
1,*,
Karthik Rajendran
1,
Azam Jeihanipour
2 and
Mohammad J. Taherzadeh
1
1
School of Engineering, University of Borås, Borås 501 90, Sweden
2
Department of Biotechnology, Faculty of Advanced Sciences and Technologies, University of Isfahan, Isfahan 81746-73441, Iran
*
Author to whom correspondence should be addressed.
Energies 2013, 6(6), 2966-2981; https://doi.org/10.3390/en6062966
Submission received: 5 May 2013 / Revised: 5 June 2013 / Accepted: 9 June 2013 / Published: 17 June 2013
(This article belongs to the Special Issue Biomass and Biofuels 2013)

Abstract

:
The effect of recirculation in increasing organic loading rate (OLR) and decreasing hydraulic retention time (HRT) in a semi-continuous two-stage anaerobic digestion system using stirred tank reactor (CSTR) and an upflow anaerobic sludge bed (UASB) was evaluated. Two-parallel processes were in operation for 100 days, one with recirculation (closed system) and the other without recirculation (open system). For this purpose, two structurally different carbohydrate-based substrates were used; starch and cotton. The digestion of starch and cotton in the closed system resulted in production of 91% and 80% of the theoretical methane yield during the first 60 days. In contrast, in the open system the methane yield was decreased to 82% and 56% of the theoretical value, for starch and cotton, respectively. The OLR could successfully be increased to 4 gVS/L/day for cotton and 10 gVS/L/day for starch. It is concluded that the recirculation supports the microorganisms for effective hydrolysis of polyhydrocarbons in CSTR and to preserve the nutrients in the system at higher OLRs, thereby improving the overall performance and stability of the process.

1. Introduction

Anaerobic digestion is gaining more attention nowadays, both as a solution to environmental concerns, and also as an energy resource for today’s energy-demanding life style [1]. Biogas is a product of anaerobic digestion processes, which is produced by a consortium of microorganisms. The anaerobic digestion process is highly dependent on a variety of different factors such as pH, temperature, HRT, carbon to nitrogen ratio, etc., [2,3,4]. However, the anaerobic degradation process is a quite slow and sensitive process, which is highly affected by environmental stress and alterations in operating conditions [5], that would lead to a disturbance of the balance in the microbial community. The consequence of this imbalance is usually process failure. Stability of an anaerobic process, especially in an industrial scale, is thus a vital factor for evaluation [6].
The microbial community in an anaerobic digestion comprise of fermentative, acetogenic and methanogenic microorganisms. In general, methanogens have slower growth rates compared to hydrolytic and acetogenic organisms, and are more sensitive to environmental stress. Efficient anaerobic digestion requires the development and maintenance of a large, stable and viable population of methane-forming microorganisms [5]. The most common reactor configuration used for anaerobic digestion is the continuously stirred tank reactor (CSTR), in which the active biomass is constantly removed from the system. These conventional systems usually have long retention times. This drawback has been overcome using a high rate system, which is basically based on immobilization of the active biomass which enables short retention times. It is because the sludge retention time is more or less independent of the hydraulic retention time [7,8,9]. The microorganisms in the upflow anaerobic sludge blanket (UASB) reactors are kept in the reactor by their ability to flocculate and produce granules and thereby give the sludge good settling properties [9,10,11].
Two-stage anaerobic digestion process is considered to be effective when the rate limiting step in the process is hydrolysis and liquefaction [12]. It consists of two separate reactors; one for hydrolysis/acidogenesis and one for acetogenesis/methanogenesis. This physical separation makes it possible to overcome the problem of the differences in the optimum conditions of the microorganisms’ activity and their growth kinetics [12] by optimizing conditions that are favorable to the growth of each group of microorganisms in each reactor, such as short HRT and low pH for acid formers, which is inhibitory for methanogens [13]. This type of phase separation would increase the stability of the process, which is not possible in a conventional anaerobic process, where these two groups of microorganisms are kept together in a single phase in a delicate balance [14]. Ever since the phase separation was introduced into anaerobic digestion technology in 1970s, a significant number of papers and reports have been published on the benefits of treating a variety of wastes at mesophilic as well as thermophilic conditions such as treating fruits and vegetables [15,16], urban wastewaters [17], industrial wastes [18], grass [19], coffee pulp juice [20], food wastes [21], cane-molasses alcohol stillage [22], spent tea leaves [23], dairy wastewater [24,25,26,27], olive mill oil [28], and abattoir wastes [29]. However, two-stage digestion processes have been used for treatment of wastes with very low solid content [30,31,32,33]. The drawback of UASB is that this technology is not able to handle high solid content [34]. Apart from this, data concerning the optimization of operating conditions, operation and performance of two-phase configuration are inadequate as well. There is a lack of investigations on how effluent recycling affects the two stage process with high solid content and high organic loading rate [35].
This paper investigates the effect of the effluent recirculation in a high rate semi-continuous two stage anaerobic process using carbohydrate-based starch and cotton as substrate with high solid content at various organic loading rates and hydraulic retention times.

2. Materials and Methods

2.1. Materials and Inoculums

The substrates used in this study were pure cotton and starch provided from local shops in Borås (Sweden). The cotton was ground into fine materials before using them. The volatile solid of the cotton and starch was 96% and 75%, respectively. The COD of the both materials were 1.19 kgCOD/kg of the materials [36]. The inoculum used in the CSTR bioreactors was obtained from a 3000-m3 digester treating municipal solid waste and working under thermophilic (55 °C) condition (Borås Energy & Environment AB, Borås, Sweden). The UASB reactors were seeded using granulated anaerobic sludge, which was provided from a pilot scale UASB reactor treating municipal wastewater at Hammarby Sjöstad (Stockholm, Sweden) operating at 37 °C.

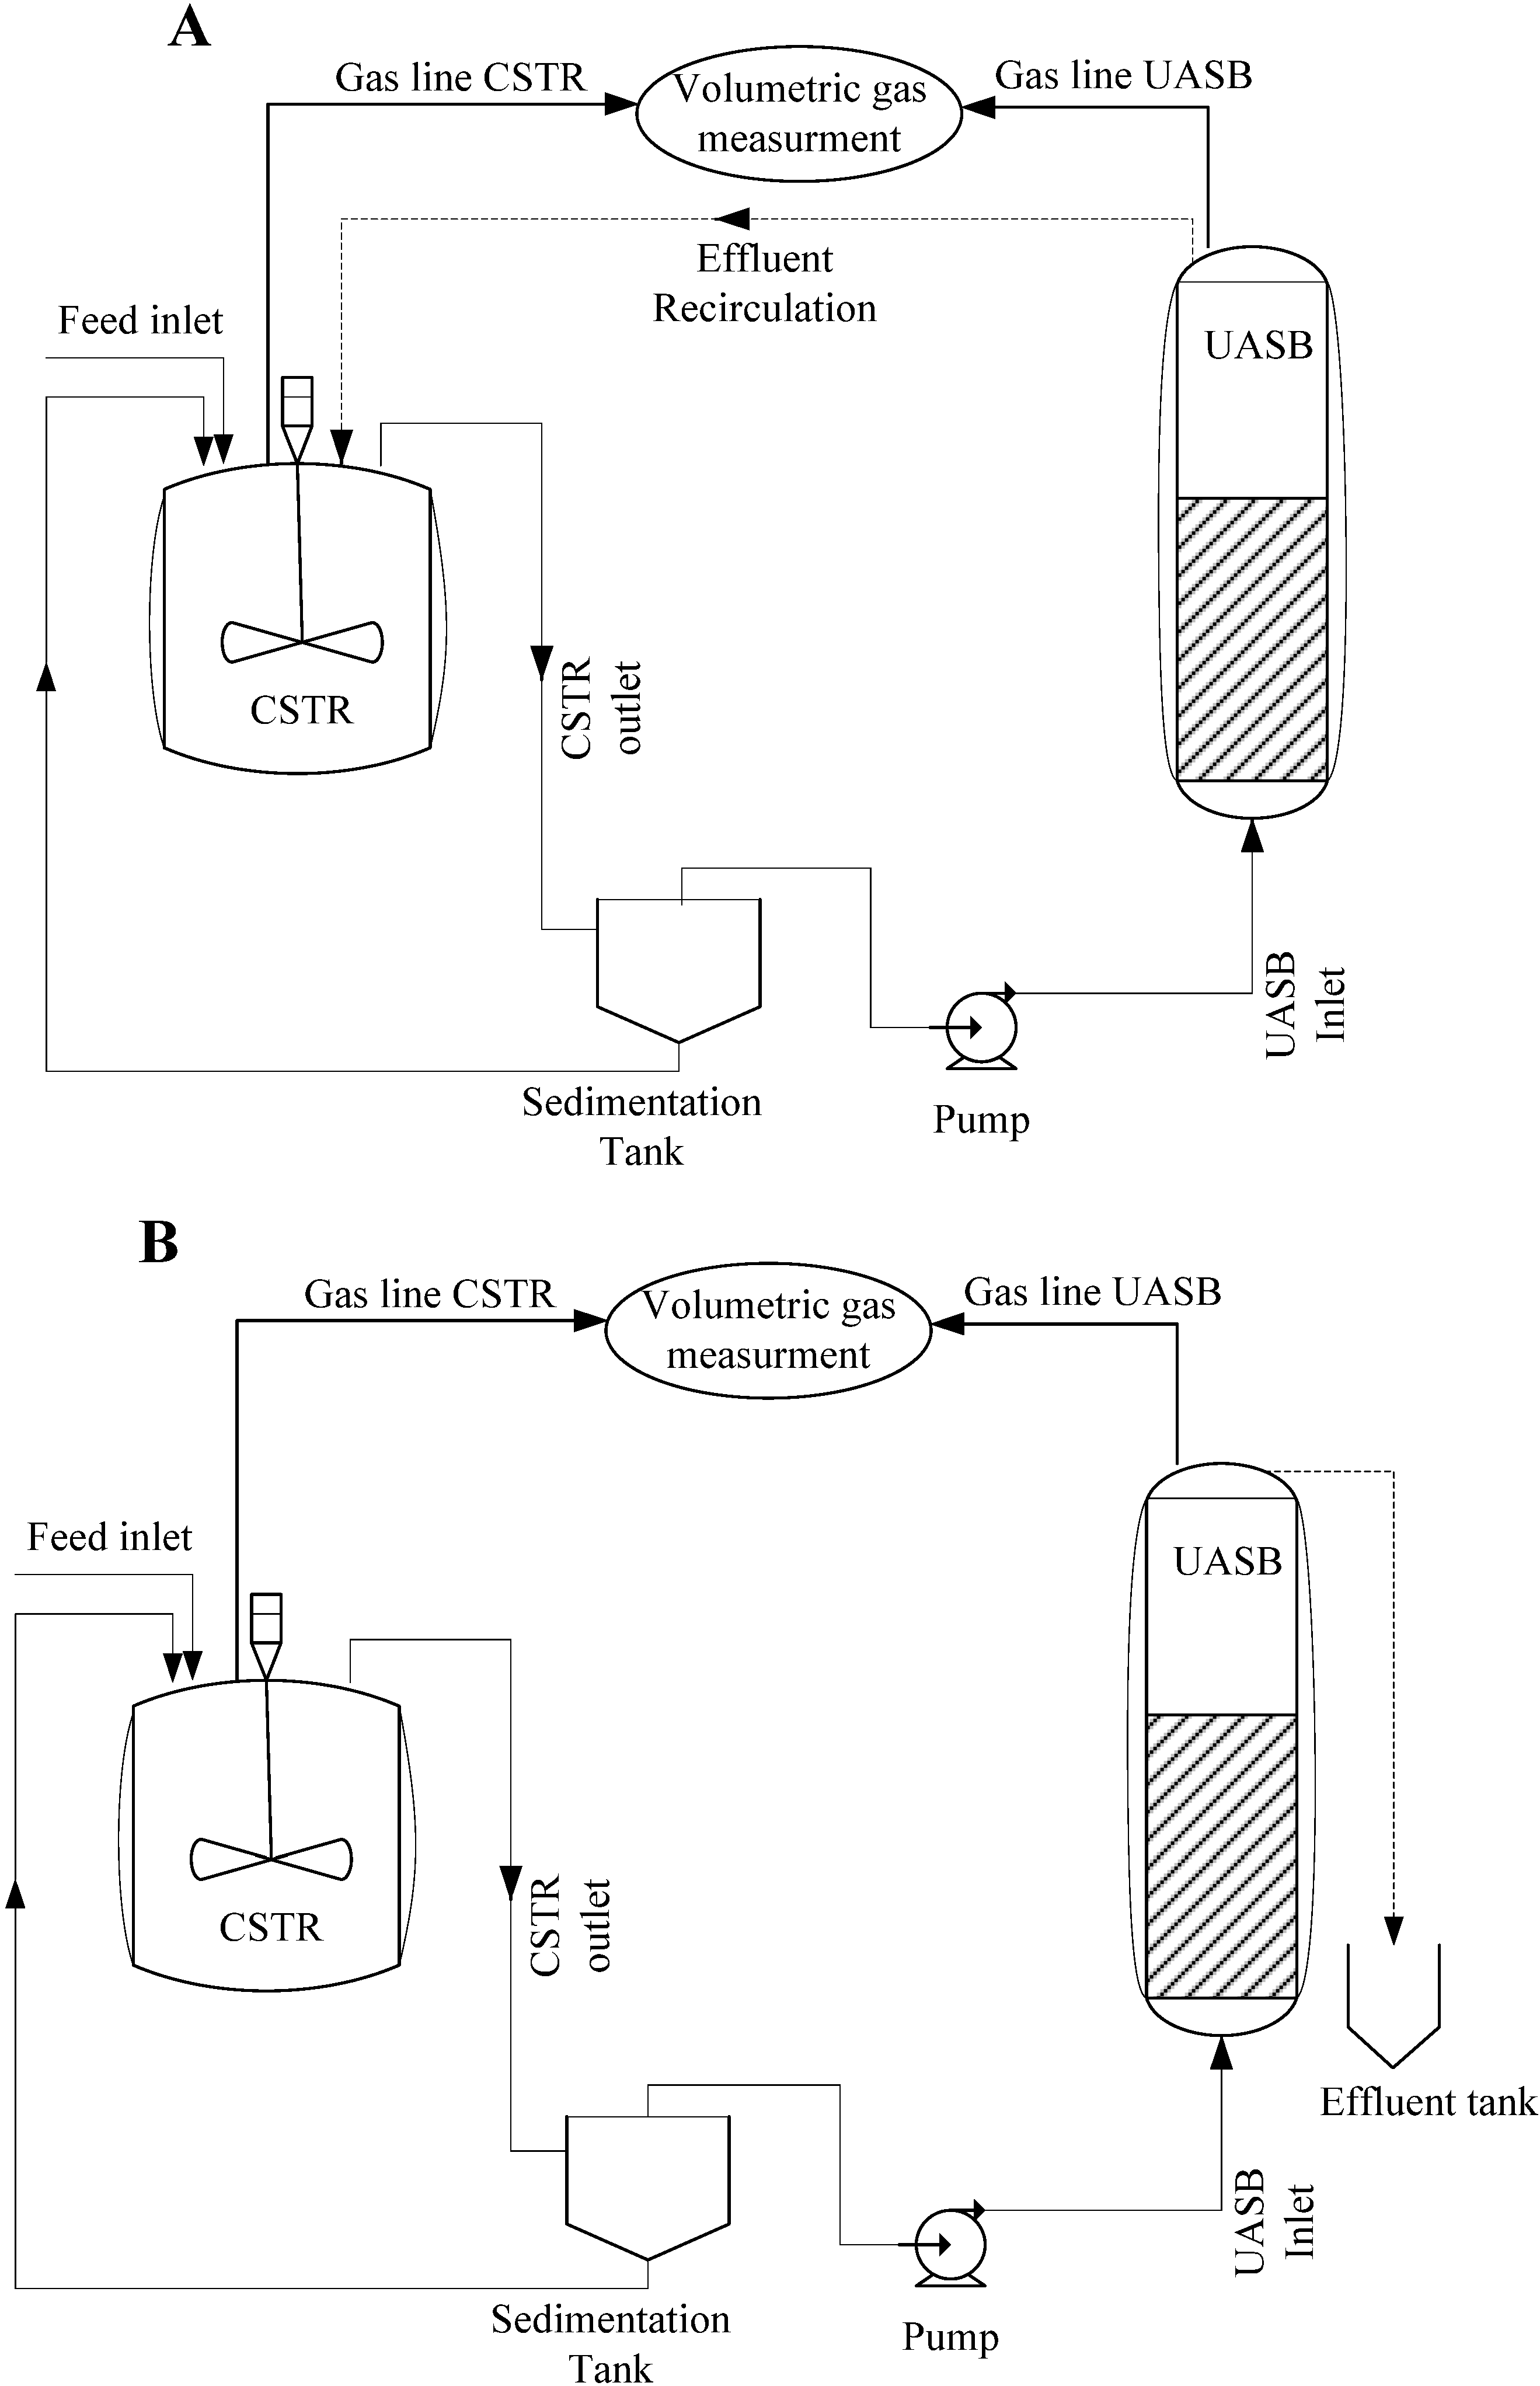
2.2. Experimental Set-Up

2.2.1. Reactors

The CSTR and UASB reactors were made of polymethylmethacrylate (PMMA), and used in different configurations. The CSTR had a working volume of 3 L with an inner diameter of 18.5 cm and a height of 18.5 cm, while the working volume of the UASB was 2.25 L with an internal diameter of 6.4 cm and a height of 70 cm. Temperature of the reactors was sustained at 55 °C for CSTR and 34 °C for UASB by a thermal water-bath with water recirculation through the reactor’s water jacket during the whole digestion process. Both reactors were equipped with a feed inlet, a liquid sampling point, an effluent outlet, and a gas line to the gas measuring system which contained a gas sampling port. The CSTR had an impeller for continuous mixing. The inlet from the bottom of the UASB reactor was equipped with a net trap to prevent the large particles away from entering the reactor (Figure 1).

2.2.2. Reactors Seeding and Start Up

The UASB reactors were seeded with 1.3 L of granular anaerobic sludge and the remaining volume of the reactors were filled with water. The inoculum for the CSTR was incubated at 55 °C for three days in order to get stabilized before use, and remove the dissolved methane. The CSTR’s were filled with 2.5 L of inoculum and 0.5 L of nutrient solution in which the C:N:P:S ratio was adjusted at 500:20:5:3 at the beginning of the experiment. The nutrient concentration for 1 g cellulose/L contained basal medium with inorganic macro nutrient (in mg/L): NH4Cl (76.4), KH2PO4 (5.18), MgSO4·7H2O (0.27), CaCl2·2H2O (10), and 1 mL/L of trace nutrients according to [37].
Figure 1. Schematic figure of the semi-continuous two-stage system. (A) with recirculation (Closed system), and (B) without recirculation (Open system).
Energies 06 02966 g001

2.2.3. Reactors Configuration

The arrangement of the two stage closed system and the two stage open system is presented schematically in Figure 1. The configuration of the closed system and open system continuous process was quite similar. The difference was that in the closed system the effluent of the UASB reactor was continuously recirculated back to the CSTR, while the open system did not have any effluent recirculation from UASB [38]. The recirculation rate of the liquid in the closed system was 91% ± 3%. The recirculation rate of the liquid is based on the HRT in each OLR, which is controlled by the flow rate in the pump. In order to separate particulate matter from the CSTR effluent, the outlet of the CSTR was equipped with a sedimentation tank consisting of a 100 mL glass bottle, to separate and settle the large particles before pumping the liquid to the UASB. The feeding to both systems was once and twice a day depending on the OLR.

2.2.4. Experimental Procedure

The semi-continuous digestions (open and closed) were carried out by feeding the bioreactors with OLRs increasing from 2 up to 20 gVS/L/day in several steps. Once a day, depending on the OLR, the substrate was fed into the CSTR. The HRT of UASB was controlled by adjusting the speed of the pump prior to each step. Each OLR was maintained for more than three HRTs in the CSTR in order to achieve a steady state condition. The steady state condition in each OLR refers to the constant loading rate and gas production, which was achieved during three HRT periods. The process conditions; including the OLR and their respective HRT, flow rate and duration are summarized in Table 1.
During the experiments, no solids/biomass was withdrawn from the reactors, except for the sample analyses. The volume of biogas produced was recorded continuously by Automatic Methane Potential Testing System (AMPTS, Bioprocess Control AB, Lund, Sweden) and gas chromatography. The liquid and gas sampling were performed twice a week during the initial state of the process and increased to every day from stage 4–6 due to short retention times. The liquid samples were kept at −20 °C until the analyses were performed.
Table 1. The process conditions including the OLR and their respective HRT, flow rate and duration in each stage of the experimental period.
StageOLR (gVS/L/day)HRT in CSTR (day)HRT in UASB (day)Duration (day)
12.010.07.5030.0
22.77.55.6230.0
34.05.03.7515.0
48.02.51.888.0
5102.01.506.0
6201.00.756.0

2.2.5. Analytical Methods

The production of biogas was recorded using AMPTS, operating based on water displacement. It was equipped with a computer to record the biogas volume from each reactor. The composition of the biogas produced during anaerobic digestion was measured using a gas chromatograph (Auto System Perkin Elmer, Waltham, MA, USA), equipped with a packed column (Perkin Elmer, 6’ × 1.8’’OD, 80/100 Mesh) and a thermal conductivity detector (Perkin Elmer) with an inject temperature of 150 °C, detection temperature of 200 °C, and oven temperature of 75 °C. The carrier gas used was nitrogen-operated at a maintained pressure of 0.70 bar and a flow rate of 40 mL/min at 60 °C. A 250 µL pressure-tight gas syringe (VICI, Precision Sampling Inc., Baton Rouge, LA, USA) was used for the gas sampling.
Liquid samples were analyzed for pH, soluble chemical oxygen demand (COD), and VFA concentrations after centrifugation at 17,000 g for 10 min and subsequent filtration through a 0.2-µm filter to remove solid particles. The COD was measured using a HACH apparatus equipped with a UV–Vis Spectrophotometer (HACH, Düsseldorf, Germany), with Digestion Solution COD vials (operating range 0–15,000 mg COD/L). The VFA concentrations, including acetic acid, propionic acid, butyric acid, isobutyric acid, valeric acid and isovaleric acid, were analyzed by HPLC (Waters 2695, Waters Corporation, Milford, MA, USA), equipped with an ion-exchange column (Aminex HPX-87H Bio-Rad, Hercules, CA, USA), working at 60 °C using 5 mM sulfuric acid as eluent with a flow of 0.6 mL/min, and a UV detector (Waters 2414, Milford, MA, USA). The macronutrients, including ammonium and potassium were analyzed using an Ion Chromatography (Metrohm, Herisau, Switzerland) working with a cation column at an eluent flow rate of 1 mL/min, pressure of 7–9 MPa, and temperature of 35–40 °C. The eluent solution was composed of 4 mM/L tartaric acid and 0.75 mM/L dipicolinic acid in water. Before injection, the samples were diluted with eluent, the pH was adjusted to 2–3, were then centrifuged at 17,000 g for 4 min and filtered through a 0.45 µm filter.

3. Results

Cellulose and starch were used as a substrate in a semi-continuous two-stage anaerobic digestion process for biogas production. The substrates were digested separately, in two CSTRs with an OLR of 2 gVS/L/day, which was then increased stepwise up to 20 gVS/L/day for starch and 4 gVS/L/day for cotton. The HRT was decreased in each step, and the reactors were continuously operated for three consecutive HRTs to obtain steady state condition. The total methane with its percentage share of methane production in CSTR and UASB produced per gram VS per day for the operational period of 90 days of digestion is presented in Figure 2.
Figure 2. Total methane production in open system for cotton and starch with --- % share in CSTR and - - - % share in UASB.
Energies 06 02966 g002

3.1. Gas Production

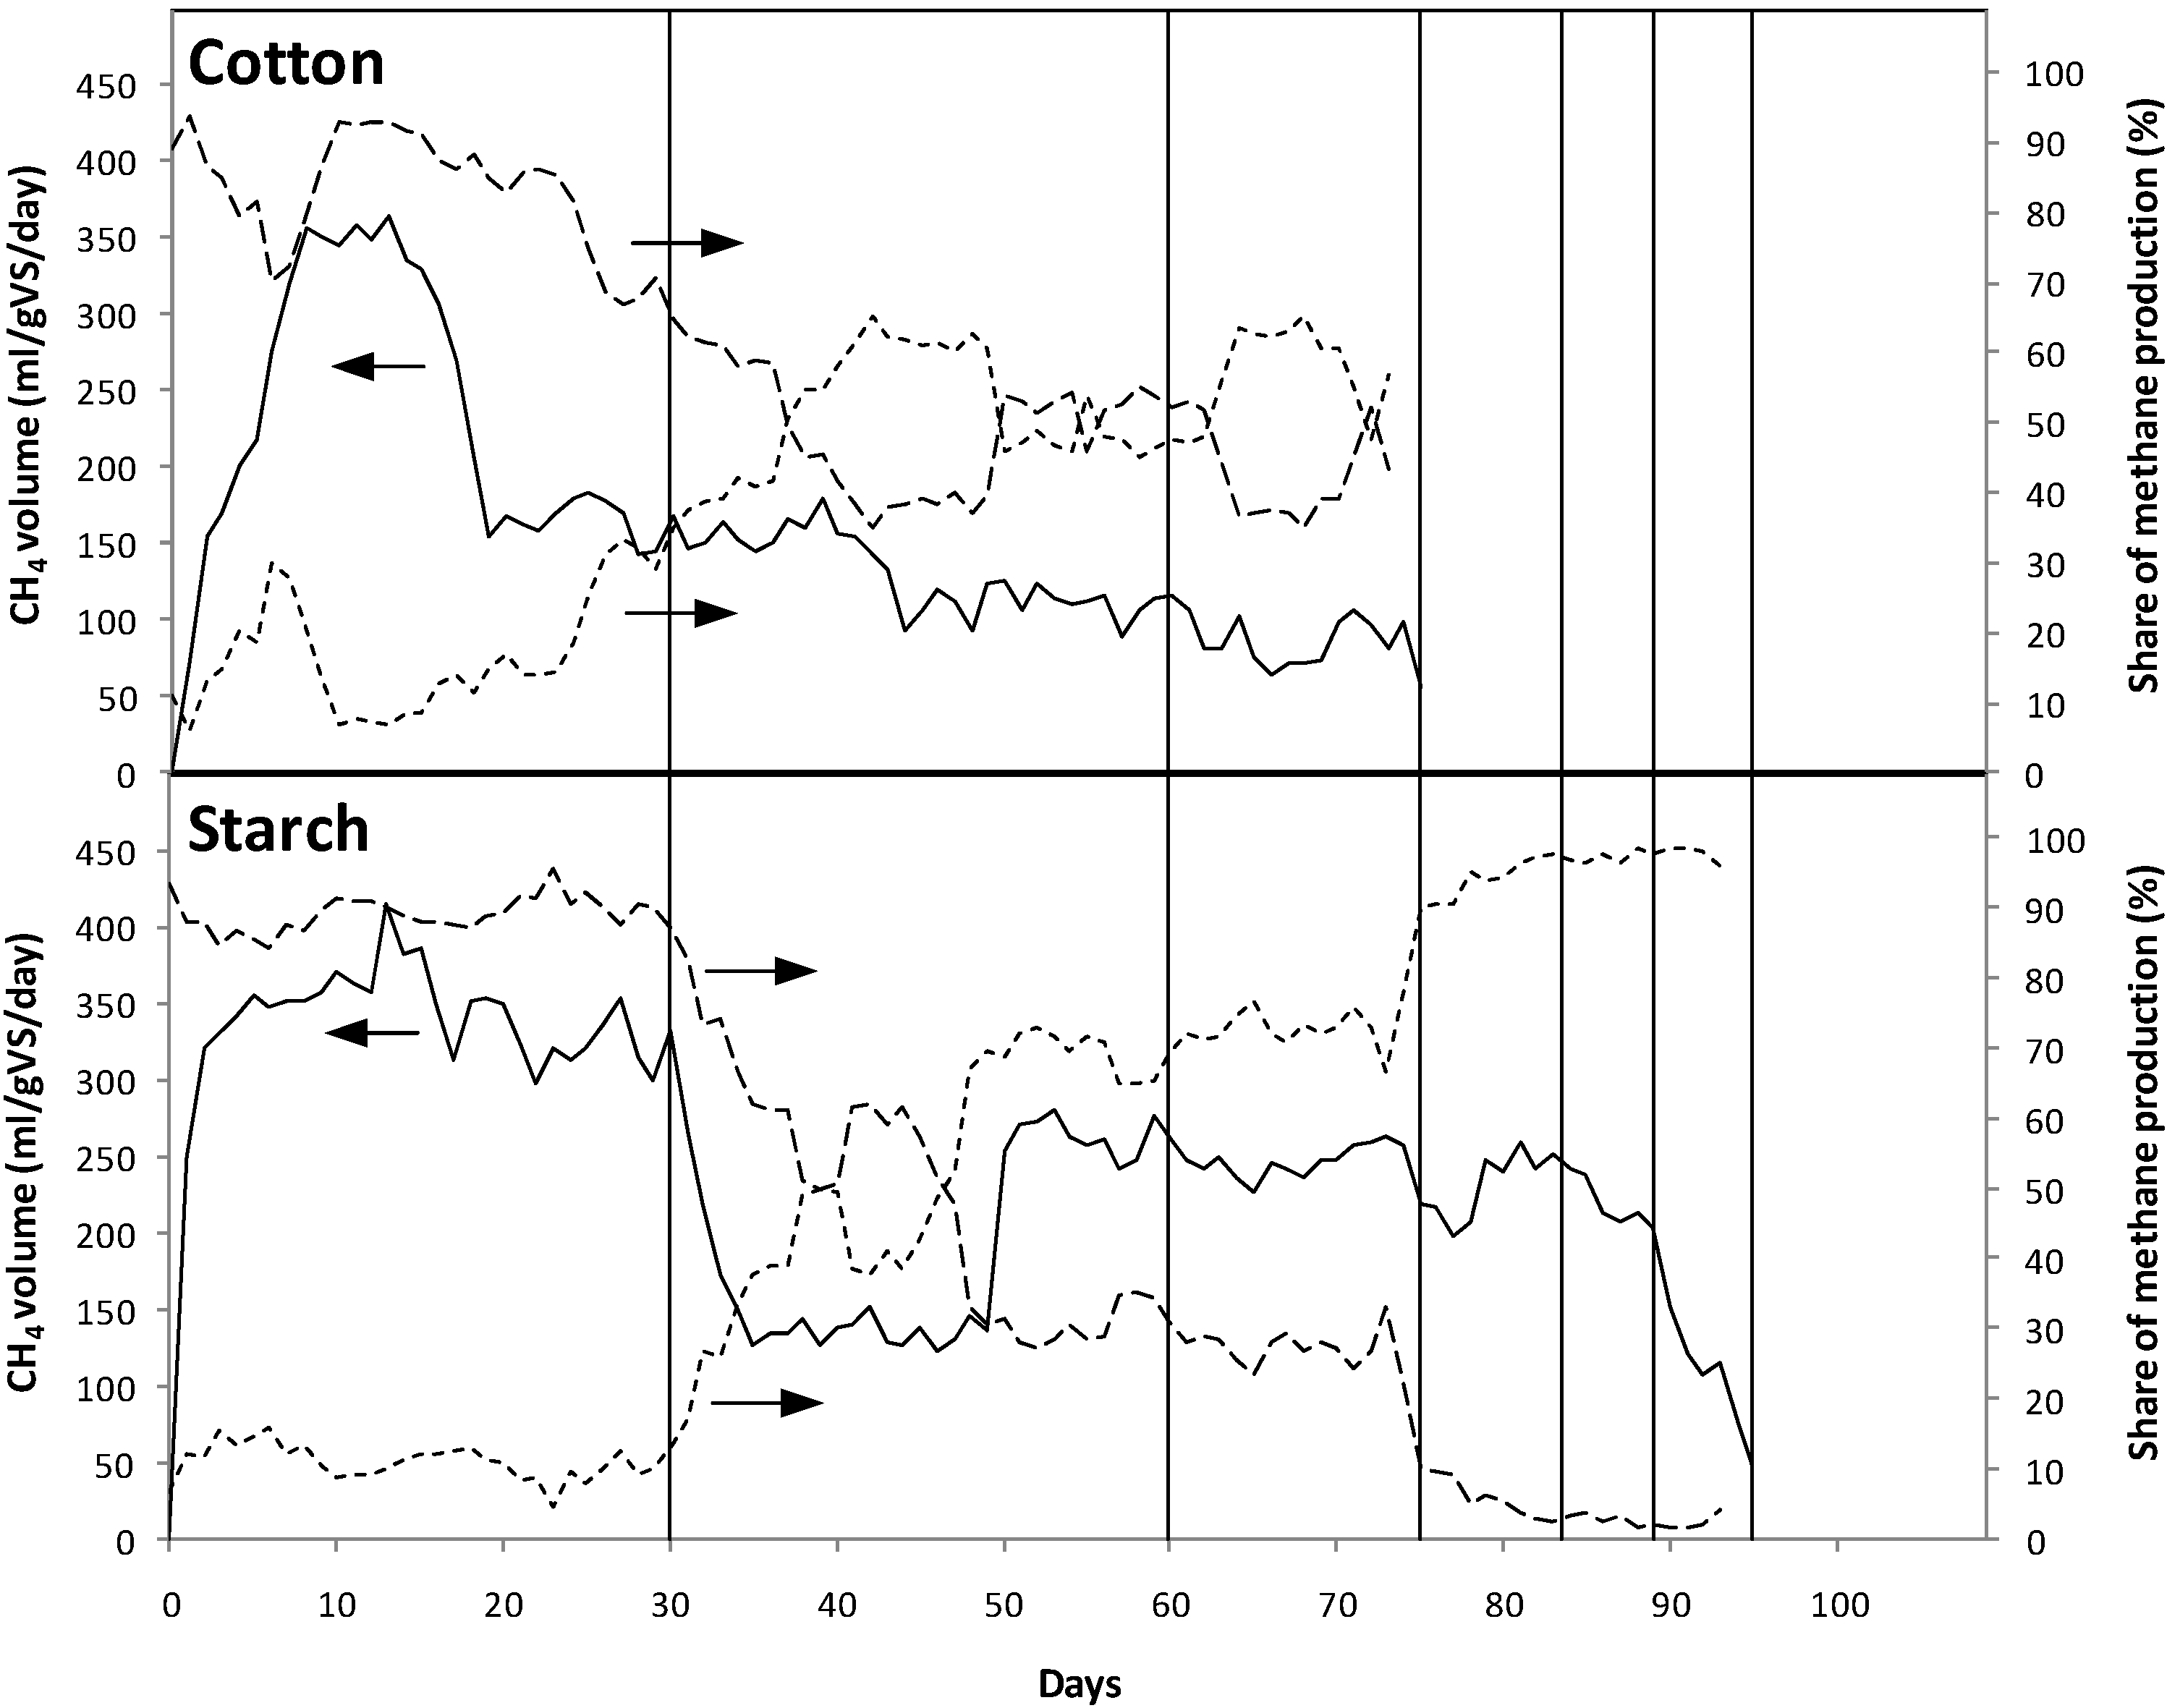
3.1.1. Biogas Production in Open System (without Effluent Recirculation)

During the startup for cotton, the maximum methane production reached 363 gVS/L/day at day 12, and then kept stable for 8 days before it started to decrease to 150 mL/gVS/d. Even after the increase in OLR up to 2.7 gVS/L/day, the methane production remained stable at 150 mL/gVS/d for 10 days. However, after day 40, the gas production decreased to less than 100 mL/gVS/d. An additional increase in OLR to 4 gVS/L/day produced only 84 mL/gVS/d until day 75. Further increase in OLR to 8 gVS/L/day resulted in reactor failure, and the experiment was stopped.
On the other hand for starch, the process could be continued up until OLR 20 gVS/L/day for 95 days, while adding 2 gVS/L/day OLR, 340 mL/gVS/d of methane was produced. However, further increase in OLR to 2.7 gVS/L/day resulted in decreased biogas production and just 45% of the theoretical methane yield was achieved. A significant shift in the share of methane production from CSTR to UASB could be observed at OLR 2.7 gVS/L/day. During the OLRs 4–10 gVS/L/day, the theoretical methane yield was constant around 55%–60%. Furthermore, the accumulation of VFA in CSTR was increased to more than 8 g/L during the same period (Figure 3C). In addition, the methane production decreased from 230 mL/gVS/d to 128 mL/gVS/d when OLR was increased from 10 to 20 gVS/L/day. Starch had a more stable process during the first stage compared to cotton, which could not reach steady state conditions even at low OLRs.
Figure 3. Volatile fatty acid concentration during the experimental period. ●- Starch; ♦- Cotton. (A) CSTR closed system; (B) UASB closed system; (C) CSTR open system; (D) UASB open system.
Energies 06 02966 g003

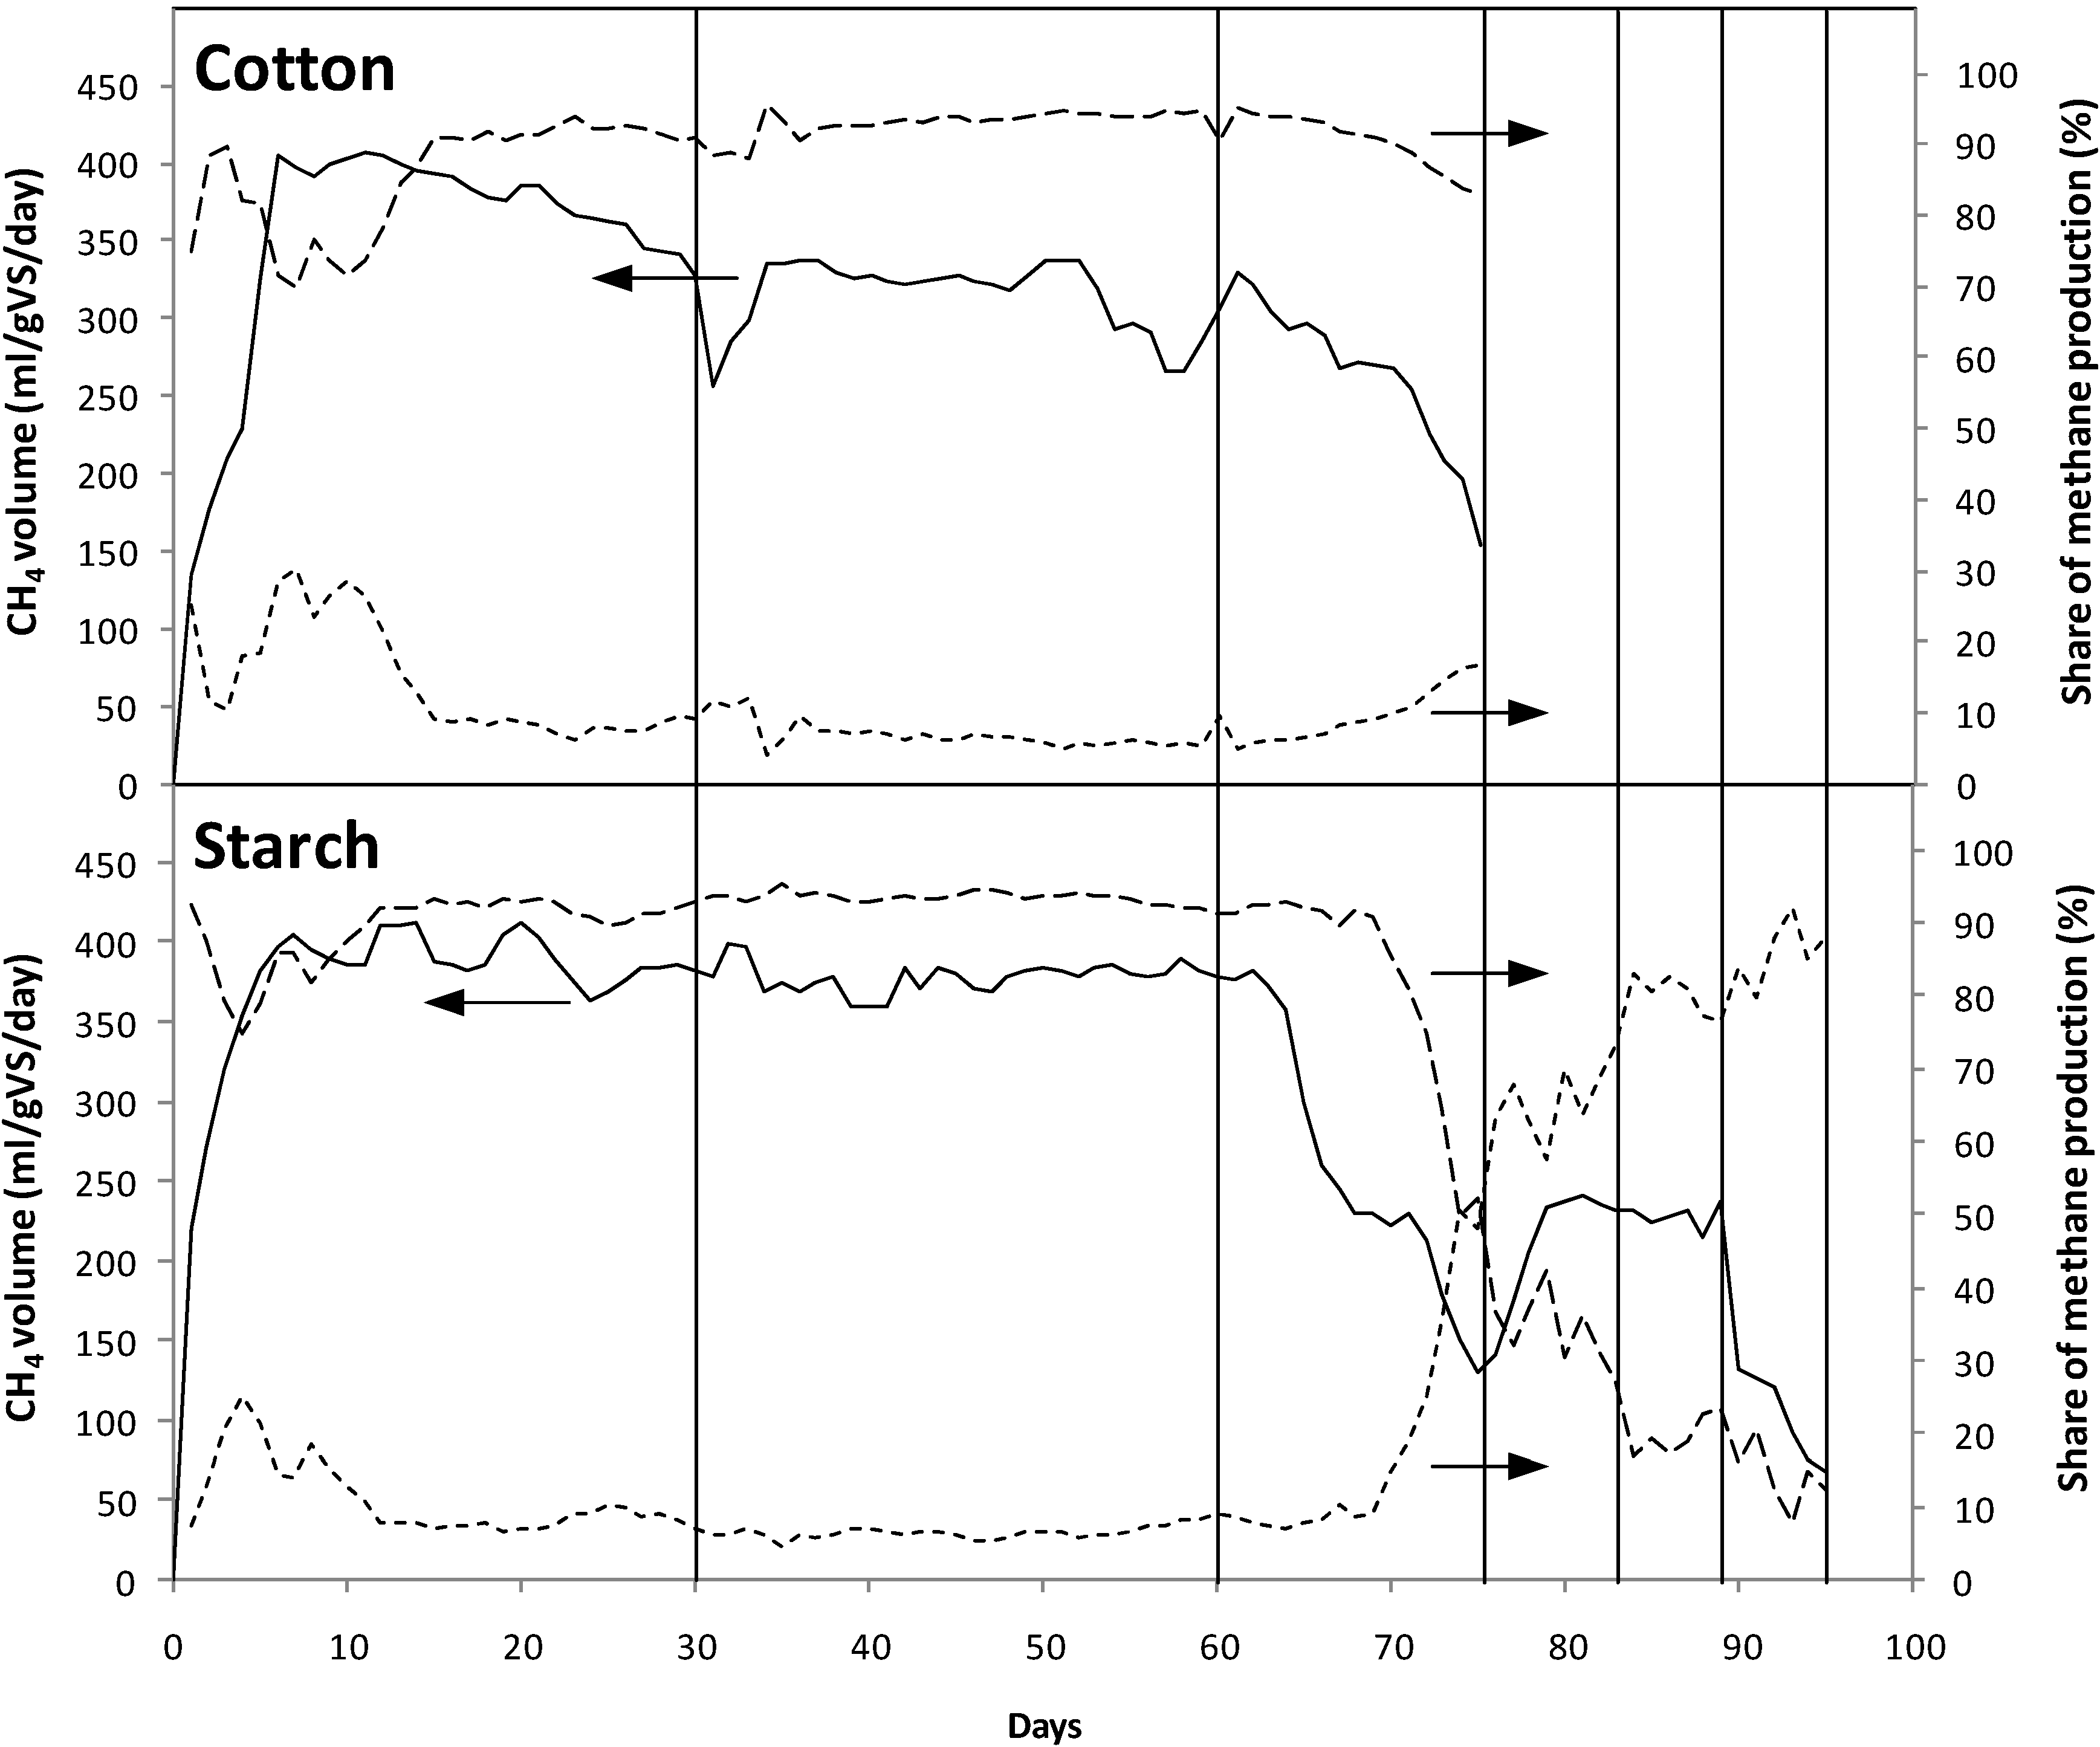
3.1.2. Biogas Production in Closed System (with Effluent Recirculation)

The two-stage process in closed system was more stable compared to the open system. The accumulated methane volume produced per gram VS per day for cotton and starch in the closed system are presented in Figure 4. The percentage share of methane production in CSTR and UASB are also marked in the same figure.
For cotton, the OLR could be increased from 2 to 2.7 gVS/L/day, and it resulted in a theoretical methane yield of 85% and 76%, respectively. Further increase of OLR to 4 g VS/L/d caused a rapid decline in the total gas production and the process was stopped.
In the case of starch, the theoretical methane yield was higher than 90% in the OLRs of 2 and 2.7 gVS/L/day. Additional decrease in HRT and increase in OLR up to 10 gVS/L/day stepwise resulted in a theoretical methane yield of 50%–60%. The transition of the major share of methane production from CSTR to UASB was observed at OLR 8 gVS/L/day. Though, the methane yield between the OLR 4 to 10 gVS/L/day, the closed system possessed an overall stability. However, when the OLR increased to 20 gVS/L/day, the gas production declined rapidly and the process was stopped.
Figure 4. Total methane production in closed system for cotton and starch with --- % share in CSTR and - - - % share in UASB.
Energies 06 02966 g004

3.2. COD and Its Removal
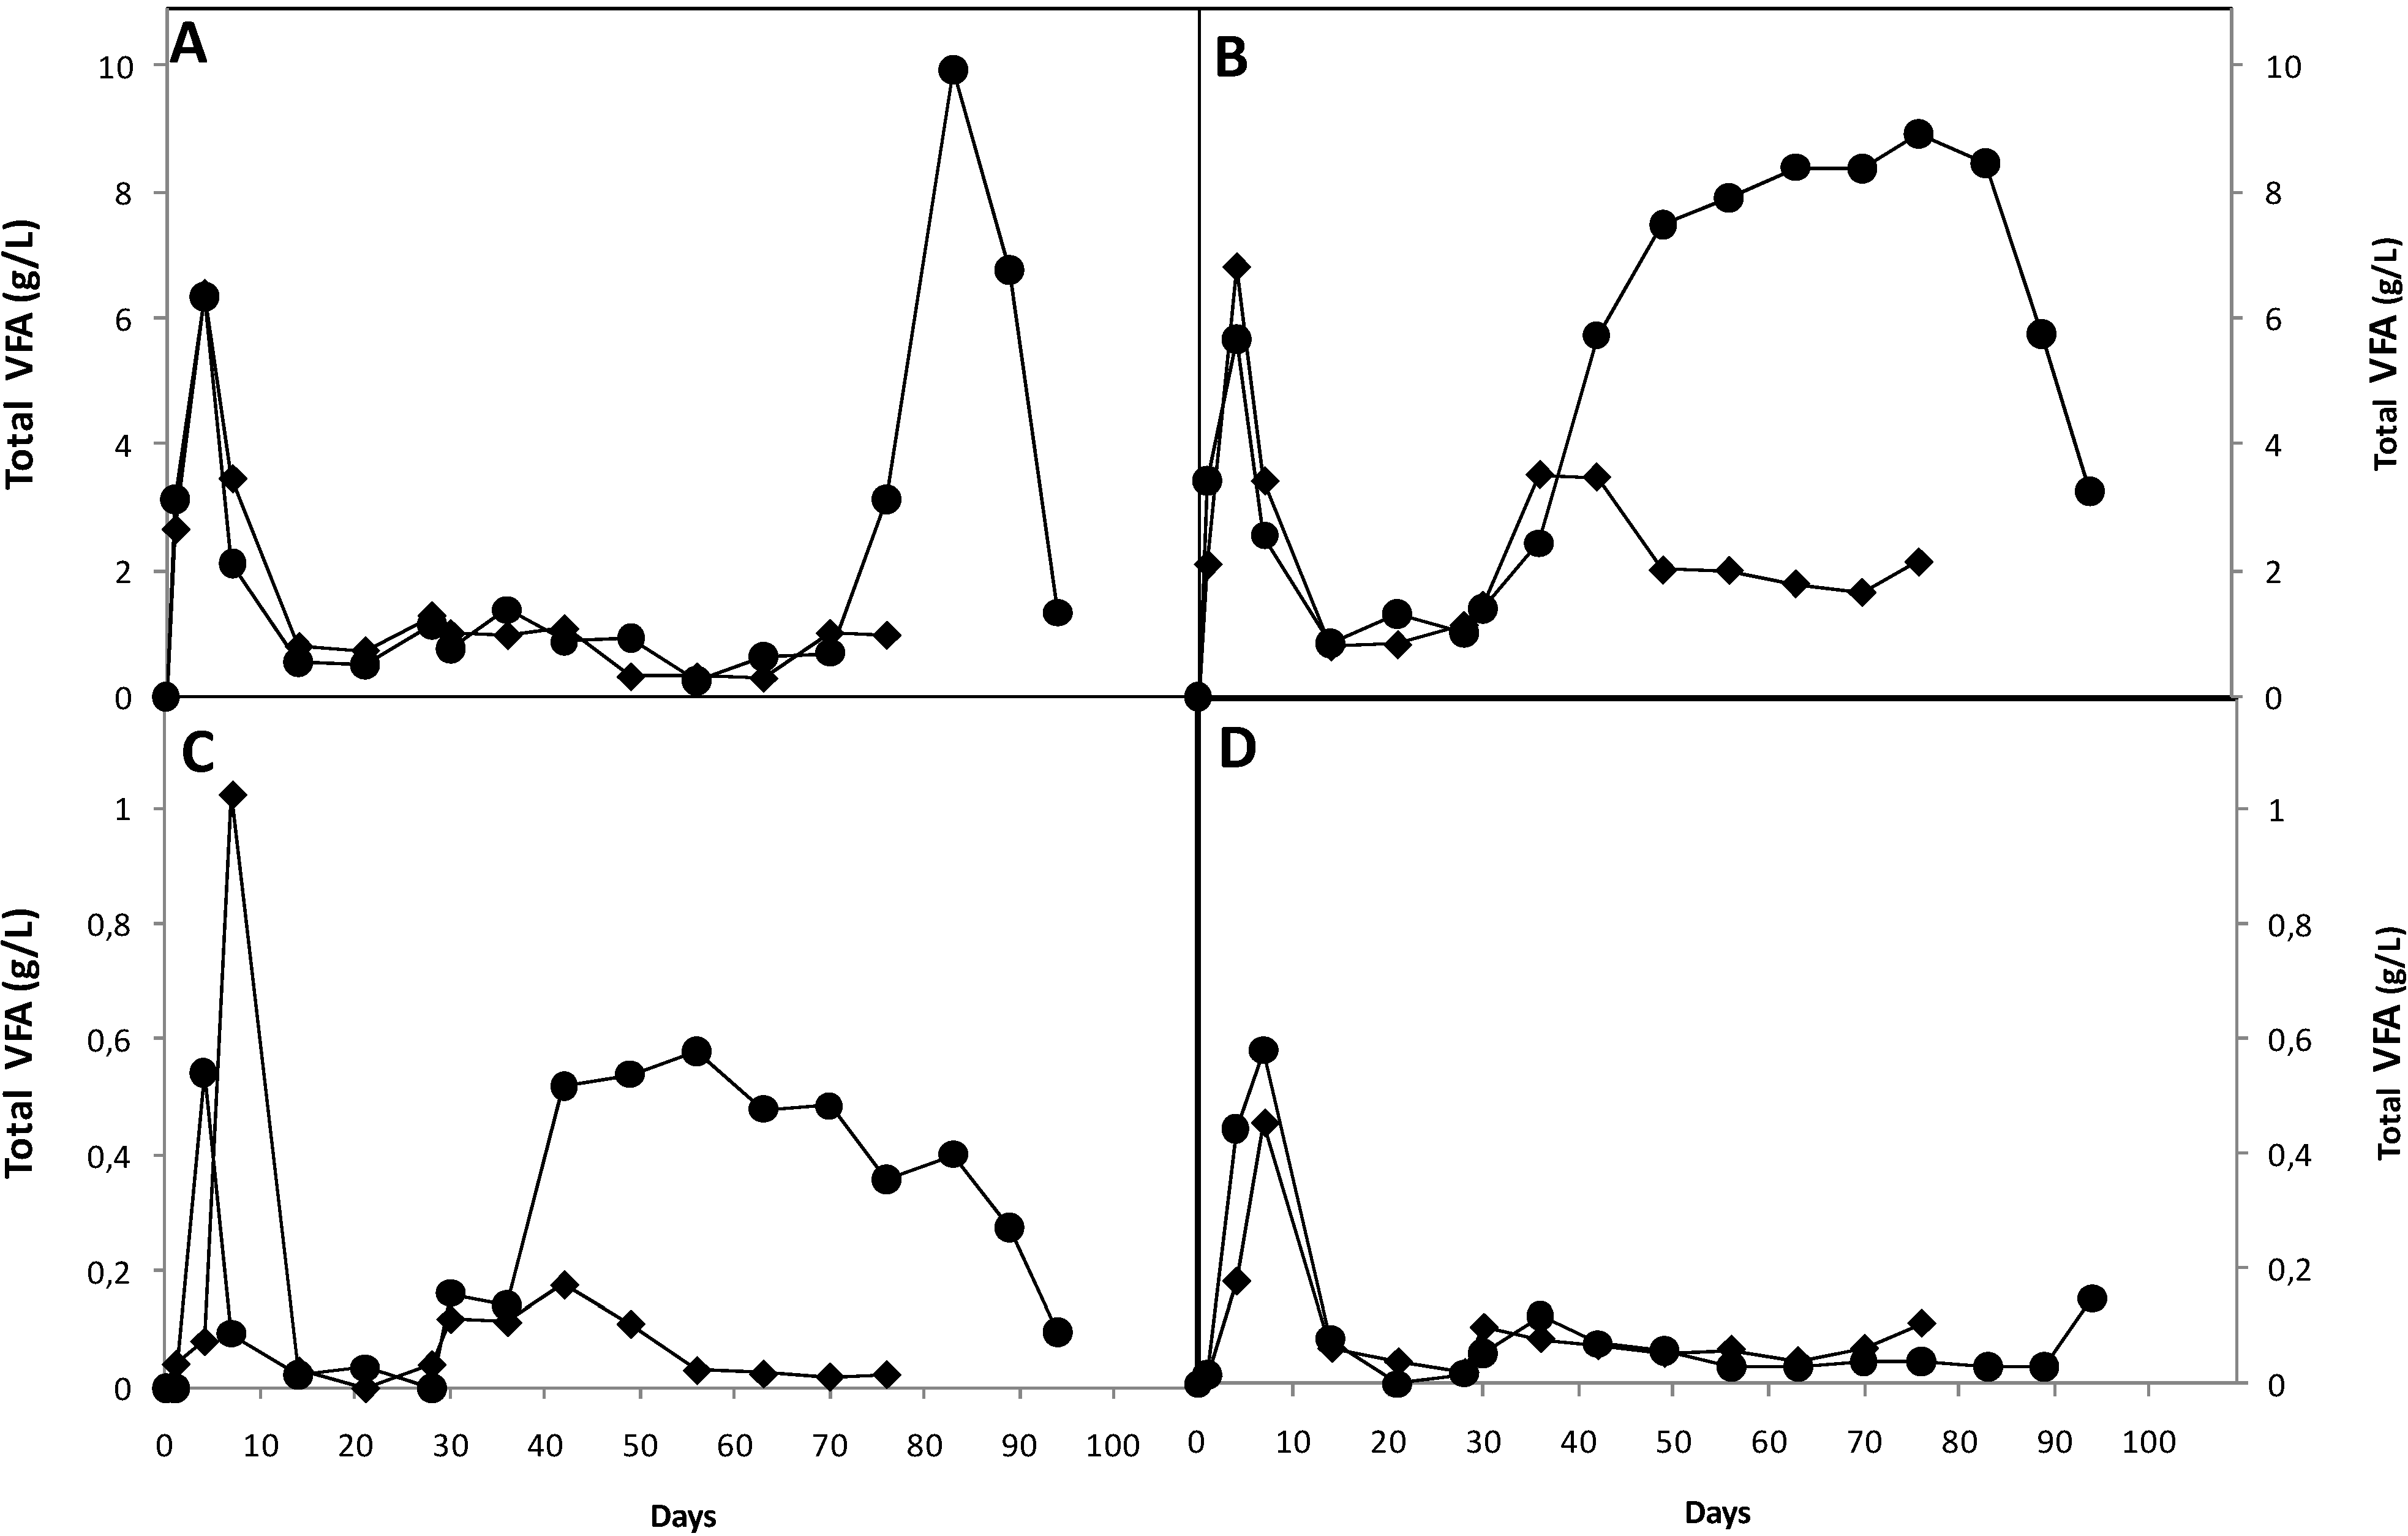
The COD was analyzed from the influent and effluent of the UASB during the operation. The UASB digesters performance was examined using COD removal efficiency, calculated by dividing the differences between COD inlet and outlet of UASB by the COD inlet to UASB. The results are presented in Table 2. Equation (1) shows the calculation of the COD removal efficiency:
C O D   r e m o v a l   e f f i c i e n c y = C O D i n C O D o u t C O D i n × 100

3.2.1. Open System

The COD removal efficiency was greater than 95% throughout the process for starch. The COD was increased from 4300 to 27,700 mg/L in the CSTR fed with starch by increasing the OLR from 2 to 10 gVS/L/day. Furthermore, when the OLR was increased further to 20 g VS/L/d for starch, the COD was decreased to approximately 24,000 mg/L. The COD in the UASB on the other hand, kept stable throughout the entire process between 3000 and 4000 mg/L.
Table 2. The ratio of methane to carbon dioxide, concentration of COD and the COD removal efficiency for cotton and starch in UASB and CSTR during different organic loading rates.
SubstateOLR (gVS/L/day)COD (mg/L)COD removal efficiency (%)COD (mg/L)COD removal efficiency (%)
Open systemClosed system
CSTRUASBCSTRUASB
Cotton23,259 ± 6381,194 ± 9561.9 ± 16.34,204 ± 7421,958 ± 79149.2 ± 21.6
2.73,699 ± 844229 ± 8293.3 ± 3.52,651 ± 5721,525 ± 17239.4 ± 16.5
43,241 ± 545196 ± 3393.9 ± 1.82,571 ± 2041,476 ± 35745.6 ± 15.9
Starch24,324 ± 1,3451,308 ± 33569.7 ± 14.25,041 ± 4303,273 ± 67435.0 ± 12.8
2.79,034 ± 1,127317 ± 14396.49 ± 1.24,463 ± 6263,353 ± 37424.8 ± 16.2
419,500 ± 2,493350 ± 16598.2 ± 2.14,396 ± 5653,051 ± 49430.5 ± 7.8
821,450 ± 2,185708 ± 18696.6 ± 2.717,865 ± 2,7673,091 ± 42382.69 ± 3.8
1027,716 ± 1,606876 ± 27096.8 ± 1.325,833 ± 3,3333,995 ± 87384.5 ± 4.2
2023,800 ± 2,347898 ± 9896.2 ± 2.512,516 ± 2,1713,256 ± 65873.9 ± 9.5
In contrast, for cotton in open system, the COD removal efficiency was as high as 93%. Interestingly, in the open system the increase in OLR from 2 to 4 gVS/L/day, did not significantly change the COD of the CSTR fed with cotton which was stable around 3500 mg/L. The COD concentration in the UASB on the other hand, decreased from 1194 mg/L to 196 mg/L during the same period.

3.2.2. Closed System

In the closed system digesting starch, the COD removal efficiency of UASB reactor performance of starch increased from 35% to 84.5% with increasing in OLR from 2 to 10 g VS/L/d and decreasing in HRT from 7.5 to 1.5 days. A further increase in OLR up to 20 gVS/L/day decreased the COD removal efficiency of starch in UASB with more than 10%. The effluent COD out of UASB of starch during the entire process in closed system was stable, even though the OLR increased and the HRT decreased compared to the open system, which were more stable between 3000 and 4000 mg/L. A decreasing trend was observed for the COD removal efficiency in cotton in closed system, in which a reduction from 49.2% to 45.6% was occurred by increasing the OLR from 2 to 4 gVS/L/day.

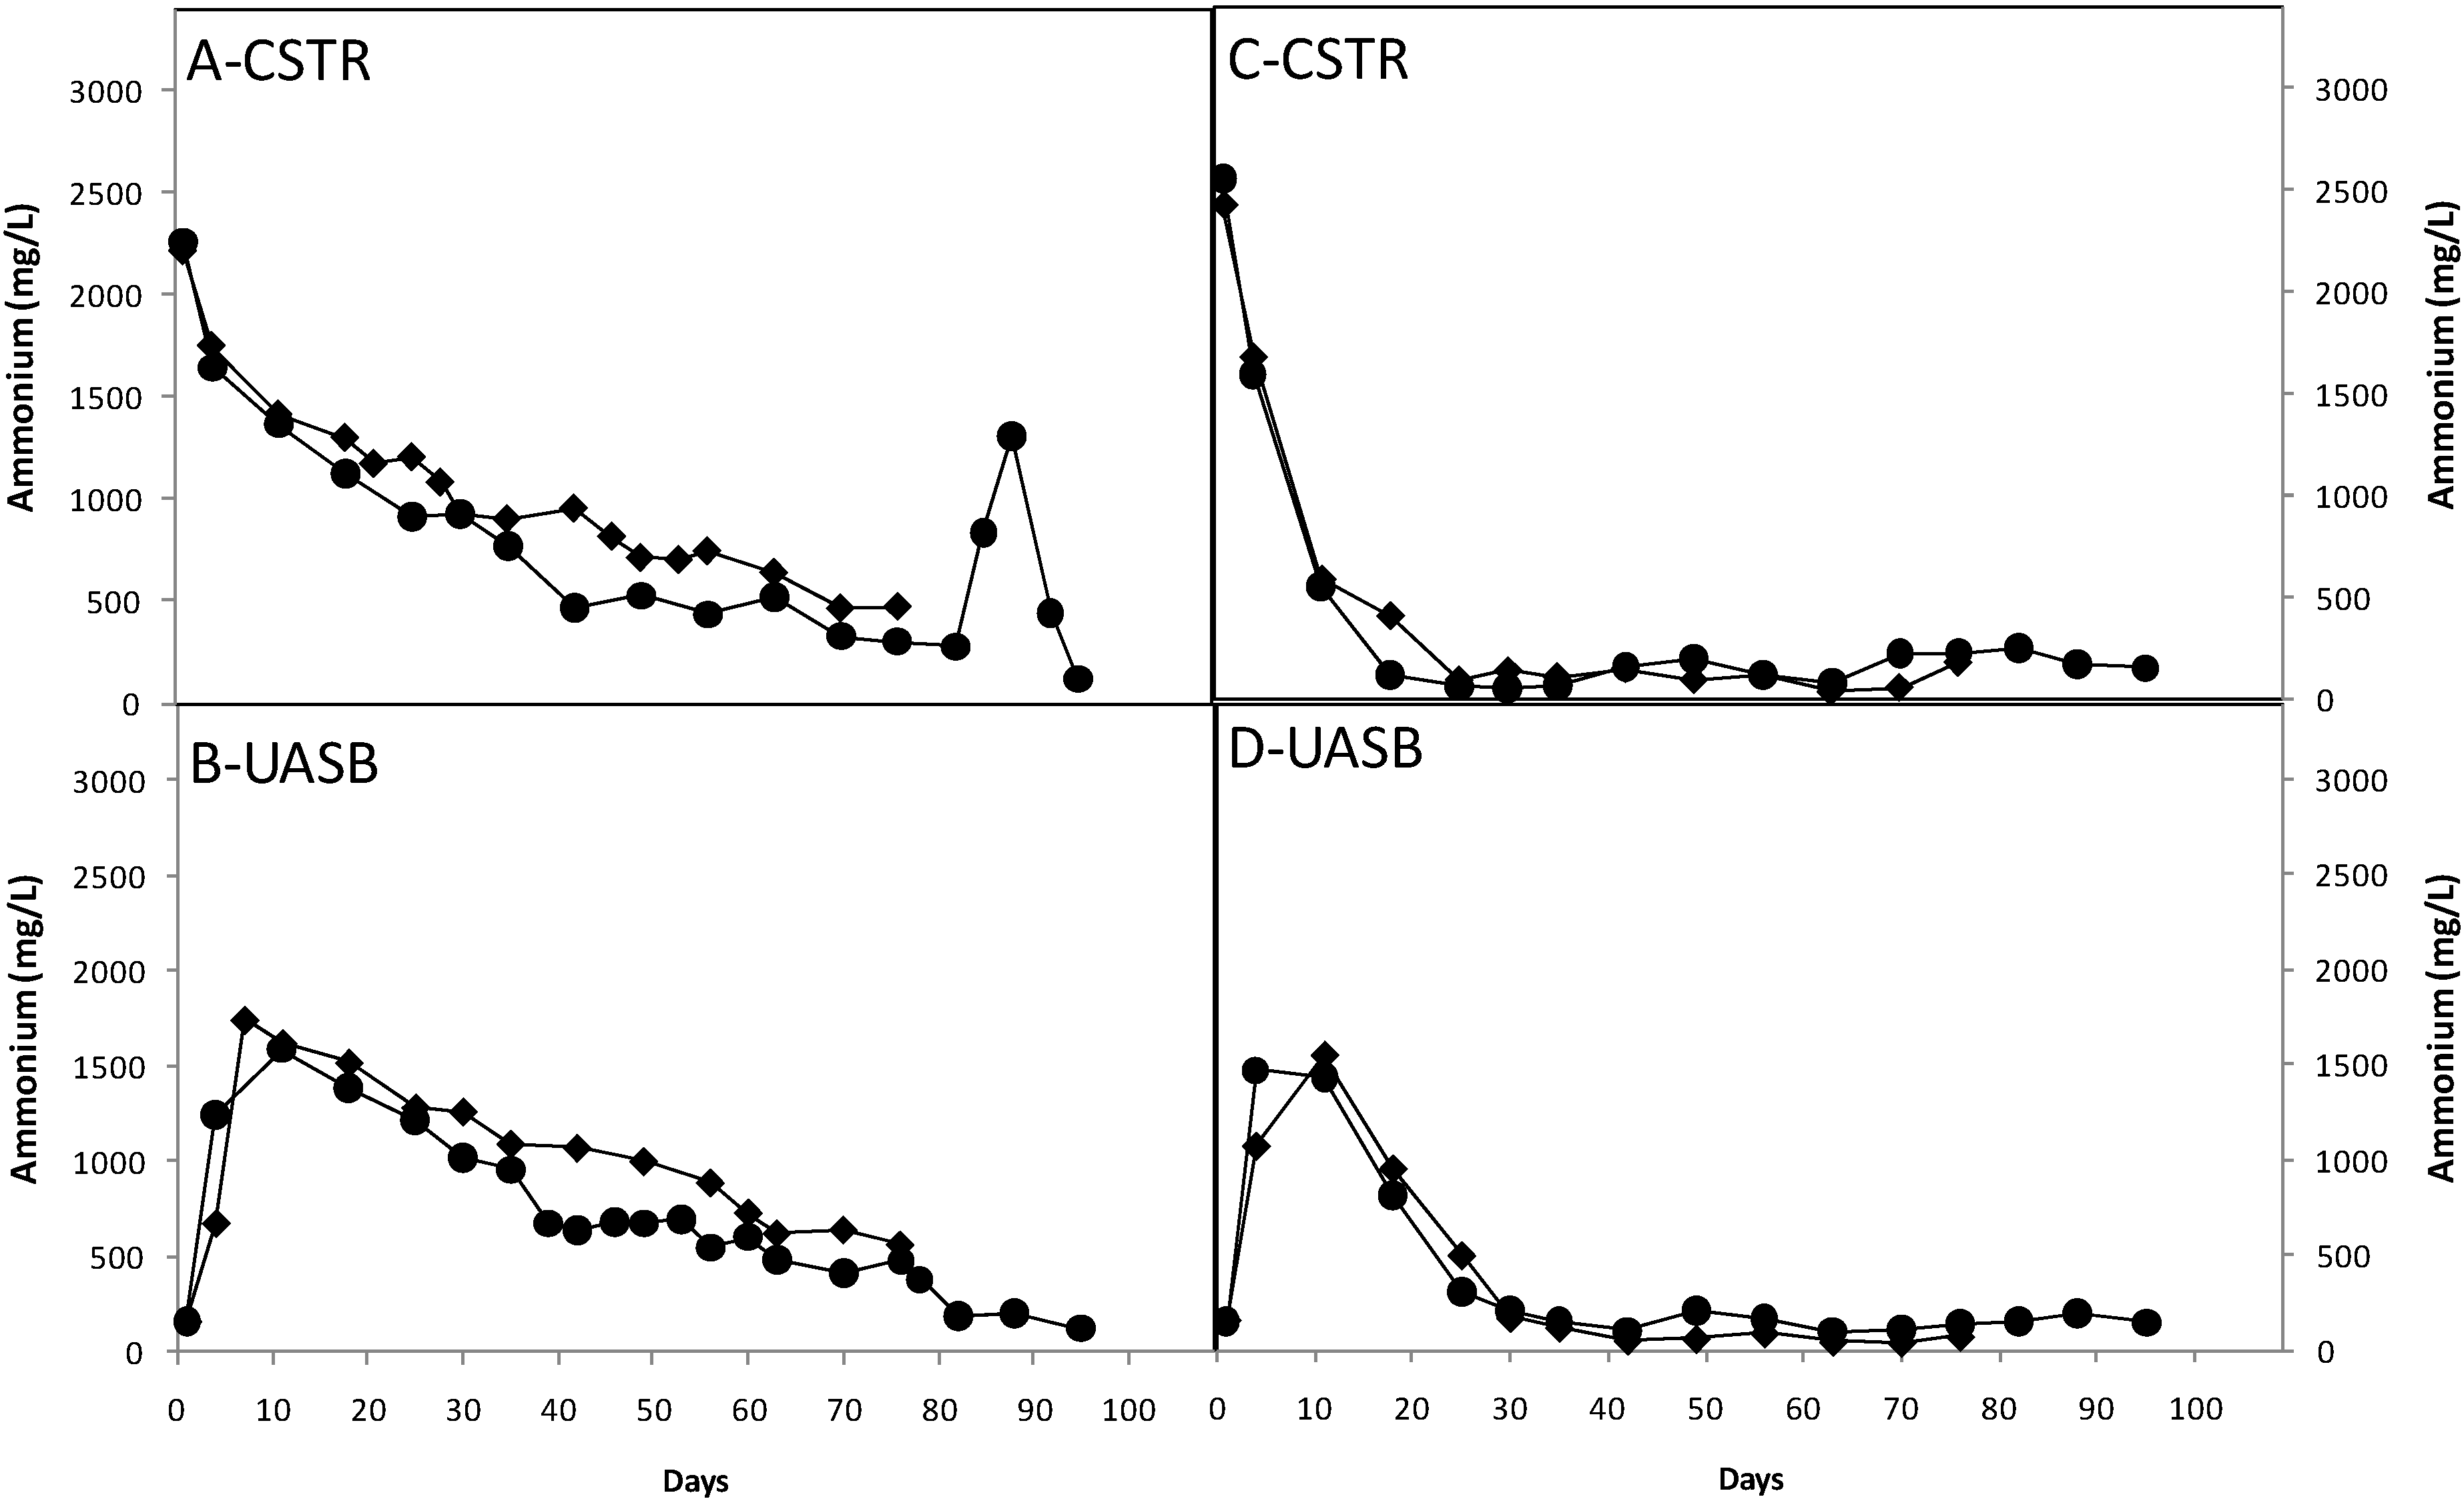
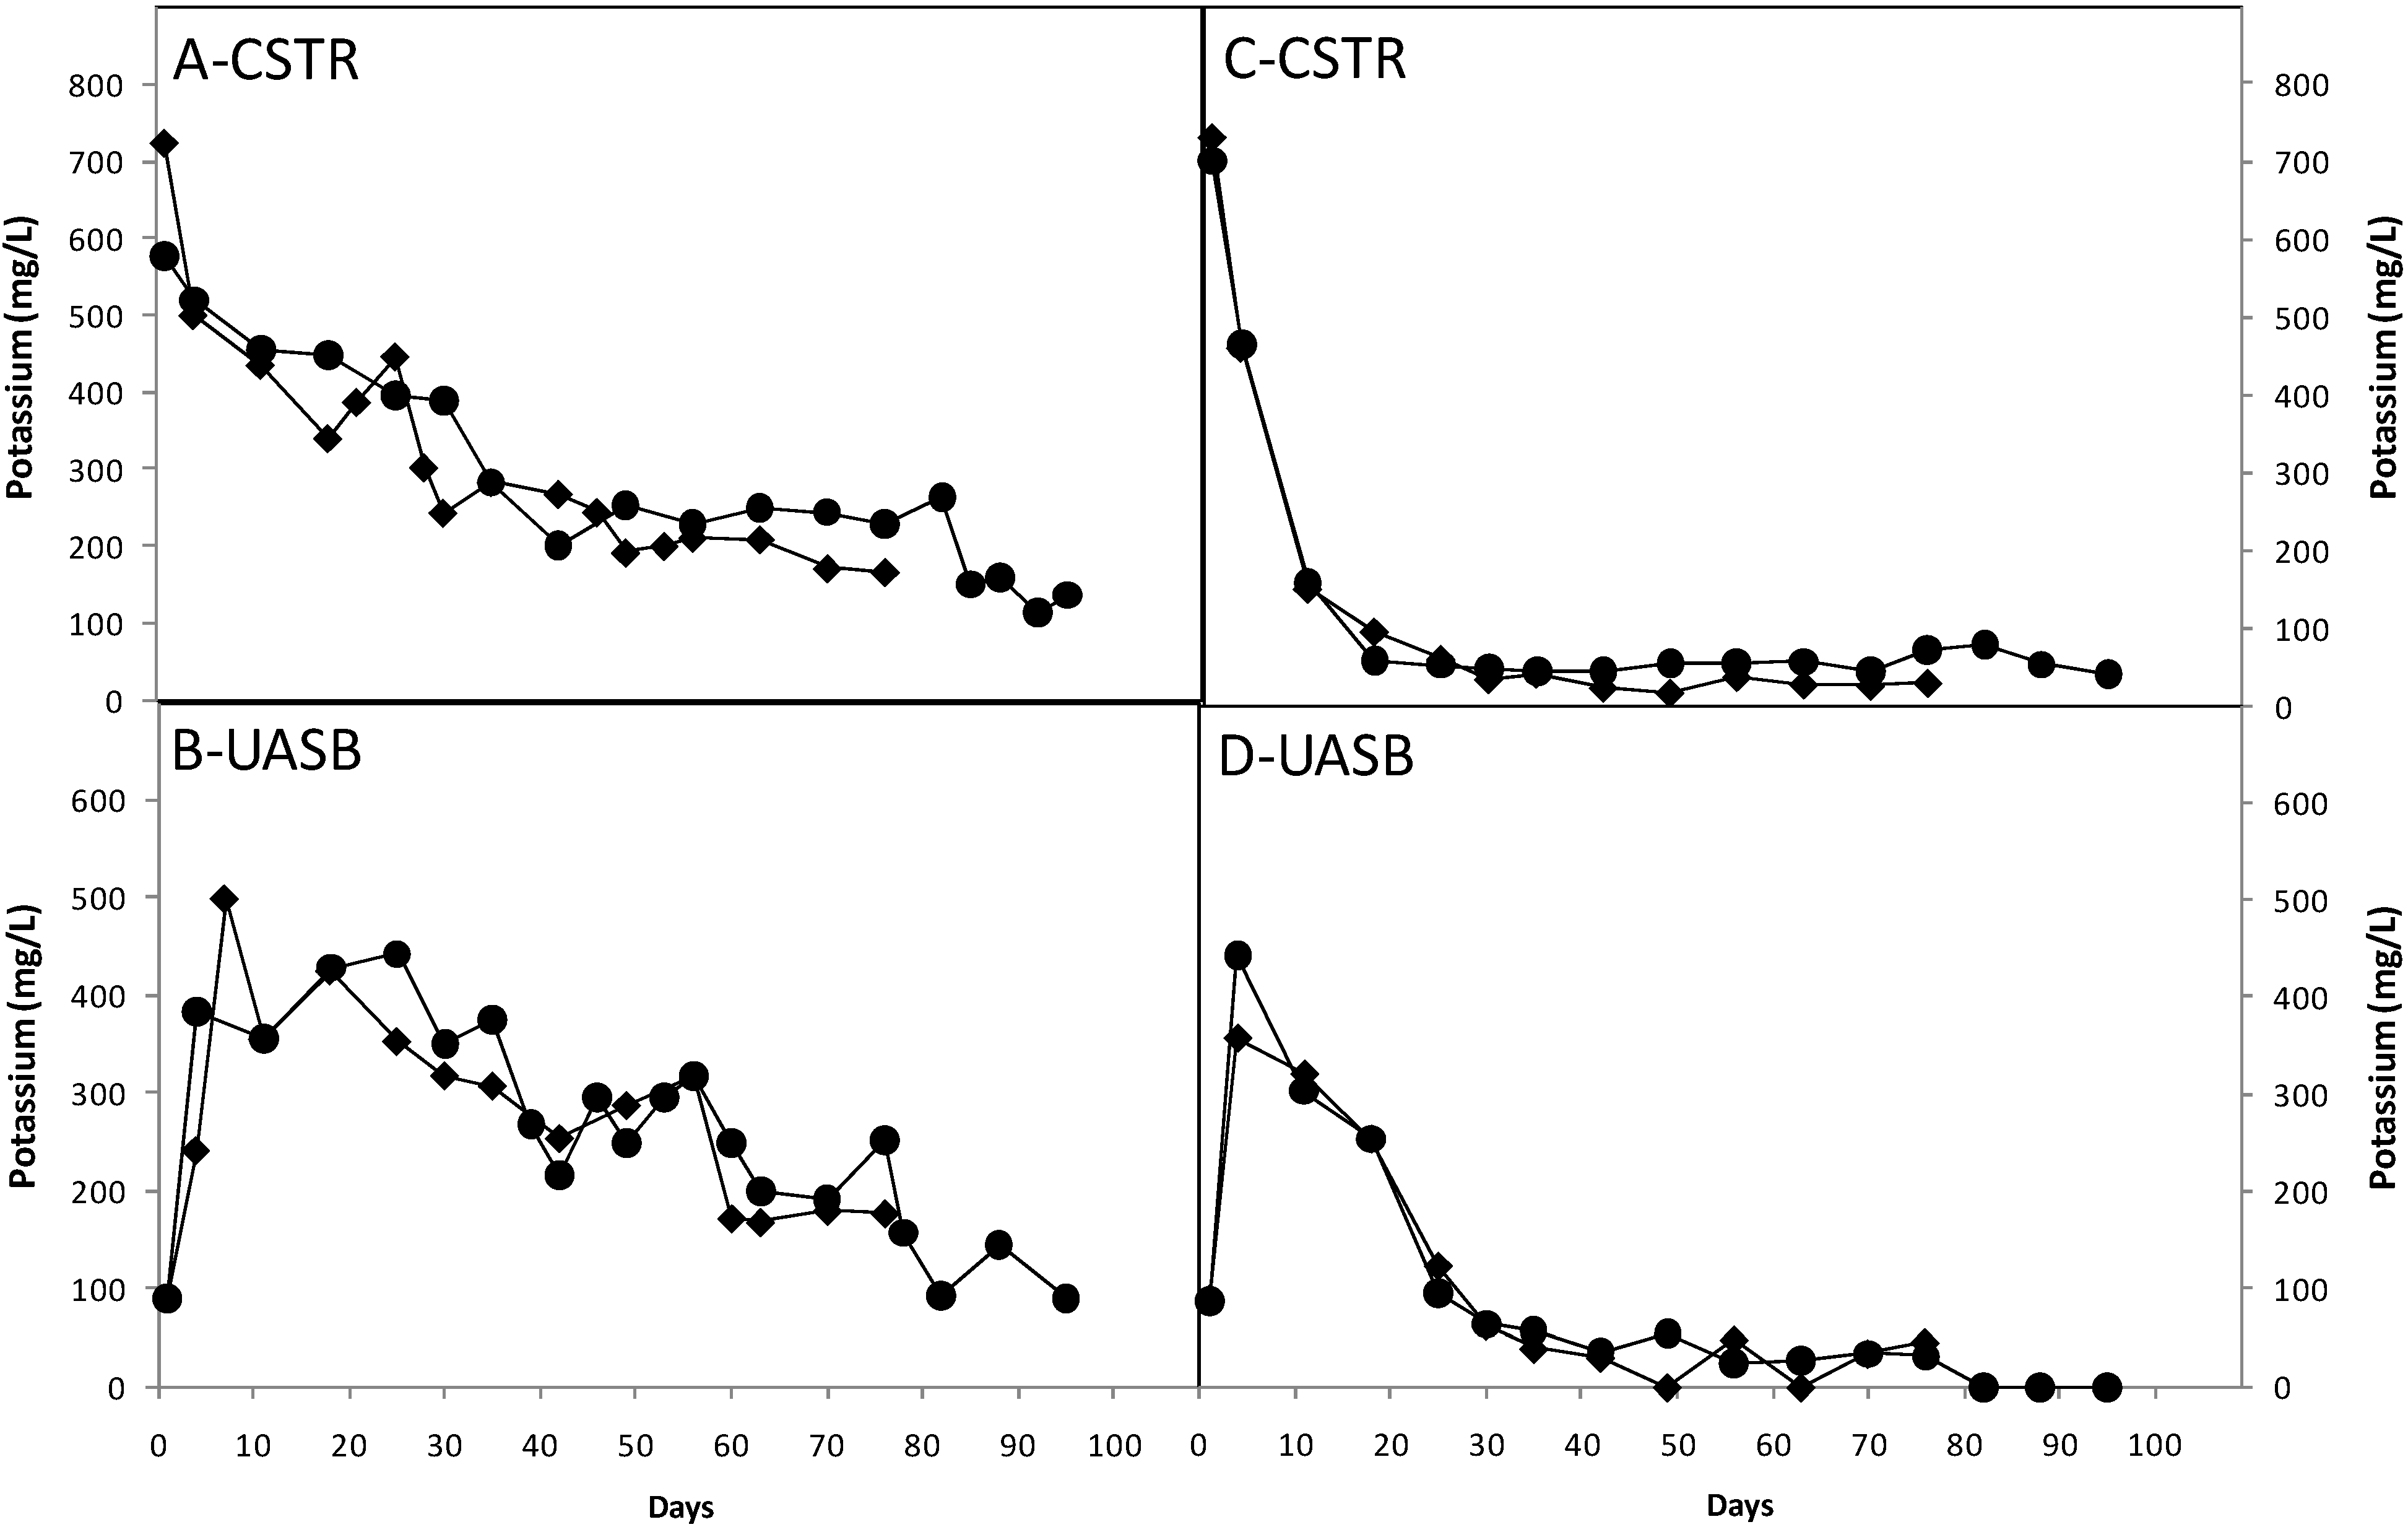
3.3. Effect of Nutrients

The effects of macronutrients, including ammonium and potassium were studied and the results of ammonium and potassium concentration during the entire experimental period are illustrated in Figure 5 and Figure 6.
A decreasing trend of nutrient concentration was observed for cotton and starch in both the open and closed systems. In the closed system, the final ammonium concentration in CSTR and UASB was four times higher than in the open system at OLR of 8 to 10 gVS/L/day for both the substrates. An interesting observation was obtained in OLR between 10 and 20 gVS/L/day. The concentration of ammonium show a sudden increase in the CSTR fed with starch in the closed system from 300 mg/L to more than 1300 mg/L (Figure 5A).
Figure 5. The ammonium concentration during the experimental period. ●- Starch; ♦- Cotton. (A) CSTR closed system; (B) UASB closed system; (C) CSTR open system; (D) UASB open system.
Energies 06 02966 g005
The same trend could also be observed in the potassium concentration for both starch and cotton as the potassium concentration declined in CSTR in both systems. However, in the closed system, the concentration was maintained between 100 and 500 mg/L (Figure 6A,C). On the other hand, in open system the concentration of potassium decreased to less 100 mg/L in both CSTR and UASB (Figure 6B,D).
Figure 6. The potassium concentration during the experimental period.●- Starch; ♦- Cotton. (A) CSTR closed system; (B) UASB closed system; (C) CSTR open system; (D) UASB open system.
Energies 06 02966 g006

3.4. Ratio of Methane to Carbon Dioxide

Anaerobic digestion of the carbohydrate in starch and cotton results in 50% methane (CH4/CO2 = 1 mol/mol) in the biogas formed. However, partial dissolution of carbon dioxide in water can lead to higher content of methane in the formed biogas. On the other hand, if the earlier steps in the digestion process (e.g., hydrolysis and acidogenesis) occur and methanogenic bacteria fail to produce methane, this CH4/CO2 ratio approaches to zero, since CO2 is still produced.
The ratio of methane to carbon dioxide in each stage of the experiments in this work is illustrated in Table 3. The increase in OLR had a significant effect on the methane to carbon dioxide ratio for both open and closed systems in CSTR.
In the CSTR open system for starch, the ratio CH4/CO2 ratio decreased from 2 to almost 0.1 at OLR 10 gVS/L/day. During the same period, the closed system could maintain a high ratio around 0.8. In UASB, in contrast the ratio was stable throughout the process for both systems. However, while adding 20 gVS/L/day OLR, the ratio was decreased for starch in the open system.
The CH4/CO2 ratio for cotton in CSTR was very stable in both open and closed system and did not show any significant change as the OLR increased from 2 to 4 gVS/L/day, being stable around 4.9. The CH4/CO2 ratio for cotton in UASB was somewhat lower than in CSTR for both systems, being around 2, and remained stable and during the entire process.
Table 3. The Ratio of methane to carbon dioxide, in open and closed system, for cotton and starch in UASB and CSTR.
SubstrateOLR (gVS/L/day)Ratio of methane to carbon dioxide
Open systemClosed system
CSTRUASBCSTRUASB
Cotton21.8 ± 0.24.4 ± 0.81.9 ± 0.24.4 ± 0.4
2.71.7 ± 0.14.9 ± 0.62.0 ± 0.14.2 ± 0.2
42.0 ± 0.04.9 ± 0.22.1 ± 0.04.1 ± 0.1
Starch22.0 ± 1.04.0 ± 0.52.1 ± 0.24.1 ± 0.6
2.71.3 ± 0.34.5 ± 0.62.2 ± 0.03.4 ± 0.2
41.0 ± 0.14.9 ± 0.21.8 ± 0.53.4 ± 0.1
80.3 ± 0.24.4 ± 0.10.9 ± 0.14.2 ± 0.3
100.1 ± 0.04.2 ± 0.20.8 ± 0.14.7 ± 0.4
200.07 ± 0.043.5 ± 0.80.7 ± 0.14.3 ± 0.8

4. Discussion

The results of this comparative study suggest that the recirculation in the closed system increases the stability and the performance of a two stage system, using substrates at high OLRs. A higher methane production was also achieved in the closed system comparing to open system for both substrates. The major share of methane production seems also to be higher in CSTR at lower OLRs rather than UASB for both processes and substrates. However, an interesting transition pattern is observed in both systems as the major share of methane production is shifted from CSTR to UASB Figure 2 and Figure 3. This shift, however appear to occur at earlier stages in the open system comparing to the closed system.
During OLR 2–2.7 gVS/L/day in the closed system the major share of the methane, produced in the UASB was around 90% in CSTR for both cotton and starch. However, the increase in OLR to 4 gVS/L/day decreased the total methane yield and the transition of the major share of methane production from CSTR to UASB begins. Additional increase of OLR to 8 gVS/L/day in closed system digesting starch shifted the major share of methane produced shifted from CSTR to UASB and it continued to increase with increasing OLR.
In the open system this transition was also observed, but at lower OLR (2.7 gVS/L/day) for both substrates. The decrease in methane yield, which is the starting point of the transition, could be explained by the accumulation of VFA in CSTR from less than 1 g/L to more than 8 g/L. The pH was more stable in the closed system, which could be due to the effect of effluent recirculation from UASB with pH around 8 to the CSTR and thereby stabilizing and keeping a stable pH over 6 in CSTR (data not shown). Furthermore, the VFA produced in the CSTR was converted to biogas in the UASB without accumulating in the first phase and reaching inhibitory levels for the acidogenesis process, which consequently contributes to the stability of the closed system in comparison to the open system. This transition on the other hand, was never reached in the closed system digesting cotton. A combination of the composition and efficient hydrolysis and the conversion of the intermediates to methane in the CSTR due to the effect of recirculation causing higher and stable pH can be the possible explanation [39].
The COD removal efficiency and the COD concentration in the CSTR were also affected by recirculation as it started to increase during the same time as the transition occurs. The COD concentration in the CSTR is highly dependent on the hydrolysis of the organic material to VFA and follows more or less the same trend. The COD removal efficiency was higher, around 95%, in the open system comparing to closed system which started for starch at the OLR 8 gVS/L/day to almost 85%. However the COD efficiency in closed system could also be increased at higher OLR comparing to open system. This also shows that UASB is more efficient at higher COD concentrations and could handle high OLRs.
In contrast, the concentration of COD in the UASB decreased as the OLR increased in the open system compared to closed system. The COD concentration in the closed system stayed stable between 1500 and 2000 mg/L for cotton and around 3000 mg/L for starch. It could be because of some solubilized material kept recirculating in the system, and thereby keeping the COD both higher and stable in closed system for both substrates, without having any considerable effects on the process. Furthermore, when the OLR was increased further to 20 g VS/L/d for starch in open system, the COD concentration in CSTR was decreased to approximately 1000 mg/L. This observation indicates that the capacity of the CSTR to hydrolyze cotton and starch is limited. This capacity was obtained as less than 4 gVS/L/day for cotton, and 10–20 gVS/L/day for starch.
The ratio of methane to carbon dioxide was increased in UASB and decreased in CSTR in the closed system. The increased CH4/CO2 ratio in the UASB could be due to dissolution of some part of the produced carbon dioxide in the UASB and the capacity of the media in the UASB to capture and further convert the carbon dioxide to methane by methanogens [39]. In the CSTR open system for starch, the CH4/CO2 ratio decreased from 2 to almost 0.1 at OLR 10 gVS/L/day. During the same period, the closed system could maintain a high ratio around 0.8. As the pH falls in the CSTR, the more CO2 is dissolved to compensate as buffering system. A too strong acidification, consumes the entire CO2 produced to keep the pH stable, which consequently inhibits the methanogens [40], and hence, lower CH4/CO2 ratio in the CSTR open system comparing to the CSTR closed system. This is an indication that recirculation could be able to support the microorganisms for effective hydrolysis in CSTR. In UASB, the ratio was stable throughout the process for both systems.
In the closed system, the final ammonium concentration in CSTR and UASB was four times higher than in the open system for both starch and cotton. The closed system supported the maintenance of the nutrients in the system, compared to the open system, where fresh nutrients were added every day. Since no liquid was removed or added to the system, the nutrients kept recycling in a closed cycle in the process, leading to negligible loss of nutrients compared to the open system. An interesting observation was obtained in OLR between 10 and 20 gVS/L/day in CSTR closed system. The concentration of ammonium show a sudden increase at OLR 10–20 gVS/L/day in CSTR closed system fed with starch (Figure 5A). This could be explained by the fact that shorter HRT, which is accomplished by the increase in flow rate, causes high upflow velocities and thereby turbulence in the UASB. The consequence of this high flow rate is granule disintegration as the effect of shearing. The resulting fragments are then washed out of the reactor [41] and are migrated to the CSTR by recirculation. The subsequent degradation of the biomass and the release of the proteins into the medium in CSTR cause an increase in the ammonium concentration [42].

5. Conclusions

The effect of recirculation in a semi-continuous two-stage anaerobic digestion combining CSTR and UASB was studied using starch and cotton as substrate. The comparison of the closed system with open system revealed that higher theoretical yield of methane could be achieved in the closed system compared to the open system. Furthermore, it can be concluded that the recirculation could support the hydrolysis step as well as avoiding nutrient loss at higher OLR and thus improving the performance and the stability of the process a great deal.

Acknowledgements

This work was financially supported by Sparbank foundation in Sjuhärad (Sweden) and Borås Energy and Environment AB (Sweden). The authors acknowledge Gopinath Balasubramanian for experimental, technical and analytical support.

Conflicts of Interest

The authors declare no conflict of interest.

References

  1. Asam, Z.-U.-Z.; Poulsen, T.G.; Nizami, A.-S.; Rafique, R.; Kiely, G.; Murphy, J.D. How can we improve biomethane production per unit of feedstock in biogas plants? Appl. Energy 2011, 88, 2013–2018. [Google Scholar] [CrossRef]
  2. Chynoweth, D.P.; Owens, J.M.; Legrand, R. Renewable methane from anaerobic digestion of biomass. Renew. Energy 2001, 22, 1–8. [Google Scholar] [CrossRef]
  3. Yadvika; Santosh; Sreekrishnan, T.R.; Kohli, S.; Rana, V. Enhancement of biogas production from solid substrates using different techniques––A review. Bioresour. Technol. 2004, 95, 1–10. [Google Scholar] [CrossRef] [PubMed]
  4. Mahmoud, N.; Zeeman, G.; Gijzen, H.; Lettinga, G. Solids removal in upflow anaerobic reactors, a review. Bioresour. Technol. 2003, 90, 1–9. [Google Scholar] [CrossRef] [PubMed]
  5. Vartak, D.R.; Engler, C.R.; McFarland, M.J.; Ricke, S.C. Attached-film media performance in psychrophilic anaerobic treatment of dairy cattle wastewater. Bioresour. Technol. 1997, 62, 79–84. [Google Scholar] [CrossRef]
  6. Tay, J.-H.; Zhang, X. Stability of high-rate anaerobic systems. I: Performance under shocks. J. Environ. Eng. 2000, 126, 713–725. [Google Scholar] [CrossRef]
  7. Lettinga, G. Anaerobic digestion and wastewater treatment systems. Antonie Van Leeuwenhoek 1995, 67, 3–28. [Google Scholar] [CrossRef] [PubMed]
  8. Schmidt, J.E.; Ahring, B.K. Granular sludge formation in upflow anaerobic sludge blanket (UASB) reactors. Biotechnol. Bioeng. 1996, 49, 229–246. [Google Scholar] [CrossRef] [PubMed]
  9. Lyberatos, G.; Skiadas, I.V. Modelling of anaerobic digestion—A review. Glob. Nest. Int. J. 1999, 1, 63–76. [Google Scholar]
  10. Lettinga, G.; van Velsen, A.F.M.; Hobma, S.W.; de Zeeuw, W.; Klapwijk, A. Use of the upflow sludge blanket (USB) reactor concept for biological wastewater treatment, especially for anaerobic treatment. Biotechnol. Bioeng. 1980, 22, 699–734. [Google Scholar] [CrossRef]
  11. Bal, A.S.; Dhagat, N.N. Upflow anaerobic sludge blanket reactor—A review. Indian J. Environ. Health 2001, 43, 1–83. [Google Scholar] [PubMed]
  12. Shin, H.S.; Han, S.K.; Song, Y.C.; Lee, C.Y. Performance of UASB reactor treating leachate from acidogenic fermenter in the two-phase anaerobic digestion of food waste. Water Res. 2001, 35, 3441–3447. [Google Scholar] [CrossRef] [PubMed]
  13. Ince, O. Performance of a two-phase anaerobic digestion system when treating dairy wastewater. Water Res. 1998, 32, 2707–2713. [Google Scholar] [CrossRef]
  14. Demirel, B.; Yenigün, O. Two-phase anaerobic digestion processes: A review. J. Chem. Technol. Biotechnol. 2002, 77, 743–755. [Google Scholar] [CrossRef]
  15. Verrier, D.; Roy, F.; Albagnac, G. Two-phase methanization of solid vegetable wastes. Biol. Wastes 1987, 22, 163–177. [Google Scholar] [CrossRef]
  16. Bouallagui, H.; Torrijos, M.; Godon, J.J.; Moletta, R.; Ben Cheikh, R.; Touhami, Y.; Delgenes, J.P.; Hamdi, M. Two-phases anaerobic digestion of fruit and vegetable wastes: Bioreactors performance. Biochem. Eng. J. 2004, 21, 193–197. [Google Scholar] [CrossRef]
  17. Chanakya, H.N.; Borgaonkar, S.; Rajan, M.G.C.; Wahi, M. Two-phase anaerobic digestion of water hyacinth or urban garbage. Bioresour. Technol. 1992, 42, 123–131. [Google Scholar] [CrossRef]
  18. Ghosh, S.; Ombregt, J.P.; Pipyn, P. Methane production from industrial wastes by two-phase anaerobic digestion. Water Res. 1985, 19, 1083–1088. [Google Scholar] [CrossRef]
  19. Yu, H.W.; Samani, Z.; Hanson, A.; Smith, G. Energy recovery from grass using two-phase anaerobic digestion. Waste Manag. 2002, 22, 1–5. [Google Scholar] [CrossRef] [PubMed]
  20. Calzada, J.F.; de Porres, E.; Yurrita, A.; de Arriola, M.C.; de Micheo, F.; Rolz, C.; Menchú, J.F.; Cabello, A. Biogas production from coffee pulp juice: One- and two-phase systems. Agric. Wastes 1984, 9, 217–230. [Google Scholar] [CrossRef]
  21. Koster, I.W. Liquefaction and acidogenesis of tomatoes in an anaerobic two-phase solid-waste treatment system. Agric. Wastes 1984, 11, 241–252. [Google Scholar] [CrossRef]
  22. Yeoh, B.G. Two-phase anaerobic treatment of cane-molasses alcohol stillage. Water Sci. Technol. 1997, 36, 441–448. [Google Scholar] [CrossRef]
  23. Goel, B.; Pant, D.C.; Kishore, V.V.N. Two-phase anaerobic digestion of spent tea leaves for biogas and manure generation. Bioresour. Technol. 2001, 80, 153–156. [Google Scholar] [CrossRef] [PubMed]
  24. Lo, K.V.; Liao, P.H. Two-phase anaerobic digestion of screened dairy manure. Biomass 1985, 8, 81–90. [Google Scholar] [CrossRef]
  25. Liao, P.H.; Lo, K.V. Two-phase thermophilic anaerobic digestion of screened dairy manure. Biomass 1985, 8, 185–194. [Google Scholar] [CrossRef]
  26. Lo, K.V.; Chen, W.Y.; Liao, P.H. Mesophilic digestion of screened dairy manure using anaerobic rotating biological contact reactor. Biomass 1986, 9, 81–92. [Google Scholar] [CrossRef]
  27. Demirer, G.N.; Chen, S. Two-phase anaerobic digestion of unscreened dairy manure. Process Biochem. 2005, 40, 3542–3549. [Google Scholar] [CrossRef]
  28. Fezzani, B.; Ben Cheikh, R. Two-phase anaerobic co-digestion of olive mill wastes in semi-continuous digesters at mesophilic temperature. Bioresour. Technol. 2010, 101, 1628–1634. [Google Scholar] [CrossRef] [PubMed]
  29. Wang, Z.; Banks, C.J. Evaluation of a two stage anaerobic digester for the treatment of mixed abattoir wastes. Process Biochem. 2003, 38, 1267–1273. [Google Scholar] [CrossRef]
  30. Bhattacharya, S.K.; Madura, R.L.; Walling, D.A.; Farrell, J.B. Volatile solids reduction in two-phase and conventional anaerobic sludge digestion. Water Res. 1996, 30, 1041–1048. [Google Scholar] [CrossRef]
  31. Diamantis, V.; Aivasidis, A. Two-stage uasb design enables activated-sludge free treatment of easily biodegradable wastewater. Bioproc. Biosyst. Eng. 2010, 33, 287–292. [Google Scholar] [CrossRef]
  32. Diamantis, V.I.; Aivasidis, A. Comparison of single- and two-stage UASB reactors used for anaerobic treatment of synthetic fruit wastewater. Enzym. Microb. Technol. 2007, 42, 6–10. [Google Scholar] [CrossRef]
  33. Feng, C.; Shimada, S.; Zhang, Z.; Maekawa, T. A pilot plant two-phase anaerobic digestion system for bioenergy recovery from swine wastes and garbage. Waste Manag. 2008, 28, 1827–1834. [Google Scholar] [CrossRef] [PubMed]
  34. Sabry, T. Application of the UASB inoculated with flocculent and granular sludge in treating sewage at different hydraulic shock loads. Bioresour. Technol. 2008, 99, 4073–4077. [Google Scholar] [CrossRef] [PubMed]
  35. Joubert, W.A.; Britz, T.J.; Lategan, P.M. The effect of effluent recirculation on the performance of a two stage anaerobic process. Biotechnol. Lett. 1985, 7, 853–858. [Google Scholar] [CrossRef]
  36. Suss, H.U.; Kronis, J.D. The Correlation of Cod and Yield in Chemical Pulp Bleaching. In Presented at Tappi Breaking the Pulp Yield Barrier Symposium, Atlanta, GA, USA, 8–12 March 1998.
  37. Osuna, M.B.; Zandvoort, M.H.; Iza, J.M.; Lettinga, G.; Lens, P.N.L. Effects of trace element addition on volatile fatty acid conversions in anaerobic granular sludge reactors. Environ. Technol. 2003, 24, 573–587. [Google Scholar] [CrossRef] [PubMed]
  38. Jeihanipour, A.; Aslanzadeh, S.; Rajendran, K.; Balasubramanian, G.; Taherzadeh, M. High-rate biogas production from waste textiles using a two-stage process. Renew. Energy 2013, 52, 128–135. [Google Scholar] [CrossRef]
  39. Alimahmoodi, M.; Mulligan, C.N. Anaerobic bioconversion of carbon dioxide to biogas in an upflow anaerobic sludge blanket reactor. J. Air Waste Manag. Assoc. 2008, 58, 95–103. [Google Scholar] [CrossRef] [PubMed]
  40. Deublein, D.; Steinhauser, A. Biology. In Biogas from Waste and Renewable Resources; Wiley-VCH Verlag GmbH & Co. KGaA: Weinheim, Germany, 2008; pp. 93–128. [Google Scholar]
  41. Kosaric, N.; Blaszczyk, R.; Orphan, L. Factors influencing formation and maintenance of granules in anaerobic sludge blanket reactors (UASBR). Water Sci. Technol. 1990, 22, 275–282. [Google Scholar]
  42. Blaszczyk, R.; Gardner, D.; Kosaric, N. Response and recovery of anaerobic granules from shock loading. Water Res. 1994, 28, 675–680. [Google Scholar] [CrossRef]

