Article

Results from a Novel Method for Corrosion Studies of Electroplated Lithium Metal Based on Measurements with an Impedance Scanning Electrochemical Quartz Crystal Microbalance

Münster Electrochemical Energy Technology (MEET) Battery Research Center, Institute of Physical Chemistry, University of Münster, Corrensstr. 46, 48149 Münster, Germany
*
Authors to whom correspondence should be addressed.
Energies 2013, 6(7), 3481-3505; https://doi.org/10.3390/en6073481
Submission received: 3 May 2013 / Revised: 14 June 2013 / Accepted: 3 July 2013 / Published: 15 July 2013
(This article belongs to the Special Issue Li-ion Batteries and Energy Storage Devices)

Abstract

:
A new approach to study the chemical stability of electrodeposited lithium on a copper metal substrate via measurements with a fast impedance scanning electrochemical quartz crystal microbalance is presented. The corrosion of electrochemically deposited lithium was compared in two different electrolytes, based on lithium difluoro(oxalato) borate (LiDFOB) and lithium hexafluorophosphate, both salts being dissolved in solvent blends of ethylene carbonate and diethyl carbonate. For a better understanding of the corrosion mechanisms, scanning electron microscopy images of electrodeposited lithium were also consulted. The results of the EQCM experiments were supported by AC impedance measurements and clearly showed two different corrosion mechanisms caused by the different salts and the formed SEIs. The observed mass decrease of the quartz sensor of the LiDFOB-based electrolyte is not smooth, but rather composed of a series of abrupt mass fluctuations in contrast to that of the lithium hexafluorophosphate-based electrolyte. After each slow decrease of mass a rather fast increase of mass is observed several times. The slow mass decrease can be attributed to a consolidation process of the SEI or to the partial dissolution of the SEI leaving finally lithium metal unprotected so that a fast film formation sets in entailing the observed fast mass increases.

1. Introduction

The chemical stability of lithium on a metal substrate is a major issue in battery research as it plays an important role for the self-discharge behavior of primary and secondary batteries using lithium metal anodes. It is generally accepted that the chemical stability of the anode of a lithium ion cell or even a rechargeable cell with a lithium metal anode is mainly influenced by changes at the electrode/electrolyte interface caused by reactions of the anode material with the electrolyte [1] depending on electrolyte composition [2,3,4] and type of anode material [5,6]. However, these complex mechanisms are still not fully understood [1]. One of the most often used techniques to study this issue is AC impedance spectroscopy [1,7]. This method gives access to many parameters and processes that have to be studied for understanding ageing mechanisms. A method offering similar opportunities as AC impedance spectroscopy is the electrochemical quartz crystal microbalance (EQCM) in the form of the recently presented fast impedance scanning (FIS) quartz crystal microbalance (fis-QCM) technique [8,9]. Like AC impedance spectroscopy, it offers fast, non-destructive, in situ measurements and is therefore a method of choice in studying processes at the electrode surface [1,9].
The chemical stability of deposited lithium can be understood as a corrosion process when the chemical stability of deposited lithium is investigated under open circuit potential (OCP) conditions [10]. This approach is followed in this work. The FIS-EQCM is a powerful tool for the investigation of corrosion processes [11,12,13]. The advantage of this electroanalytical method is based on simultaneous in situ measurements of mass, charge and potential change in electrochemical processes [14], if certain boundary conditions are fulfilled.
The basic principle of this method was introduced by Sauerbrey [15] and consists of the linear relationship between the deposited (or withdrawn) mass ∆m >0 or <0 on the working electrode and the resulting change in the resonance frequency ∆f <0 or >0 of the quartz sensor [16]. Therefore, with the Sauerbrey equation it is possible to detect both mass deposition and mass dissolution at the surface of a quartz sensor. In case of a deposition process (∆m >0) a frequency decrease (∆f <0) is observed:
f =     2 f 0 2 A ρ Q μ Q m
where ∆f is the frequency change due to mass change ∆m, f0 is the resonance frequency, A is the active surface of the quartz, and ρQ and μQ are the density and shear modulus of the quartz crystal, respectively. These parameters f0, A, ρQ and μQ are material constants of the sensor quartz hence the Sauerbrey Equation (1) can be simplified in this case to the following equation [15]:
f =     C f m
The calibration factor Cf can be obtained via a calibration measurement, e.g., by the deposition of known amounts of a known material.
Unfortunately, the frequency change of the sensor quartz is not only caused by the mass change due to deposition or dissolution of compounds at its surface but also by parallel changes of the roughness factor of its surface [17] and also in some experiments, by changes of solution properties, which was first shown by Kanazawa et al. [18]. Recently, we used these changes of solution properties to determine the solubility of solids in liquids by this novel method [19].
Therefore, for surface film formation processes change of mass and change of the roughness factor should always be discussed together, which implies that for these systems the Sauerbrey equation [see Equation (2)] is only able to explain the observed processes on a comparative basis. Unfortunately, there are just a few publications dealing with lithium deposition/dissolution processes and the solid electrolyte interphase (SEI) formation studied by EQCM measurements [14,20,21]. A possible reason for that could be the difficulties in quartz preparation. To study lithium deposition/dissolution processes the quartz surface has to be coated with a copper-, titanium- or nickel-film, because these metals do not form an alloy with lithium. However, most commercially available sensor quartzes are coated with gold, platinum or aluminum. Therefore, many research groups study SEI formation processes and accompanied layer thickness with model systems, using gold quartz crystals as working electrodes (WE) [22,23] for instance. Copper or nickel surfaces have been made in the laboratory, for example, by electrochemical deposition or via sputtering [14,20]. However, properties of these thin metal films naturally differ from bulk metal foils that are used as current collectors in batteries [24]. To make the results of lithium deposition/dissolution experiments of the EQCM more comparable with results from classic lithium deposition/dissolution experiments we tried to glue the appropriate metal foil onto the quartz surface using a method that was first published by Bucur et al. [24]. He and his research group were able to glue various kinds of metal foils, including aluminum, nickel, copper and platinum onto a quartz sensor surface. Examples from our group include an aluminum foil that was used to study the anodic dissolution of the other current collector in a lithium ion cell the aluminum current collector [10,25,26]. To our knowledge no other results from EQCM experiments have been published until now, where corrosion processes of deposited lithium on a copper foil which was glued on the quartz sensor were investigated. Hence, this publication is the first work reporting studies of chemical stability of deposited lithium on copper by an EQCM. Corrosion processes of lithium electrodeposited from 1 M lithium difluoro(oxalato)borate (LiDFOB) and 1 M lithium hexafluoro-phosphate (LiPF6) both in solvent blends of ethylene carbonate (EC) and diethyl carbonate (DEC) (3:7, by wt.) were compared. As LiDFOB was recently checked as a possible new salt for secondary lithium metal batteries [27] the influence of this salt on the chemical stability of deposited lithium was investigated as well. Since this salt was first published by Zhang in 2006 [28] its characteristics have been extensively studied, mainly for possible applications in secondary lithium ion batteries [25,29,30,31,32]. LiDFOB combines the advantages of lithium bis(oxalato)borate (LiBOB) and lithium tetrafluoroborate (LiBF4) when used in electrolytes for lithium ion cells as LiDFOB comprises the same molecular moieties as LiBOB and LiBF4 [28,29]. Therefore, LiDFOB-based electrolytes can fulfill the requirements for electrolytes needed for lithium ion batteries. There are only two properties, conductivity and electrochemical stability window in non-aqueous solutions, where LiDFOB electrolytes cannot fully reach the performance of LiPF6 containing electrolytes [32]. The benefits of LiDFOB based electrolytes include a cationic transference number of 1 M LiDFOB in EC:DEC (3:7, by wt.) that is significantly higher than that of 1 M LiPF6 in this solvent mixture (0.33 vs. 0.24) [33,34] and the ability to form a very stable and protecting SEI [35,36] on graphite electrodes, just like LiBOB [29,30,37]. Beyond that, the SEI built in an LiDFOB-based electrolyte is also a very good lithium ion conductor, comparable with the SEIs of LiBF4-based electrolytes [29,30]. Furthermore, LiDFOB has higher solubility in organic carbonates than LiBOB [1.4 mol kg−1solvent vs. 0.65 mol kg−1solvent in EC-DEC (3:7, by wt.)] [25,38]. The higher concentrated LiDFOB-based electrolytes also show a lower viscosity and better wettability than that of the comparable LiBOB-based electrolytes [29]. Other important features of LiDFOB include its very good protection of the aluminum current collector against anodic dissolution [10,25,26,32,39] and even more important, the good thermal stability of LiDFOB [31]. Furthermore, the fact that no hydrogen fluoride (HF) generation occurs during hydrolysis in solvents with low water content [25,40,41] introduces this salt as one of the most promising alternatives for LiPF6. It is known that in LiPF6 based electrolytes, HF formation takes place in presence of traces of water [41,42]. This property could even promote cheaper and environmentally more preferable cathode materials such as lithium manganese oxide spinels [25] for lithium and lithium ion batteries [43,44]. Furthermore, LiDFOB as additive in LiPF6-based electrolytes has the ability to inhibit electrolyte oxidation and reducing thus dissolution of Mn-, Ni-, and Co-ions due to an enhanced film formation on Li1.2Ni0.15Mn0.55Co0.1O2–based cathode materials [45]. Finally, LiDFOB-based electrolytes show a better low temperature cycling performance than LiBOB-based electrolytes because of a reduced charge-transfer resistance [29,30] and a better lithium ion cell performance at high temperatures than the state of the art LiPF6-based electrolytes [31,42].

2. Results and Discussion

2.1. Fast Impedance Scanning Electrochemical Quartz Crystal Microbalance (fis-EQCM)

In this section and subsequent sections we use the observed frequency change and convert it into an attributed mass change via the Sauerbrey equation. For limitations of this interpretation that are also taken into account in interpreting the observations, see Section 1.
The main results of EQCM experiments are shown in Figure 1 and Figure 2, where the time dependence of potential and attributed mass change of the OCP measurement after lithium was deposited is shown for LiDFOB-based and LiPF6-based electrolytes. The results of electrodeposition of lithium onto the surface of the copper foil on quartz by applying 0.36 A s are shown in detail in Figure 3 and Figure 4 for both electrolytes, respectively. The electrode potential curves in both electrolytes showed the typical behavior when lithium is deposited on a metal substrate. After the beginning of lithium deposition the attributed mass of the quartz-sensors for both electrolytes increased linearly until the current was switched off after 360 s. During the first 40 s of the OCP measurements no additional mass changes were observed for both electrolytes. However, the slopes of the straight lines of the linear fits of the Δm(t) curves were different for both electrolytes. For the LiDFOB-based electrolyte a slope of (0.3587 ± 0.0004) µg cm−2 s−1, for the LiPF6-based electrolyte a larger slope of (0.7146 ± 0.0009) µg cm−2 s−1 is obtained showing that the mass change with time is about twice as fast for the LiPF6-based electrolyte. Accordingly, the resulting ∆m values were 254 µg cm−2 (LiPF6) and 120 µg cm−2 (LiDFOB). When we would assume in a thought experiment ideal behavior including (i) the applied charge of 0.36 As would only lead to deposition of just lithium metal onto the surface of the sensor; (ii) this lithium layer would show ideal metallic properties with a smooth surface and no SEI formation; and (iii) no changes of bulk electrolyte properties would occur, the expected (theoretical) mass change of copper foil on quartz would be 25.9 µg cm−2 for both electrolytes according to Faraday’s law. In practice, we observed a mass increase that was 10 times (5 times) larger than the expected value. These deviations are a matter of discussion in subsequent sections.
Figure 1. Time dependence of potential and attributed mass change during the OCP measurement after lithium was deposited on copper in 1 M LiDFOB in EC-DEC (3:7, by wt.).
Energies 06 03481 g001
Figure 2. Time dependence of potential and attributed mass change during the OCP measurement after lithium was deposited on copper in 1 M LiPF6 in EC-DEC (3:7, by wt.).
Energies 06 03481 g002
Figure 3. Time dependence of potential and attributed mass change during the chronopotentiometric deposition of lithium on the copper foil on quartz in 1 M LiDFOB in ECDEC (3:7, by wt.).
Energies 06 03481 g003
Figure 4. Time dependence of potential and attributed mass change during the chronopotentiometric deposition of lithium on the copper foil on quartz in 1 M LiPF6 in EC:DEC (3:7, by wt.).
Energies 06 03481 g004

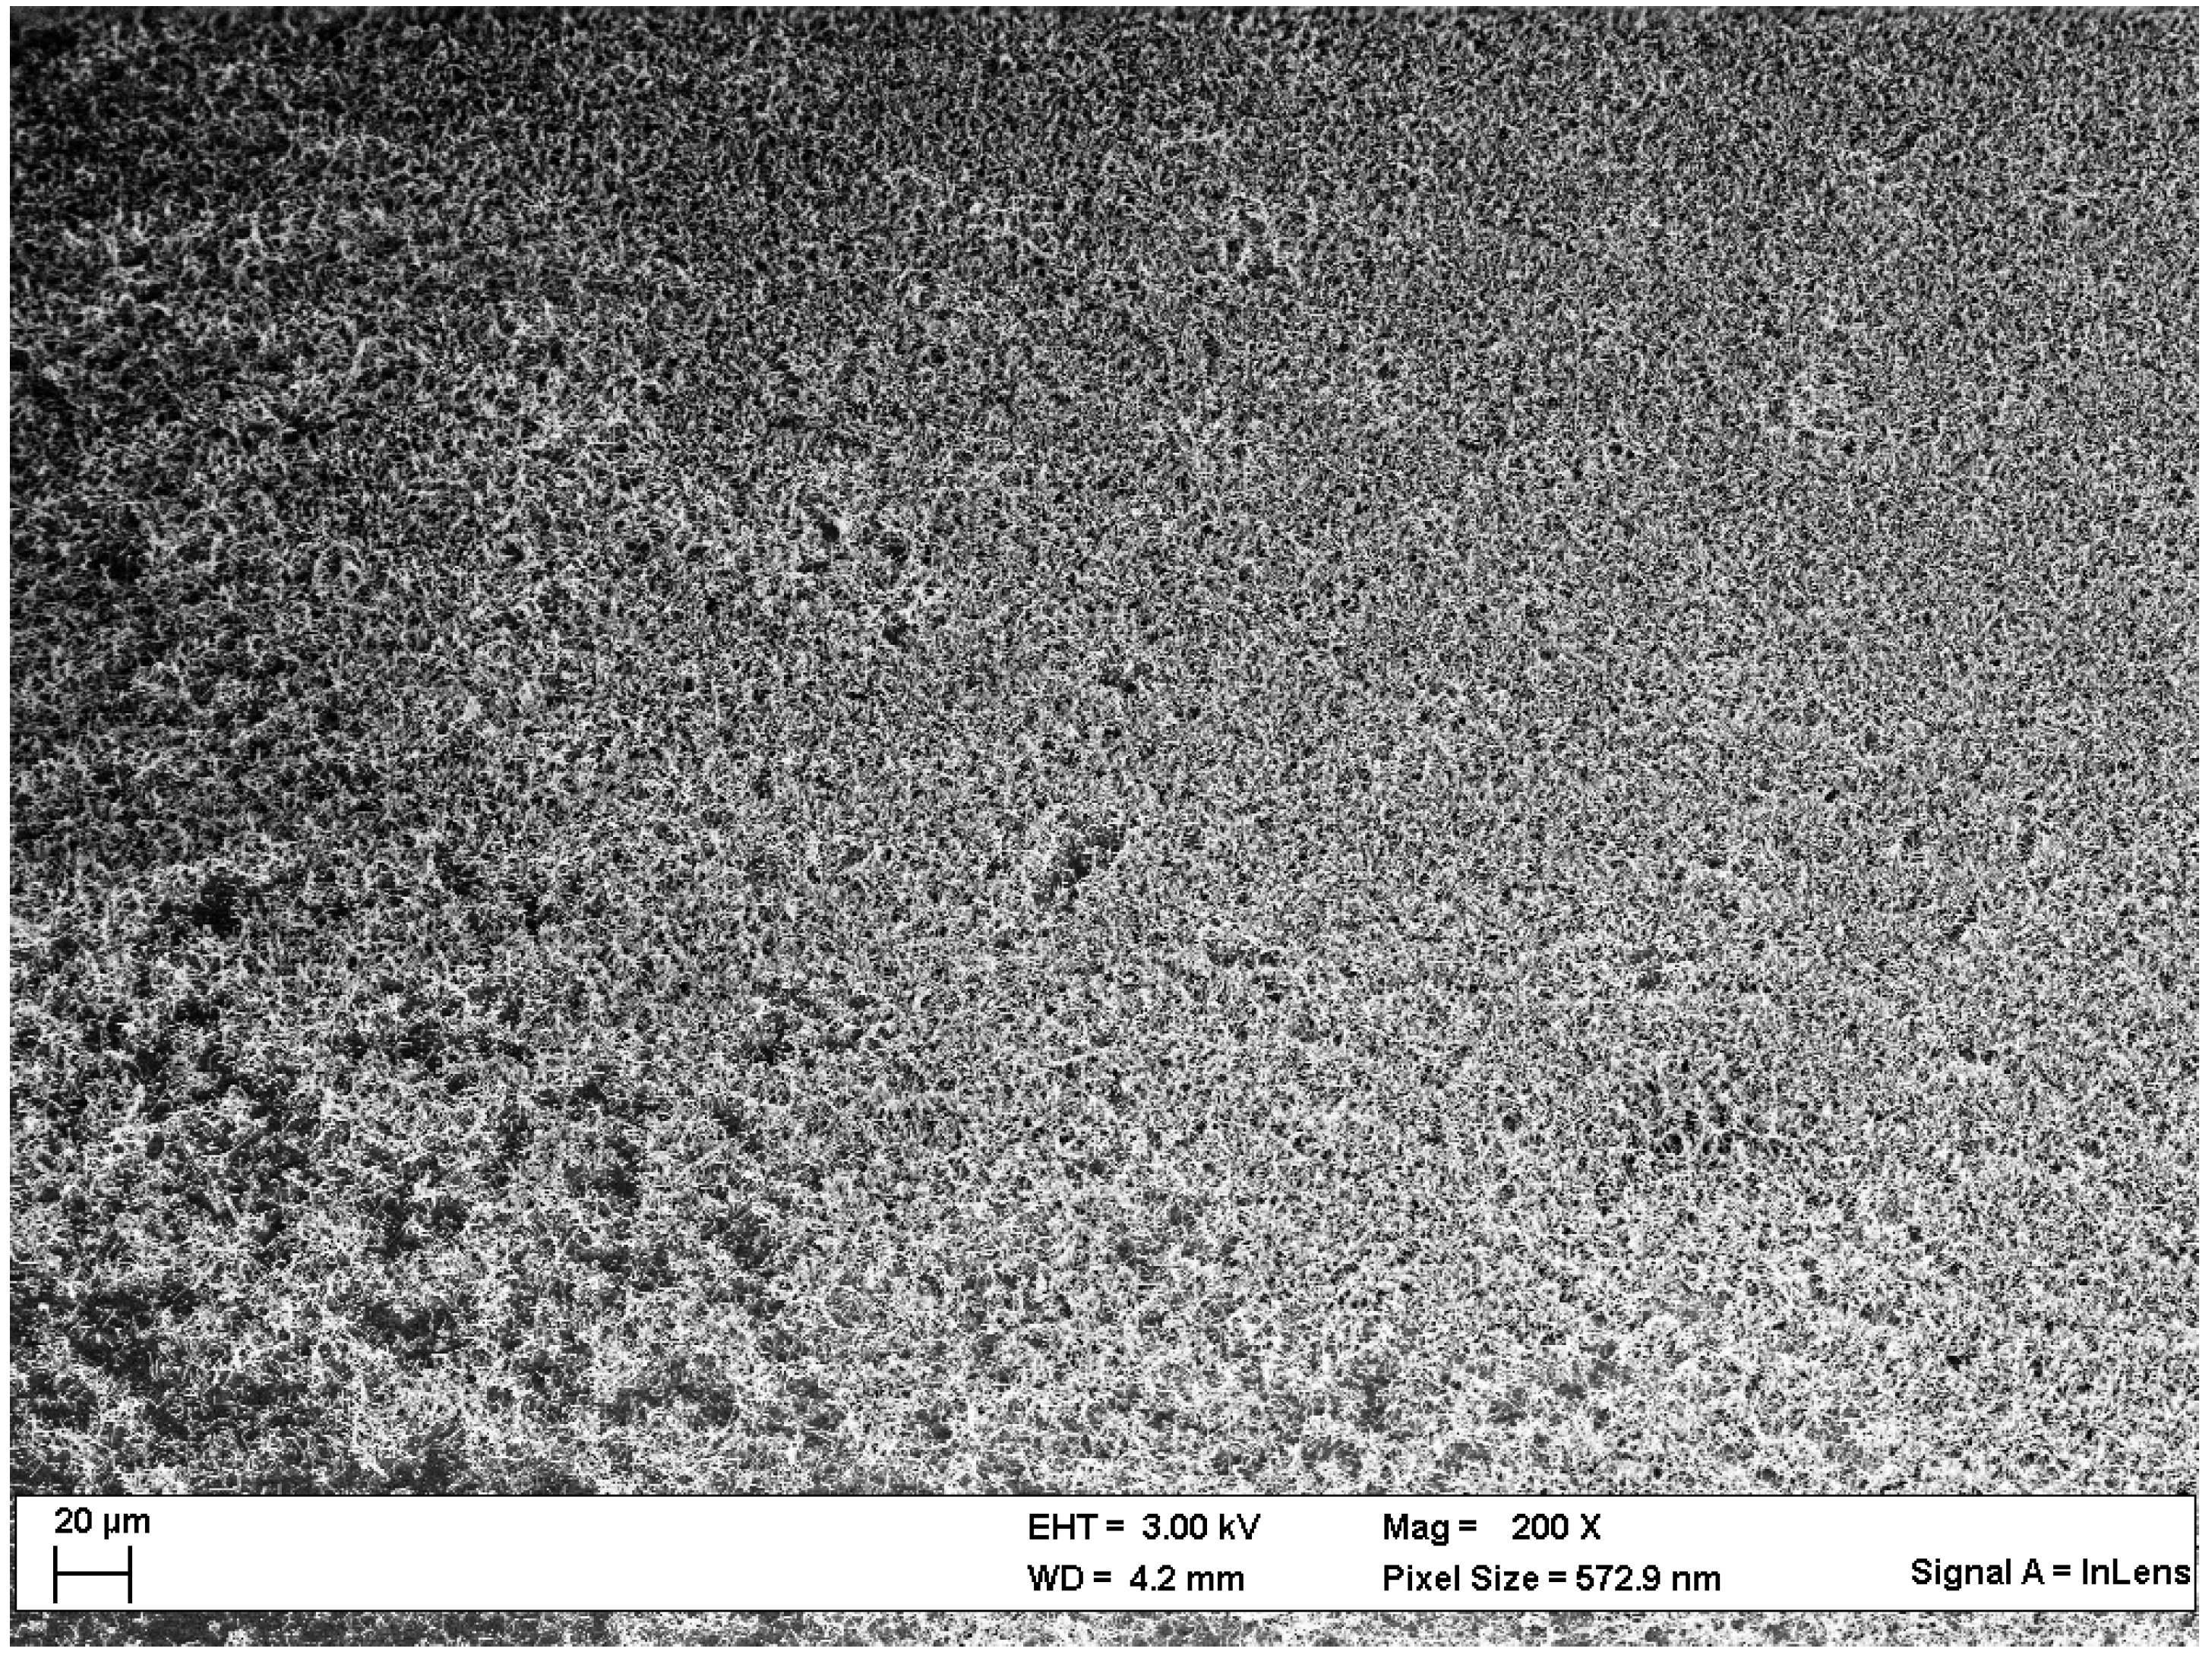
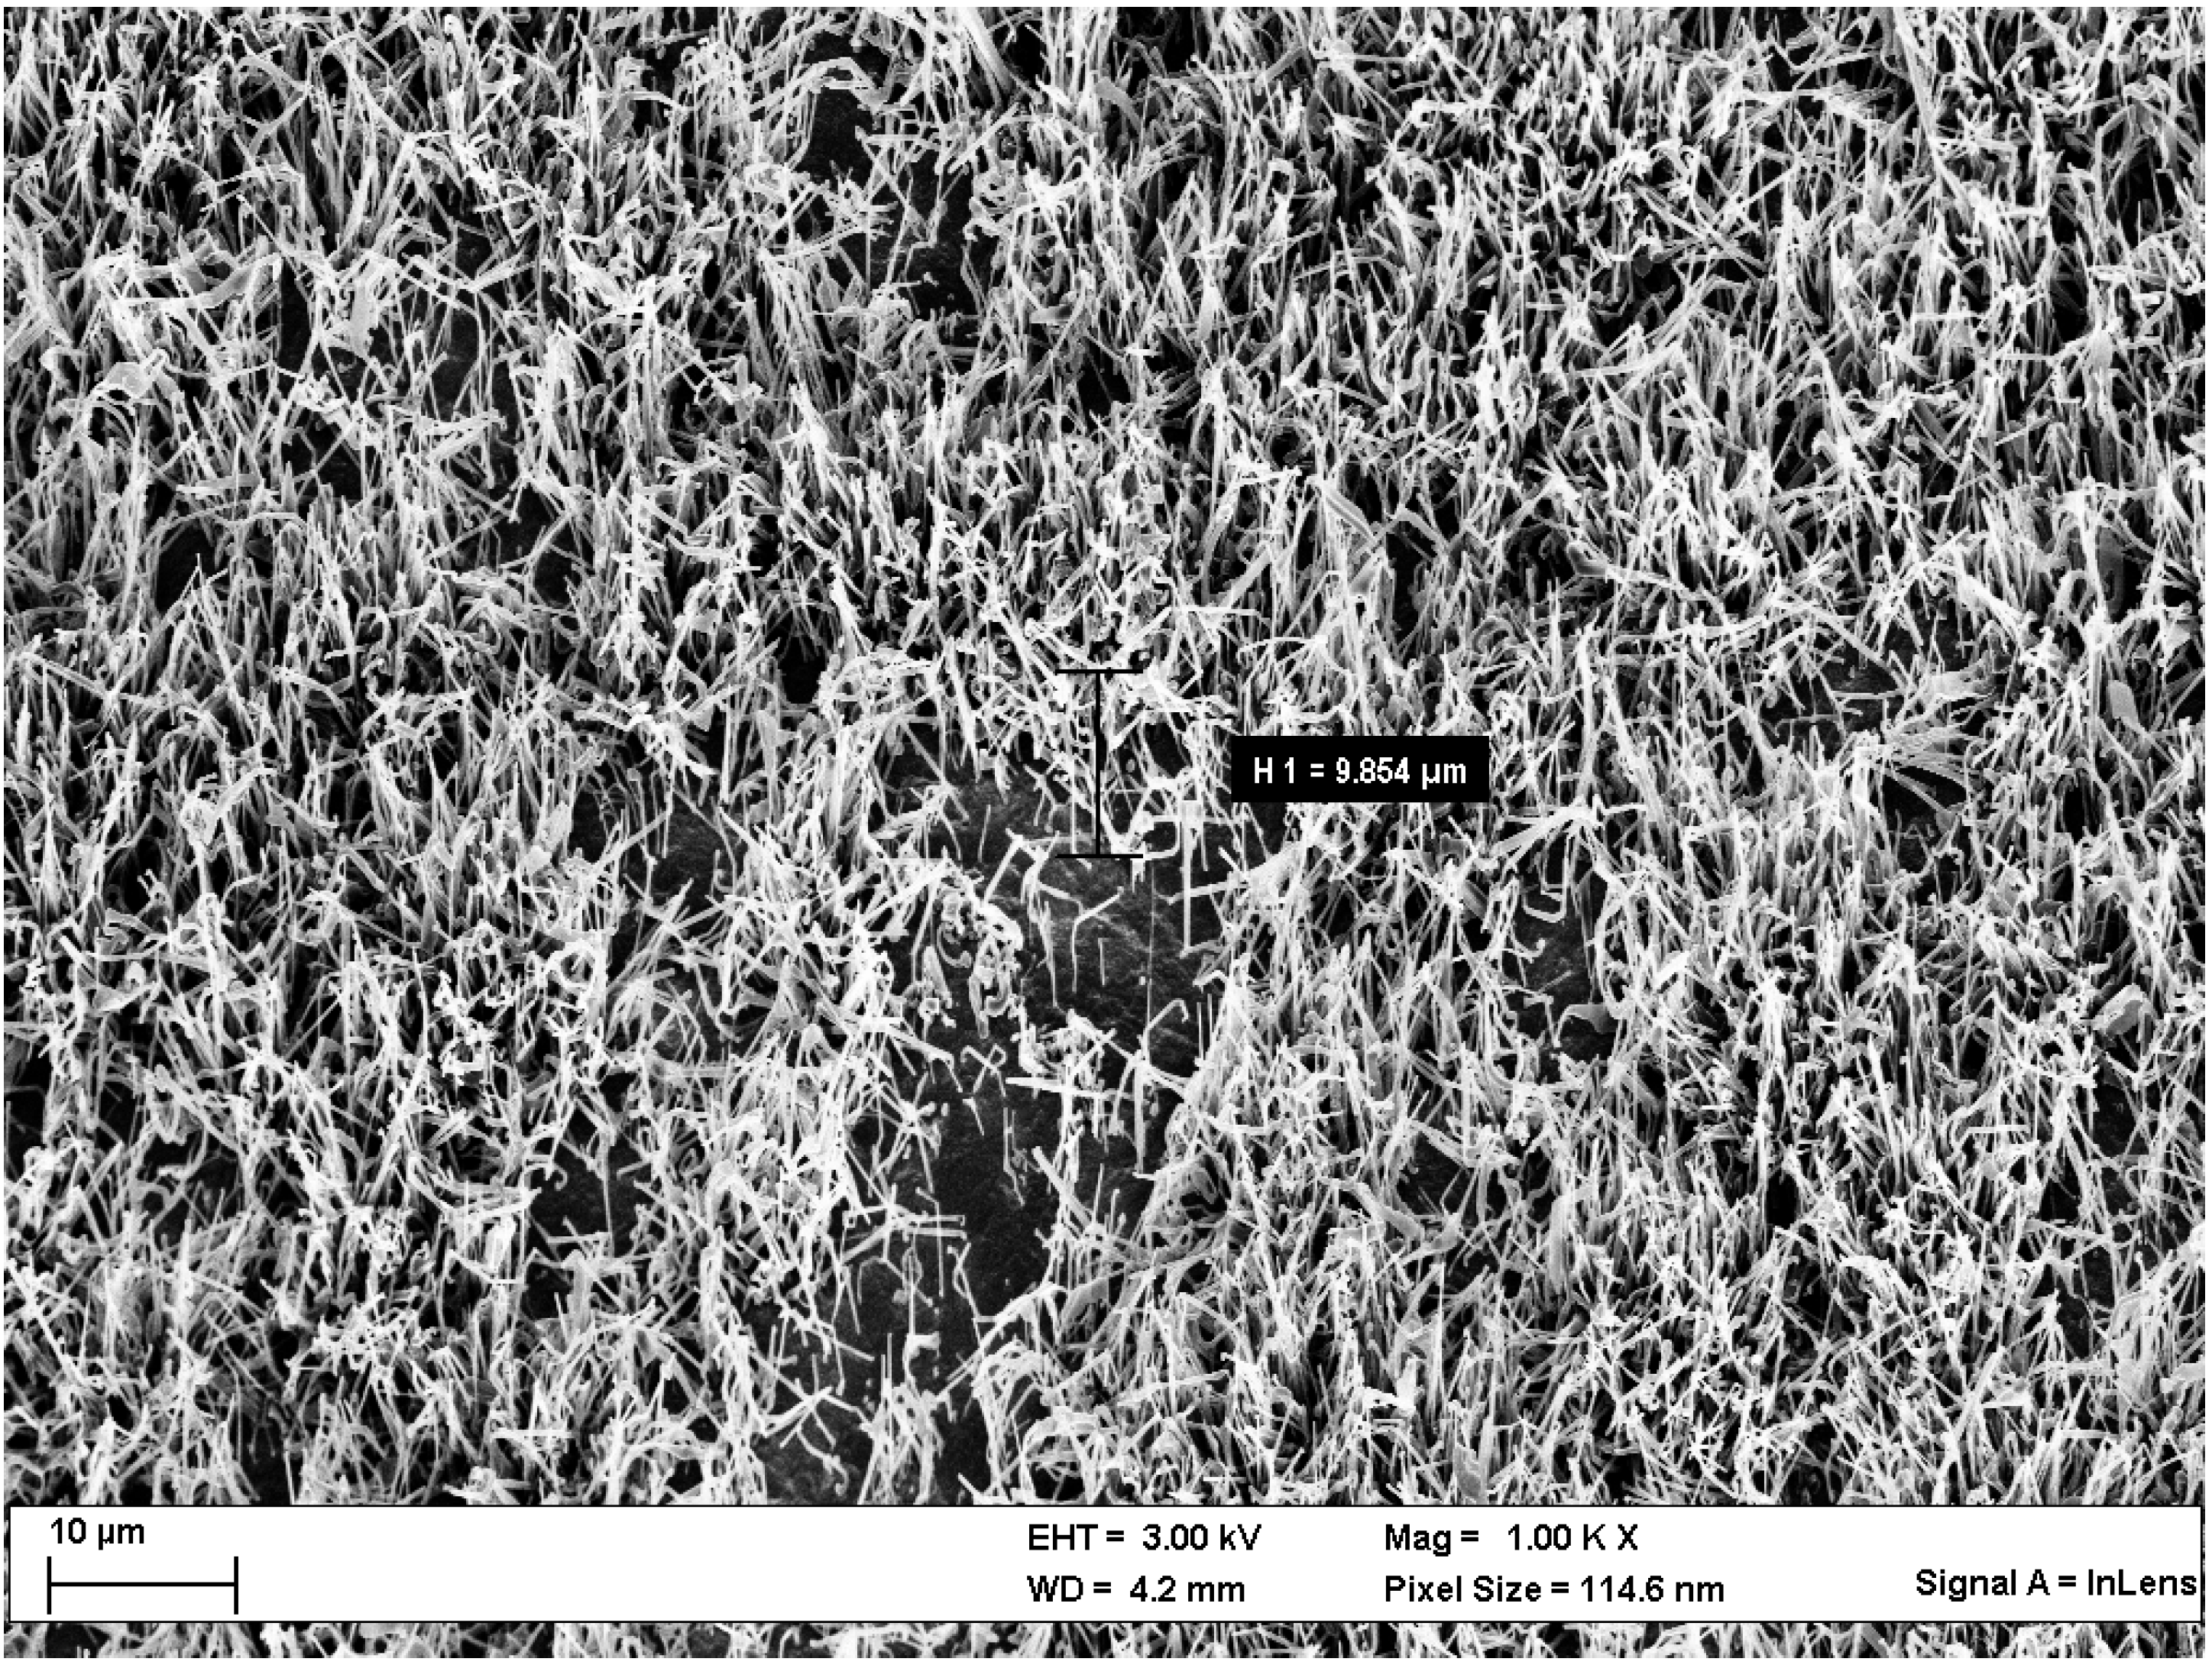
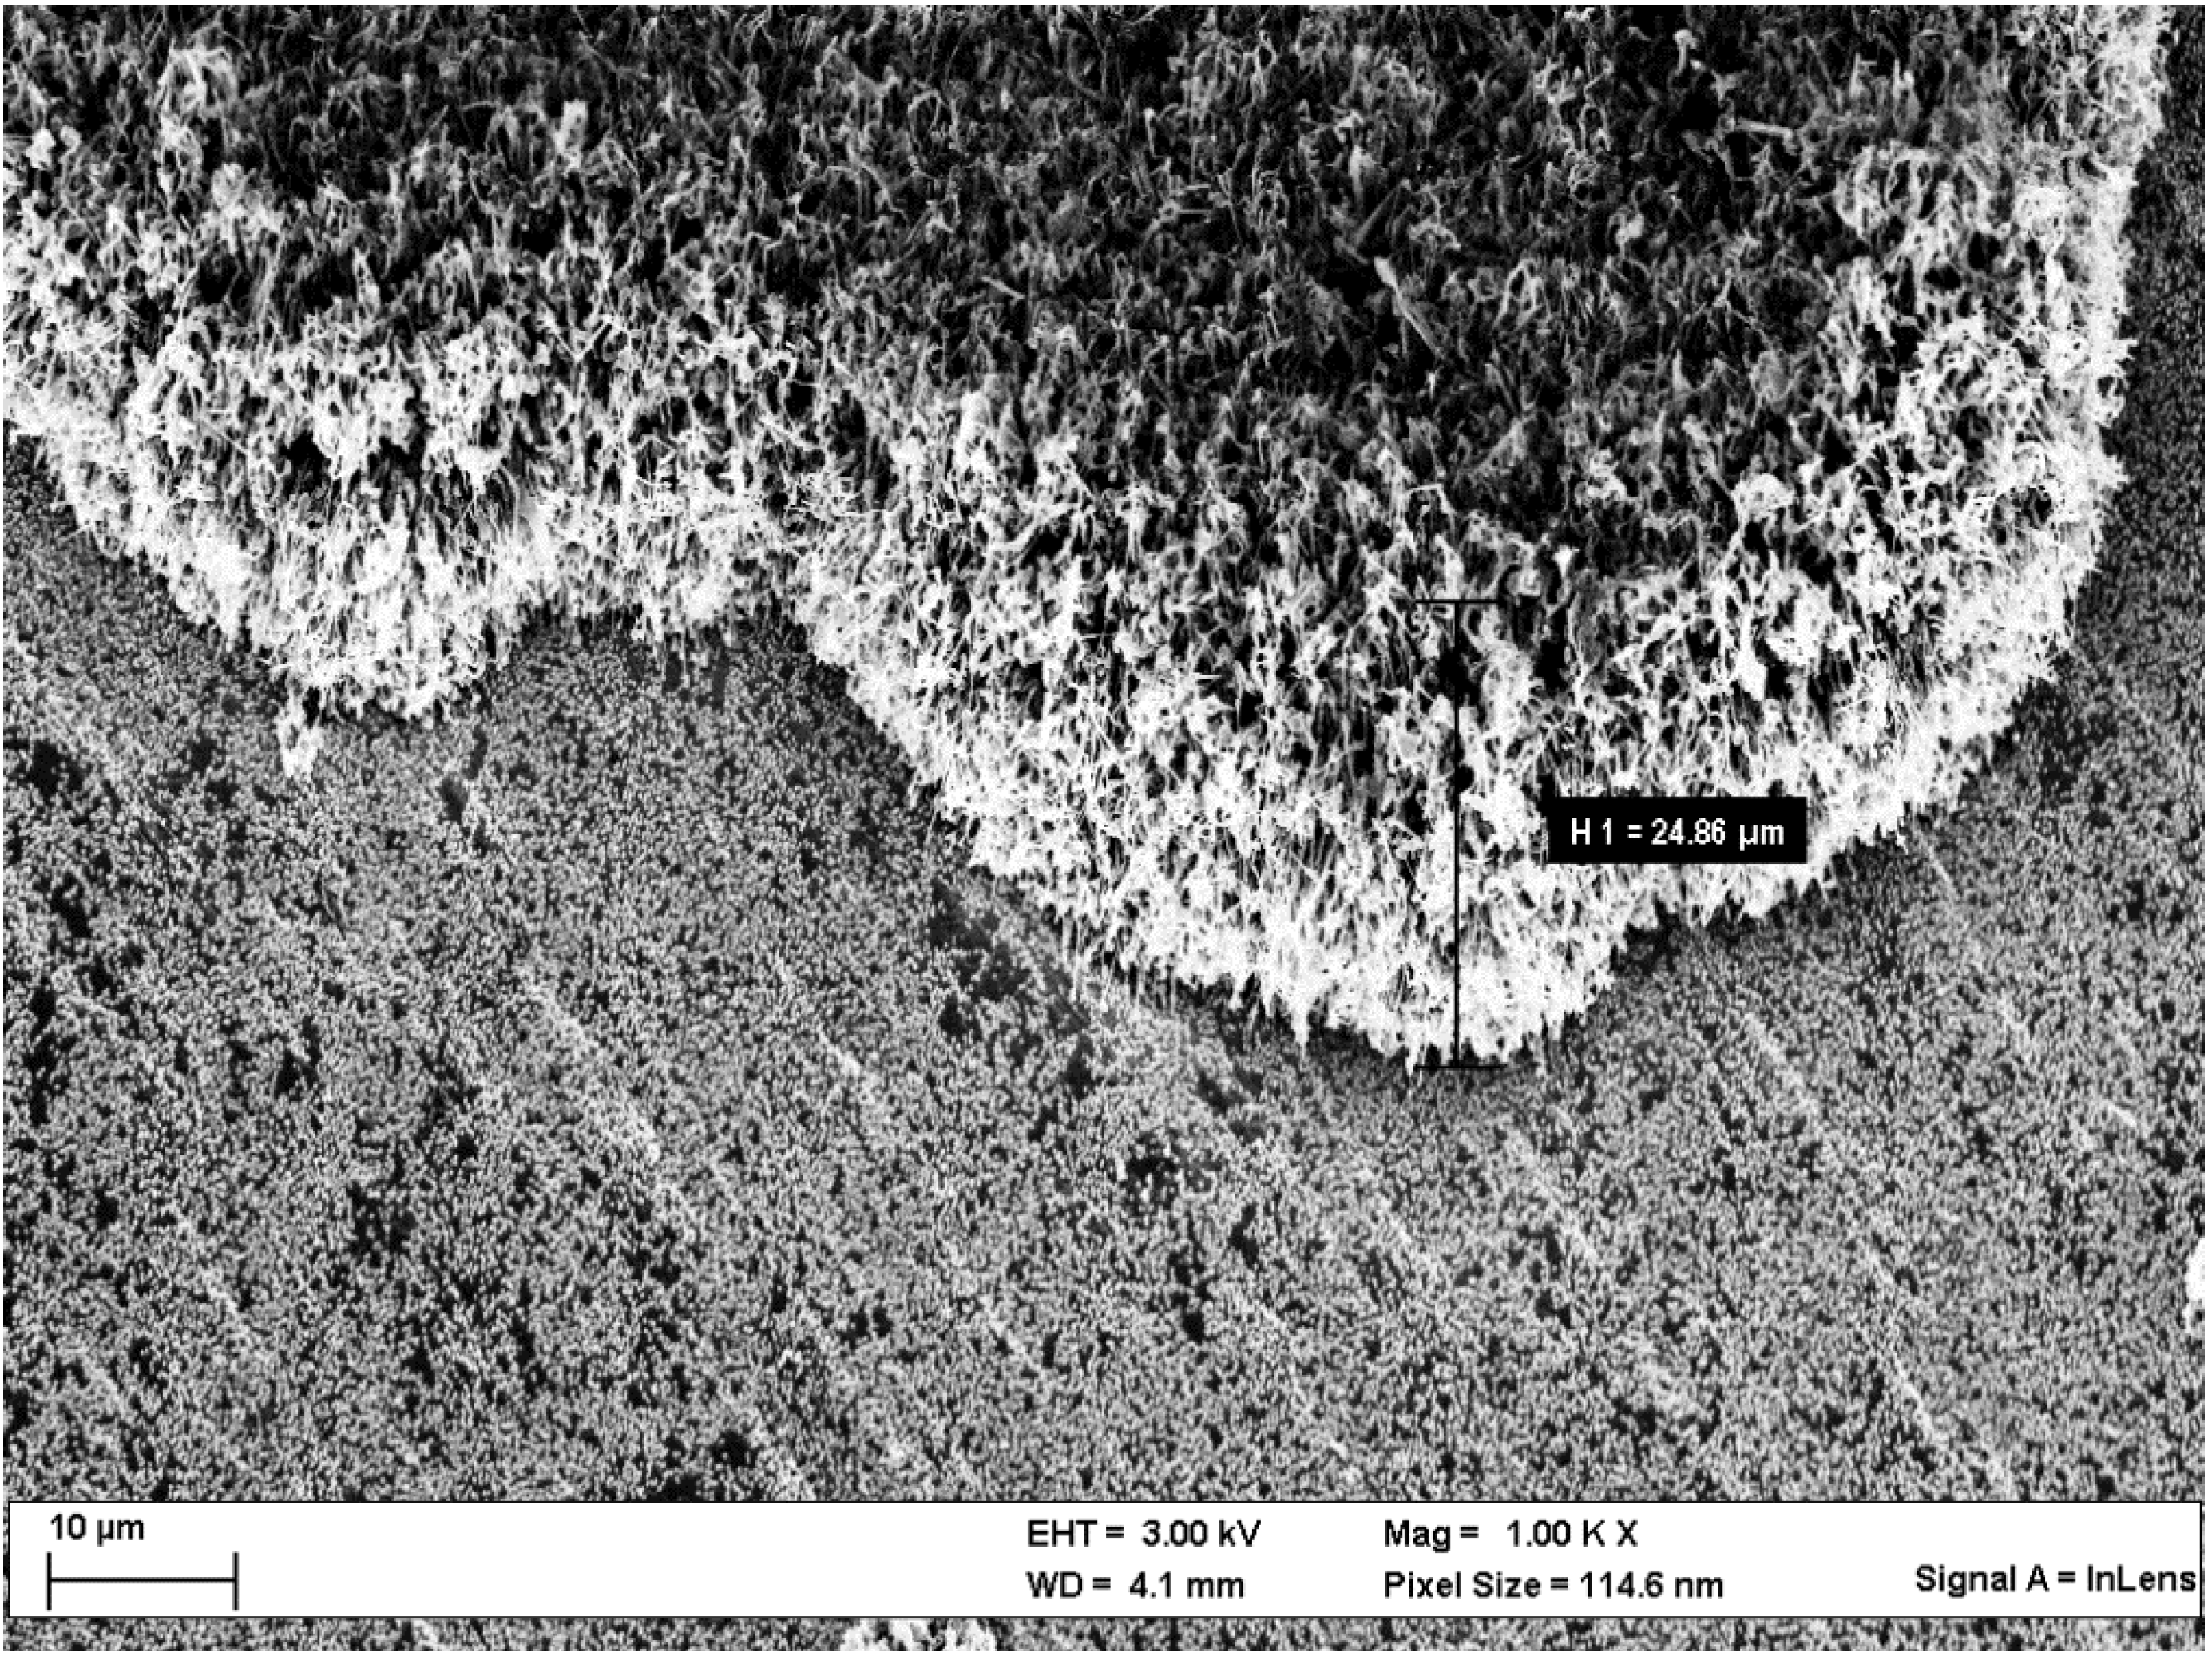
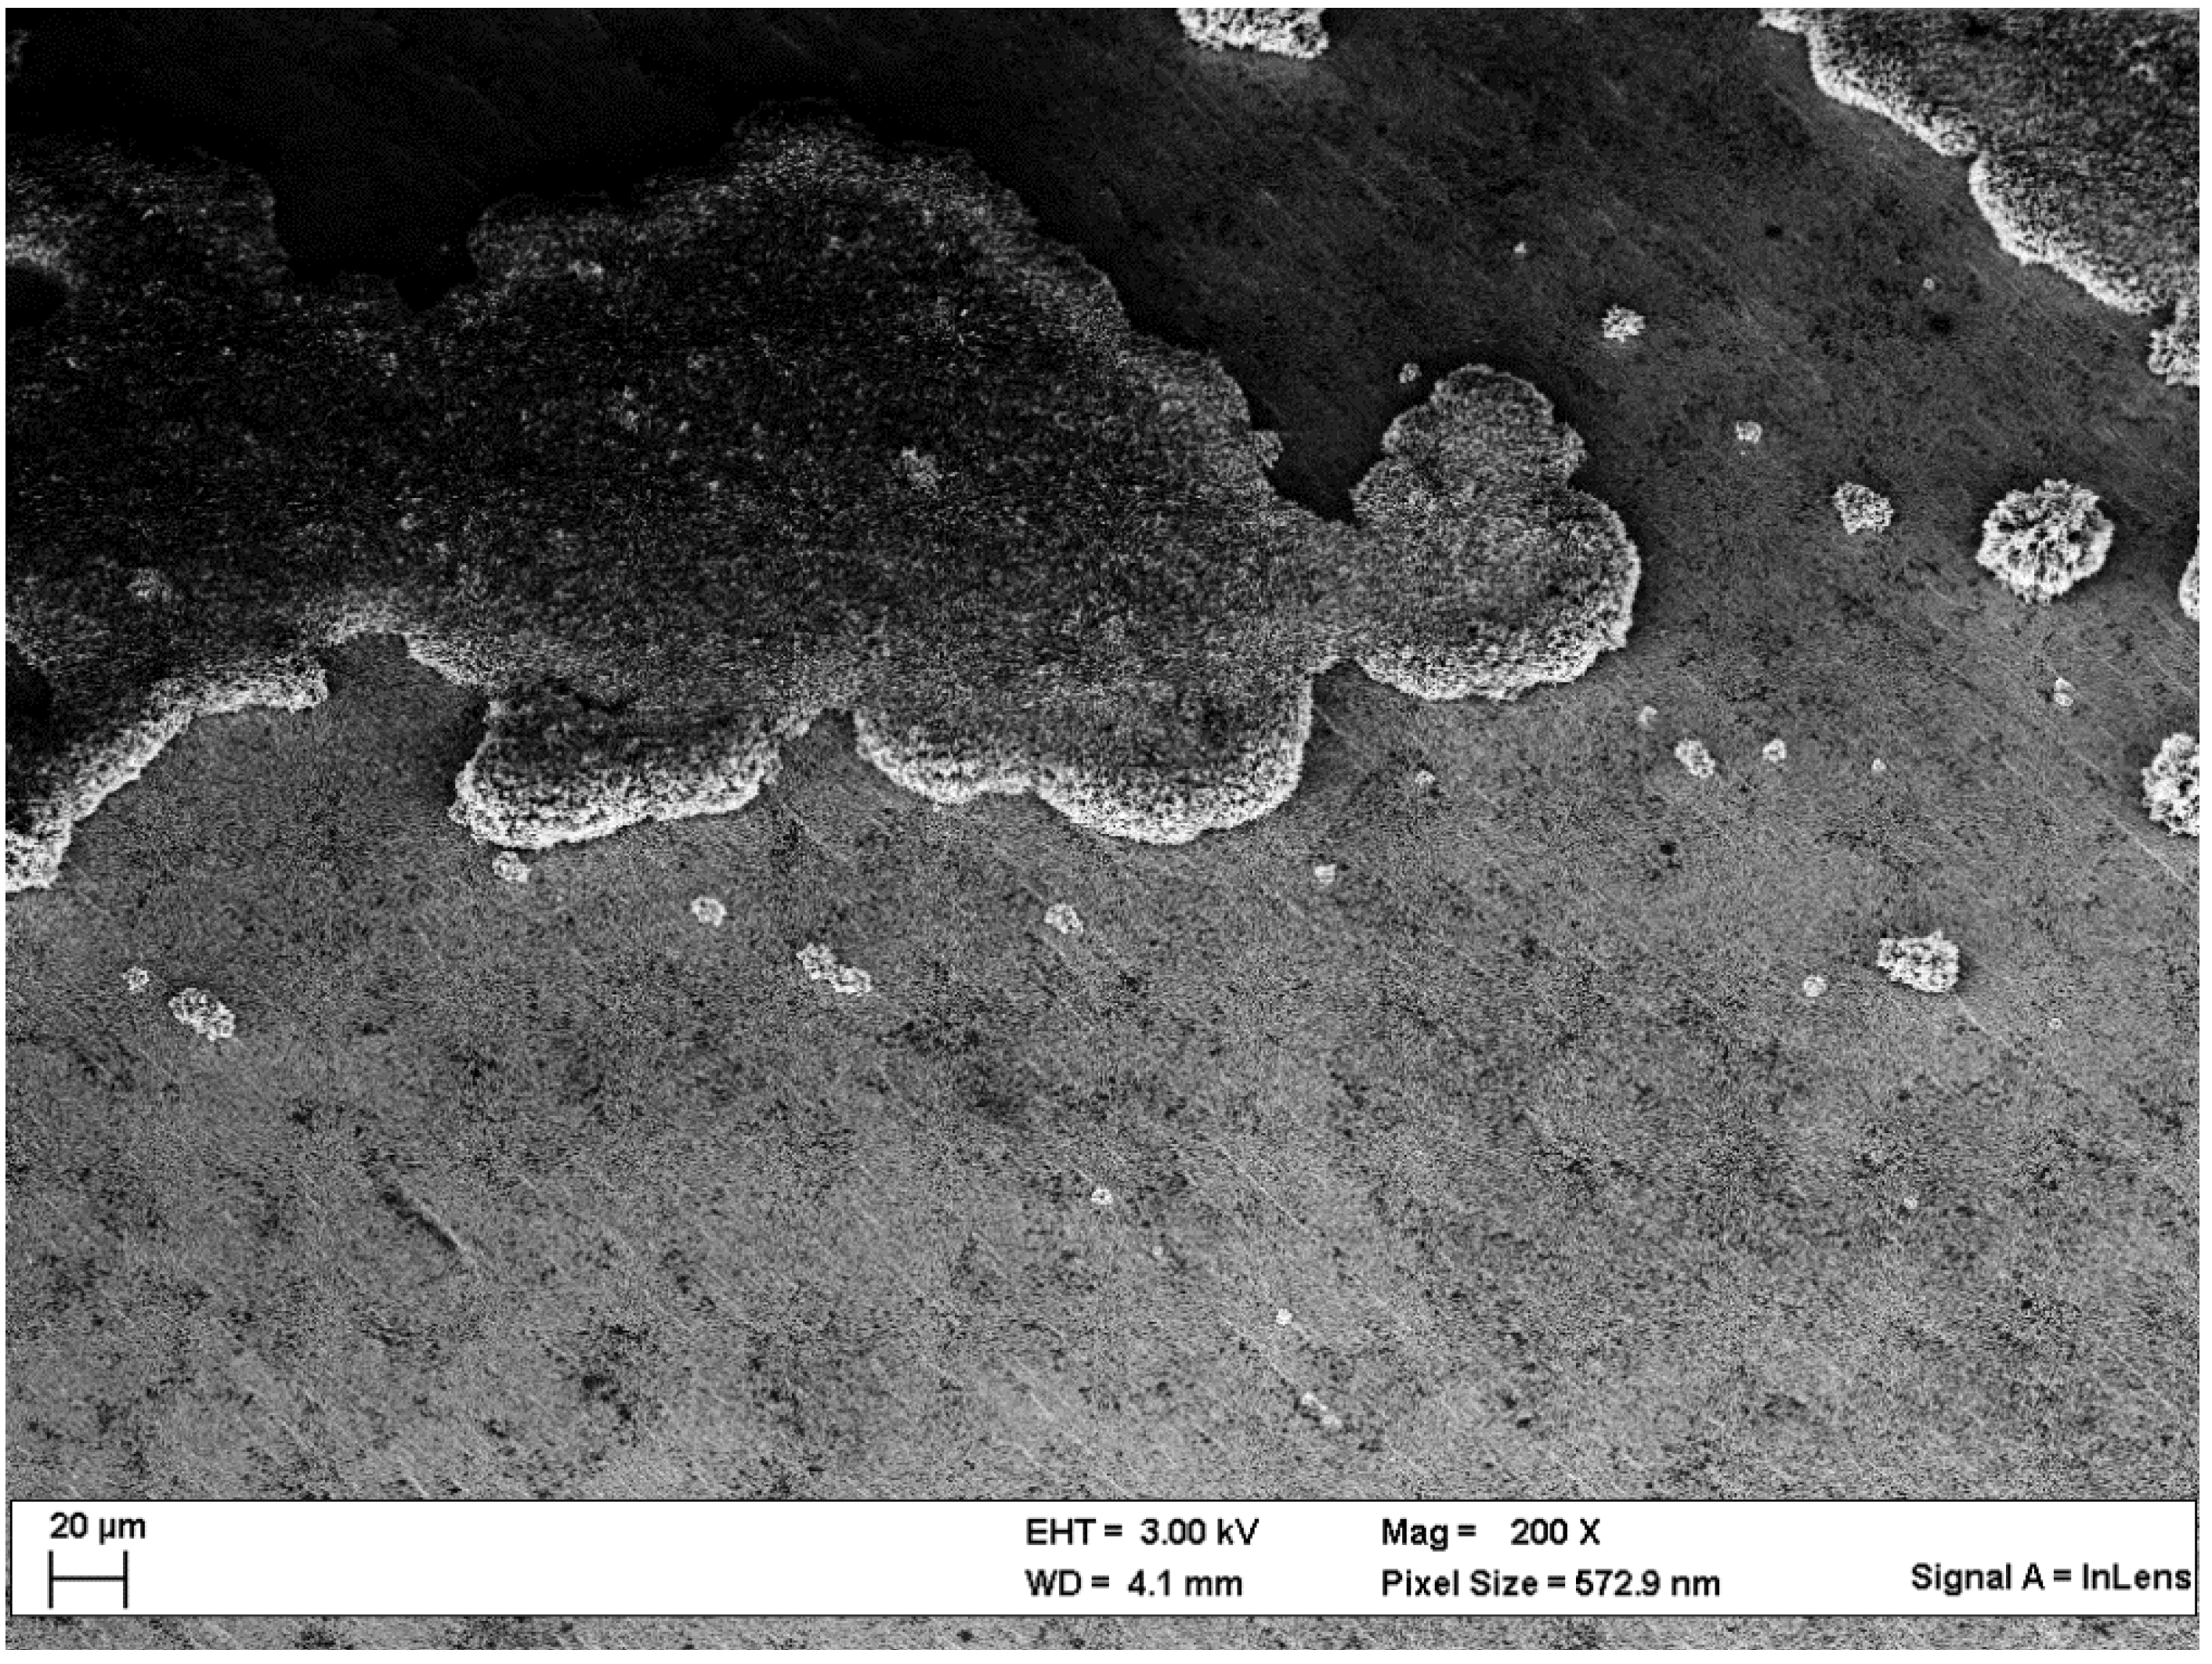
Scanning Electron Microscopy (SEM)

To find an explanation for these differences in mass increase, SEM images of the deposited lithium on copper foils immediately after lithium deposition for both electrolytes were performed (see Figure 5, Figure 6, Figure 7 and Figure 8). Chemical composition of the decomposition products were checked by Laser Ablation Inductively Coupled Plasma Mass Spectrometry (LA-ICP-MS) technique immediately after lithium deposition onto a copper foil.
Figure 5. SEM image of lithium metal deposits on a copper foil, immediately after lithium deposition. Lithium was deposited for 360 s with a current density of 1 mA cm−2 from 1 M LiDFOB in EC-DEC (3:7, by wt.).
Energies 06 03481 g005
Figure 6. SEM image of lithium metal deposits on a copper foil, immediately after lithium deposition. Lithium was deposited for 360 s with a current density of 1 mA cm−2 from 1 M LiPF6 in EC:DEC (3:7, by wt.).
Energies 06 03481 g006
Figure 7. SEM image of lithium metal deposits on a copper foil, immediately after lithium deposition. Lithium was deposited for 360 s with a current density of 1 mA cm−2 from 1 M LiDFOB in EC:DEC (3:7, by wt.). Additionally the measured height (9.854 µm) of the lithium metal deposits is shown.
Energies 06 03481 g007
Figure 8. SEM image of lithium metal deposits on a copper foil, immediately after lithium deposition. Lithium was deposited for 360 s with a current density of 1 mA cm−2 from 1 M LiPF6 in EC:DEC (3:7, by wt.). Additionally the measured height (24.86 µm) of the lithium metal deposits is shown.
Energies 06 03481 g008
The main element of the deposition products for the LiPF6- and the LiDFOB-based electrolyte was lithium (7Li). Furthermore, for the LiPF6-based electrolyte also traces of phosphor (31P) and carbon (12C) and for the LiDFOB-based electrolyte traces of boron (11B) and carbon (12C) could be detected that can be assigned to the SEI layer. The results of the LA-ICP-MS measurements are shown in Table 1, with x the arithmetic mean and rmds the root mean square deviation both in cps (counts per second). These results show that the deposits that are observed in SEM images are lithium metal deposits.
Table 1. Results of chemical composition analysis of the deposition products by LA-ICP-MS technique immediately after lithium deposition onto a copper foil. Lithium was deposited for 360 s at a current density of 1 mA cm−2.
Lithium metal deposits analysis of7Li11B12C
x/cpsrmsd/cpsx/cpsrmsd/cpsx/cpsrmsd/cps
1 M LiDFOB in EC:DEC (3:7, by wt.)1.61 × 1075.38 × 1062.47 × 1058.53 × 1042.45 × 1066.93 × 105
-7Li31P12C
x/cpsrmsd/cpsx/cpsrmsd/cpsx/cpsrmsd/cps
1 M LiPF6 in EC:DEC (3:7, by wt.)6.17 × 1071.83 × 1072.58 × 1057.63 × 1042.88 × 1061.44 × 105
Figure 5 shows a rather regular distribution of lithium metal deposits, plated from the LiDFOB-based electrolyte [27], whereas lithium metal deposits shown in Figure 6 (LiPF6-based electrolyte) show a very inhomogeneous distribution, where the lithium metal deposits form islands of different sizes. Figure 7 and Figure 8 allow a closer look at the morphology of the lithium metal deposits and show also an estimation of the heights of the deposited lithium layers. The thickness of the accumulated lithium metal deposits from the LiPF6-based electrolyte was about (25 ± 2) µm, i.e. more than two times larger than the thickness of the lithium layer of the LiDFOB-based electrolyte [about (10 ± 1) µm], indicating a mass loading of the copper foil that is also about twice as high for the LiPF6-based electrolyte (see Figure 3 and Figure 4).
The differences in morphology, thickness and distribution of lithium metal deposits entail different properties of the lithium layer and the built SEI. The different density and higher surface area of the lithium layer will possibly cause more pronounced electrolyte decomposition and therefore lead to a thicker and “heavier” SEI in the case of the LiPF6-based electrolyte.
Furthermore, the differences in lithium metal deposits and SEI formation affect the roughness of the surface during and after lithium plating. The up to now unexplained differences in mass increase of the quartz sensor can therefore be ascribed to the differences in morphology, distribution and thickness of the built lithium metal deposits and the accompanied SEI formation. In LiDFOB-based electrolytes a probably more homogenous, denser and thinner lithium metal layer is formed and the SEI is presumably also thinner and smoother than for the LiPF6-based electrolyte.
After lithium was chronopotentiometrically deposited on copper, both the OCP and the frequency change of the sensor quartz were measured simultaneously. The first 8 h and 30 h of the corrosion measurements of deposited lithium of the LiDFOB- and LiPF6-based electrolytes are shown in Figure 9 and Figure 10, respectively. Although the same trends in the potential curve and the mass change during the first hours of the OCP measurements were observed for both electrolytes, there are also pronounced differences.
Figure 9. Time dependence of potential and attributed mass change during the first 8 h of the OCP measurement after lithium was deposited onto copper from 1 M LiDFOB in EC:DEC (3:7, by wt.).
Energies 06 03481 g009
Figure 10. Time dependence of potential and attributed mass change during the first 30 h of the OCP measurement after lithium was deposited onto copper from 1 M LiPF6 in EC:DEC (3:7, by wt.).
Energies 06 03481 g010
After the current was switched off, the potential curve stayed constant at 0.0 V vs. Li/Li+ for both electrolytes. However, for the LiDFOB-based electrolyte the potential rose after 6 h to more positive potentials, whereas the potential of the LiPF6-based electrolyte stayed constant during 12.8 h at 0.0 V vs. Li/Li+. The earlier rise of the potential of the LiDFOB-based electrolyte can be attributed to its more conductive SEI compared to the LiPF6-based electrolyte. As long as the potential was stable at 0.0 V vs. Li/Li+ the copper surface was probably covered by a dense lithium and SEI layer that determined the potential. When the potential started to rise to more positive potentials, the lithium layer could no longer cover the whole copper surface and the potential was more and more affected by the copper foil [46]. During the first hours of the OCP measurements the mass change of the quartz sensors for both electrolytes reached a maximum after passing through a sink. The mass change of the quartz from the LiDFOB-based electrolyte reached its maximum after 6 h at the same time as the potential started to increase to more positive potentials (see Figure 9). In contrast, only after 30 h the quartz sensor of the LiPF6-based electrolyte reached its maximum value of mass increase, when the potential had already reached a value of 2.6 V vs. Li/Li+. A possible explanation for the mass increase of the sensor quartzes in both electrolytes after the current was switched off is the growth and dissolution of the SEI [1,47,48]. The chemical stability of deposited lithium on a metal substrate and of lithium metal anodes has been investigated by different research groups via AC impedance measurements [1,47,49]. It has been assumed that charged (anions, electrons, solvated cations) and neutral (solvents, impurities) species are able to diffuse through the SEI film and probably cause self-discharge reactions, including the growth of the SEI [1].
As all known SEI components show a higher molecular mass than lithium [50] already a very small and slow SEI growth can be detected by the QCM. However, during the corrosion process the SEI changes also its composition and morphology [1]. The growth of the SEI, as well as changes in composition and morphology of the SEI will affect the roughness factor of the surface causing thus also frequency changes of the quartz sensor and attributed mass changes of the quartz sensor, as shown in Figure 9 and Figure 10.
Furthermore, as soon as the OCP measurement started, also a partial dissolution of the SEI is assumed to begin, especially the dissolution of decomposition products of DEC that are soluble in used organic electrolytes [50,51,52]. To sum up, mass changes of the quartz sensor during corrosion are affected by growth and dissolution of the SEI and changes in the surface roughness.
It is interesting to note, that the quartz sensor in the LiDFOB-based electrolyte reached the maximum attributed mass growth of 125 µg cm−2 after 6 h at a velocity of (0.41 ± 0.02) µg cm-2 h−1, whereas in case of the LiPF6-based electrolyte the maximum mass change of the quartz sensor of 330 µg cm−2 was reached after 30 h at a velocity of mass change of (2.45 ± 0.02) µg cm−2 h−1. These first quantitative results indicate that for the LiPF6-based electrolyte the overwhelming process is the strong growth of the SEI that may be accompanied by changes in morphology and an increase of roughness of the surface. For the LiDFOB-based electrolyte the increase of mass (decrease of frequency) is less pronounced leading to the assumption that the frequency change of the quartz seems to be strongly affected by the dissolution of the SEI compounds as well.
Another possible explanation of this differing behavior could be the reorganization of the lithium surface forming a different morphology [53]. It is assumed that during this surface reorganization process a consolidation of the SEI occurs. During this process most of the free electrolyte is expelled from the multi-layered morphology [53].
This suggested consolidation process of the SEI could play an important role that is presumably more pronounced for the more flexible SEI [27] generated from LiDFOB entailing a slight mass increase at the beginning of the corrosion process of the film.
Figure 1 and Figure 2 show the EQCM corrosion measurement in both investigated electrolytes. After the maximum mass value of the quartz sensor was reached, the mass of the film decreased for both electrolytes. The differences in corrosion mechanisms of the deposited lithium are most pronounced during the mass decrease in the two electrolytes. The observed mass decrease of the quartz sensor of the LiDFOB-based electrolyte is not smooth but composed of a series of abrupt mass fluctuations in contrast to that of the LiPF6-based electrolyte. After a slow decrease of the mass a rather fast increase of the mass is observed several times (see Figure 1). The corrosion process in the LiDFOB-based electrolyte may be affected by reorganization processes of the SEI, as suggested by Basile et al. [53]. The involved consolidation process of the SEI can explain the first part of the abrupt mass fluctuations of the quartz sensor, because when most of the free electrolyte is expelled from the multi-layered morphology of the SEI the accompanied mass changes will be detected by the QCM, attributed to the slow mass decrease. Another, more probable explanation is the slow dissolution of the SEI-materials or parts of those materials supported by the vibrating sensor. This dissolution could finally leave lithium metal unprotected so that a fast SEI film formation sets in entailing the observed fast mass increases.
The electrode potential curve and also the mass change of the quartz sensor of the LiDFOB-based electrolyte may be divided into three parts. During the first part the potential increased relatively fast and could therefore reach a potential of ca. 2.0 V vs. Li/Li+ already after 60 h and at an average mass decrease of (−0.423 ± 0.002) µg cm-2 h-1 (slope of the light grey straight line (see Figure 1). During the second part from the 60th to the 165th h of OCP measurement only a very slight potential increase could be observed and also the mass decrease of the quartz sensor was with (−0.301 ± 0.001) µg cm−2 h−1 slower compared to the first part. The third part shows the slowest potential increase of (−0.0877 ± 0.0007) µg cm−2 h−1 and the potential reached the potential value of the bare copper foil. It should be stressed that almost the initial weight of the copper foil quartz was finally reached and only a very small additional mass of 20 µg cm−2 was measured.
A completely different behavior of the mass changes reflecting the corrosion mechanisms of the deposited lithium was observed for the LiPF6-based electrolyte. As already mentioned, the potential did reach a value of 2.6 V vs. Li/Li+ at the maximum mass value of the quartz sensor in this electrolyte. After the maximum mass value was reached, the mass of the quartz sensor decreased in case of the LiPF6-based electrolyte with a smooth and nearly linear mass decrease at a high velocity of (−1.454 ± 0.007) µg cm−2 h−1 without any fluctuations. At the end of the experiment still an additional mass of 250 µg cm−2 of the copper foil quartz was detected, i.e., about >10 times that for the LiDFOB-based electrolyte. A possible explanation for this behavior could be, that as most of the deposited lithium was converted into SEI products the dissolution of the SEI became the overwhelming process and the mass of the quartz sensor started to decrease. However, as the potential reached more than 3.0 V vs. Li/Li+ lithium was probably completely converted to SEI compounds, but the SEI was not completely dissolved in the electrolyte and the mass, roughness and morphology of the SEI caused an additional attributed mass at the end of the experiment for the LiPF6-based electrolyte. Perhaps, when the experiment would be extended probably all of the SEI compounds would be dissolved into the electrolyte and the initial mass of the quartz sensor would also be reached [54]. Although the mass decrease showed the same velocity up to the end of the experiment the potential curve became more and more flat until it reached the potential of the bare copper foil. The result that the corrosion process is fast at the beginning and slows down with ongoing immersion time is in agreement with the literature [54]. In the case of the LiPF6-based electrolyte, the initial potential value of the bare copper foil was already reached after 86 h, whereas the potential of the copper foil was reached in the LiDFOB-based electrolyte after 272 h, only. It can be concluded that the inhomogeneous lithium metal deposit distribution from the LiPF6-based electrolyte is responsible for the fast increase of the potential, because it is generally known [55] that high surface areas accelerate dissolution processes.

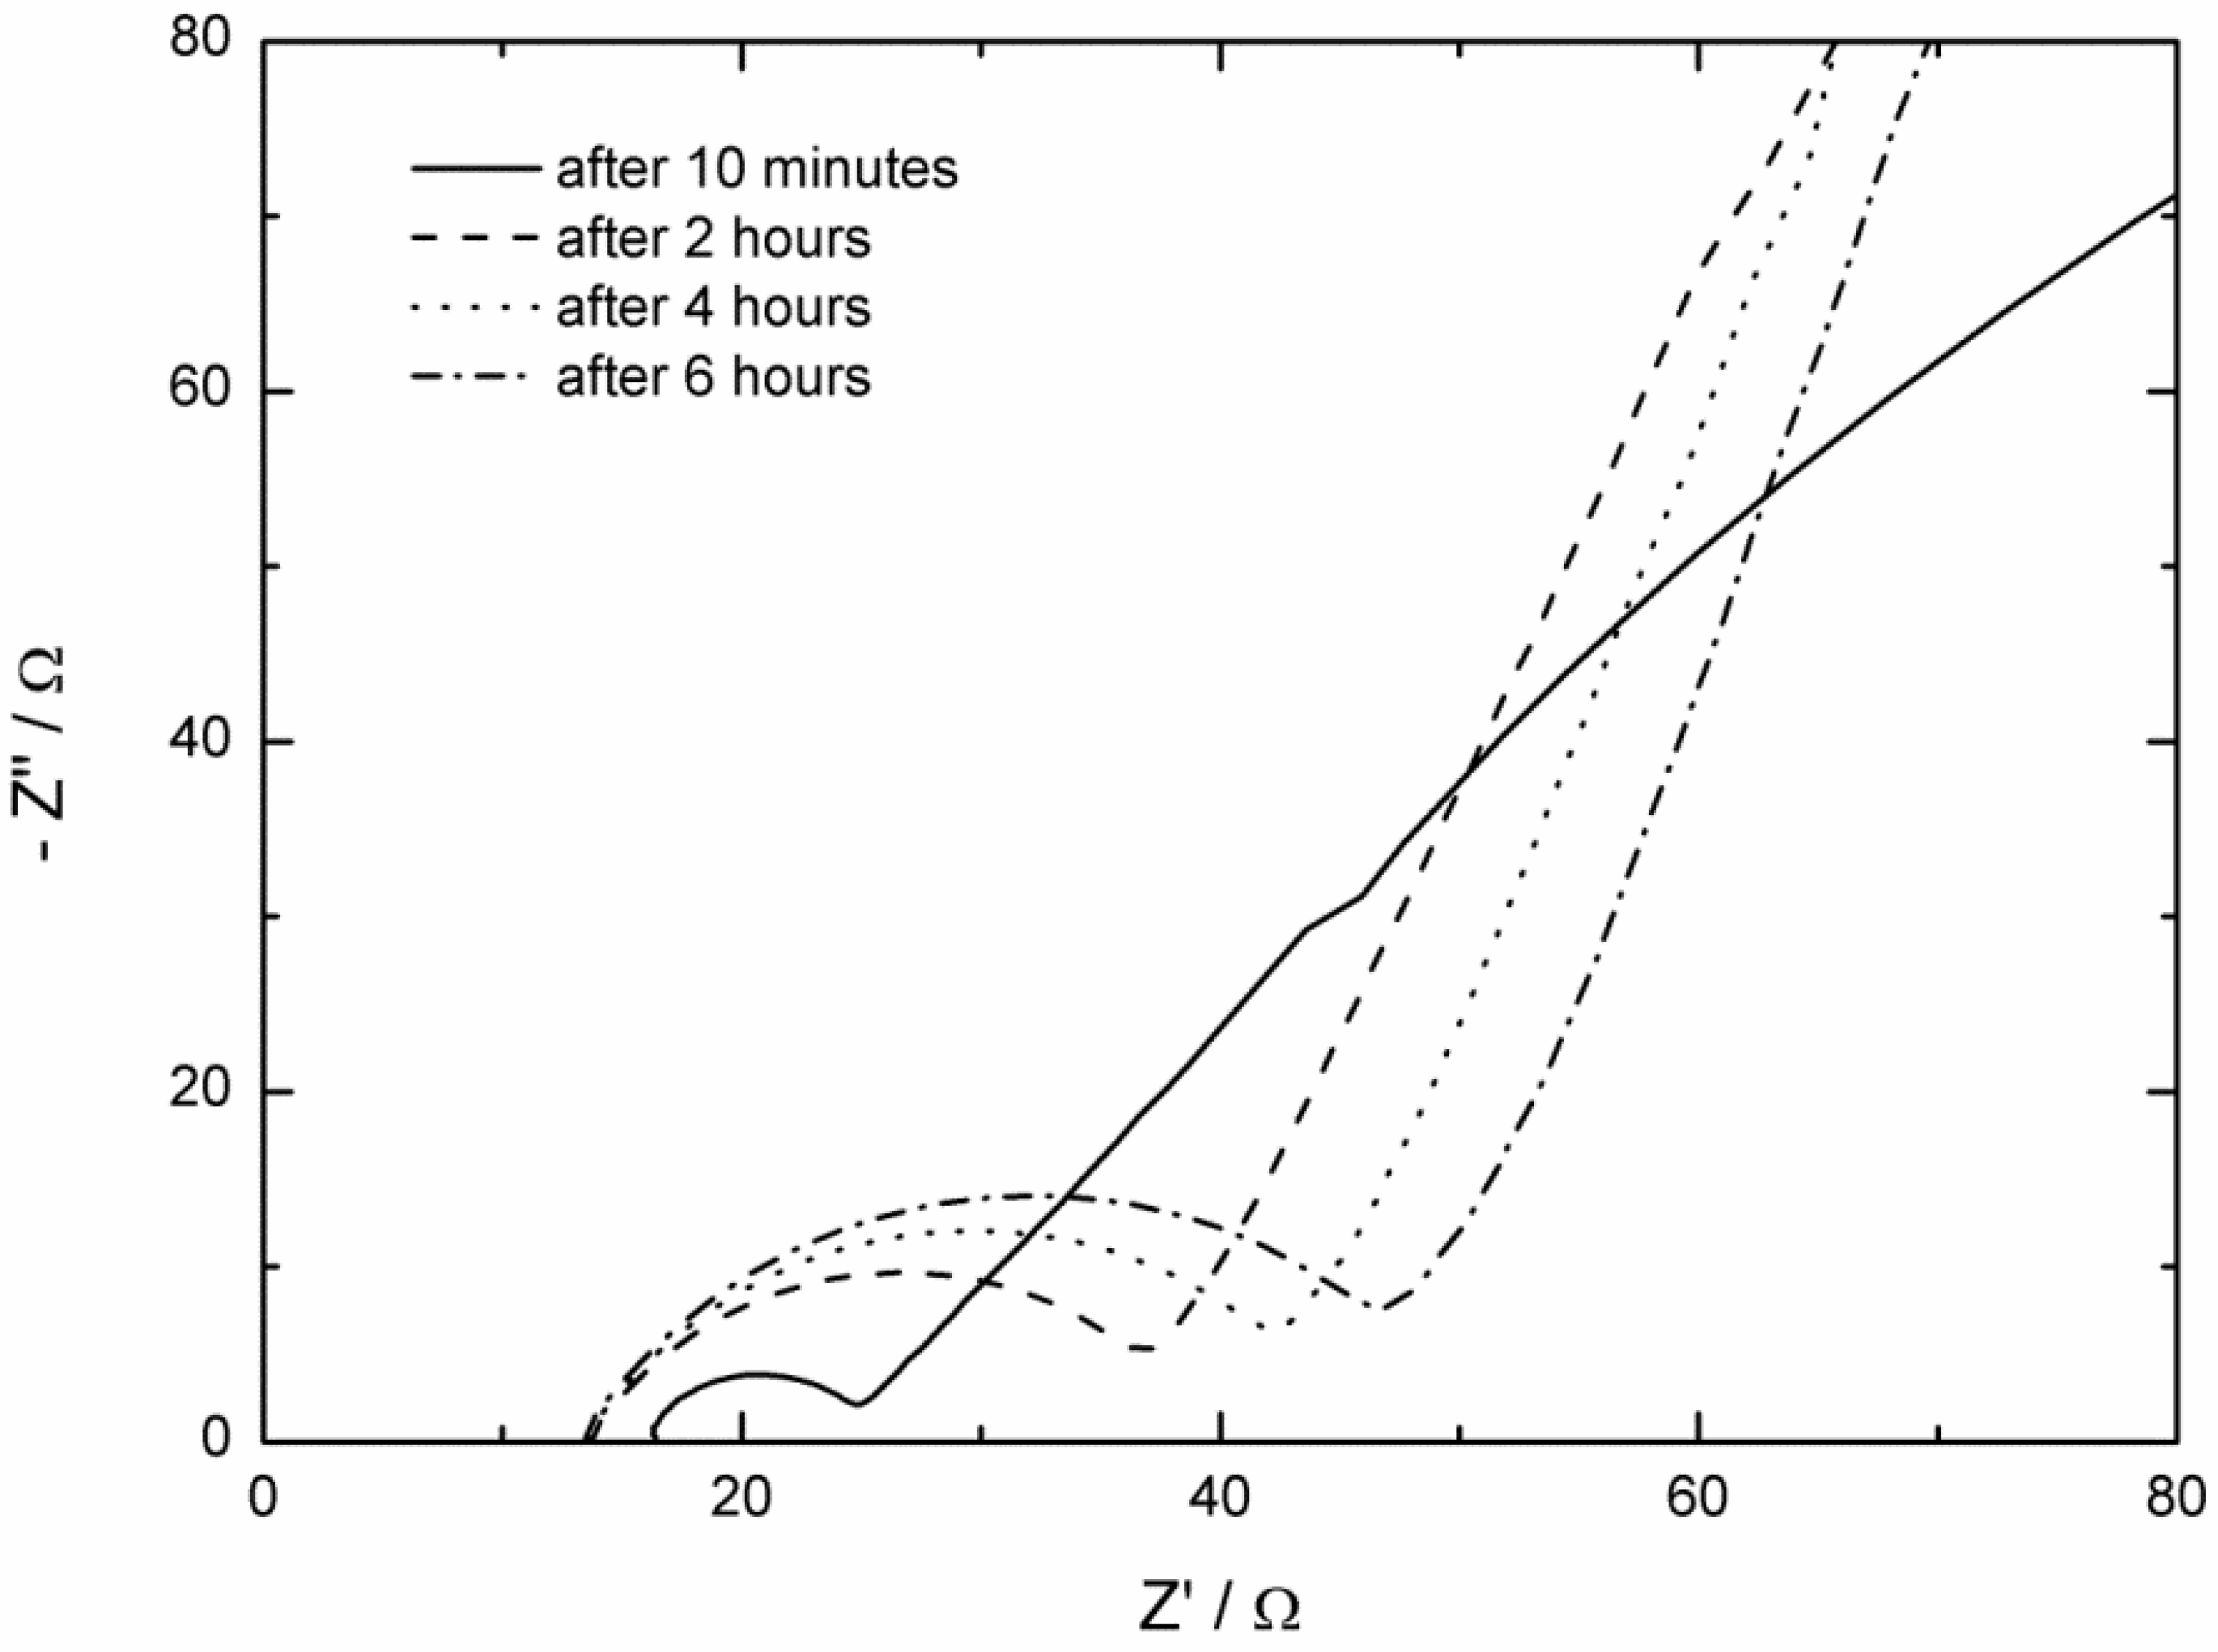
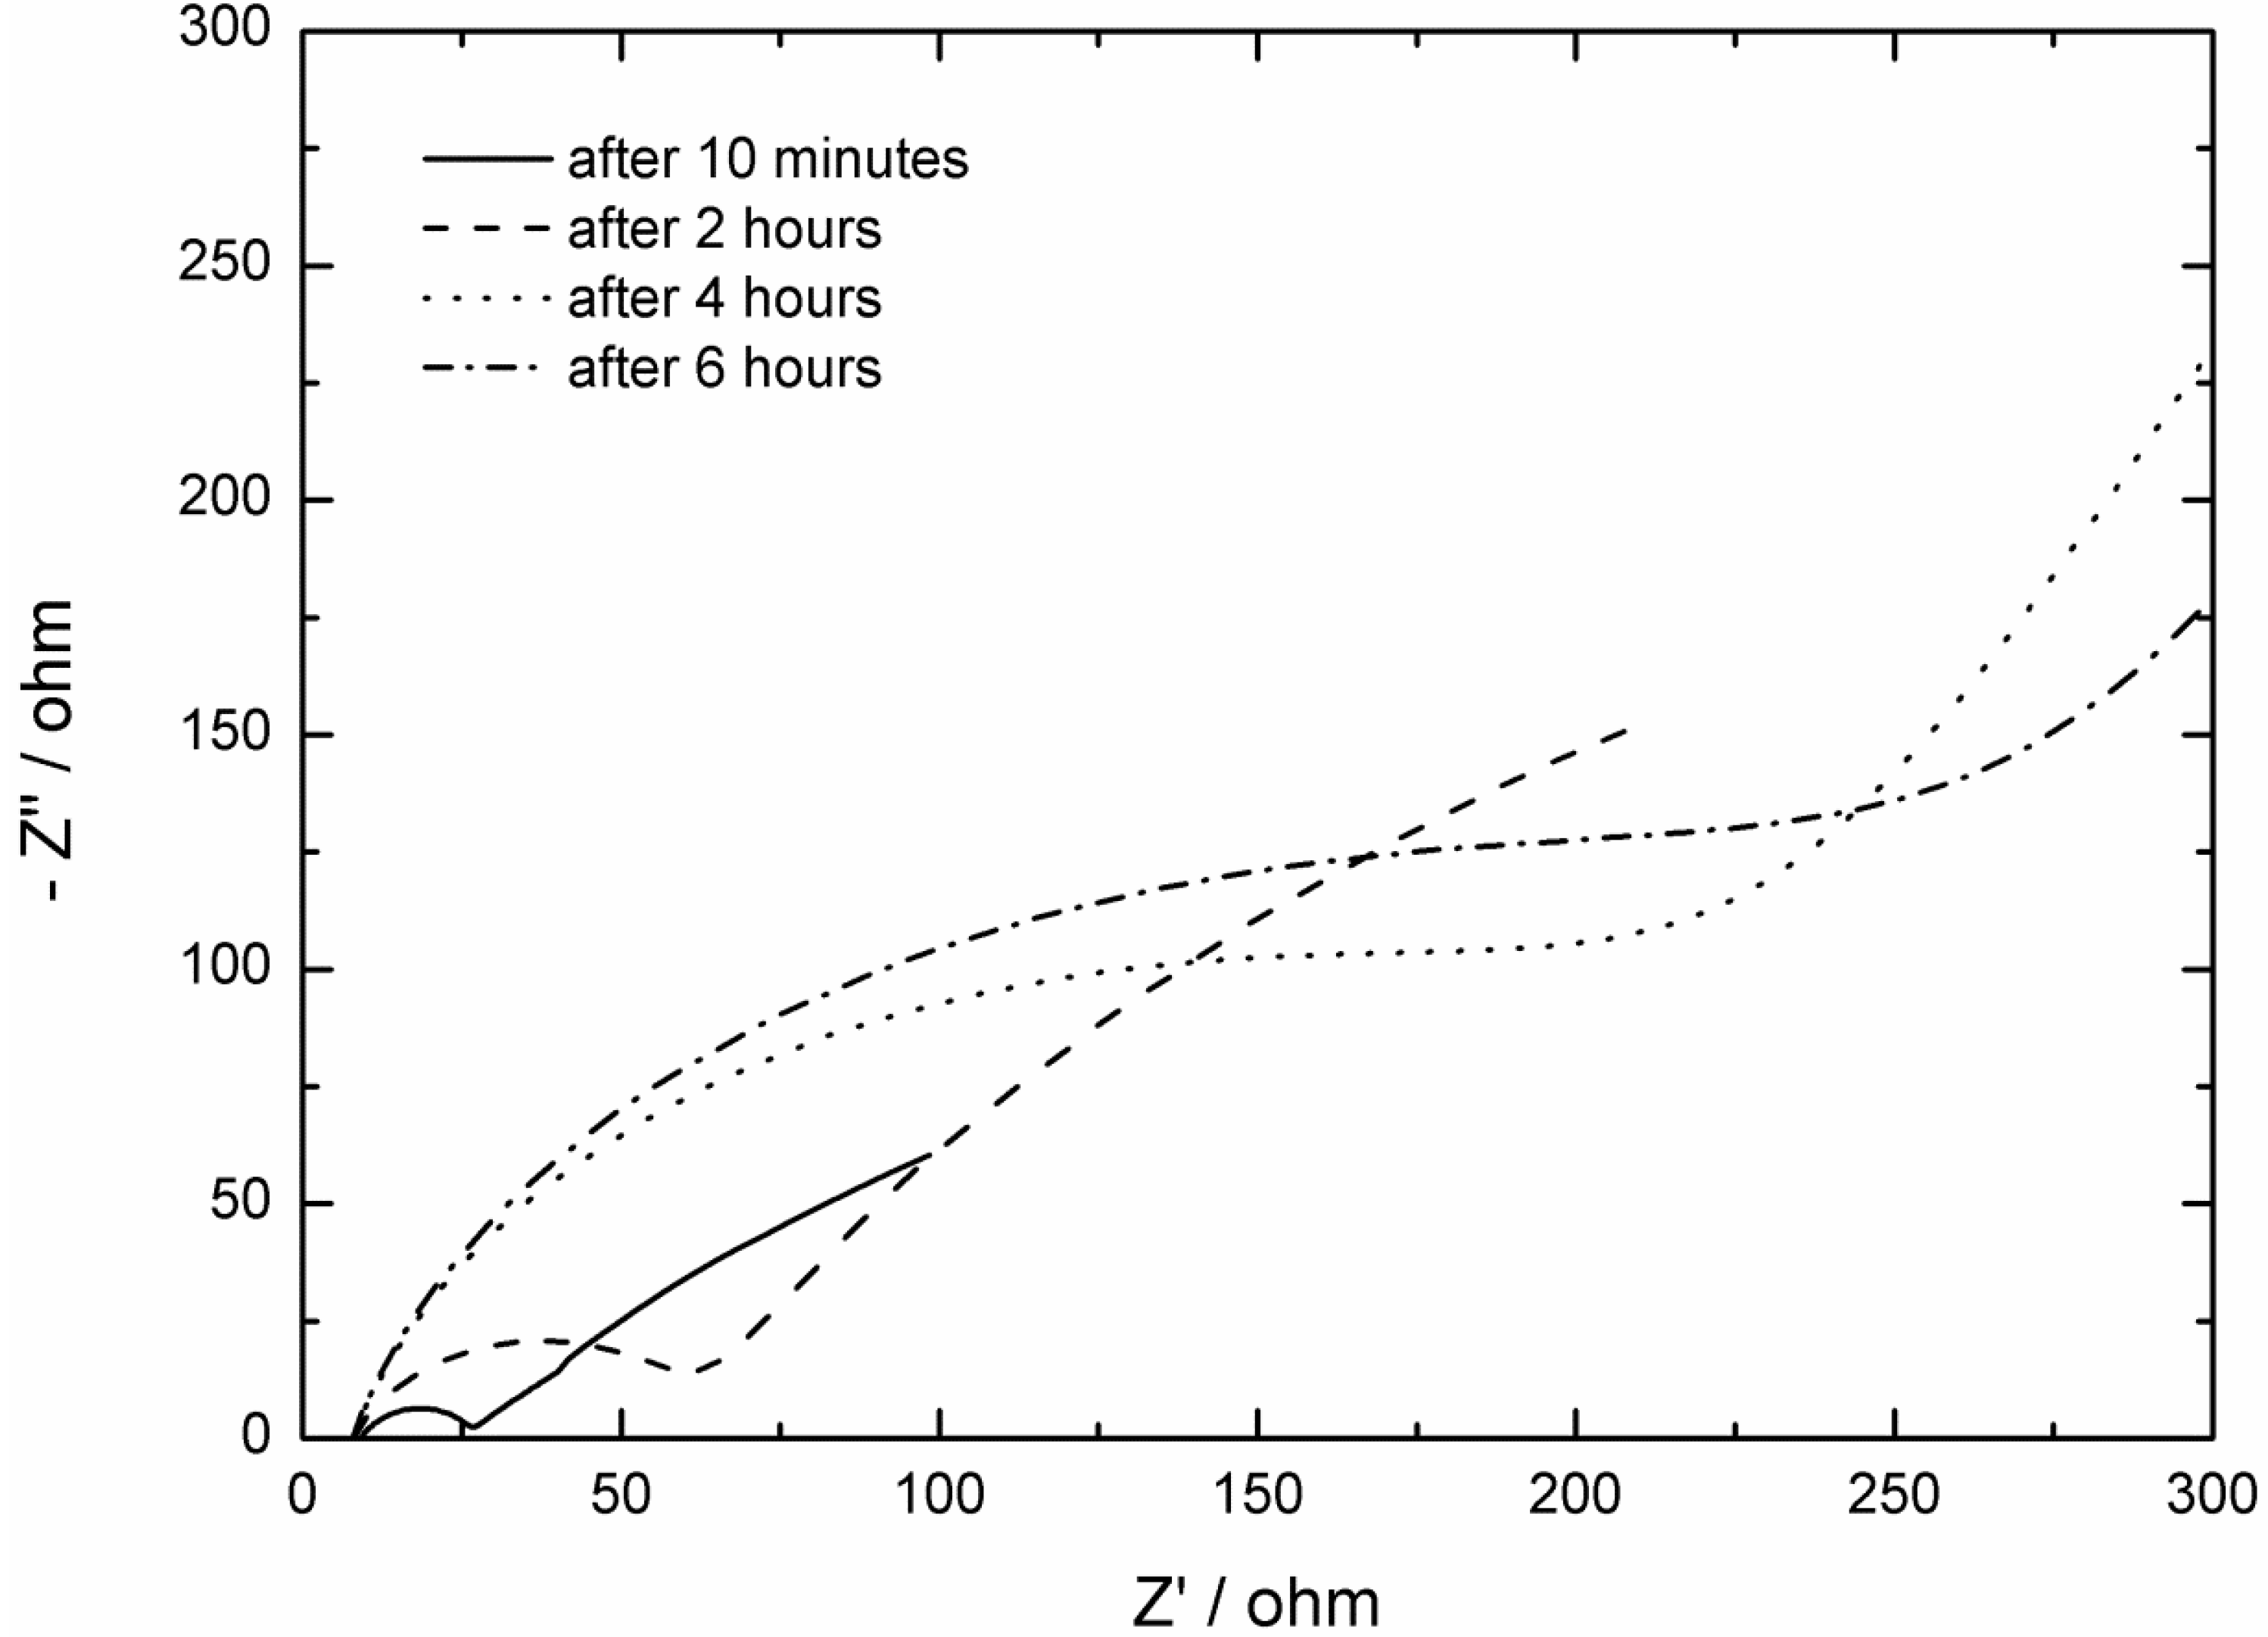
2.2. AC Impedance Measurements

In addition to the EQCM experiments, numerous AC impedance measurements were carried out. To allow a better insight into the results of AC impedance measurements only the first four of the 26 measured Nyquist plots related to corrosion of deposited lithium in the investigated electrolytes are shown in Figure 11 and Figure 12, respectively. At this state of our research, analysis of AC impedance spectra is only qualitative because our aim is limited to study the behavior of deposited lithium under OCP conditions in the two investigated electrolytes. Above all, we are interested in SEI growth which occurs when lithium corrosion starts to be the major process [1,47,54].
Figure 11. Selection of Nyquist plots of a Lideposited/electrolyte/Lideposited -cell with 1 M LiDFOB in EC:DEC (3:7, by wt.) as electrolyte of a symmetrical cell of deposited lithium on a copper foil (0.36 As cm−2). The AC impedance measurements were carried out after 10 min, after 2 h, 4 h and 6 h during immersion time of the deposited lithium in the electrolyte.
Energies 06 03481 g011
Figure 12. Selection of Nyquist plots of Lideposited/electrolyte/ Lideposited -cell with 1 M LiPF6 in EC:DEC (3:7, by wt.) as electrolyte of a symmetrical cell of deposited lithium on a copper foil (0.36 As cm−2). The AC impedance measurements were carried out after 10 min, after 2 h, after 4 h and after 6 h during immersion time of the deposited lithium in the electrolyte.
Energies 06 03481 g012
Therefore, only a qualitative discussion of the diameter of the overall semicircle at high frequencies is in focus of our interest. Thus, the x-axis intercept at high frequencies reflecting the Ohmic resistance of the bulk electrolyte [56] and the slope of the impedance spectra at very low frequencies representing diffusion processes in the electrolyte [56] will not be further discussed.
The typical semicircle of surface films, whose diameter reflects in this case the resistance of the SEI is related to migration of lithium ions through the surface film [57], shows the expected closed semicircle only after the first 10 min of immersion time in the LiDFOB-based electrolyte (see Figure 11). With ongoing immersion time of the deposited lithium in the electrolyte, the low frequency end of the semicircle was more and more taken off and shifted to more negative values of the imaginary impedance. This behavior of the Nyquist plots reflects the growth of the SEI, because the diameter of the overall semicircle increased with ongoing immersion time [49].
To take a closer look at the resistance growth of the SEI of the LiDFOB-based electrolyte the interphase resistances of the SEIs, ZSEI, corresponding to the fitted diameter of the overall semicircle of the according Nyquist plots are plotted against t1/2 (see Figure 13). With this graph it can be checked if the growth of the SEI is diffusion-limited, which is the case when there is a linear relation between interphase resistance and t1/2 [49]. For the corrosion process of the deposited lithium in the LiDFOB-based electrolyte only during the first 6 h of immersion time a linear relation between interphase resistance and t1/2 is observed. The slope of the straight line was calculated to be (16.6 ± 0.3) Ω h−1/2. Afterwards the interphase resistance is more scattered and no clear linear relation is observed. Compared with the results of the EQCM experiment (see Figure 1 and Figure 9) it may be concluded that for the corrosion process of deposited lithium in the LiDFOB-based electrolyte the SEI growth is only as long a diffusion-limited process as long as the potential is stable at 0.0 V vs. Li/Li+. Afterwards, when the potential starts to increase to more positive potentials growth and formation of semicircles of the Nyquist plots is not only influenced by the diffusion-limited growth of the SEI but also possibly by the change in structure and morphology of the SEI and also by dissolution processes of some SEI compounds.
The first four Nyquist plots of the corrosion experiment of the LiPF6-based electrolyte are shown in Figure 12. Again, only the first Nyquist plot after 10 min of immersion time of the deposited lithium in the electrolyte showed a closed semicircle. With ongoing immersion time of the deposited lithium in the LiPF6-based electrolyte the low frequency end of the semicircles take off and the indicated semicircles beneath the Nyquist plots became larger. In comparison with the Nyquist plots of the LiDFOB-based electrolyte the semicircles of the LiPF6-based electrolytes grew faster with time and therefore the typical shape of a semicircle disappeared faster with ongoing immersion time in the electrolyte.
Figure 13. Variation of the interphase resistance ZSEI with immersion time, for the 1 M LiDFOB in EC:DEC (3:7, by wt.) electrolyte.
Energies 06 03481 g013
This result can even be stressed further by the resistance growth of the SEI, ZSEI, plotted against t1/2 as shown in Figure 14. After 50 h of immersion time the interphase resistance of the SEI is for the LiPF6-based electrolyte almost 7 times higher than for the LiDFOB-based electrolyte. Even more interesting is the result that in the case of the LiPF6-based electrolyte the whole SEI growing process is diffusion-limited, although the SEI growth is divided into two parts with different diffusion-controlled velocities. The slope of the black straight line in Figure 14, representing the velocity of the SEI growth during the first 18 h is (115.8 ± 9.7) Ω h−1/2, i.e., about 5 times flatter than the slope of the grey straight line (572.2 ± 9.3) Ω h−1/2 representing the velocity of the SEI growth from the 20th to 50th h of immersion time in the LiPF6-based electrolyte. The first part of the SEI growth can almost be attributed to the period of time where the potential is stable at 0.0 V vs. Li/Li+. As shown by the EQCM experiment (see Figure 10) the mass of the quartz sensor increased in this period of time. Therefore, the diffusion of the lithium ions through the SEI leads to a growth of the SEI and to a mass increase of the quartz sensor, during the first 18 h of immersion time of deposited lithium in the LiPF6-based electrolyte. Afterwards the SEI growth is still diffusion-controlled, but the interphase resistance of the SEI grows faster. From the 20th to 50th h of immersion time the potential increased from 1.5 V vs. Li/L+ to 3.0 V vs. Li/Li+, at least at the EQCM experiment (see Figure 2). Therefore, we conclude that also for the AC impedance measurement the potentials of the copper foil electrodes reached already relatively positive potentials in this period of time where the driving force for lithium dissolution is lowered [54]. As the SEI is no longer as much exposed to the very negative potential of the deposited lithium as it used to be, maybe some morphology changes in the SEI occurred which blew the SEI up entailing a faster SEI growth. This suggested behavior of the SEI could also be an explanation for the stagnation of mass change from the 18th to 30th h seen in the EQCM experiment. However, after the 30th h the EQCM experiment could detect a mass decrease, because in the end also the SEI will probably start to dissolve in the electrolyte, whereas the Nyquist plots still show a SEI growth.
Figure 14. Variation of the interphase resistance ZSEI with immersion time, for the 1 M LiPF6 in EC:DEC (3:7, by wt.) electrolyte.
Energies 06 03481 g014
This discrepancy of the results from the two methods can be explained by the different cell designs of used cells. The EQCM cell has a volume of 600 µL with no separator and a vibrating sensor, whereas in the Swagelok®-cell for the AC impedance measurement a separator was soaked with 120 µL electrolyte. It is justified to assume that the SEI compounds will dissolve earlier and more easily in the EQCM experiment. The results of the AC impedance measurements are able to confirm that the LiDFOB-based electrolyte not only creates a more conductive and thinner SEI than the LiPF6-based electrolyte, but that the SEI growth during the corrosion process of deposited lithium is not as fast as in the LiPF6-based electrolyte.

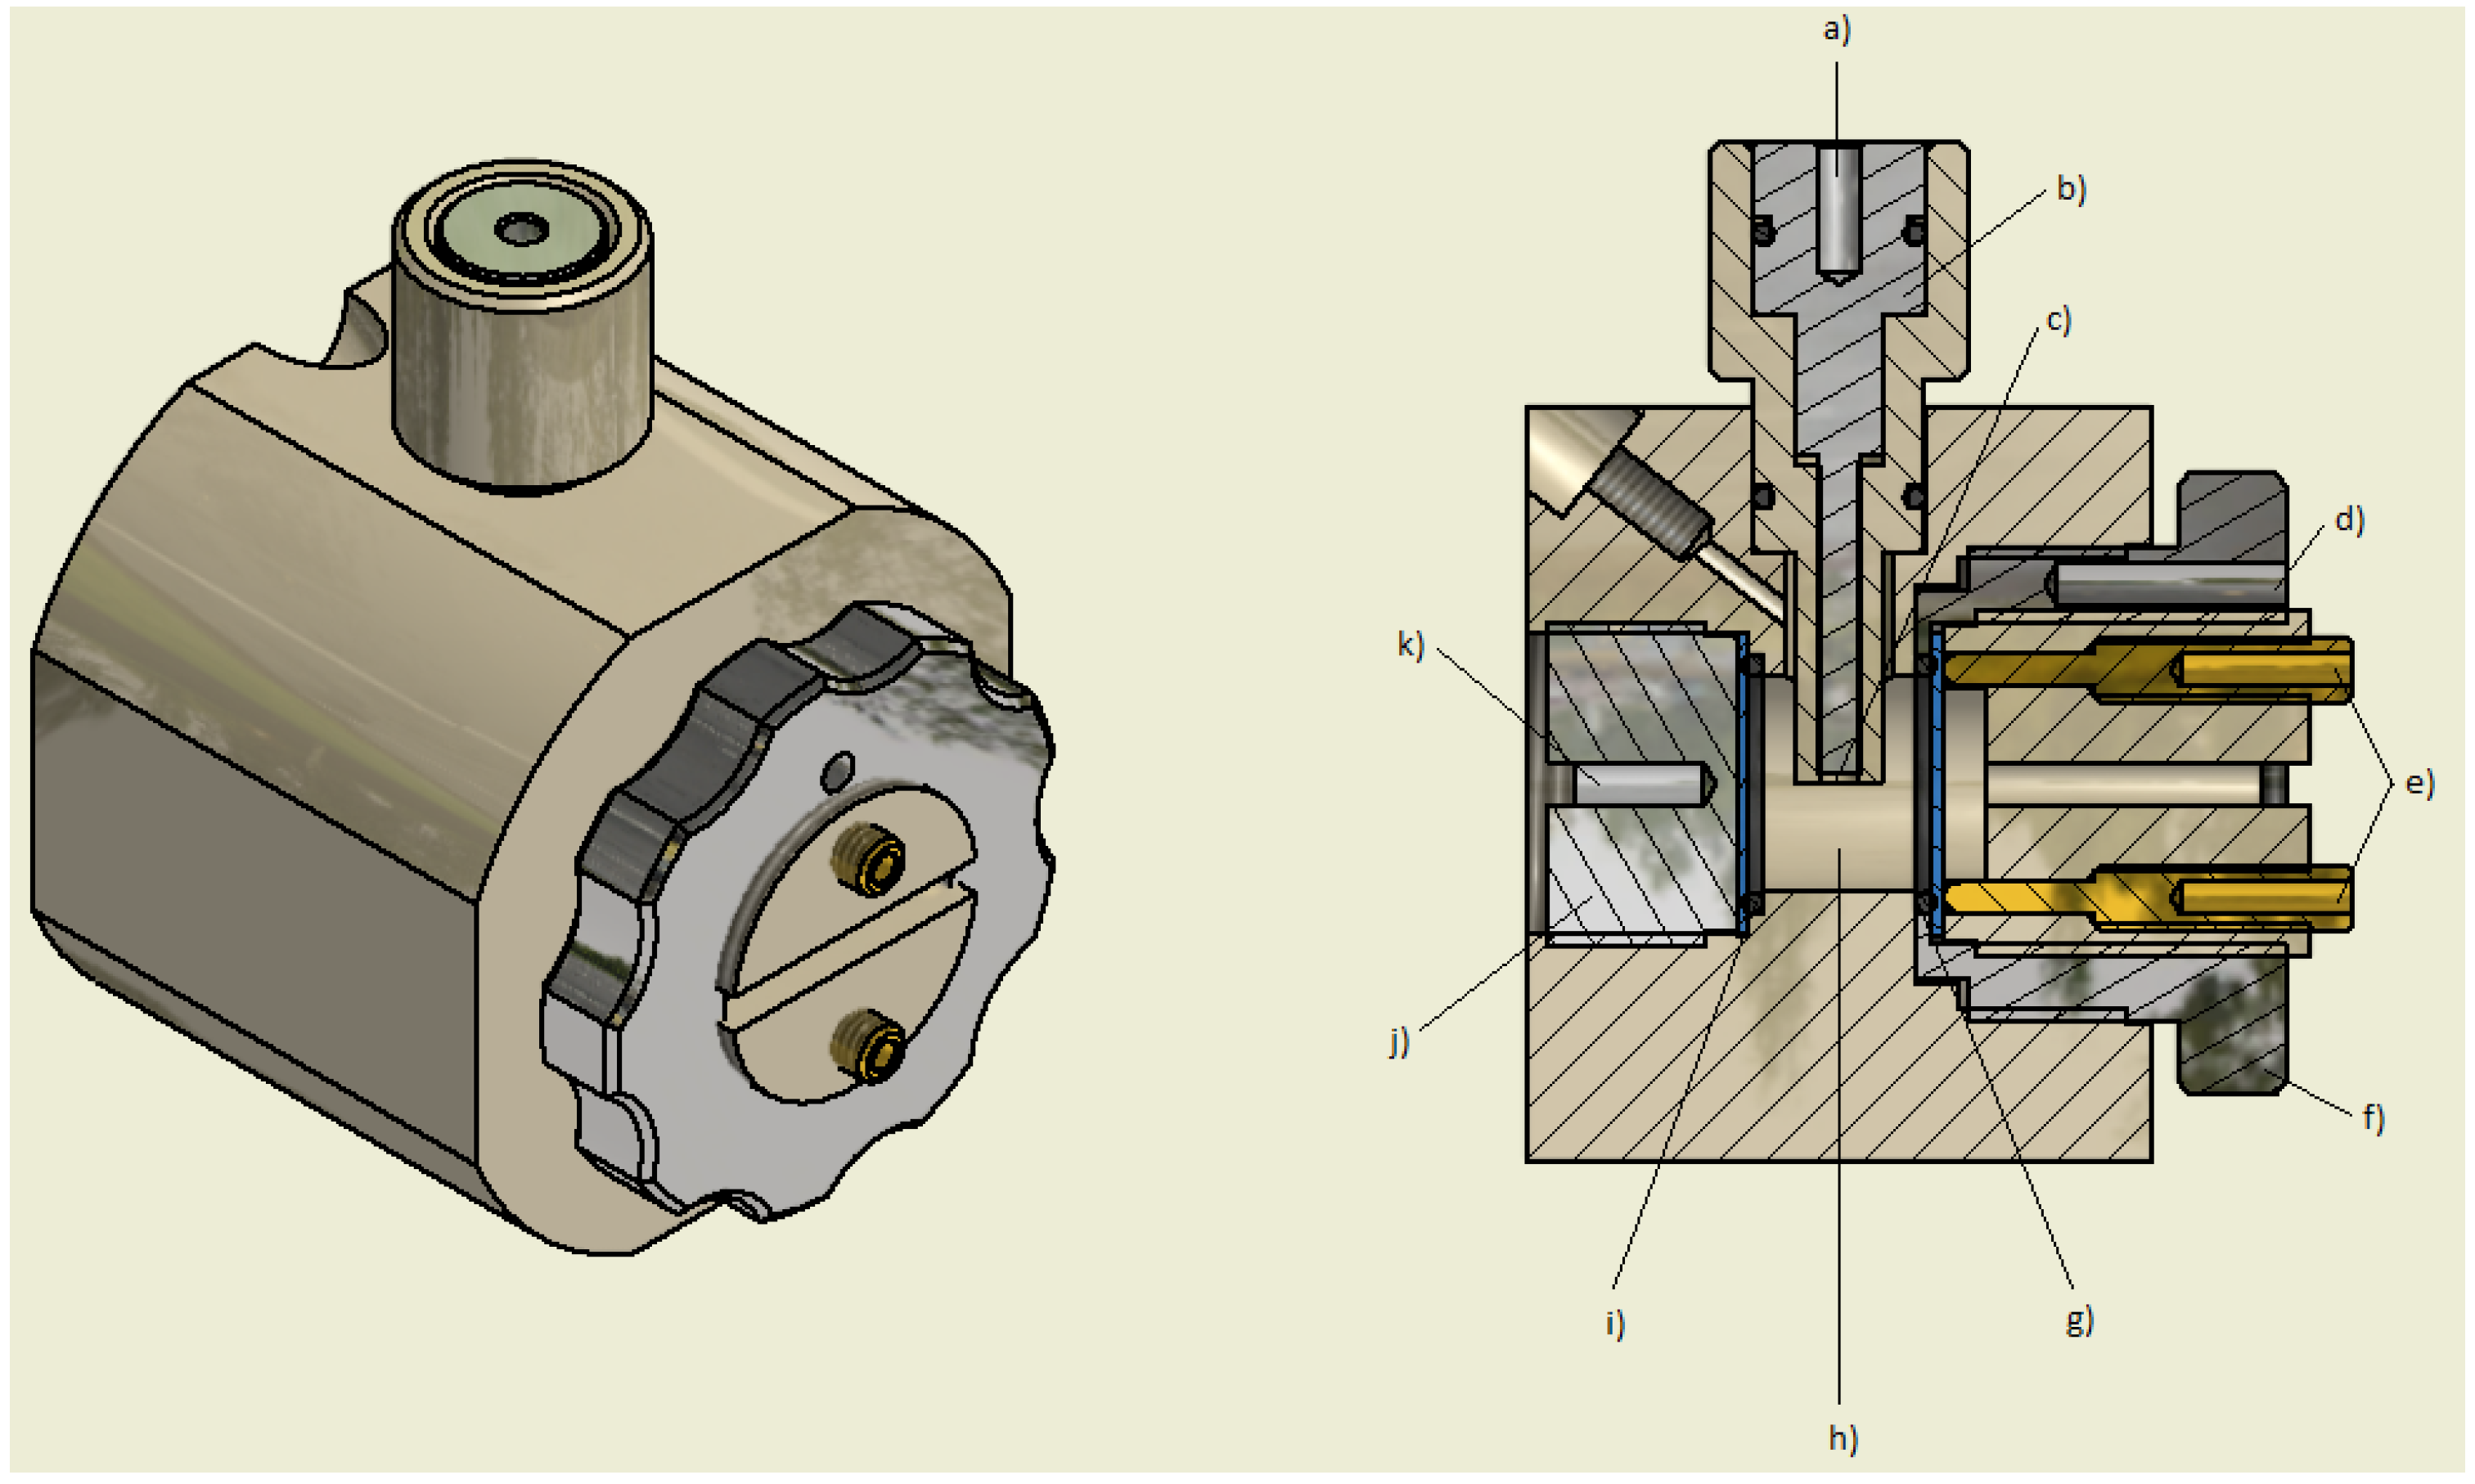
3. Experimental Section

The solvents EC (battery grade), DEC (battery grade) and the standard electrolyte 1 M LiPF6 in EC:DEC (3:7, by wt., battery grade) were obtained from UBE Europe GmbH (Düsseldorf, Germany) and used as received. LiDFOB was prepared in quantitative yield by the synthesis route described by Schreiner et al. [58,59]. The electrolyte solution of 1 M LiDFOB in EC-DEC (3:7, by wt.) was obtained by dissolving an adequate amount of LiDFOB in the premixed solvent at 20 °C in a volumetric flask. All solutions were prepared in an argon filled glove box (LABmaster SP/DP glovebox workstation, MBraun, (Garching, Germany) with mass fractions of water and oxygen below 1 ppm. The water content in all electrolytes was analyzed by Karl Fischer Titration (Mitsubishi CA-200, Mitsubishi, Düsseldorf, Germany) with Aquamicron AKX (Mitsubishi) as anolyte and Aquamicron CXU (Mitsubishi) as catholyte; it was below 10 ppm. Lithium metal was purchased from Chemetall (Frankfurt, Germany) and copper foil was obtained from Evonik Industries (Essen, Germany). The copper foil was washed with water and ethanol and dried overnight in a glass oven (Büchi Labortechnik AG, (Essen, Germany) at 60 °C in rotary vane pump vacuum, pressure about 0.1 Pa. The quartz crystals (gold surface, 6 MHz, 0.55 inch diameter) were obtained from INDOMET (Gründau, Germany).
The FIS-QCM [9] was connected with a Gamry Potentiostat Reference 600 as was previously described [25] and used in the EQCM mode [9]. The home-built EQCM cell is shown in Figure 15. For this cell with a three electrode setup only 600 µL of electrolyte is needed. To study lithium deposition/dissolution processes at bulk metal foils the copper foil was glued onto the gold quartz sensor [24]. To prepare the copper foil quartz a copper foil disc with 14 mm diameter was glued (Crystalbond 509, Garton Inc., Turlock, CA, USA) on the plane side of the gold sputtered quartz crystal, as described previously [10,25]. As the copper foil covers the whole quartz surface, the electrolyte is only in contact with the electrochemical active surface of the copper foil (0.785 cm2). The copper foil on quartz was calibrated with an electrolyte containing 1 M sulfuric acid (H2SO4) (95%–97%) and 0.1 M copper(II) sulfate pentahydrate (CuSO4·5H2O) (99.995%, Sigma-Aldrich, Spruce St., St. Louis, USA) [60]. A cylindrical teflon cell [61] and a three electrode setup including a platinum (Pt) as pseudo-reference electrode (RE) and counter electrode (CE) and copper foil on quartz as working electrode (WE) was used. Copper was deposited chrono-potentiometrically for 600 s with a current density of 1 mA cm−2 [62]. To determine the calibration factor [see equation (2)] the charge Q is plotted against the change of the resonance frequency ∆f (see Figure 16). With the slope of the straight line in Figure 16. and the Faraday’s law the calibration factor Cf could be determined to (94.21 ± 0.12) Hz µg−1. The calibration factor Cf of the gold sputtered quartz sensor, also determined by copper deposition, is 246 Hz µg−1 [9]. The theoretically calculated calibration factor Cf of the aluminum foil quartz sensor was forecast to be 86.9 Hz µg-1 [61], which is very close to the experimentally determined calibration factor Cf of (94.21 ± 0.12) Hz µg−1 of the copper foil on quartz sensor.
Figure 15. EQCM cell and its various components: (a) blind hole for jack plug (RE); (b) stainless steel bolt to contact the Li foil RE; (c) Li foil RE; (d) blind hole for jack plug (WE); (e) gold bolts to contact the copper foil quartz at the back side; (f) stainless steel winding to contact the copper foil quartz at the front side; (g) copper foil on quartz; (h) measurement chamber; (i) Li foil CE; (j) stainless steel plug to fix and to contact the Li foil CE; (k) blind hole for jack plug (CE).
Energies 06 03481 g015
After calibration the sensor was cleaned with 0.1 M H2SO4 to remove the deposited copper. The sensor was washed with water and ethanol and dried overnight in a glass oven (Büchi Labortechnik AG, Flawil, Switzerland) at 60 °C in rotary vane pump vacuum, pressure about 0.1 Pa and then used for the measurements of the chemical stability of deposited lithium. For the EQCM experiment a three electrode setup, with lithium both as RE and CE and the copper foil on quartz as WE, were chosen (see Figure 15). The EQCM experiment started with deposition of lithium onto the copper foil (j = 1 m A cm−2 for 360 s). Immediately afterwards the OCP measurement was started and was retained until the potential value of the bare copper foil was reached again. During the whole experiment the frequency change of the sensor (copper foil on quartz) was measured simultaneously, whereby the attributed mass change could be calculated. After every measurement the copper foil on quartz was cleaned with demineralized water and 0.1 M H2SO4 and was then again washed with water and ethanol and dried overnight in a glass oven (Büchi Labortechnik AG) at 60 °C in rotary vane pump vacuum, pressure about 0.1 Pa. For all EQCM measurements the same sensor was used.
The AC impedance spectrum of the deposited lithium electrode-organic electrolyte interphase was measured by a Gamry Potentiostat Reference 600. Swagelok®-cells with a symmetrical two electrode configuration including two copper foils with 12 mm diameter (WE and RE + CE) with chronopotentiometrically deposited lithium (j = 1 mA cm−2 for t = 360 s) were used. Freudenberg 2226 separators with 12 mm diameter were wetted with 120 µL electrolyte. The AC impedance measurements were carried out 10 min and then every two h during the first 50 h after the cell was assembled. An AC voltage of 10 mV was applied to the cell under OCP conditions. The frequency was scanned from 1 MHz to 0.1 Hz.
SEM analysis was carried out using a Carl Zeiss AURIGA® Modular CrossBeam® workstation (Carl Zeiss, Oberkochen, Germany). To prepare the samples lithium was deposited onto the copper foil (j = 1 m A cm−2 for 360 s) from the according electrolyte. SEM images of the lithium metal deposits were taken immediately after lithium deposition. The SEM micrographs were obtained through tilting the electrode at an angle of 35° so that the thickness of the accumulated lithium metal deposits could be measured. The heights of the lithium metal deposits were measured at four different points of each sample. The experimental setup has been previously described in detail [27].
Figure 16. Calibration measurement. Change of the resonance frequency ∆f as received from the chronopotentiometric experiment plotted against charge Q.
Energies 06 03481 g016
For the LA-ICP-MS technique lithium was deposited onto a copper foil (for 360 s with a current density of 1 mA cm−2) from the according electrolyte and the chemical analysis of the decomposition products were performed immediately after lithium deposition. A Cetac LSX-213 laser ablation (wavelength: 213 nm) unit was used to evaporate material using a 50 µm diameter spot in lateral scanning mode in a helium atmosphere (purity 6.0, Westfalen AG, Münster, Germany). The aerosol is transported to the argon plasma (Westfalen AG, purity 4.8) (Agilent Technologies 7700 × ICP-MS, Santa Clara, CA, USA) where the ablated material is vaporized, atomized and ionized. The MS is set to transient signal acquisition recording the signal for 140 s per measurement and 30 µs per m/z. After the signal is stable 100 seconds of the measurement are used for further evaluation. In the absence of any element suitable as an internal standard no further signal correction was possible. At a scanning speed of 10 µm/s the ablated line has a length of 1.4 mm. The four measurements for each sample where done in randomly chosen locations and orientations. The arithmetic mean of each replicate was calculated and is given in Table 1.

4. Conclusions

The chemical stability of deposited lithium on a copper foil was studied via a novel electrochemical quartz crystal microbalance (EQCM) experiment and the results were compared with results from AC impedance measurements. To get better insight into the corrosion process of the deposited lithium scanning electron microscopy (SEM) images were taken from the deposited lithium. The investigated electrolytes were 1 M lithium difluoro(oxalato)borate (LiDFOB) and 1 M lithium hexafluorophosphate (LiPF6) both in solvent blends of ethylene carbonate (EC) and diethyl carbonate (DEC) (3:7, by wt.).
The common behavior during the corrosion processes of electroplated lithium in both electrolytes can be summarized as follows:
-
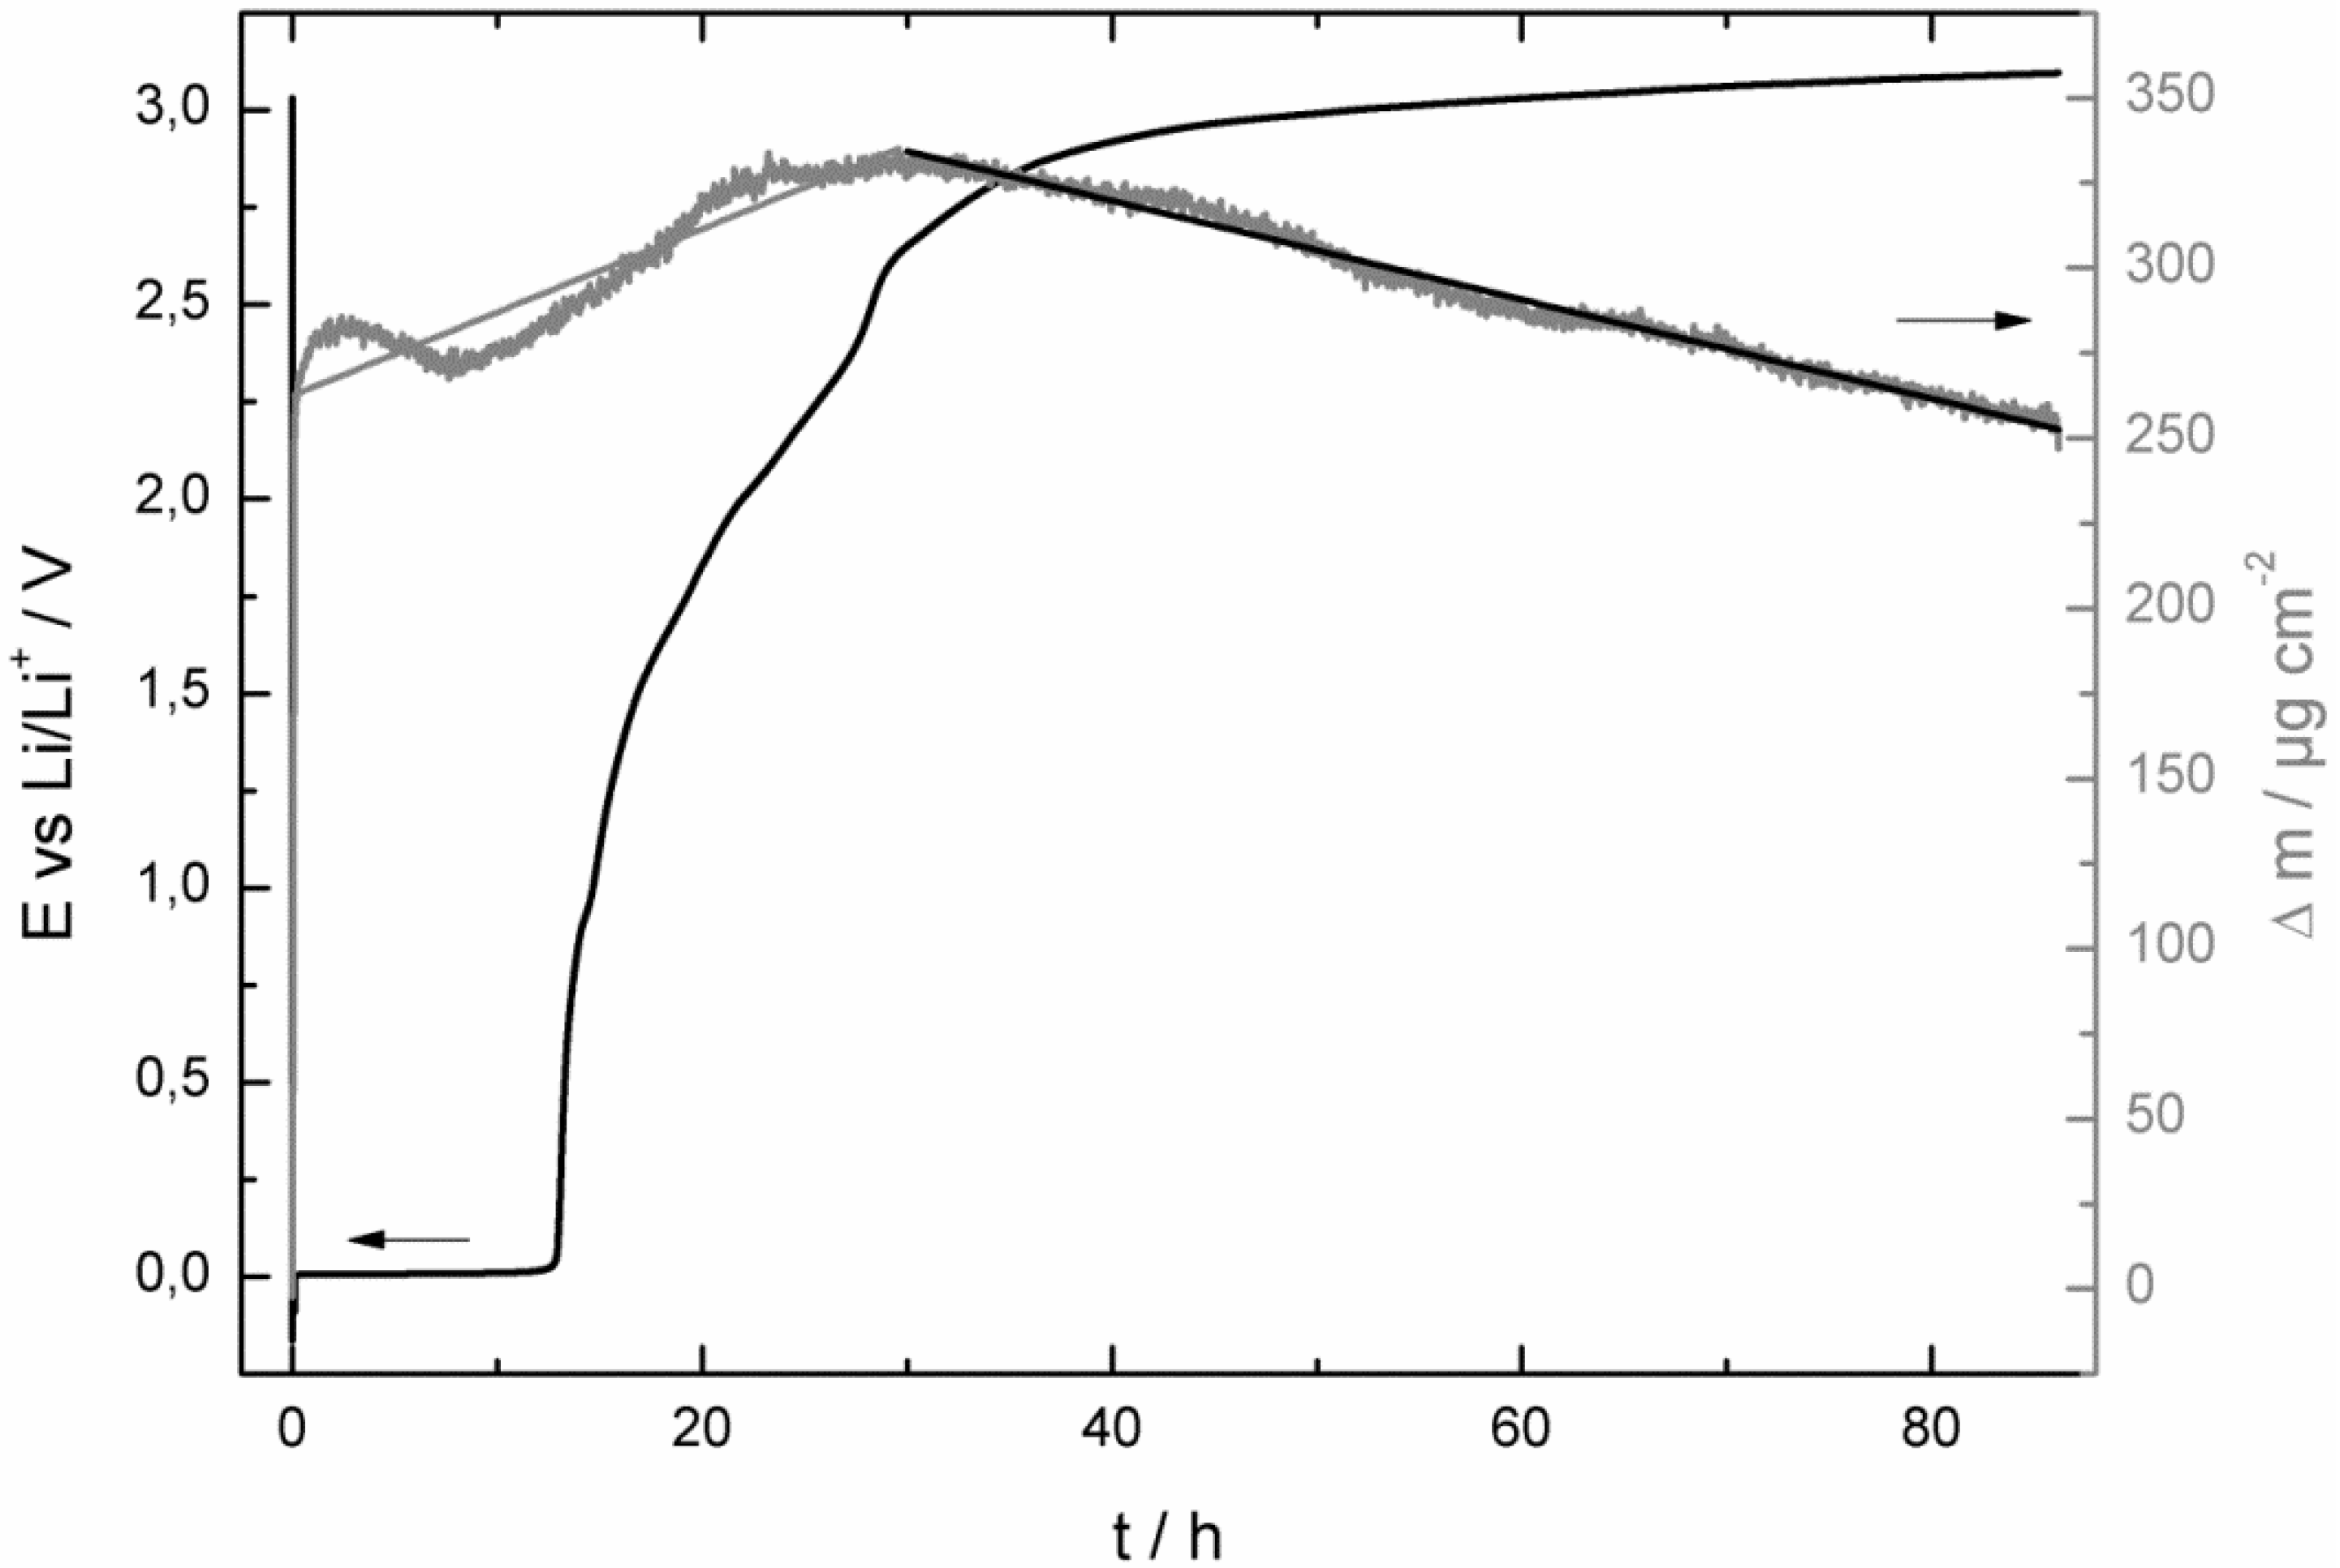
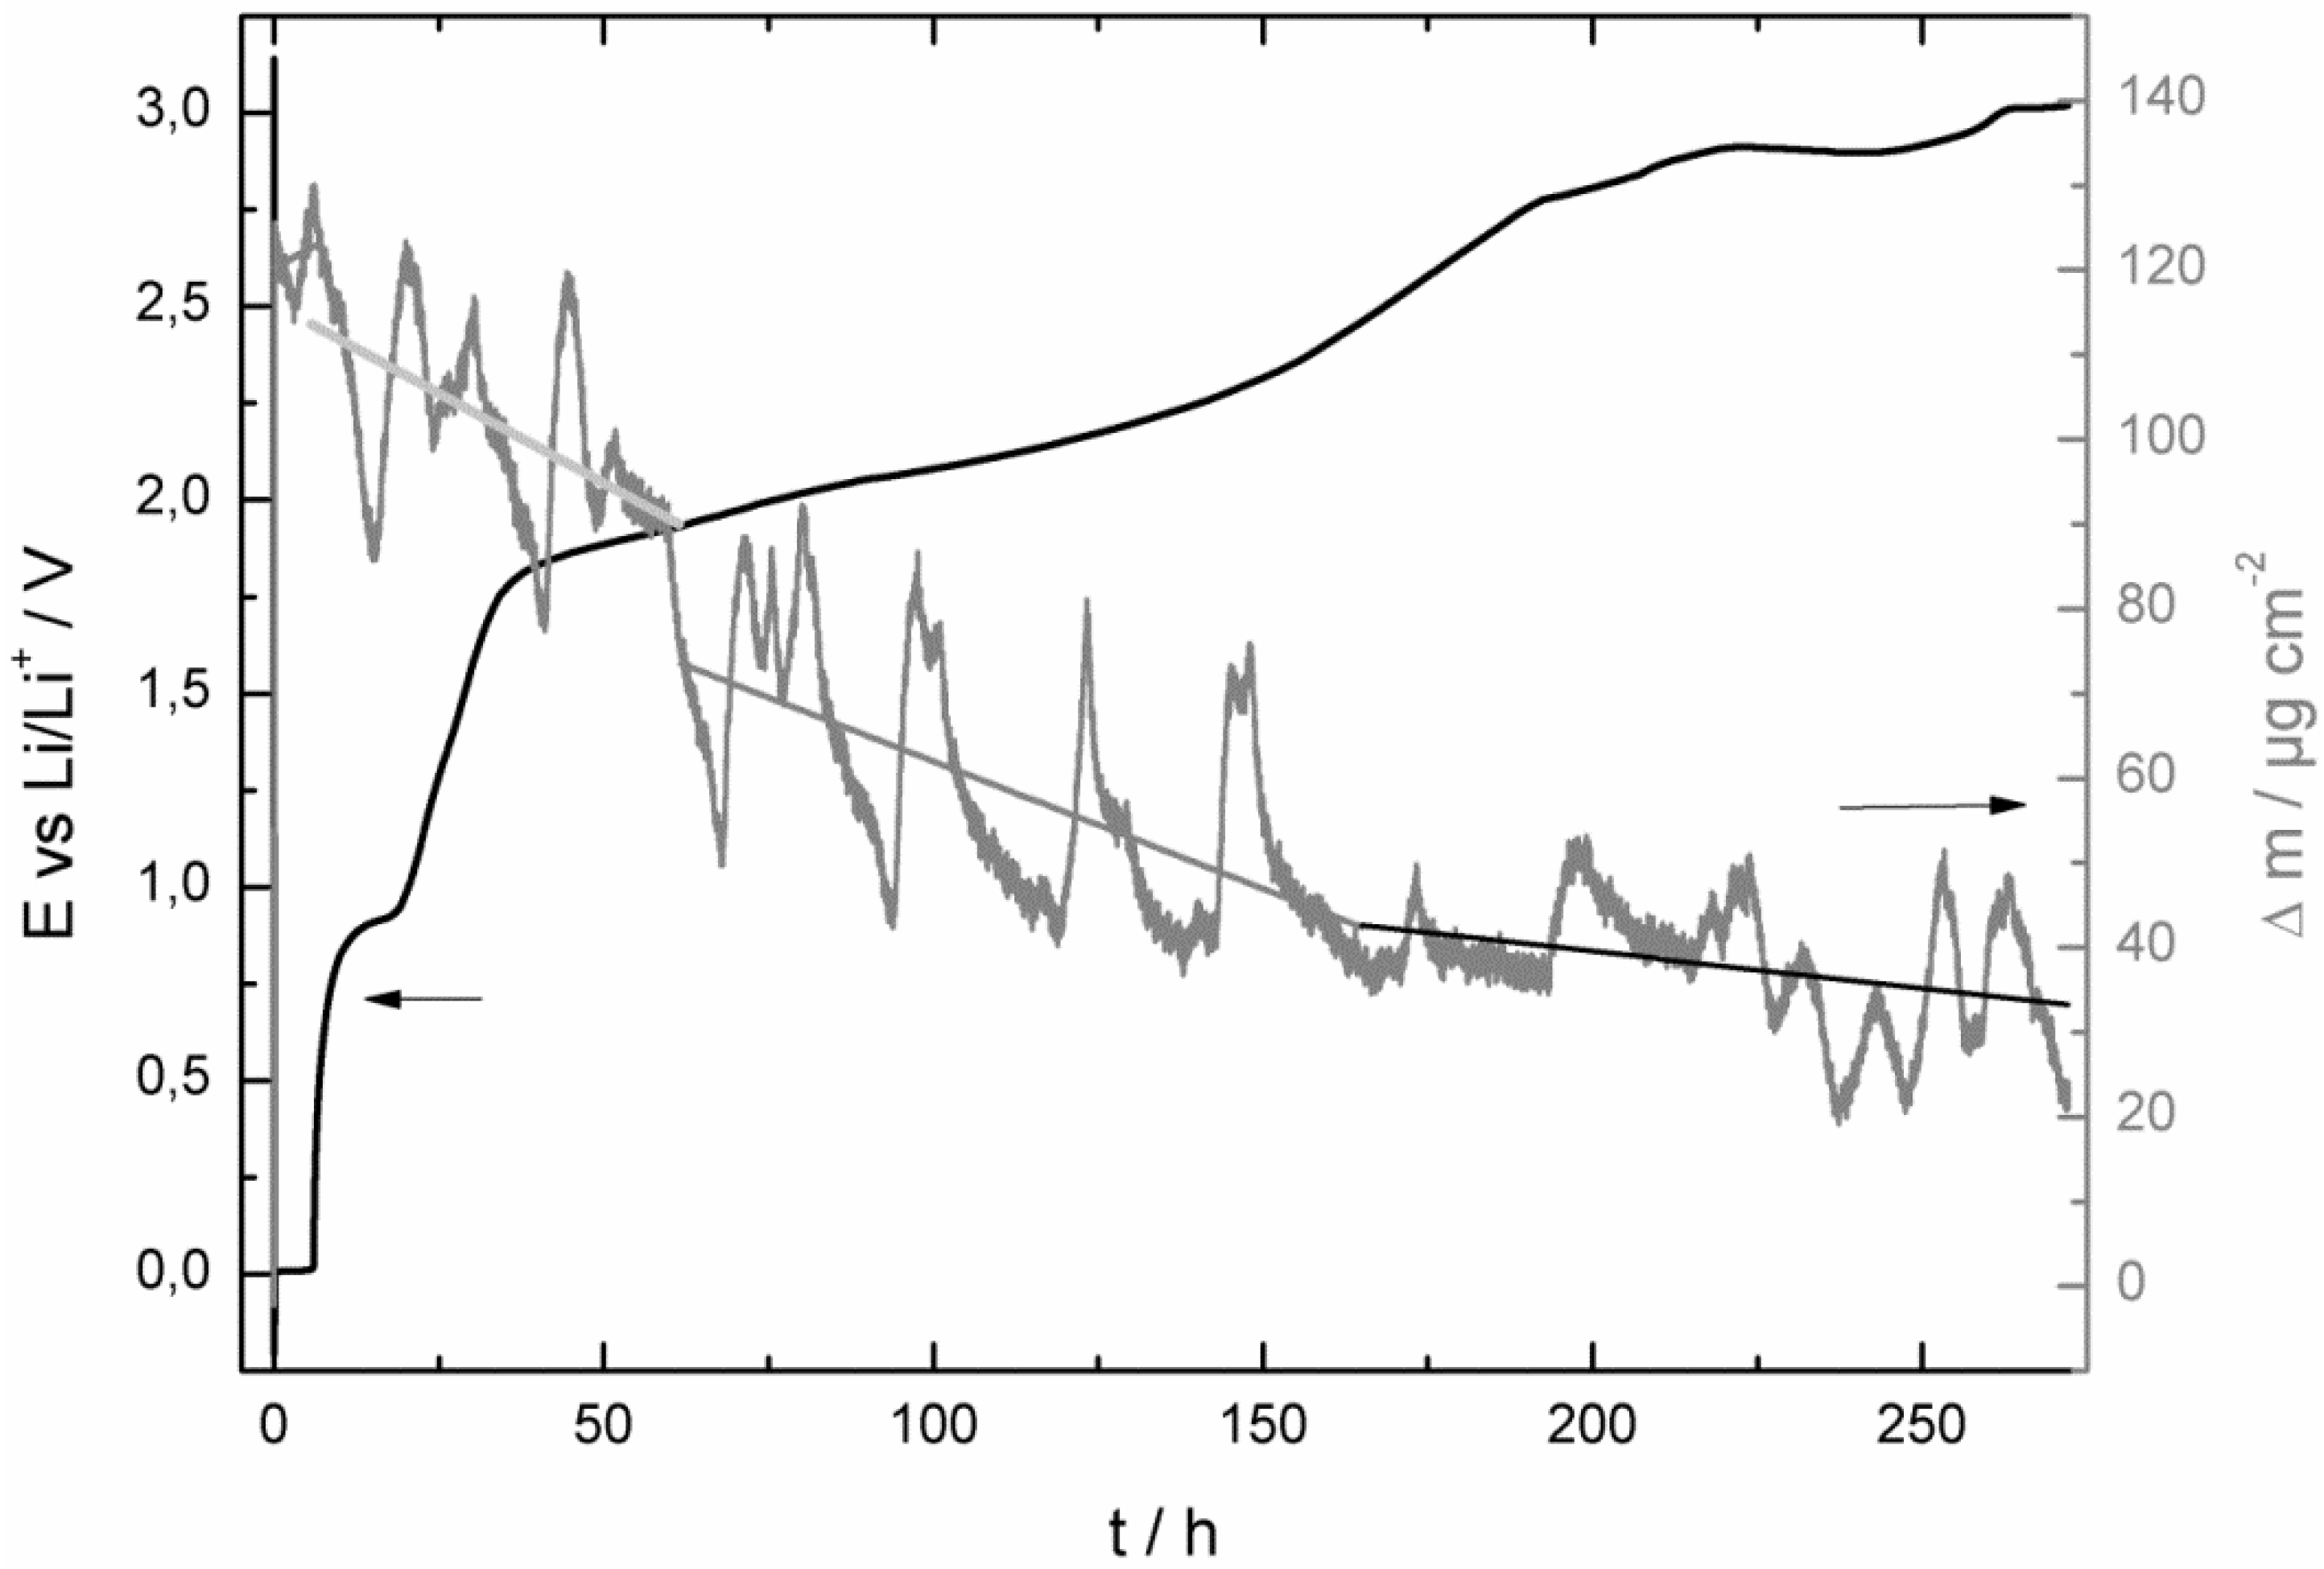
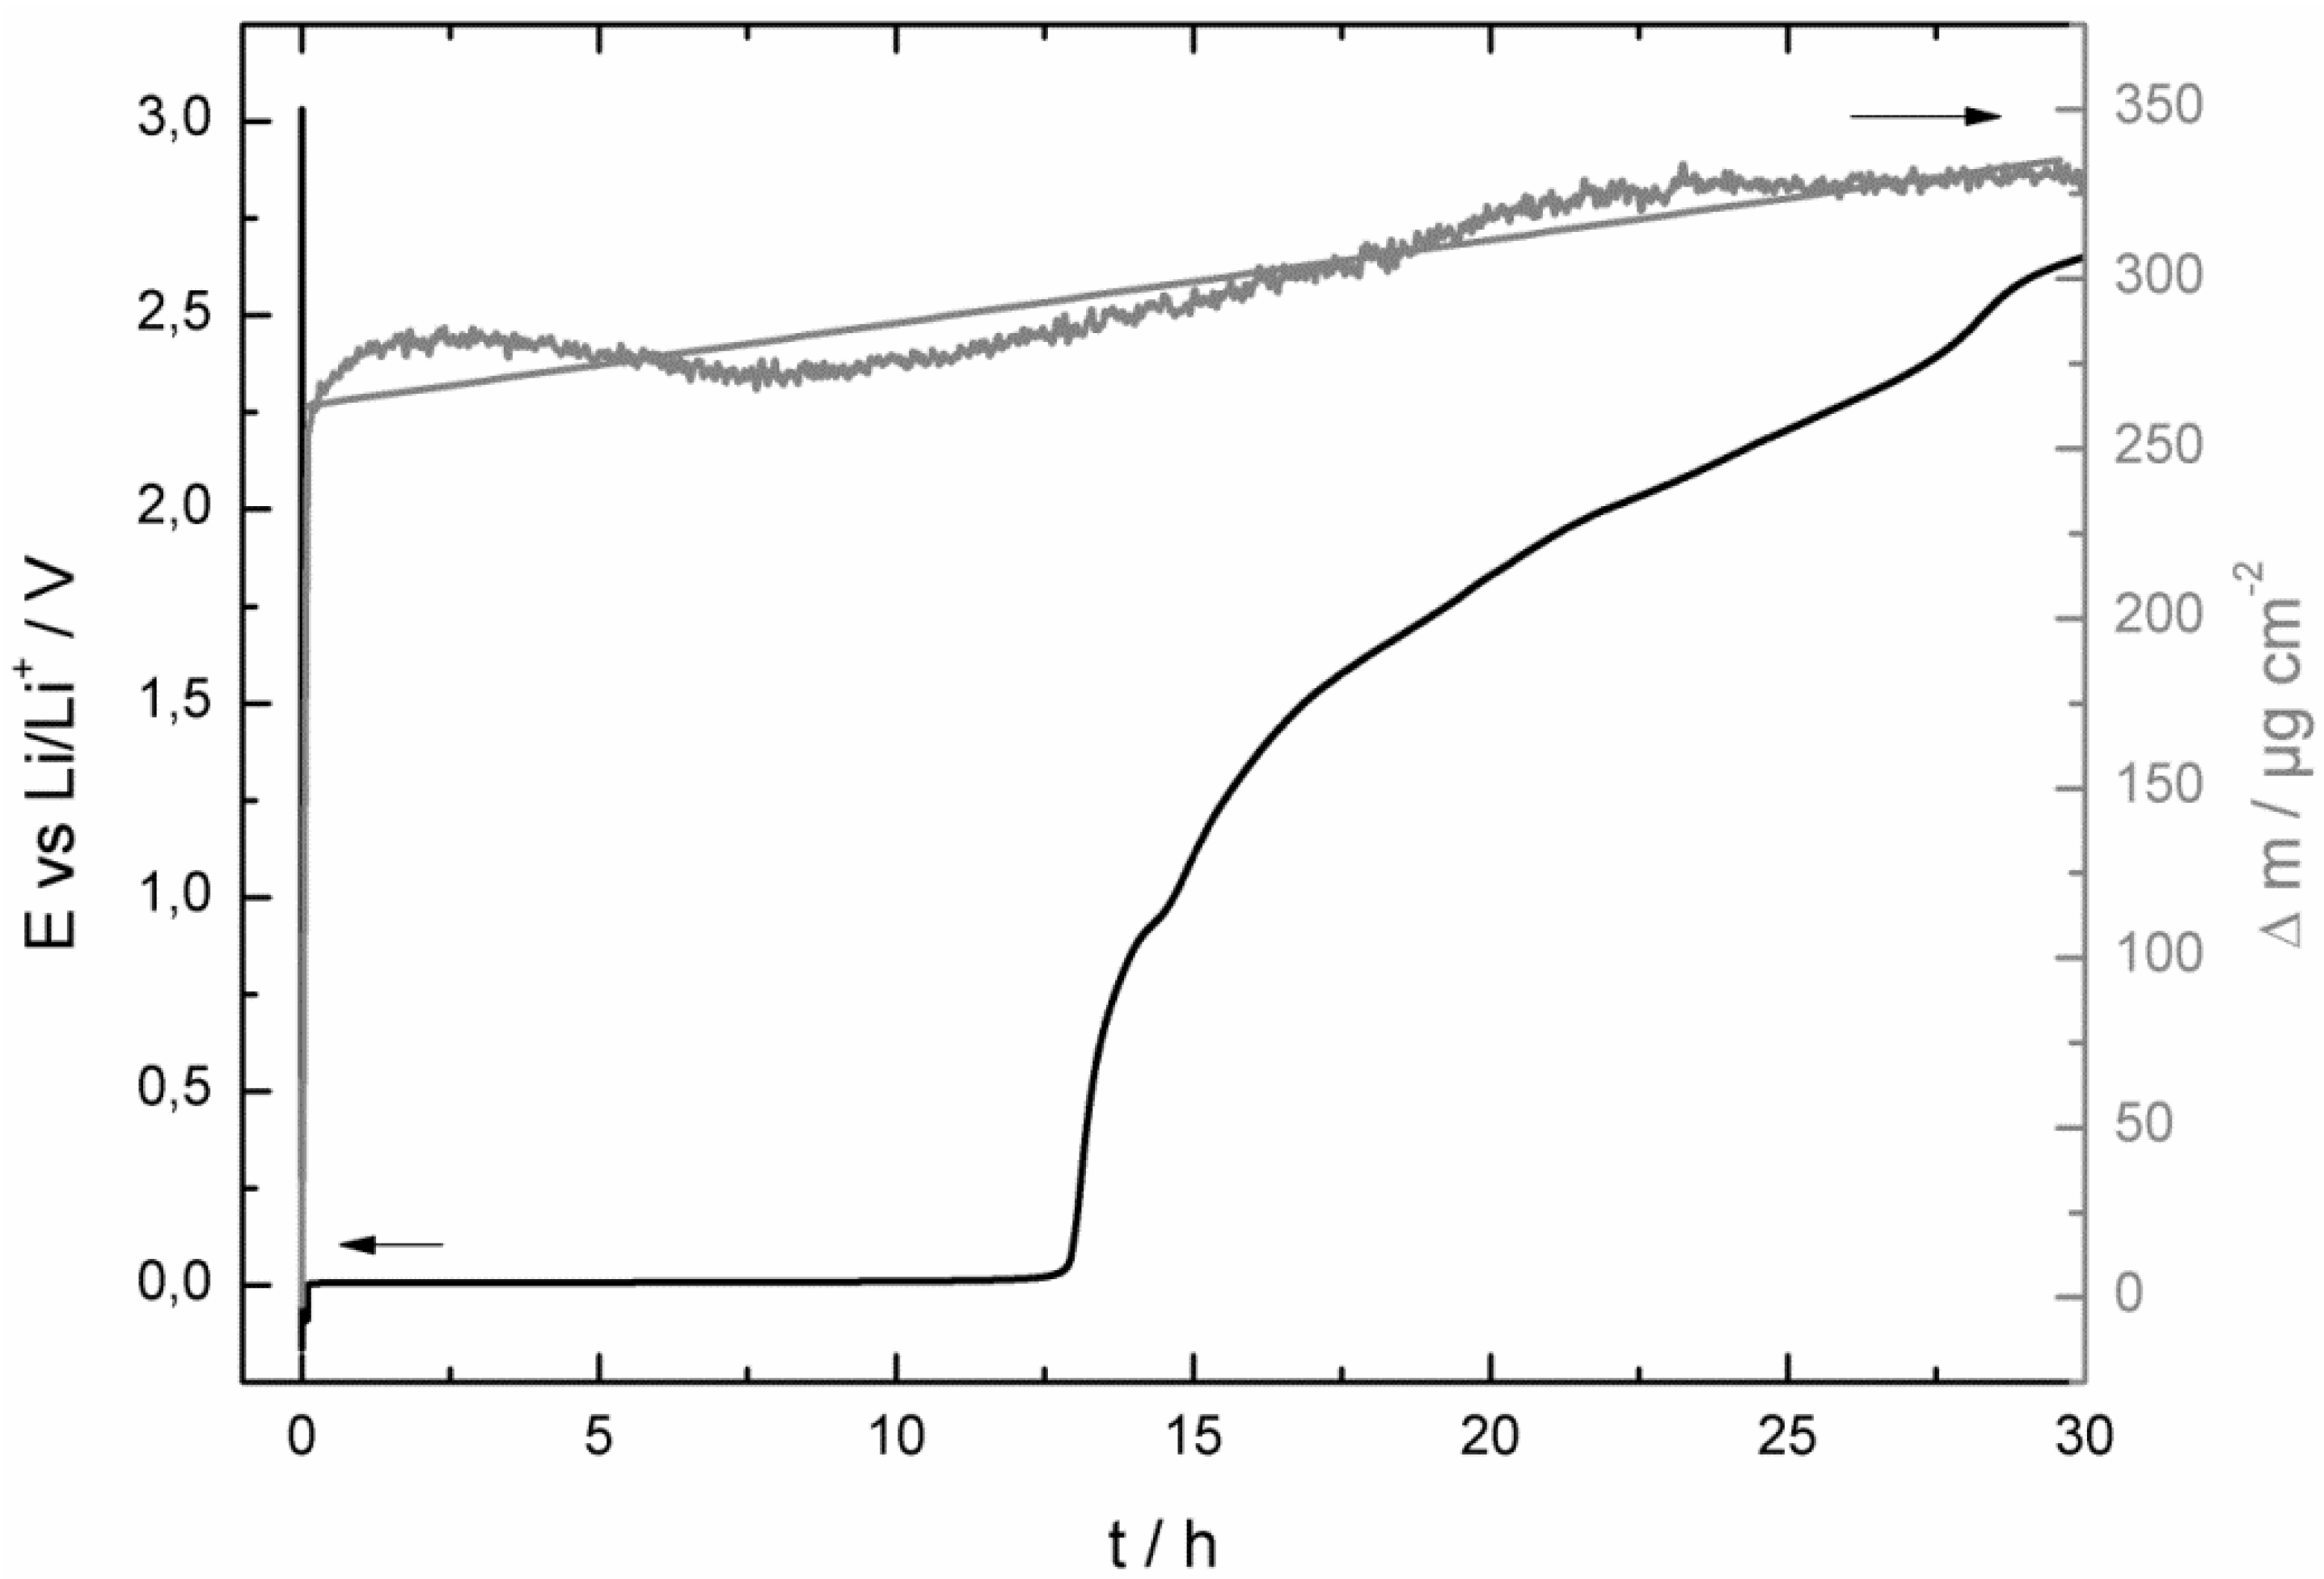
at the beginning of the corrosion process the potential stayed for some hours at 0.0 V vs. Li/Li+ and increased then consistently until it reached the potential of the bare copper foil;
-
at least as long as the potential stayed at 0.0 V vs. Li/Li+ the mass of the quartz sensor increased and after reaching a maximum it started to decrease;
-
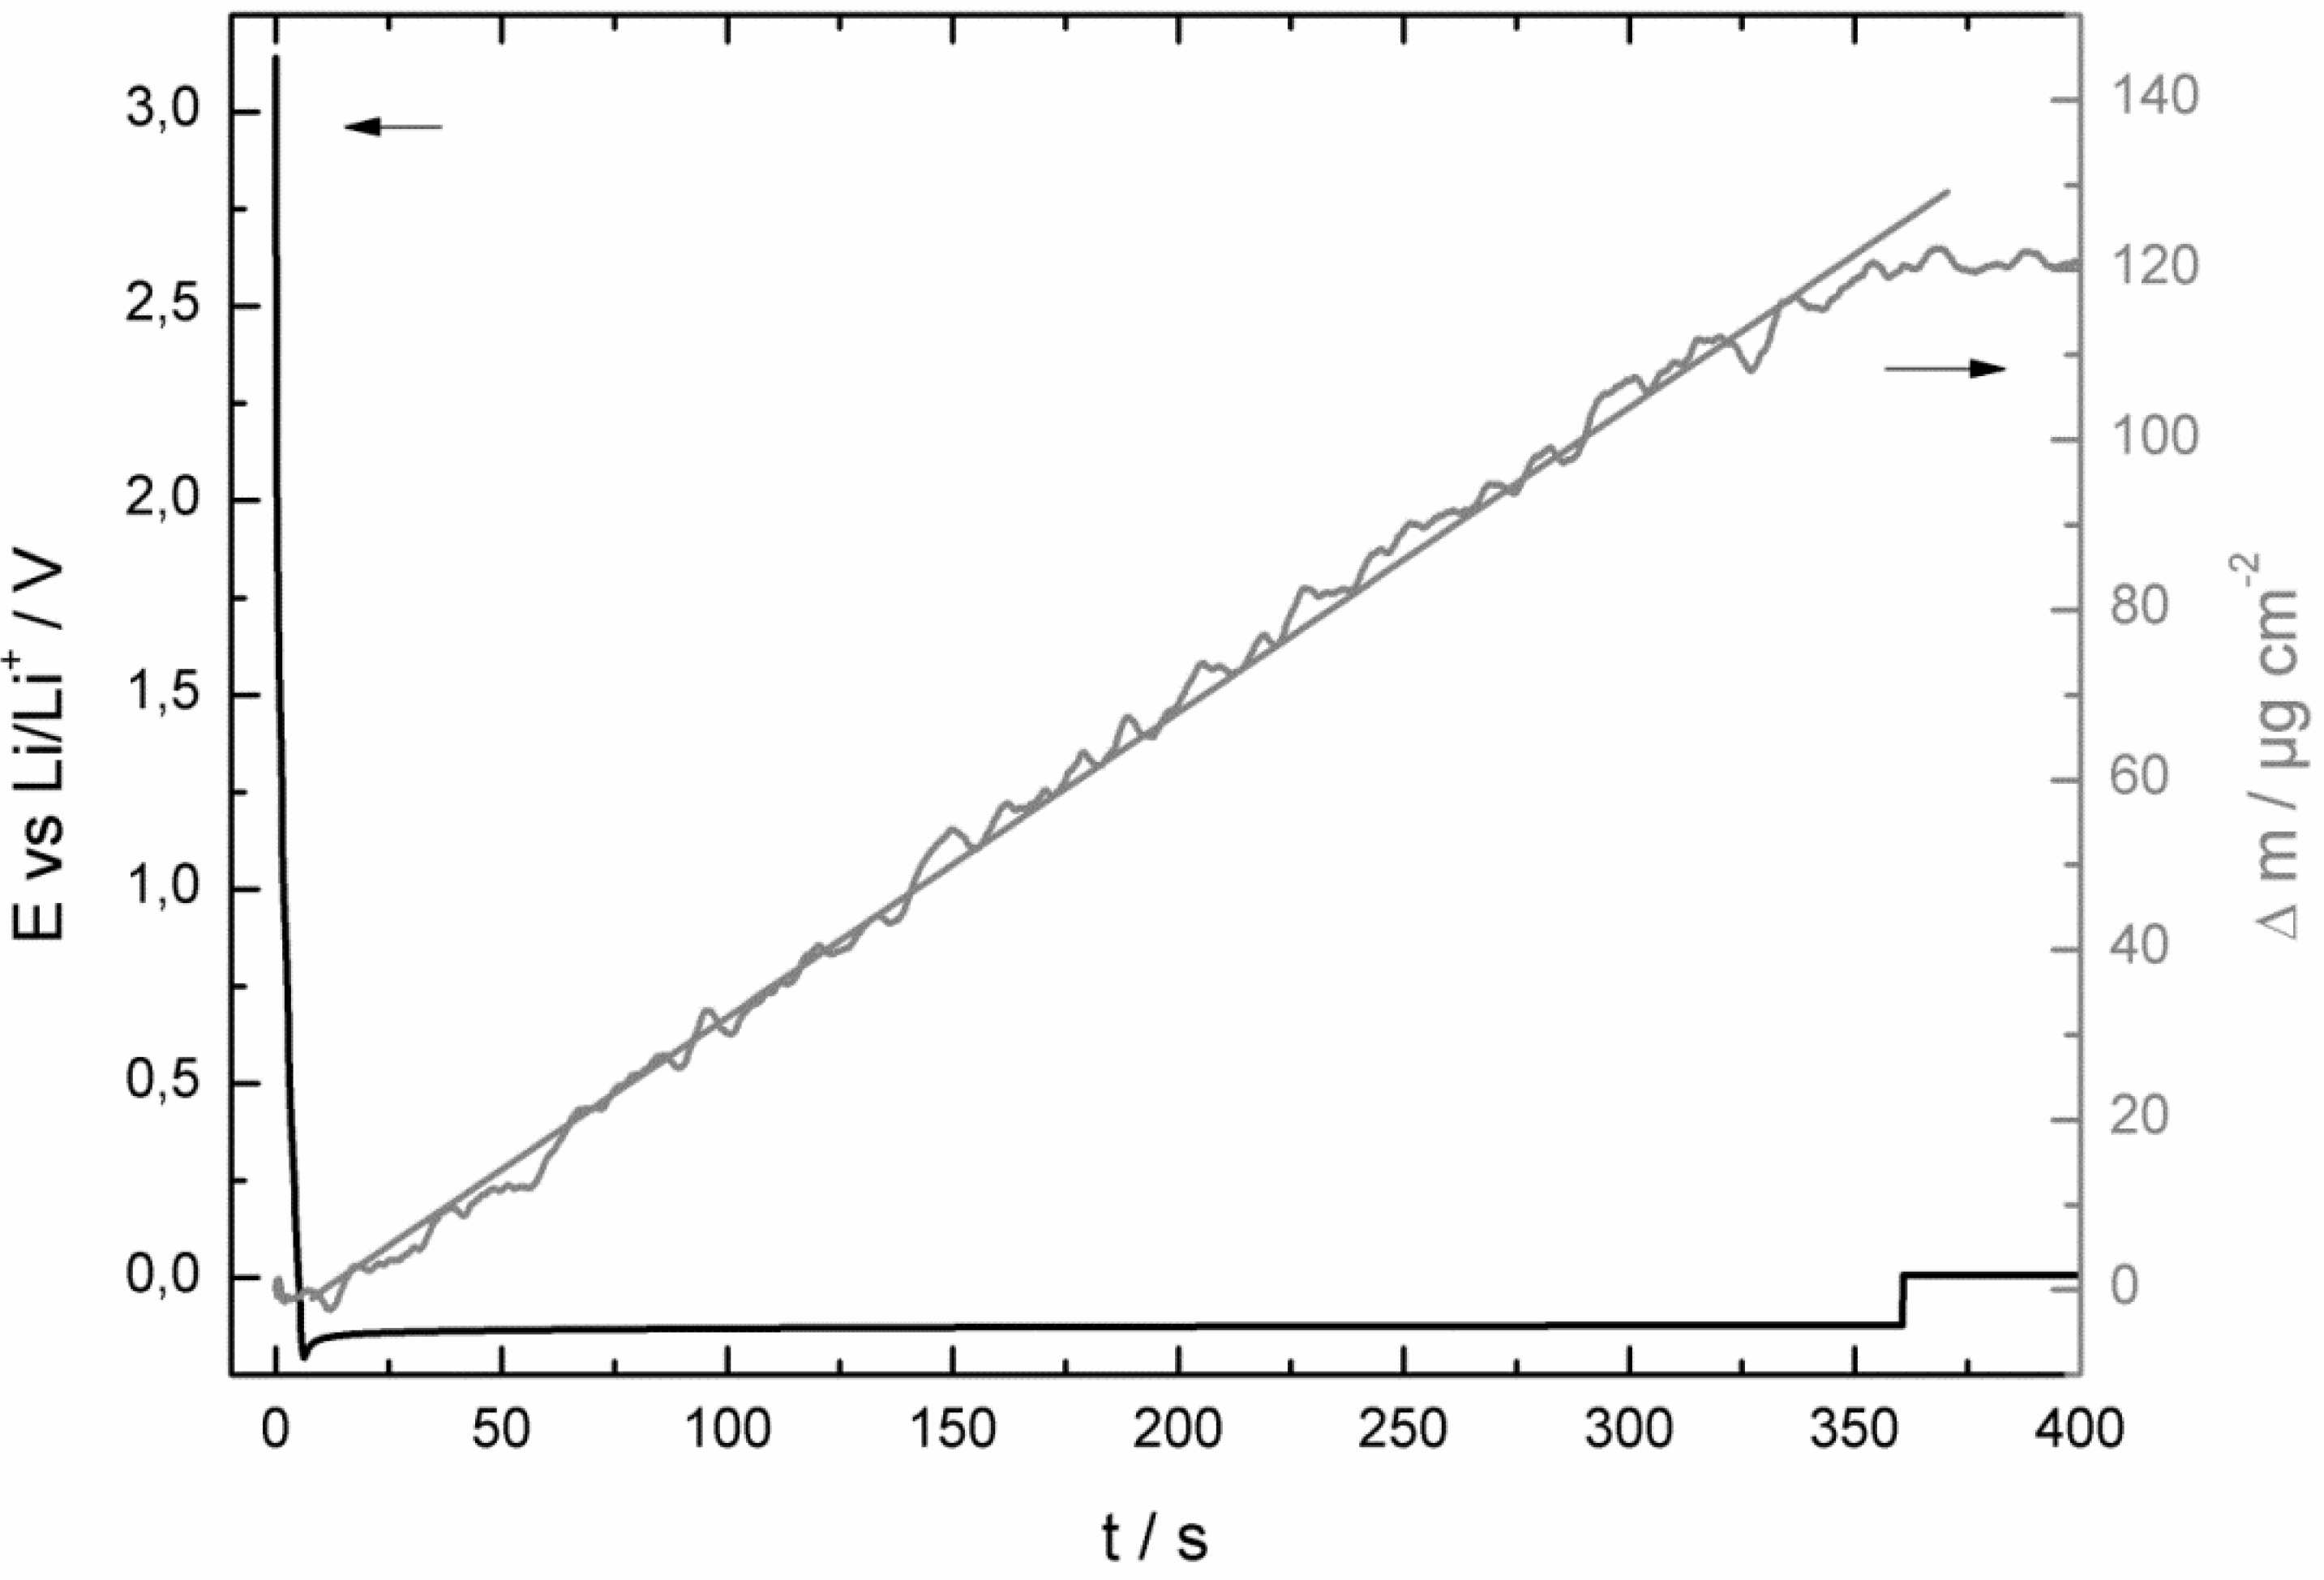
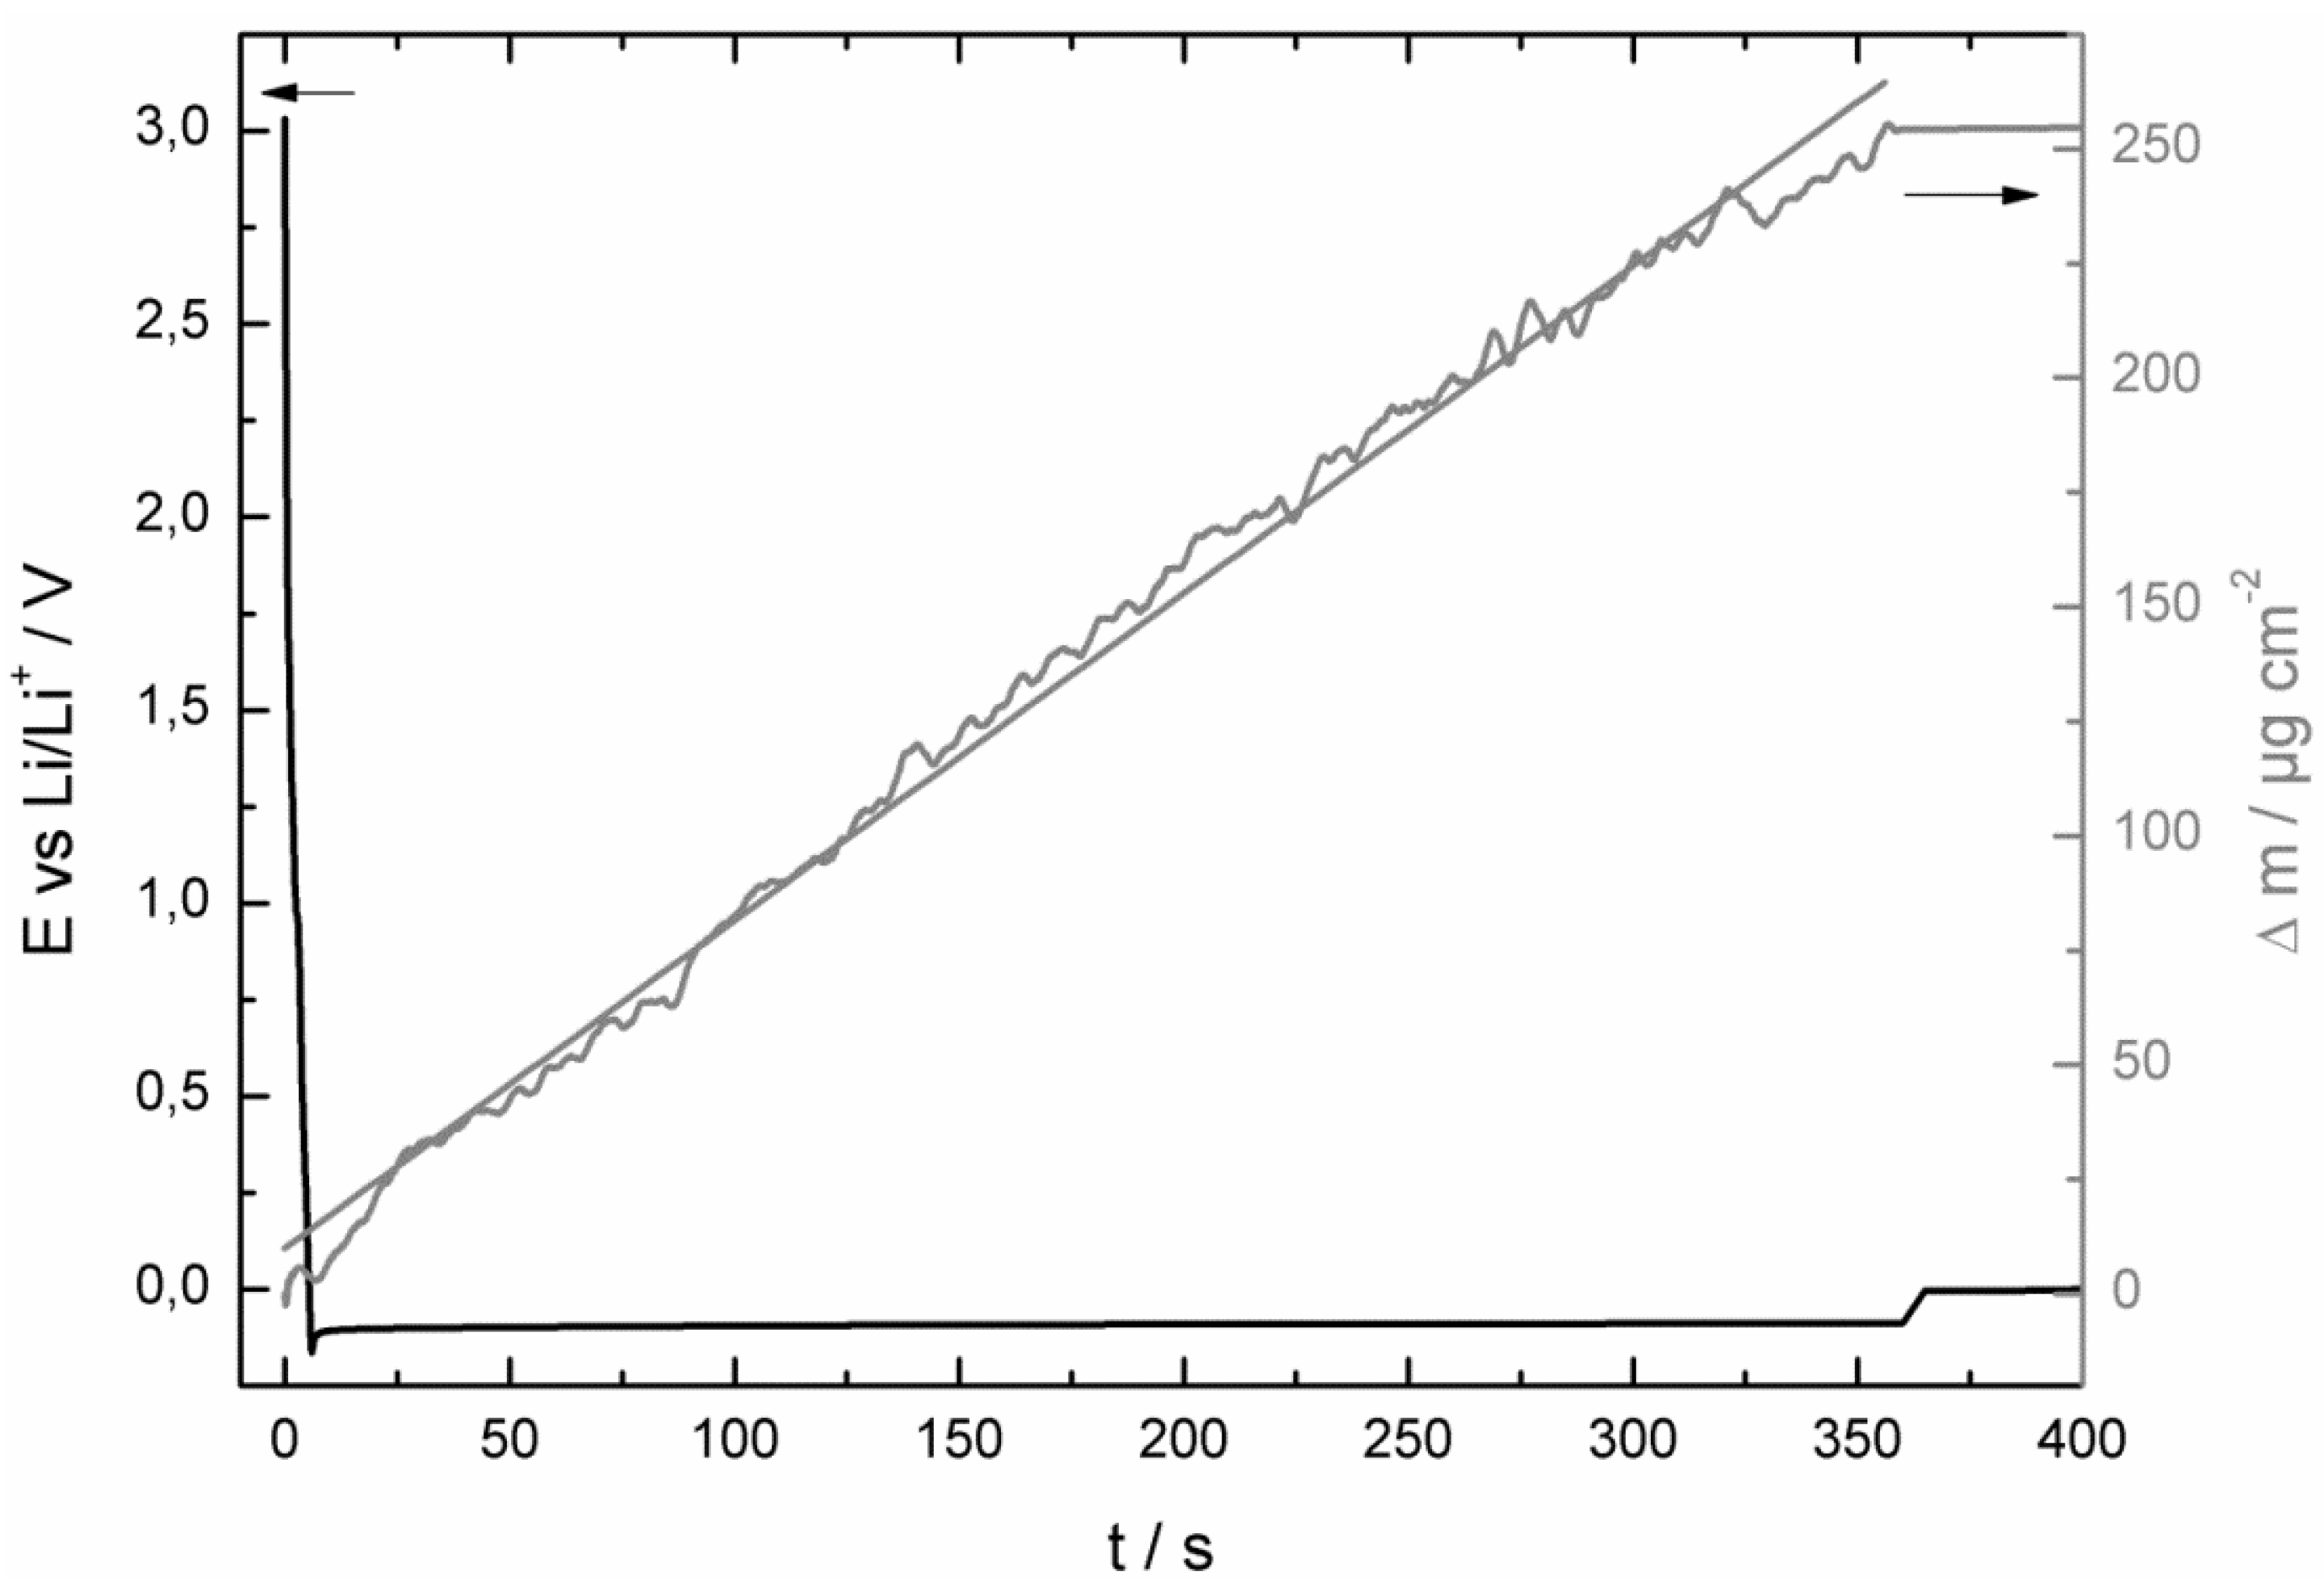
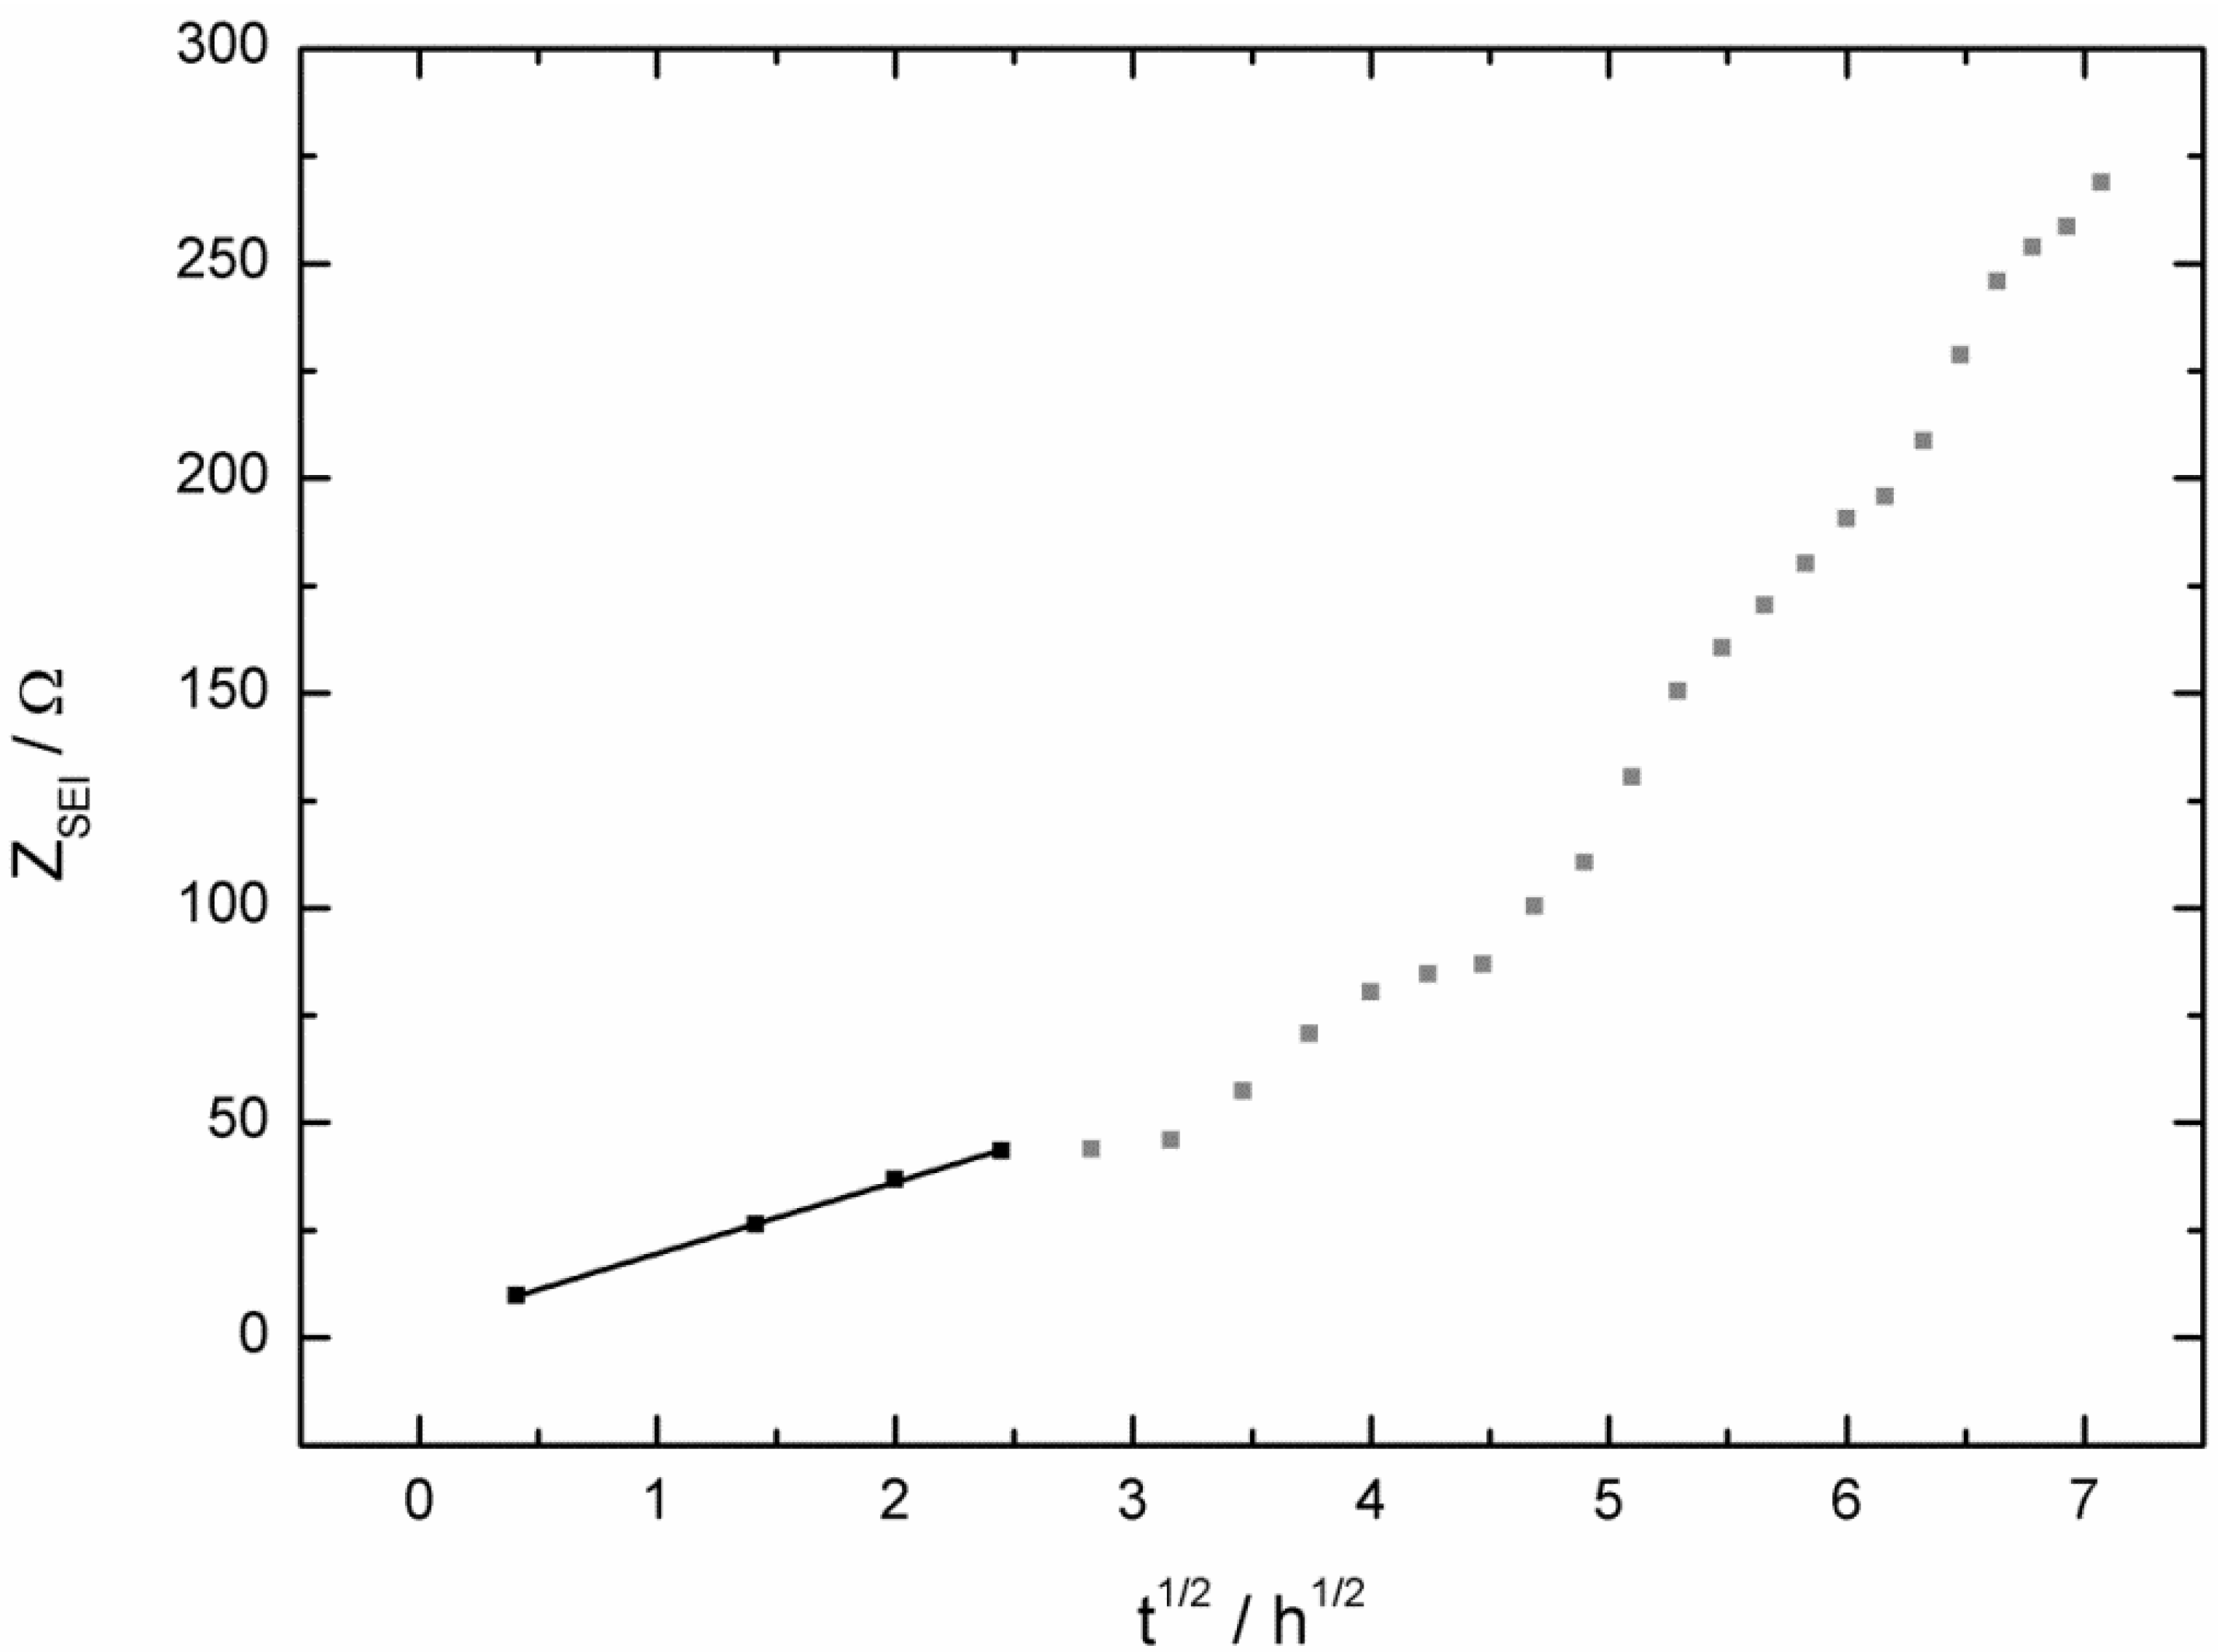
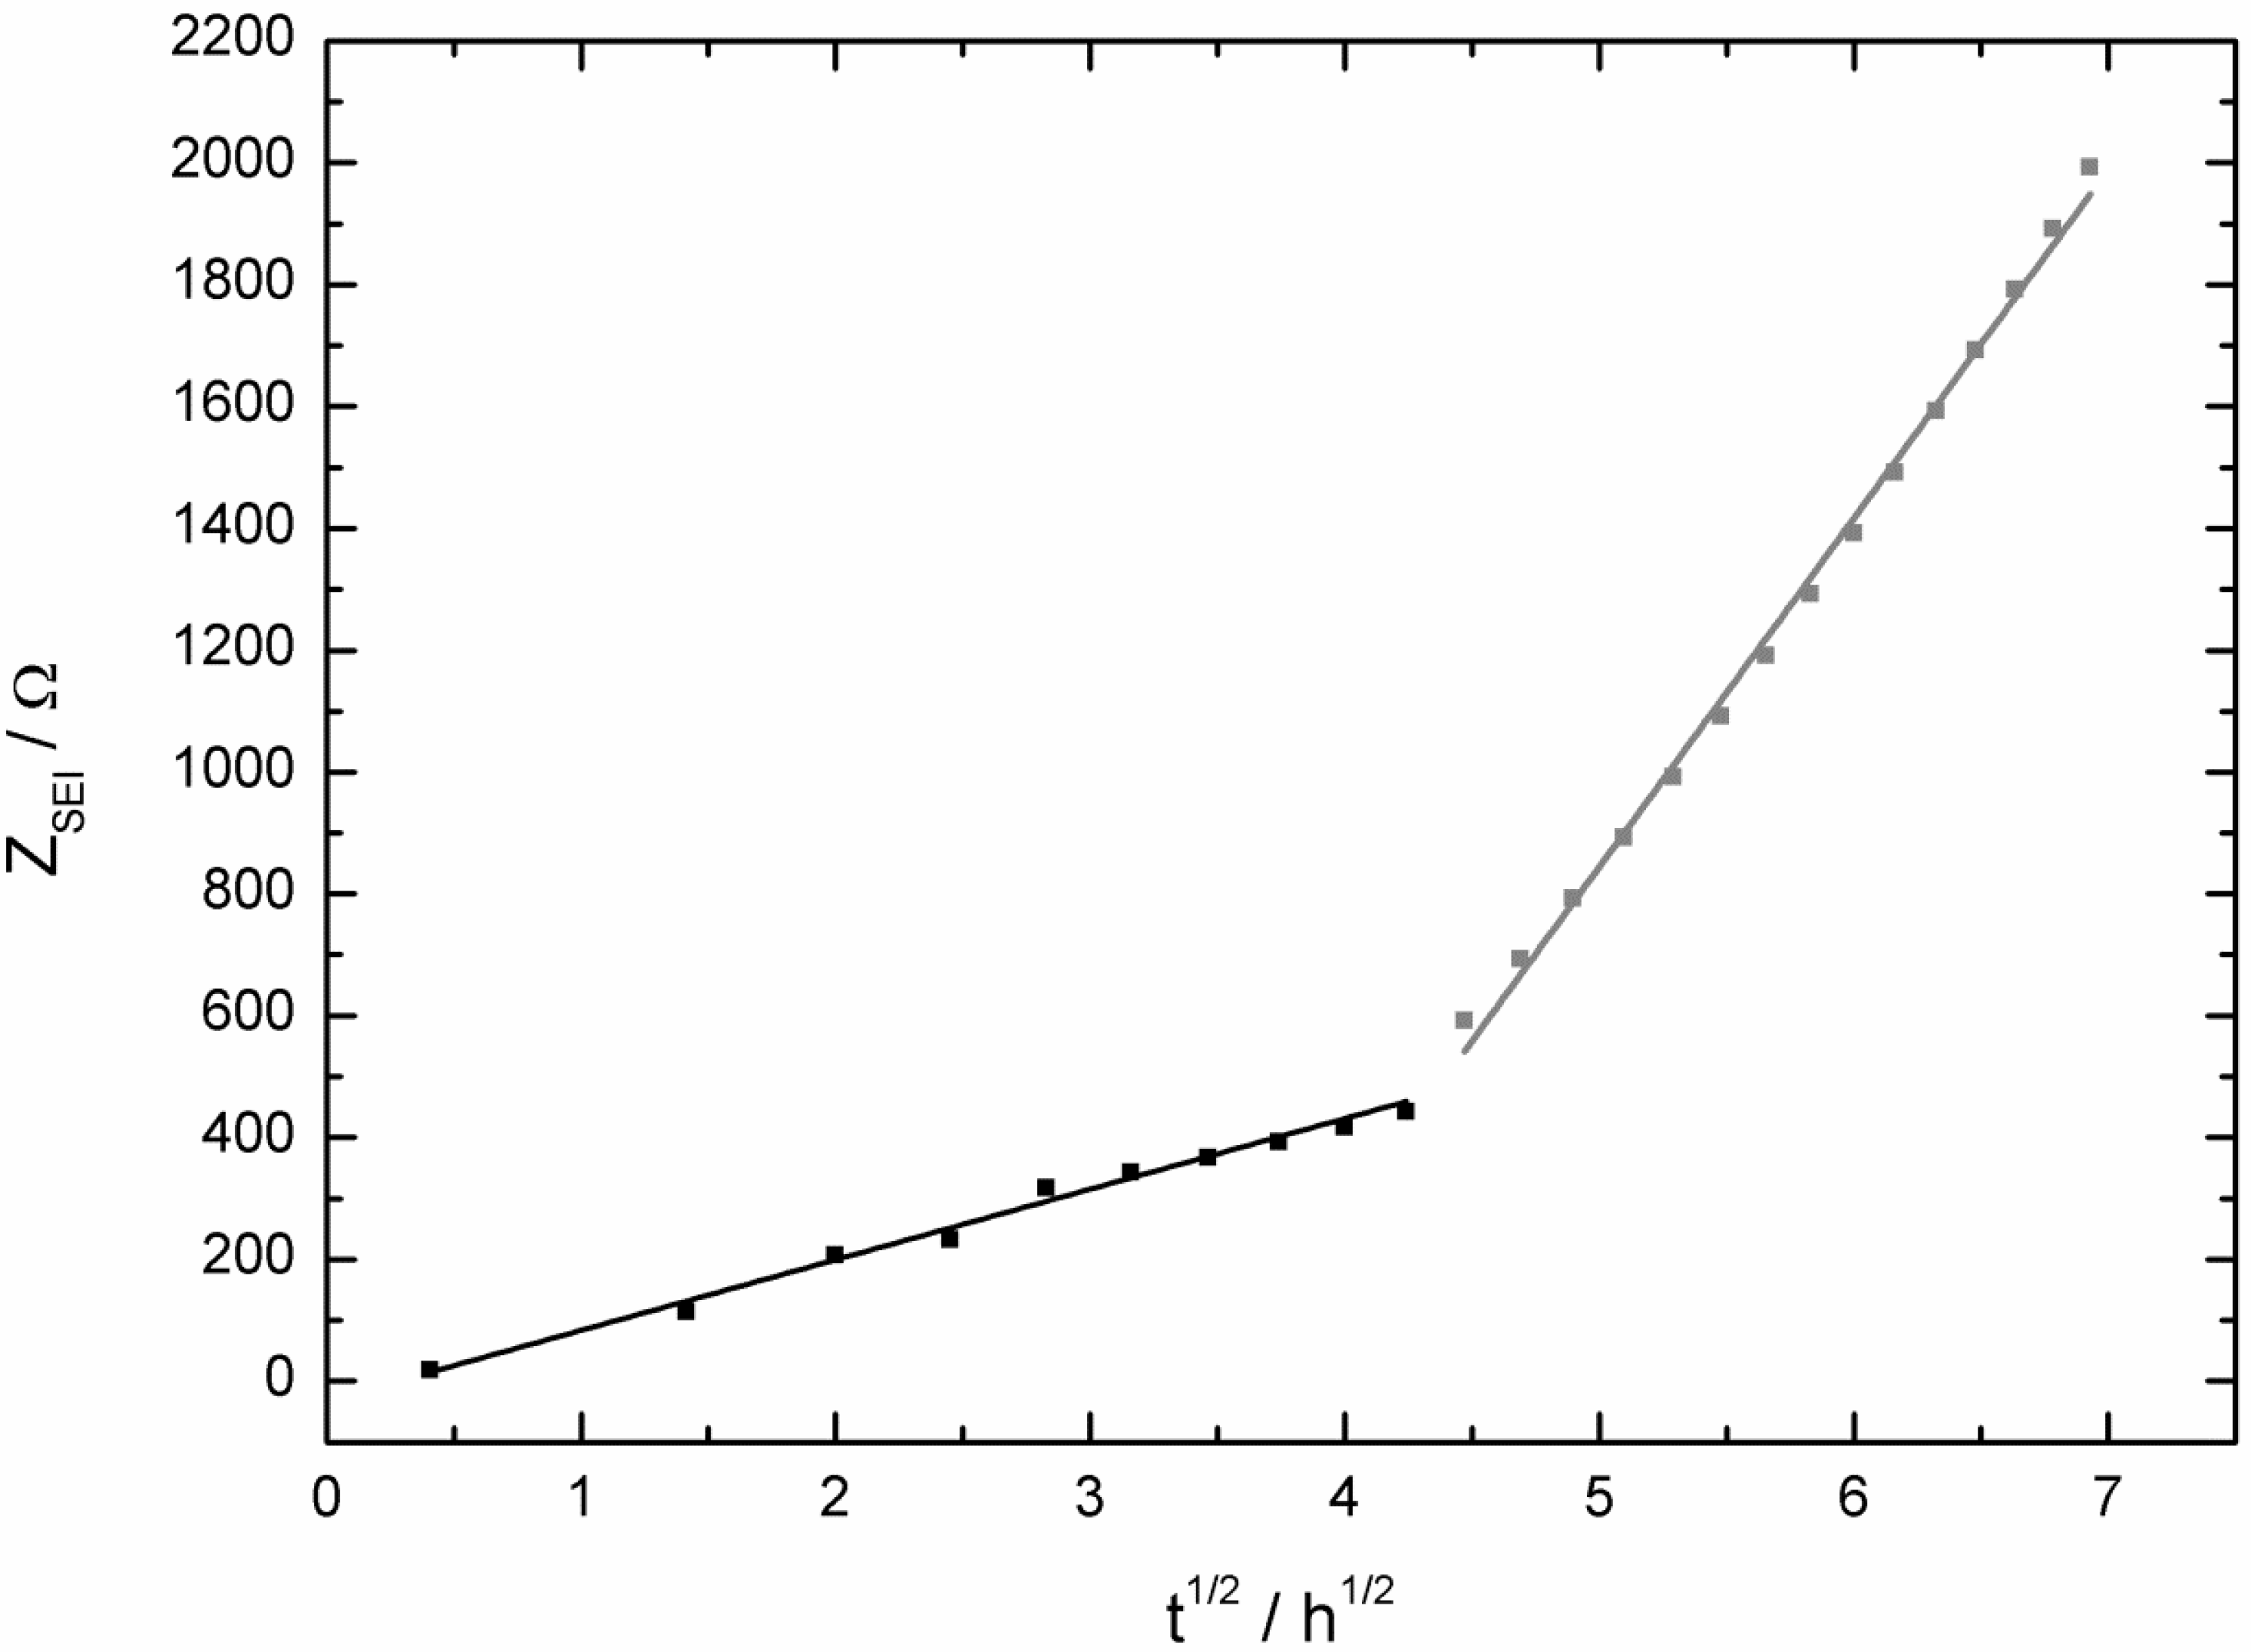
the SEI growth is only diffusion-limited at the beginning of the corrosion experiment, probably as long the potential stayed at 0.0 V vs. Li/Li+.
A detailed view of the two investigated electrolytes displayed two very different corrosion mechanisms. The main differences include:
-
at the beginning of the corrosion measurement the potential stayed longer at 0.0 V vs. Li/Li+ for the LiPF6-based electrolyte;
-
then the potential increased also much faster to the initial potential of the bare copper foil for the LiPF6-based (after 86 h) electrolyte than for the LiDFOB-based electrolyte (after 272 h);
-
the mass increase at the beginning of the corrosion measurement of the LiDFOB-based electrolyte took only place when the potential stayed at 0.0 V vs. Li/Li+, whereas the mass increase of the LiPF6-based electrolyte continued until the potential had already reached a value of 2.6 V vs. Li/Li+;
-
the mass decrease of the quartz sensor in the LiPF6-based electrolyte showed a linear decrease until the end of the experiment, whereas the mass decrease of the quartz sensor of the LiDFOB-based electrolyte consisted of a series of huge mass fluctuations.
Based on our results we propose the following corrosion mechanisms for lithium in the two investigated electrolytes. The thinner and more conductive SEI of the LiDFOB-based electrolyte is responsible for the shorter potential plateau at 0.0 V vs. Li/Li+ and therefore for an at first sight faster corrosion process of deposited lithium compared to the LiPF6-based electrolyte. But despite the potential is kept longer at 0.0 V vs. Li/Li+ in the LiPF6-based electrolyte the SEI growth and the mass increase is finally much faster in this electrolyte and also the potential of the bare copper foil is reached faster. This behavior can be ascribed to the inhomogeneous and therefore larger surface of deposited lithium in the LiPF6-based electrolyte. In the case of the LiPF6-based electrolyte it seems that only after almost all deposited lithium was reacted to SEI compounds a dissolution process of the SEI compounds started and that this process probably will continue even if the potential of the bare copper foil is reached. In contrast, in the case of the LiDFOB-based electrolyte the mass increase caused by SEI growth was not very pronounced and as soon as the potential started to rise to more positive potentials a mass decrease occurred, which was superimposed by distinctive mass fluctuations. We assume that the SEI growth and the dissolution of the SEI compounds are superimposed by reorganization and consolidation processes of the SEI and subsequent reactions of lithium causing the observed mass fluctuations. It should be stressed again that the reorganization processes of the SEI could play an important role for the very slow increase of the potential curve, which in the end implies a slower corrosion process of the deposited lithium in the LiDFOB-based electrolyte when compared with the LiPF6-based electrolyte. The results of this work again stress the huge influence of the salt on the SEI formation and dissolution.

Acknowledgments

The authors gratefully acknowledge the financial support of this work by the DFG (German Research Foundation) as part of the research initiative PAK 177 “Funktionsmaterialien und Materialanalytik zu Lithium-Hochleistungsbatterien” (contract numbers WI 2929/1-1, GO 1001-7-2, and WI 2929/5-1) on materials for lithium ion batteries.

Conflict of Interest

The authors declare no conflict of interest.

References

  1. Vetter, J.; Novak, P.; Wagner, M.; Veit, C.; Möller, K.; Besenhard, J.; Winter, M.; Wohlfahrt-Mehrens, M.; Vogler, C.; Hammouche, A. Ageing mechanisms in lithium-ion batteries. J. Power Sources. 2005, 147, 269–281. [Google Scholar] [CrossRef]
  2. Winter, M.; Imhof, R.; Joho, F.; Novak, P. FTIR and DEMS investigations on the electroreduction of chloroethylene carbonate-based electrolyte solutions for lithium-ion cells. J. Power Sources. 1999, 82, 818–823. [Google Scholar] [CrossRef]
  3. Wrodnigg, G.H.; Besenhard, J.O.; Winter, M. Cyclic and acyclic sulfites: new solvents and electrolyte additives for lithium ion batteries with graphitic anodes? J. Power Sources. 2001, 97, 592–594. [Google Scholar] [CrossRef]
  4. Tasaki, K.; Goldberg, A.; Winter, M. On the difference in cycling behaviors of lithium-ion battery cell between the ethylene carbonate- and propylene carbonate-based electrolytes. Electrochim. Acta. 2011, 56, 10424–10435. [Google Scholar] [CrossRef]
  5. Olivier, J.P.; Winter, M. Determination of the absolute and relative extents of basal plane surface area and “non-basal plane surface” area of graphites and their impact on anode performance in lithium ion batteries. J. Power Sources. 2001, 97, 151–155. [Google Scholar] [CrossRef]
  6. Wagner, M.R.; Raimann, P.R.; Möller, K.C.; Besenhard, J.O.; Winter, M. Electrolyte decomposition reactions on tin- and graphite-based anodes are different. Electrochem. Solid St. 2004, 7, A201–A205. [Google Scholar] [CrossRef]
  7. Schranzhofer, H.; Bugajski, J.; Santner, H.; Korepp, C.; Moller, K.; Besenhard, J.; Winter, M.; Sitte, W. Electrochemical impedance spectroscopy study of the SEI formation on graphite and metal electrodes. J. Power Sources. 2006, 153, 391–395. [Google Scholar] [CrossRef]
  8. Wudy, F.; Schedlbauer, T.; Stock, C.; Gores, H.J. Impedance scanning QCM studies of aniline electropolymerization in aqueous phosphoric acid solutions to determine the most effective acid concentration. Acta Chim. Slov. 2009, 56, 65–69. [Google Scholar]
  9. Wudy, F.; Multerer, M.; Stock, C.; Schmeer, G.; Gores, H.J. Rapid impedance scanning QCM for electrochemical applications based on miniaturized hardware and high-performance curve Fitting. Electrochim. Acta. 2008, 53, 6568–6574. [Google Scholar] [CrossRef]
  10. Kramer, E.; Schedlbauer, T.; Hoffmann, B.; Terborg, L.; Nowak, S.; Gores, H.J.; Passerini, S.; Winter, M. Mechanism of anodic dissolution of the aluminum current collector in 1 M LiTFSI EC:DEC 3:7 in rechargeable lithium batteries. J. Electrochem. Soc. 2013, 160, A356–A360. [Google Scholar] [CrossRef]
  11. Song, S.W.; Richardson, T.J.; Zhuang, G.V.; Devine, T.M.; Evans, J.W. Effect on aluminum corrosion of LiBF4 addition into lithium imide electrolyte: A study using the EQCM. Electrochim. Acta. 2004, 49, 1483–1490. [Google Scholar] [CrossRef]
  12. Simbeck, T.; Thomaier, S.; Stock, C.; Riedl, E.; Gores, H.J. Measurement of adsorption kinetics of benzotriazole on copper surfaces via impedance scanning quartz crystal microbalance studies. Electrochem. Commun. 2011, 13, 803–805. [Google Scholar] [CrossRef]
  13. Simbeck, T.; Hammer, M.M.; Thomaier, S.; Stock, C.; Riedl, E.; Gores, H.J. Kinetics of adsorption of poly(vinylimidazole) (PVI) onto copper surfaces investigated by quartz crystal microbalance studies. J. Solid State Electr. 2012, 16, 3467–3472. [Google Scholar] [CrossRef]
  14. Aurbach, D.; Moshkovich, M. A study of lithium deposition-dissolution processes in a few selected electrolyte solutions by electrochemical quartz crystal microbalance. J. Electrochem. Soc. 1998, 145, 2629–2639. [Google Scholar] [CrossRef]
  15. Sauerbrey, G. Verwendung Von Schwingquarzen zur Wägung dunner Schichten und zur Mikrowägung. Z. Phys. 1959, 155, 206–222. [Google Scholar] [CrossRef]
  16. Aurbach, D.; Zaban, A. The application of EQCM to the study of the electrochemical-behavior of propylene carbonate solutions. J. Electroanal. Chem. 1995, 393, 43–53. [Google Scholar] [CrossRef]
  17. Bund, A.; Schneider, O.; Dehnke, A. Combining AFM and EQCM for the in situ investigation of surface roughness effects during electrochemical metal depositions. Phys. Chem. Chem. Phys. 2002, 4, 3552–3554. [Google Scholar] [CrossRef]
  18. Kanazawa, K.K.; Gordon, J.G. Frequency of a quartz microbalance in contact with liquid. Anal. Chem. 1985, 57, 1770–1771. [Google Scholar] [CrossRef]
  19. Stock, C.; Moosbauer, D.; Zugmann, S.; Simbeck, T.; Amereller, M.; Gores, H.J. A novel method for in situ measurement of solubility via impedance scanning quartz crystal microbalance studies. Chem. Commun. 2011, 47, 6984–6986. [Google Scholar] [CrossRef]
  20. Larush-Asraf, L.; Biton, A.; Teller, H.; Zinigrad, E.; Aurbach, D. On the electrochemical and thermal behavior of lithium bis(oxalato)borate (LiBOB) solutions. J. Power Sources. 2007, 174, 400–407. [Google Scholar] [CrossRef]
  21. Moller, K.; Santner, H.; Kern, W.; Yamaguchi, S.; Besenhard, J.; Winter, M. In situ characterization of the SEI formation on graphite in the presence of a vinylene group containing film-forming electrolyte additives. J. Power Sources. 2003, 119, 561–566. [Google Scholar] [CrossRef]
  22. Tavassol, H.; Buthker, J.W.; Ferguson, G.A.; Curtiss, L.A.; Gewirth, A.A. Solvent oligomerization during SEI formation on model systems for Li-ion battery anodes. J. Electrochem. Soc. 2012, 159, A730–A738. [Google Scholar] [CrossRef]
  23. Wang, F.M.; Shieh, D.T.; Cheng, J.H.; Yang, C.R. An investigation of the salt dissociation effects on solid electrolyte interface (SEI) formation using linear carbonate-based electrolytes in lithium ion batteries. Solid State Ionics. 2010, 180, 1660–1666. [Google Scholar] [CrossRef]
  24. Bucur, R.V.; Carlsson, J.O.; Mecea, V.M. Quartz-crystal mass sensors with glued foil electrodes. Sensor Actuat. B Chem. 1996, 37, 91–95. [Google Scholar] [CrossRef]
  25. Zugmann, S.; Moosbauer, D.; Amereller, M.; Schreiner, C.; Wudy, F.; Schmitz, R.; Schmitz, R.; Isken, P.; Dippel, C.; Muller, R.; et al. Electrochemical characterizaiton of electrolytes for lithium-ion batteries based on lithium difluoromono(oxalato)borate. J. Power Sources 2011, 196, 1417–1424. [Google Scholar] [CrossRef]
  26. Moosbauer, D.; Zugmann, S.; Amereller, M.; Gores, H.J. Effect of ionic liquids as additives on lithium electrolytes: Conductivity, electrochemical stability, and aluminum corrosion. J. Chem. Eng. Data. 2010, 55, 1794–1798. [Google Scholar] [CrossRef]
  27. Schedlbauer, T.; Krüger, S.; Schmitz, R.; Schmitz, R.W.; Schreiner, C.; Gores, H.J.; Passerini, S.; Winter, M. Lithium difluoro(oxalato)borate: A promising salt for lithium metal based secondary batteries? Electrochim. Acta. 2013, 92, 102–107. [Google Scholar] [CrossRef]
  28. Zhang, S.S. An unique lithium salt for the improved electrolyte of Li-ion battery. Electrochem. Commun. 2006, 8, 1423–1428. [Google Scholar] [CrossRef]
  29. Zhang, S.S. Electrochemical study of the formation of a solid electrolyte interface on graphite in a LiBC(2)O(4)F(2)-based electrolyte. J. Power Sources. 2007, 163, 713–718. [Google Scholar] [CrossRef]
  30. Chen, Z.H.; Liu, J.; Amine, K. Lithium difluoro(oxalato)borate as salt for lithium-ion batteries. Electrochem. Solid St. 2007, 10, A45–A47. [Google Scholar] [CrossRef]
  31. Xu, M.Q.; Zhou, L.; Hao, L.S.; Xing, L.D.; Li, W.S.; Lucht, B.L. Investigation and application of lithium difluoro(oxalate)borate (LiDFOB) as additive to improve the thermal stability of electrolyte for lithium-ion batteries. J. Power Sources 2011, 196, 6794–6801. [Google Scholar] [CrossRef]
  32. Lex-Balducci, A.; Schmitz, R.; Schmitz, R.W.; Müller, R.A.; Amereller, M.; Moosbauer, D.; Gores, H.J.; Winter, M. Lithium borates for lithium-ion battery electrolytes. ECS Trans. 2010, 25, 13–17. [Google Scholar]
  33. Zugmann, S.; Fleischmann, M.; Amereller, M.; Gschwind, R.M.; Winter, M.; Gores, H.J. Salt diffusion coefficients, concentration dependence of cell potentials, and transference numbers of lithium difluoromono(oxalato)borate-based solutions. J. Chem. Eng. Data. 2011, 56, 4786–4789. [Google Scholar] [CrossRef]
  34. Zugmann, S.; Fleischmann, M.; Amereller, M.; Gschwind, R.M.; Wiemhofer, H.D.; Gores, H.J. Measurement of transference numbers for lithium ion electrolytes via four different methods, a comparative study. Electrochim. Acta. 2011, 56, 3926–3933. [Google Scholar] [CrossRef]
  35. Besenhard, J.O.; Winter, M. Insertion reactions in advanced electrochemical energy storage. Pure Appl. Chem. 1998, 70, 603–608. [Google Scholar] [CrossRef]
  36. Winter, M.; Appel, W.; Evers, B.; Hodal, T.; Moller, K.; Schneider, I.; Wachtler, M.; Wagner, M.; Wrodnigg, G.; Besenhard, J. Studies on the anode/electrolyte interface in lithium ion batteries. Monatsh. Chem. 2001, 132, 473–486. [Google Scholar] [CrossRef]
  37. Wu, Q.L.; Lu, W.Q.; Miranda, M.; Honaker-Schroeder, T.K.; Lakhsassi, K.Y.; Dees, D. Effects of lithium difluoro(oxalate)borate on the performance of Li-rich composite cathode in Li-ion battery. Electrochem. Commun. 2012, 24, 78–81. [Google Scholar] [CrossRef]
  38. Herzig, T.; Schreiner, C.; Bruglachner, H.; Jordan, S.; Sclunidt, M.; Gores, H.J. Temperature and concentration dependence of conductivities of some new semichelatoborates in acetonitrile and comparison with other borates. J. Chem. Eng. Data. 2008, 53, 434–438. [Google Scholar] [CrossRef]
  39. Kraemer, E.P.; Winter, M. Dependency of aluminum collector corrosion in lithium ion batteries on the electrolyte solvent. ECS Electrochem. Letters. 2012, 1, C9–C11. [Google Scholar] [CrossRef]
  40. Amereller, M.; Multerer, M.; Schreiner, C.; Lodermeyer, J.; Schmid, A.; Barthel, J.; Gores, H.J. Investigation of the hydrolysis of lithium bis[1,2-oxalato(2-)O,O'] borate (LiBOB) in water and acetonitrile by conductivity and NMR measurements in comparison to some other borates. J. Chem. Eng. Data. 2009, 54, 468–471. [Google Scholar] [CrossRef]
  41. Terborg, L.; Nowak, S.; Passerini, S.; Winter, M.; Karst, U.; Haddad, P.R.; Nesterenko, P.N. Ion chromatographic determination of hydrolysis products of hexafluorophosphate salts in aqueous solution. Anal. Chim. Acta. 2012, 714, 121–126. [Google Scholar] [CrossRef] [PubMed]
  42. Lux, S.F.; Lucas, I.T.; Pollak, E.; Passerini, S.; Winter, M.; Kostecki, R. The mechanism of HF formation in LiPF6 based organic carbonate electrolytes. Electrochem. Commun. 2012, 14, 47–50. [Google Scholar] [CrossRef]
  43. Winter, M.; Besenhard, J.O. Rechargeable batteries. Chem. Unserer Zeit. 1999, 33, 320–332. [Google Scholar] [CrossRef]
  44. Wagner, R.; Preschitschek, N.; Passerini, S.; Leker, J.; Winter, M. Current research trends and prospects among the various materials and designs used in lithium-based batteries. J. Appl. Electrochem. 2013, 1, 1–16. [Google Scholar]
  45. Zhu, Y.; Li, Y.; Bettge, M.; Abraham, D.P. Positive electrode passivation by LiDFOB electrolyte additive in high-capacity lithium-ion cells. J. Electrochem. Soc. 2012, 159, A2109–A2117. [Google Scholar] [CrossRef]
  46. Bard, A.J.; Faulkner, L.R. Electrochemical Methods: Fundamentals and Applications; John Wiley & Sons: New York, NY, USA, 2001; pp. 60–62. [Google Scholar]
  47. Ohue, K.; Utsunomiya, T.; Hatozaki, O.; Yoshimoto, N.; Egashira, M.; Morita, M. Self-discharge behavior of polyacenic semiconductor and graphite negative electrodes for lithium-ion batteries. J. Power Sources. 2011, 196, 3604–3610. [Google Scholar] [CrossRef]
  48. Winter, M. The solid electrolyte interphase—The most important and the least understood solid electrolyte in rechargeable Li batteries. Z. Phys. Chem. 2009, 223, 1395–1406. [Google Scholar] [CrossRef]
  49. Morita, M.; Aoki, S.; Matsuda, Y. AC-impedance behavior of lithium electrode in organic electrolyte-solutions containing additives. Electrochimica Acta. 1992, 37, 119–123. [Google Scholar] [CrossRef]
  50. Xu, K. Nonaqueous liquid electrolytes for lithium-based rechargeable batteries. Chem. Rev. 2004, 104, 4303–4417. [Google Scholar] [CrossRef] [PubMed]
  51. Aurbach, D.; Ein Eli, Y.; Markovsky, B.; Zaban, A.; Luski, S.; Carmeli, Y.; Yamin, H. The study of electrolyte-solutions based on ethylene and diethyl carbonates for rechargeable Li batteries. 2. Graphite-Electrodes. J. Electrochem. Soc. 1995, 142, 2882–2890. [Google Scholar] [CrossRef]
  52. Aurbach, D.; Zaban, A.; Schechter, A.; Ein Eli, Y.; Zinigrad, E.; Markovsky, B. The Study of Electrolyte-Solutions Based on Ethylene and Diethyl Carbonates for Rechargeable Li Batteries.1. Li Metal Anodes. J. Electrochem. Soc. 1995, 142, 2873–2882. [Google Scholar] [CrossRef]
  53. Basile, A.; Hollenkamp, A.F.; Bhatt, A. I.; O'Mullane, A.P. Extensive charge–discharge cycling of lithium metal electrodes achieved using ionic liquid electrolytes. Electrochem. Commun. 2013, 27, 69–72. [Google Scholar] [CrossRef] [Green Version]
  54. Rauh, R.D.; Brummer, S.B. Effect of additives on lithium cycling in propylene carbonate. Electrochim. Acta. 1977, 22, 75–83. [Google Scholar] [CrossRef]
  55. Atkins, P.W. Physikalische Chemie, 3rd ed.; WILEY-VCH Verlag: Weinheim, Germany, 2001; pp. 938–942. [Google Scholar]
  56. Mark, B.T.; Orazem, E. Electrochemical Impedance Spectroscopy, 1st ed.; John Willey & Sons: Hoboken, NJ, USA, 2008; pp. 60–97. [Google Scholar]
  57. Aurbach, D.; Zaban, A. Impedance spectroscopy of lithium electrodes. 1. General behavior in propylene carbonate solutions and the correlation to surface-chemistry and cycling efficiency. J. Electroanal. Chem. 1993, 348, 155–179. [Google Scholar] [CrossRef]
  58. Schreiner, C.; Amereller, M.; Gores, H.J. Chloride-free method to synthesise new ionic liquids with mixed borate anions. Chemistry A Eur. J. 2009, 15, 2270–2272. [Google Scholar] [CrossRef]
  59. Herzig, T.; Schreiner, C.; Gerhard, D.; Wasserscheid, P.; Gores, H.J. Characterisation and properties of new ionic liquids with the difluoromono[1,2-oxalato(2-)-O,O']borate anion. J. Fluor. Chem. 2007, 128, 612–618. [Google Scholar] [CrossRef]
  60. Kologo, S.; Eyraud, M.; Bonou, L.; Vacandio, F.; Massiani, Y. Voltametry and EQCM study of copper oxidation in acidic solution in presence of chloride ions. Electrochim. Acta. 2007, 52, 3105–3113. [Google Scholar] [CrossRef]
  61. Moosbauer, D. Electrochemical Characterization of Electrolytes and Electrodes for Lithium-Ion-Batteries: Development of a New Measurement Method for Electrochemical Investigations on Electrodes with the EQCM. Ph.D. Dissertation, University of Regensburg, Regensburg, Germany, 2010. [Google Scholar]
  62. Vatankhah, G.; Lessard, J.; Jerkiewicz, G.; Zolfaghari, A.; Conway, B.E. Dependence of the reliability of electrochemical quartz-crystal nanobalance mass responses on the calibration constant, C-f: Analysis of three procedures for its determination. Electrochim. Acta. 2003, 48, 1613–1622. [Google Scholar] [CrossRef]

