Determining Adaptability Performance of Artificial Neural Network-Based Thermal Control Logics for Envelope Conditions in Residential Buildings

Abstract
:1. Introduction
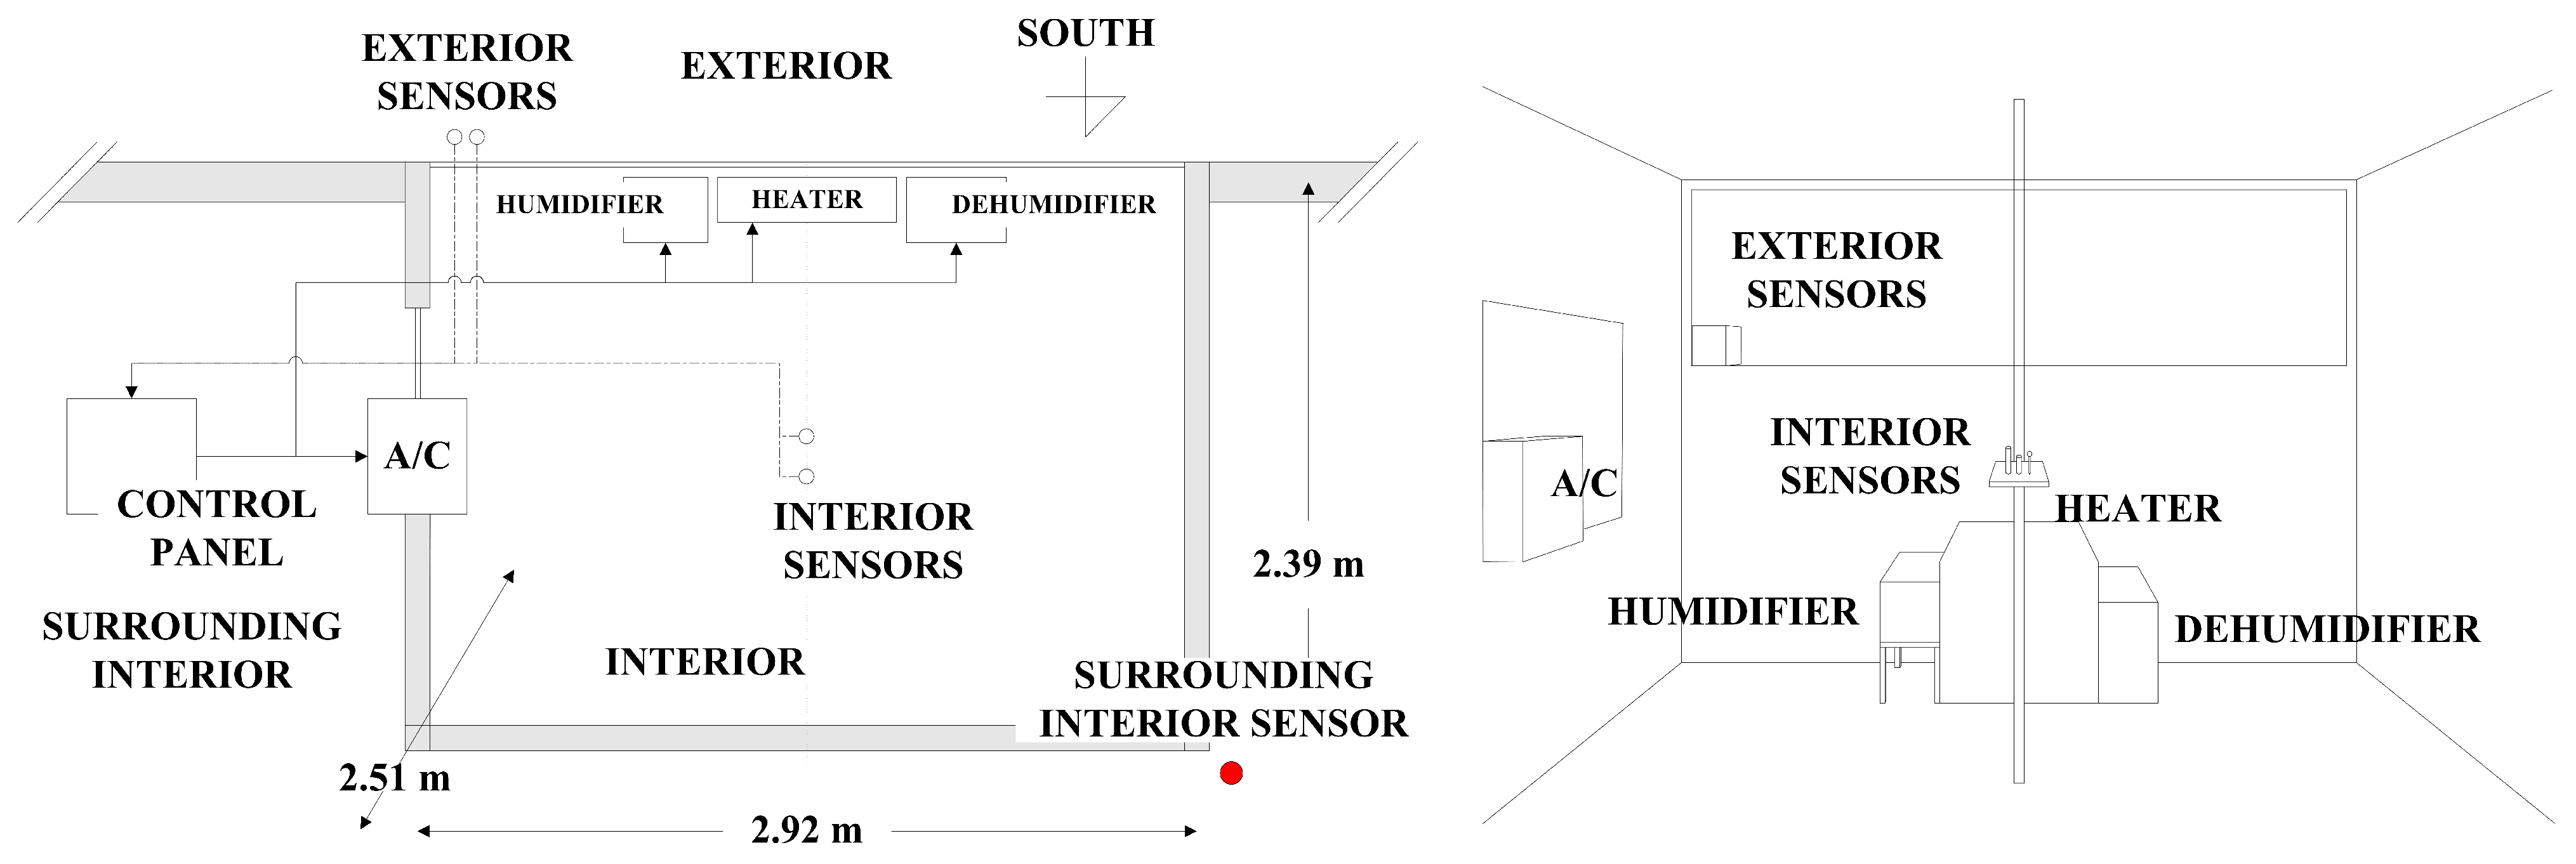
2. Validation of Simulation Results for Thermal Control Logics
| T: air temperature (°C) | t: time |
| C: thermal capacity (J/kg·K) | R: thermal resistance (m2·K/W) |
| hevap: latent heat of evaporation (J/kg) | p: density of the material (kg/m3) |
| ma: density of moisture flow rate of dry air (kg/m2·s) | d: thickness (m) |
| cpa: specific heat capacity of dry air (J/kg·K) | suc: suction |
| w: moisture content mass by volume (kg/m3) | i: the objective node |
| i − 1: the preceding node | i + 1: the following node |
| n: previous time step | n + 1: the corresponding time step |


| Factors | Unstandardized Coefficients | t | Sig. | |
|---|---|---|---|---|
| B | Std. Error | |||
| Constant | 0.7100 | 0.45 | 15.88 | 0.00 |
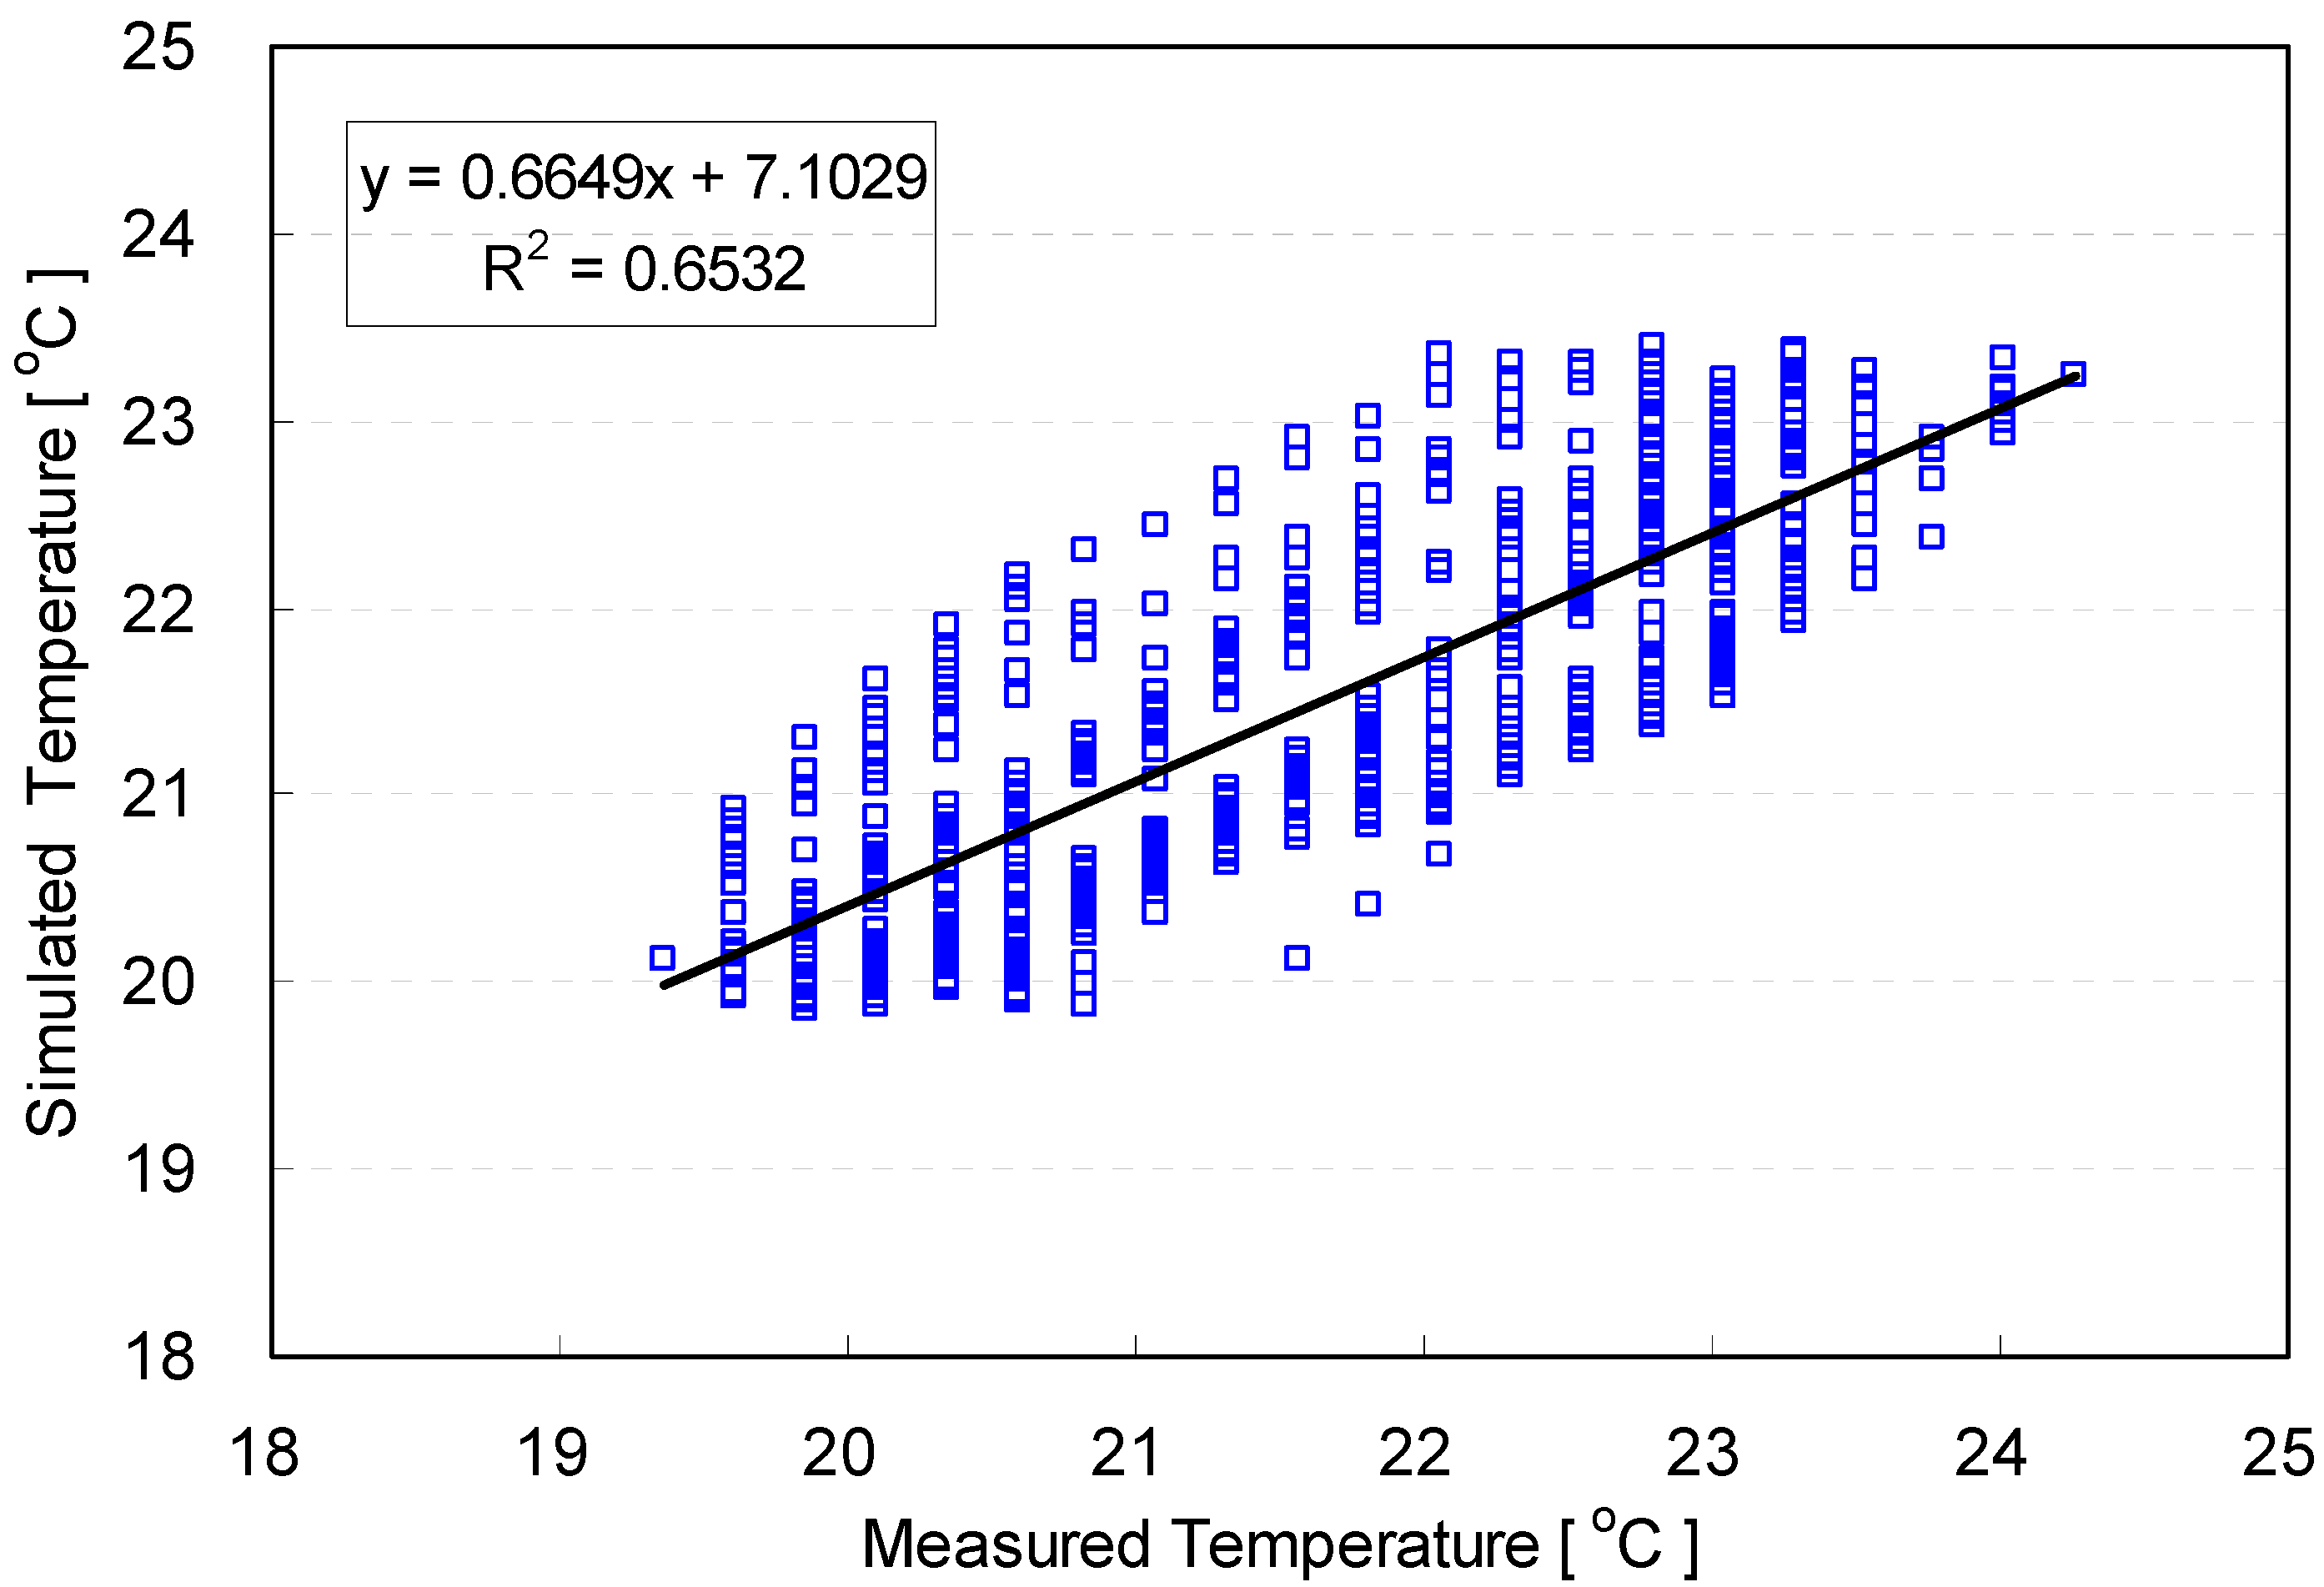
| Measured temperature | 0.665 | 0.02 | 32.21 | 0.00 |
| ANOVA | R2 = 0.6532, F(1, 551) = 346.59, Sig. = 0.00 | |||
3. Thermal Performance Tests of Developed Control Logics
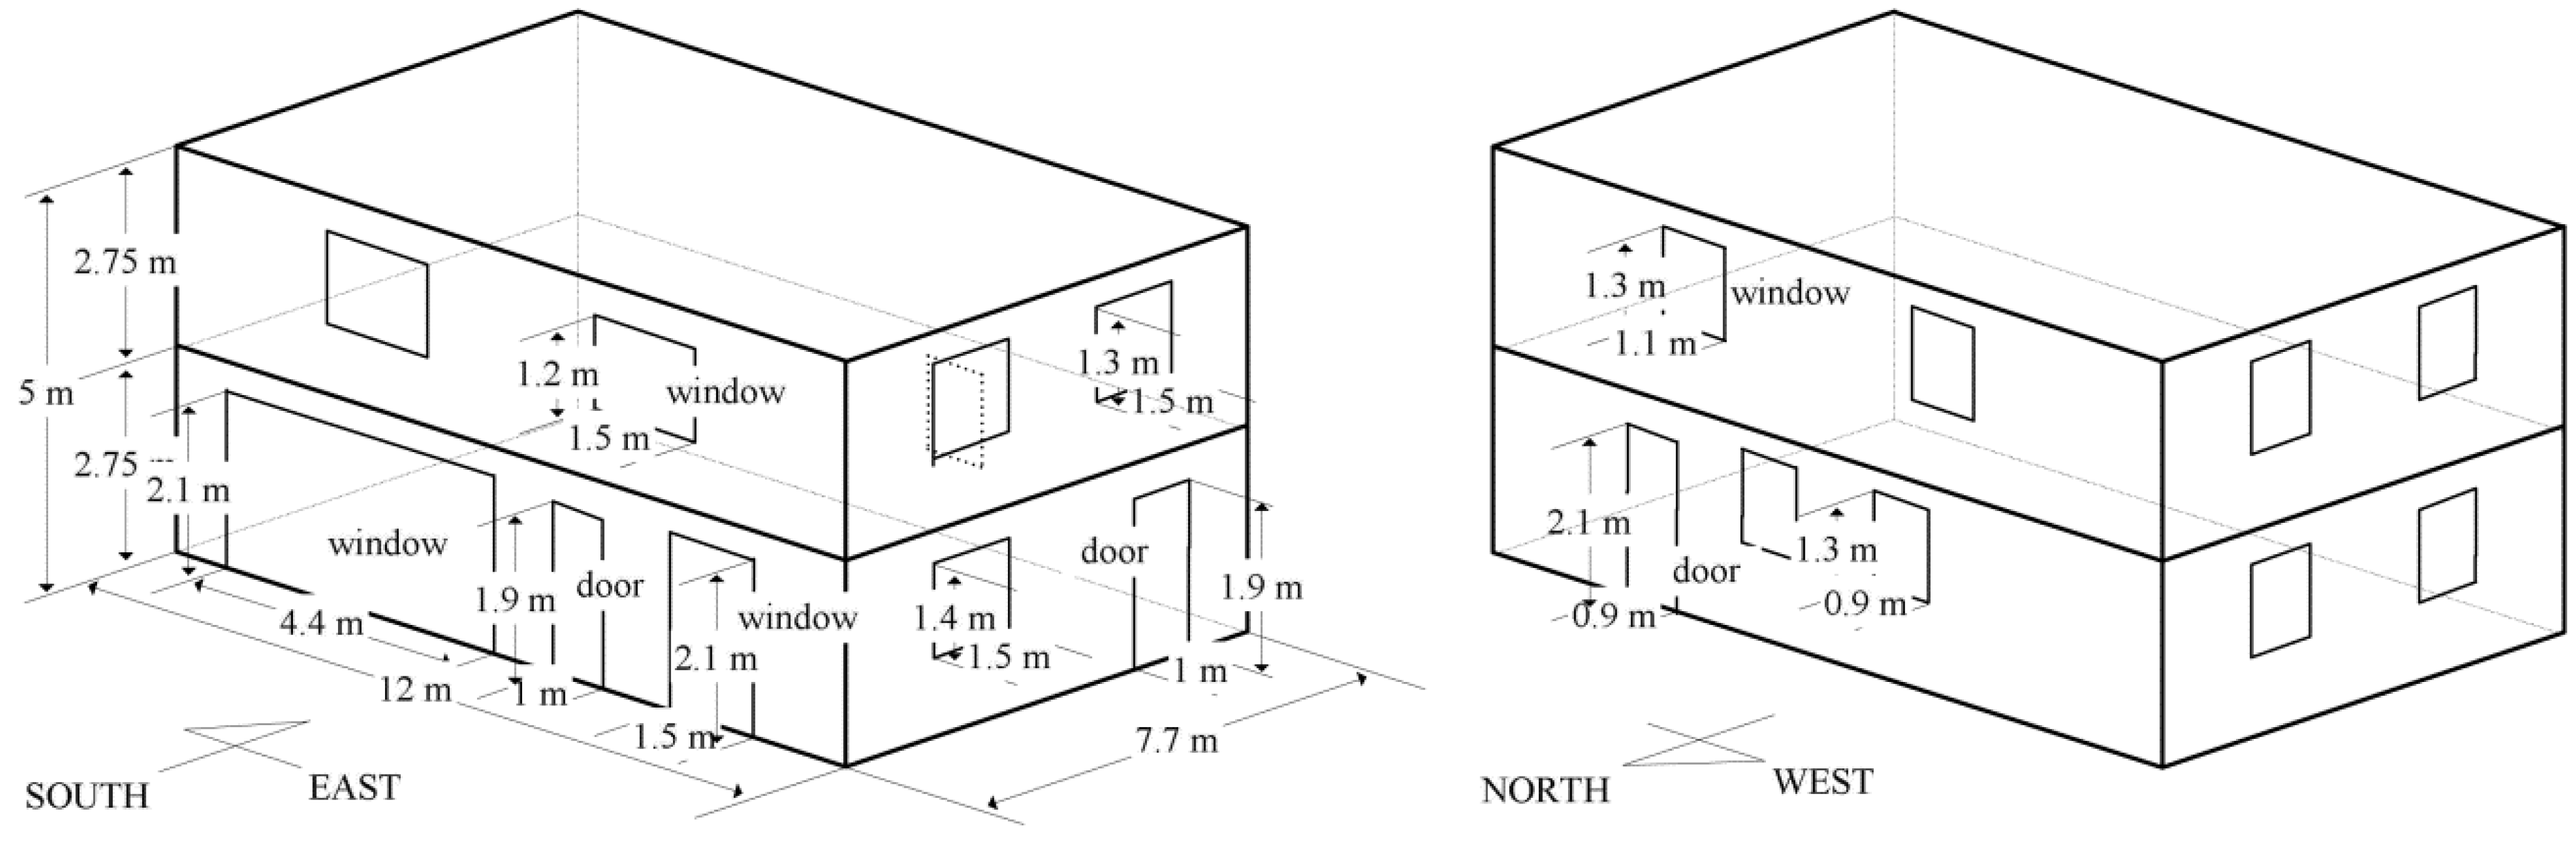
3.1. Simulation Conditions

| Location/Weather Data | Detroit, MI, USA/TMY2 | |
| Building size | 184.4 m2 (92.2 m2 for each floor) | |
| Envelope | Ratio of window to wall | 0.15 on average (- East: 0.14, - West: 0.13, - South: 0.24, - North: 0.08) |
| Insulation (°K m2/W) | - Wall: R-value 3.35; - Roof: R-value 6.69; - Floor: R -value 3.7; - Windows: R-value 0.61; - Door: R-value 0.2 | |
| Infiltration Rate | 0.3 ACH | |
| Orientation | South | |
| Internal Heat Gains | Hourly-weighted heat and moisture gains for a family of four people [24,25] | |
| Thermal Control Systems | Convective heating: 9,000 W att heat supply Convective cooling: 10,000 W att heat removal Humidifying: 1.41 K g/h moisture supply Dehumidifying: 2.36 K g/h moisture removal | |
| Assumptions | Initial air temperature: 23 °C Initial humidity: 45% Mean Radiant Temperature (MRT): same as air temperature [3,12,13,14,15,16] Air velocity: 0.0 m/s Activity level: 1.0 M ET Clothing level: 1.0 CLO (winter) and 0.5 C LO (summer) | |
| Properties | Content | |
|---|---|---|
| R-value (°K m2/W) | Wall | 2.64, 3.35, 5.28, 7.04, (base case: 3.35) |
| Roof | 1.76, 5.28, 6.69, 8.81, 12.33, (base case: 6.69) | |
| Window | 0.18, 0.53, 0.61, 0.88, 1.23, 1.59, (base case: 0.61) | |
| Window to wall ratio | 0.1, 0.15, 0.2, 0.3, 0.4, 0.5 (base case: 0.15) | |
| Infiltration rate | 0.3 ACH | |
| Day | Summer: January 27–Feberary 1 on a daily basis Winter: July 3–July 8 on a daily basis | |
| Targeted thermal comfort range | Indoor air temperature in winter: 20 °C–23 °C | |
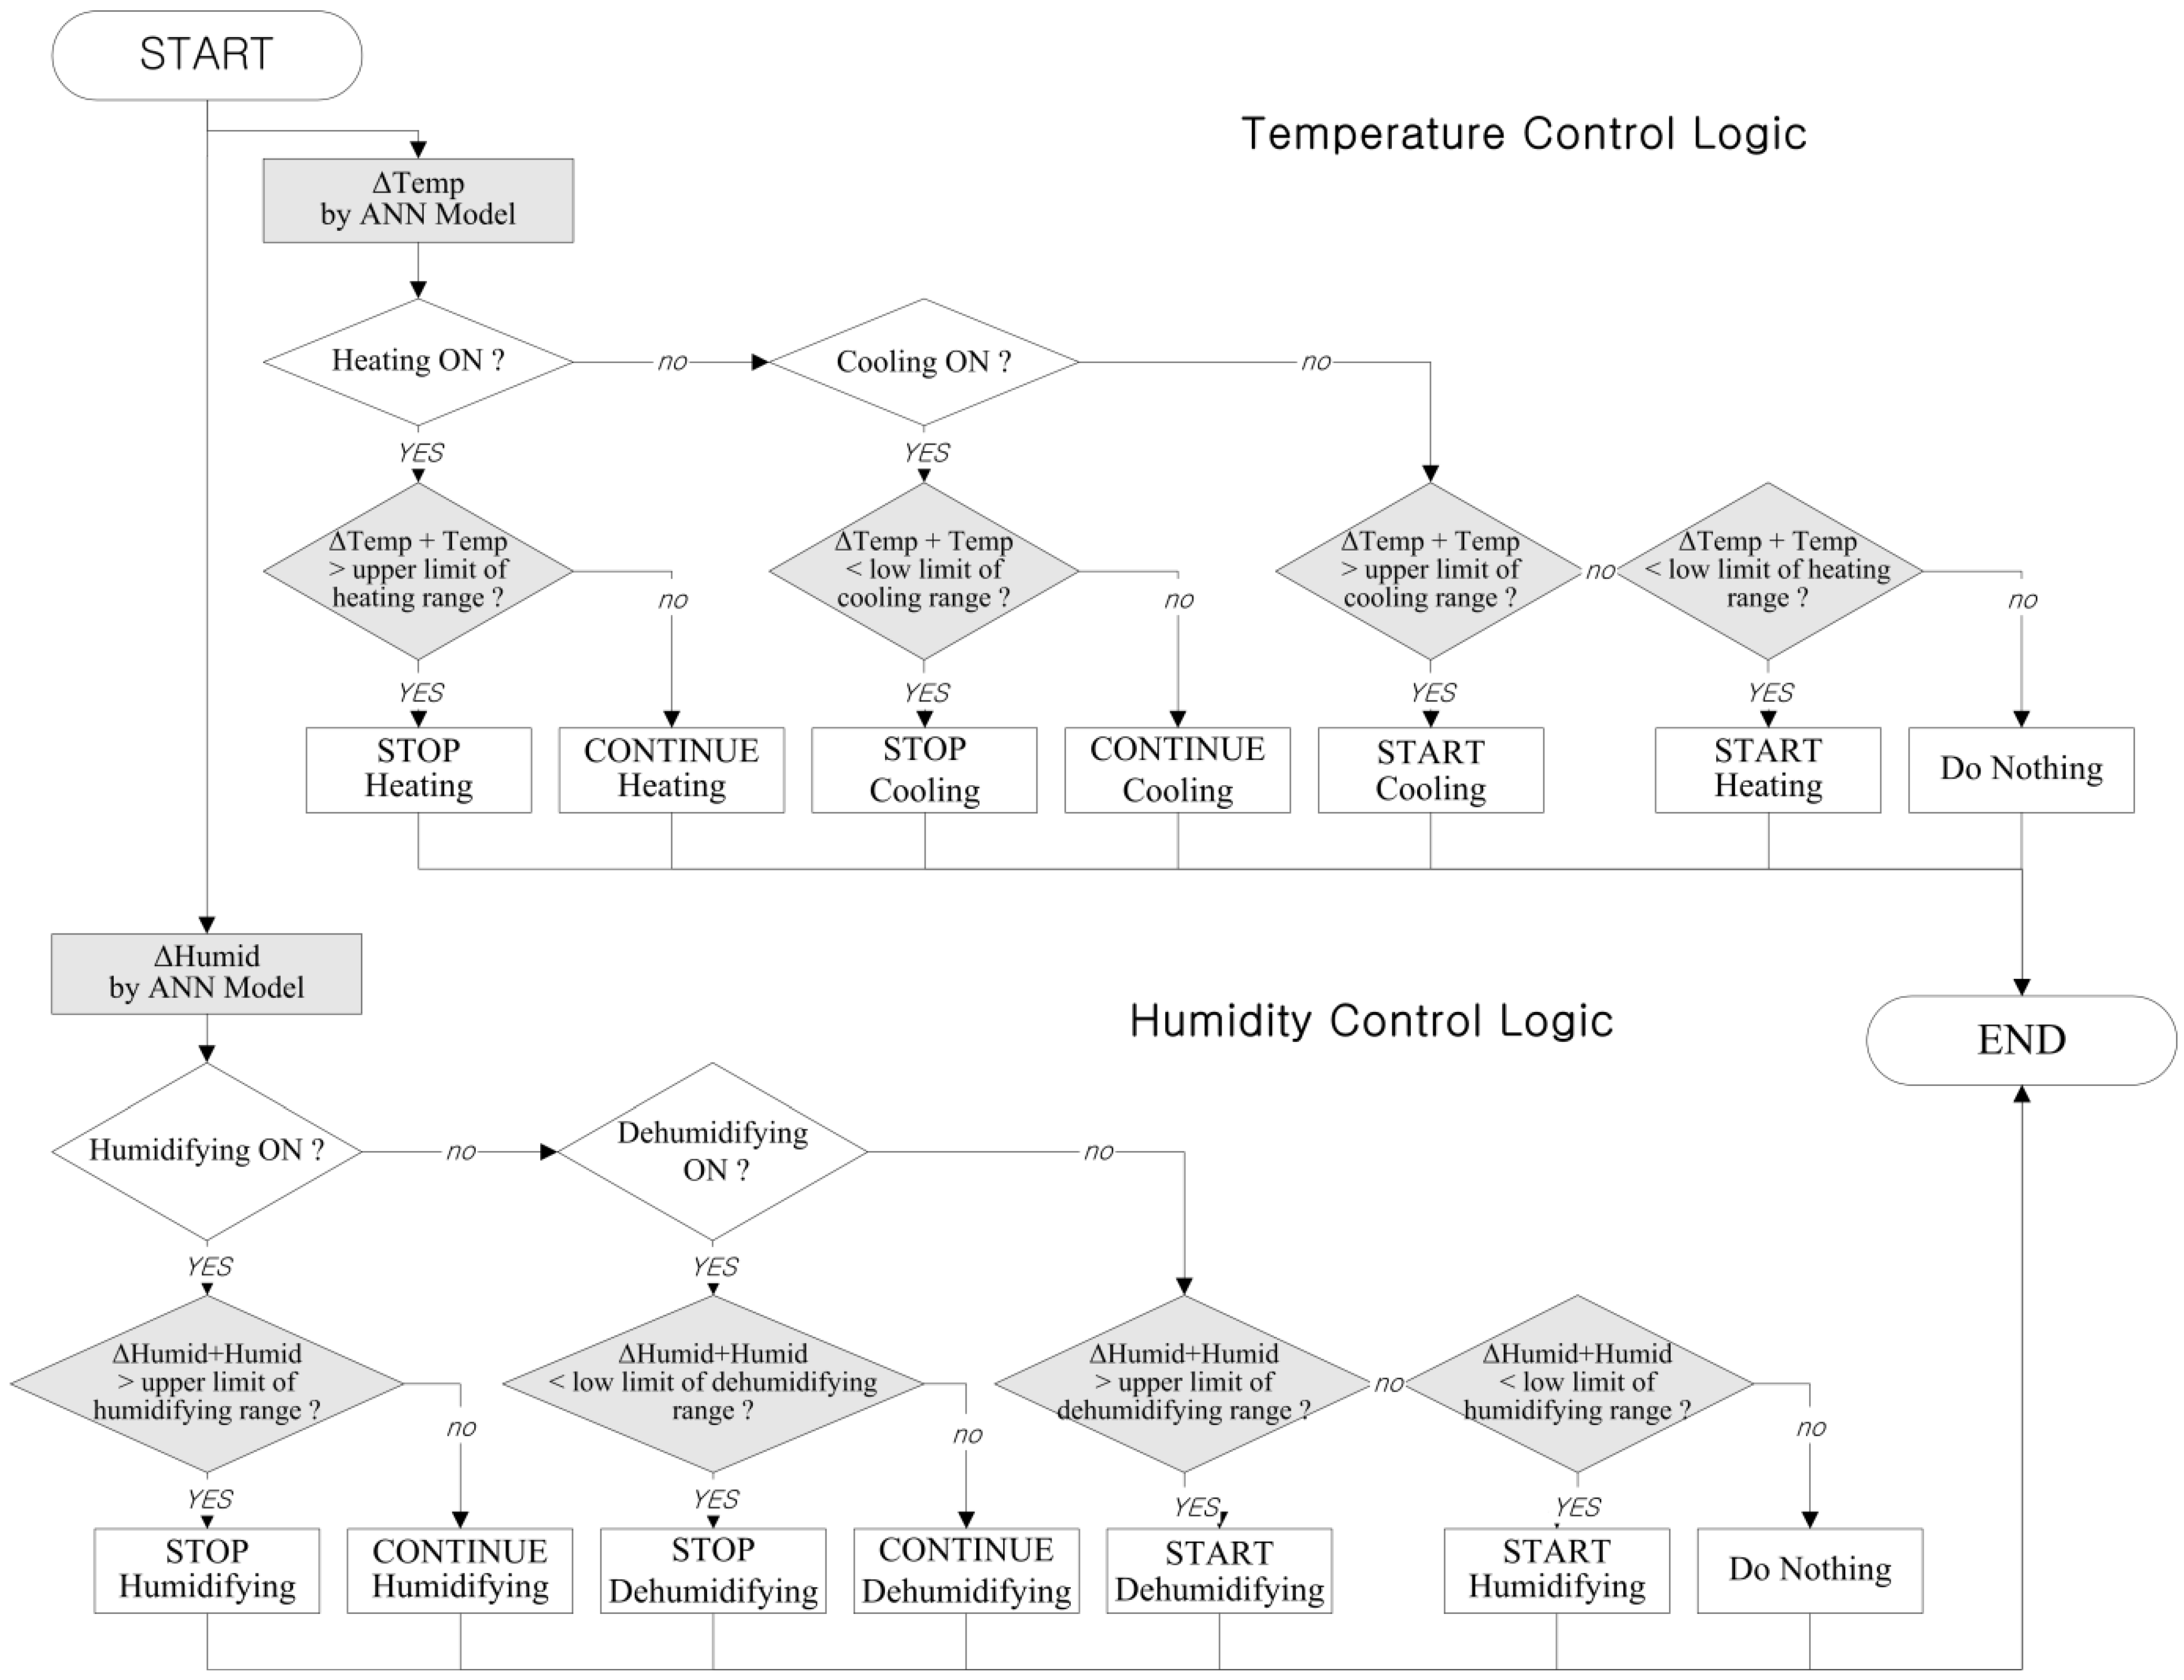
| Thermal control logics | (1) ANN-based Temperature and Humidity Control | |
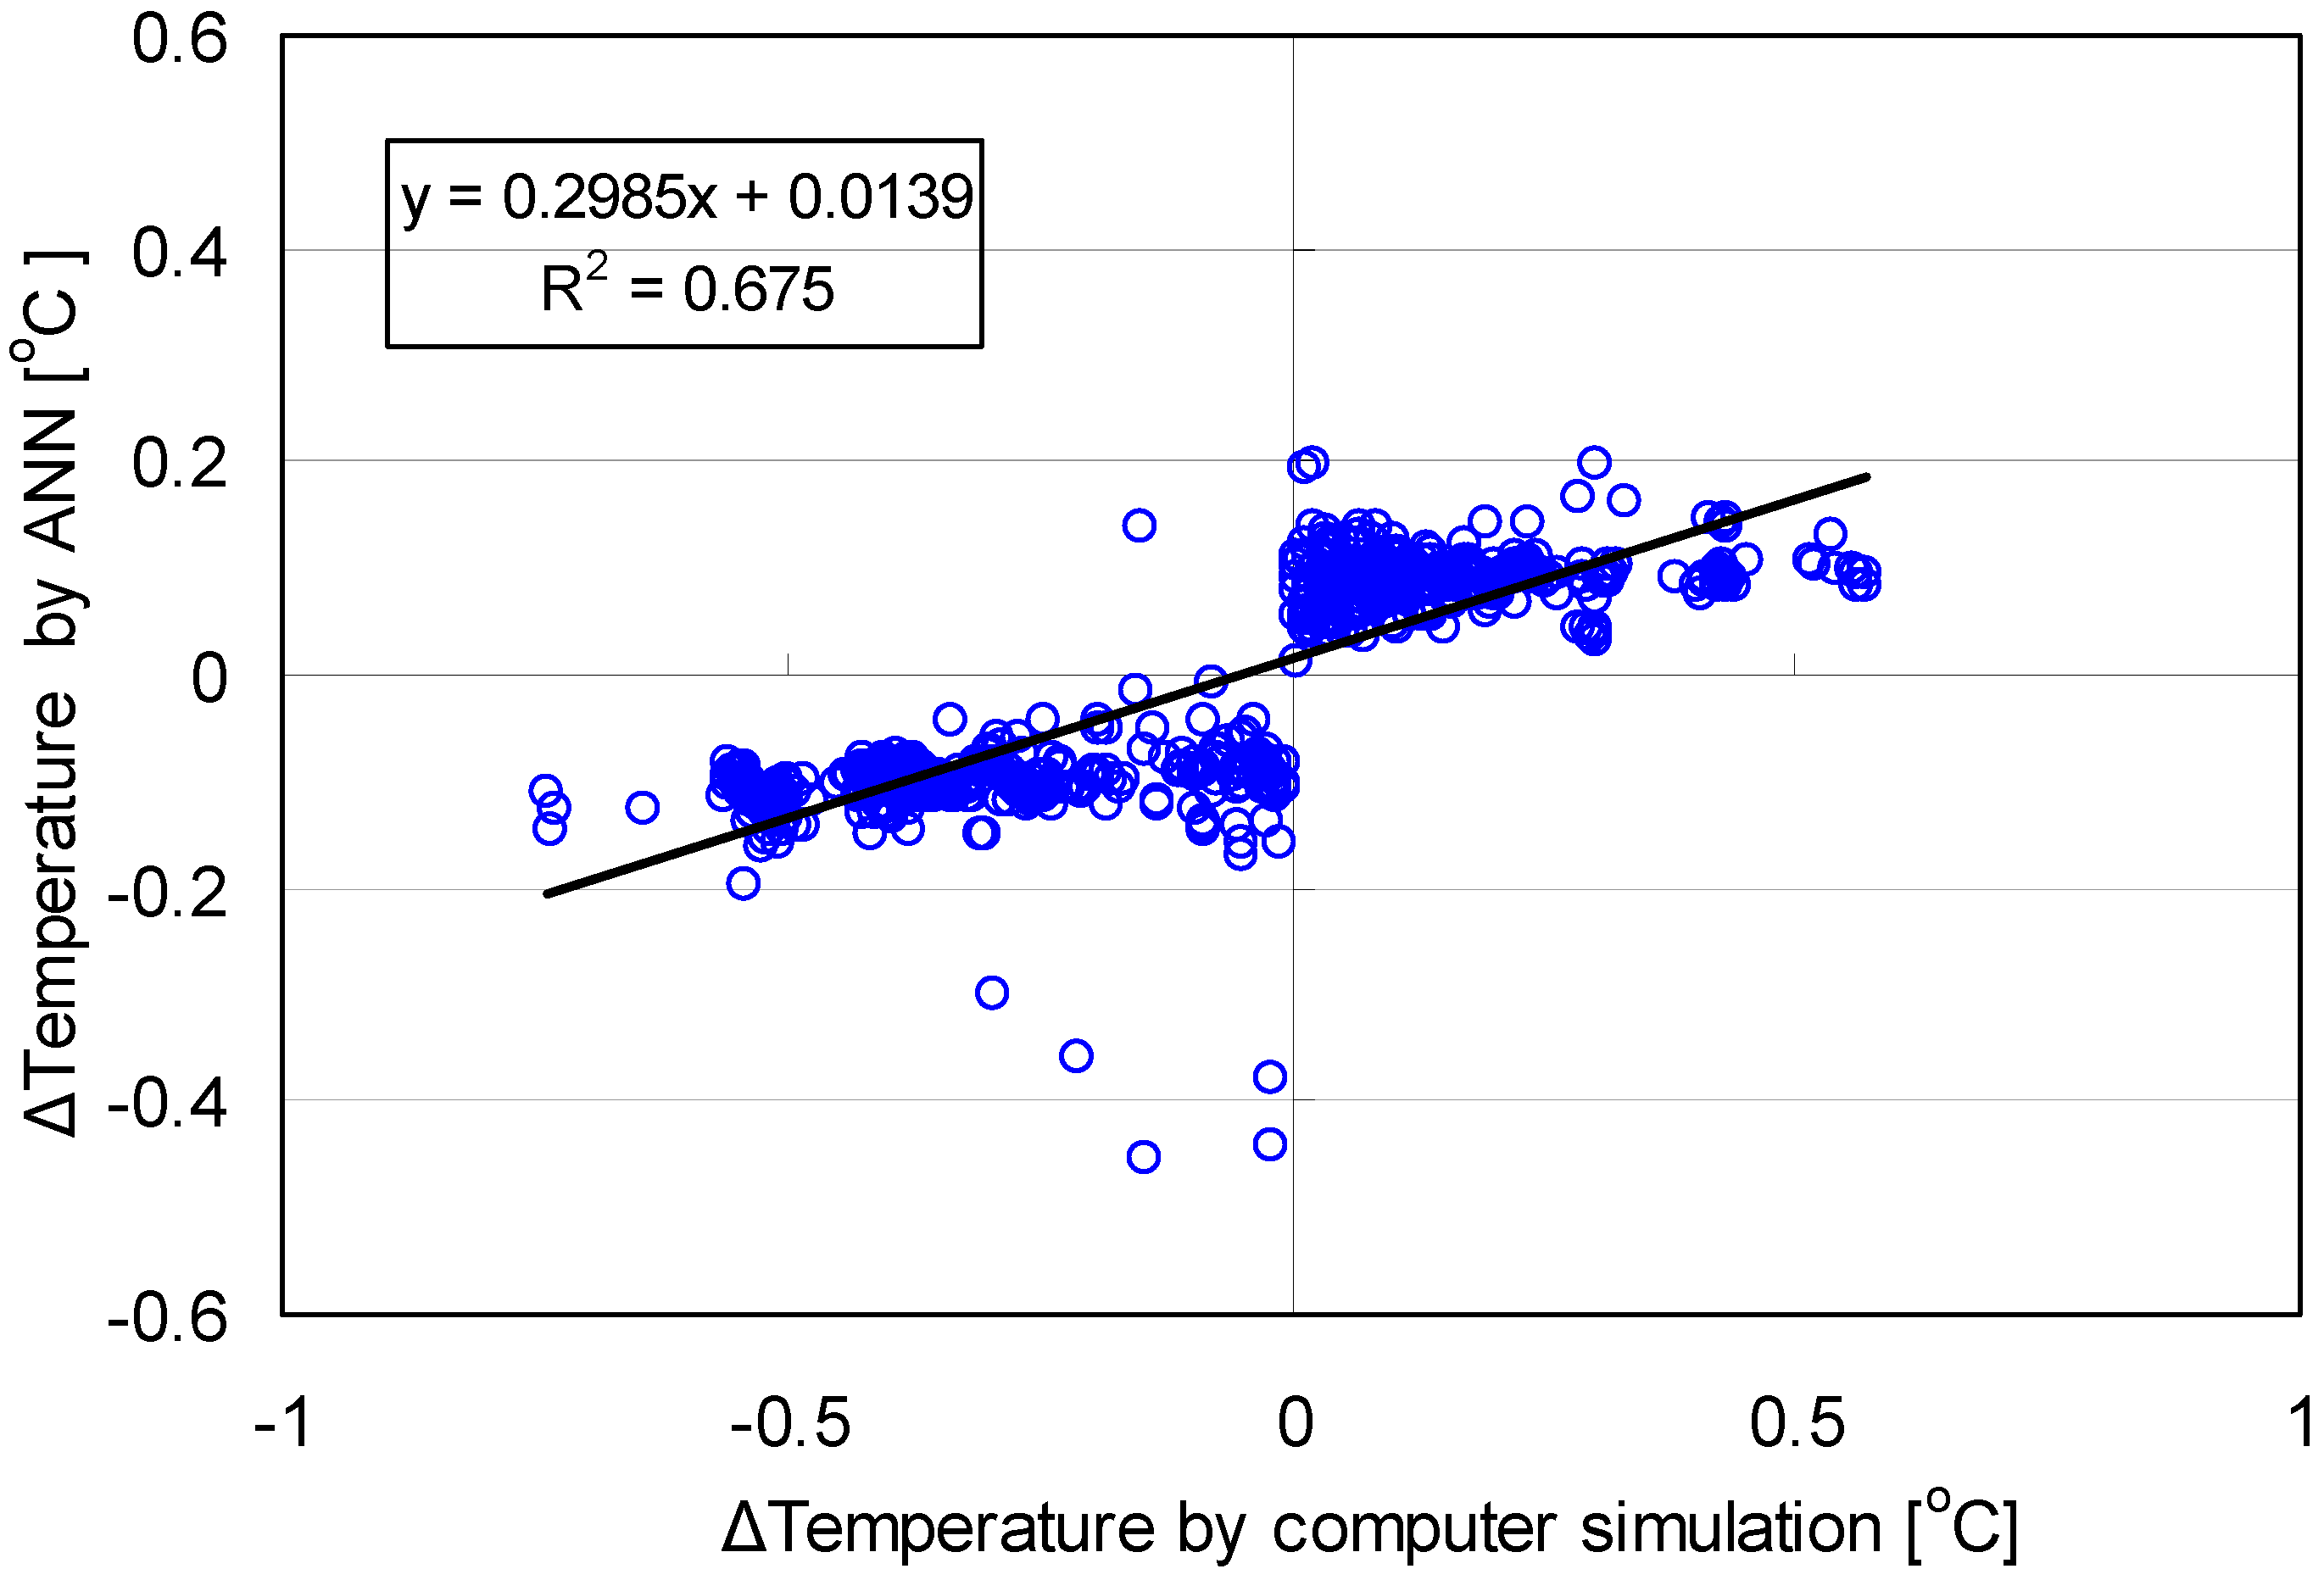
3.2. Prediction Performance of ANN Model
| Factors | Unstandardized Coefficients | t | Sig. | |
|---|---|---|---|---|
| B | Std. Error | |||
| Constant | 0.013 | 0.002 | 5.892 | 0.00 |
| Computer Simulated | 0.298 | 0.008 | 38.645 | 0.00 |
| ANOVA | R2 = 0.6586, F(1, 299) = 1,493.44, Sig. = 0.00 | |||
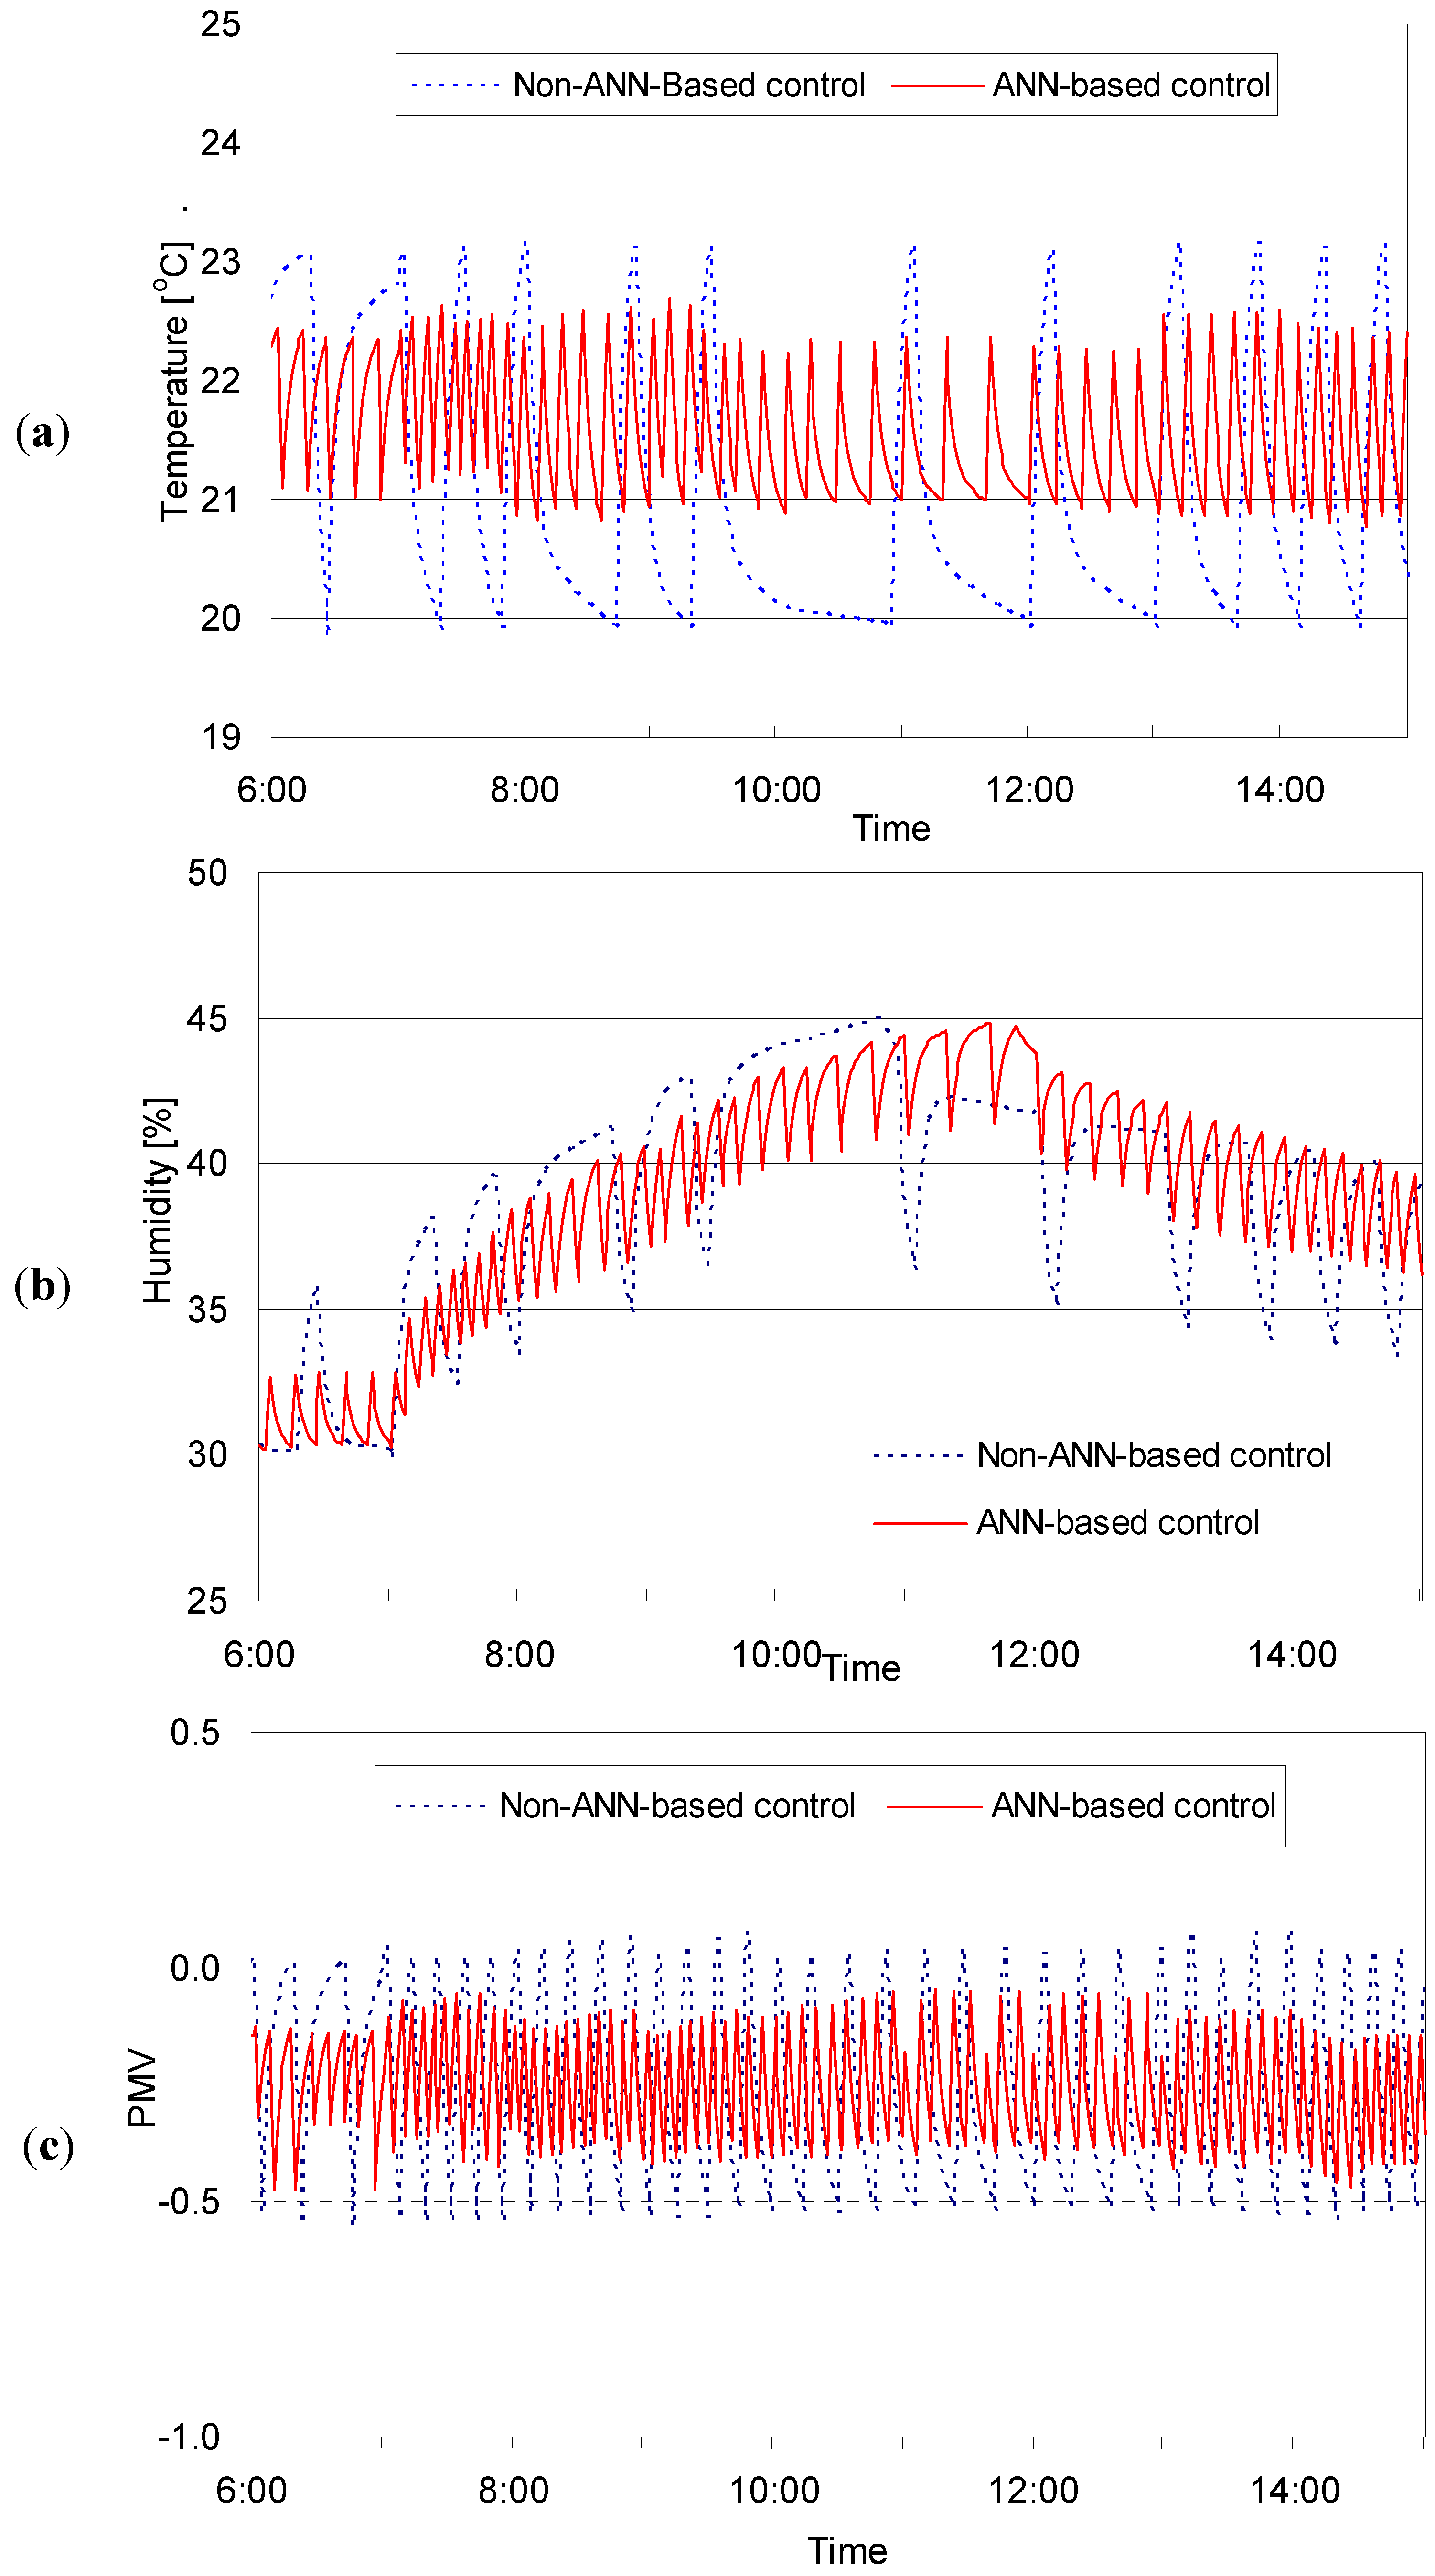
3.3. Thermal Performance of the Developed ANN Logic

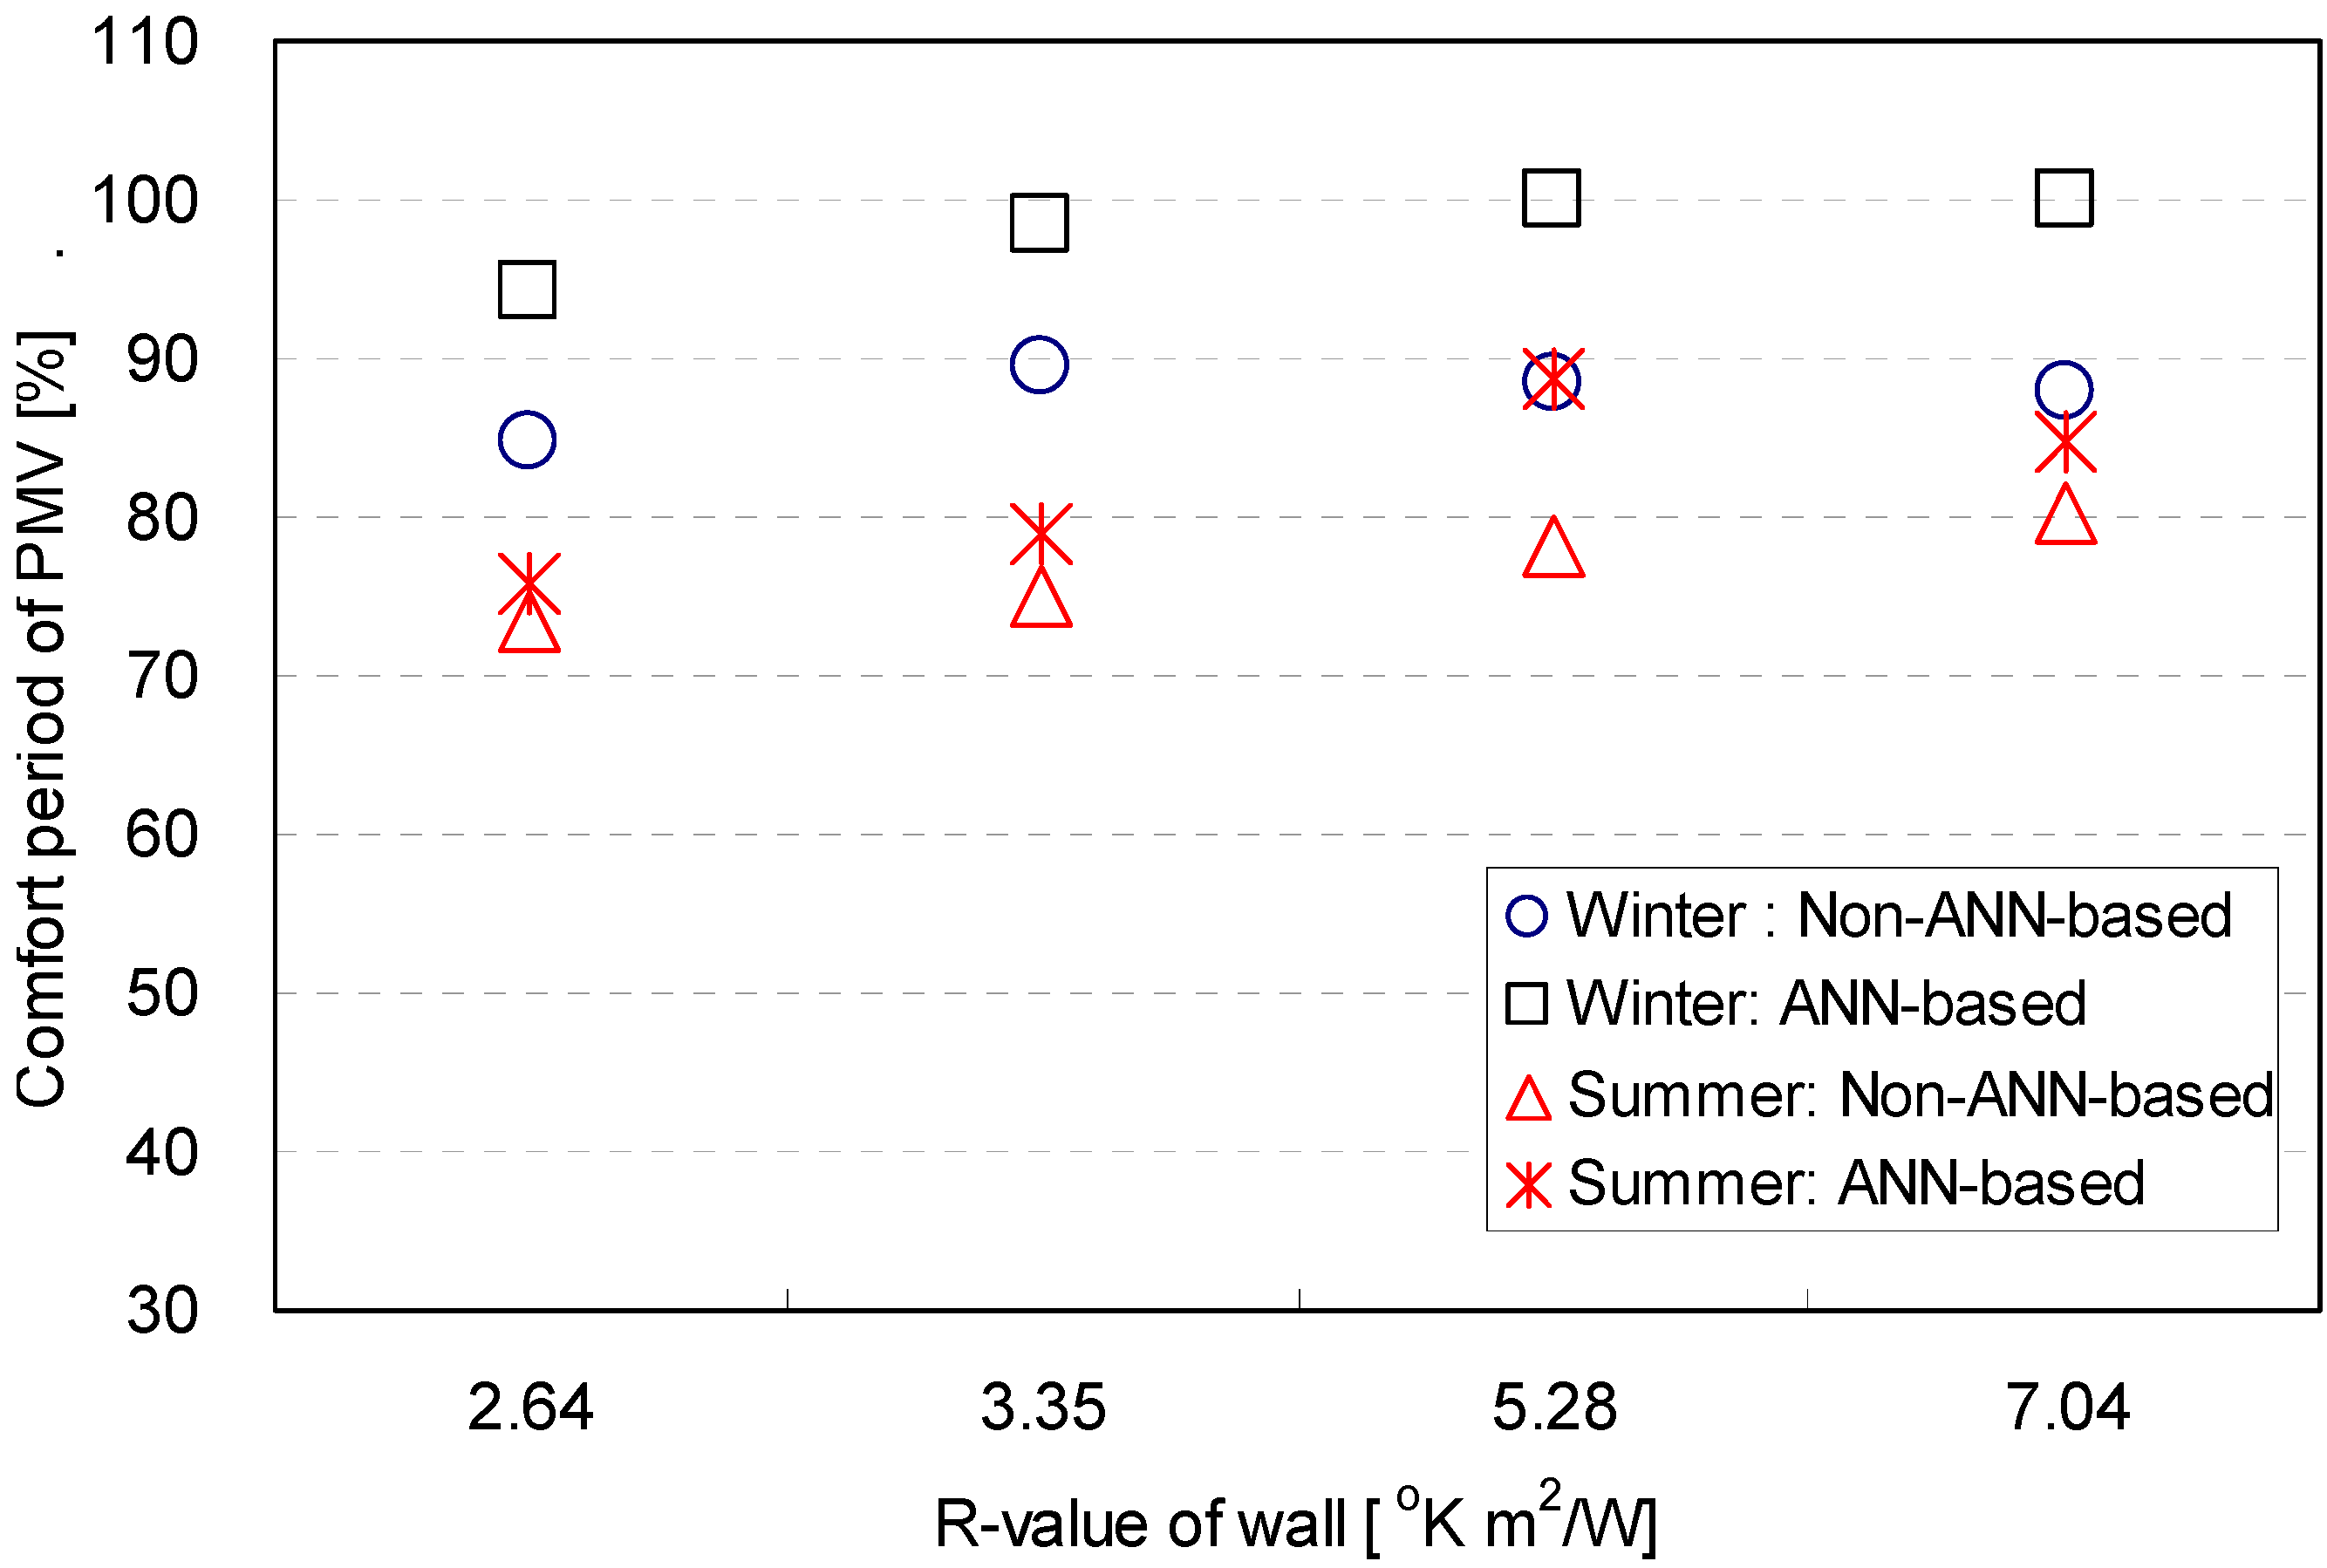
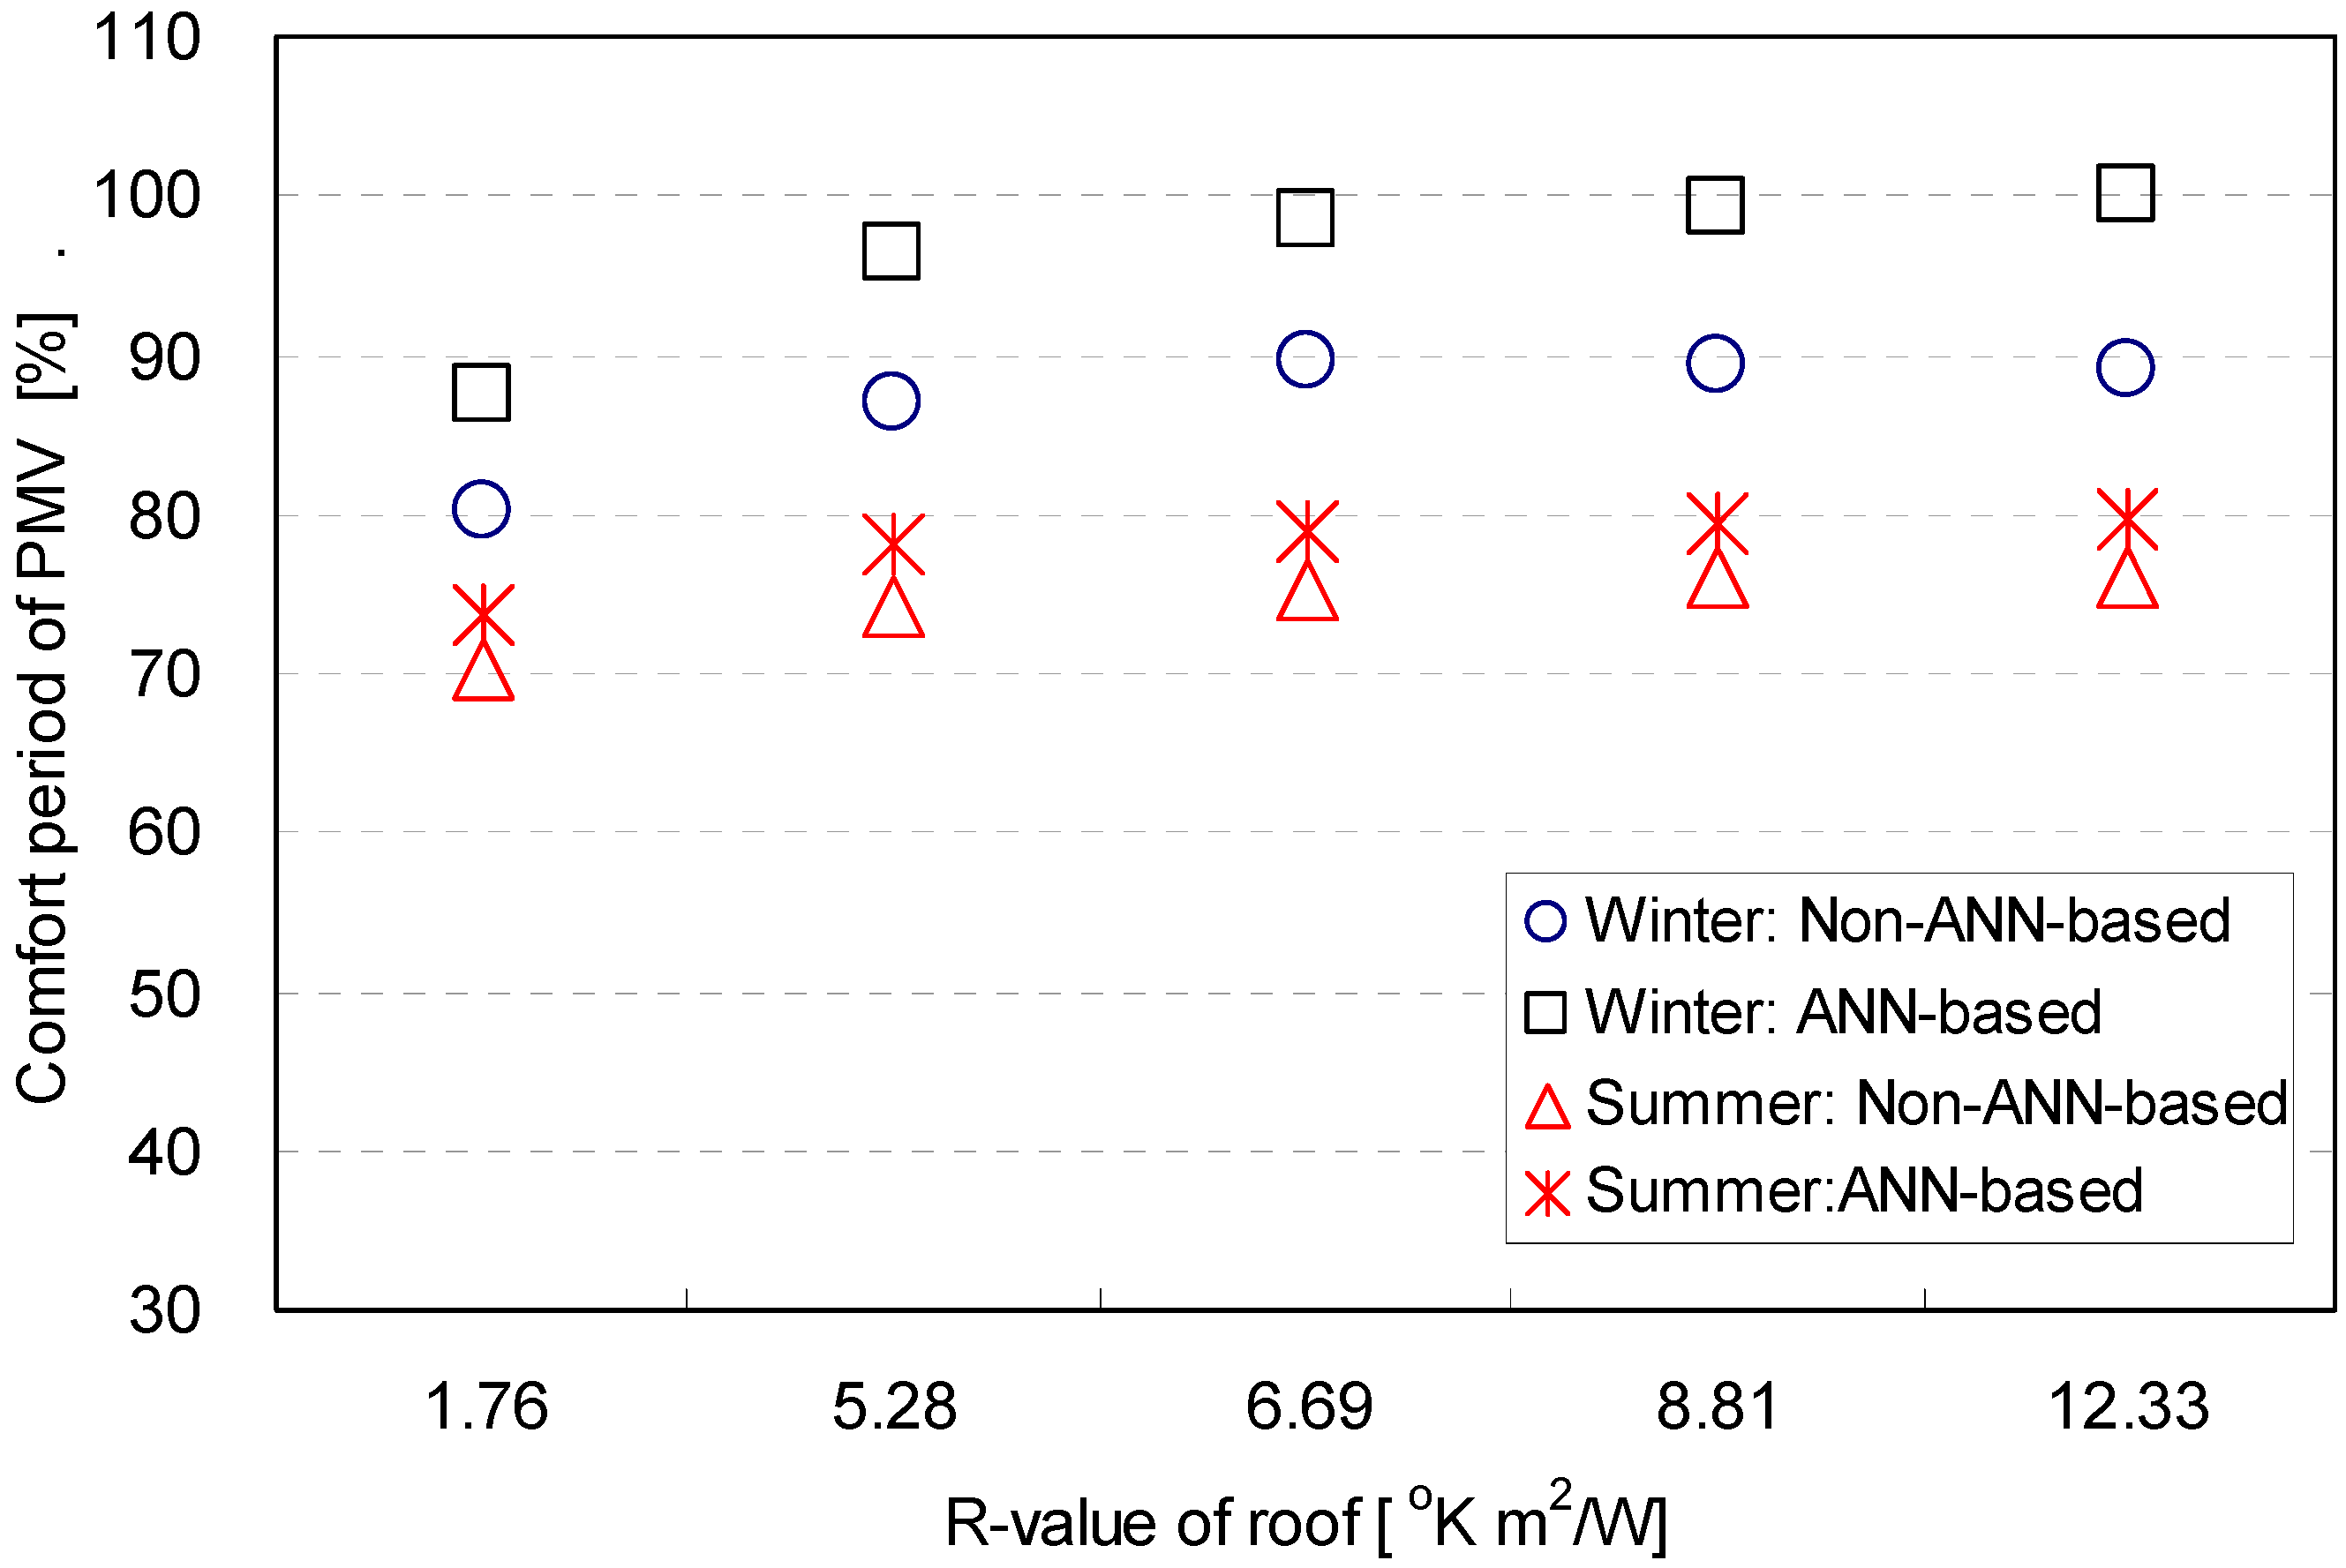
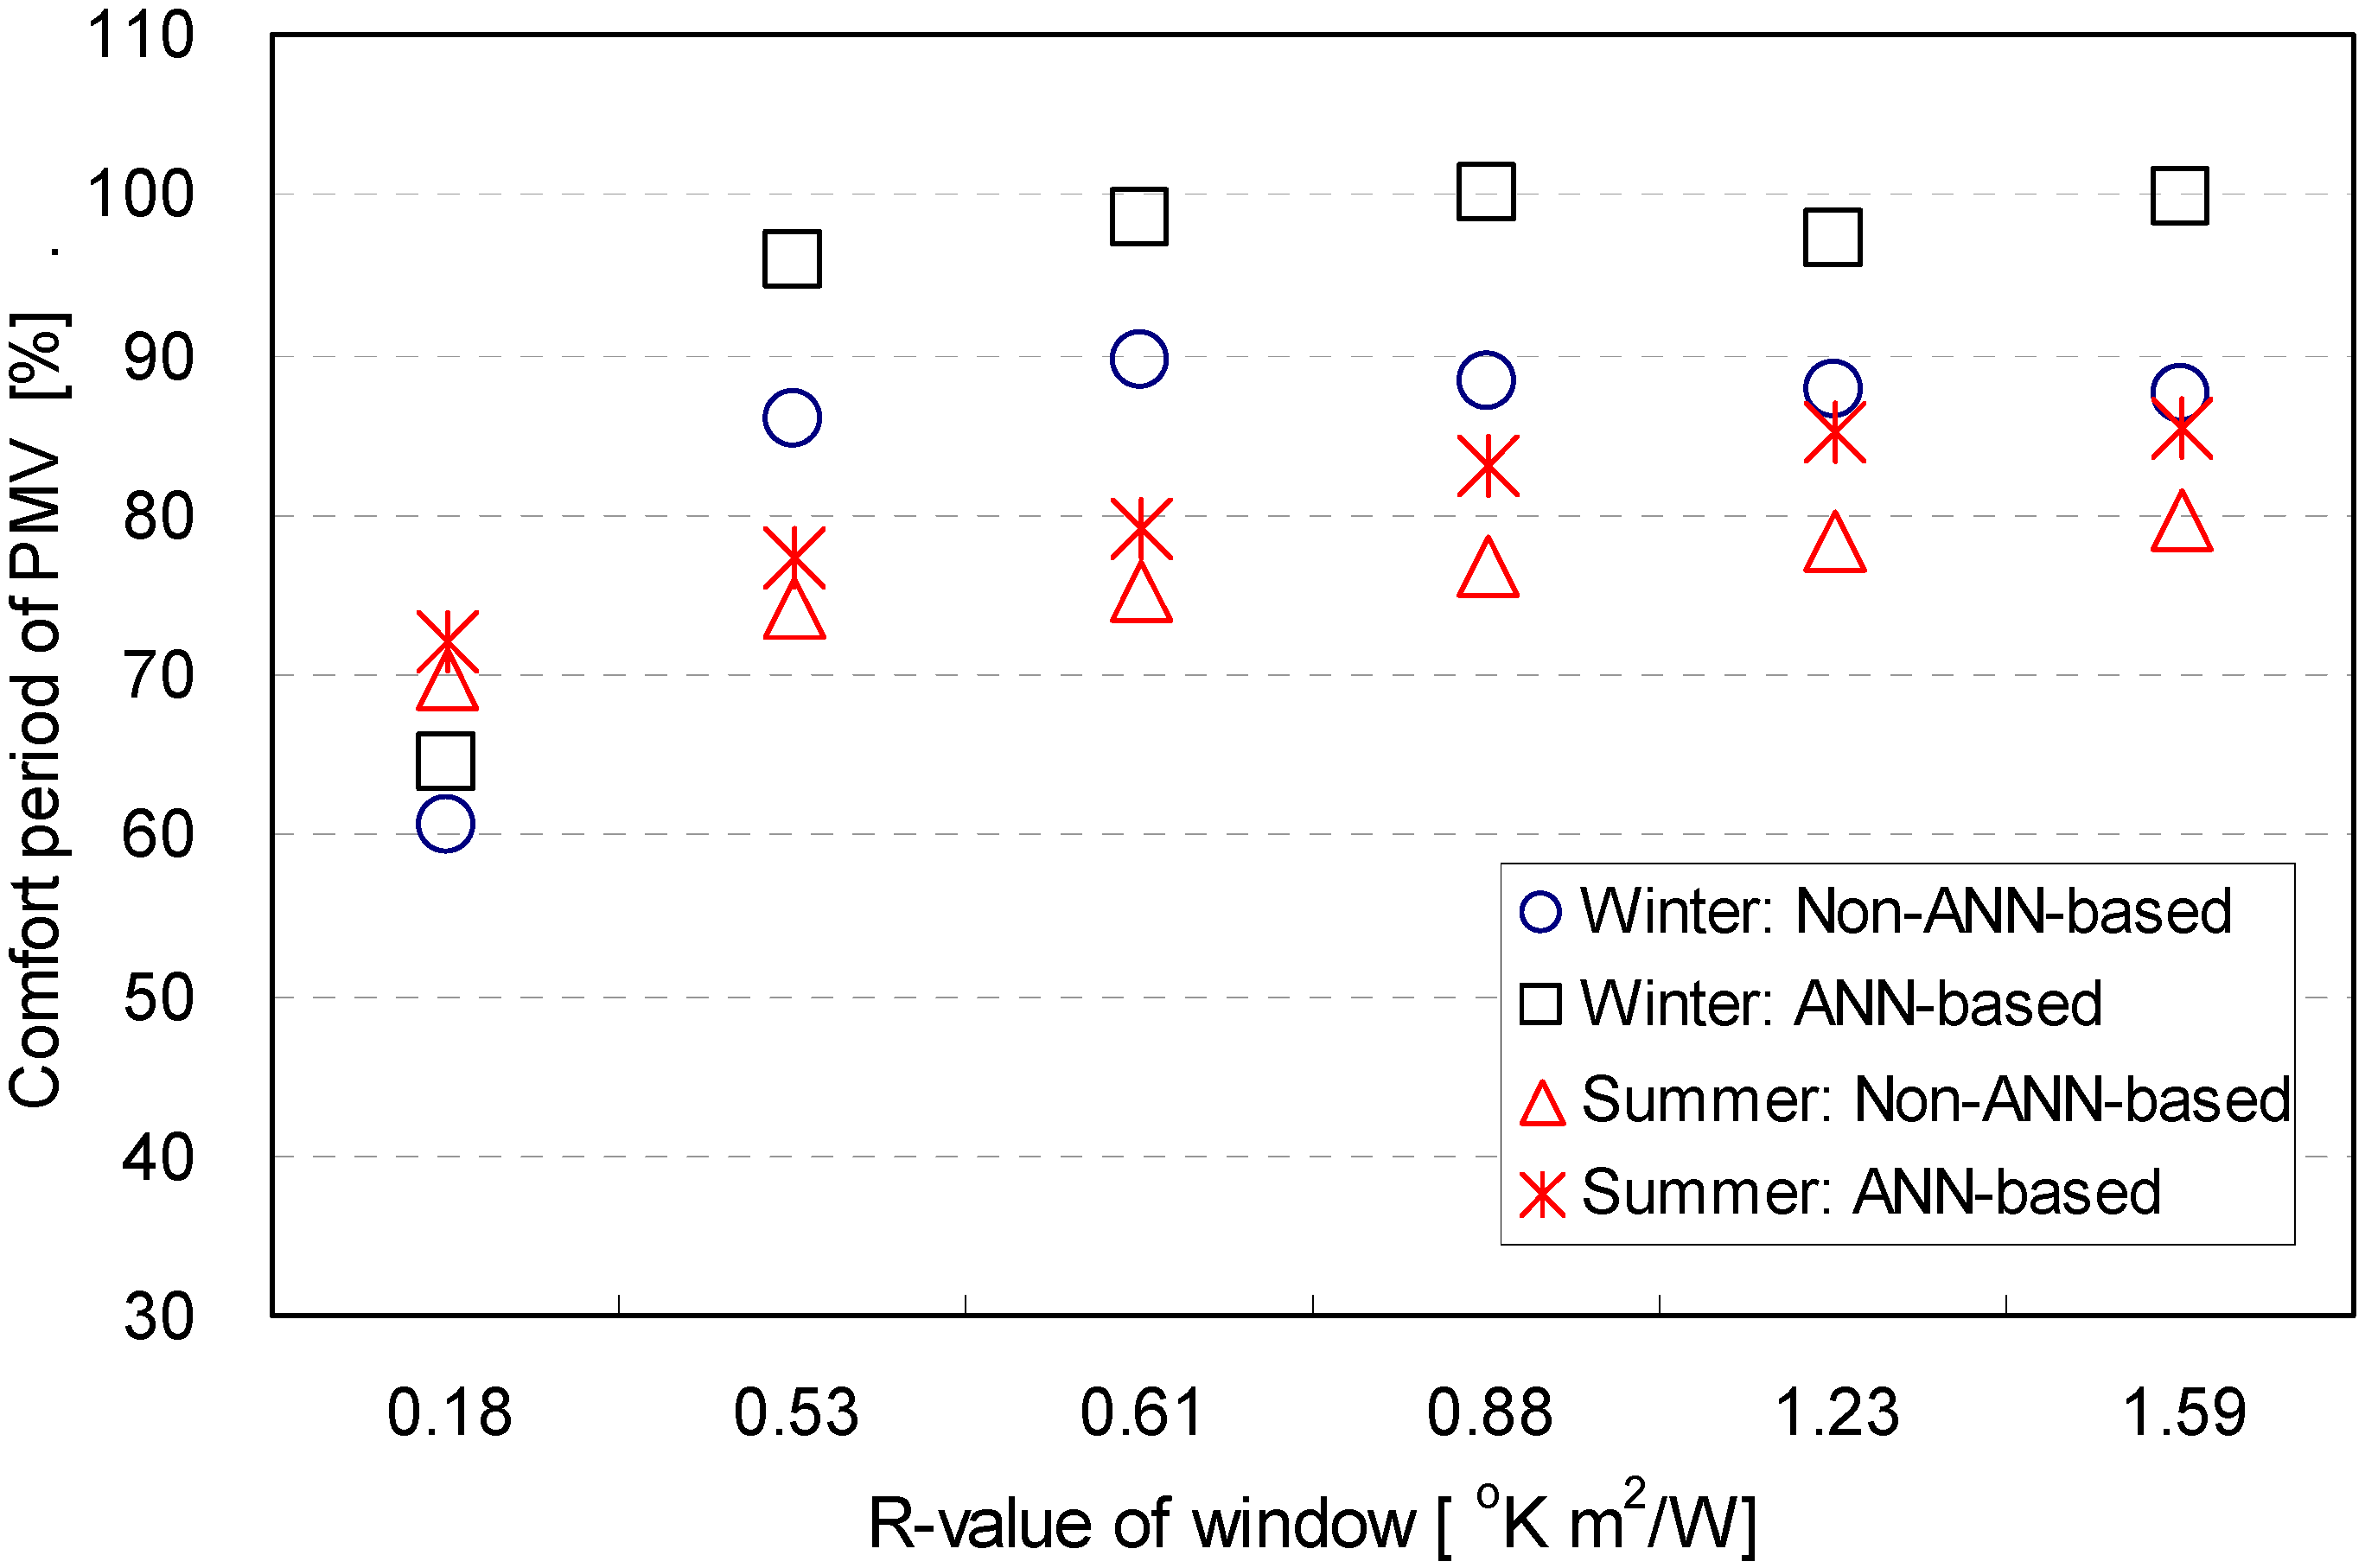
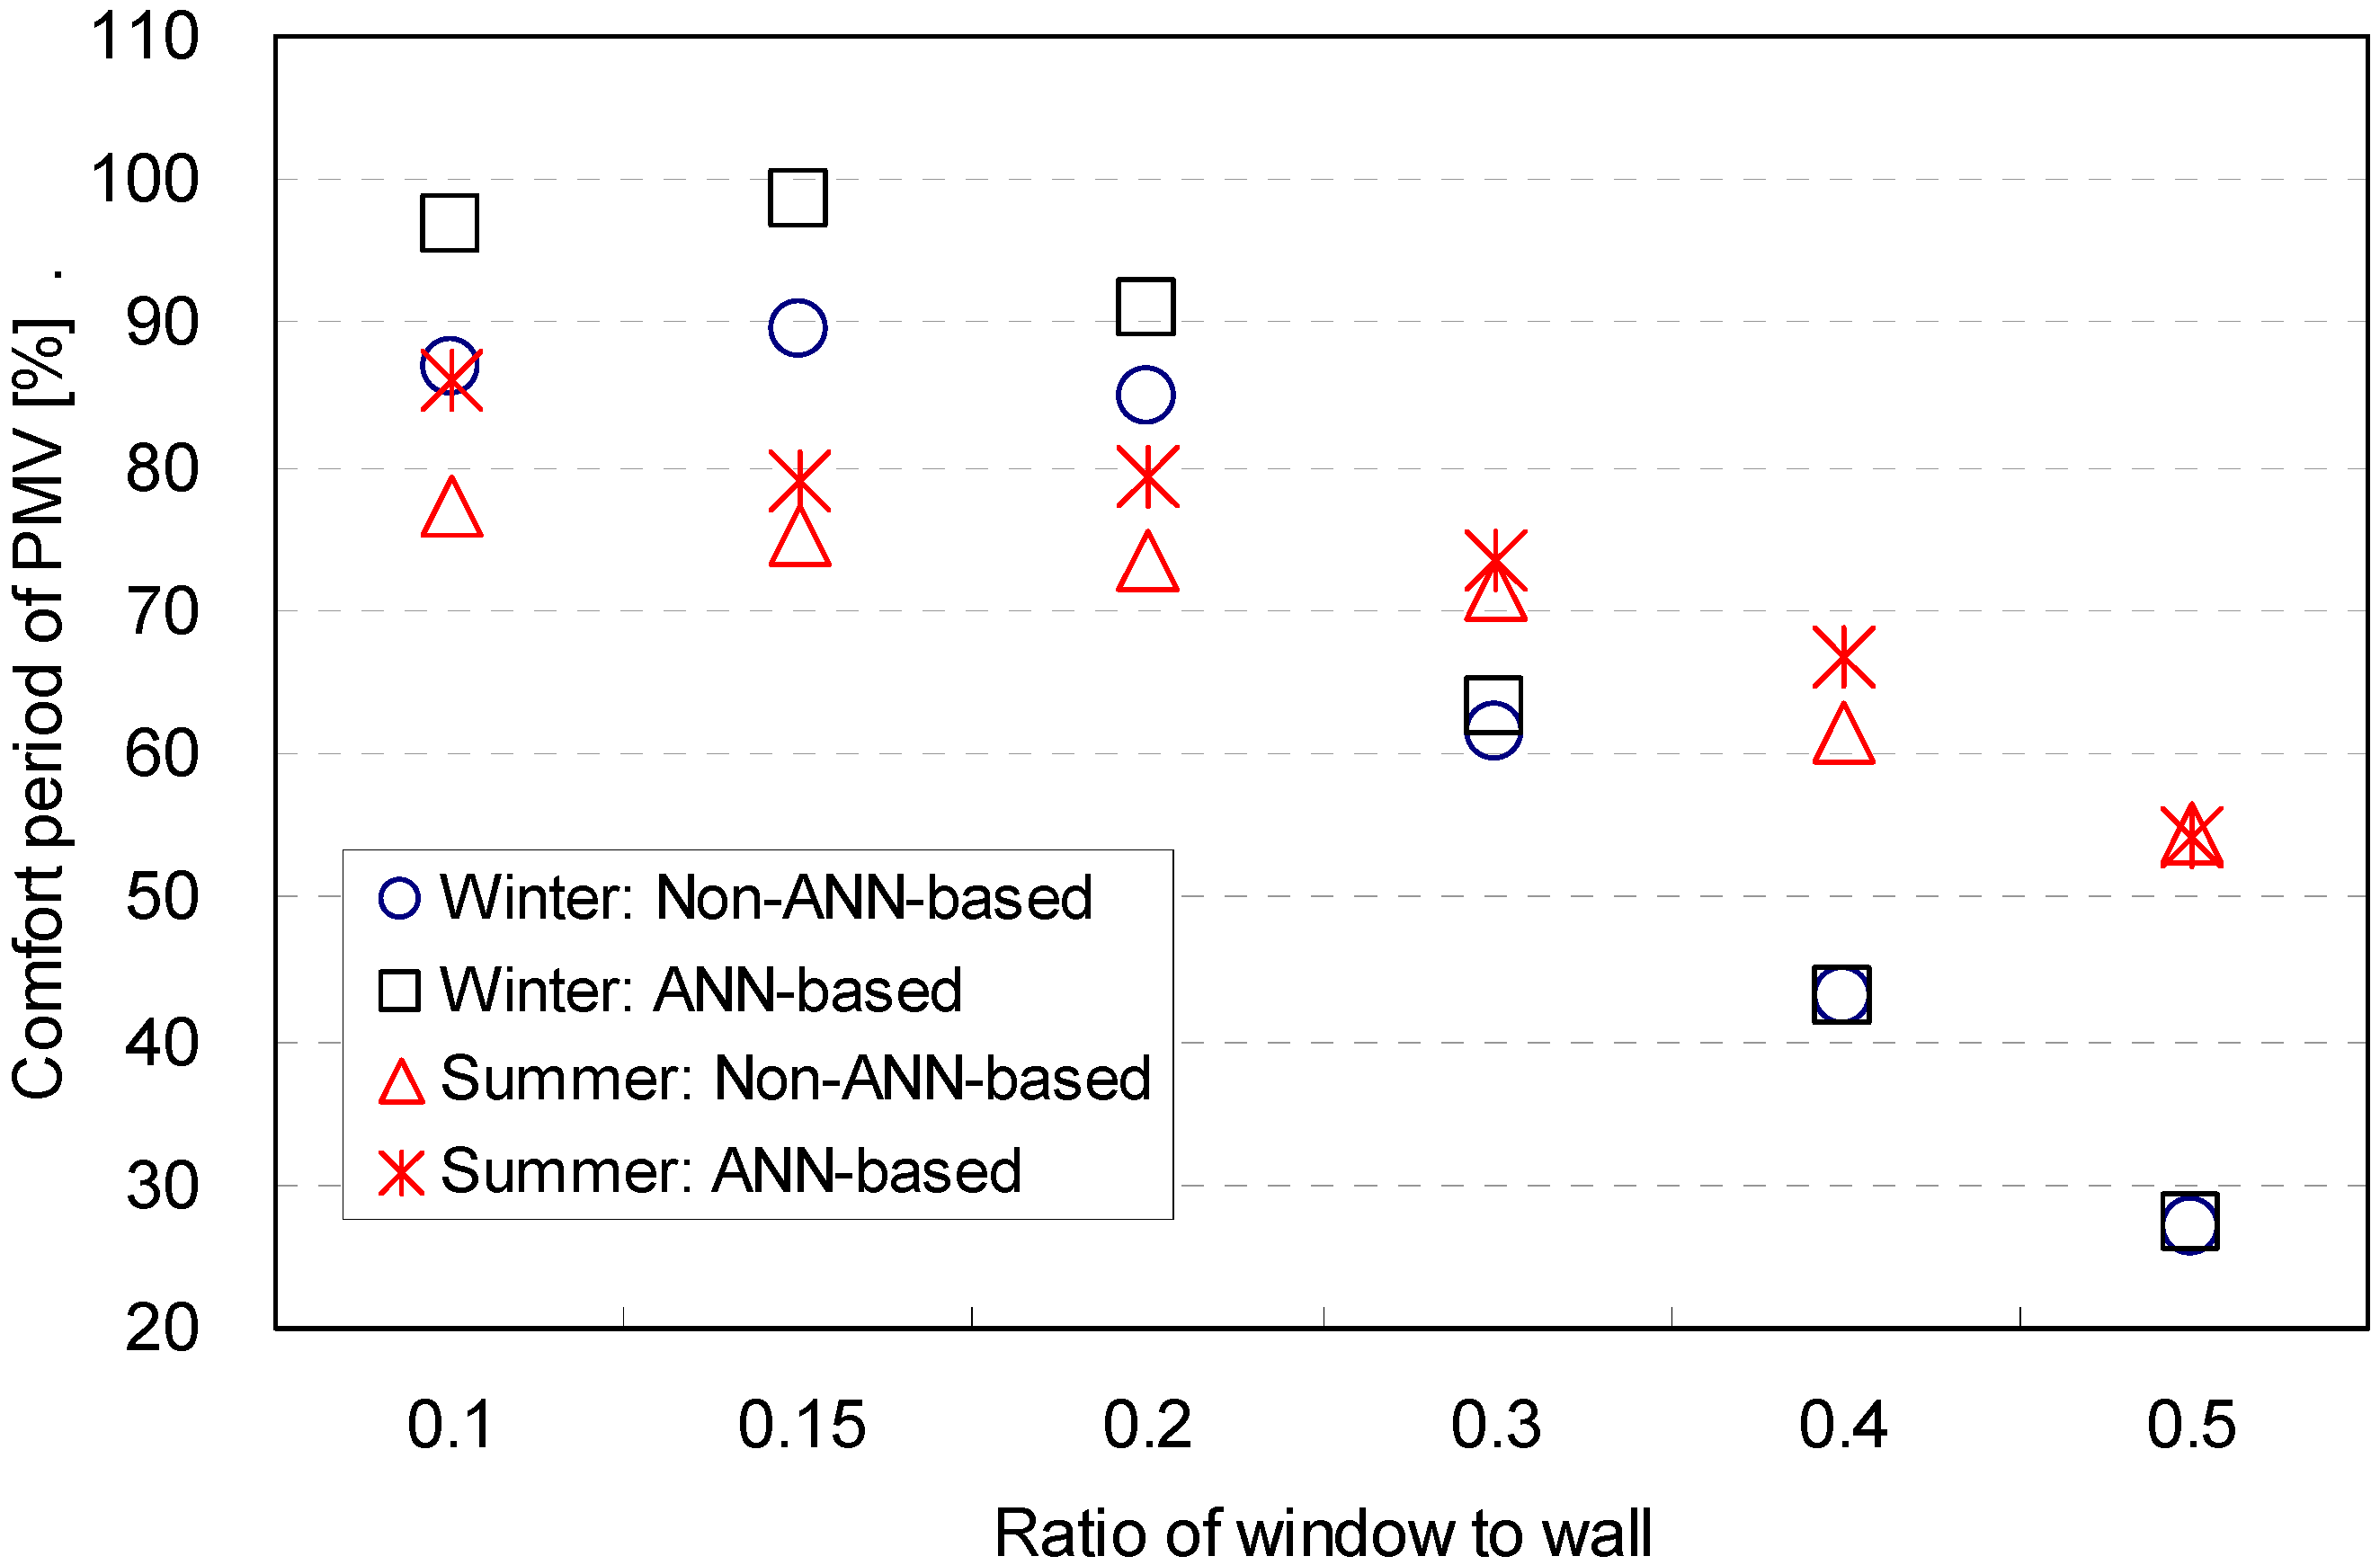
3.3.1. Percentage of Period within Targeted Range for Thermal Condition
| Thermal property | Season | Control logic | R-vale of wall (°K m/W) | |||
|---|---|---|---|---|---|---|
| 2.64 | 3.35 | 5.28 | 7.04 | |||
| Temperature | Winter | non-ANN | 90.7 | 95.8 | 95.4 | 95.3 |
| ANN | 94.0 | 100.0 | 100.0 | 99.9 | ||
| Summer | non-ANN | 96.3 | 96.1 | 95.9 | 96.0 | |
| ANN | 100.0 | 100.0 | 100.0 | 100.0 | ||
| Humidity | Winter | non-ANN | 99.9 | 99.9 | 100.0 | 100.0 |
| ANN | 100.0 | 100.0 | 100.0 | 100.0 | ||
| Summer | non-ANN | 99.2 | 99.2 | 99.4 | 99.3 | |
| ANN | 98.8 | 99.9 | 99.1 | 100.0 | ||
| Thermal property | Season | Control logic | R-value of roof (°K m/W) | ||||
|---|---|---|---|---|---|---|---|
| 1.76 | 5.28 | 6.69 | 8.81 | 12.33 | |||
| Temperature | Winter | non-ANN | 85.6 | 92.9 | 95.8 | 95.9 | 95.9 |
| ANN | 88.5 | 100.0 | 100.0 | 100.0 | 100.0 | ||
| Summer | non-ANN | 96.5 | 96.1 | 96.1 | 96.1 | 96.1 | |
| ANN | 100.0 | 100.0 | 100.0 | 100.0 | 100.0 | ||
| Humidity | Winter | non-ANN | 99.8 | 99.9 | 99.9 | 100.0 | 100.0 |
| ANN | 100.0 | 100.0 | 100.0 | 100.0 | 100.0 | ||
| Summer | non-ANN | 99.3 | 99.2 | 99.2 | 99.3 | 99.4 | |
| ANN | 99.7 | 99.0 | 99.9 | 99.7 | 99.5 | ||
| Thermal property | Season | Control logic | R-value of window (°K m/W) | |||||
|---|---|---|---|---|---|---|---|---|
| 0.18 | 0.53 | 0.61 | 0.88 | 1.23 | 1.59 | |||
| Temperature | Winter | non-ANN | 66.16 | 91.77 | 95.80 | 95.53 | 95.20 | 95.01 |
| ANN | 67.34 | 95.40 | 100.00 | 99.99 | 100.00 | 100.00 | ||
| Summer | non-ANN | 96.31 | 96.08 | 96.08 | 96.01 | 96.00 | 95.95 | |
| ANN | 98.61 | 100.00 | 100.00 | 99.97 | 99.97 | 100.00 | ||
| Humidity | Winter | non-ANN | 99.89 | 99.97 | 99.94 | 99.94 | 99.94 | 99.94 |
| ANN | 100.00 | 99.97 | 100.00 | 99.75 | 100.00 | 99.42 | ||
| Summer | non-ANN | 99.24 | 99.21 | 99.15 | 99.17 | 99.17 | 99.22 | |
| ANN | 99.92 | 99.72 | 99.90 | 99.68 | 99.54 | 99.96 | ||


| Thermal property | Season | Control logic | Ratio of window to wall | |||||
|---|---|---|---|---|---|---|---|---|
| 0.1 | 0.15 | 0.2 | 0.3 | 0.4 | 0.5 | |||
| Temperature | Winter | non-ANN | 94.7 | 93.7 | 89.3 | 66.5 | 49.7 | 31.7 |
| ANN | 98.8 | 100.0 | 91.8 | 67.2 | 49.7 | 32.5 | ||
| Summer | non-ANN | 95.8 | 96.1 | 96.7 | 94.9 | 86.0 | 77.3 | |
| ANN | 100.0 | 100.0 | 100.0 | 98.1 | 85.7 | 77.3 | ||
| Humidity | Winter | non-ANN | 99.9 | 99.9 | 100.0 | 99.8 | 92.7 | 59.8 |
| ANN | 100.0 | 100.0 | 100.0 | 100.0 | 94.1 | 62.2 | ||
| Summer | non-ANN | 99.2 | 99.2 | 99.2 | 98.6 | 97.9 | 98.1 | |
| ANN | 99.4 | 99.9 | 98.4 | 99.0 | 99.9 | 99.6 | ||

3.3.2. Magnitude of Overshoots and Undershoots out of Targeted Comfort Range
| Factor | Envelope | R-value (K m2/W) | Winter | Summer | ||||||
|---|---|---|---|---|---|---|---|---|---|---|
| Non-ANN based | ANN-based | Non-ANN based | ANN-based | |||||||
| Over shoot | Under shoot | Over shoot | Under shoot | Over shoot | Under shoot | Over shoot | Under shoot | |||
| Temperature | Wall | 2.64 | 3.5 | −5.17 | 0 | 0 | 4.75 | −6.28 | 0 | 0 |
| 3.35 | 3.95 | −6.1 | 0 | 0 | 5.4 | −7.1 | 0 | 0 | ||
| 5.28 | 4.8 | −6.1 | 0.09 | 0 | 5.46 | −7.36 | 0 | 0 | ||
| 7.04 | 4.42 | −5.79 | 0.6 | 0 | 5.75 | −6.29 | 0 | 0 | ||
| Roof | 1.76 | 3.42 | −5.1 | 0.49 | 0 | 4.72 | −7.66 | 0 | 0 | |
| 5.28 | 3.64 | −5.17 | 0 | 0 | 5.1 | −7.21 | 0 | 0 | ||
| 6.69 | 4 | −6.5 | 0 | 0 | 5.41 | −7.07 | 0 | 0 | ||
| 8.81 | 3.93 | −5.42 | 0 | 0 | 4.78 | −7.58 | 0 | 0 | ||
| 12.33 | 3.66 | −5.83 | 0 | 0 | 4.81 | −6.79 | 0 | 0 | ||
| Window | 0.18 | 1.84 | −3.51 | 0 | 0 | 5.31 | −7.04 | 0 | 0 | |
| 0.53 | 3.42 | −4.51 | 0 | 0 | 4.69 | −6.95 | 0 | 0 | ||
| 0.61 | 3.69 | −4.89 | 0 | 0 | 5.35 | −6.59 | 0 | 0 | ||
| 0.88 | 3.66 | −4.6 | 0.03 | 0 | 4.73 | −7.34 | 0 | −0.14 | ||
| 1.23 | 3.44 | −3.98 | 0 | 0 | 4.69 | −6.88 | 0 | −0.51 | ||
| 1.59 | 3.53 | −3.2 | 0 | 0 | 5.33 | −6.88 | 0 | 0 | ||
| Humidity | Wall | 2.64 | 0.07 | −0.11 | 0.58 | 0 | 34.48 | −1.05 | 0 | −2.83 |
| 3.35 | 0.18 | −0.11 | 0 | 0 | 31.67 | −1.1 | 0.22 | −0.2 | ||
| 5.28 | - | - | - | - | 18.33 | −0.91 | 0 | −2.51 | ||
| 7.04 | - | - | - | - | 12.29 | −0.53 | 1.53 | 0 | ||
| Roof | 1.76 | 0.91 | −0.01 | 0 | 0 | 33.49 | −0.85 | 0.04 | −0.18 | |
| 5.28 | 0.04 | −0.03 | 0 | 0 | 36.56 | −0.73 | 0.2 | −0.59 | ||
| 6.69 | 0.19 | −0.11 | 0 | 0 | 31.67 | −1.1 | 0.22 | −0.2 | ||
| 8.81 | 0.01 | −0.001 | 0 | 0 | 21.92 | −0.7 | 0 | −0.39 | ||
| 12.33 | 0.01 | −0.06 | 0 | 0 | 16.12 | −0.79 | 0 | −0.56 | ||
| Window | 0.18 | - | - | - | - | 27.82 | −0.85 | 4.1 | 0 | |
| 0.53 | 0.01 | −0.01 | 0 | 0 | 24.15 | −0.61 | 0.26 | −0.15 | ||
| 0.61 | 0.1 | −0.11 | 0 | 0 | 31.67 | −1.1 | 0.22 | −0.21 | ||
| 0.88 | 0.04 | −0.03 | 0 | 0 | 32.27 | −0.69 | 0 | −0.2 | ||
| 1.23 | 0.03 | −0.01 | 0 | 0 | 19.46 | −1.14 | 0 | −0.28 | ||
| 1.59 | 0.09 | −0.01 | 0.04 | 0 | 30.85 | −0.84 | 0 | 0.02 | ||
| Factor | Envelope | R-value (°K m/W) | Winter | Summer | ||||||
|---|---|---|---|---|---|---|---|---|---|---|
| Non-ANN based | ANN-based | Non-ANN based | ANN-based | |||||||
| Over shoot | Under shoot | Over shoot | Under shoot | Over shoot | Under shoot | Over shoot | Under shoot | |||
| PMV | Wall | 2.64 | 5.1 | −8.09 | 0.04 | 0 | 15.67 | −21.3 | 14.35 | −2.15 |
| 3.35 | 5.7 | −8.34 | 0 | −0.65 | 14.1 | −23.51 | 1.65 | −8.81 | ||
| 5.28 | 6.84 | −7.69 | 0 | 0 | 12.68 | −25.33 | 2.68 | −1.04 | ||
| 7.04 | 6.82 | −7.76 | 0 | −0.05 | 12.43 | −26.8 | 11.84 | −4.04 | ||
| Roof | 1.76 | 4.46 | −6.14 | 0 | −0.02 | 15.39 | −18.62 | 0.05 | −7.78 | |
| 5.28 | 5.52 | −9.09 | 0 | −0.1 | 15.1 | −22.21 | 1.94 | −11.02 | ||
| 6.69 | 5.71 | −8.43 | 0 | −0.65 | 14.1 | −23.51 | 1.65 | −8.81 | ||
| 8.81 | 5.81 | −8.09 | 0 | −0.56 | 14.41 | −23.35 | 0.14 | −11.14 | ||
| 12.33 | 6.14 | −7.99 | 0 | 0 | 14.01 | −22.54 | 0 | −13.27 | ||
| Window | 0.18 | 2.39 | −4.92 | 0 | 0 | 15.17 | −19.61 | 9.3 | −3.53 | |
| 0.53 | 5.19 | −7.4 | 0 | 0 | 14.32 | −22.29 | 4.73 | −5.76 | ||
| 0.61 | 5.43 | −6.64 | 0 | −0.62 | 13.87 | −22.15 | 1.65 | −7.44 | ||
| 0.88 | 6.26 | −5.68 | 0 | 0 | 14.01 | −22.87 | 0.9 | −3.17 | ||
| 1.23 | 6.67 | −5.85 | 0 | −0.03 | 14.42 | −23.68 | 0.37 | −4.17 | ||
| 1.59 | 6.5 | −5.3 | 0 | 0 | 13.61 | −24.09 | 0.02 | −4.5 | ||
| Factor | Ratio of window to wall | Winter | Summer | ||||||
|---|---|---|---|---|---|---|---|---|---|
| Non-ANN based | ANN-based | Non-ANN based | ANN-based | ||||||
| Over shoot | Under shoot | Over shoot | Under shoot | Over shoot | Under shoot | Over shoot | Under shoot | ||
| Temperature | 0.1 | 2.5 | −1.77 | 0.07 | 0 | 2.2 | −6.86 | 0 | 0 |
| 0.15 | 2.3 | −1.5 | 0 | 0 | 2.45 | −5.55 | 0 | 0 | |
| 0.2 | 1.55 | −1.51 | 0 | 0 | 3.17 | −5.07 | 0 | 0 | |
| 0.3 | 0.92 | −1.02 | 0.01 | 0 | 2.45 | −4.05 | 0 | 0 | |
| 0.4 | 0.85 | −0.57 | 0.36 | −0.02 | 2.15 | −3.62 | 0 | 0 | |
| 0.5 | 0.76 | −0.95 | 0 | 0 | 2.18 | −3.02 | 0.03 | 0 | |
| Humidity | 0.1 | 0.04 | −0.07 | 0 | −0.01 | 23.82 | −0.44 | 0.23 | −1.88 |
| 0.15 | 0.11 | −0.02 | 0 | 0 | 31.67 | −1.1 | 0.22 | 0 | |
| 0.2 | 0.01 | −0.01 | 0.15 | 0 | 38.35 | −1.28 | 0 | −11.37 | |
| 0.3 | - | - | - | - | 45.38 | −49.38 | 14.88 | −2.84 | |
| 0.4 | - | - | - | - | 104.52 | −82.02 | 3.06 | −2.54 | |
| 0.5 | - | - | - | - | 115.03 | −72.65 | 21.82 | 0 | |
| PMV | 0.1 | 3.42 | −2.02 | 0 | 0 | 4.06 | −18.22 | 0 | −1.01 |
| 0.15 | 3.17 | −2.04 | 0 | 0 | 5.43 | −17.31 | 0 | −7.38 | |
| 0.2 | 2.8 | −1.79 | 0 | −0.02 | 7.15 | −16.23 | 0.27 | −1.55 | |
| 0.3 | 2.33 | −1.28 | 0 | −0.69 | 7.56 | −13.71 | 0.55 | −5.43 | |
| 0.4 | 2.03 | −1.12 | 0.39 | −1.32 | 8.26 | −13.23 | 1.44 | −4.53 | |
| 0.5 | 1.56 | −1.25 | 0.02 | −2.86 | 7.35 | −11.44 | 6.33 | −5.5 | |
4. Conclusions
- (1)
- The applied simulation method proved its validity through the similarities of the simulation results in the air temperature profile and energy consumption with the collected data from the existing experimental building. This result provided effective grounds for further computer simulations to analyze the influence of the control logics on the indoor thermal environment.
- (2)
- The prediction accuracy of the ANN model was statistically validated using the linear regression model. The linear regression model presented a significant relationship between the values calculated from the ANN model and from the computational simulation. It indicates that the developed ANN models can be effectively applied to the thermal control logic.
- (3)
- The percentage of the comfort period in terms of the predictive mean vote (PMV) generated by non-ANN-based and ANN-based control logics increased as the R-values of the building envelopes increased. The percentage significantly dropped as the ratio of window to wall decreased, because the indoor humidity was maintained above the targeted comfort range without the operation of a humidifying device. The control performance obtained by using the ANN-based logic was more effective for reducing the overshoots of the dehumidifying device in summer. Also, the cooling and dehumidifying were effectively controlled by the ANN-based logic in terms of the PMV. This result consists with the control pattern in terms of the humidity.
- (4)
- The thermal performance of the ANN-based logics was investigated and compared with the non-ANN counterparts for a variety of architectural variables in the building. In general, the ANN-based logics provided an increased percentage of the period within the targeted range for the air temperature, humidity and PMV. The overshoots and undershoots outside of the targeted comfort range were also significantly reduced by the ANN-based logics. The results imply that the ANN-based logics are able to achieve more comfortable thermal conditions in buildings.
Acknowledgments
References
- Mettam, K.C. Human Thermal Environment, 2nd ed.; Taylor & Frances: London, UK, 2003. [Google Scholar]
- Harper, R. Inside the Smart Home; Springer-Verlag: London, UK, 2003. [Google Scholar]
- Moon, J.W.; Jung, S.K.; Kim, J.J. Application of ANN (Artificial Neural Network) in Residential Thermal Control. In Proceedings of the Eleventh International IBPSA Conference, Glasgow, Scotland, 27–30 July 2009; pp. 64–71.
- Rumelhart, D.E.; Hinton, G.E.; Williams, R.J. Learning representations by back-propagating errors. Nature 1986, 323, 533–536. [Google Scholar] [CrossRef]
- Argiriou, A.A.; Bellas-Velidis, I.; Kummert, M.; Andre, P. A Neural network controller for hydronic heating systems of solar buildings. Neural Netw. 2004, 17, 427–440. [Google Scholar] [CrossRef] [PubMed]
- Argiriou, A.A.; Bellas-Velidis, I.; Balaras, C.A. Development of a neural network heating controller for solar buildings. Neural Netw. 2000, 13, 811–820. [Google Scholar] [CrossRef] [PubMed]
- Morel, N.; Bauer, M.; El-Khoury, M.; Krauss, J. NEUROBAT, A predictive and adaptive heating control system using artificial neural networks. Int. J. Sol. Energy 2001, 21, 161–201. [Google Scholar] [CrossRef]
- Lee, J.Y.; Yeo, M.S.; Kim, K.W. Predictive control of the radiant floor heating system in apartment buildings. J. Asian Archit. Build. 2002, 1, 105–112. [Google Scholar] [CrossRef]
- Lee, J.Y.; Yang, I.H.; Song, S.Y.; Kim, H.S.; Kim, K.W. A Study of The Predictive Control of the Ondol System in Apartments. In Proceedings of the International Building Performance Simulation Association, Kyoto, Japan, 13–15 September 1999; pp. 215–222.
- Gouda, G.G.; Danaher, S.; Underwood, C.P. Quasi-adaptive fuzzy heating control of solar buildings. Build. Environ. 2006, 41, 1881–1891. [Google Scholar] [CrossRef]
- Soyguder, S.; Alli, H. An expert system for the humidity and temperature control in HVAC systems using ANFIS and optimization with fuzzy modeling approach. Energy Build. 2009, 41, 814–822. [Google Scholar] [CrossRef]
- Moon, J.W. ANN-Based Model-Free Thermal Controls for Residential Buildings. Ph.D. Thesis, Taubman College of Architecture and Urban Planning, University of Michigan, Ann Arbor, MI, USA, 2009. [Google Scholar]
- Moon, J.W.; Jung, S.K.; Kim, Y.; Han, S.H. Comparative study of artificial intelligence-based thermal control methods—Application of fuzzy, adaptive neuro-fuzzy inference system, and artificial neural network. Appl. Therm. Eng. 2011, 31, 2422–2429. [Google Scholar] [CrossRef]
- Moon, J.W. Development of ANN- and ANFIS-based control logics for heating and cooling systems in residential buildings and their performance tests. J. Korean Hous. Assoc. 2011, 22, 113–122. [Google Scholar] [CrossRef]
- Moon, J.W.; Kim, J.J. ANN-based thermal control models for residential buildings. Build. Environ. 2010, 45, 1612–1625. [Google Scholar] [CrossRef]
- Moon, J.W. Performance of ANN-based predictive and adaptive thermal-control methods for disturbances in and around residential buildings. Build. Environ. 2011, 48, 15–26. [Google Scholar] [CrossRef]
- Moon, J.W.; Han, S.H. A comparative study between thermostat/hygrometer-based conventional and artificial neural network-based predictive/adaptive thermal controls in residential buildings. J. Asian Archit. Build. 2012, 11, 169–176. [Google Scholar]
- Ruano, A.E.; Crispim, E.M.; Conceicao, E.Z.E.; Lucio, M.M., Jr. Prediction of building’s temperature using neural networks models. Energy Build. 2006, 38, 682–694. [Google Scholar] [CrossRef]
- Stergious, C.; Siganos, D. Introduction to Neural Networks. Available online: http://www.doc.ic.ac.uk/~nd/surprise_96/journal/vol4/cs11/report.html (accessed on 10 July 2006).
- International Building Physics Toolbox in Simulink. Available online: http://www.ibpt.org/ (accessed on November 23, 2009).
- MathWorks. MATLAB 14. Available online: http://www.mathworks.com (accessed on 17 October 2008).
- Bradshaw, V. Building Control Systems, 2nd ed.; John Wiley & Sons: New York, NY, USA, 1993. [Google Scholar]
- American Society of Heating, Refrigerating and Air-Conditioning Engineers, Inc. (ASHRAE). Thermal Environmental Conditions for Human Occupancy; ANSI-ASHRAE Standard 55-1992; ASHRAE: Atlanta, GA, USA, 1992. [Google Scholar]
- ASHRAE. Energy-Efficient Design of Low-Rise Residential Buildings; ANSI-ASHRAE Standard 90.2-2004; ASHRAE: Atlanta, GA, USA, 2004. [Google Scholar]
- McArthur, H.; Spalding, D. Engineering Materials Science: Properties, Uses, Degradation and Remediation; Horwood Publishing: Cambridge, UK, 2004. [Google Scholar]
© 2013 by the authors; licensee MDPI, Basel, Switzerland. This article is an open access article distributed under the terms and conditions of the Creative Commons Attribution license (http://creativecommons.org/licenses/by/3.0/).
Share and Cite
Moon, J.W.; Chang, J.D.; Kim, S. Determining Adaptability Performance of Artificial Neural Network-Based Thermal Control Logics for Envelope Conditions in Residential Buildings. Energies 2013, 6, 3548-3570. https://doi.org/10.3390/en6073548
Moon JW, Chang JD, Kim S. Determining Adaptability Performance of Artificial Neural Network-Based Thermal Control Logics for Envelope Conditions in Residential Buildings. Energies. 2013; 6(7):3548-3570. https://doi.org/10.3390/en6073548
Chicago/Turabian StyleMoon, Jin Woo, Jae D. Chang, and Sooyoung Kim. 2013. "Determining Adaptability Performance of Artificial Neural Network-Based Thermal Control Logics for Envelope Conditions in Residential Buildings" Energies 6, no. 7: 3548-3570. https://doi.org/10.3390/en6073548