Article

Satellite Lithium-Ion Battery Remaining Cycle Life Prediction with Novel Indirect Health Indicator Extraction

1
Department of Automatic Test and Control, Harbin Institute of Technology, No.2, YiKuang Street, NanGang District, Harbin 150080, China
2
Department of Systems and Industrial Engineering, The University of Arizona, Tucson, AZ 85721, USA
*
Author to whom correspondence should be addressed.
Energies 2013, 6(8), 3654-3668; https://doi.org/10.3390/en6083654
Submission received: 21 June 2013 / Revised: 11 July 2013 / Accepted: 12 July 2013 / Published: 25 July 2013
(This article belongs to the Special Issue Li-ion Batteries and Energy Storage Devices)

Abstract

:
Prognostics and remaining useful life (RUL) estimation for lithium-ion batteries play an important role in intelligent battery management systems (BMS). The capacity is often used as the fade indicator for estimating the remaining cycle life of a lithium-ion battery. For spacecraft requiring high reliability and long lifetime, in-orbit RUL estimation and reliability verification on ground should be carefully addressed. However, it is quite challenging to monitor and estimate the capacity of a lithium-ion battery on-line in satellite applications. In this work, a novel health indicator (HI) is extracted from the operating parameters of a lithium-ion battery to quantify battery degradation. Moreover, the Grey Correlation Analysis (GCA) is utilized to evaluate the similarities between the extracted HI and the battery’s capacity. The result illustrates the effectiveness of using this new HI for fading indication. Furthermore, we propose an optimized ensemble monotonic echo state networks (En_MONESN) algorithm, in which the monotonic constraint is introduced to improve the adaptivity of degradation trend estimation, and ensemble learning is integrated to achieve high stability and precision of RUL prediction. Experiments with actual testing data show the efficiency of our proposed method in RUL estimation and degradation modeling for the satellite lithium-ion battery application.

1. Introduction

Lithium-ion batteries have been widely used in many fields, such as communications, navigation, aviation, and outer space technologies, for their high energy density, high output voltage, low self-discharge rate, long lifetime, high reliability and safety, and other advantages [1,2]. Especially, for outer space applications, lithium-ion batteries can effectively reduce the system weight of a spacecraft, thus improving the load efficiency of satellites. As a result, lithium-ion batteries have been used in the new satellites of the United States and European Space Agency (ESA) [3,4]. Moreover, it has been reported that lithium-ion batteries will become the third generation of satellite power storage batteries for China’s future space platform instead of NiMH batteries and NiCd batteries.
Because a lot of fatal failures of spacecraft are attributable to their power systems, especially the battery sub-systems [1,5], the reliability of lithium-ion batteries has attracted much attention in the electronics industry. With the challenges of safety management, charging and discharging control, and capacity degradation of lithium-ion battery, performance fade and remaining useful life (RUL) estimation have become two of the hottest but the most challenging issues in the fields of reliability engineering, aerospace system engineering, and power sources, etc. [6]. Prognostics and RUL estimation entail the use of the current and previous system states of a battery to predict the future states of the battery system. Reliable information (predicted) can be used to schedule repairs and maintenance in advance and provide an alarm before faults reach critical levels. Such efforts prevent malfunction and catastrophic failures.
On the other hand, compared with the traditional satellite platform, the self-management and safety/reliability management abilities are emphasized on the in-obit operations for future satellites and spacecraft. Under this technical condition, developing an intelligent battery management system (BMS) is necessary as the central component of a spacecraft. Along this line, the lithium-ion batteries must be monitored, state-aware, and RUL estimated in the new BMS, so that effective maintenance strategy and control and safety management can be achieved on the satellite platform in orbit [7]. Moreover, with the requirements on life extension, reliability testing and cycle life evaluation face great challenges on the ground for satellite applications. In particular, lifetime tests and data modeling and analysis should be carefully addressed for reliability evaluation and system integration.
Recently, a lot of research work has been focused on lithium-ion battery degradation modeling and RUL prediction. Saha et al. study the battery RUL prediction and the uncertainty representation and management with particle filter (PF) algorithm (using the empirical degradation model to build state transition equation [6,8]). Regarding the development of computational intelligence and machine learning, research work on data-driven prognostics has been focused on the use of flexible models, such as various types of neural networks (NNs) [9], Support Vector Machine (SVM), and Relevance Vector Machine (RVM) [8] for battery RUL forecasts. To complement the capabilities of different approaches, the fusion prognostics method becomes a main research direction for improving the performance in battery RUL prediction. In order to achieve a fusion prognostic strategy, Kozlowski [10] proposes a data-driven RUL prediction approach by combining ARMA model, neural networks and fuzzy logic. Liu et al. [11] develop a fusion prognostic framework to increase the system long-term prediction performance. An ensemble model for predicting the RUL of a lithium-ion battery is introduced by combining a fused empirical exponential and polynomial regression model and a PF algorithm [12].
To predict the future system states, these data-driven methods rely on past degradation patterns of similar systems. The prediction accuracy depends on the amount of historical data and the knowledge about the data [13]. A major disadvantage of data-driven methods is that the prognostic process is usually opaque and such models are often invisible to the users. As a result, ensuring the stability and adaptability of parameters becomes quite challenging in dealing with these data-driven approaches. Another limitation of these methods is that the capacity or internal resistance is often used as the health indicator (HI) of a battery for degradation modeling and RUL estimation. However, for on-line or in-orbit applications, e.g., electric vehicles and satellites, it is very difficult to perform capacity measurement or monitoring. This is because the batteries might not be discharged from 100% SOC to 0% SOC or charged from 0% SOC to 100% SOC, and such internal state variables are inaccessible via general sensors.
With aforementioned problems and challenges, in this paper, a novel indirect HI parameter is extracted based on the charging and discharging voltage, current, and time for on-line degradation analysis. The goal is to achieve a simple and reliable framework for on-line RUL estimation for satellite lithium-ion batteries. Furthermore, this research also presents an optimized ensemble Echo State Networks (ESN) based data-driven algorithm to ensure high RUL prediction precision and stability.

2. Framework for Satellite Battery Remaining Cycle Life Estimation

2.1. Novel HI Extraction with Monitoring Parameters

Generally, to realize the State-of-Health (SOH) estimation and the RUL prognostics of a lithium-ion battery, the capacity is often adopted as an HI to represent the degradation state [14,15]. However, the capacity cannot be measured on-line, and, thus in most industrial applications, it is estimated using an ampere-hour method with the electric current and voltage. Such an estimation is time-consuming and has a low accuracy, and only one capacity (maximum charging capacity) value can be obtained in each cycle. From a degradation modeling perspective, the capacity data samples are usually insufficient. Thus, the SOH estimation and RUL prognostics should be conducted with the monitoring parameters, such as charging and discharging voltages, current and temperature, for actual industrial requirements. Therefore, to achieve indirectly degradation modeling and RUL predicting with monitoring voltage, electric current is an important factor for industrial application. Moreover, with this indirect method, we can realize on-line modeling and RUL prediction.
Considering lithium-ion batteries of new cell phones/laptops, the operating time will be maximal after a full charge at the very beginning. However, the operating time (discharging time period) after subsequent full charge becomes shorter and shorter due to the charging and discharging process. This is because that the maximum charging capacity fades with the cyclic charge/discharge. Meanwhile, there is a certain relationship between the discharging time period and the capacity of lithium-ion batteries.
The phenomenon and related analysis indicate that the time interval of equal discharging voltage difference (TIEDVD) can be used as an HI to measure the capacity degradation in each charging and discharging cycle. The HI extraction for a charging and discharging cycle is shown in Figure 1.
Figure 1. HI extraction with time interval and discharging voltage difference.
Energies 06 03654 g001
The TIEDVD parameter is defined as the time interval corresponding to a certain discharging voltage difference. The indicated degradation based on the TIEDVD parameter is similar to that of battery capacity as well as RUL. In particular, the time interval corresponding to certain discharging voltage difference in the ith cycles is:
t i _ T I E D V D ( H I ) = | t V M a x t V M i n | ,     i = 1 , 2 , ... , k
and the HI series can be expressed as:
t T I E D V D = { t 1 _ T I E D V D , t 2 _ T I E D V D , ... , t k _ T I E D V D }
The three-step HI extraction framework is as follows:
Step 1.
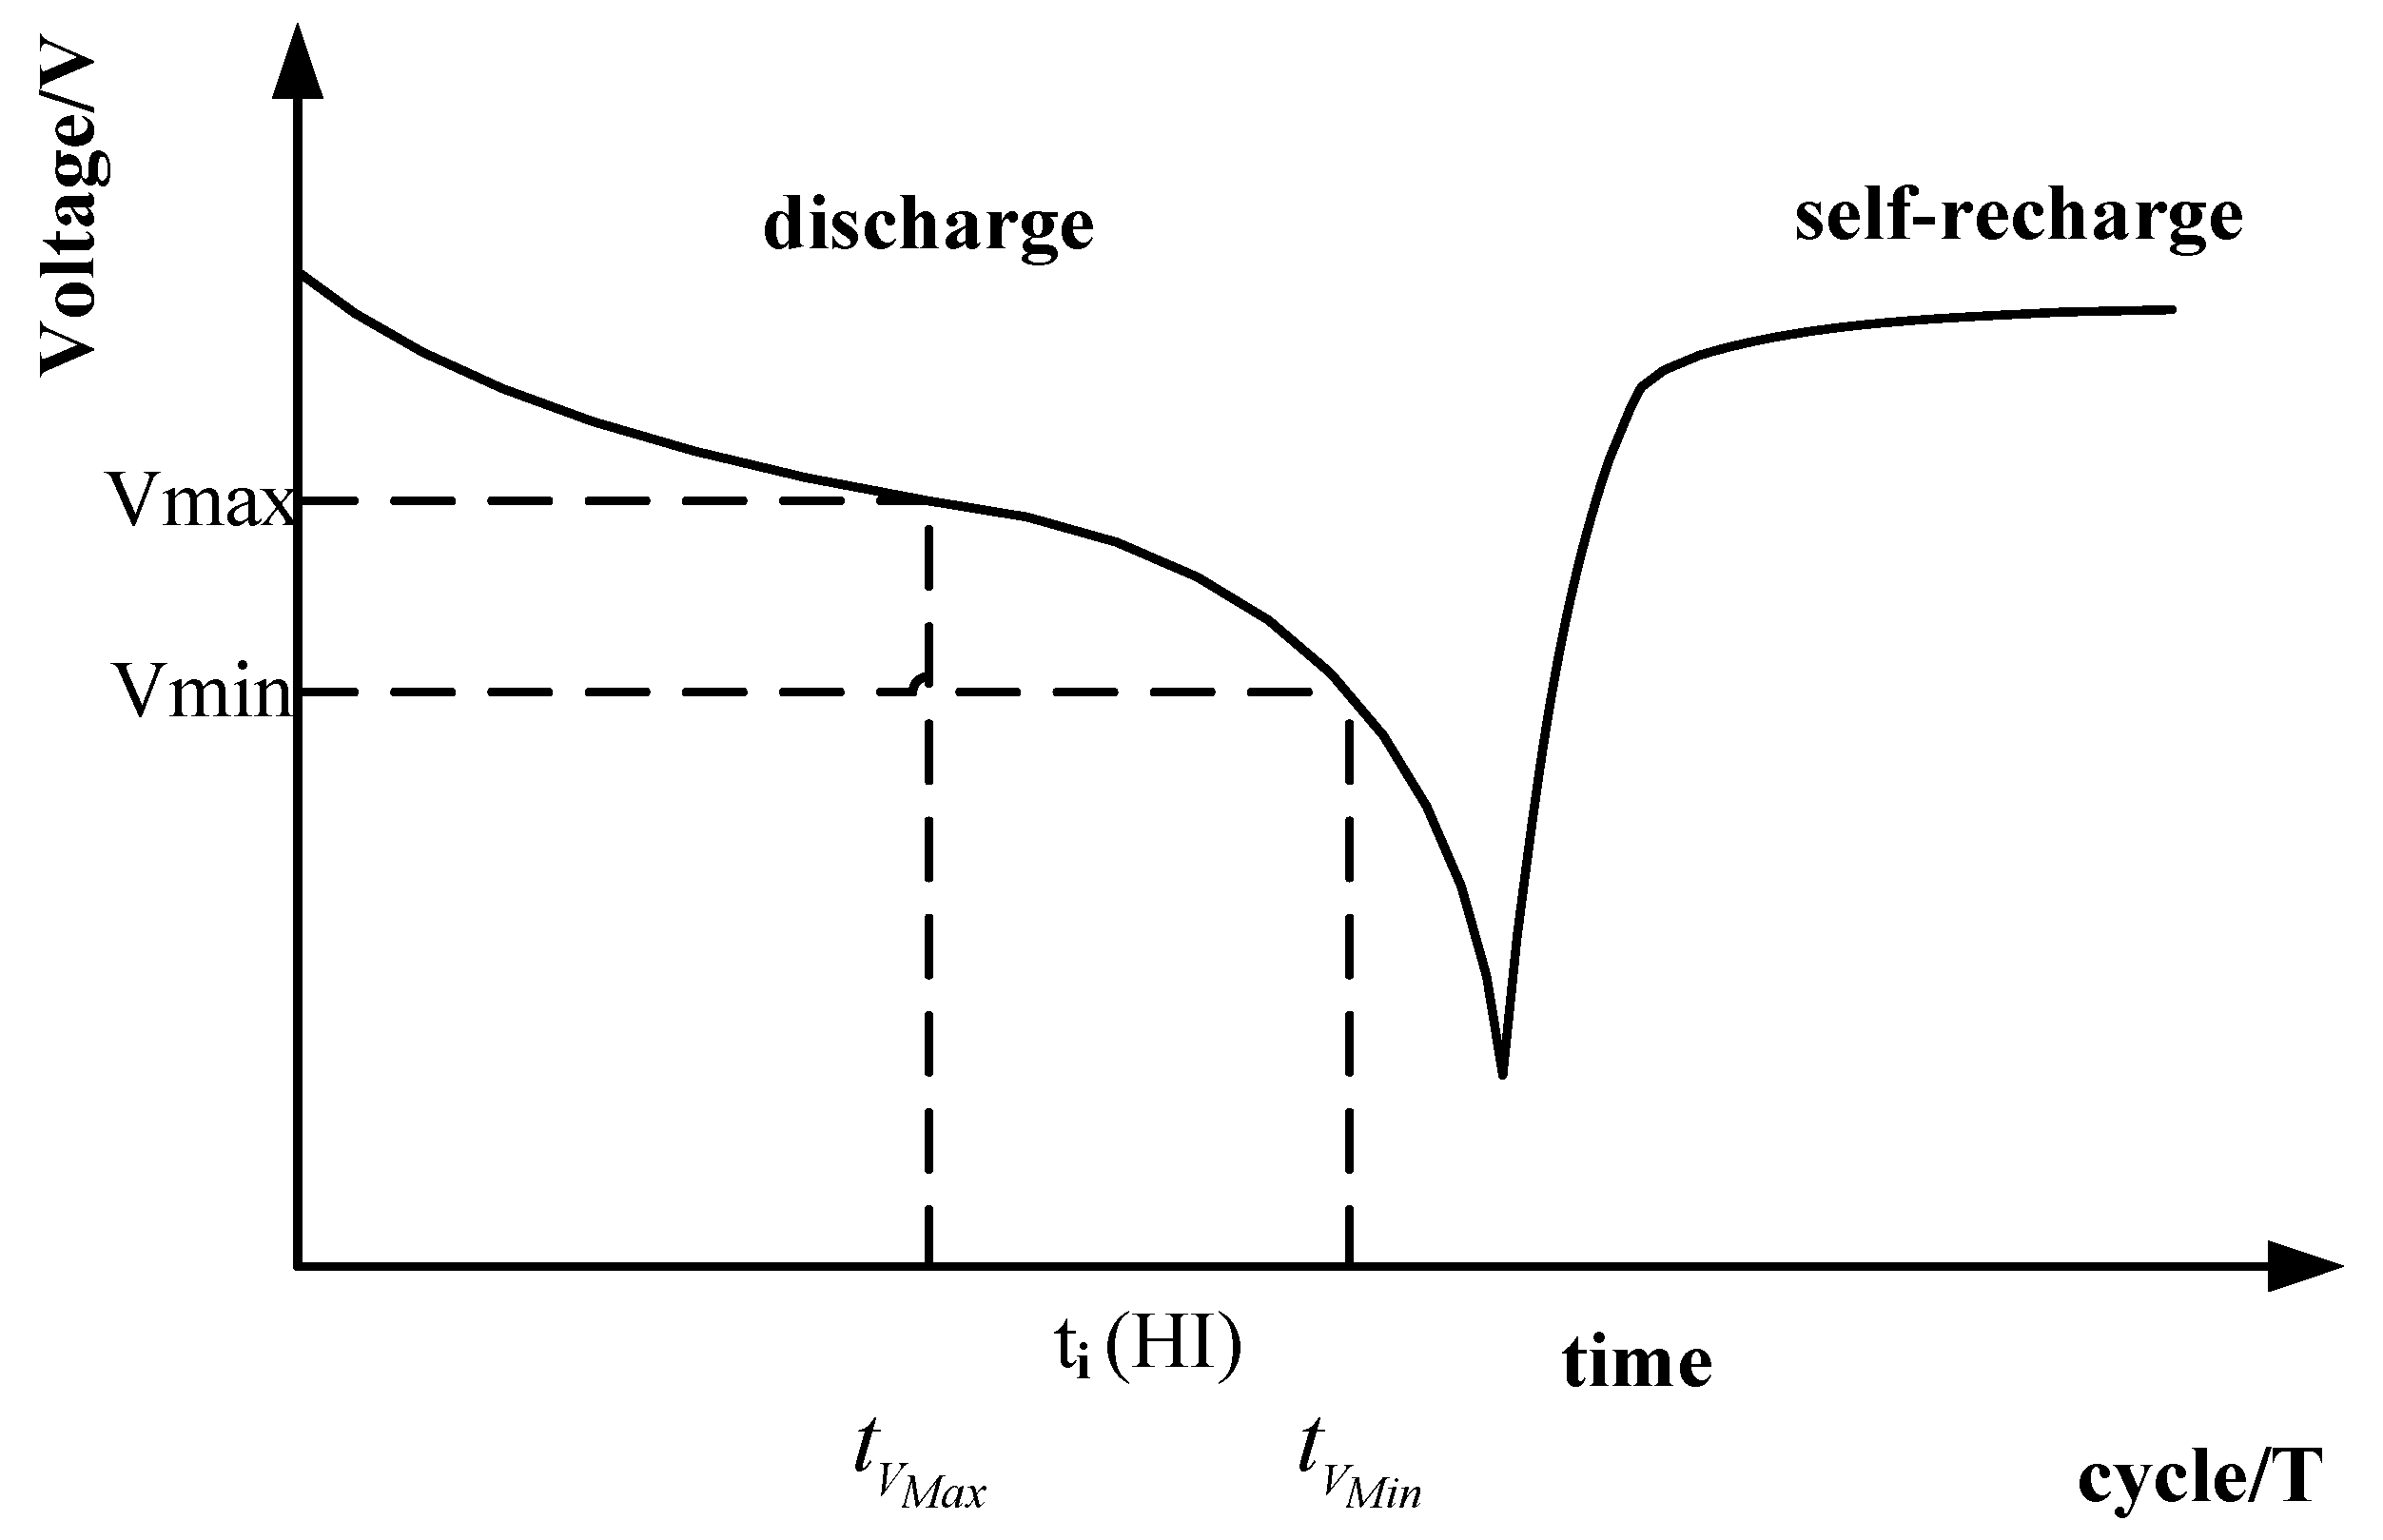
Extract the monitoring voltage, current, and cycle index in each charging/discharging cycle under the constant-voltage and restricted-current mode;
Step 2.
Define the discharging voltage interval (Vmax and Vmin) and extract the health indicating time series. Here, Vmax (Vmin) is the maximum (minimum) voltage value used as the starting (ending) signal to count the number of discharging time intervals. Thus, the time interval corresponding to discharging voltage between Vmax and Vmin can be obtained as shown in Equation (1);
Step 3.
Convert the time interval difference corresponding to the VmaxVmin, to obtain the TIEDVD series in each cycle as shown in Equation (2).
To verify the effectiveness of using the TIEDVD HI for battery degradation quantification, we perform the Grey Correlation Analysis (GCA) [16] to compare and determine the similarity between TIEDVD and battery RUL (and battery capacity). Thus, the TIEDVD HI can be extracted from the battery on-line monitoring time series stored in the data file. The evaluation process with GCA algorithm can be described as follows:
Step 1.
Prepare the verified series and referred series. The verified series is the constructed TIEDVD series defined as Xi = {xi(k)|k = 1,2,…,n}, i = 1,2,…,m, and the referred series is the capacity series defined as Y = {y(k)|k = 1,2,…,n} (n is the length of series and m is the number of verified series);
Step 2.
Compute the correlation coefficient. The correlation coefficient of y(k) and xi(k) is:
ξ i ( k ) = min i   min k | y ( k ) x i ( k ) | + ρ   max i   max k | y ( k ) x i ( k ) | | y ( k ) x i ( k ) | + ρ   max i   max k | y ( k ) x i ( k ) |
where ρ > 0 is the identification coefficient. A small ρ indicates high identification ability, and the general range of ρ is between 0 and 1. Generally, high identification ability can be obtained when ρ ≤ 0.5463. As a result, ρ is usually set to be 0.5;
Step 3.
Compute the correlation level. The correlation level ri is defined as:
r i = 1 n k = 1 n ξ i ( k ) ​​​
Note that the range of the correlation level is between 0 and 1, and the correlation level increases as ri approaches 1.

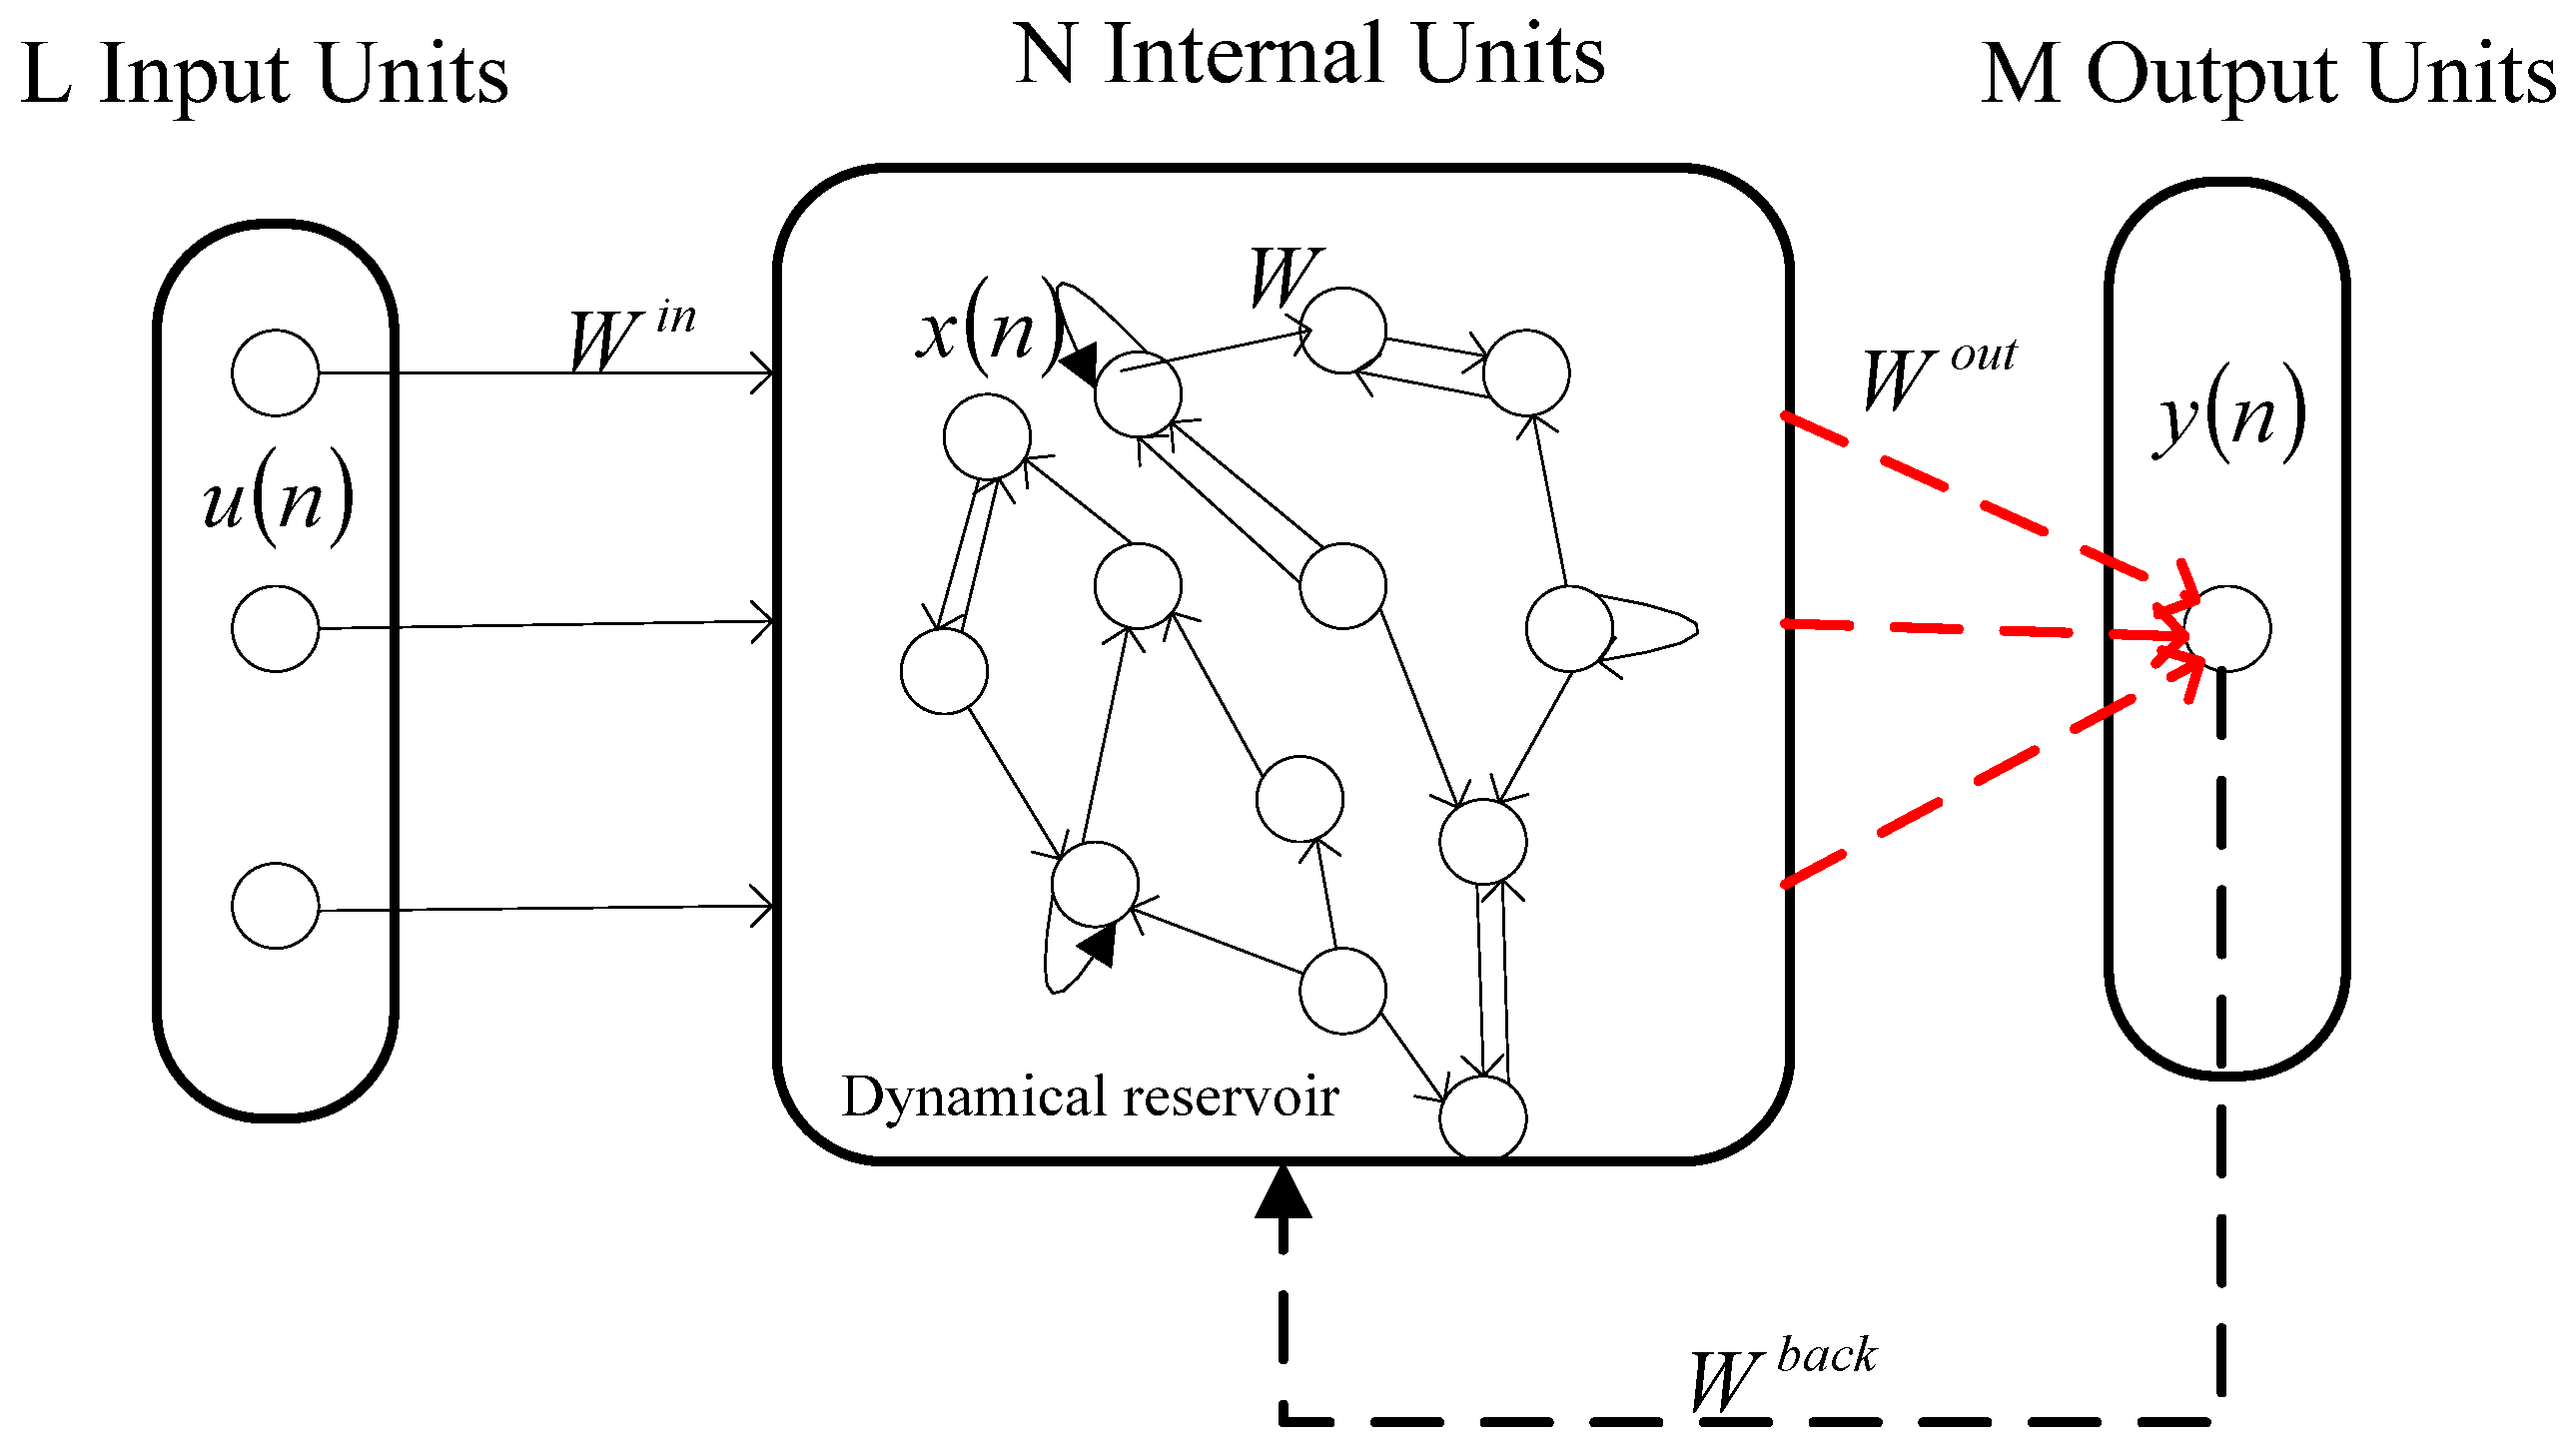
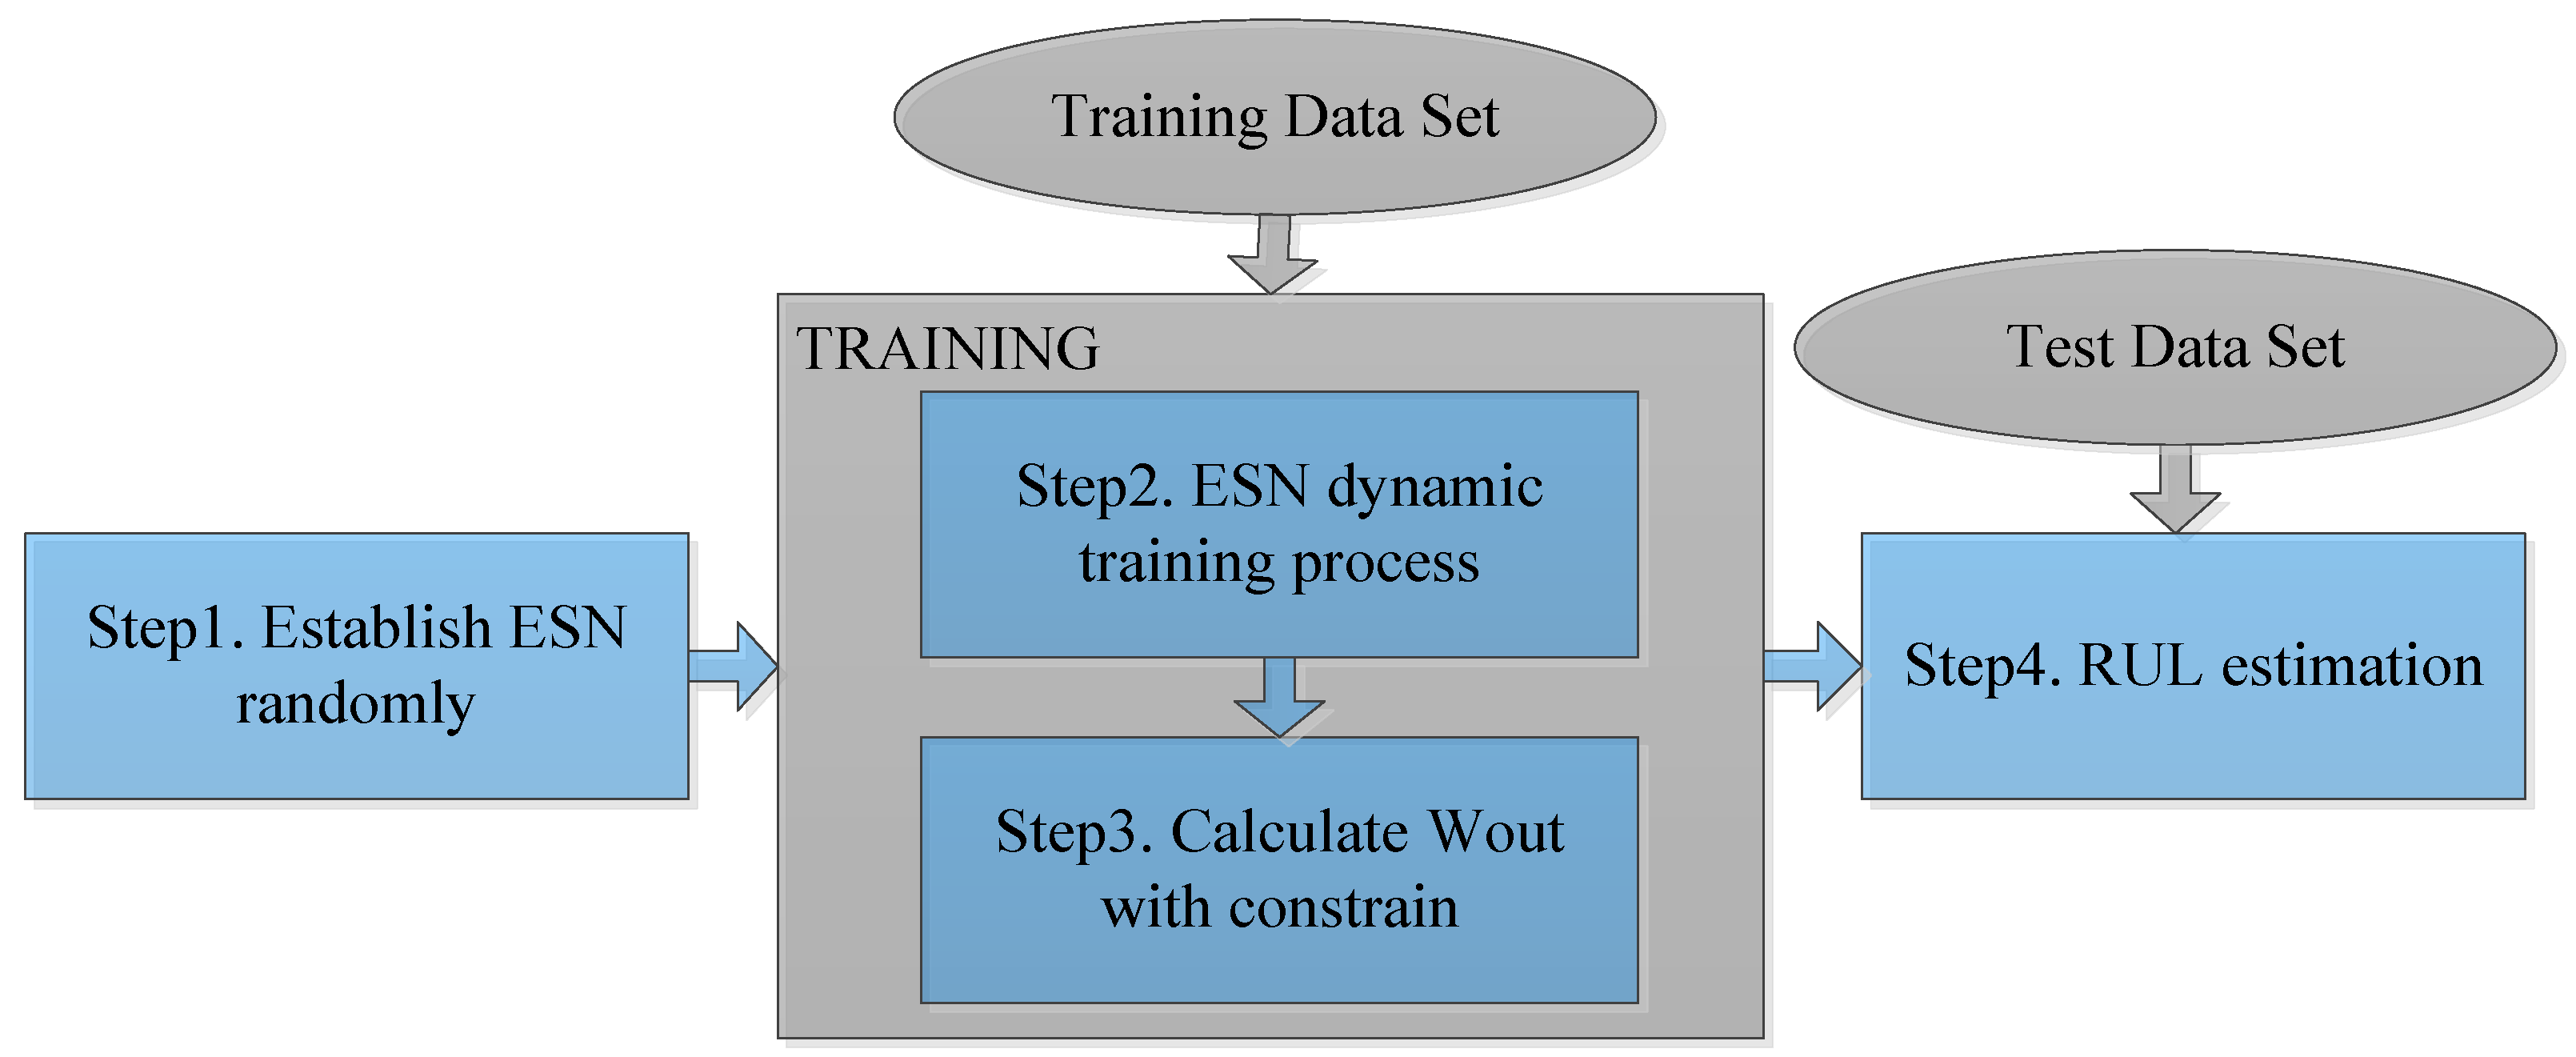
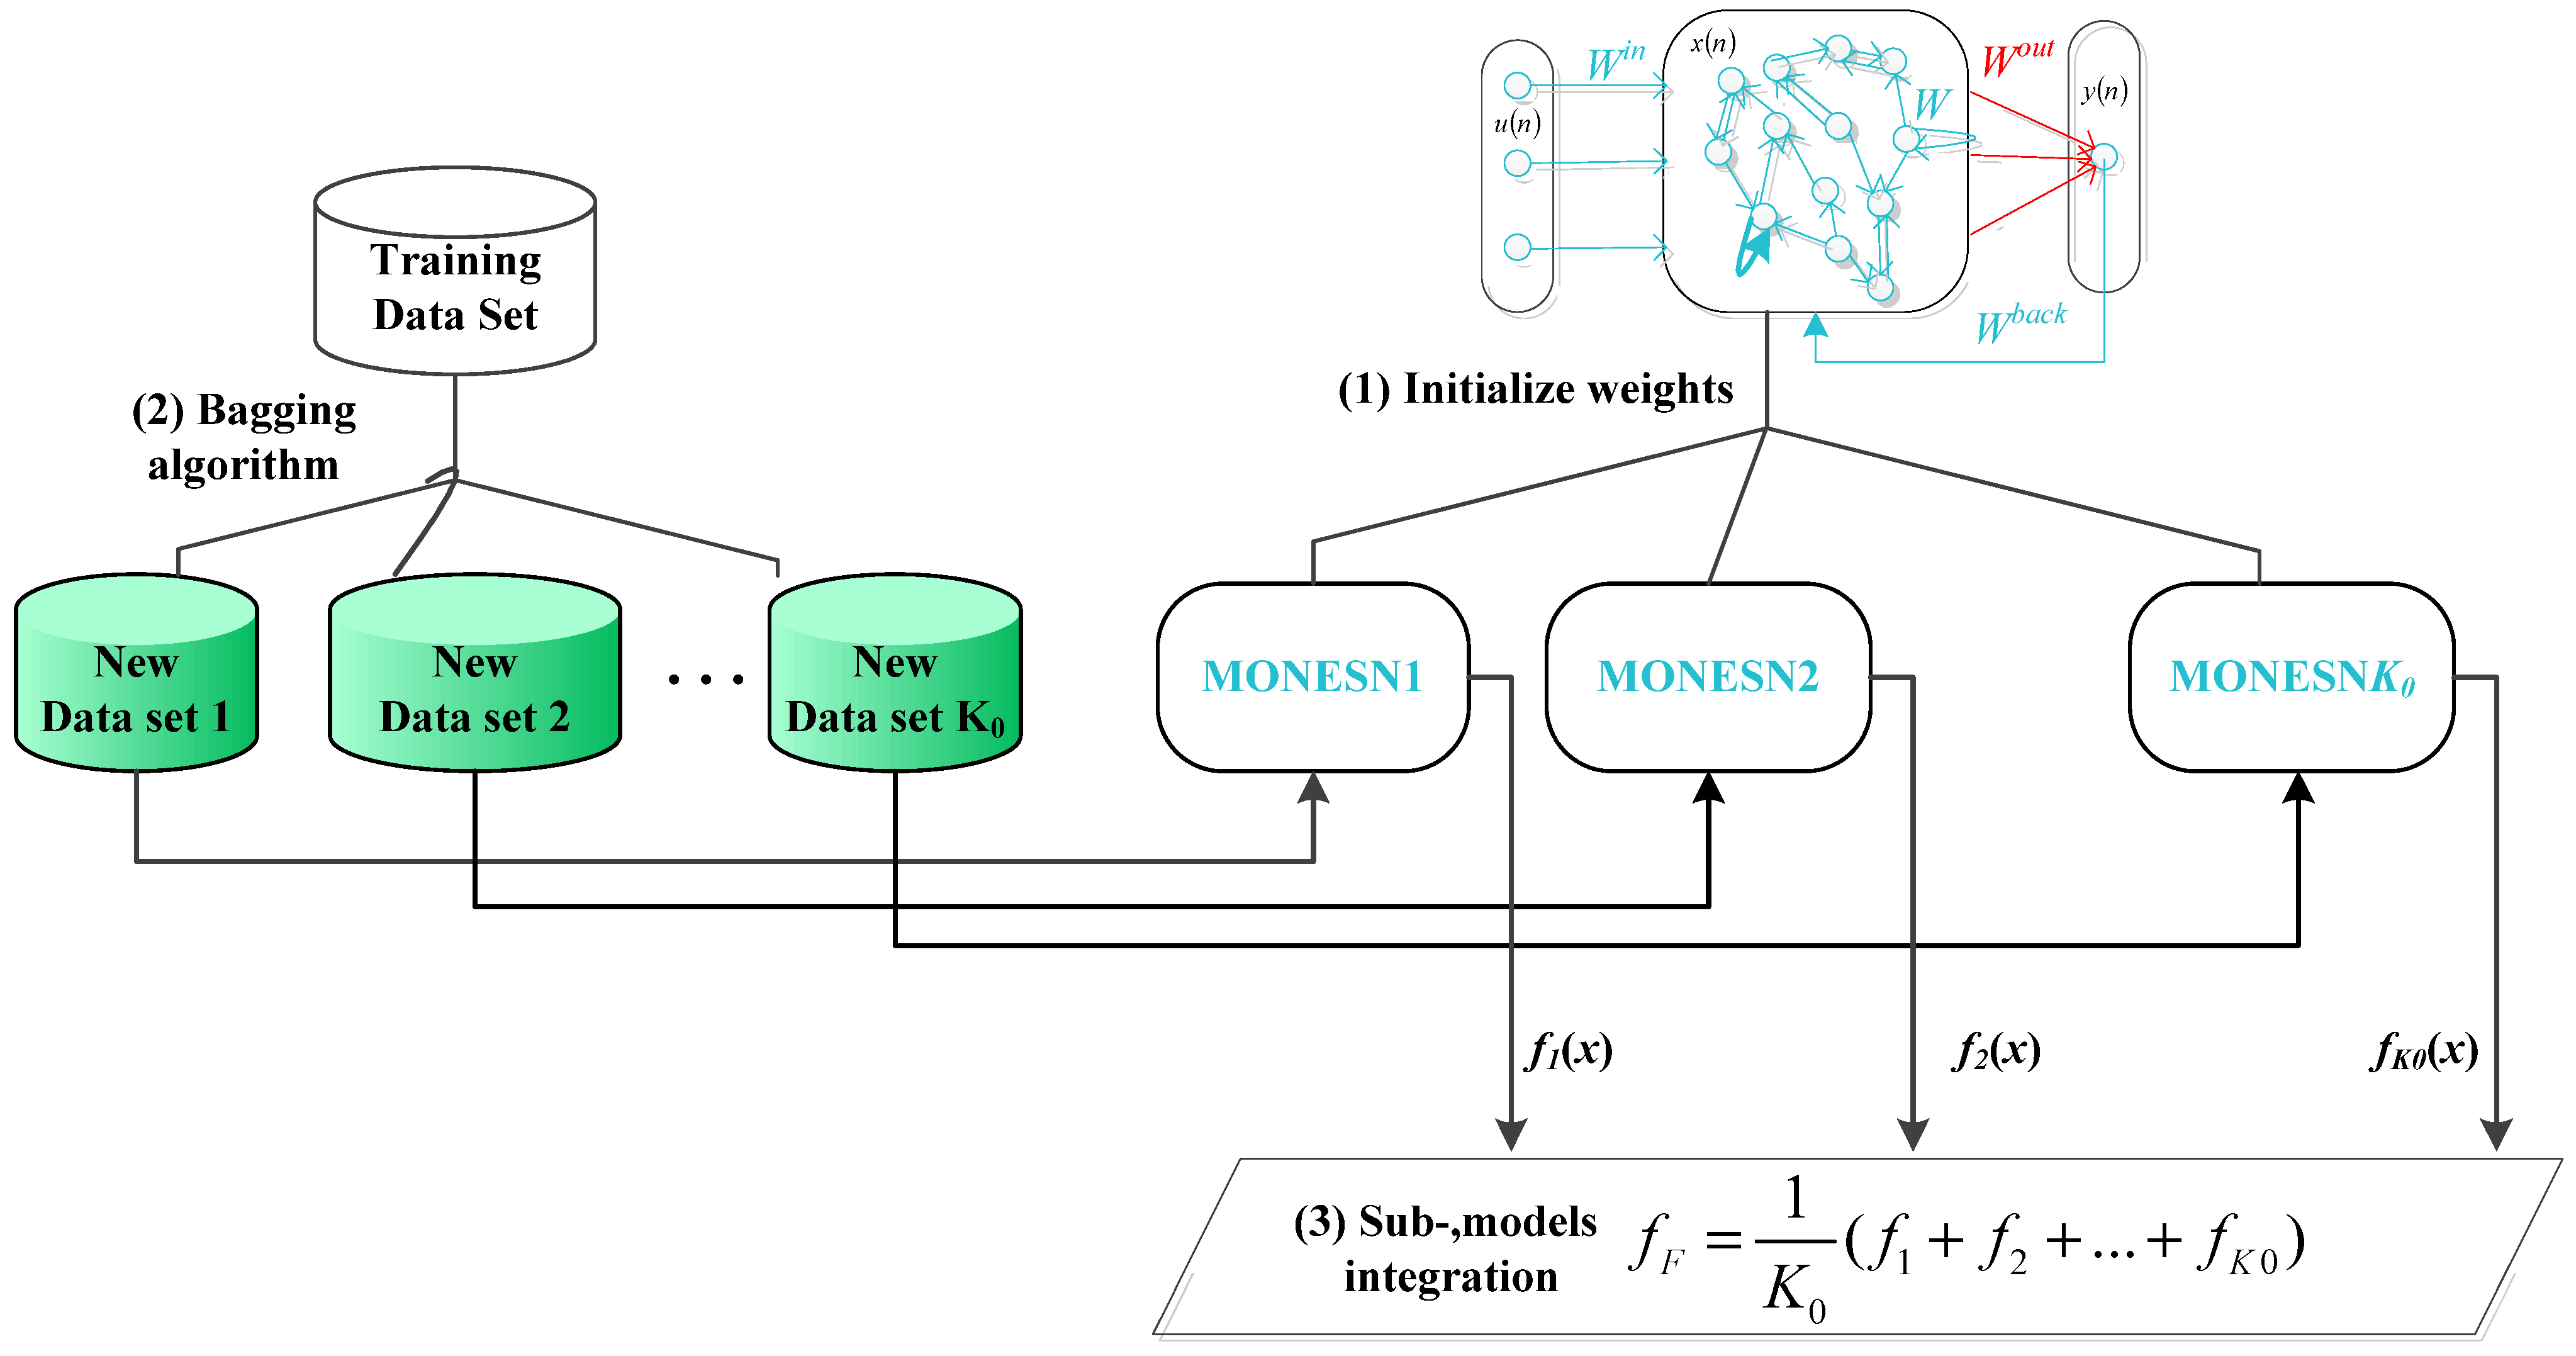
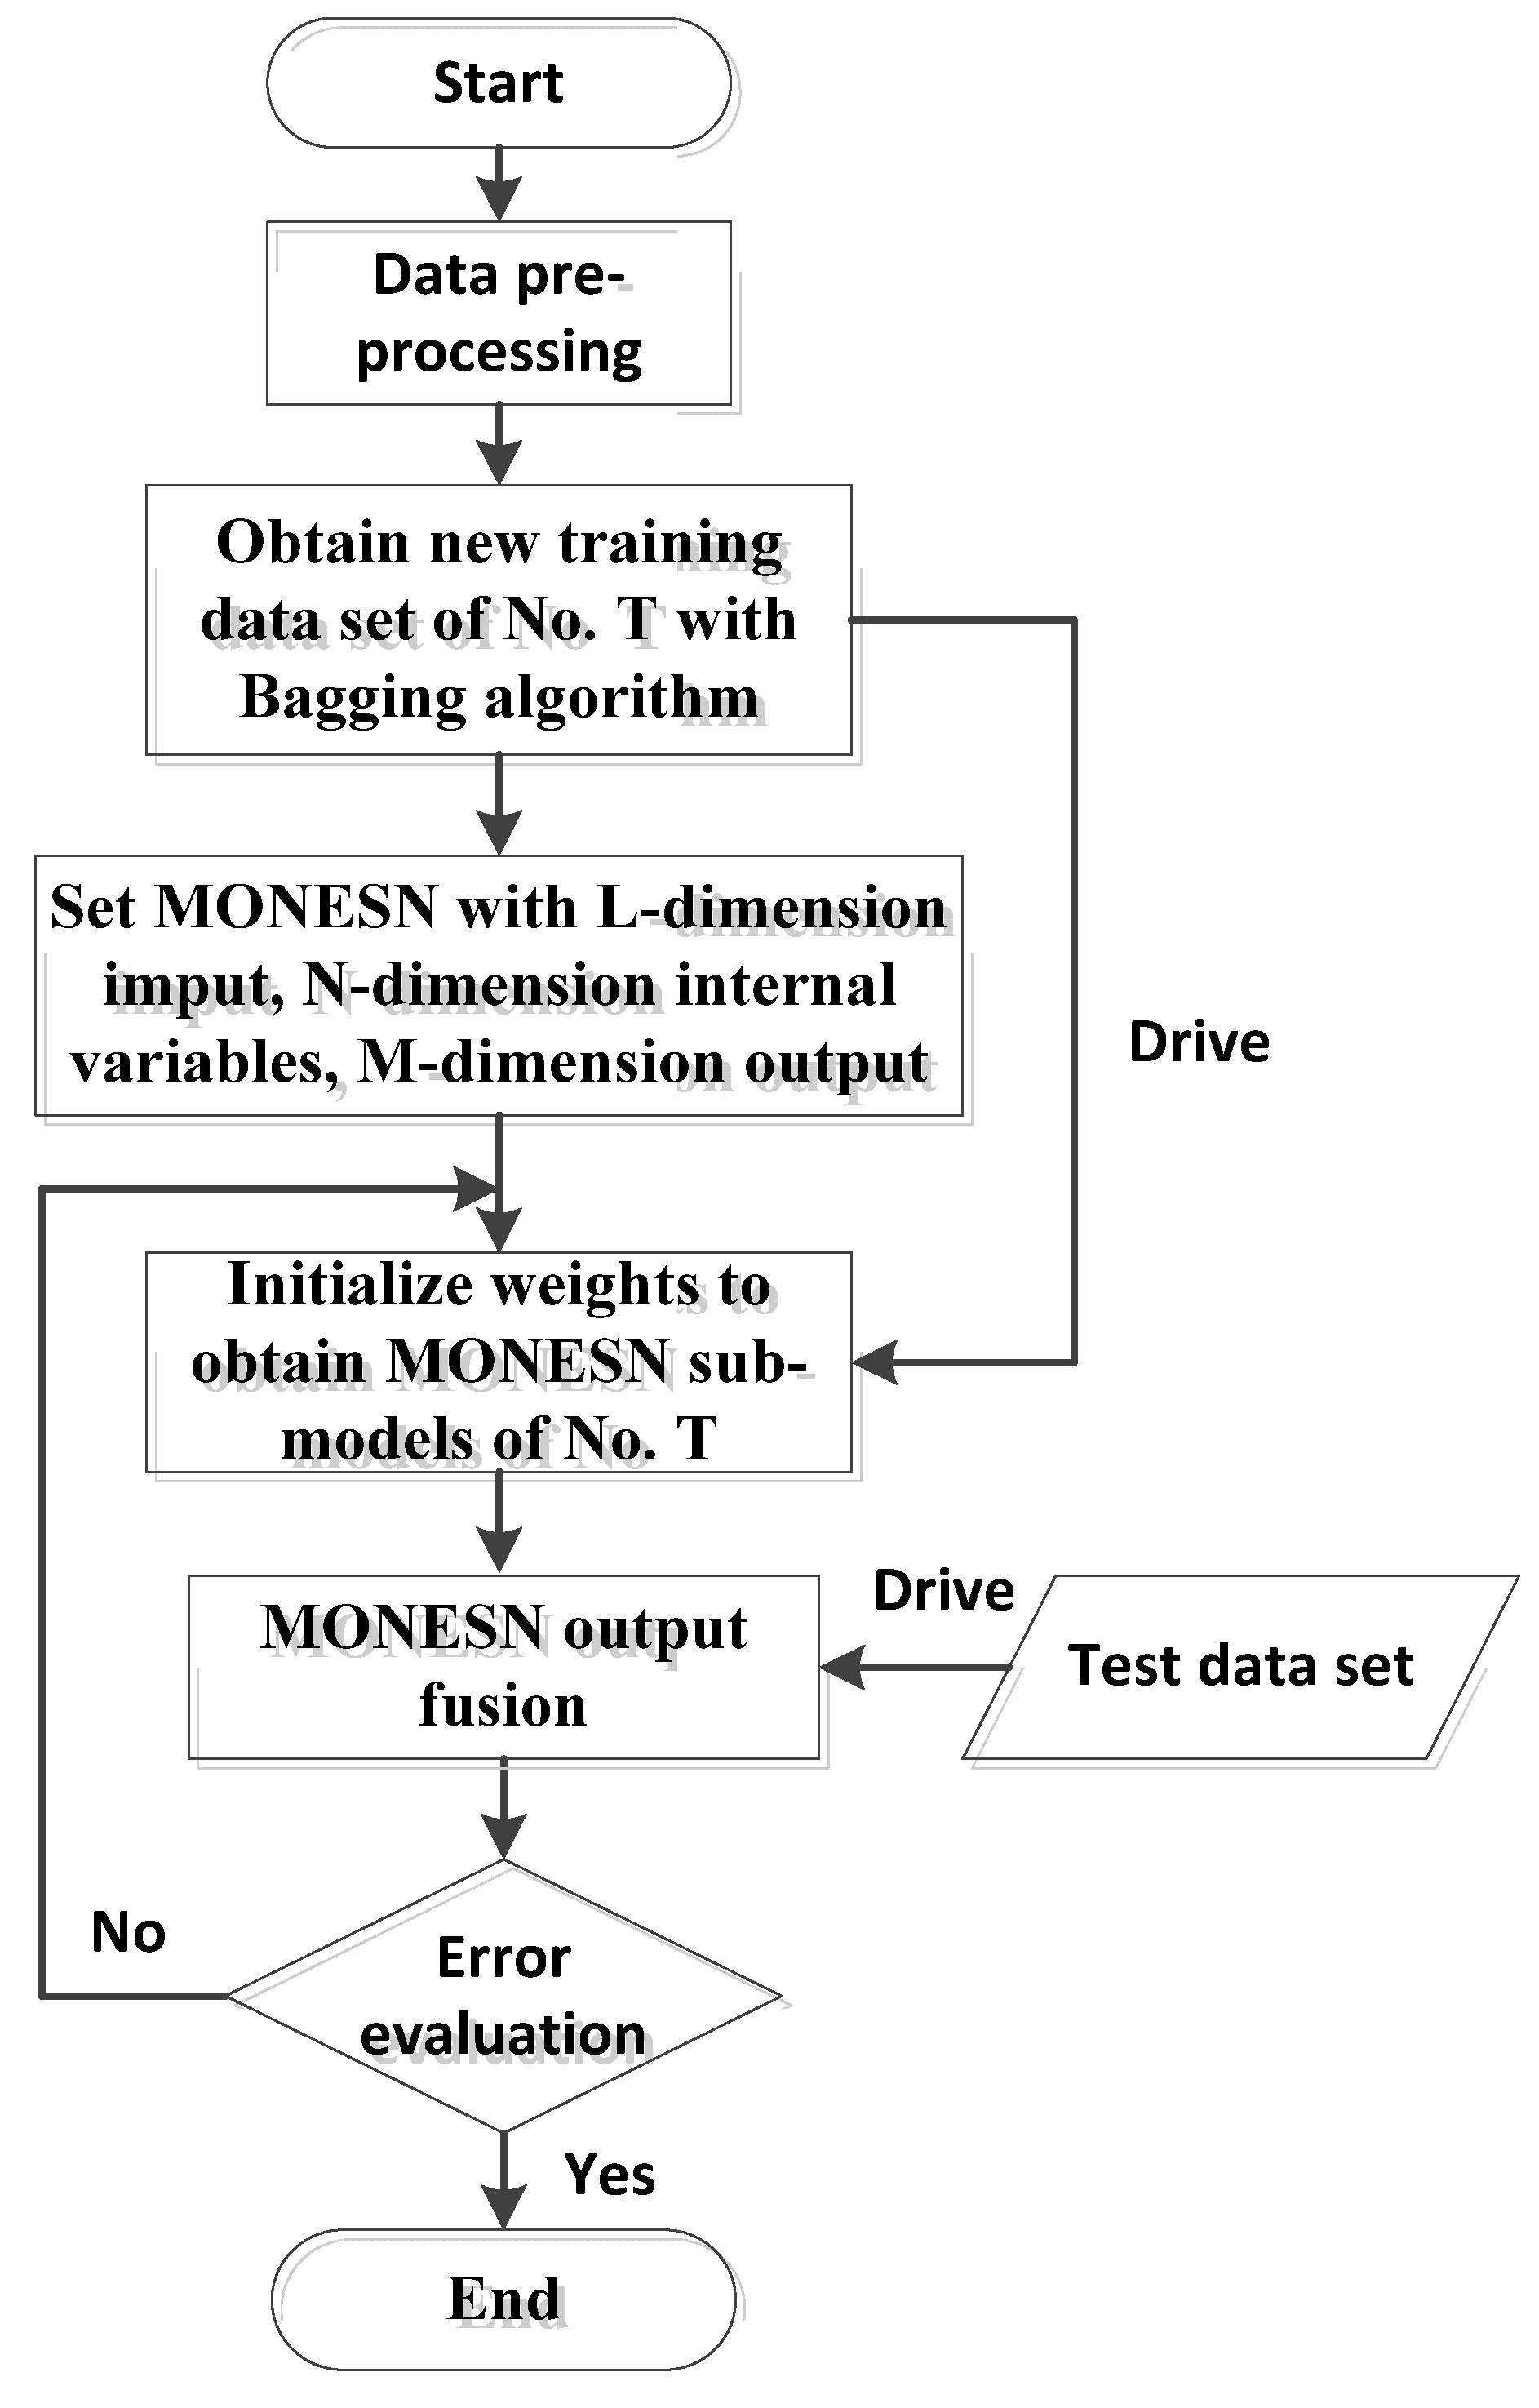
2.2. En_MONESN for RUL Estimation

We assume that a discrete Echo State Networks (ESN) [17,18] has L input units, N internal processing units and M output units. At a time instant k, the input units, the internal processing units, and the output units are expressed as u(k) = (u1(k),…,uL(k)), x(k) = (x1(k),…,xN(k)), and y(k) = (y1(k),…,yM(k), respectively.
The update equation of the internal processing units is given by:
x ( k ) = f ( W i n u ( k ) + W x ( k 1 ) + W b a c k y ( k 1 ) )
where f = (f1,…,fL) is the activation function (usually a sigmoid function, e.g., tanh) of an internal neuron, Win = (wijin) is an N × L dimensional input weight matrix, W = (wij) is an N × N dimensional internal connection weight matrix, and Wback = (wijback) is an N × M dimensional feedback weight matrix that returns the output of ESN back to the internal processing units. For simplicity, Wback is often assumed to be zero.
The output equation of ESN is given by:
y ( k ) = f o u t ( W o u t ( u ( k ) , x ( k ) , y ( k 1 ) )
where fout = (fout1,…, foutM) is the output transition. The output layer is usually linear and Equation (6) shows a linear output transition, where Wout = (wijout) is M × (L + N + M) dimensional output weight matrix. Assuming Wback = 0, then the Equation (6) becomes:
y ( k ) = W o u t ( u ( k ) , x ( k ) )  
As shown in Figure 2, L-dimensional input unit, N-dimensional internal state unit and M-dimensional output unit are included in a standard ESN structure. If we assume Wback = 0, the relationship between the input and output units can be expressed in the following equation:
y i ( x ) = j = 1 L w i j o u t u j + t = 1 N w i * ( L + t ) o u t tanh ( k = 1 L w t k i n u k + k = 1 N w t k x k ) θ t   ( i = 1 , ... , M )
Figure 2. The architecture of ESN (the dashed line represents the output weights that need to be trained).
Energies 06 03654 g002
In order to ensure that the output unit yi (i [1,…,M]) is monotonically increasing in the value of each input unit uj (j [1,…,L]) of ESN [19,20], we superimpose the following condition:
y i u j = w i j o u t + t = 1 N w j * ( L + t ) o u t ( 1 θ t 2 ) w t j i n >0
Since the derivative of hyperbolic tangent must be positive, i.e., ( 1 θ t 2 ) >0 , the sufficient condition to guarantee the monotonic relationship between the output unit yi and the input unit uj is:
y i u j = w i j o u t + t = 1 N w j * ( L + t ) o u t w t j i n >0 , i , j
Equation (10) contains two terms: one is the output weight wijout that connects the output unit yi and the input unit uj, and the other one is t = 1 N w j * ( L + t ) o u t w t j i n which is the sum of the product of the output weights wj(L + t)out (connecting the output unit yi and the internal state xt (t [1,…,N]))and the input weights w t j i n (connecting xt and uj). If the input weights and the output weights of ESN satisfy Equation (8), we can ensure that the output unit yi monotonically increases as the value of input unit uj increases.
Similarly, the sufficient condition to ensure that the output unit yi is monotonically decreasing in the value of input unit uj is given by:
y i u j = w i j o u t + k = 1 N w j * ( L + k ) o u t w k i i n <0 , i , j
Then the output unit yi and the input unit uj of ESN will have monotonic relationships by adding constrains [Equation (10) or Equation (11)] to the learning process.
Next we consider how to add the inequality constraints to the ESN learning process. First, traditional ESN adopts a least square algorithm to train the output weights. The training principle is to obtain the least square error of training sample as shown in Equation (12):
min W o u t 1 2 ( y W o u t x ) 2 = min W o u t 1 2 ( y T x T ( W o u t ) T ) 2  
where y is the true value of function and y' = Wout (u, x) is the output unit of the ESN. As mentioned before, only the output weights need to be trained in the ESN. This simplifies the training process of ESN a lot. The symbols u and x are input unit and internal state unit, respectively. Equation (12) can be regarded as an unconstrained quadratic programming. Adding the inequality constraint Equation (10) or Equation (11) to Equation (12), we can get a constrained quadratic programming. Equation (13) guarantees the monotonically increasing relationship between input and output units:
      min W o u t ( y W o u t ( u , x ) ) 2 s . t .    w i j o u t + t = 1 N w j * ( L + t ) o u t w t j i n >0
Equation (14) ensures the monotonically decreasing relationship between input and output unit:
      min W o u t ( y W o u t ( u , x ) ) 2 s . t .    w i j o u t + t = 1 N w j * ( L + t ) o u t w t j i n <0
We assume that the input sequence (u(n), n = 1,2,…,T) and output sequence (yd(n−1), n = 1,2,…,T) of MONESN are known. Then the input and output sequences should be divided into training sequence and testing sequence. Figure 3 shows the four steps for estimating RUL with MONESN: establish the network randomly, train the network dynamically, calculate the output weights under constraints, and estimate RUL.
Figure 3. The scheme of RUL estimation process with the proposed MONESN algorithm.
Energies 06 03654 g003
To further improve the stability of the MONESN as well as satisfy the high precision requirement for a specific MONESN, we introduce an En_MONESN (ensemble MONESN) based RUL prognostic framework. This framework overcomes the challenge in parameters determination for the MONESN. Based on the different parts of the training and modeling data set, various MONESN sub-models can be obtained. A more stable and robust ESN based RUL prognostic framework is fused with the ensemble learning of the resulting sub-models. The framework and flow chart of the En_MONESN algorithm are shown in Figure 4 and Figure 5, respectively.
First, the ESN is a new type of recurrent neural networks which adopts large scale sparse connection (instead of the hidden layers of the classical ANN). To promote the variety of the ESN sub-models, randomly initialized input weights and internal connection weights of the reservoir can achieve different parameters settings.
Next, because the learning algorithm of ANN is unstable, we can obtain multiple new training data sets by applying the bagging algorithm (with re-sampling) to the raw training data set [21,22]. Using these new data sets to train the multiple MONESN sub-models can ensure the diversity of MONESN models.
Finally, to make the mean errors of the sub-models approach zero, we can adjust the free parameters of the ESN sub-models. The ensemble output generalized errors can be decreased significantly by the ensemble of sub-models; on the other hand, the prediction precision of single ESN model can be reduced in the ensemble model base.
Figure 4. Scheme of En_MONESN modeling.
Energies 06 03654 g004
Figure 5. Flowchart of En_MONESN modeling.
Energies 06 03654 g005

3. Experiments and Test Data

The lithium-ion battery data set of satellite is composed of three single batteries (rated capacity is 10 Ah). To measure the performance and the capacity fade process, the lithium-ion batteries are tested under room temperature:
(1)
The test is conducted by charging and discharging the batteries (simulating the condition of LEO orbit);
(2)
The 30-Ah batteries (3 × 10 Ah) are first discharged with 0.6 C for 30 min, and then charged with 0.3 C until the voltage reaches 4.1 V and finally charged with constant charging voltage. The total charging time is 60 min;
(3)
The charging depth is 30% DOD and the capacity of the batteries is measured every 500 cycles;
(4)
The parameters of voltage, current, etc. are sampled every 30 s and we store the measured data into test file.
The voltage and the current of lithium-ion batteries are monitored every 30 s. The capacity and internal resistance are measured every 500 cycles. In this experiment, the battery data set contains measured parameters for 10,500 cycles of the satellite lithium-ion batteries. Thus, 22 capacity data samples are included in the data set (see Figure 6). In actual satellite platform, the direct HIs, such as capacity and internal resistance, are hard to measure and monitor. So the indirect HI of TIEDVD series is quite valuable to the application which is lack of capacity data samples. Thus, our motivation is to study lithium-ion battery degradation modeling and RUL estimation through parameters that can be directly measured, such as charging and discharging voltage, current, etc.
Figure 6. Raw capacity data samples of lithium-ion batteries for satellite.
Energies 06 03654 g006

4. Results and Discussion

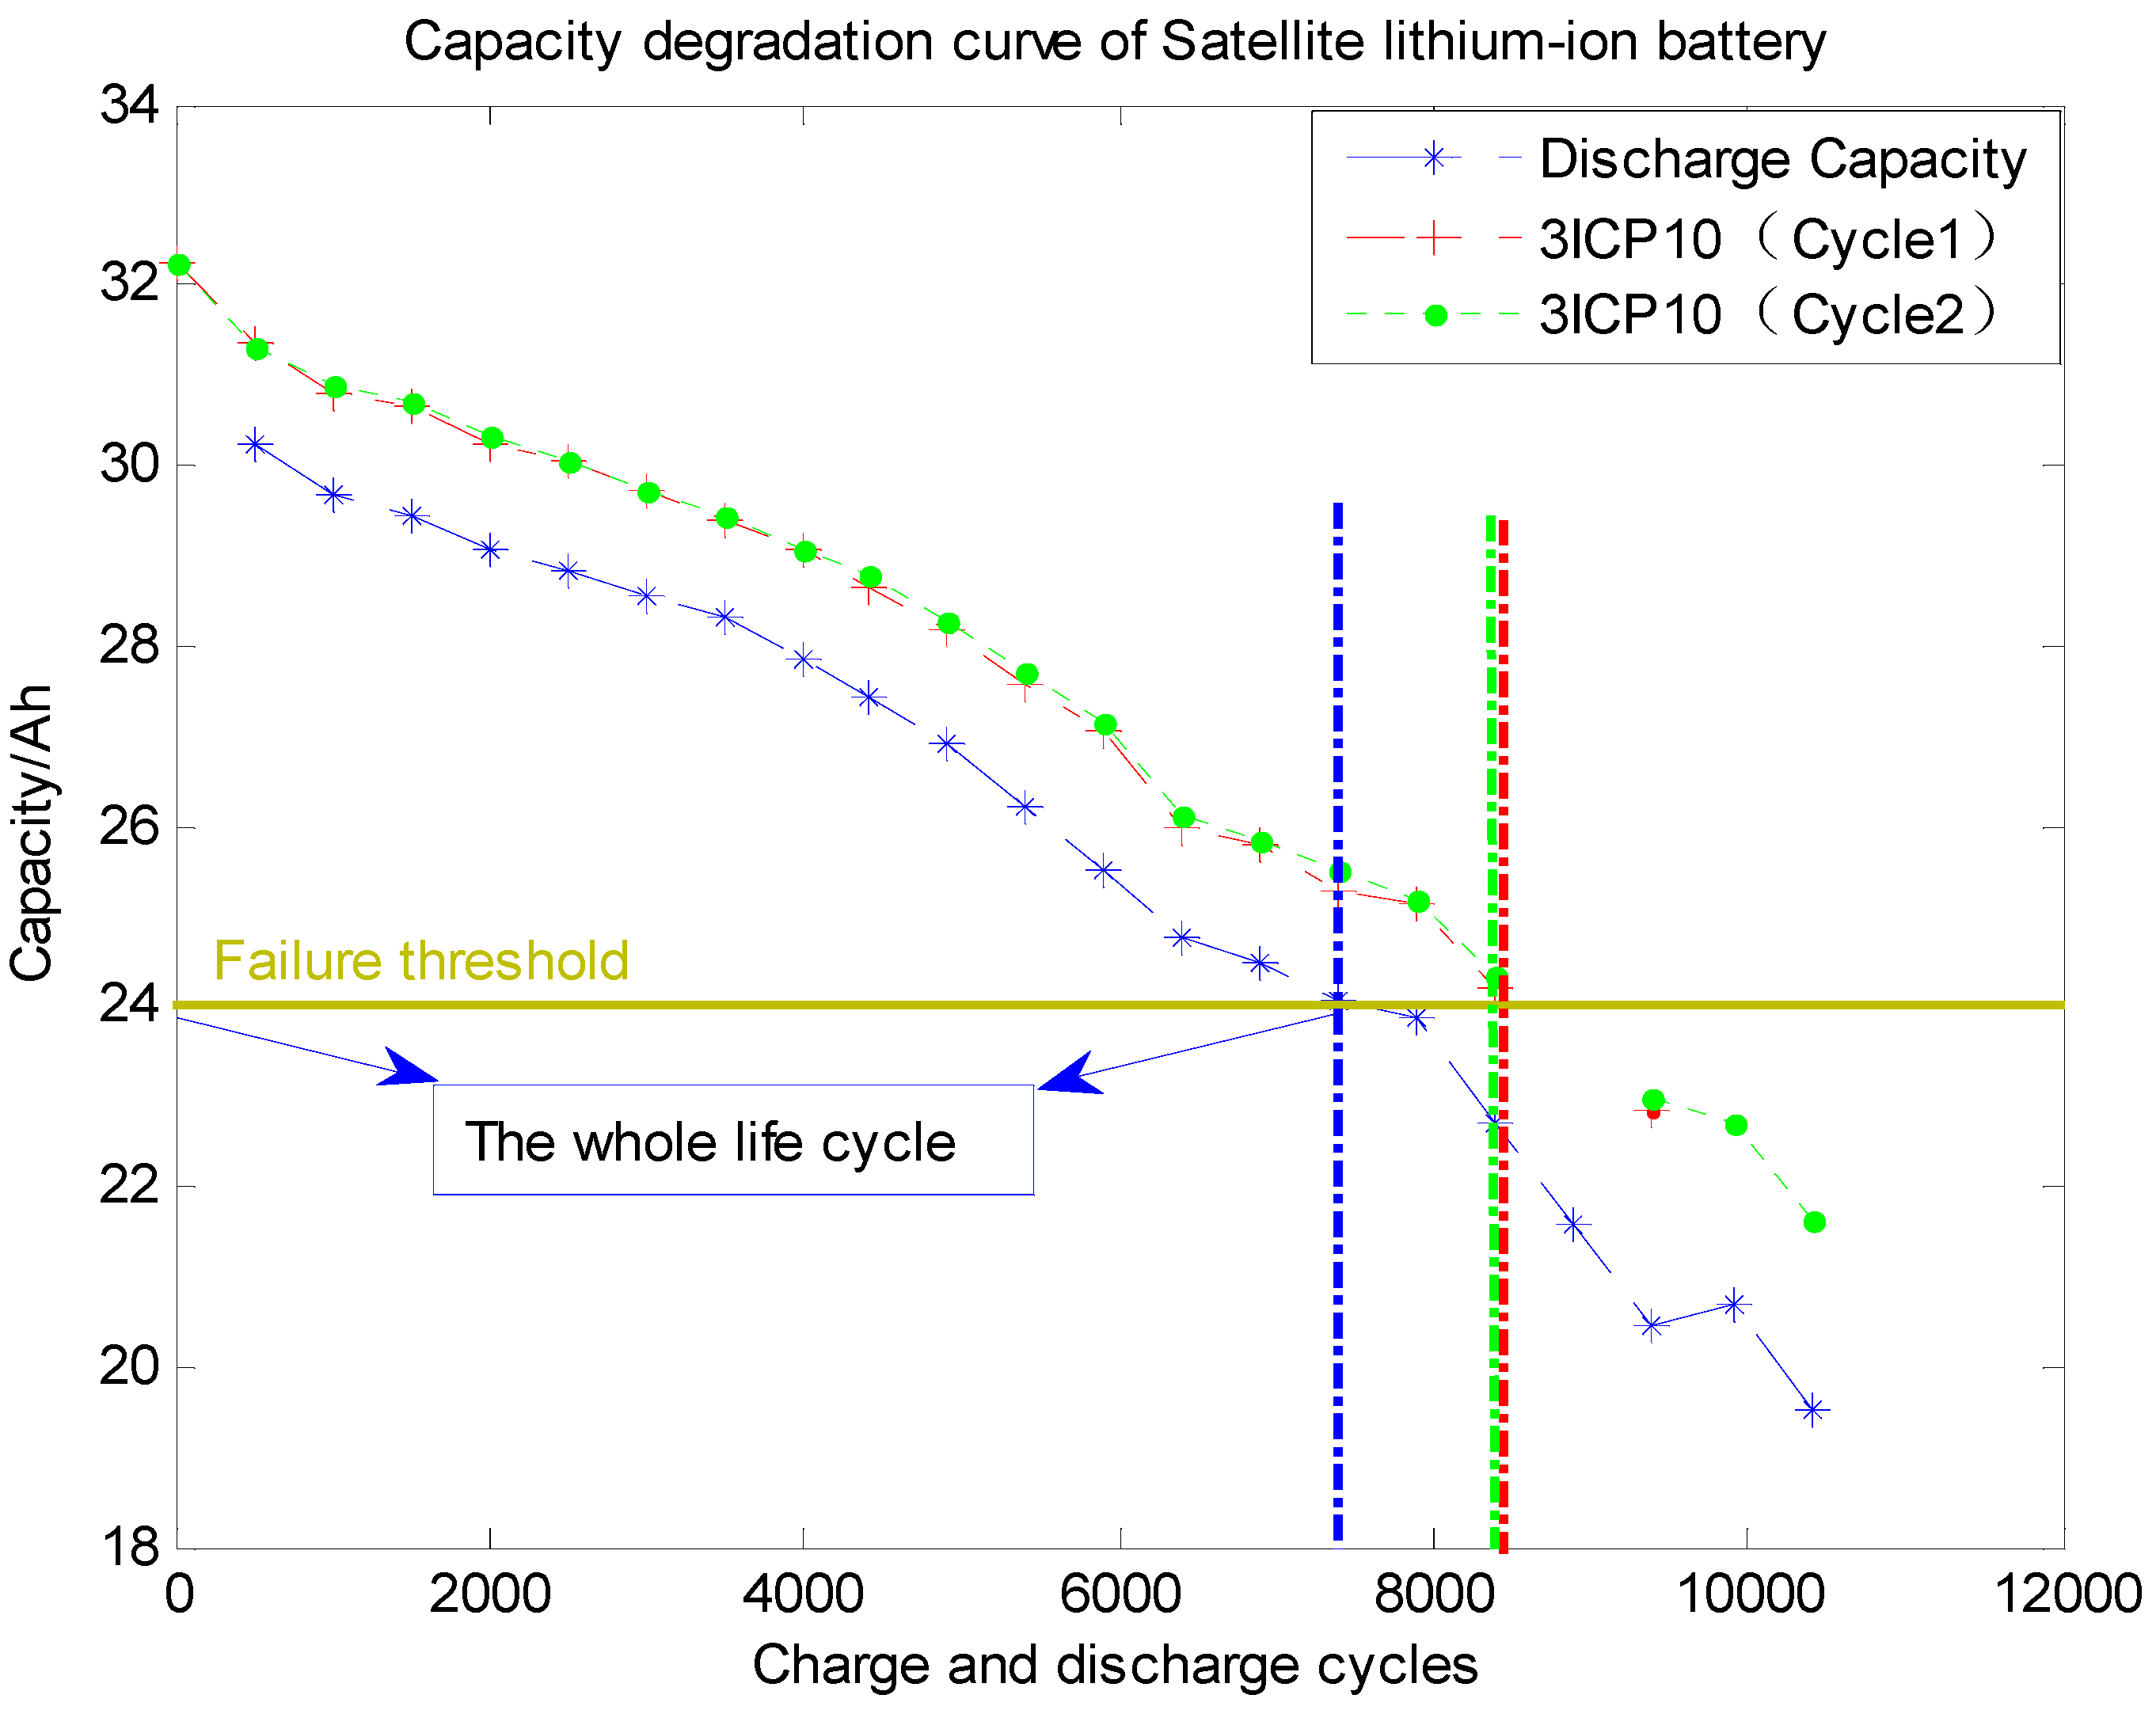
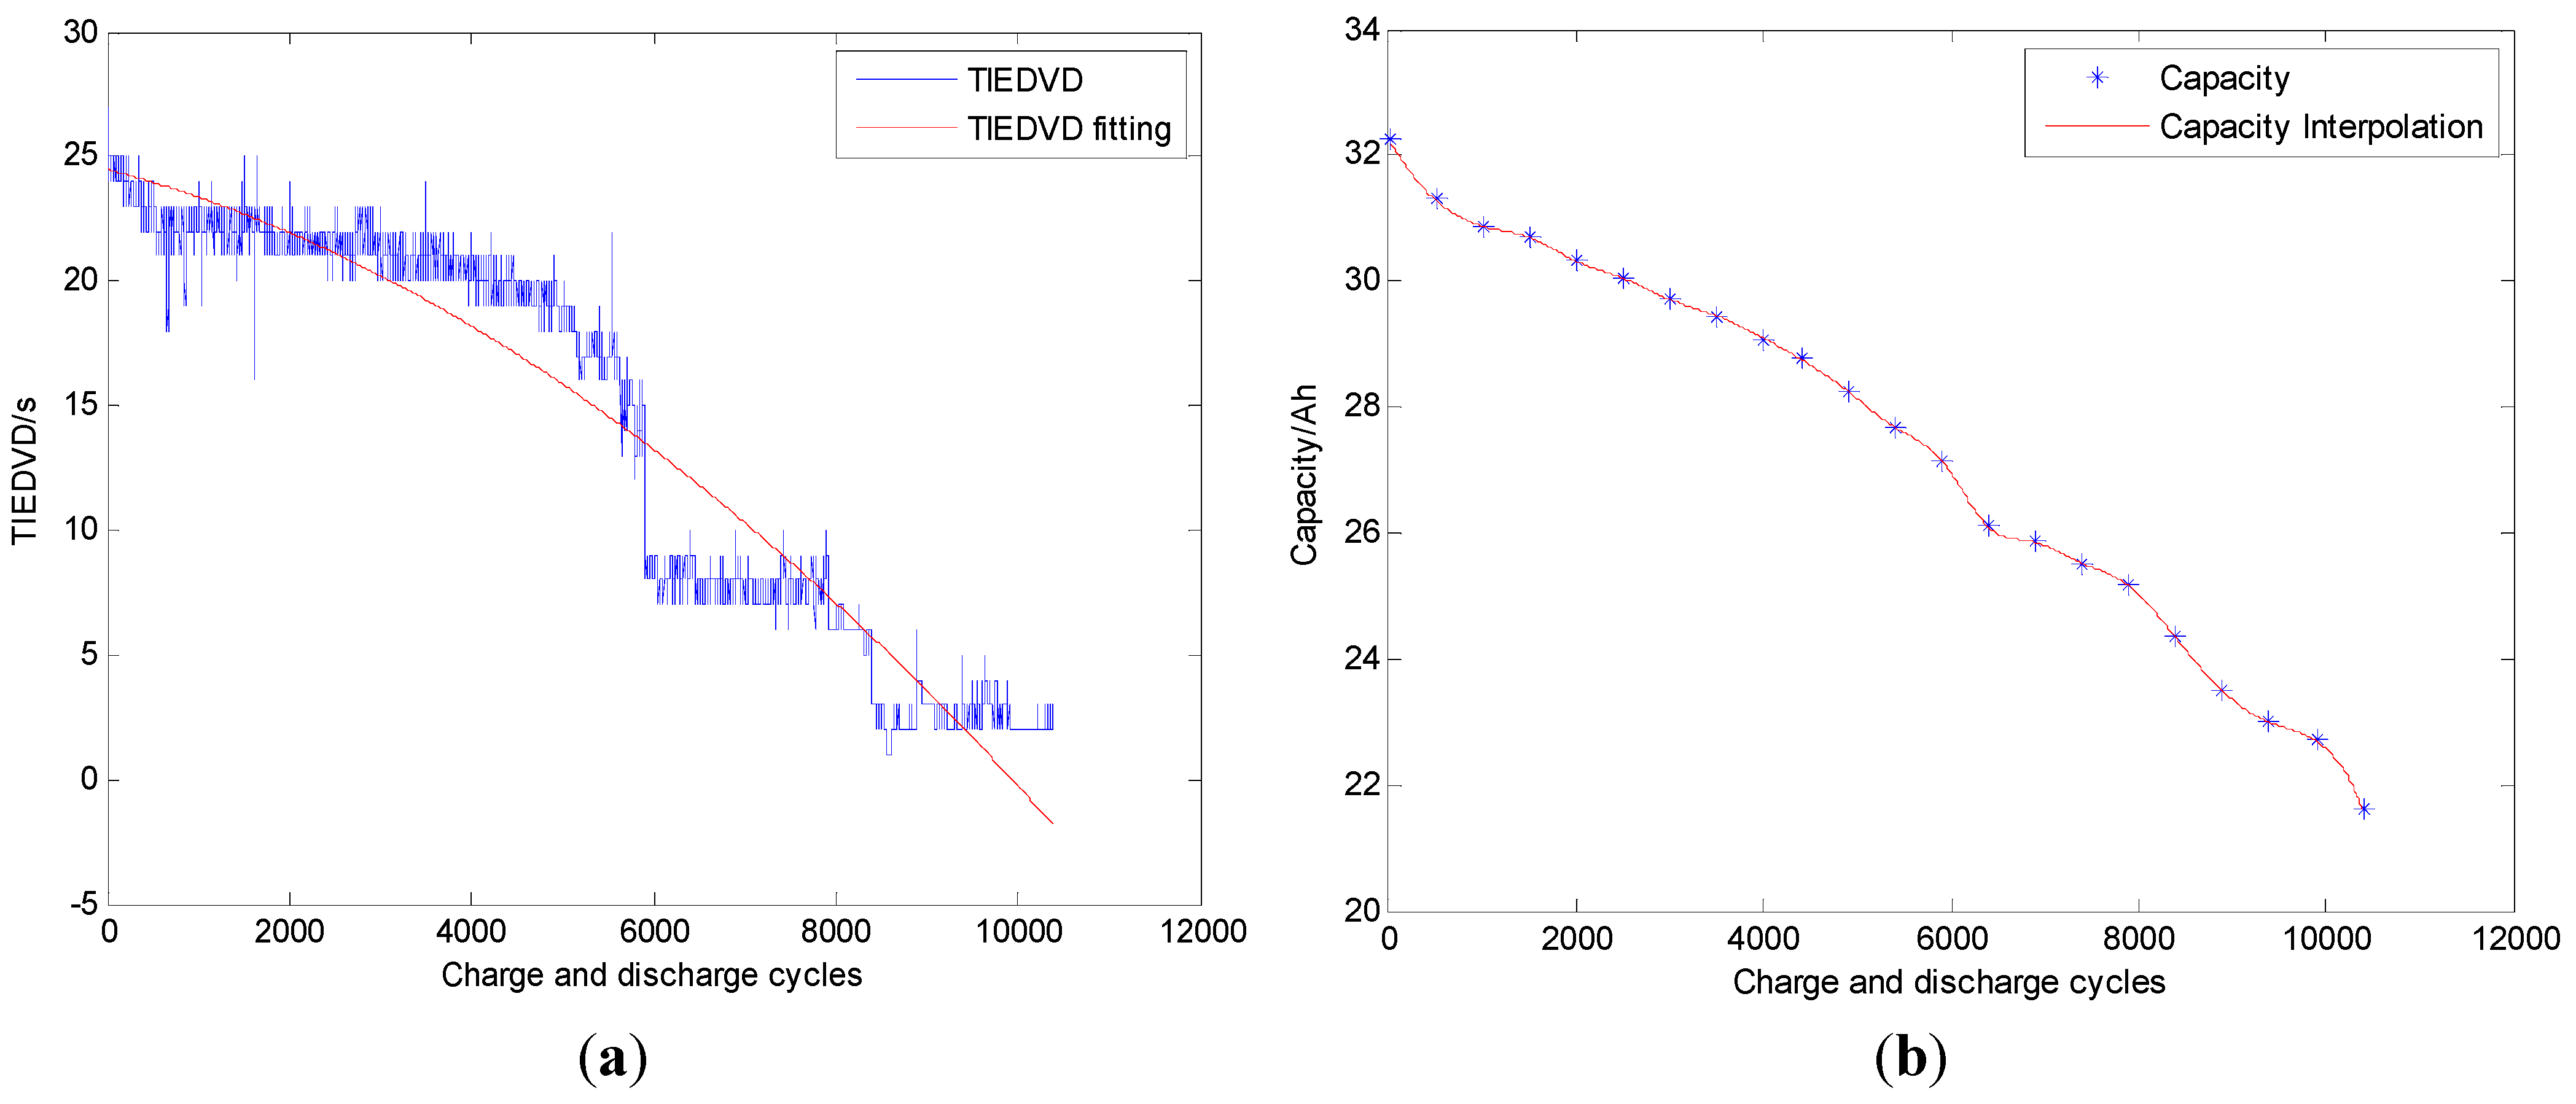
4.1. Indirect HI Extraction and Evaluation

To pre-process the lithium-ion battery data set, we can obtain the TIEDVD data series of satellite batteries as shown in Figure 7a. In the experiment, the selected discharging voltage interval is between 3.799 V and 3.866 V. Compared with the TIEDVD data series, the capacity data samples are not enough. Thus, we use the Cubic Spline Interpolation method to extend the capacity data samples (see Figure 7b). In this way, the data samples of the capacity and TIEDVD are equal. The GCA method is applied to compute the similarity of the two types of data series. The result shows that ρ is equal to 0.5463 and the computed correlation level r is 0.7384. This indicates the strong similarity between the extracted TIEDVD series and the capacity series.
With the analysis and calculation above, we conclude that the TIEDVD series can be used as an HI for the RUL estimation of satellite lithium-ion batteries. With the proposed method, the lithium-ion battery SOH is estimated with the on-line monitoring parameters. Experiments and test results verify its effectiveness and confirm that the method can be effectively applied to the on-line battery RUL prediction and SOH estimation. Moreover, the HI extraction method has more potential applicability which can be extended to on-line RUL prediction for electric vehicles.
Figure 7. TIEDVD series and remained capacity series (with interpolation) for the satellite lithium-ion battery. (a) TIEDVD series. (b) Interpolated capacity series.
Energies 06 03654 g007

4.2. Evaluation Criterion

We use four evaluation criteria to measure and demonstrate the accuracy and stability of the proposed method:
(1)
Root Mean Square Error (RMSE): to evaluate the local prediction accuracy:
R M S E = i = 1 m ( f ( u i ) f ( u i ) ) 2 m  
(2)
R2: to evaluate the prediction performance. If the prediction result is good, R2 will be close to 1:
R 2 = 1 i = 1 m ( f ( u i ) f ( u i ) ) 2 i = 1 m ( f ( u i ) f _ ( u i ) ) 2  
(3)
RULerror (RUL predicted Errors): to evaluate the prediction accuracy of RUL:
R U L e r r o r = R U L p r e d i c t R U L t r u e
(4)
Standard Deviation (Std): to evaluate the stability by determining the bias of the predicted RUL with En_MONESN:
S t d = i = 1 T ( R U L p r e d i c t , i R U L t r u e ) 2 T
Here f ( u i ) is the actual capacity of lithium-ion battery, f ( u i ) is the predicted remaining capacity, f _ ( u i ) is the mean value of the predicted remaining capacity, and m is the number of samples. Denote R U L p r e d i c t , i as the ith predicted RUL value by the ith MONESN model, R U L t r u e as the actual RUL value, and T as the number of MONESN sub-models contains in the model repository.

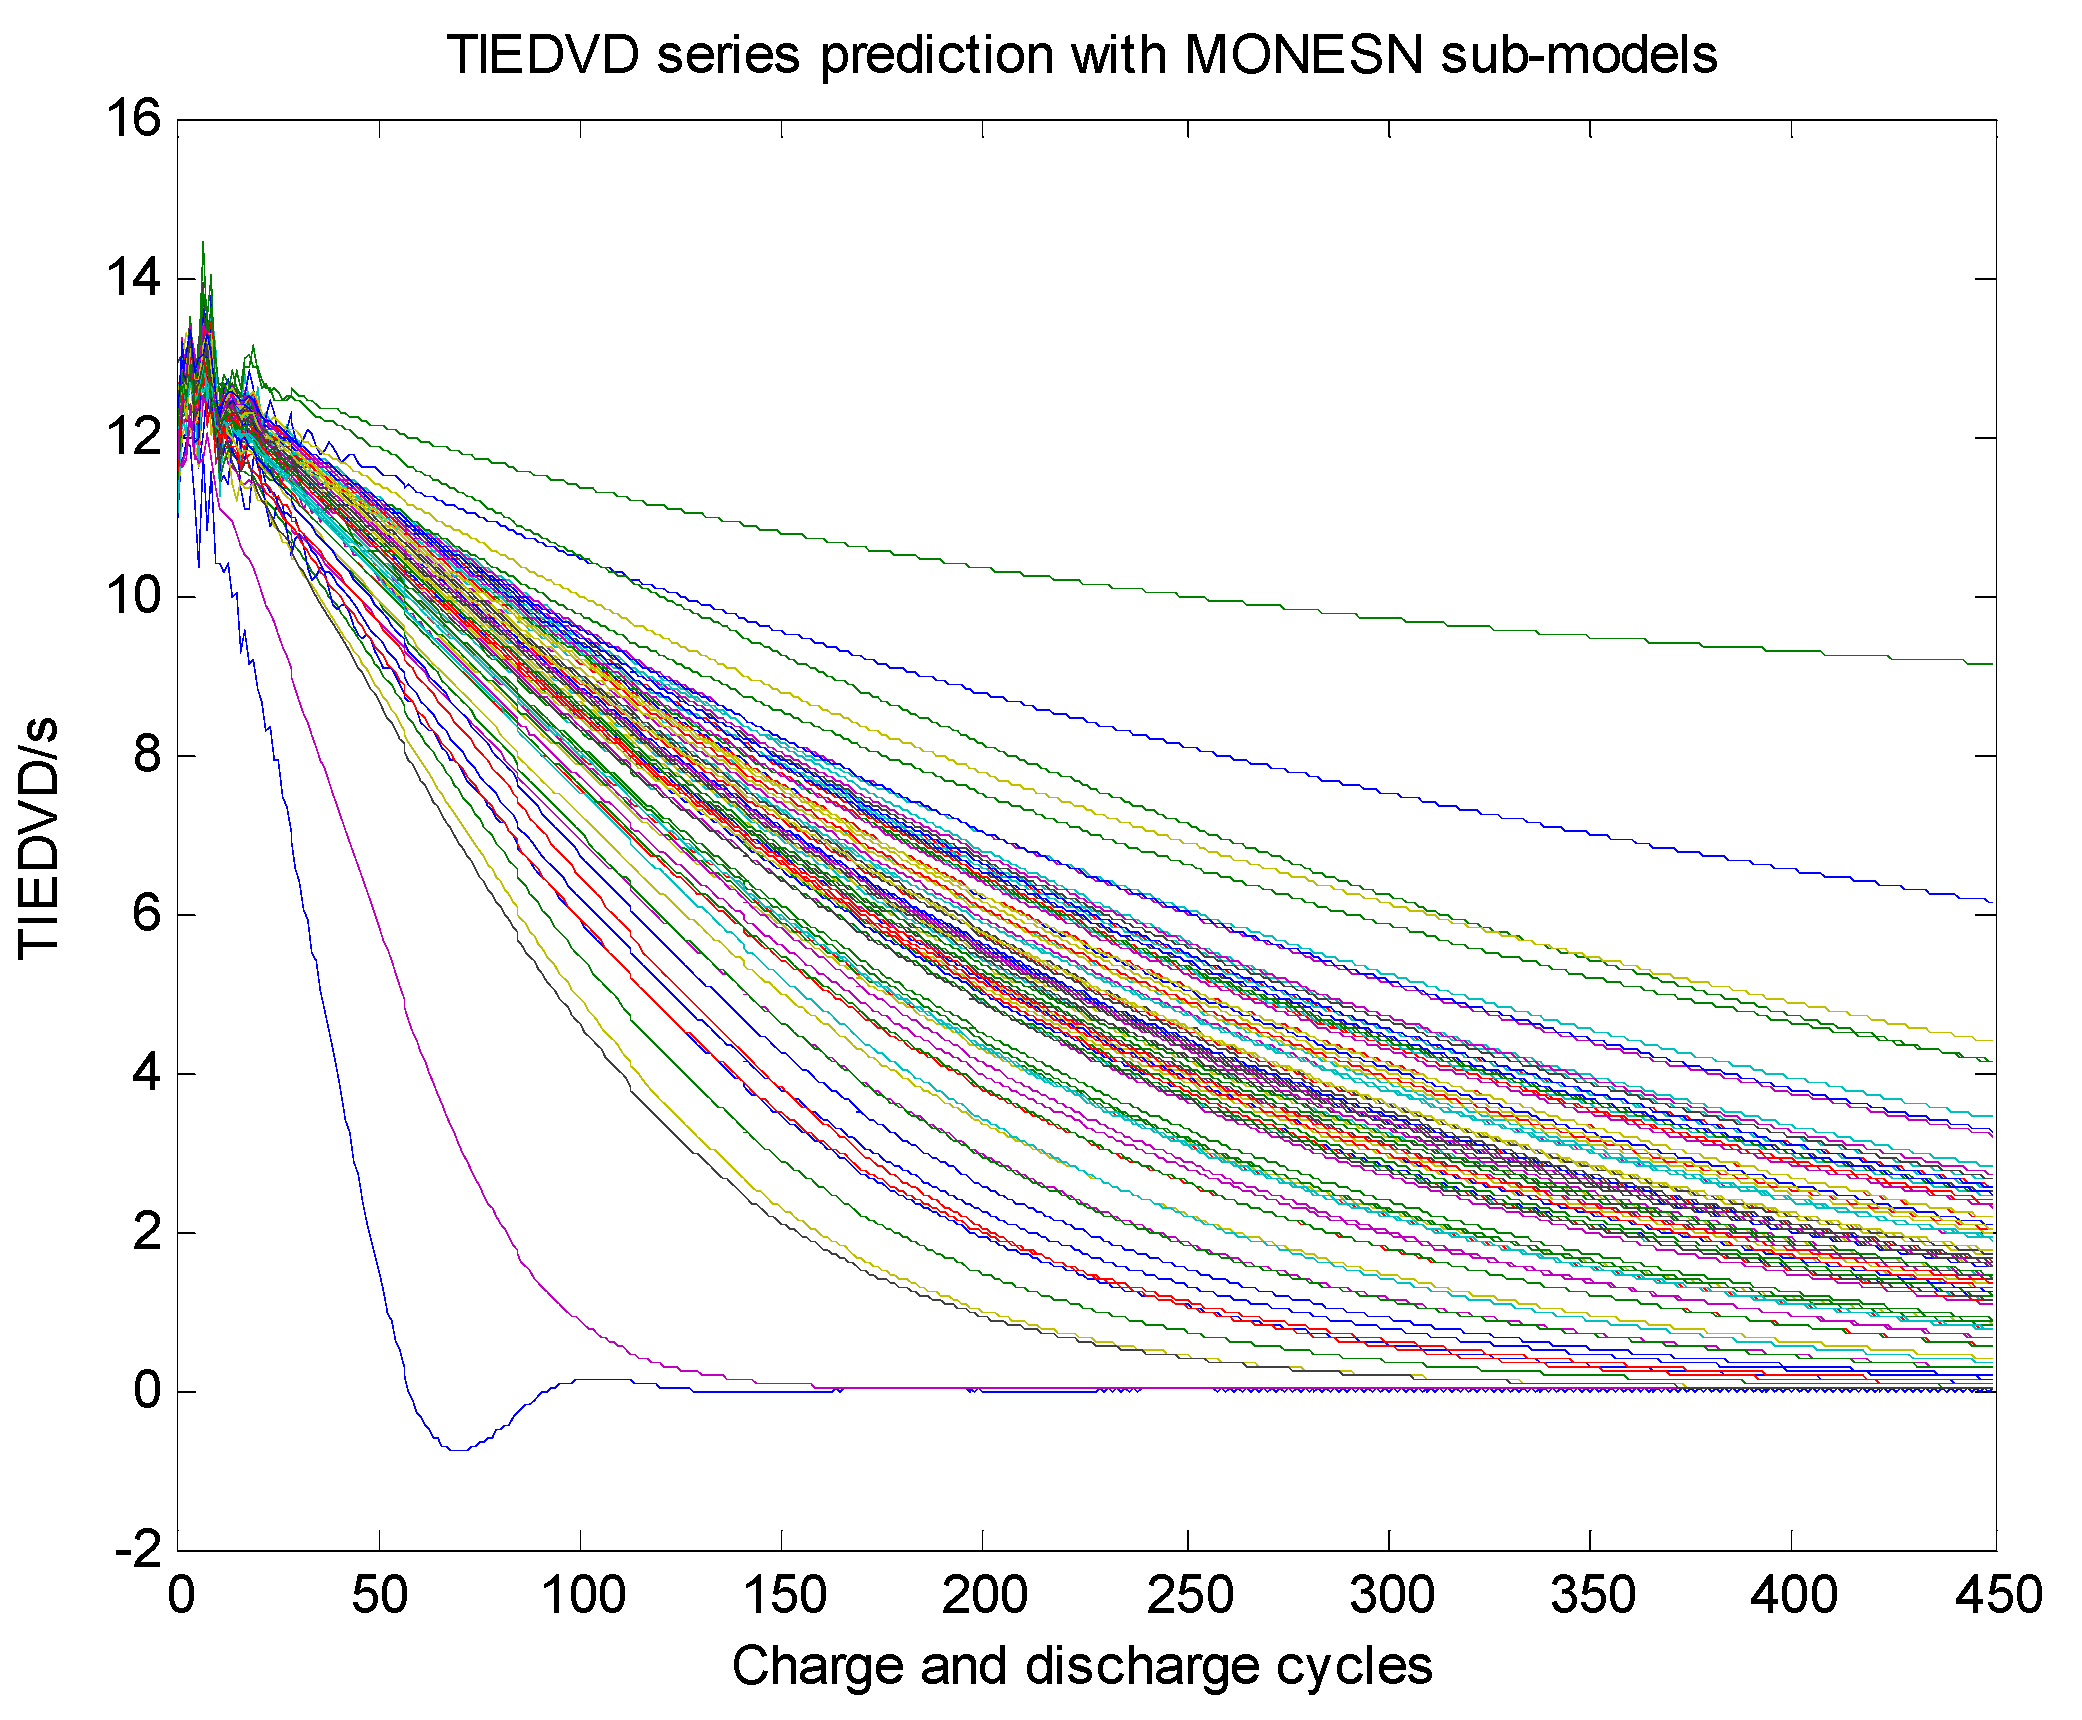
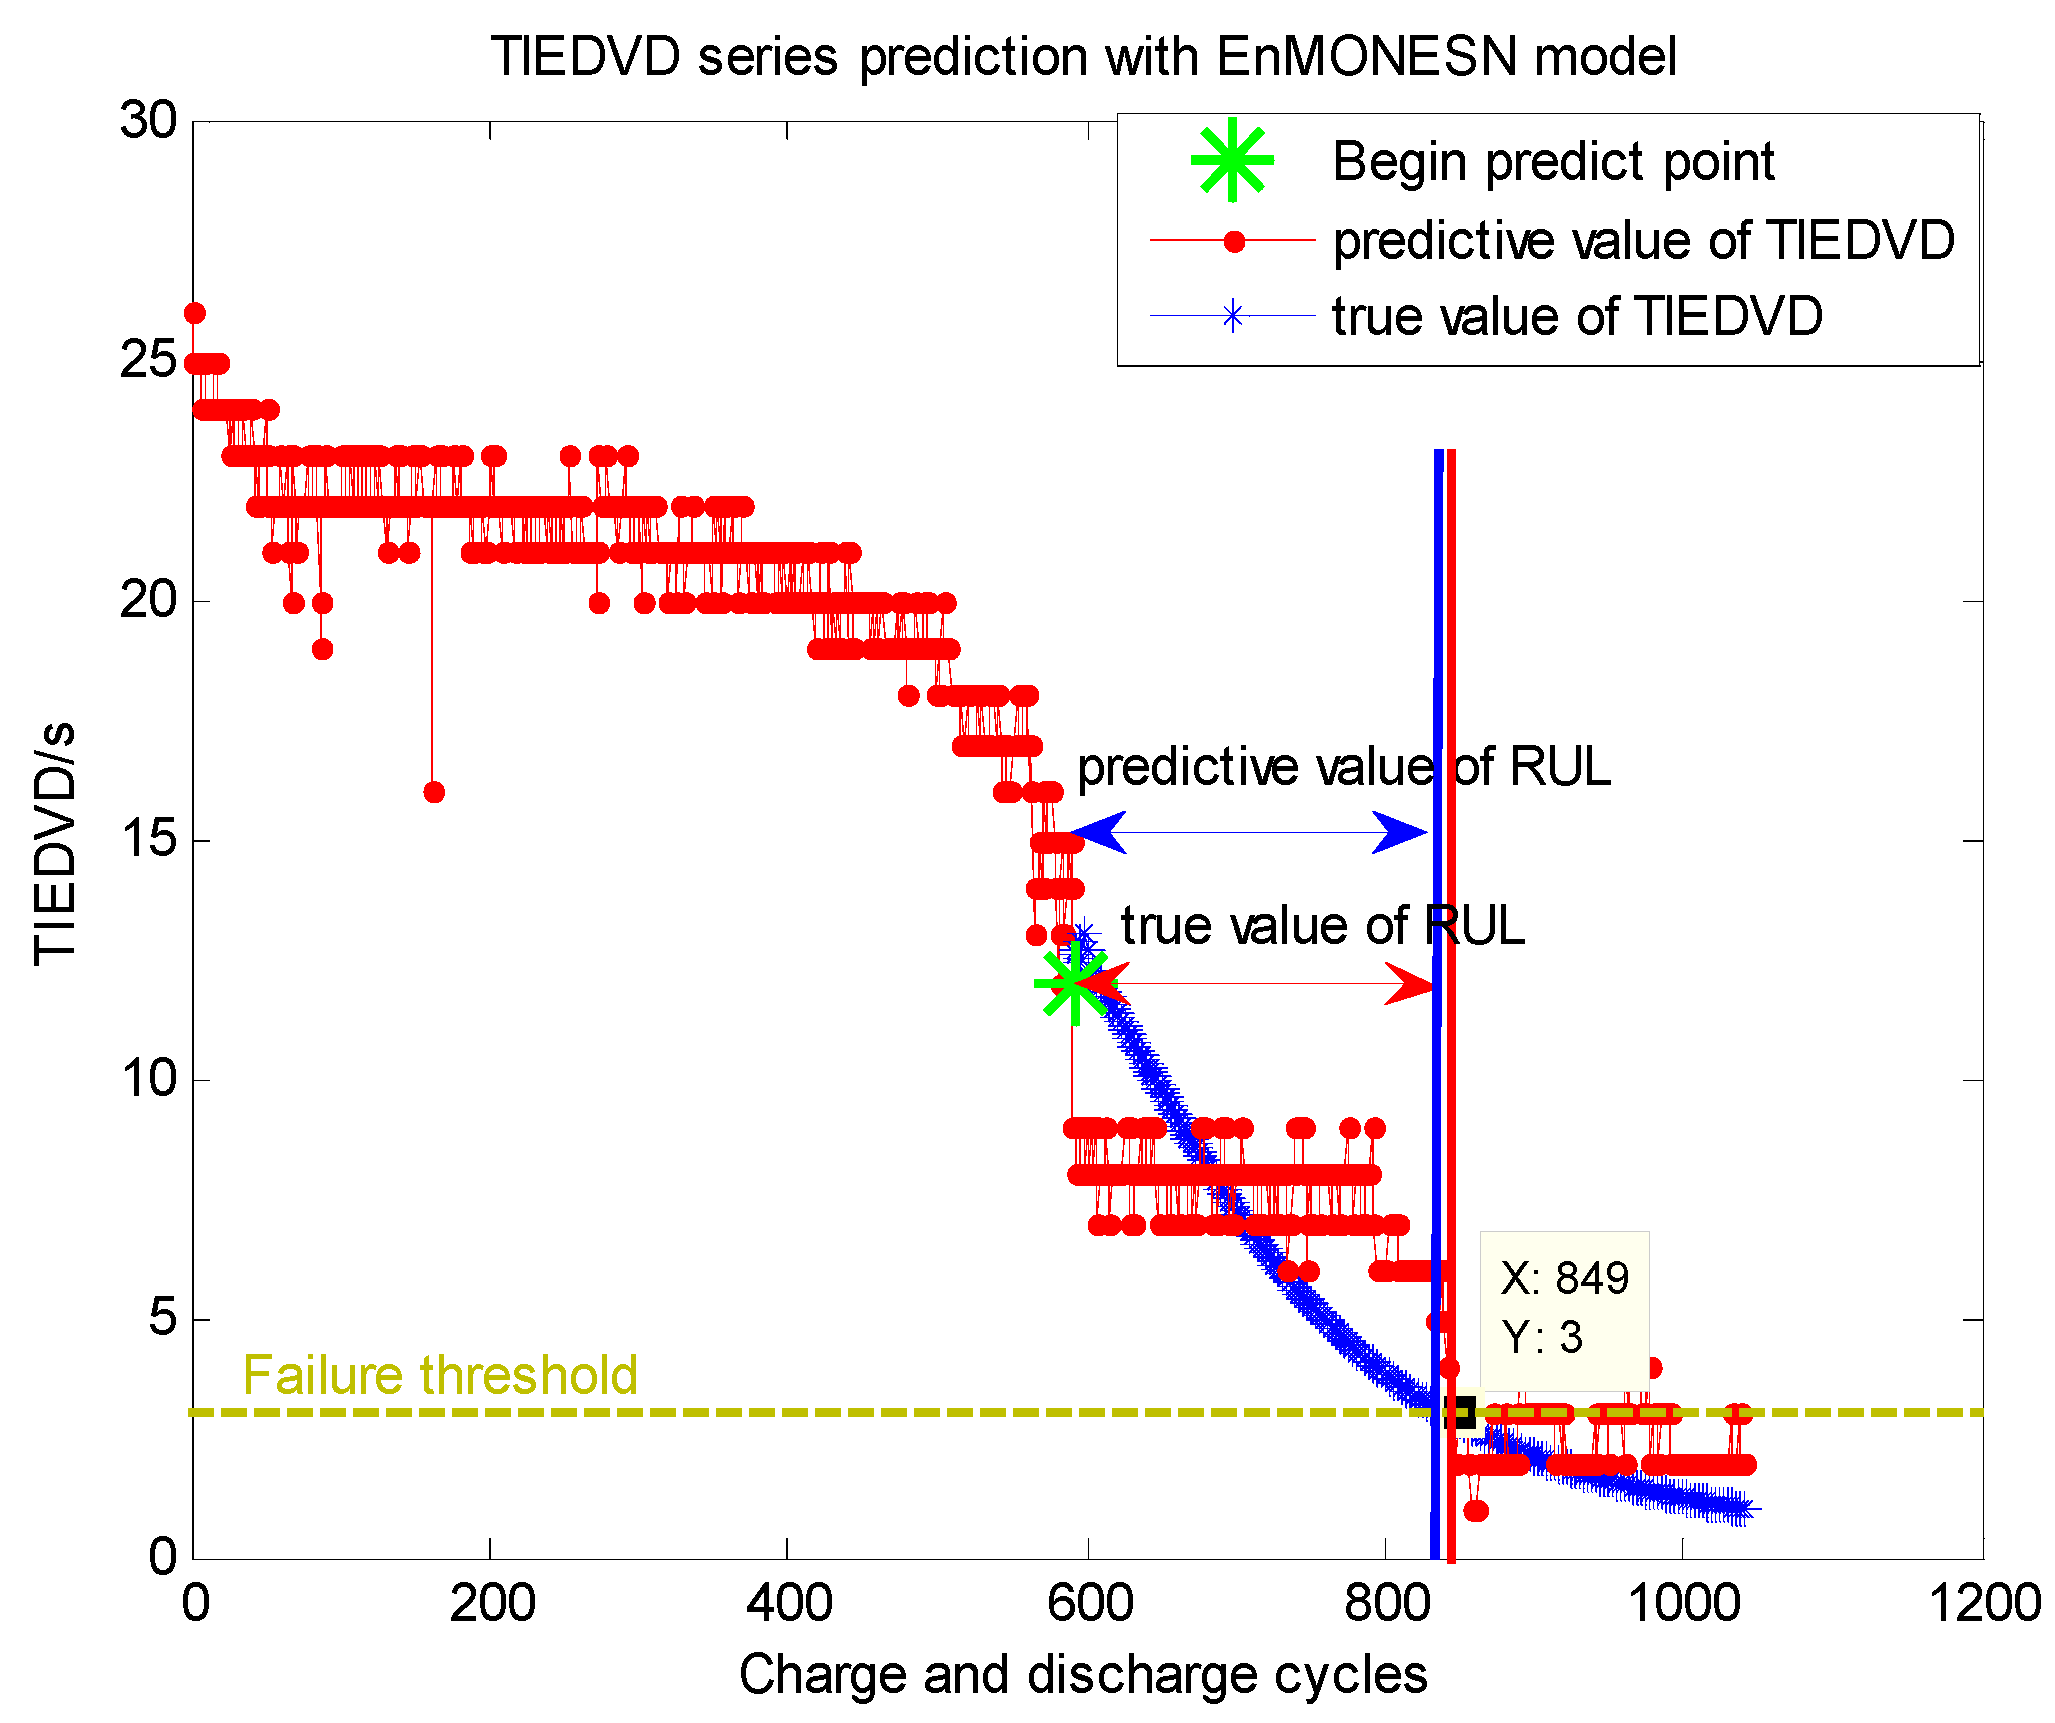
4.3. Satellite Lithium-Ion Battery RUL Prediction

In this section, we apply the proposed En_MONESN algorithm and the novel indirect HI to predict satellite lithium-ion battery RUL.
After raw data pre-processing, we can obtain the TIEDVD series and interpolated capacity series with the following three steps:
Outlier detection and elimination;
Sequence fitting of TIEDVD series;
Re-sampling the TIEDVD series to reduce the data samples, the strategy is to re-sample one point in each ten samples.
One thousand forty (1040) data samples are divided into two data sets: the first 1 to 520 data samples are training data samples, and the rest of the data samples are used as testing data samples. We assume that 25% rated capacity degradation implies the failure of the lithium-ion battery. Then the failure threshold for the satellite battery is 32.2510 × 0.75 = 24.1883 Ah.
According to the correlation between the capacity series and HI series, we adopt the TIEDVD series as input and the capacity as output to realize the degradation modeling with the MONESN algorithm. As a result, we can use 3 time units as the corresponding TIEDVD threshold to the cycle life (it is 3 time units, i.e., 3 × 30 s = 90 s).
The 1 to 590 TIEDVD data samples are used as the input of En_MONESN, and the associated 2 to 591 data samples are used as the output. Similarly, the bagging algorithm is applied to obtain 100 new data sets which are used to motivate the ensemble MONESN sub-models. As a result, the TIEDVD series predicted model is built with the En_MONSEN. The free parameters of En_MONESN are trained by cross-validation (N = 10, sr = 0.7, IS = 0.001, IF = 0).
With the En_MONESN model above, we can predict the HI_TIEDVD series iteratively. Thus, the 592th, 593th, …, 1040th predicted values are obtained in the iteration. Figure 8 shows the TIEDVD predicted series with the 100 MONESN sub-models, and Figure 9 shows the En_MONESN based TIEDVD series prediction (the prediction is started from the blue line marked in the Figure 9).
As shown in Figure 8 and Figure 9, we can find that even if the predicted values deviate from the 100 MONESN sub-models, satisfied predicted result can be obtained with the ensemble learning. By examining the corresponding RUL predicted error in Figure 9, one can see that much more stable and precise estimated performance is achieved for the HI estimation of the lithium-ion battery.
To prove the effectiveness of the proposed framework, we also compare the EN_MONESN with the basic ESN and MONESN for the battery RUL estimation. In Table 1, the TIEDVD series are predicted with the basic ESN, MONESN, and En_MONESN models (the predicted results for single operating as well as the average predicted results for 100 times operating randomly are involved). It can be seen that the prediction precision of TIEDVD series based on En_MONESN is the highest. The RUL prediction stability (represented by the Std) indicates that the result obtained by En_MONESN is 5 to 20 times lower than the basic MONESN and ESN algorithms.
Figure 8. TIEDVD series prediction with MONESN sub-models (100 sub-models).
Energies 06 03654 g008
Figure 9. TIEDVD series prediction with En_MONESN for a satellite lithium-ion battery.
Energies 06 03654 g009
Table 1. Comparison of TIEDVD series predictions based on three different methods for a satellite lithium-ion battery RUL estimation.
Methods/CriterionRMSER2RULerrorStd
ESN1.83120.7184400-
MONESN1.81430.7197250-
En_MONESN1.72700.714690-
ESN (100)2.58590.61457322383.4036
MONESN (100)2.45700.5539390519.2168
En_MONESN (100)1.74410.7145293120.4061

5. Conclusions

In this work, we present a novel MONESN algorithm and apply the proposed method to satellite lithium-ion battery RUL prediction. A type of prediction and approximation with monotonic function feature is focused by analyzing the inherent monotonic relationship between the monitoring/testing data and the target value. Moreover, an ensemble learning strategy is used to optimize the MONESN to obtain high prediction accuracy and stability. In particular, a novel indirect HI is extracted from battery monitoring parameters to achieve flexible and applicable lithium-ion battery RUL estimation for in-orbit satellites. We also provide industrial RUL applications for satellite with the proposed framework. The experimental results prove the high effectiveness and efficiency of the RUL framework as well as the actual spacecraft application of lithium-ion batteries.

Acknowledgments

This work is partly supported by Twelfth Government Advanced Research Fund under Grant No. 51317040302, Research Fund for the Doctoral Program of Higher Education of China under Grant No. 20112302120027, Fundamental Research Funds for the Central Universities under Grant No. HIT.NSRIF.2014017, and China Scholarship Council. We would like to thank Dr. Liping Ma and Mr. Zhiyuan Yang for their support on the battery test and data collection. The authors would also like to thank anonymous reviewers for their valuable comments.

Conflict of Interest

The authors declare no conflict of interest.

References

  1. Zhang, J.; Lee, J. A review on prognostics and health monitoring of Li-ion battery. J. Power Sources 2011, 196, 6007–6014. [Google Scholar] [CrossRef]
  2. He, W.; Williard, N.; Osterman, M.; Pecht, M. Prognostics of lithium-ion batteries based on Dempster-Shafer theory and the Bayesian Monte Carlo method. J. Power Sources 2011, 196, 10314–10321. [Google Scholar] [CrossRef]
  3. Halpert, G.; Flood, D.J.; Sabripour, S. Spacecraft Power Technology; Imperial College Press: London, UK, 2000. [Google Scholar]
  4. Wang, D.; Li, G.; Pan, Y. The technology of Lithium-ion batteries for spacecraft application. Aerospa. Shanghai 2000, 17, 54–59. [Google Scholar]
  5. Xing, Y.; Ma, E.; Tsui, K.L.; Pecht, M. Battery management system in electric and hybrid vehicles. Energies 2011, 4, 1840–1857. [Google Scholar] [CrossRef]
  6. Saha, B.; Goebel, K.; Poll, S.; Christophersen, J. Prognostics methods for battery health monitoring using a Bayesian framework. IEEE T. Instrum. Meas. 2009, 58, 291–297. [Google Scholar] [CrossRef]
  7. Rufus, F.; Lee, S.; Thakker, A. Health Monitoring Algorithms for Space Application Batteries. In Proceedings of International Conference on Prognostics and Health Management 2008, Denver, CO, USA, 6–9 October 2008; pp. 1–8.
  8. Saha, B.; Goebel, K.; Christophersen, J. Comparison of prognostic algorithms for estimating remaining useful life of batteries. Trans. Inst. Meas. Control 2009, 31, 293–308. [Google Scholar] [CrossRef]
  9. Liu, J.; Saxena, A.; Goebel, K.; Saha, B.; Wang, W. An Adaptive Recurrent Neural Network For Remaining Useful Life Prediction Of Lithium-Ion Batteries. In Proceedings of Annual Conference of the Prognostics and Health Management Society 2010, Portland, OR, USA, 10–14 October 2010; pp. 1–10.
  10. Kozlowski, J.D. Electrochemical Cell Prognostics Using Online Impedance Measurements and Model-Based Data Fusion Techniques. In Proceedings of the 2003 IEEE Aerospace Conference, Big Sky, MT, USA, 8–15 March 2003; pp. 3257–3270.
  11. Liu, J.; Wang, W.; Ma, F.; Yang, Y.; Yang, C.A. A data-model-fusion prognostic framework for dynamic system state forecasting. Eng. Appl. Artif. Intell. 2012, 25, 814–823. [Google Scholar] [CrossRef]
  12. Xing, Y.; Ma, E.; Tsui, K.L.; Pecht, M. An ensemble model for predicting the remaining useful performance of Lithium-ion batteries. Microelectron. Reliab. 2013, 53, 811–820. [Google Scholar] [CrossRef]
  13. Liu, J.; Wang, W.; Golnaraghi, F. A multi-step predictor with a variable input pattern for system state forecasting. Mech. Syst. Signal Process. 2009, 23, 1586–1599. [Google Scholar] [CrossRef]
  14. Olivares, B.E.; Cerda Munoz, M.A.; Orchard, M.E.; Silva, J.F. Particle-filtering-based prognosis framework for energy storage devices with a statistical characterization of state-of-health regeneration phenomena. IEEE Trans. Instrum. Meas. 2013, 62, 364–376. [Google Scholar] [CrossRef]
  15. He, W.; Williard, N.; Osterman, M.; Pecht, M. Prognostics of Lithium-Ion Batteries Using Extended Kalman Filtering. In Proceedings of IMAPS Advanced Technology Workshop on High Reliability Microelectronics for Military Applications, Linthicum Heights,, MD, USA, 17–19 May 2011; pp. 1–4.
  16. Peng, Y.; Xu, Y.; Liu, D.; Peng, X. A Sensor Selection Method Based on Improved Grey Correlation Analysis for RUL Evaluation of Complex Engineered Systems. In Proceedings of Annual Conference of the Prognostics and Health Management Society 2012, New Orleans, LA, USA, 14–17 October 2013; pp. 1–8.
  17. Jaeger, H.; Haas, H. Harnessing nonlinearity: Predicting chaotic systems and saving energy in wireless telecommunication. Science 2004, 308, 78–80. [Google Scholar] [CrossRef]
  18. Jaeger, H.; Lukosevicius, M.; Popovici, D. Optimization applications of echo state networks with leaky integrator neurons. Neural Netw. 2007, 20, 335–352. [Google Scholar] [CrossRef] [PubMed]
  19. Sill, J. Monotonic Networks. In Advances in Neural Information Processing Systems (NIPS); MIT Press: Cambridge, MA, USA, 1998; Volume 10, pp. 661–667. [Google Scholar]
  20. Minin, A.; Velikova, M.; Lang, B.; Daniels, H. Comparison of universal approximators incorporating partial monotonicity by structure. Neural Netw. 2010, 23, 471–475. [Google Scholar] [CrossRef] [PubMed]
  21. Parviz, M.; Moin, S. Boosting approach for score level fusion in multimodal biometrics based on AUC maximization. J. Inf. Hiding Multimed. Signal Process 2011, 2, 51–59. [Google Scholar]
  22. Kaganami, H.G.; Ali, S.K.; Zou, B. Optimal approach for texture analysis and classification based on wavelet transform and neural network. J. Inf. Hiding Multimed. Signal Process 2011, 2, 33–40. [Google Scholar]

