1. Introduction
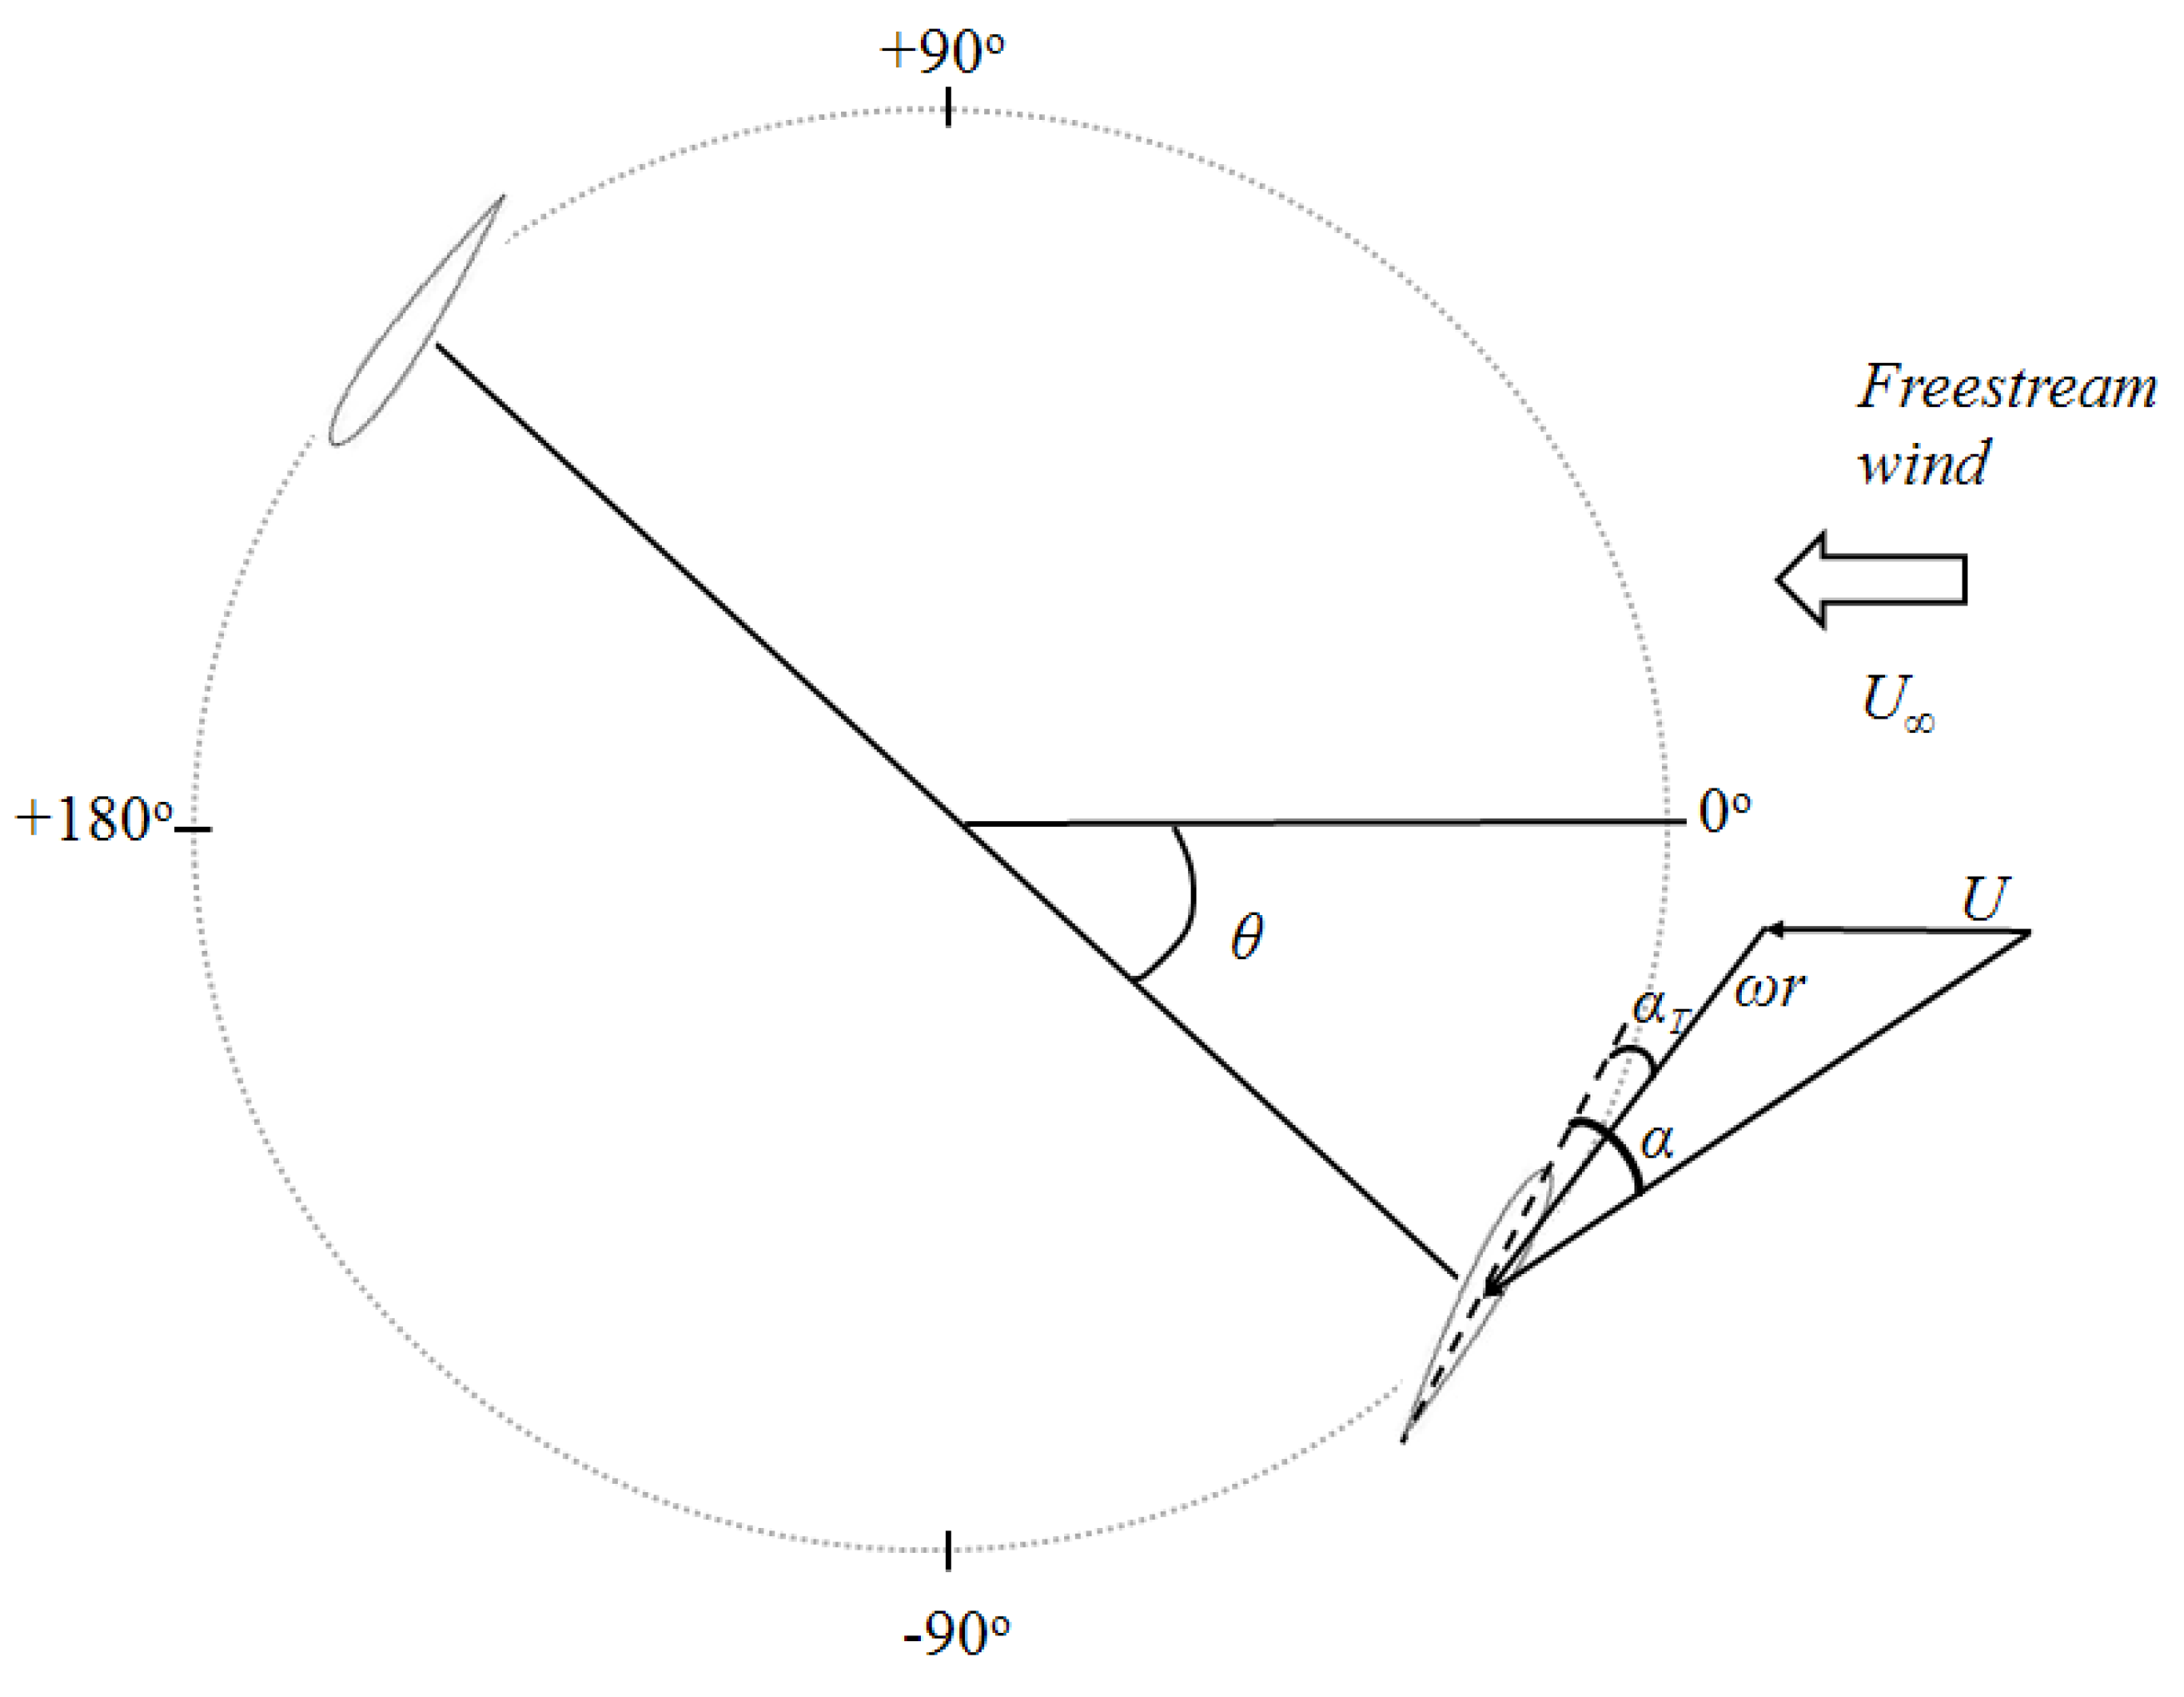
The evolution of wind turbines has largely been driven by the cost of energy. During the 1980s, this led to the demise of many vertical axis wind turbine (VAWT) concepts that provided lower cost-effectiveness compared with horizontal axis wind turbines (HAWTs). Unlike the operation of a HAWT rotor, a VAWT rotor blade sees an inconsistent angle of attack (AoA) through its rotation. Consequently, VAWT blades generally use symmetrical aerofoils with a lower lift-to-drag ratio than cambered aerofoils tailored to maximise HAWT rotor performance. Furthermore, the blades of large HAWTs use active blade pitch control to maximise performance for different operating conditions which is mechanically complex to replicate for VAWTs due to the cyclic variation of AoA. The reciprocating action illustrated in
Figure 1 requires VAWT blades to backtrack against the wind for part of the cycle leading to the cyclic variation in torque and lateral wind loading over the course of a rotation and also to rotor wake-induced losses that are significantly greater for VAWTs compared with HAWTs. Consequently, whilst VAWTs are currently capable of achieving a peak power coefficient of 0.4, HAWT rotors can achieve power coefficients approaching 0.5 (or 90% efficiency) contributing towards a better cost-effectiveness.
Figure 1.
Schematic of a VAWT operation.
Figure 1.
Schematic of a VAWT operation.
However, VAWTs have a number of other attributes that offer some advantages, particularly for offshore operations, and there has been a resurgence of interest in the development of large scale VAWTs for wind energy generation (see [
1,
2,
3,
4,
5,
6,
7,
8,
9,
10]). Research effort has focused on improving the aerodynamic efficiency of VAWT rotors. For example, the use of helical [
9] or inclined [
3] blades to reduce the torque and over-turning moment ripple, natural laminar flow aerofoil sections to minimise drag [
10] and variable pitch mechanisms [
11].
To increase the torque developed by a VAWT blade it is necessary to maximise the tangential force coefficient (
CT) of the blade section and therefore to maximize lift coefficient (
CL) and minimize drag coefficient (
CD), as shown in Equation (1):
The AoA (
) variation with blade azimuth position (
) can be calculated using Equations (2) and (3) for a vertical blade element, where the speed ratio (
) is the ratio of blade angular velocity (
) to local wind velocity (
), and
defines a geometric blade twist or pitch angle relative to the tangential path of the blade (see
Figure 1):
AoA exhibits an approximately sinusoidal variation with blade position and amplitude increases with wind speed. If we consider the lift and drag characteristics of the NACA0018 aerofoil section, commonly used in VAWT designs, the variation with AoA below that for static stall can be approximated using Equation (4) at a chord Reynolds number,
Rc = 0.7 M (based on wind tunnel measurements [
12]):
At low wind speeds the torque generated is therefore restricted by the small lift contribution relative to the negative drag contribution. A significant challenge is how to augment the blade lift, particularly at low wind speed conditions. A number of methods have been proposed by previous researchers. For example, variable pitch control allows the geometric twist angle to vary with blade position [
i.e.,
] and can achieve increased torque at low and intermediate wind speeds without compromising peak efficiency. Active and passive pitch controlled systems have been proposed and a number of small scale turbines tested and a review of these systems is given by Kirke [
13]. Active blade pitch control generally uses a central cam with pushrods connected to the blades to produce a periodic variation in pitch angle as a function of azimuth angle [
14,
15]. The passive pitch control concept uses a blade that is free to pitch about a spanwise (longitudinal) axis. Such devices have also been demonstrated [
11,
16] though pitch control is generally used to reduce the periodic AoA at higher wind speeds to delay stall rather than increasing AoA to augment lift at low wind speeds,
i.e., when the operating AoA range is low compared with the stall angle. A range of active flow control techniques for HAWT load alleviation were also reviewed by Johnson
et al. [
17], including trailing-edge flaps, micro-tabs, vortex generators, synthetic jets and plasma flows that could also potentially be utilized for VAWT aerodynamic control.
Since active and passive pitch control systems require relatively complex mechanisms that are sensitive to operating conditions, this paper considers an alternative form of lift augmentation. Circulation control (CC) is an active flow control method for lift augmentation that was inadvertently discovered by Henri Coanda in 1910. Since then it has been investigated by a great number of researchers, mainly for aerospace applications [
18]. However, although CC technology has been successfully demonstrated on aircraft there are few production aircraft flying that utilize it. This is largely due to issues relating to the pump power required to generate the jet mass flow rates, pitching moment variations requiring additional trim, and increased cruise drag and noise. This research considers the technical feasibility of utilizing active CC technology for improving VAWT aerodynamic efficiency, particularly at low wind speeds when performance is compromised relative to HAWTs. Although CC technology has previously been considered for wind turbine applications [
19,
20,
21,
22,
23,
24,
25,
26,
27,
28,
29] few researchers consider the system requirements essential to determine if the technology is feasible for deployment on medium to large VAWTs.
The maximum lift coefficient of a conventional VAWT aerofoil (NACA0018) is
CL = 1.02 at an AoA of 12° and
Rc = 0.7 M [
12]. In contrast, CC aerofoils have achieved
CL > 7 at zero AoA and
Rc = 0.6 M [
30]. Consequently it would seem that CC offers the potential to generate large lift and torque augmentation for relatively low wind speeds. This research does not attempt to optimise a CC aerofoil shape but considers the trade-offs between trailing-edge radius and jet momentum coefficient (for a fixed nozzle height) necessary to maximize the net power augmentation,
i.e., including pumping power considerations. Although CC could also potentially be used for aerodynamic braking and control by promoting separation at high wind speeds to reduce loads, this study focuses on power augmentation over a range of wind speeds. Using trend data for lift and drag generated from experimental and Computational Fluid Dynamics (CFD) methods, CC parameters were optimized to maximize the torque generated by a 100 kW baseline VAWT with a simple CC aerofoil design, using an aerodynamic performance model based on the Double-Multiple Streamtube (DMST) approach.
Section 2 of this paper describes the principles of CC and reviews existing research and applications. The VAWT DMST model is described in
Section 3 and results are presented in
Section 4, with concluding remarks on the feasibility of CC presented in
Section 5.
2. Circulation Control
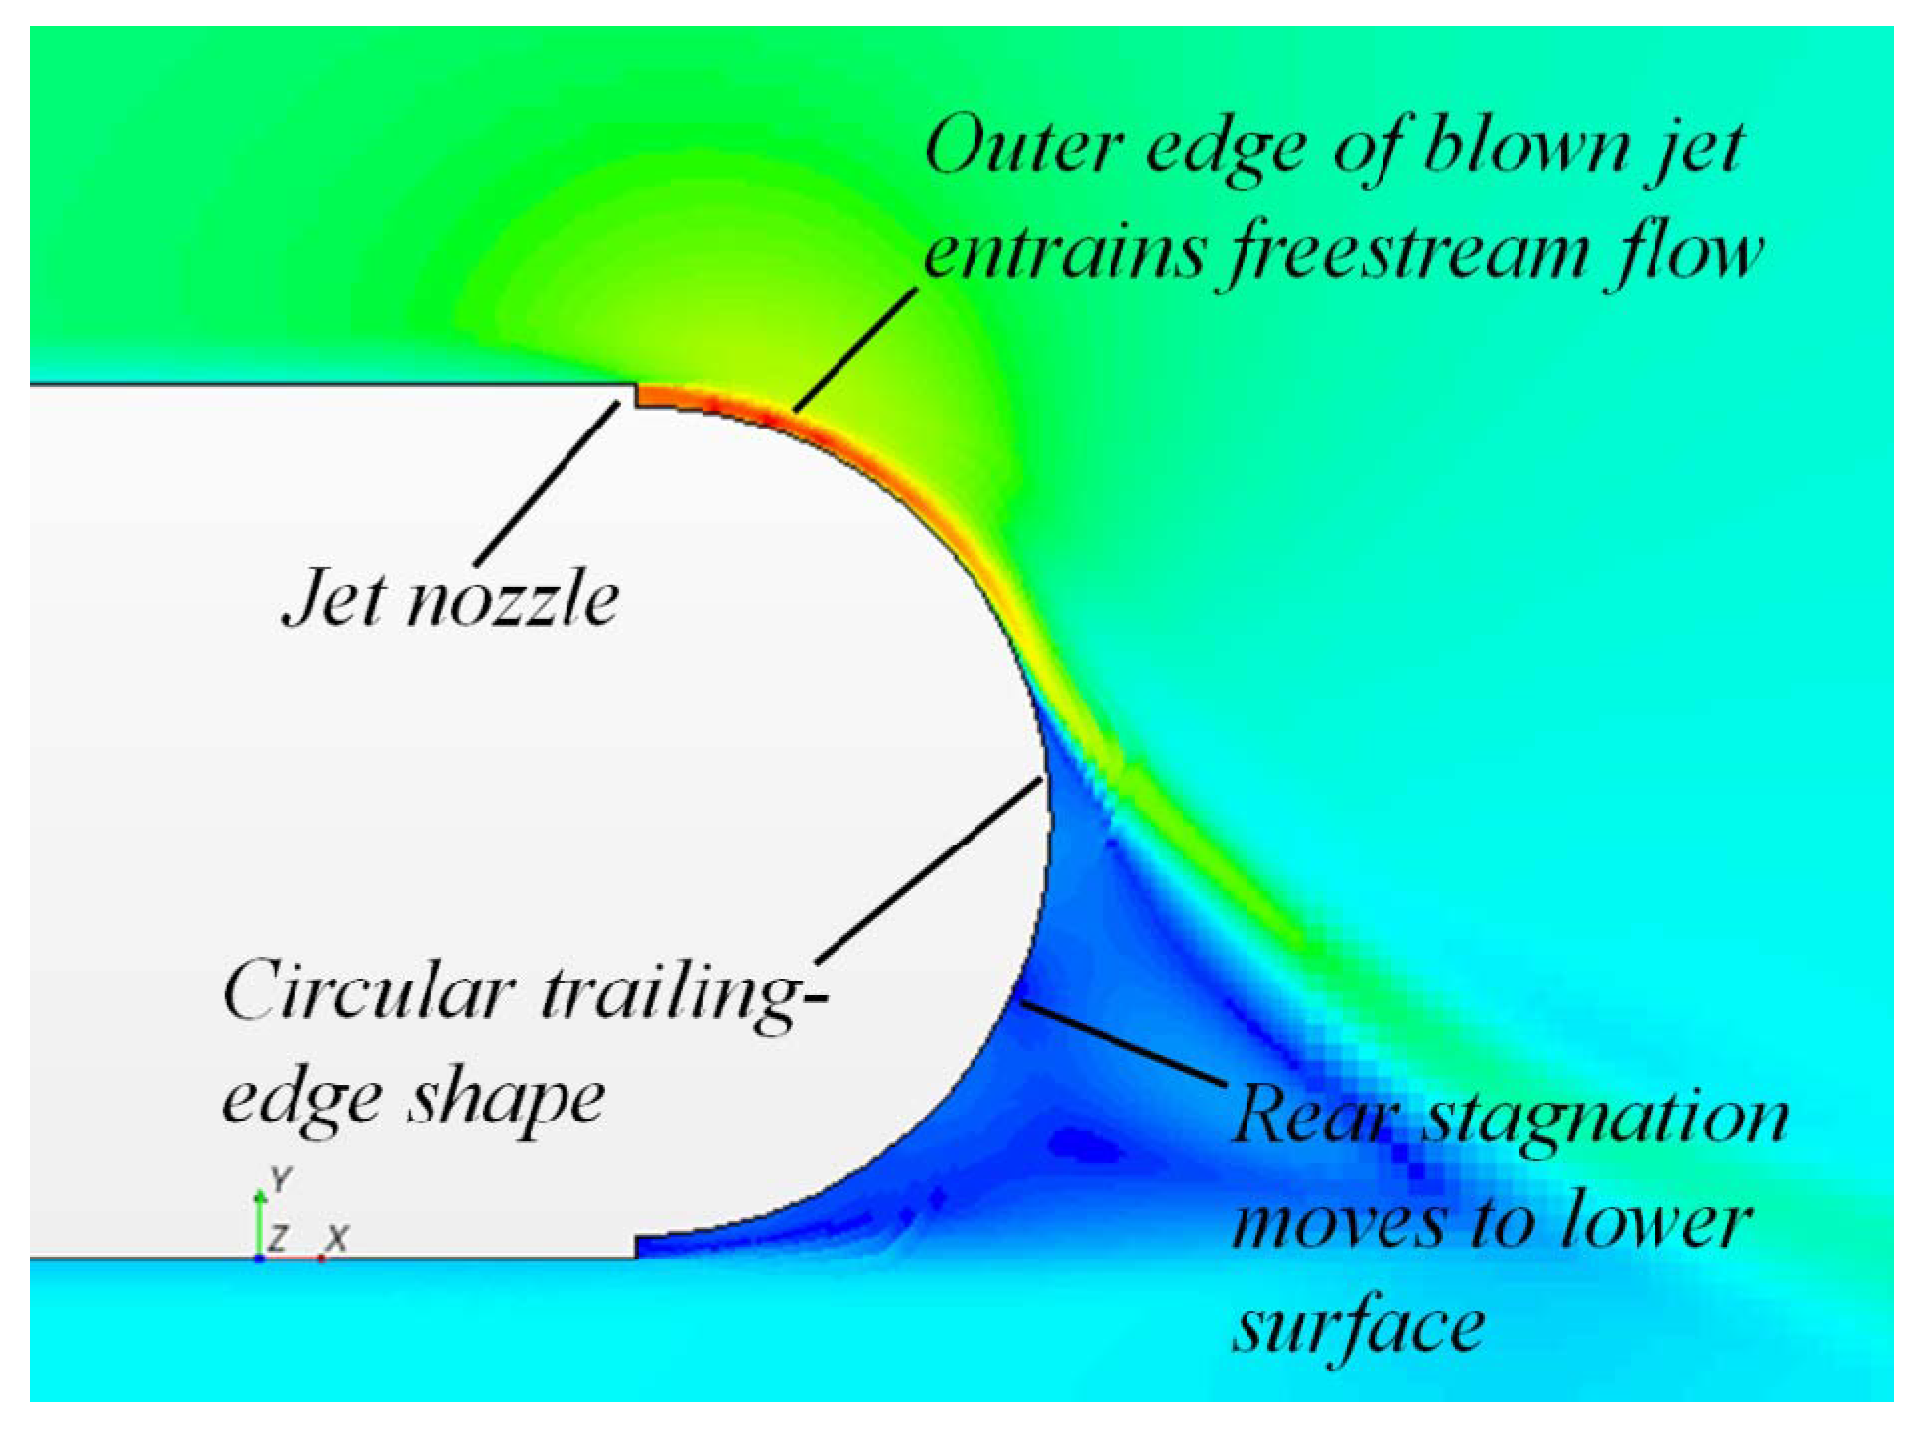
The principle of CC is illustrated in
Figure 2 which shows colour-shaded velocity contours around the trailing edge of a CC aerofoil with jet blowing from the upper nozzle. An air jet is introduced tangential to a curved surface creating a pressure force that deflects the jet towards the surface. For a rounded surface this pressure force can overcome the inertial force of the jet (
i.e., the Coanda effect) inducing a curvature of the surrounding streamlines.
Figure 2.
Mechanisms for circulation control.
Figure 2.
Mechanisms for circulation control.
This effect has been studied by many investigators for cylinders and modified aerofoil trailing-edge shapes [
18] and particularly by Englar
et al. [
30,
31,
32,
33,
34]. The pressure force decreases with distance from the jet nozzle exit and eventually equals the inertial force at which point the flow separates from the surface. The energy introduced by the jet per unit span is characterised by a non-dimensional momentum coefficient,
Cμ, given by:
where
is the jet nozzle velocity;
Q is the freestream dynamic pressure;
c is the aerofoil chord; and
is the jet mass flow rate, given by:
where
is the jet air density; and
h is the nozzle height.
As the momentum coefficient is increased, the rear stagnation position moves around the Coanda surface to the lower surface. Eventually the jet entrains the oncoming low momentum flow emanating from the lower surface flow field forming a pneumatic flap that continues to turn the streamlines. At low blowing levels (
Cμ < 0.03, [
34]) the jet exit pressure force is less than the inertial force. However, by entraining the outer freestream flow the jet re-energies the upper surface boundary layer resulting in a delayed separation position producing a curvature of the surrounding streamlines. Thus there are two mechanisms for lift augmentation. For low blowing levels (
Cμ < 0.03) lift augmentation is achieved through separation-control and for higher momentum coefficients “super-circulation” effects are achieved through jet entrainment. The degree of streamline turning, and therefore lift augmentation, has been shown to be dependent on the jet nozzle height (
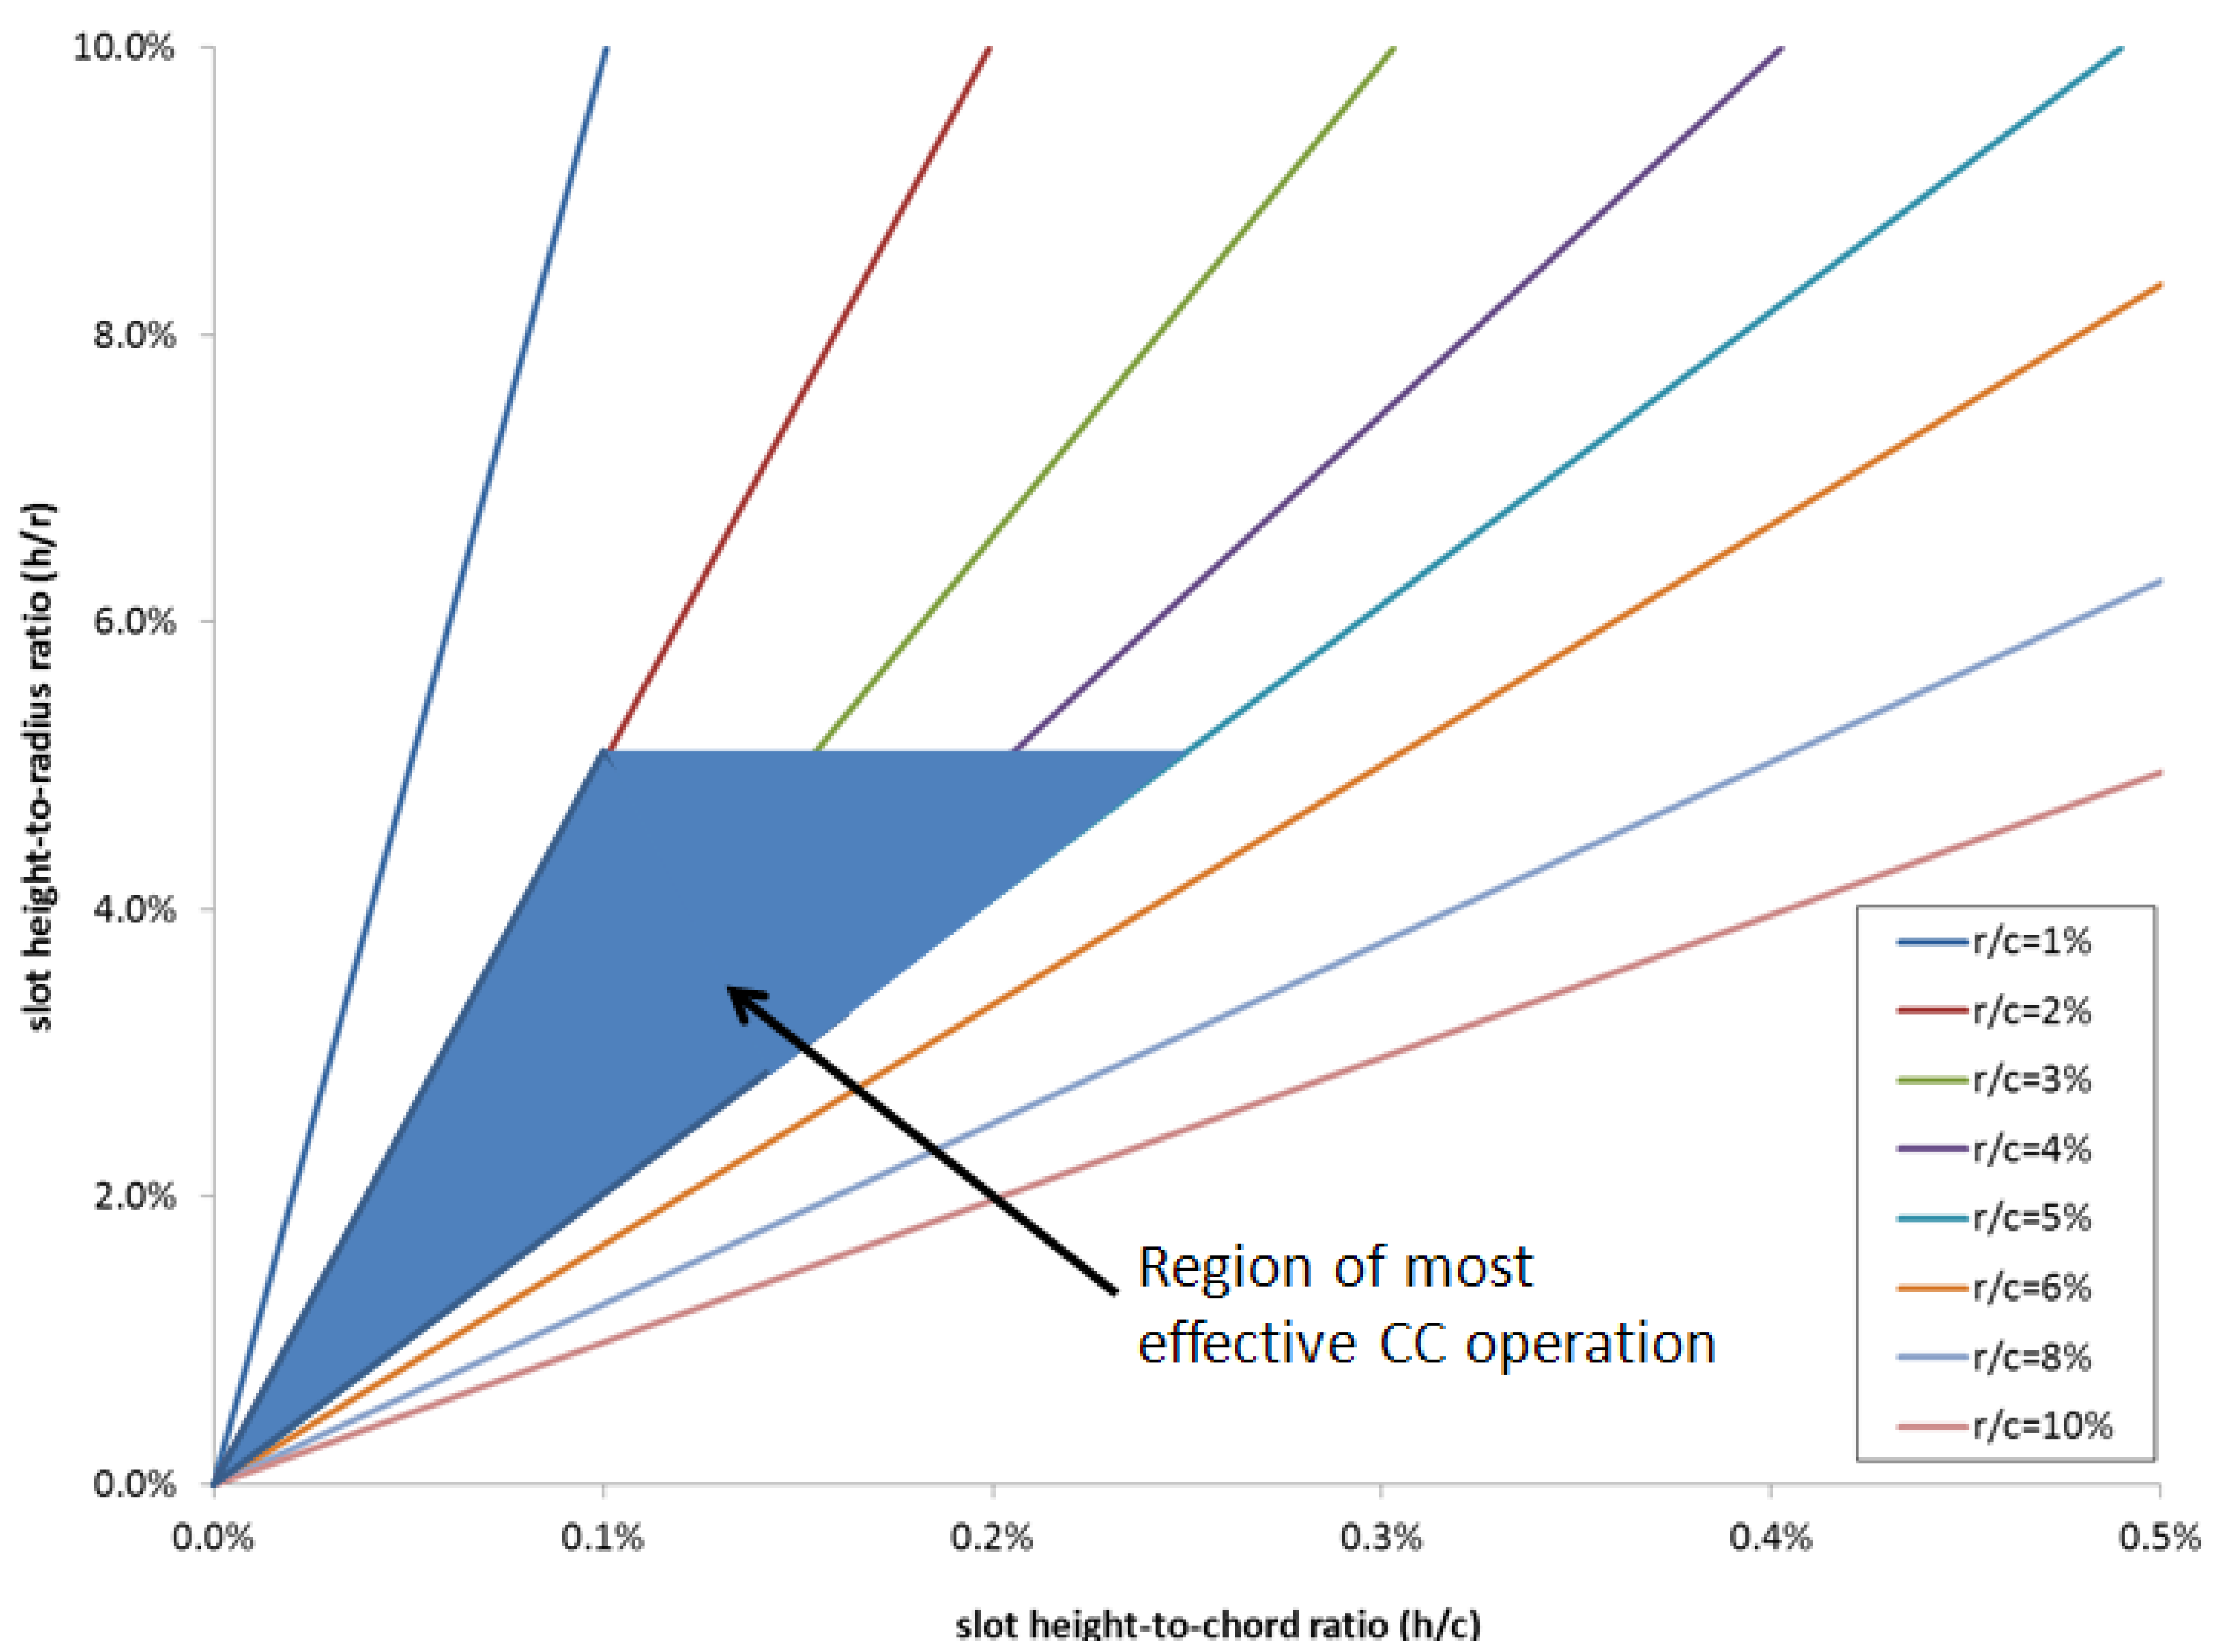
h), the trailing-edge (Coanda surface) radius and the jet momentum coefficient. Englar, responsible for much pioneering research into CC, proposed a range of these parameters where CC is most effective [
30] as shown in
Figure 3.
Figure 3.
Englar’s region of most effective CC operation [
30].
Figure 3.
Englar’s region of most effective CC operation [
30].
The choice of suitable parameters is a compromise between lift augmentation, additional base drag and the power required to pump the air jet. Aerofoil base drag increases for trailing-edge (TE) thicknesses greater than ~0.5%c giving a performance penalty particularly when CC is not utilised. A compromise can be to blow equally from top and bottom nozzles to create a virtual sharp trailing-edge that has been shown to reduce drag [
34] and may be suitable for some applications. Thus there exists a conflicting requirement for a large TE radius to maximize the effectiveness of the Coanda surface in augmenting lift, and a small TE radius to minimize base drag. Furthermore, a small nozzle height can reduce the jet mass flow and therefore the pump power, but can reduce CC effectiveness.
Because of these constraints CC has not been widely adopted for aerospace applications. The first flight demonstrator was built in 1976 by West Virginia University (WVU) and was equipped with a small retractable Coanda surface TE flap, increasing
CL from 2.1 to 5.3 for a blowing momentum coefficient of 0.12 [
35]. Also in the late 1970s, the CC concept was used on a modified U.S. Navy A-6 flight demonstrator achieving a lift augmentation factor of 2.2 [
36]. More recently BAE Systems working with Cranfield and other Universities designed and successfully flew the Demon unmanned aircraft using only CC as “fluidic flight controls” [
37]. During the 1980s, there was an increased interest in CC for helicopter rotors. The X-Wing rotor showed significant promise by reducing blade/vortex noise as well as demonstrating rotor trim and lift augmentation through the use of cyclic blowing [
38]. Researchers at NASA also demonstrated that pulsed blowing at frequencies above 10 Hz can achieve significant lift augmentation with a 42%–50% reduction in the required mass flow [
34].
In the past two decades CC has also been applied to non-Aerospace applications including the hydrodynamic control of ships with a CC rudder [
39], base drag reduction of heavy goods road vehicles [
32] and on a smaller scale for packaging machinery and in the Dyson Airblade hand drier and Air Multiplier bladeless fan for example. In 2006 the aerodynamic performance of a circulation controlled horizontal axis wind turbine (HAWT) rotor was investigated numerically and showed an augmentation in the net power production at low wind speeds (7 m/s) with moderate blowing momentum coefficients (
Cμ ≤ 0.075) [
19]. WVU also performed preliminary numerical studies on a CC H-type VAWT in 2009, predicting that overall power output performance could be increased by 24% at a blowing coefficient of
Cμ = 0.1 [
20].
It is recognized that predicting the performance of CC aerofoils represents a significant challenge for state of the art CFD methods [
40,
41]. In 2004, a NASA organized CC workshop showed that CFD simulations were unable to consistently and accurately predict the performance of a baseline CC airfoil [
41]. In particular, a failure to match the jet separation and streamline turning for
Cμ > 0.1 resulted in an over-prediction of lift. These issues were primarily linked to inadequacies of turbulence models and grid refinement in capturing the boundary layer separation location and jet interaction. For this study therefore, the use of CFD is limited to predicting general performance trends of CC aerofoils and as a guide for understanding flow-field developments, with a momentum model used to evaluate the net contribution to VAWT turbine power.
4. Results and Discussion
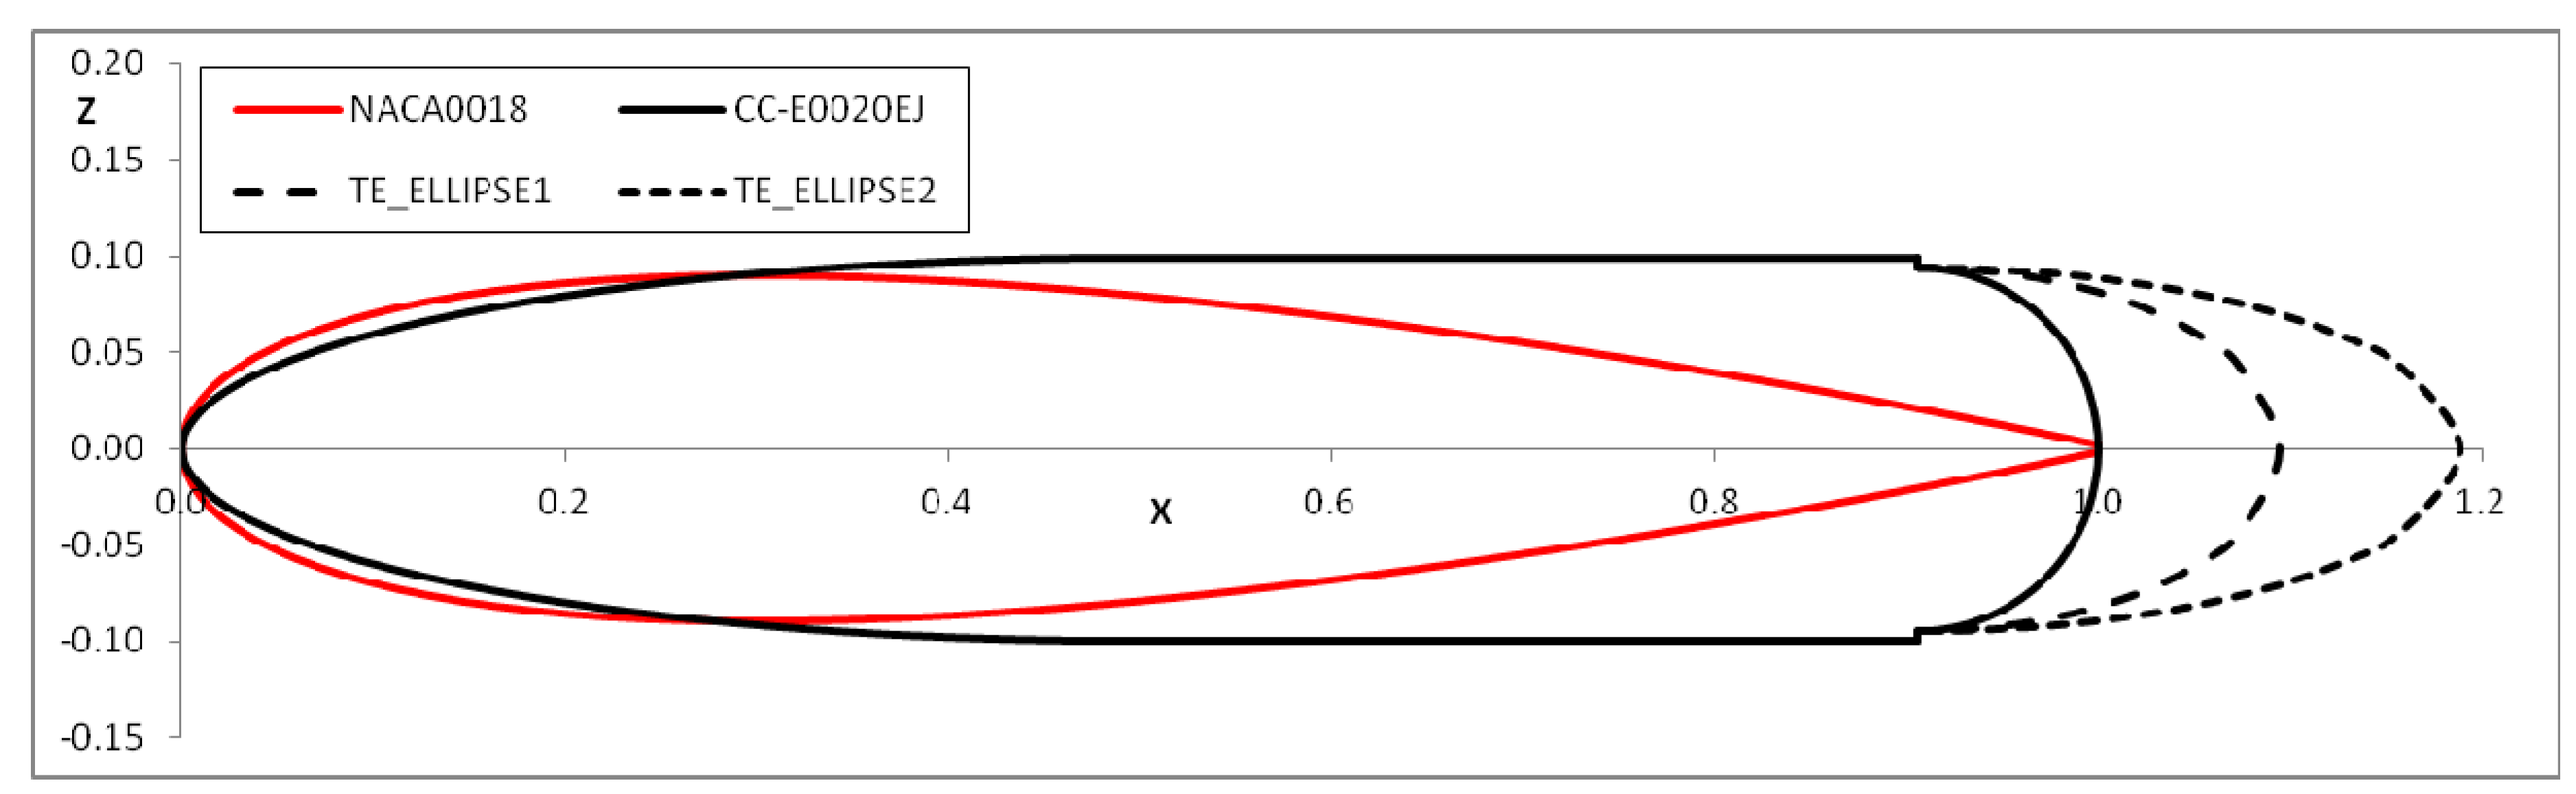
NASA and the Georgia Tech Research Institute (GTRI) defined a generic CC aerofoil geometry to provide basic flow physics and performance characteristics necessary to improve design tools and validate CFD, designated the CC-E0020EJ aerofoil. As such it is not optimised for an engineering application having a simple elliptic leading edge shape and a large circular TE shape for accurate measurements of jet separation. The 20% thick section has a 0.22 m chord, with nozzle heights that could vary from 0.1%c to 0.5%c, and is shown in
Figure 4 compared with the NACA0018 section (scaled to a unit chord). The aerofoil was jointly tested in the Basic Aerodynamic Research Tunnel at NASA Langley as well as the Model Test Facility at the GTRI [
33].
Figure 4.
A comparison of NACA0018 and CC aerofoil profiles.
Figure 4.
A comparison of NACA0018 and CC aerofoil profiles.
To eliminate low Reynolds number characteristics, such as laminar separations, the wind tunnel velocity was increased until a constant baseline drag was achieved. Using this criteria, measurements were obtained for a tunnel dynamic pressure of 718 Pa corresponding to a chord Reynolds number,
Rc = 0.5 M. These measurements are described in detail in [
33] and have been used to evaluate the CFD procedure used in this study.
The baseline aerofoil has a lift curve slope,
, and a zero-lift drag coefficient,
CD0 = 0.053 (with no blowing). Compared with measured data for the NACA0018 aerofoil at
Rc = 0.7 M [approximated using Equation (4)], the CC-E0020EJ aerofoil has poor performance with a base drag that is over 6 times greater. This is evident from
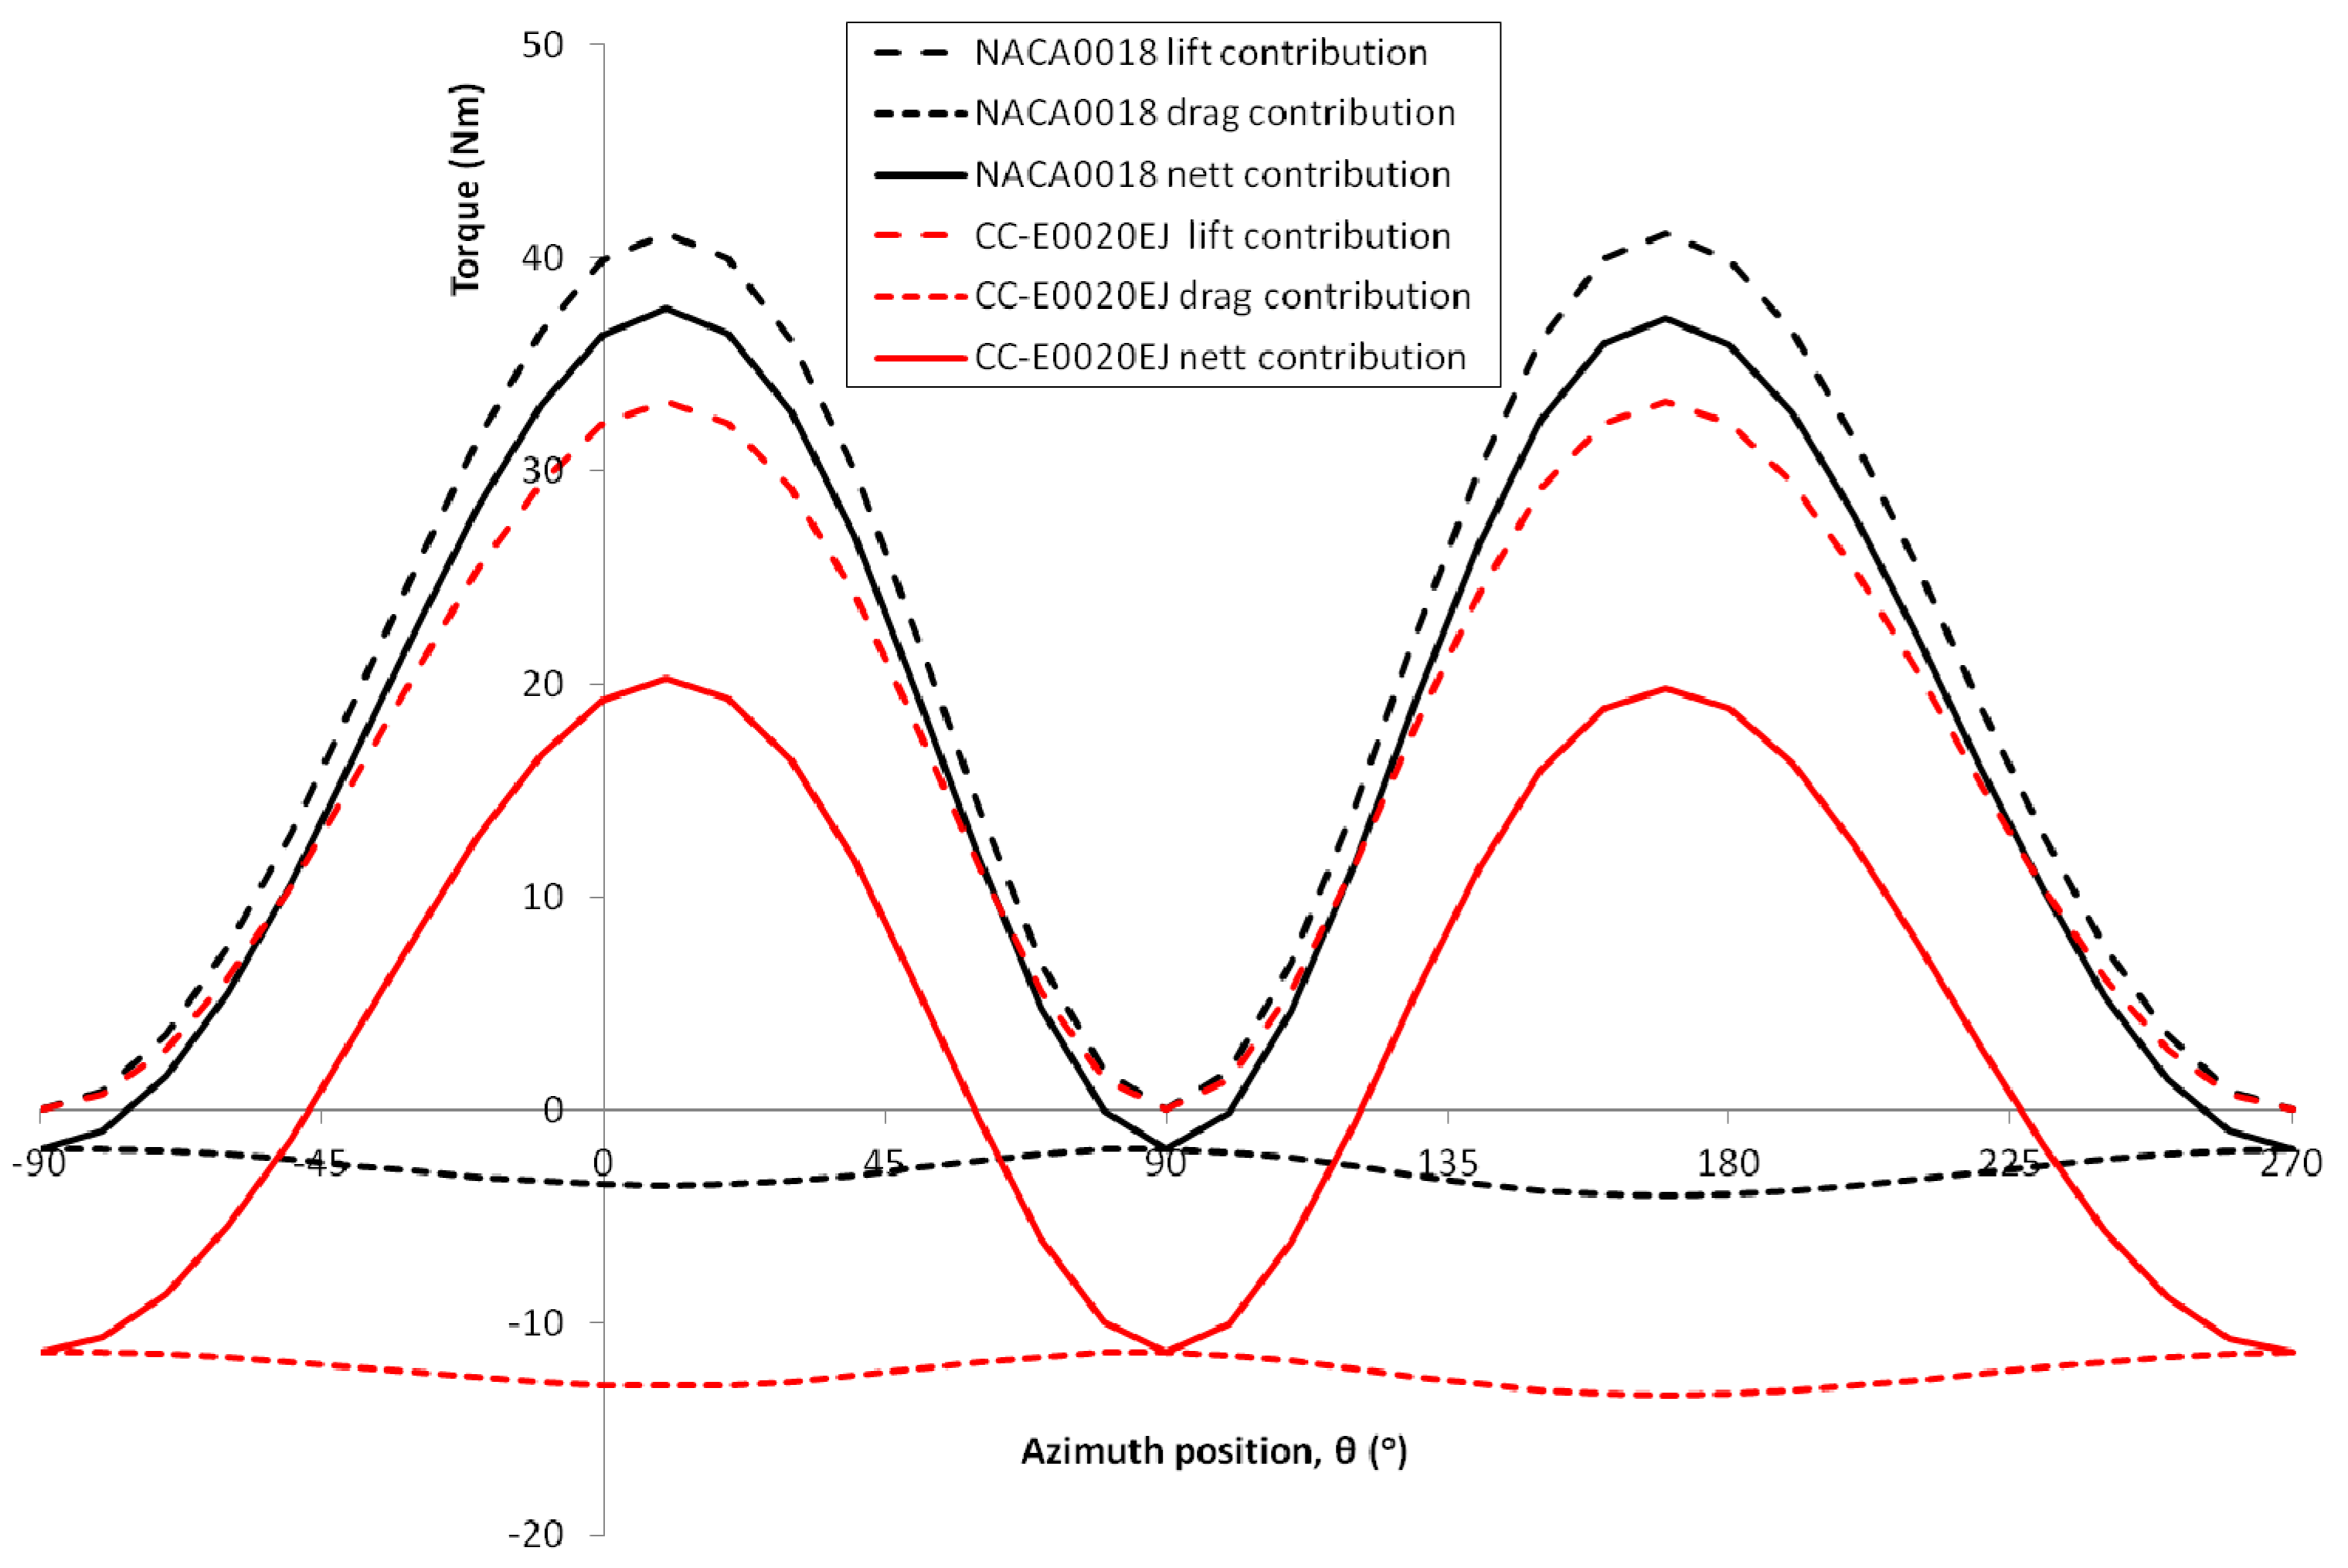
Figure 5 showing how predicted torque varies with blade position using both the NACA0018 and CC-E0020EJ aerofoils without blowing. For this relatively simple comparison a torque contribution is calculated for the mid-span blade element of a H-rotor VAWT using Equations (1)–(3) and the measured lift and drag characteristics, and neglects the momentum and tip losses and dynamic effects included in the DMST model. Since the variation of drag with AoA was not reported in [
33], it is assumed that the CC-E0020EJ aerofoil experiences the same drag increase with AoA as the NACA0018 aerofoil, as given in Equation (7):
Figure 5.
Simplified VAWT torque production using NACA0018 and baseline CC aerofoils.
Figure 5.
Simplified VAWT torque production using NACA0018 and baseline CC aerofoils.
Assuming the VAWT has a radius of 9.75 m and operates at 33 rpm and a wind speed of 6 m/s, the predicted lift and drag contributions to torque are shown in
Figure 5 with blade azimuth position,
. At the −90° and +90° positions the blade chord is parallel with the local flow direction and the lift contribution is therefore zero (since
= 0°). The positive lift contributions track the AoA as it varies almost sinusoidally between ±10°. Due to a lower lift curve slope the CC-E0020EJ aerofoil produces a smaller lift contribution than the NACA0018 aerofoil. However, it is the relatively high drag contribution of the CC-E0020EJ aerofoil that significantly reduces the net torque. Since it is inevitable that a CC aerofoil will have a higher base drag it is therefore essential that sufficient lift augmentation is created to overcome this higher drag and the pump power.
In the UK, VAWT Ltd constructed a series of 2-bladed H-rotors including the VAWT-260, a commercial 20 m diameter turbine that operated on the Scilly Isles from 1988 to 1992 with a rated power of 105 kW. Turbine geometry and measured shaft power (
data is published by Morgan
et al. [
45]. This turbine utilized a NACA0018 blade section and has been adopted for this study as a baseline for evaluating CC blade options.
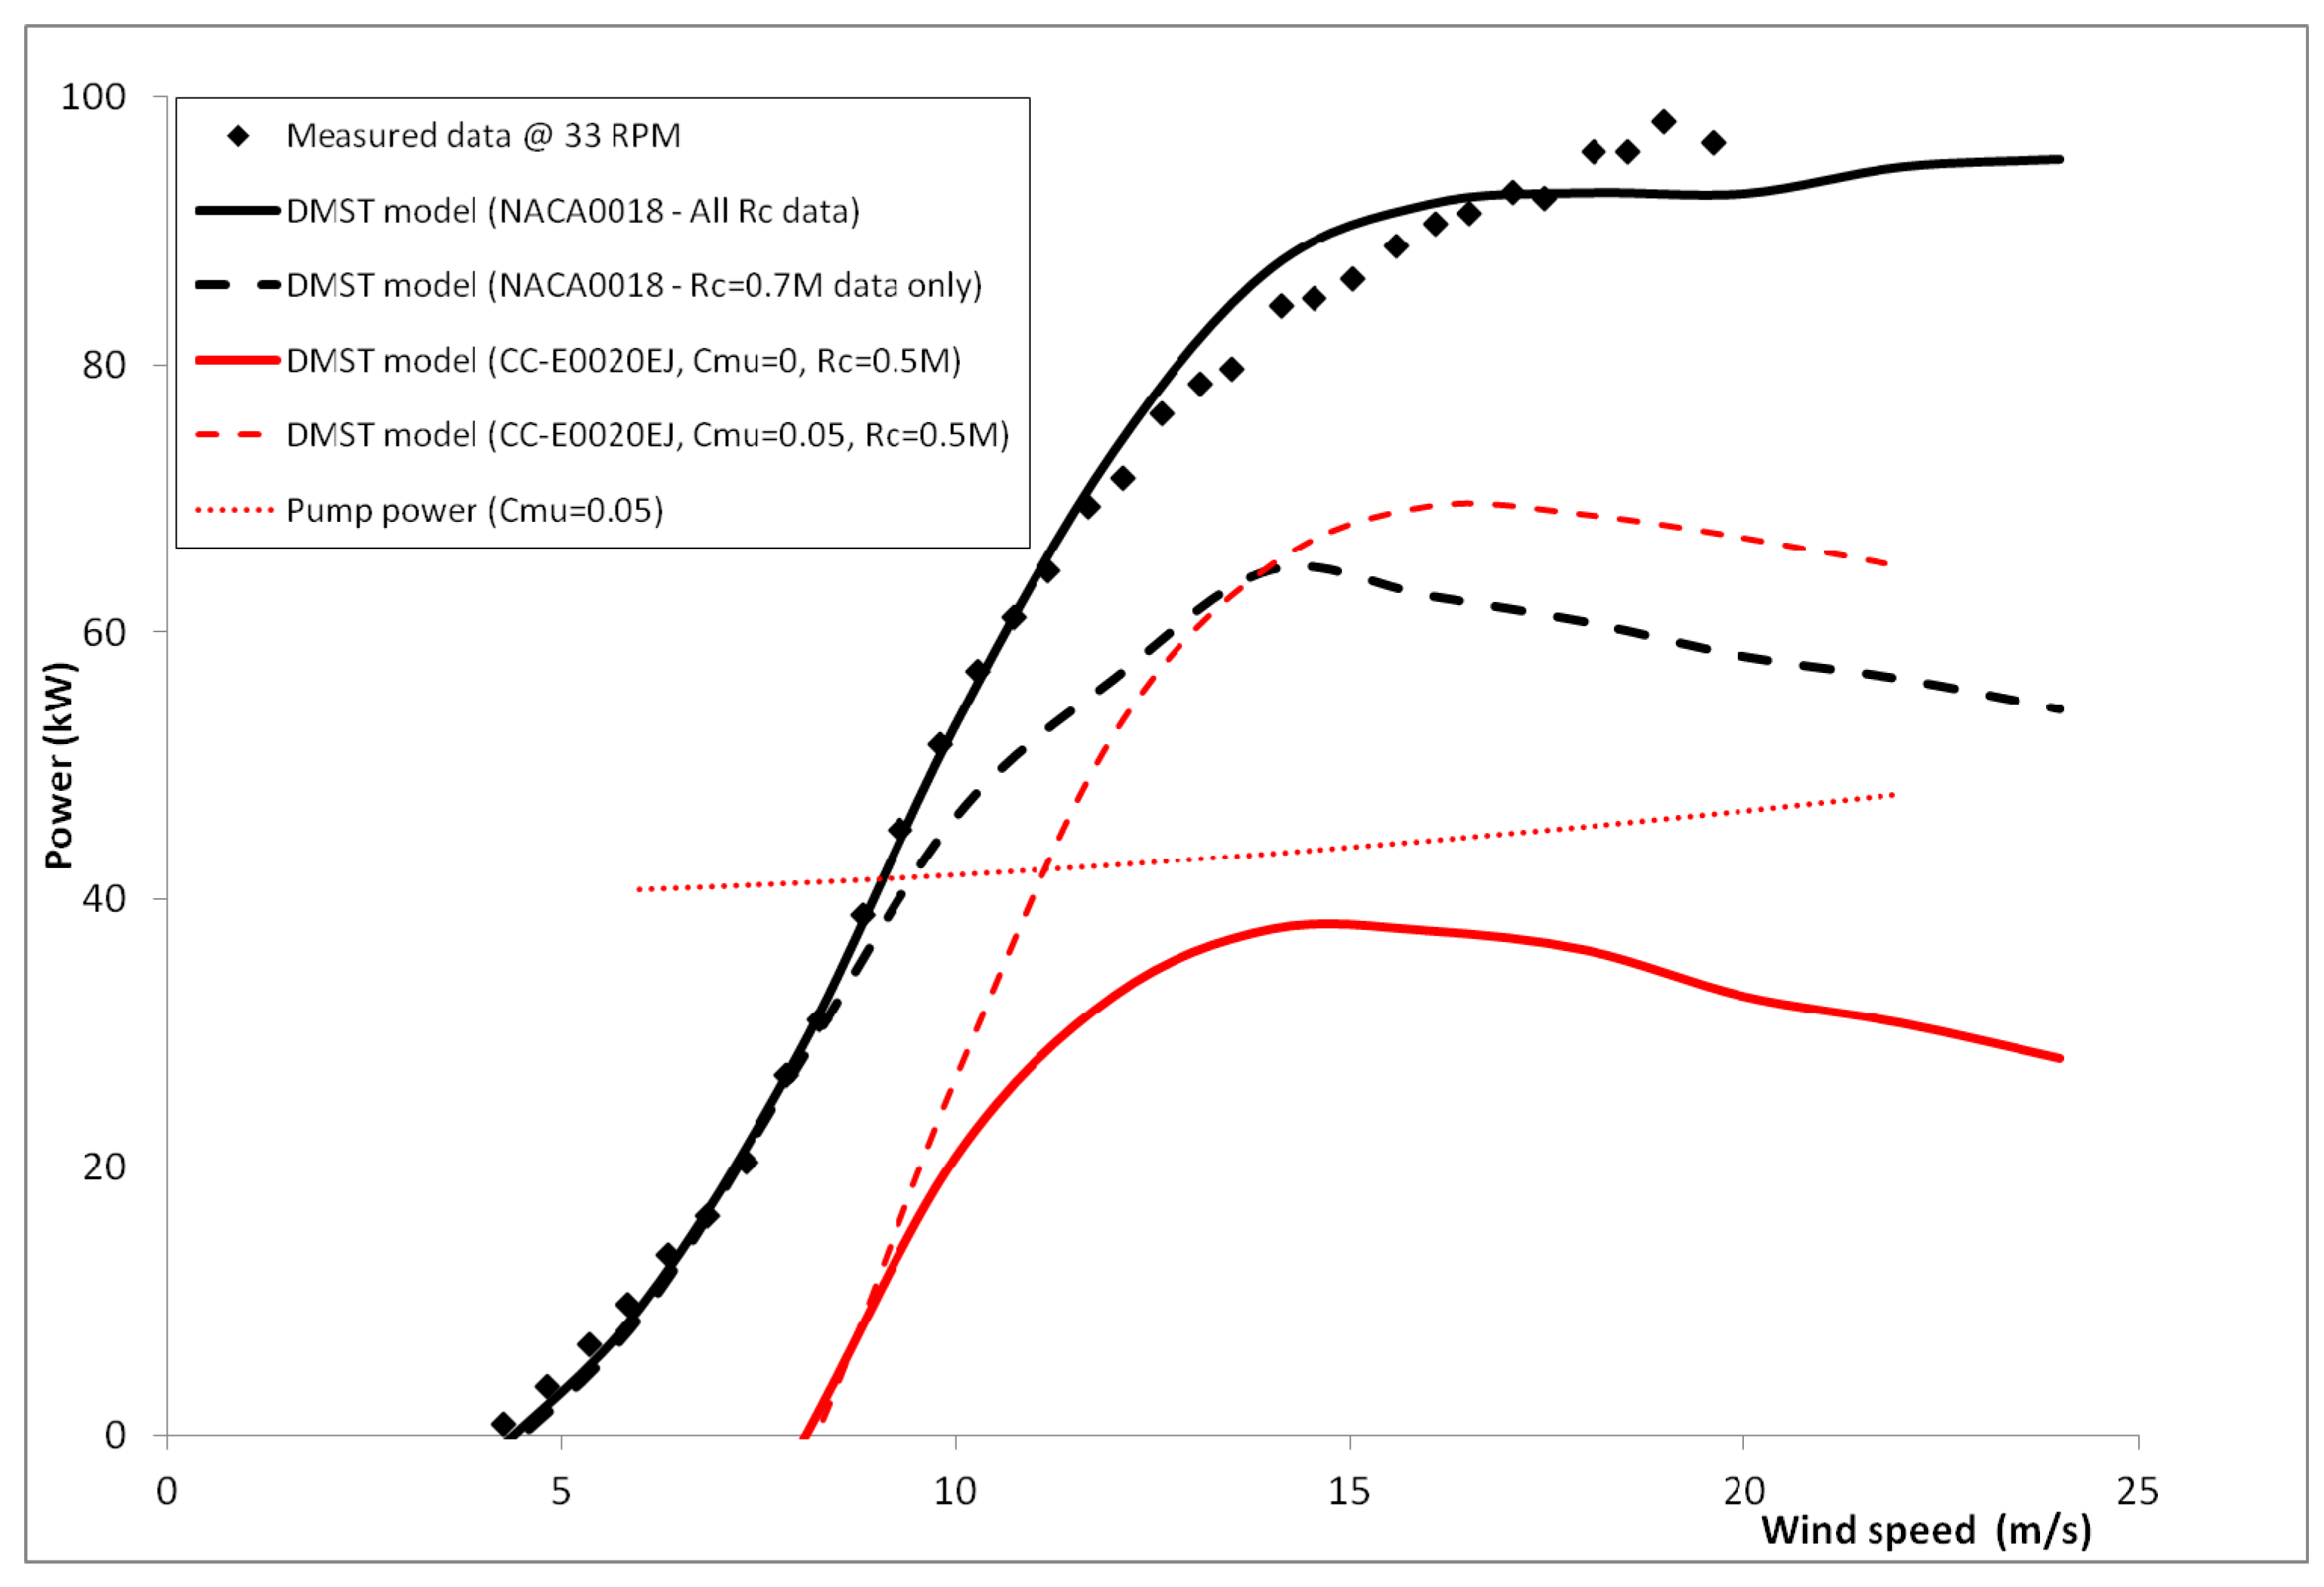
Figure 6 compares the variation of measured shaft power (
) converted to electrical power (
using Equation (8) and assuming a drivetrain efficiency (
) of 90%, with wind speed:
Figure 6.
VAWT-260 H-rotor power curve.
Figure 6.
VAWT-260 H-rotor power curve.
Also shown in
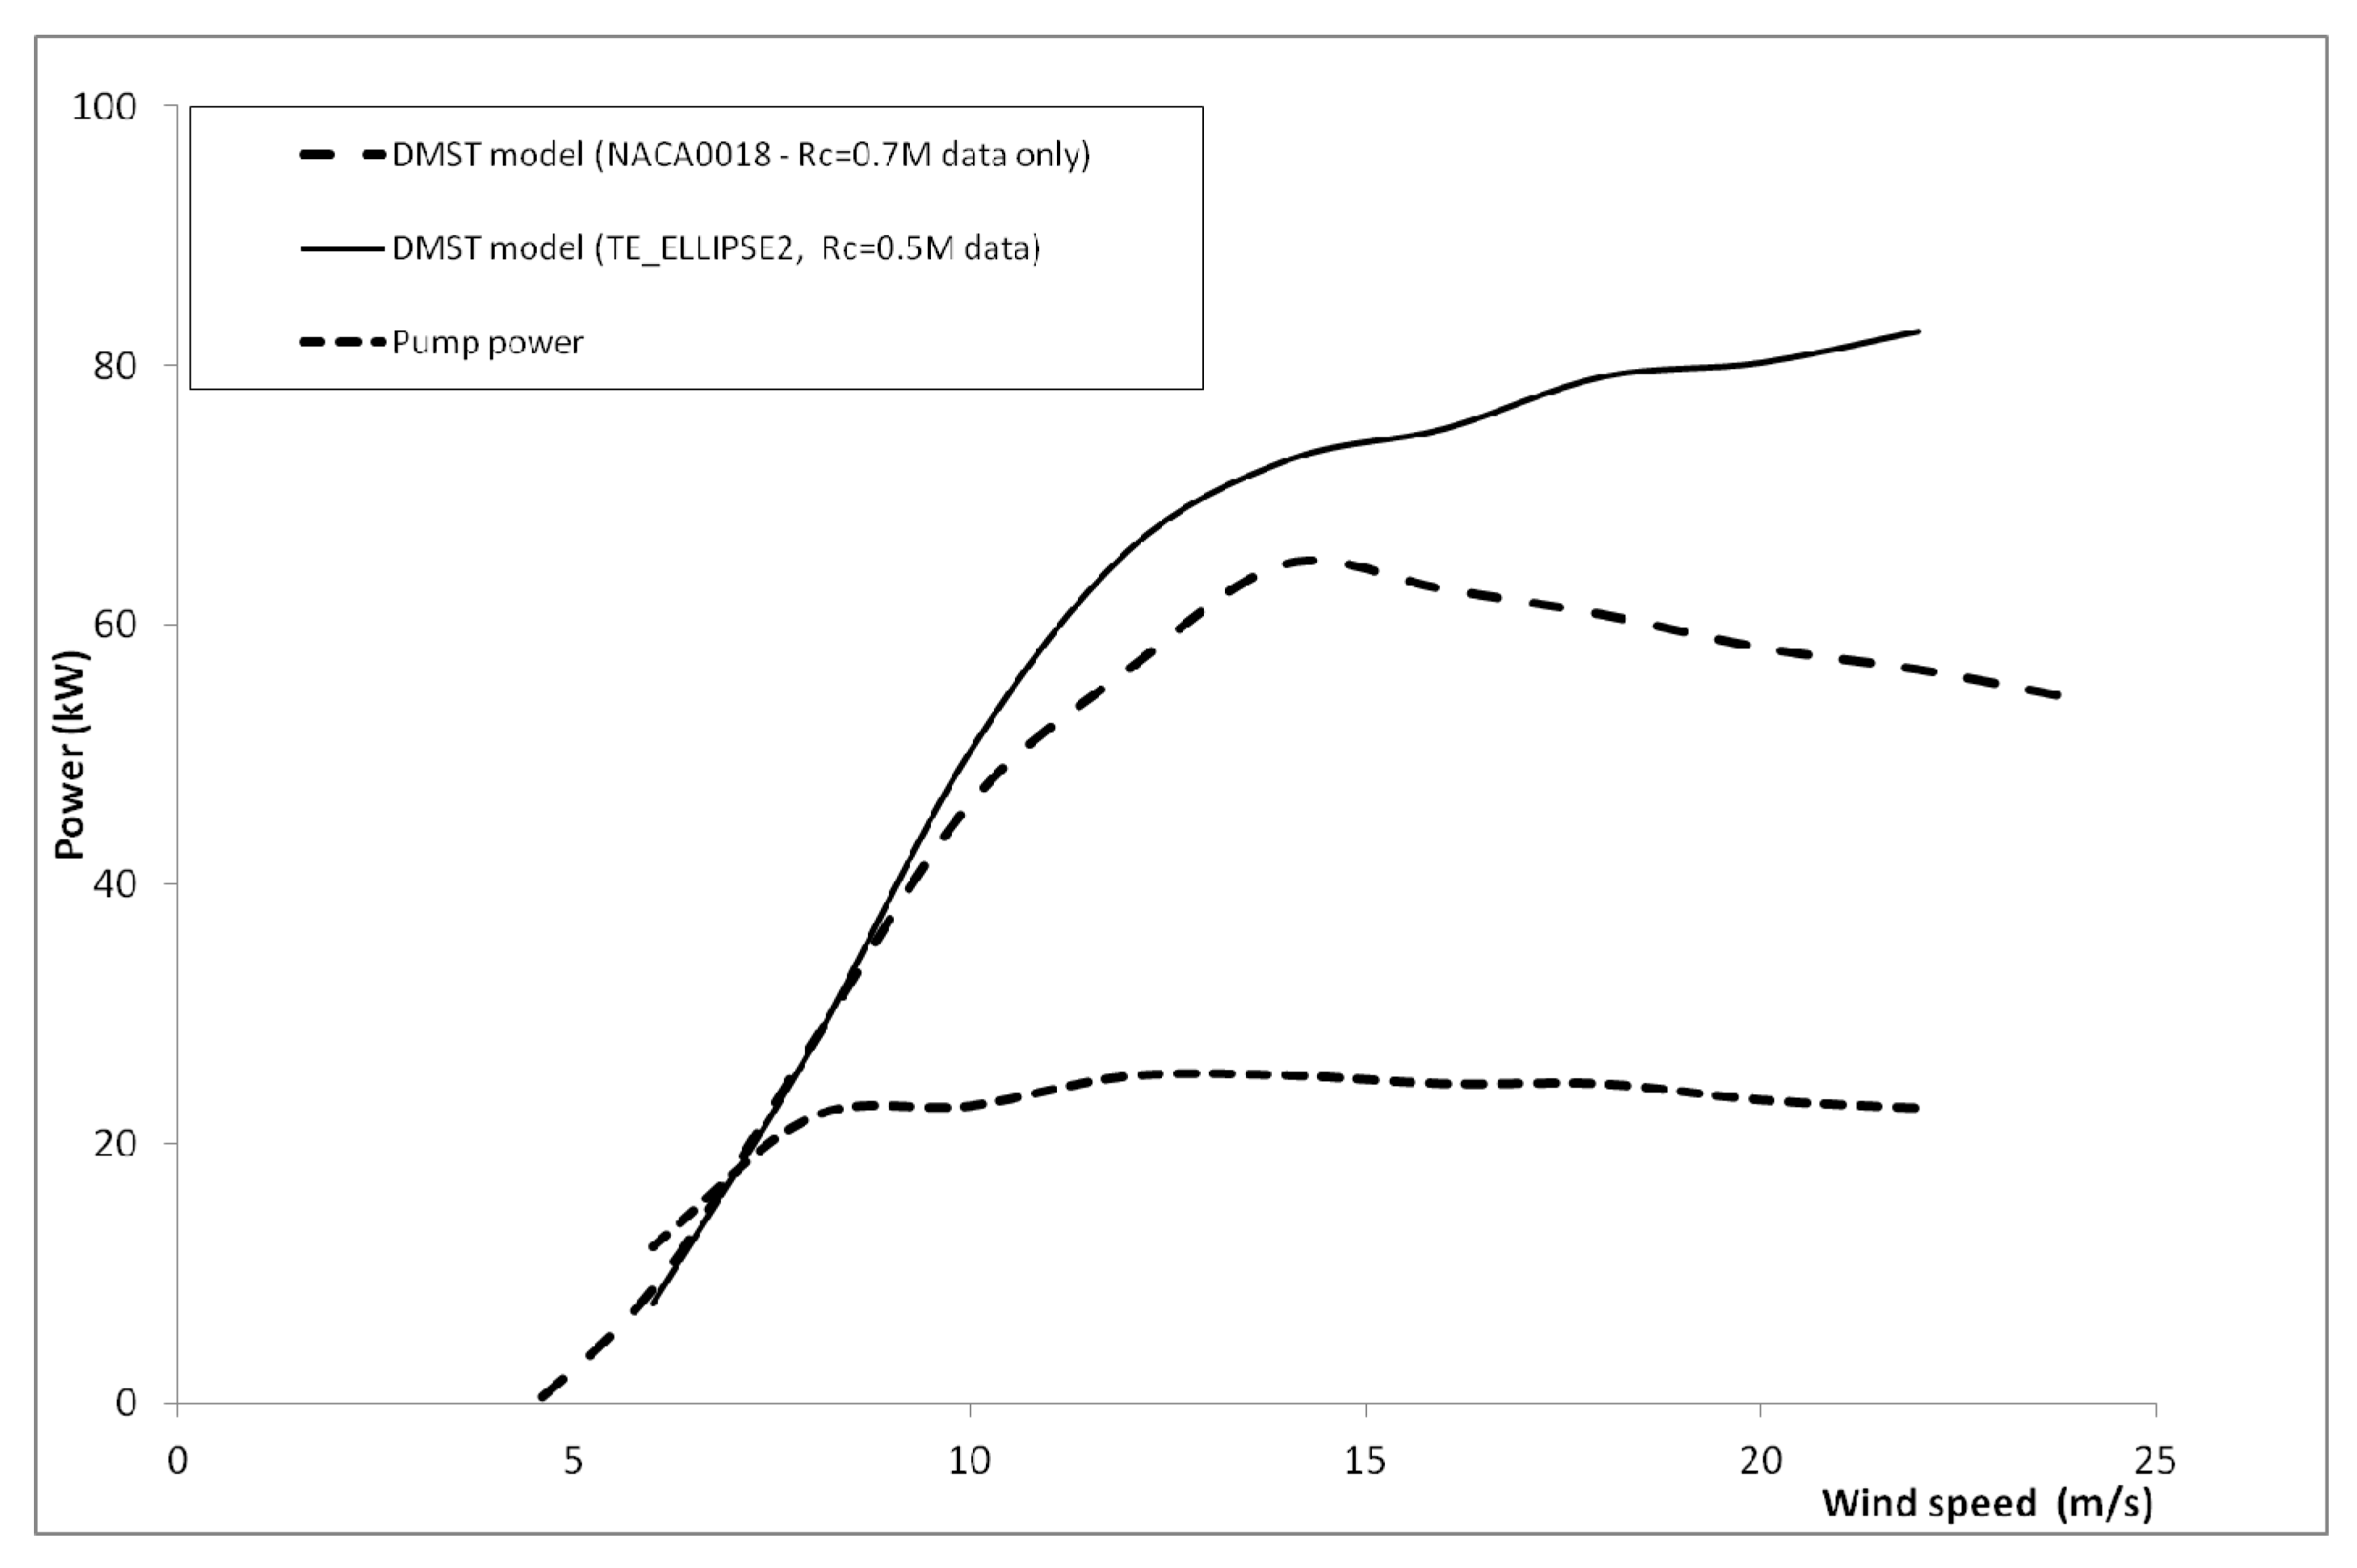
Figure 6 is the predicted electrical output using the DMST model (all
Rc data) indicating the good accuracy of the method even at high wind speeds where static and dynamic stall occurs.
The DMST method uses measured static lift and drag data for the NACA0018 aerofoil for Reynolds numbers in the range
Rc = 40 K to 5 M [
12]. However, since measured data is only available for the CC-E0020EJ aerofoil at
Rc = 0.5 M,
Figure 6 also includes the predicted power for the baseline turbine using only the measured
Rc = 0.7 M data for comparison with CC blade options. As would be expected, differences occur at moderate to high wind speeds when stall occurs which is clearly dependent on Reynolds number. However, for the purposes of comparing the relative performances of CC aerofoils and the NACA0018 aerofoil, results for this single Reynolds number will be considered, being indicative of overall rotor performance.
Figure 6 also presents the predicted turbine power for blades with the CC-E0020EJ aerofoil without blowing (
Cμ = 0), indicating a significant reduction in generated power for reasons discussed previously. If blowing with a momentum coefficient,
Cμ = 0.05, is introduced then the net electrical power,
i.e.,
, shows a significant increase above wind speeds of 10 m/s and exceeds the power of the NACA0018 section for wind speeds above ~14 m/s. However, it should be noted that at these higher wind speeds stall effects may not be correctly modeled due to the limited Reynolds number data. It is assumed that the blowing is continuous from both blades over 90% of the span and that blowing switches instantly from upper to lower surface nozzles as the blade traverses the upwind and downwind cycles respectively. The pump power is calculated using Equation (9), assuming adiabatic compression using a fan taking non-rotating air from the rotor hub:
where 1 and 2 denote freestream and plenum chamber conditions respectively;
is the ratio of specific heats;
R the gas constant for air and an assumed fan efficiency
= 80%. The plenum pressure ratio
P2/
P1 was measured during tests and varied with momentum coefficient [
33] according to Equation (10):
Due to the relatively high drag of the CC-E0020EJ aerofoil blowing at low wind speeds does not improve low wind speed performance. Two further CC aerofoil sections have therefore been defined with an objective of reducing base drag whilst maintaining similar levels of lift augmentation. These aerofoils are shown in
Figure 4, designated TE_ELLIPSE1 and TE_ELLIPSE2, and were generated by modifying the trailing edge shape from a circular arc to 50% and 33% ellipses respectively, thereby increasing the chord for the same maximum thickness. The Star-CCM+ CFD package was used to derive static lift and drag characteristics of these aerofoils with and without blowing. The air jet is imposed by specifying a uniform inflow velocity boundary condition at the jet nozzle boundary. Previous researchers have modeled the internal plenum chamber and nozzle shape to capture the actual jet velocity profile but also highlight difficulties in modeling these flows with CFD [
40,
41]. By assuming a uniform jet velocity profile we are not modeling the true interaction between the jet and freestream flow, but it is hoped to generate gross effects with reasonable accuracy that are suitable for inclusion in the DMST model for evaluating turbine relative performance. Experimental results reported in [
33] showed that nozzle height does not have a large influence on lift augmentation for
Cμ < 0.1, and so all CFD results presented here have assumed a nozzle height,
h = 0.5%c. This was initially chosen to give a lower jet velocity for a given value of
Cμ due to concerns of potential compressibility effects. However,
Figure 3 indicates that this value is outside Englars’ region of most effective CC operation [
30] and with hindsight a reduced nozzle height may have been more effective.
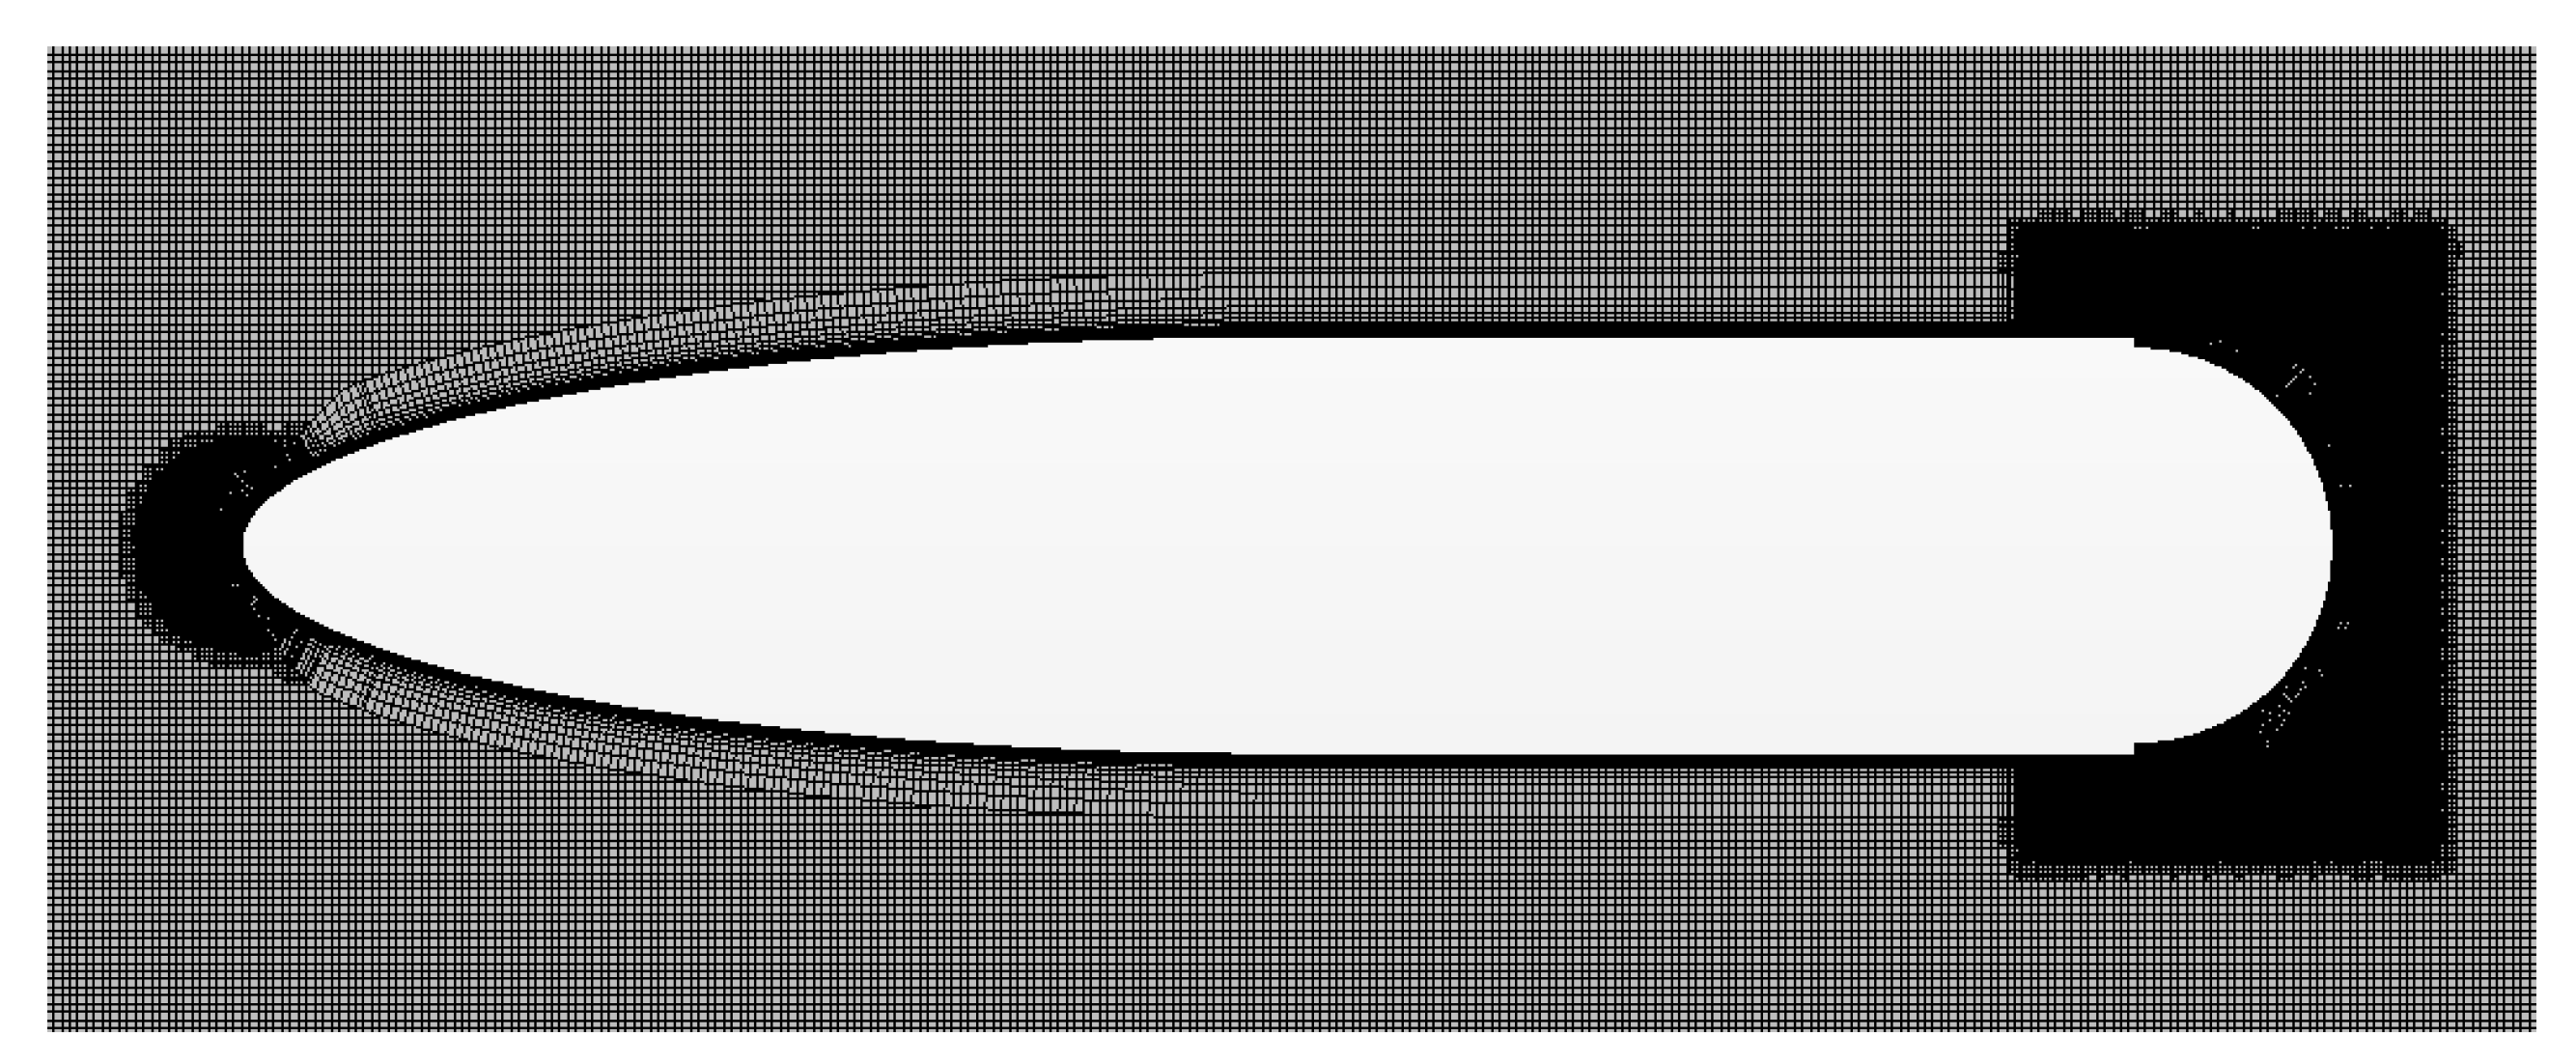
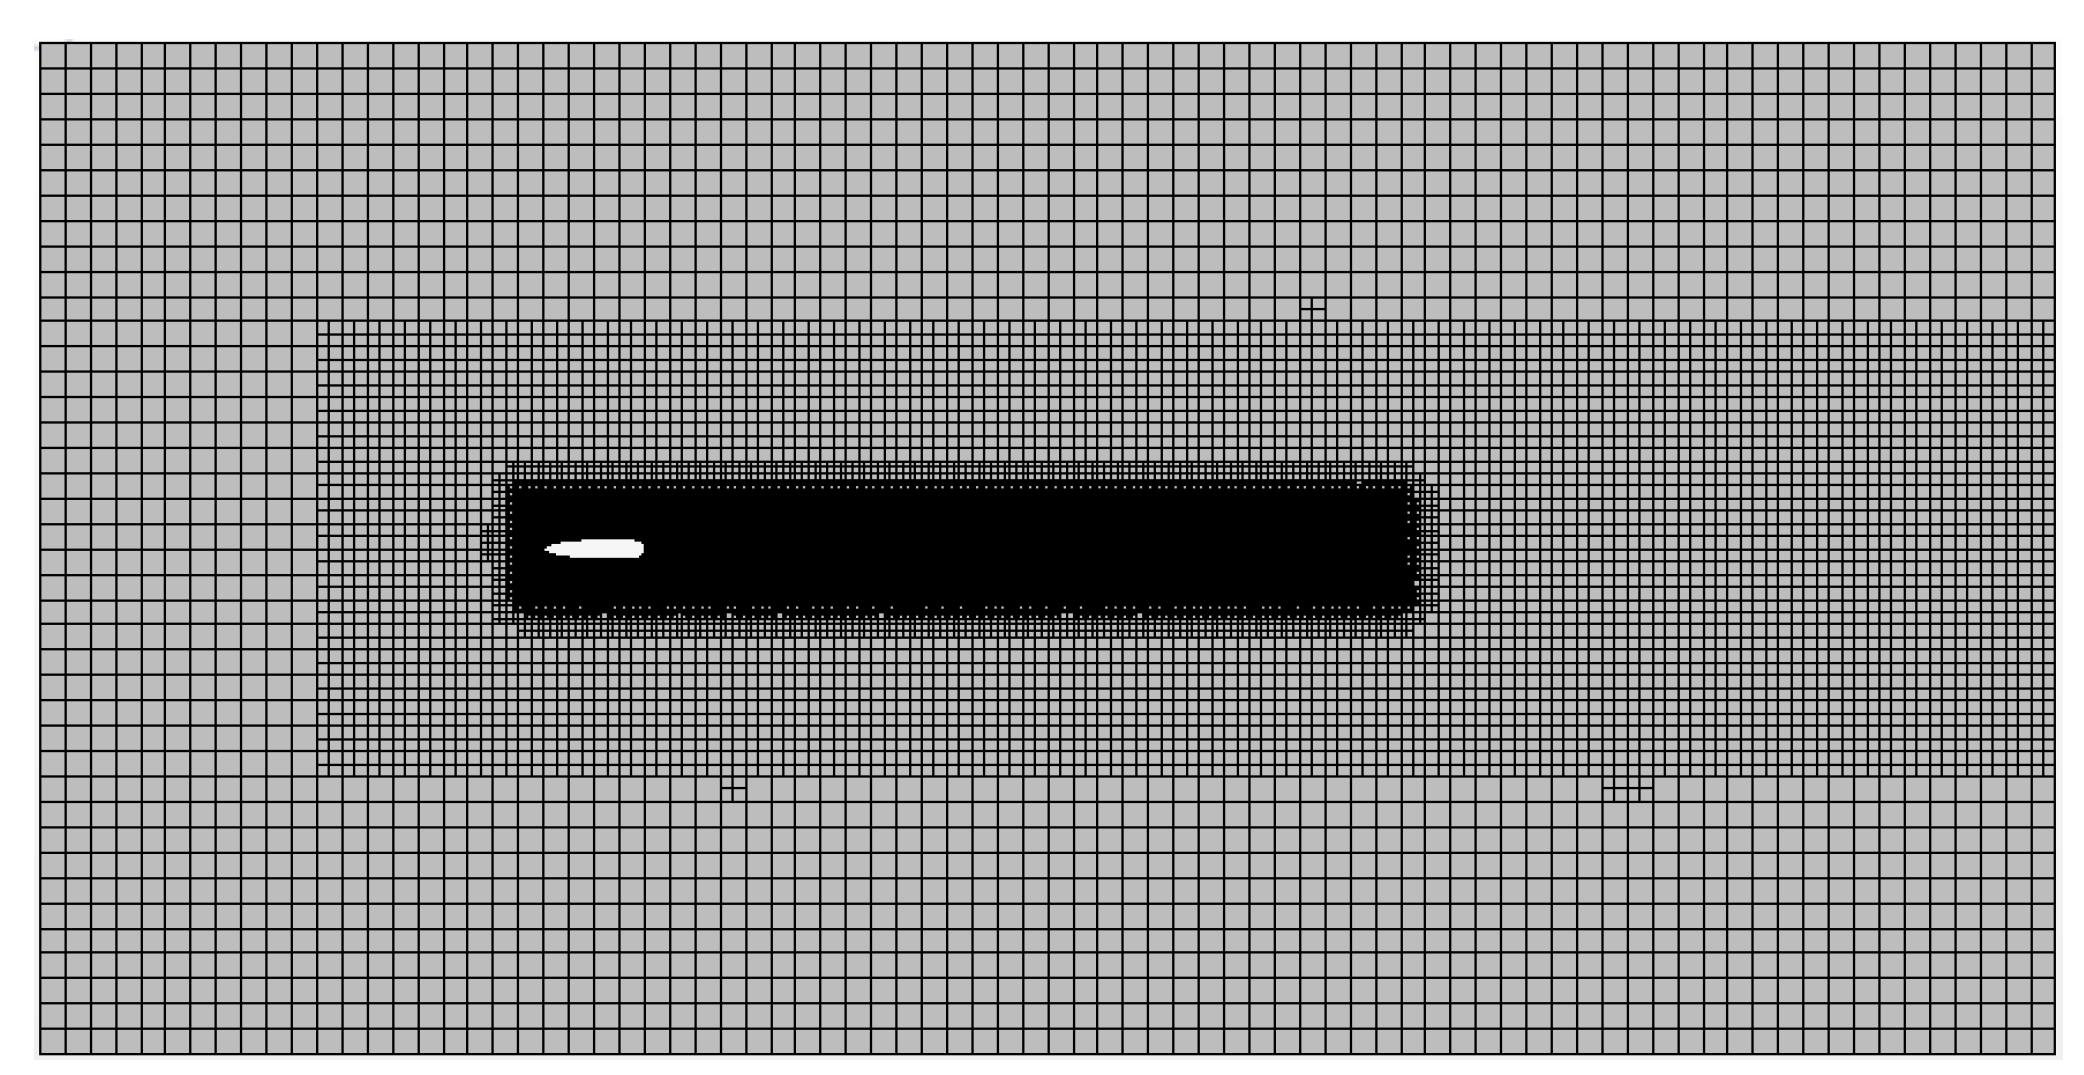
Steady CFD solutions were performed with the k-ω Menter SST turbulence model, suitable for flows with smooth surface separations. The 2D Octree hexahedral mesh shown in
Figure 7 was used with appropriate mesh refinement (illustrated in
Figure 8) included near the leading and trailing edges to capture the jet interaction and off-surface flow development.
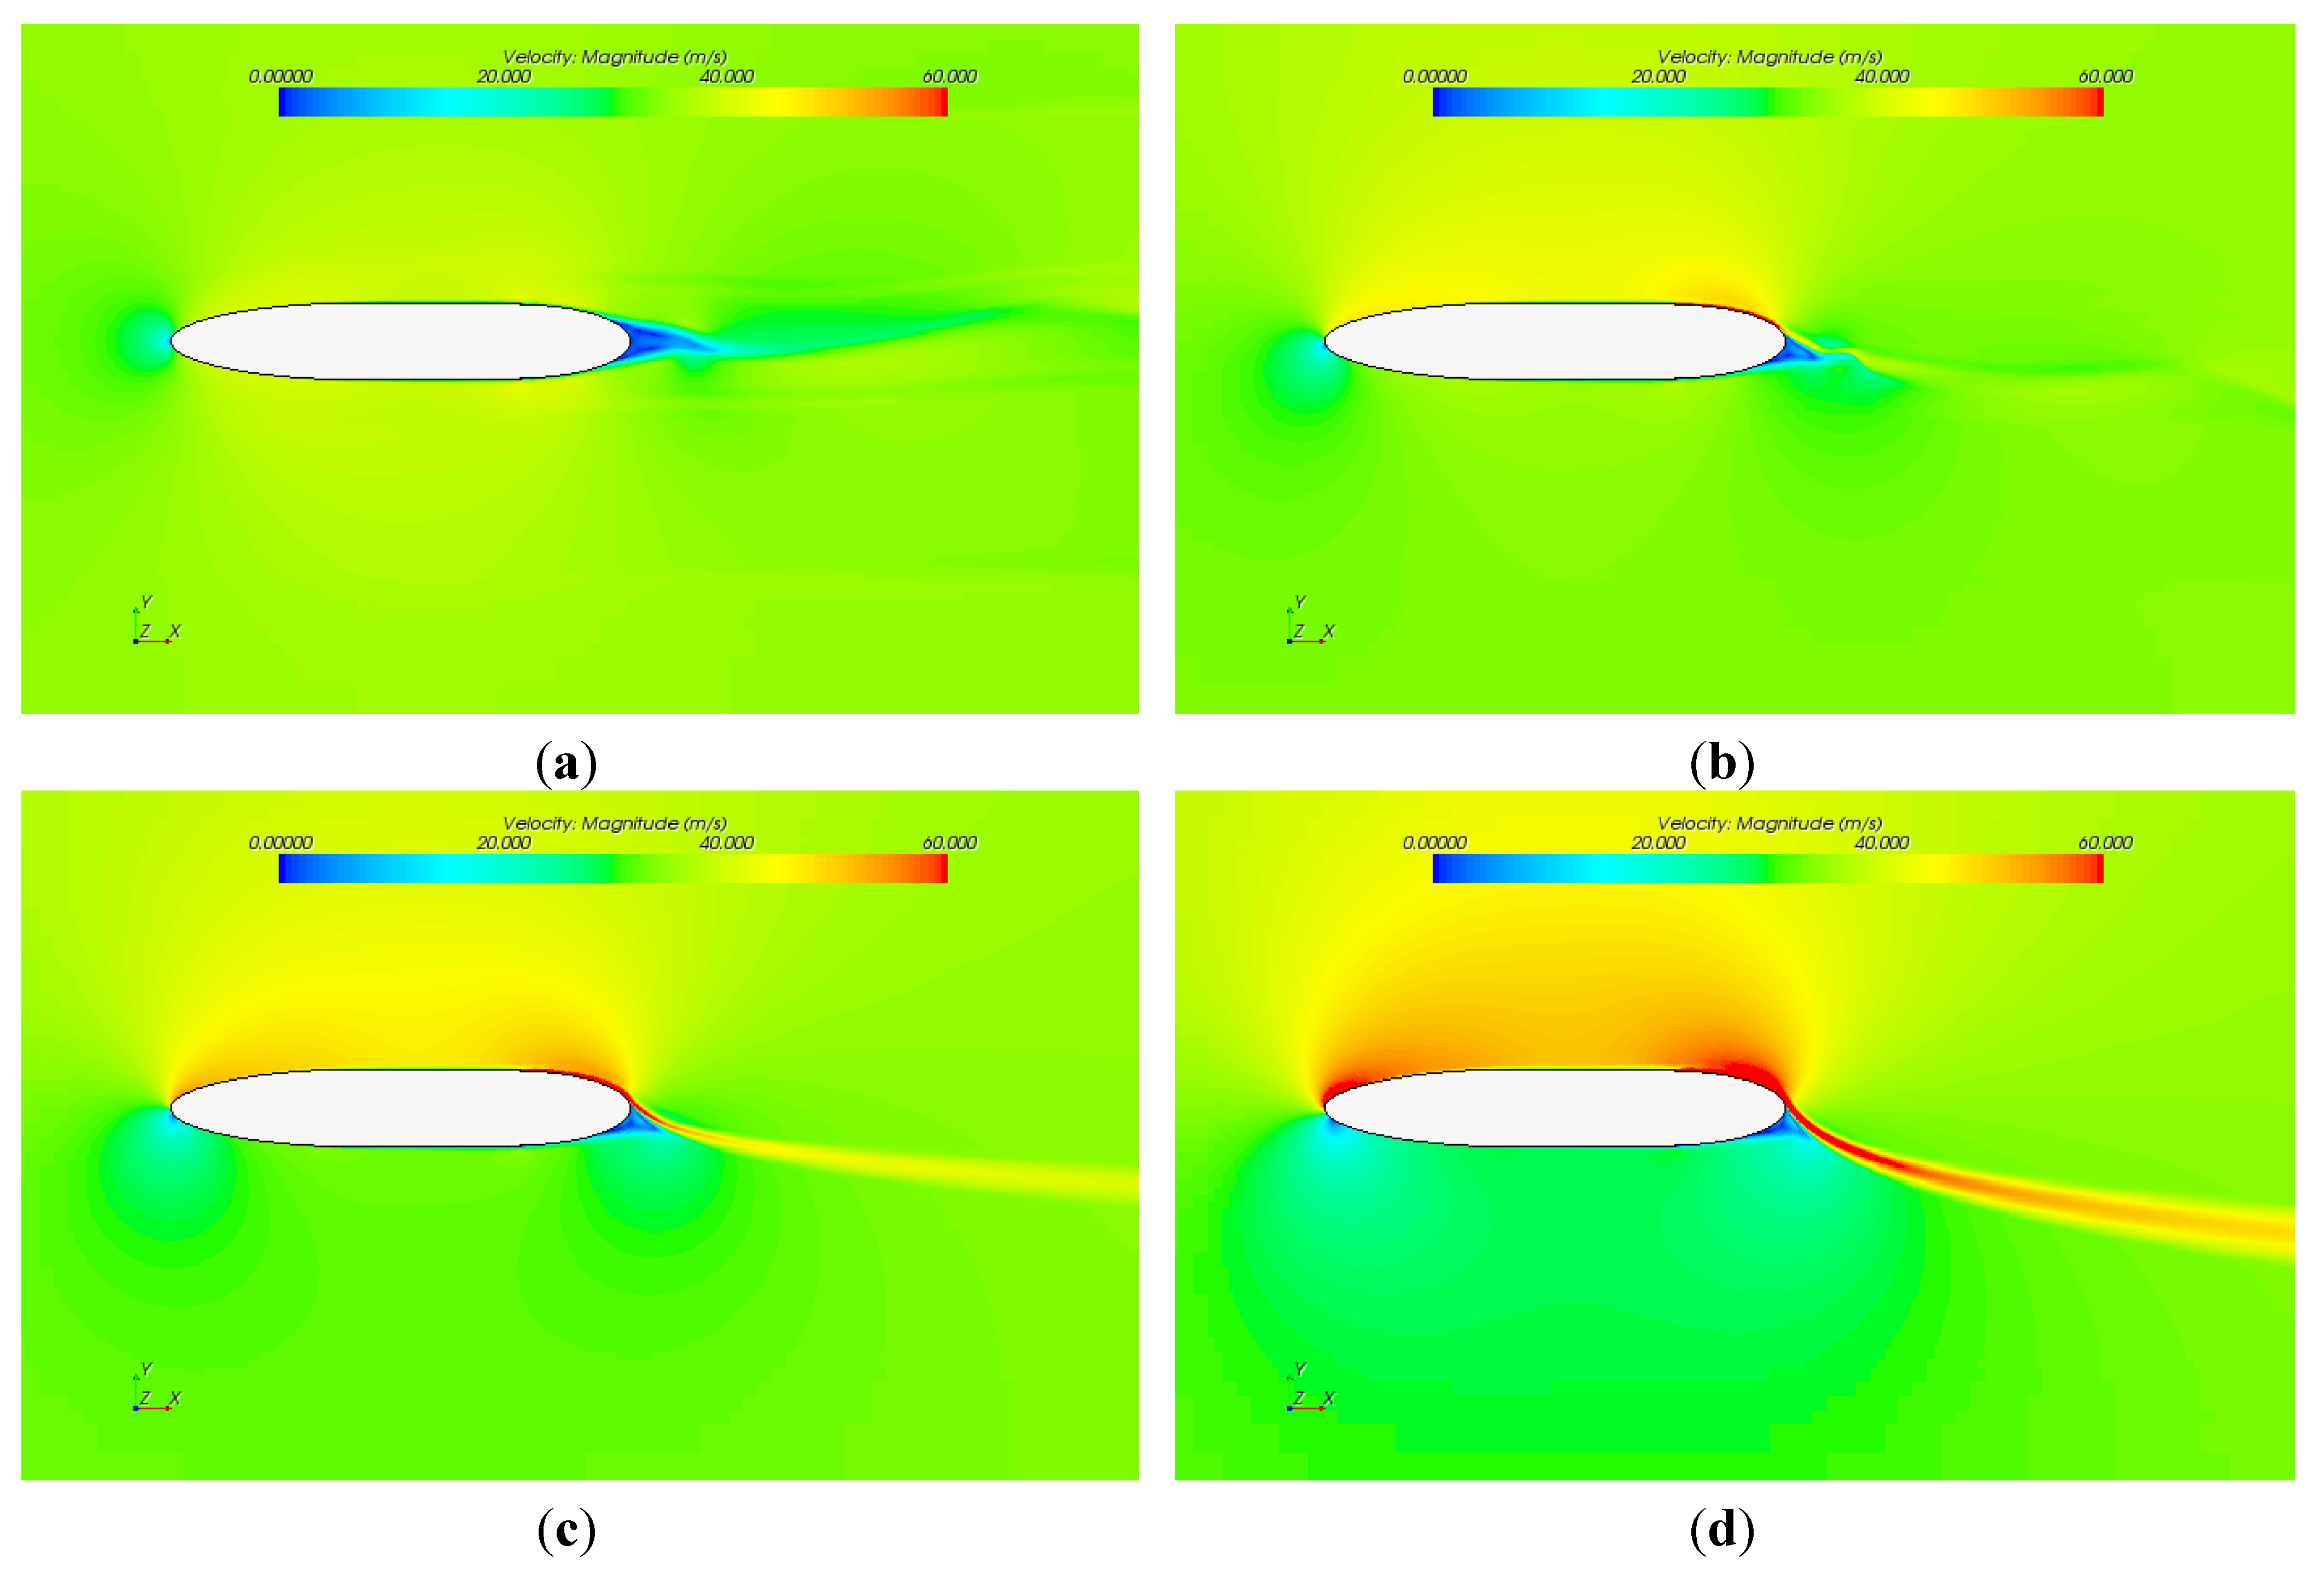
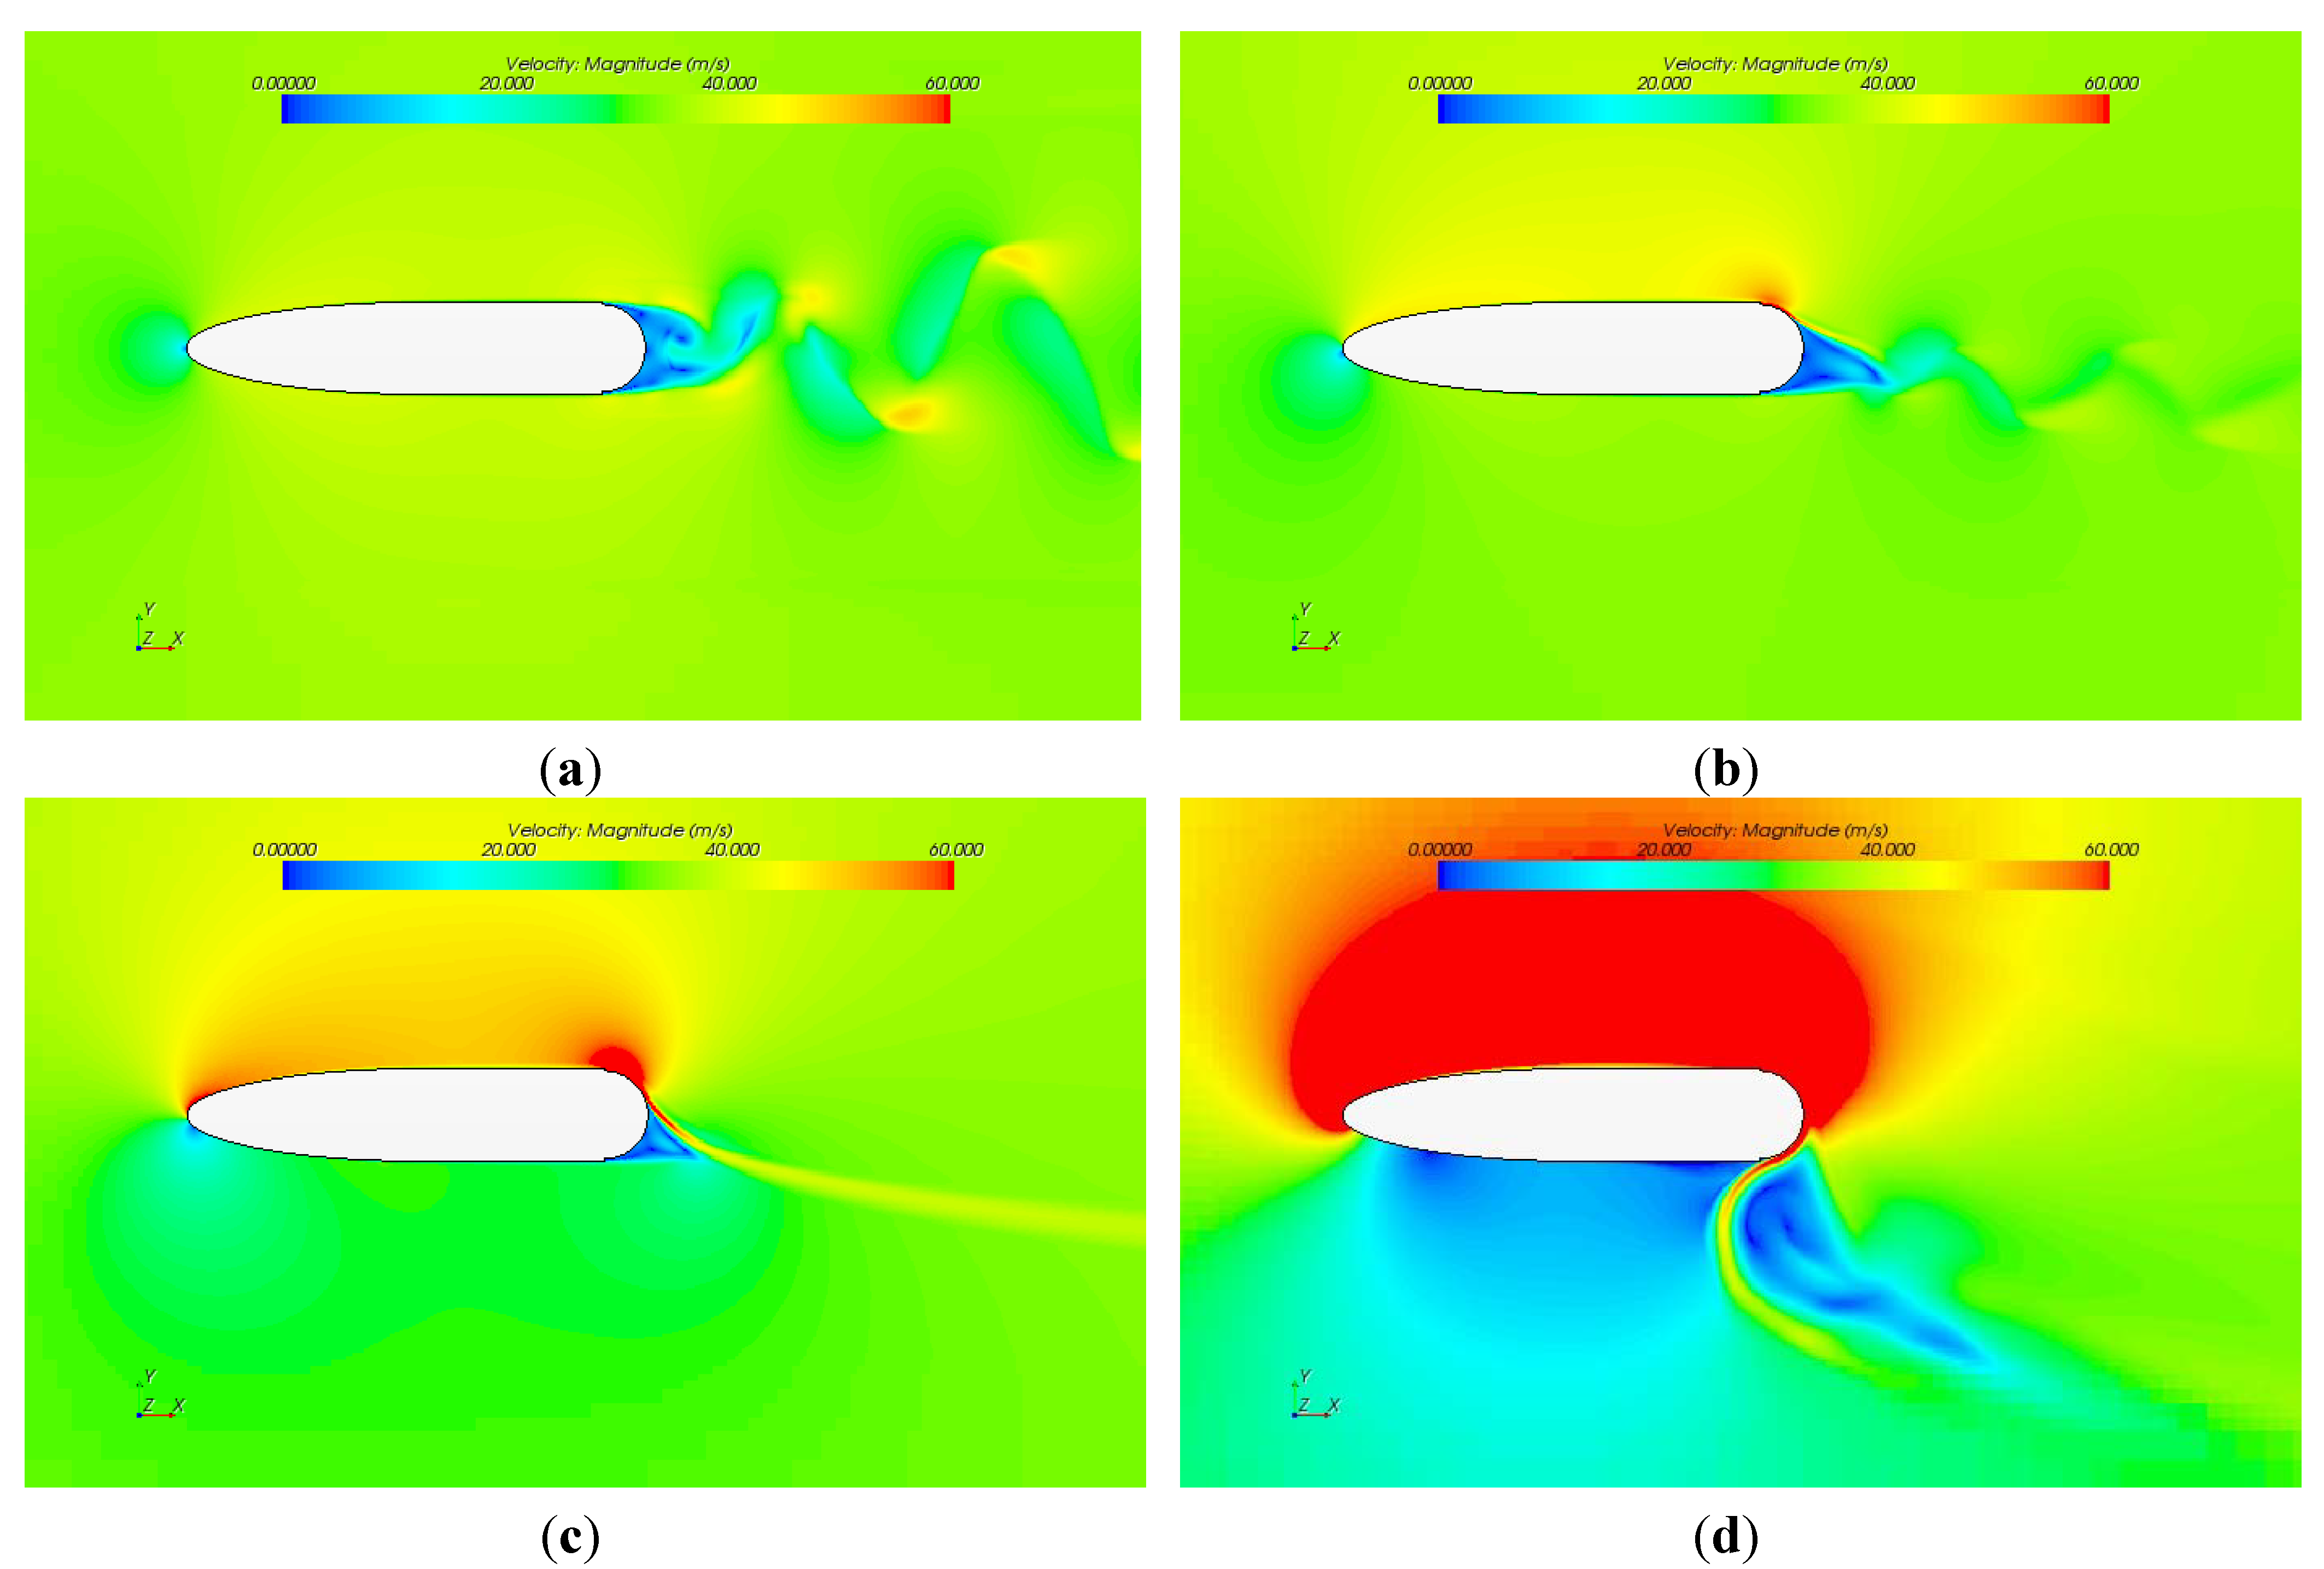
Figure 9 shows colour shaded velocity contours predicted for the baseline CC-E0020EJ aerofoil. With a zero momentum coefficient (
Figure 9a) the flow is characterised by a large separated wake with vortex shedding. Jet blowing from the upper nozzle clearly reduces the vortex shedding and moves the rear stagnation position around the trailing edge giving rise to increased circulation and higher upper surface velocities. At the highest momentum coefficient (
Figure 9d) the jet flow opposes the lower surface freestream flow giving a large recirculation. However, this solution was not as well converged and is only included here as an indicative flow development.
Figure 7.
Computational domain for the baseline CC-E0020EJ aerofoil.
Figure 7.
Computational domain for the baseline CC-E0020EJ aerofoil.
Figure 8.
Mesh refinement around the baseline CC-E0020EJ aerofoil.
Figure 8.
Mesh refinement around the baseline CC-E0020EJ aerofoil.
Figure 9.
Predicted velocity contours for the CC-E0020EJ aerofoil for alternative momentum coefficients (Cμ). (a) Cμ = 0.0; (b) Cμ = 0.05; (c) Cμ = 0.1; (d) Cμ = 0.2. AoA = 0°, Q = 718 Pa.
Figure 9.
Predicted velocity contours for the CC-E0020EJ aerofoil for alternative momentum coefficients (Cμ). (a) Cμ = 0.0; (b) Cμ = 0.05; (c) Cμ = 0.1; (d) Cμ = 0.2. AoA = 0°, Q = 718 Pa.
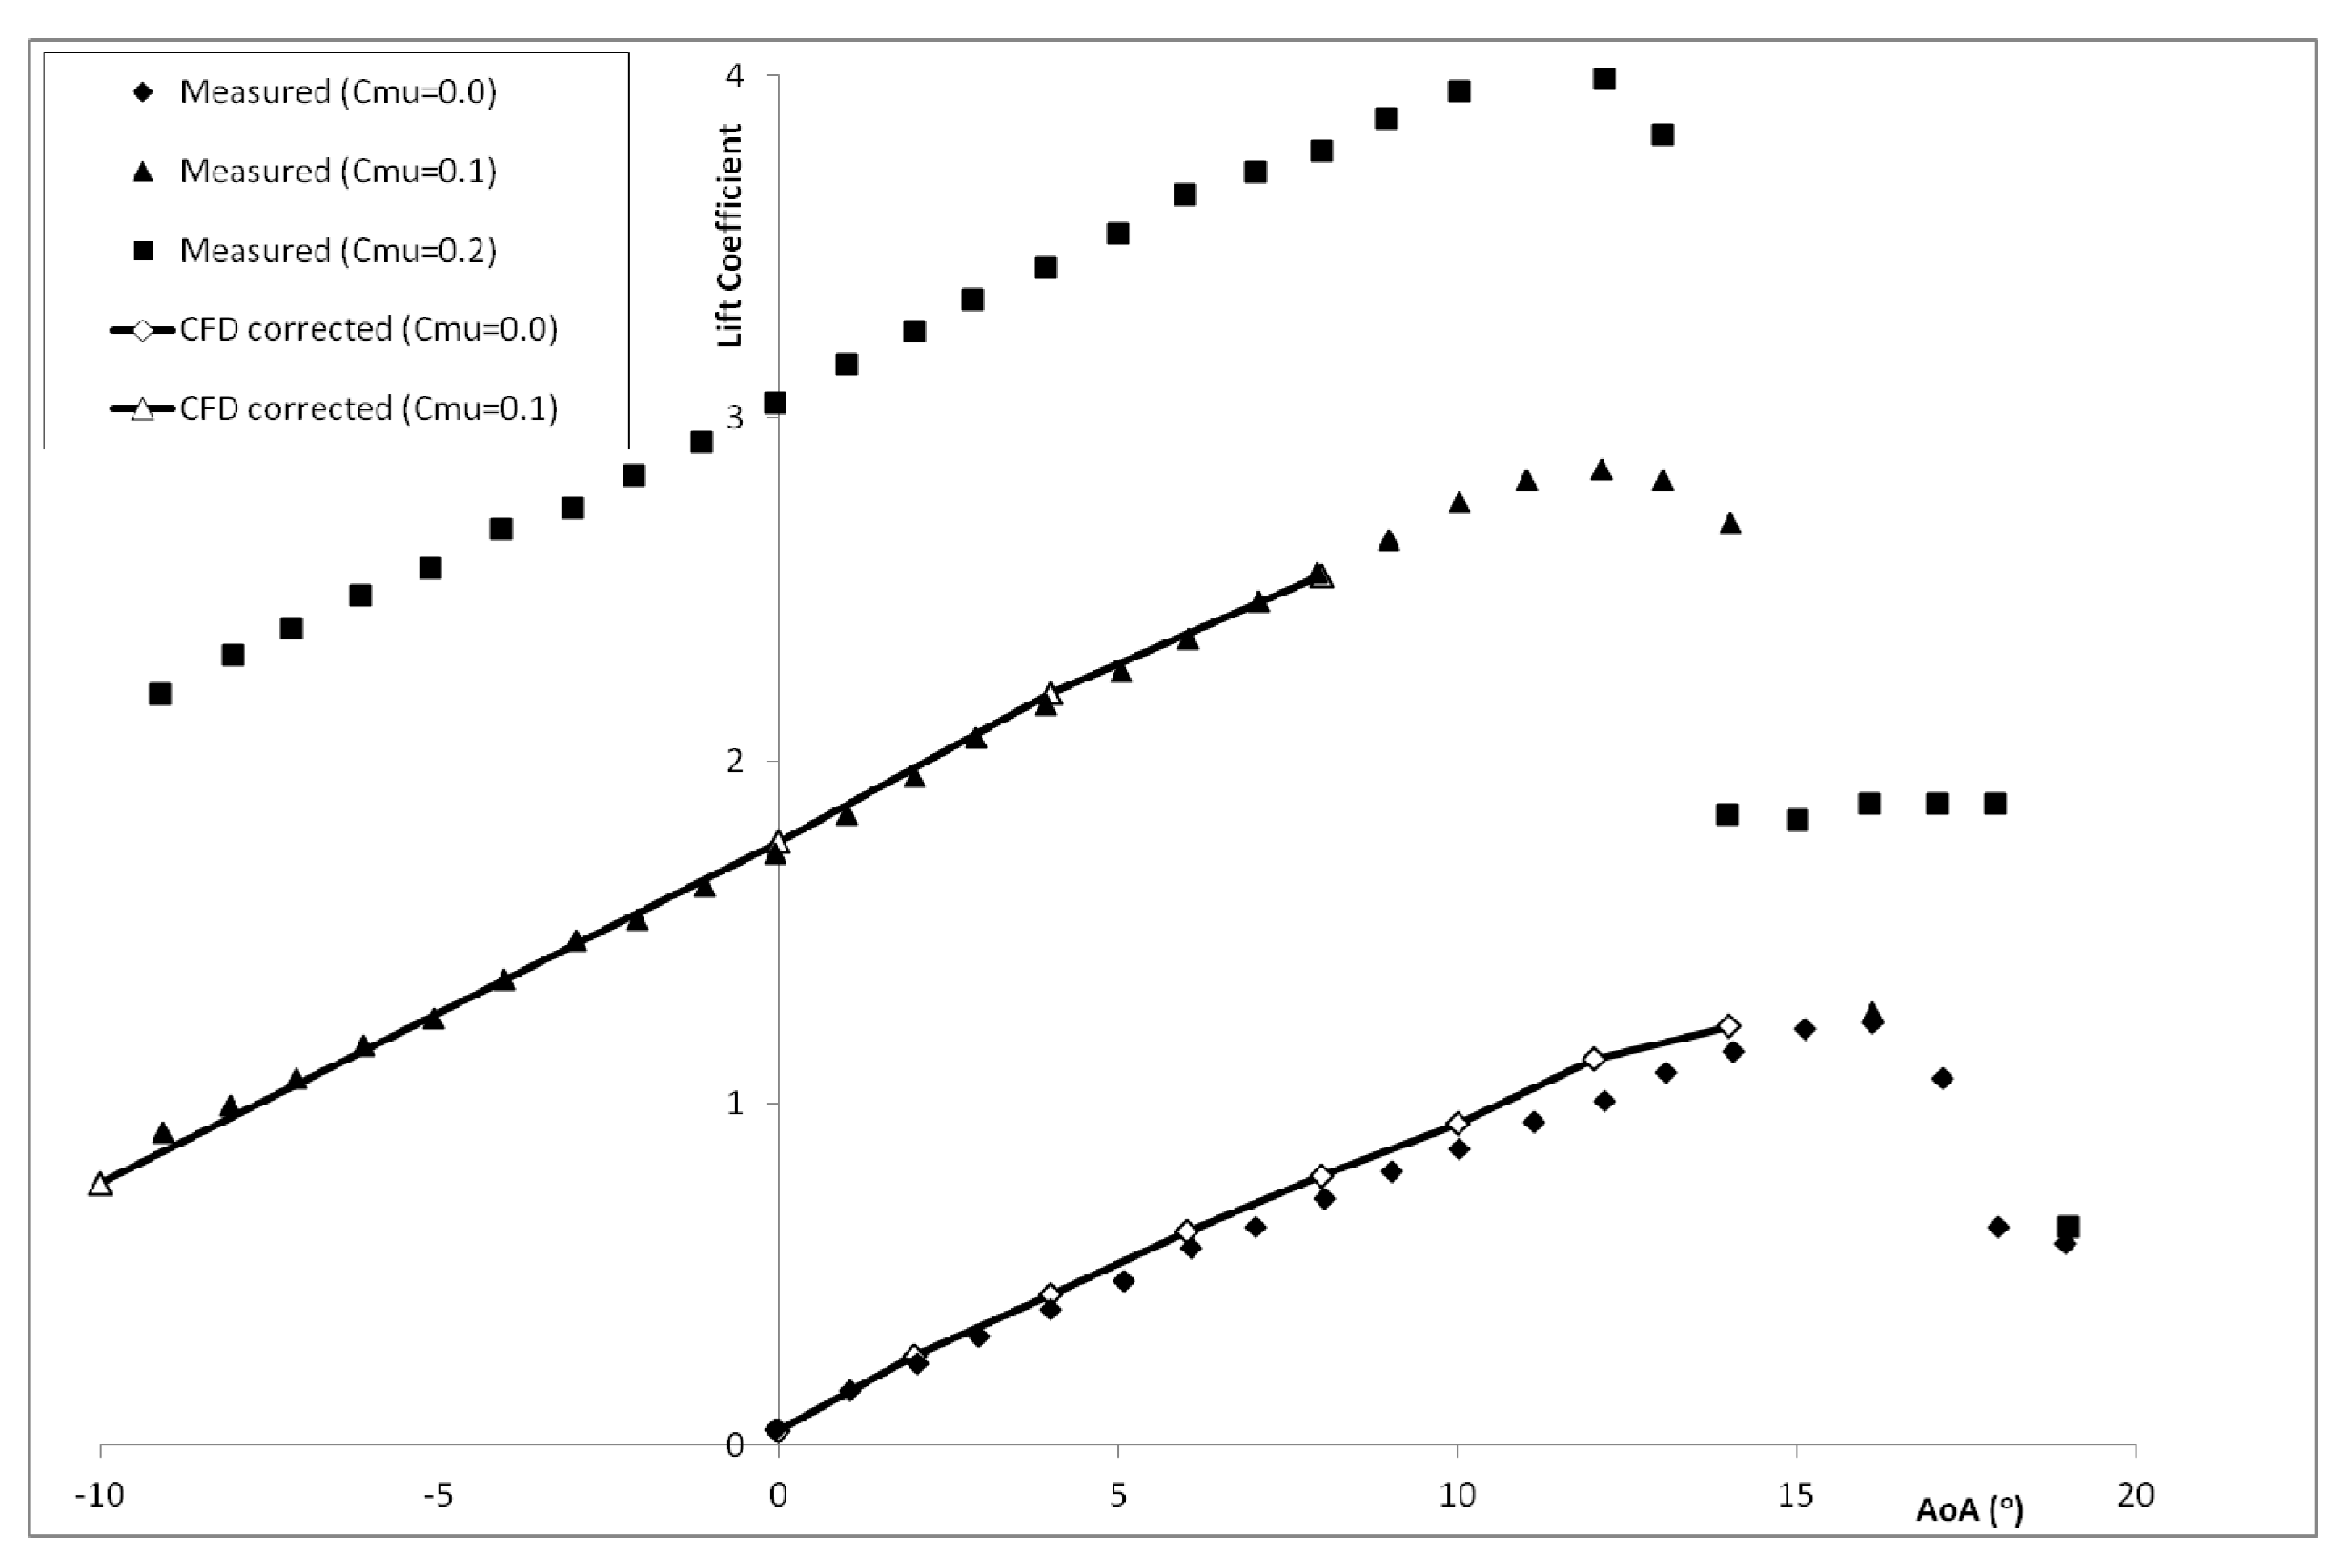
The predicted lift for the baseline CC-E0020EJ aerofoil is shown in
Figure 10 compared with measured data [
33]. It was found that CFD over-predicts the lift curve slope with and without blowing as reported by other researchers [
40,
41]. Hence the predicted lift is corrected in
Figure 10 by applying a factor of 0.9 which was found to give an improved comparison with measured lift up to stall onset.
Figure 10.
Predicted and measured lift curve slopes for CC-E0020EJ aerofoil.
Figure 10.
Predicted and measured lift curve slopes for CC-E0020EJ aerofoil.
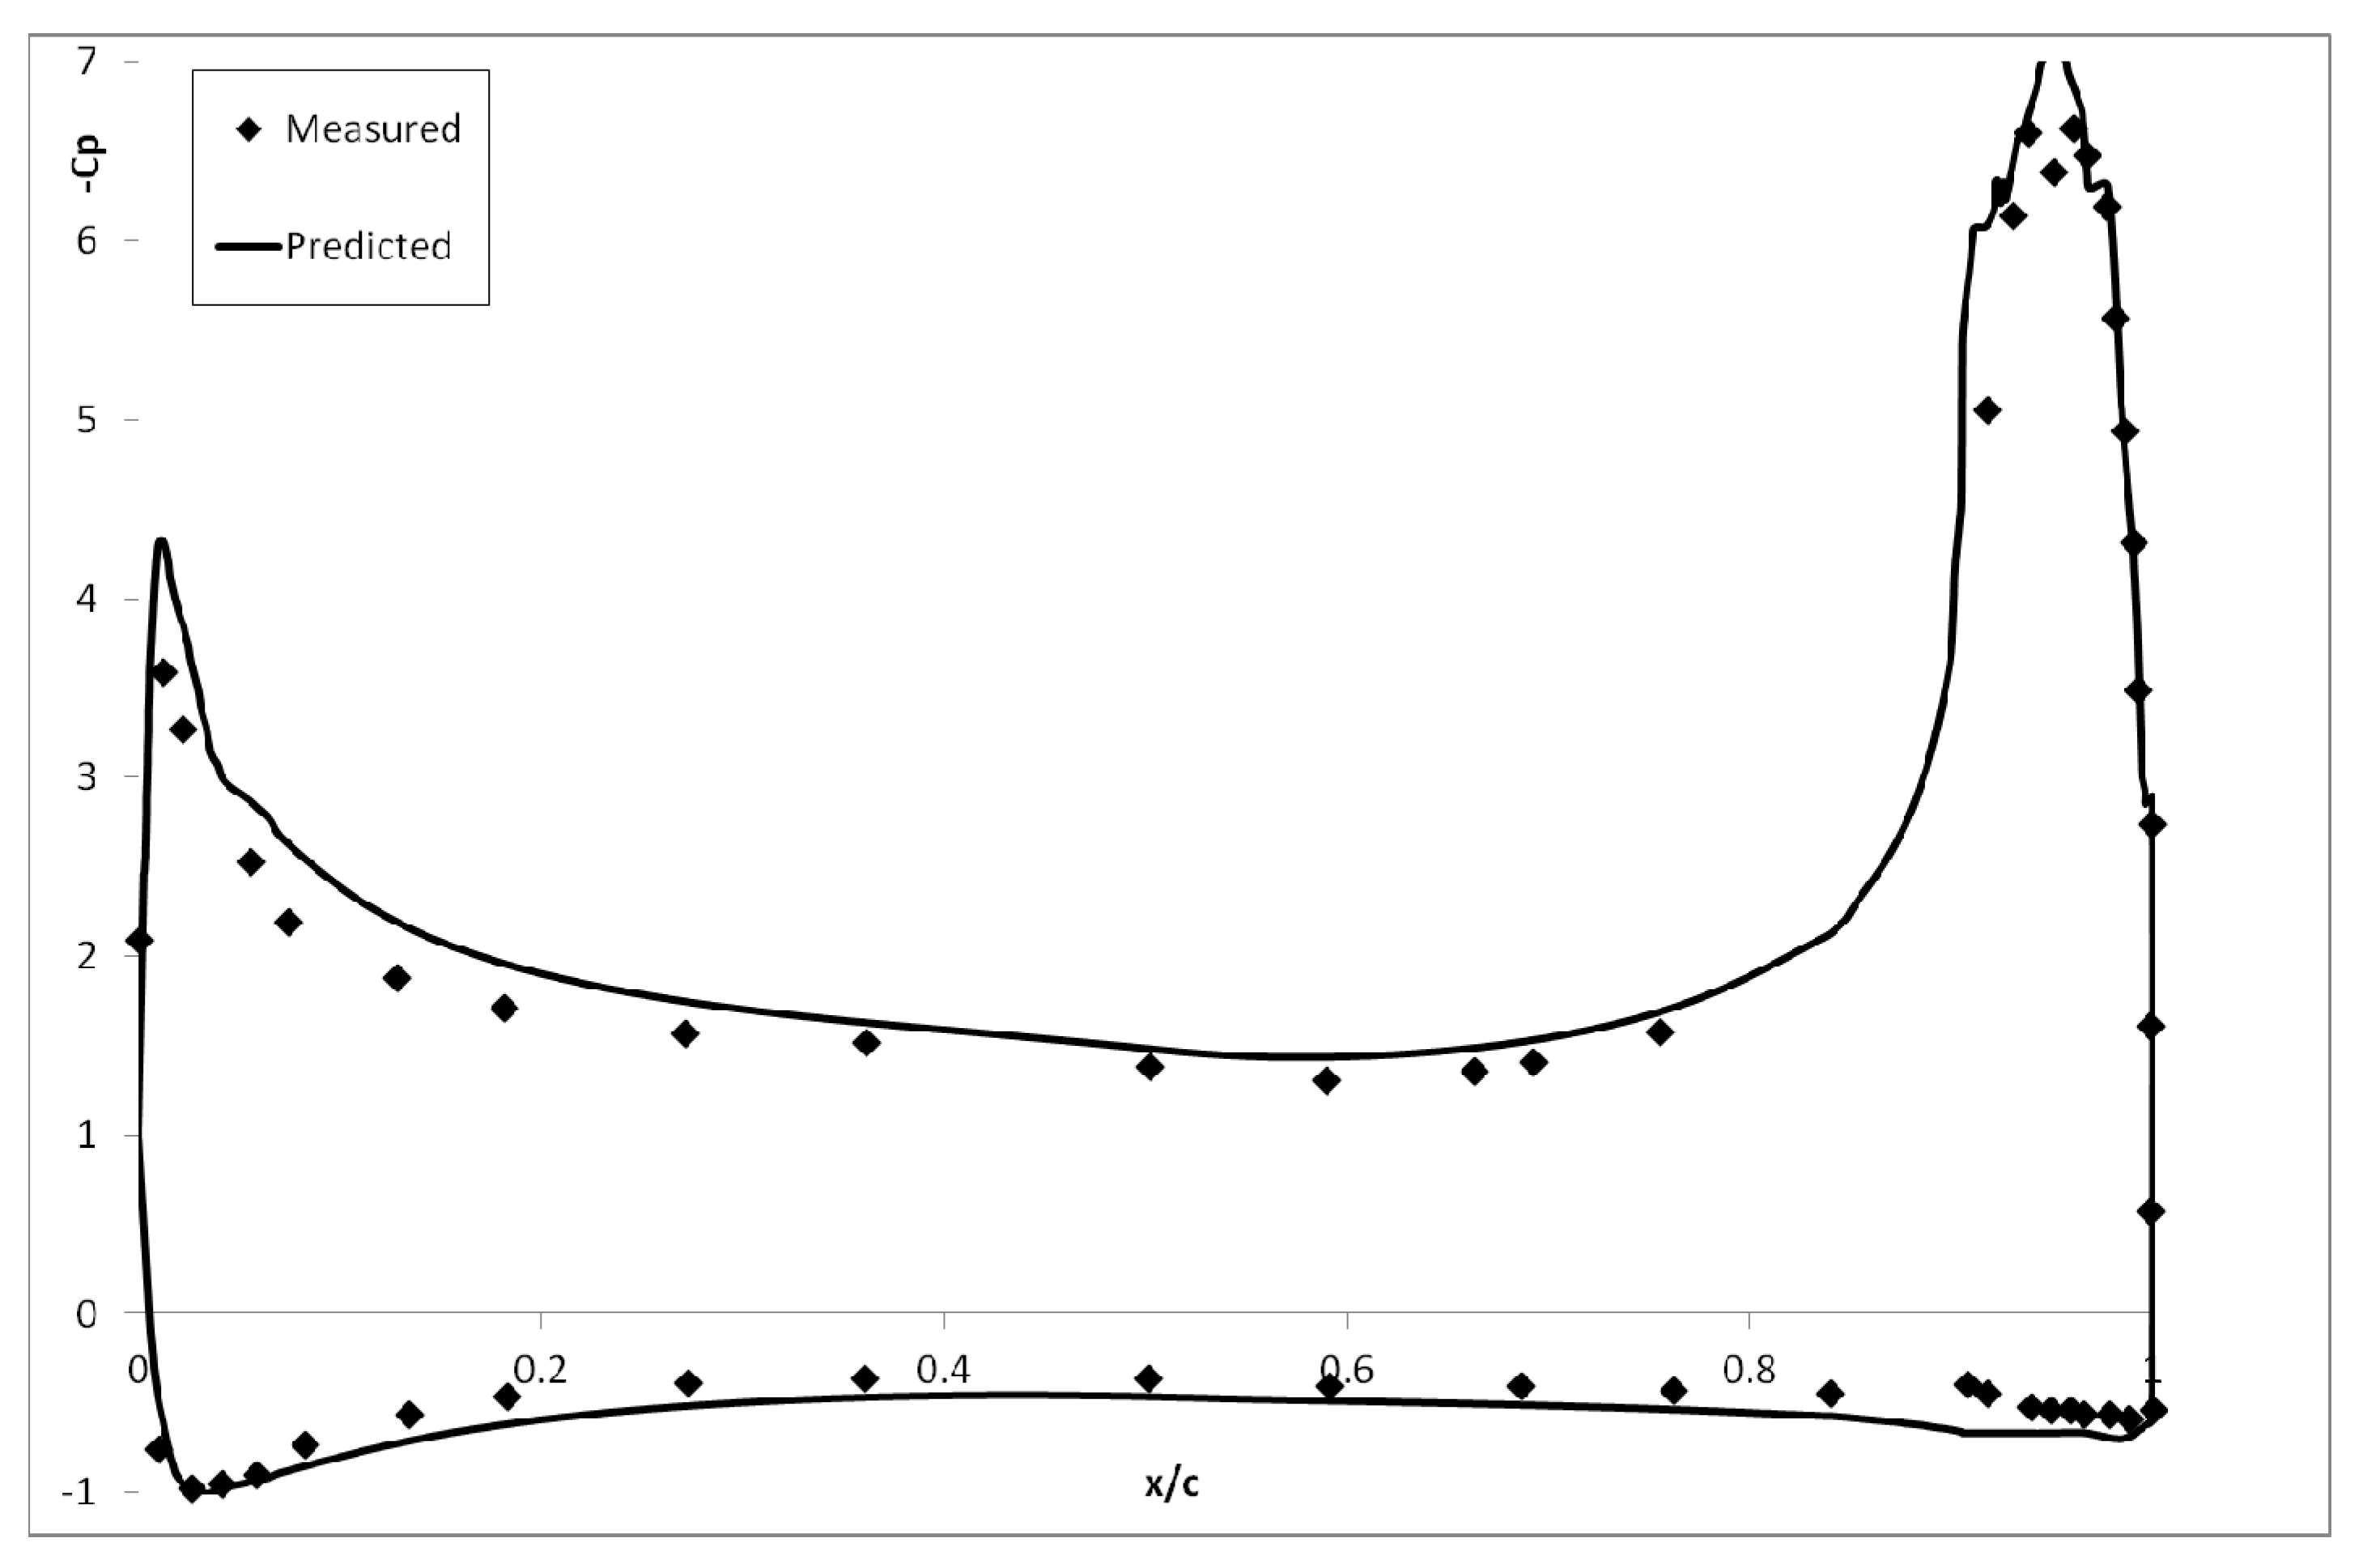
The predicted [
33] and measured pressure distribution shown in
Figure 11 confirms that CFD over-predicts the lift and the figure shows good agreement in the suction levels generated by the upper surface air jet. Profile drag was also over-predicted by CFD and was corrected using a factor of 63% giving good agreement with experiment.
Figure 11.
Predicted & measured [
33] pressure distributions (CC-E0020EJ aerofoil, AoA = 0°,
Cμ = 0.1).
Figure 11.
Predicted & measured [
33] pressure distributions (CC-E0020EJ aerofoil, AoA = 0°,
Cμ = 0.1).
Although it has been necessary to correct the predicted lift and drag data using these factors, the incremental changes due to AoA and blowing coefficient are well represented using CFD. Hence CFD was used to predict the flow development of the TE_ELLIPSE1 and TE_ELLIPSE2 aerofoils with lift and drag data corrected in the same manner. Colour shaded velocity contours around the TE_ELLIPSE2 aerofoil are shown in
Figure 12 for increasing momentum coefficients. Compared with velocity contours for the baseline CC-E0020EJ aerofoil shown in
Figure 9, the modified section creates a significantly reduced wake with no blowing, with a corresponding zero-lift drag coefficient,
CD0 = 0.014 that compares with
CD0 = 0.053 for the baseline aerofoil. Increasing the momentum coefficient moves the rear stagnation position around the elliptical trailing edge as for the baseline aerofoil. However, at the higher momentum coefficient (
Figure 12d) the jet flow no longer opposes the lower surface freestream flow and good convergence is achieved.
Figure 12.
Predicted velocity contours for the TE_ELLIPSE2 aerofoil for alternative momentum coefficients (Cμ). (a) Cμ = 0.0; (b) Cμ = 0.05; (c) Cμ = 0.1; (d) Cμ = 0.2. AoA = 0°, Q = 718 Pa.
Figure 12.
Predicted velocity contours for the TE_ELLIPSE2 aerofoil for alternative momentum coefficients (Cμ). (a) Cμ = 0.0; (b) Cμ = 0.05; (c) Cμ = 0.1; (d) Cμ = 0.2. AoA = 0°, Q = 718 Pa.
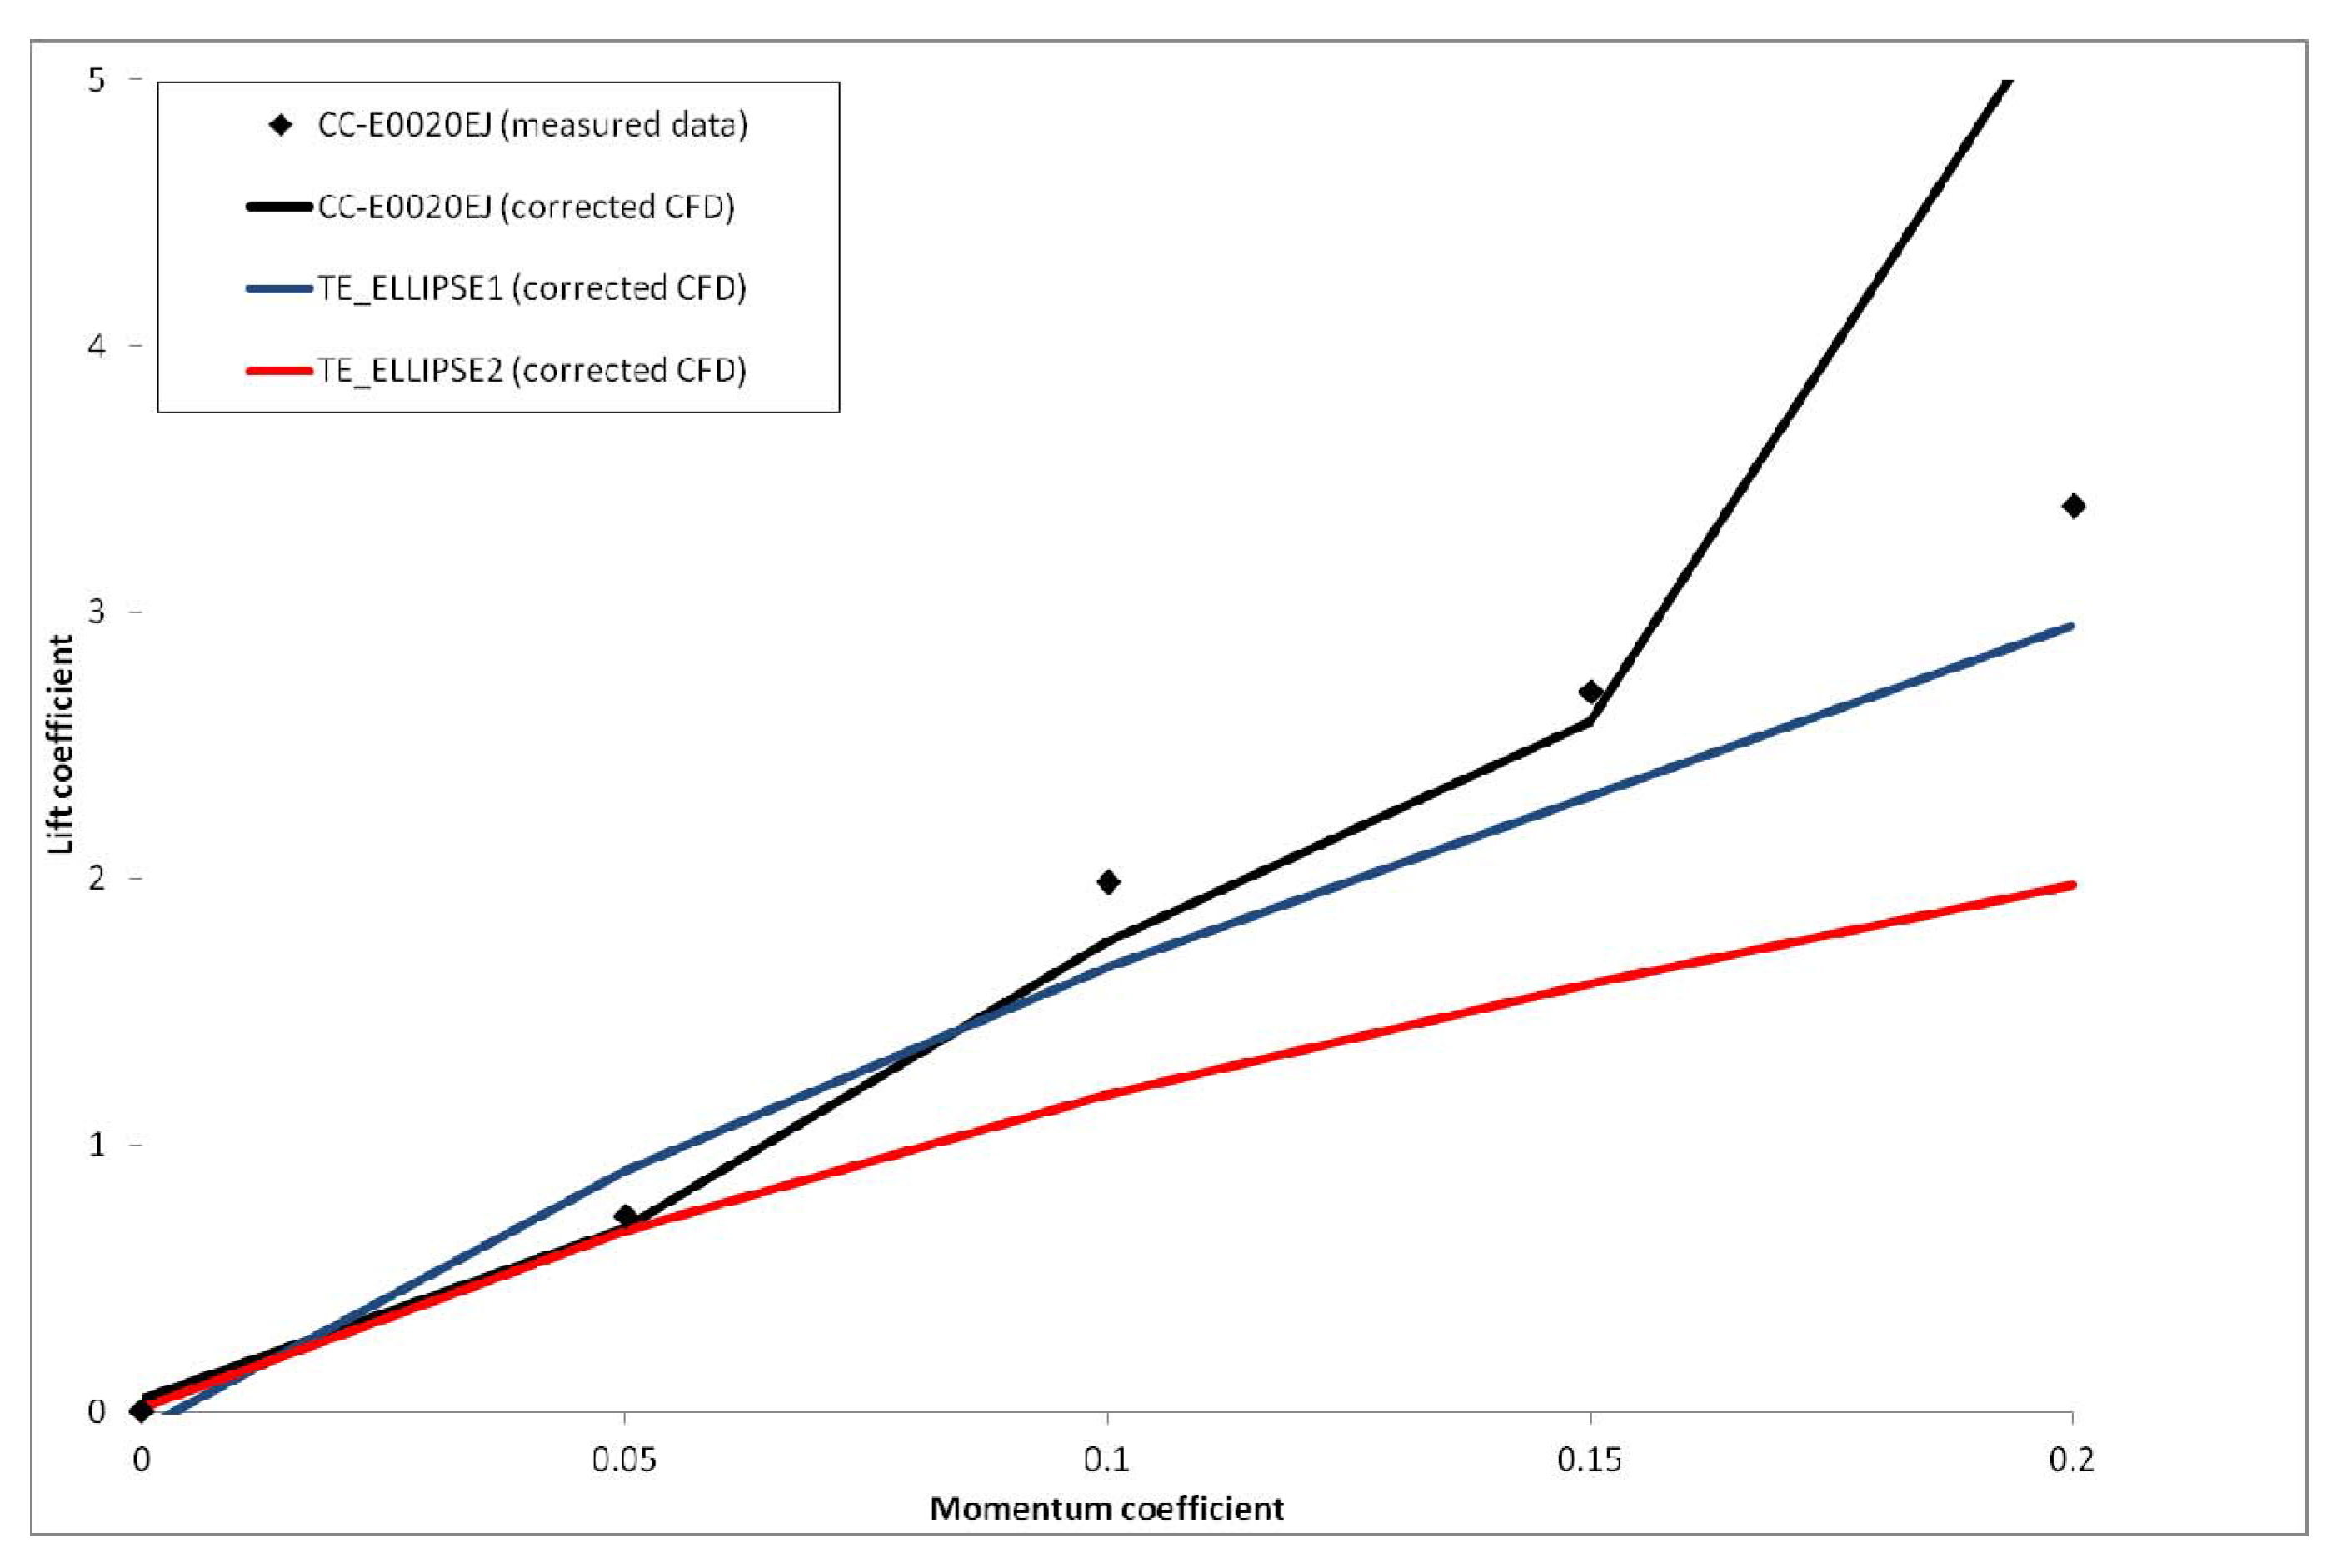
The effect of momentum coefficient on lift coefficient at AoA = 0° is shown in
Figure 13. This indicates that the predicted lift is in good agreement with measured data for the baseline CC-E0020EJ aerofoil for
Cμ < 0.2. It should be noted that full convergence was not achieved for
Cμ = 0.2 and that other researchers found that CFD over-predicts lift for
Cμ > 0.15 [
40,
41]. For the modified sections lift augmentation is reduced for
Cμ > 0.05 as the trailing edge ellipse is reduced to 50% (TE_ELLIPSE1) and 33% (TE_ELLIPSE2), though significant lift augmentation is still achieved.
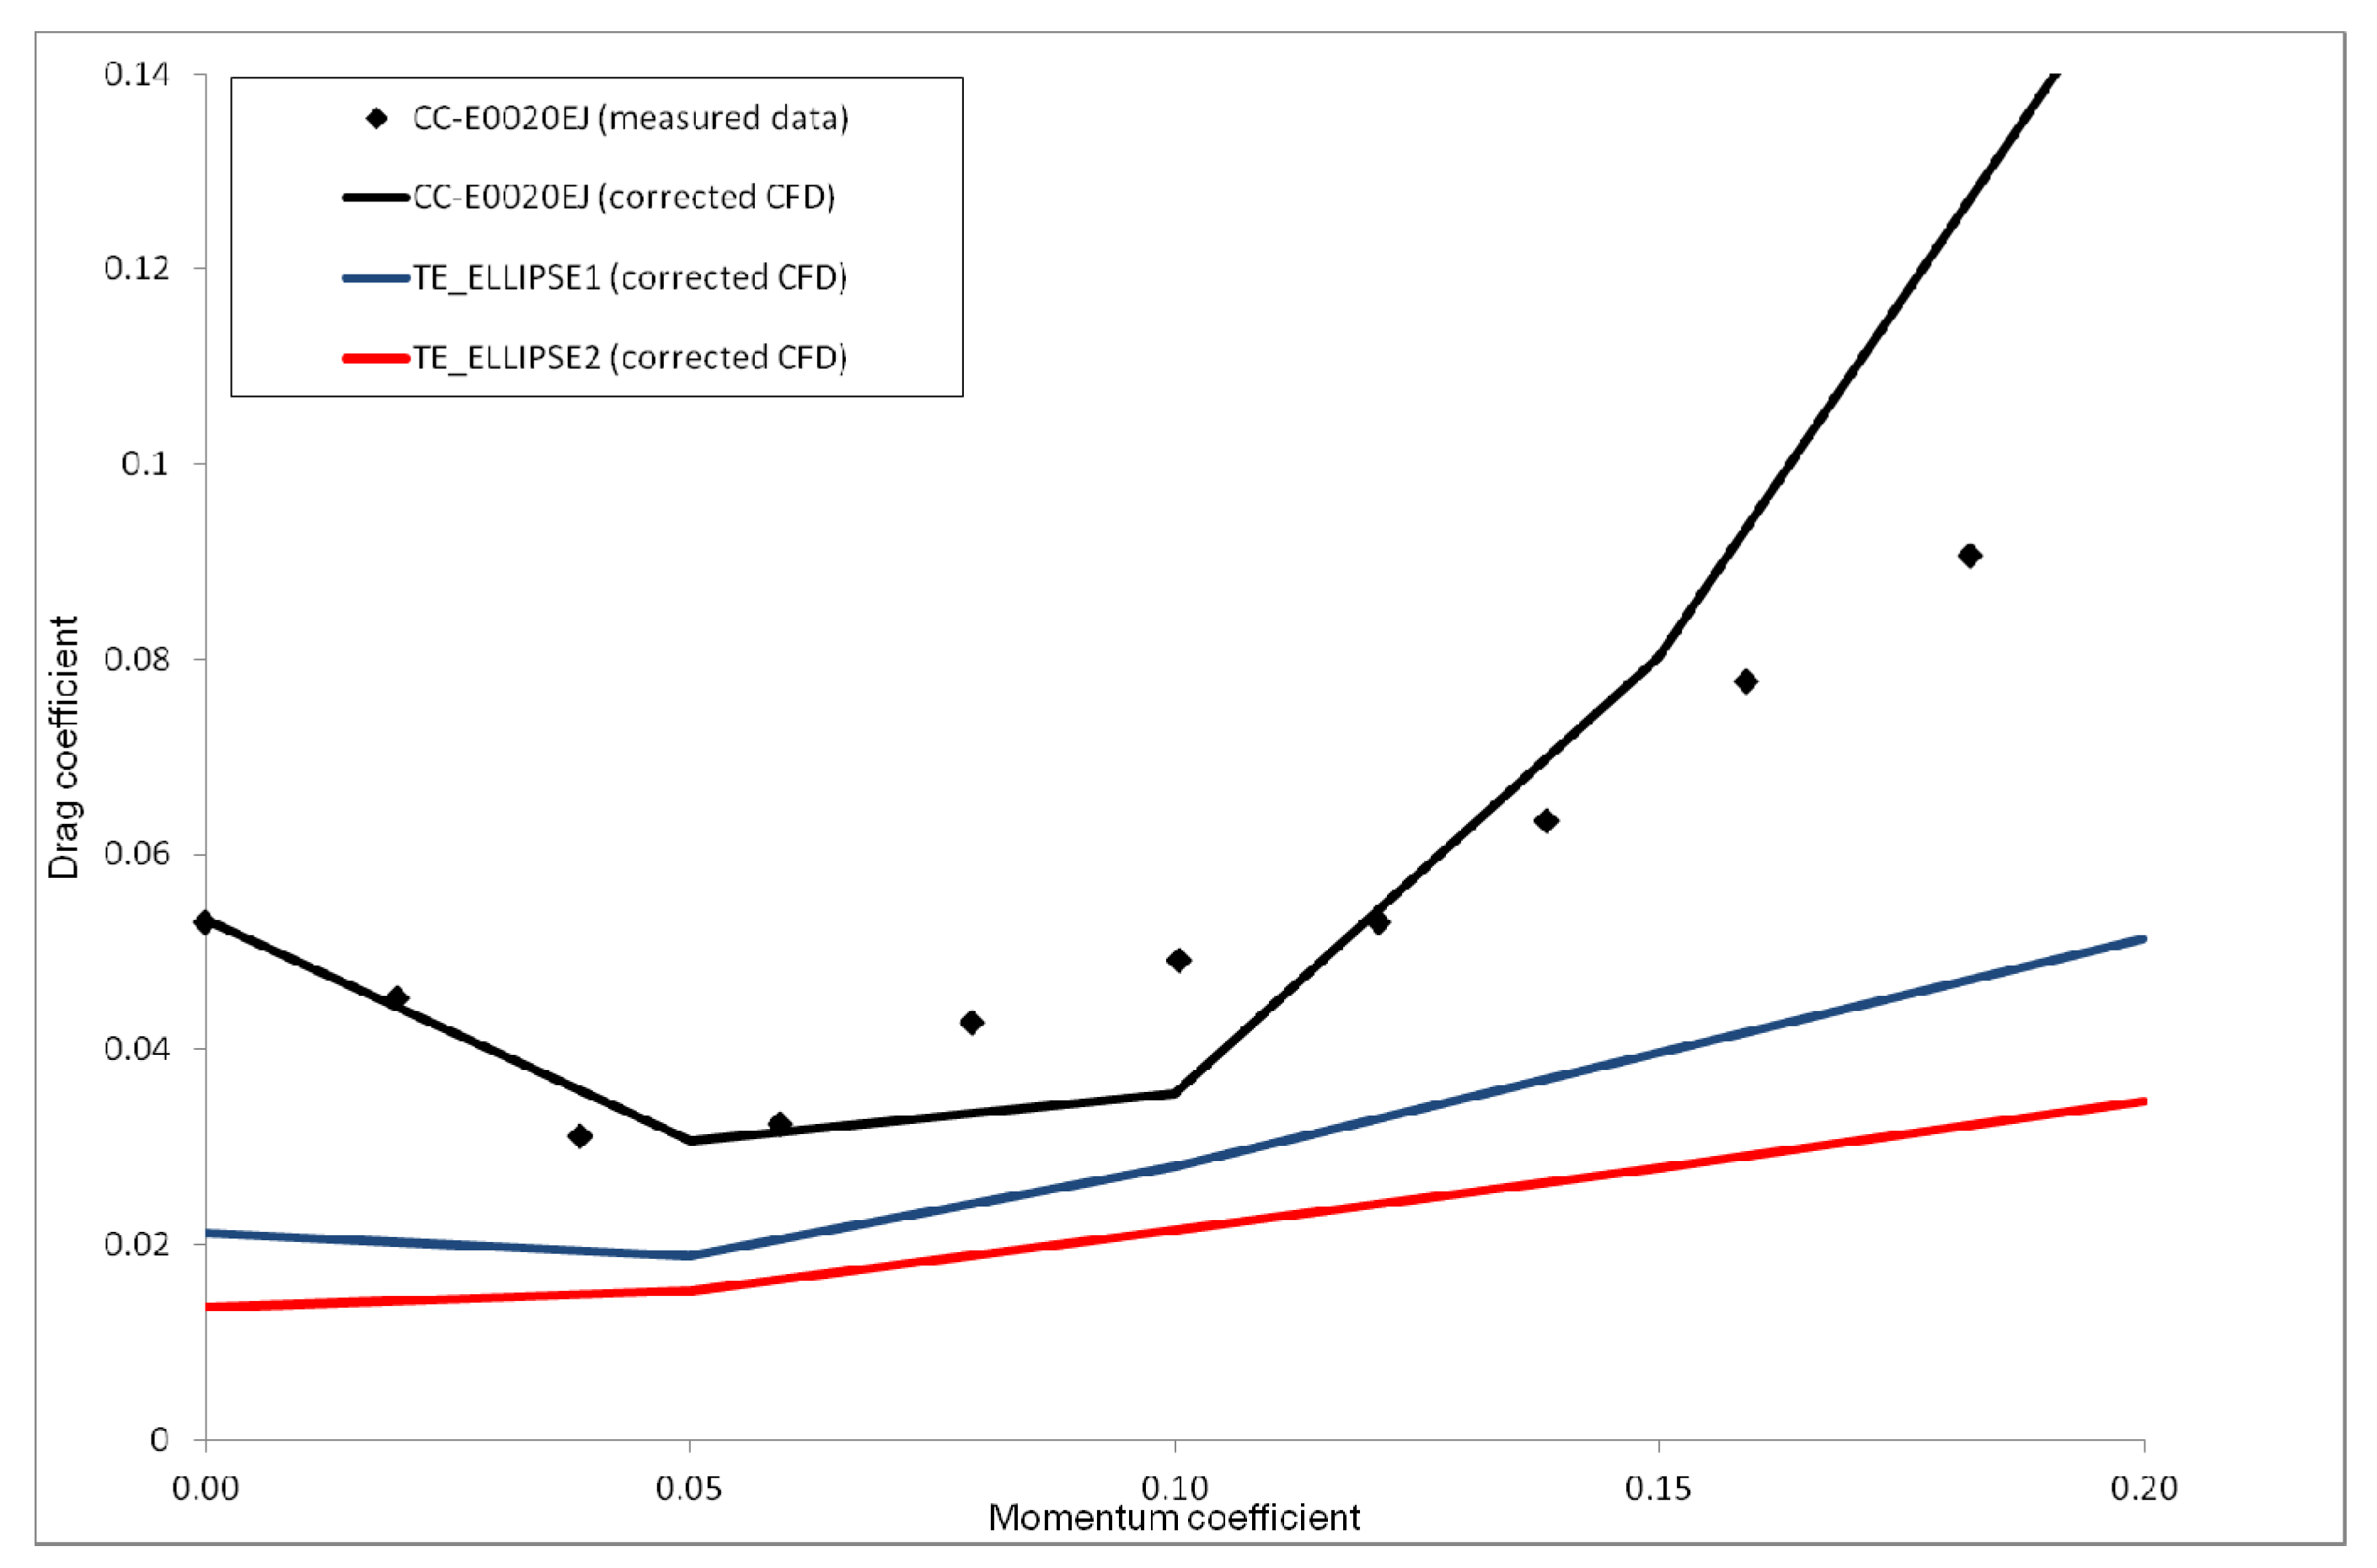
The corresponding variation of profile drag with momentum coefficient at AoA = 0° is shown in
Figure 13. For the baseline aerofoil the predicted drag is in reasonable agreement with measured drag including the initial drag reduction achieved at low momentum coefficients due to separation control creating a reduced wake (illustrated in
Figure 9b). For the modified sections significant drag reductions are achieved relative to the baseline aerofoil.
Figure 13.
Profile drag of different CC aerofoils.
Figure 13.
Profile drag of different CC aerofoils.
The lift augmentation and drag increase of the TE_ELLIPSE2 aerofoil at AoA = 0° as a function of momentum coefficient can be approximated using Equation (11) from
Figure 13 and
Figure 14:
Figure 14.
Lift augmentation for different CC aerofoils.
Figure 14.
Lift augmentation for different CC aerofoils.
Lift and drag were interpolated using the measured databases [
33] for the CC-E0020EJ aerofoil at the relevant momentum coefficient, and were modified using the predicted incremental (pre-stall) lift and drag characteristics of the TE_ELLIPSE1 and TE_ELLIPSE2 aerofoils. Consequently these modified lift and drag data assumed the same stall characteristics as the baseline aerofoil with blowing. The DMST turbine model was subsequently used to predict the net power production using these blade sections with continuous CC (
Cμ = 0.05) and results are shown in
Figure 15 [pump power is calculated using Equations (9) and (10) as before].
Figure 15.
Predicted power of VAWT-260 H-rotor with continuous CC.
Figure 15.
Predicted power of VAWT-260 H-rotor with continuous CC.
Although both of the modified aerofoils improve net power relative to the baseline, the increase is small. At low wind speeds where base drag has a more significant influence on power, the modified aerofoils produce significantly less power than for the NACA0018 aerofoil.
Figure 15 also indicates that the pump power required for continuous CC is very significant. Consequently, an optimization tool was used to ensure that CC is utilized more efficiently and thereby reduce the pumping power requirements.
A non-linear, gradient-search type, constrained optimisation routine was used to optimize parameters controlling the CC at each wind speed considered, with the objective of maximizing the net power production. This routine was coupled to the DMST turbine model to derive predicted output power. The CC parameters considered were the momentum coefficient, the blade azimuth position (
) at which blowing is switched on and off and the blade twist angle (
). Only blowing from the upper nozzle was considered to utilize CC over the upwind cycle of the rotor, though the corresponding start and end positions were not constrained to the upwind cycle. The momentum coefficient was allowed to vary in the range 0 <
Cμ < 0.2 but the corresponding nozzle exit velocity was limited to avoid the potential for compressibility effects. Only the TE_ELLIPSE2 blade section was considered and the lift and profile drag was again obtained by interrogating a database for the datum aerofoil, and including increments calculated using Equation (11) for the relevant momentum coefficient. The blade twist angle could not vary cyclically, but was optimized for each wind speed and subsequently a mean value was obtained. It is assumed that a suitable control and actuation system can switch the blowing on and off instantaneously at the required blade positions and that
Cμ does not vary cyclically. Values of optimized parameters are given in
Table 1.
Table 1.
Optimised CC parameters.
Table 1.
Optimised CC parameters.
| U∞ (m/s) | Cμ | UJ (m/s) | θSTART (°) | θEND (°) | αT (°) |
|---|
| 6 | 0.047 | 165.9 | −61.9 | 50.4 | −1.1 |
| 8 | 0.071 | 204.1 | −65.3 | 47.0 | −1.1 |
| 10 | 0.063 | 197.3 | −80.2 | 56.2 | −1.1 |
| 12 | 0.062 | 199.1 | −80.2 | 70.5 | −1.1 |
| 14 | 0.060 | 199.8 | −80.2 | 75.1 | −1.1 |
| 16 | 0.058 | 200.9 | −80.2 | 75.1 | −1.1 |
| 18 | 0.057 | 203.9 | −80.2 | 75.1 | −1.1 |
| 20 | 0.054 | 203.6 | −80.2 | 75.1 | −1.1 |
| 22 | 0.052 | 204.1 | −80.2 | 75.1 | −1.1 |
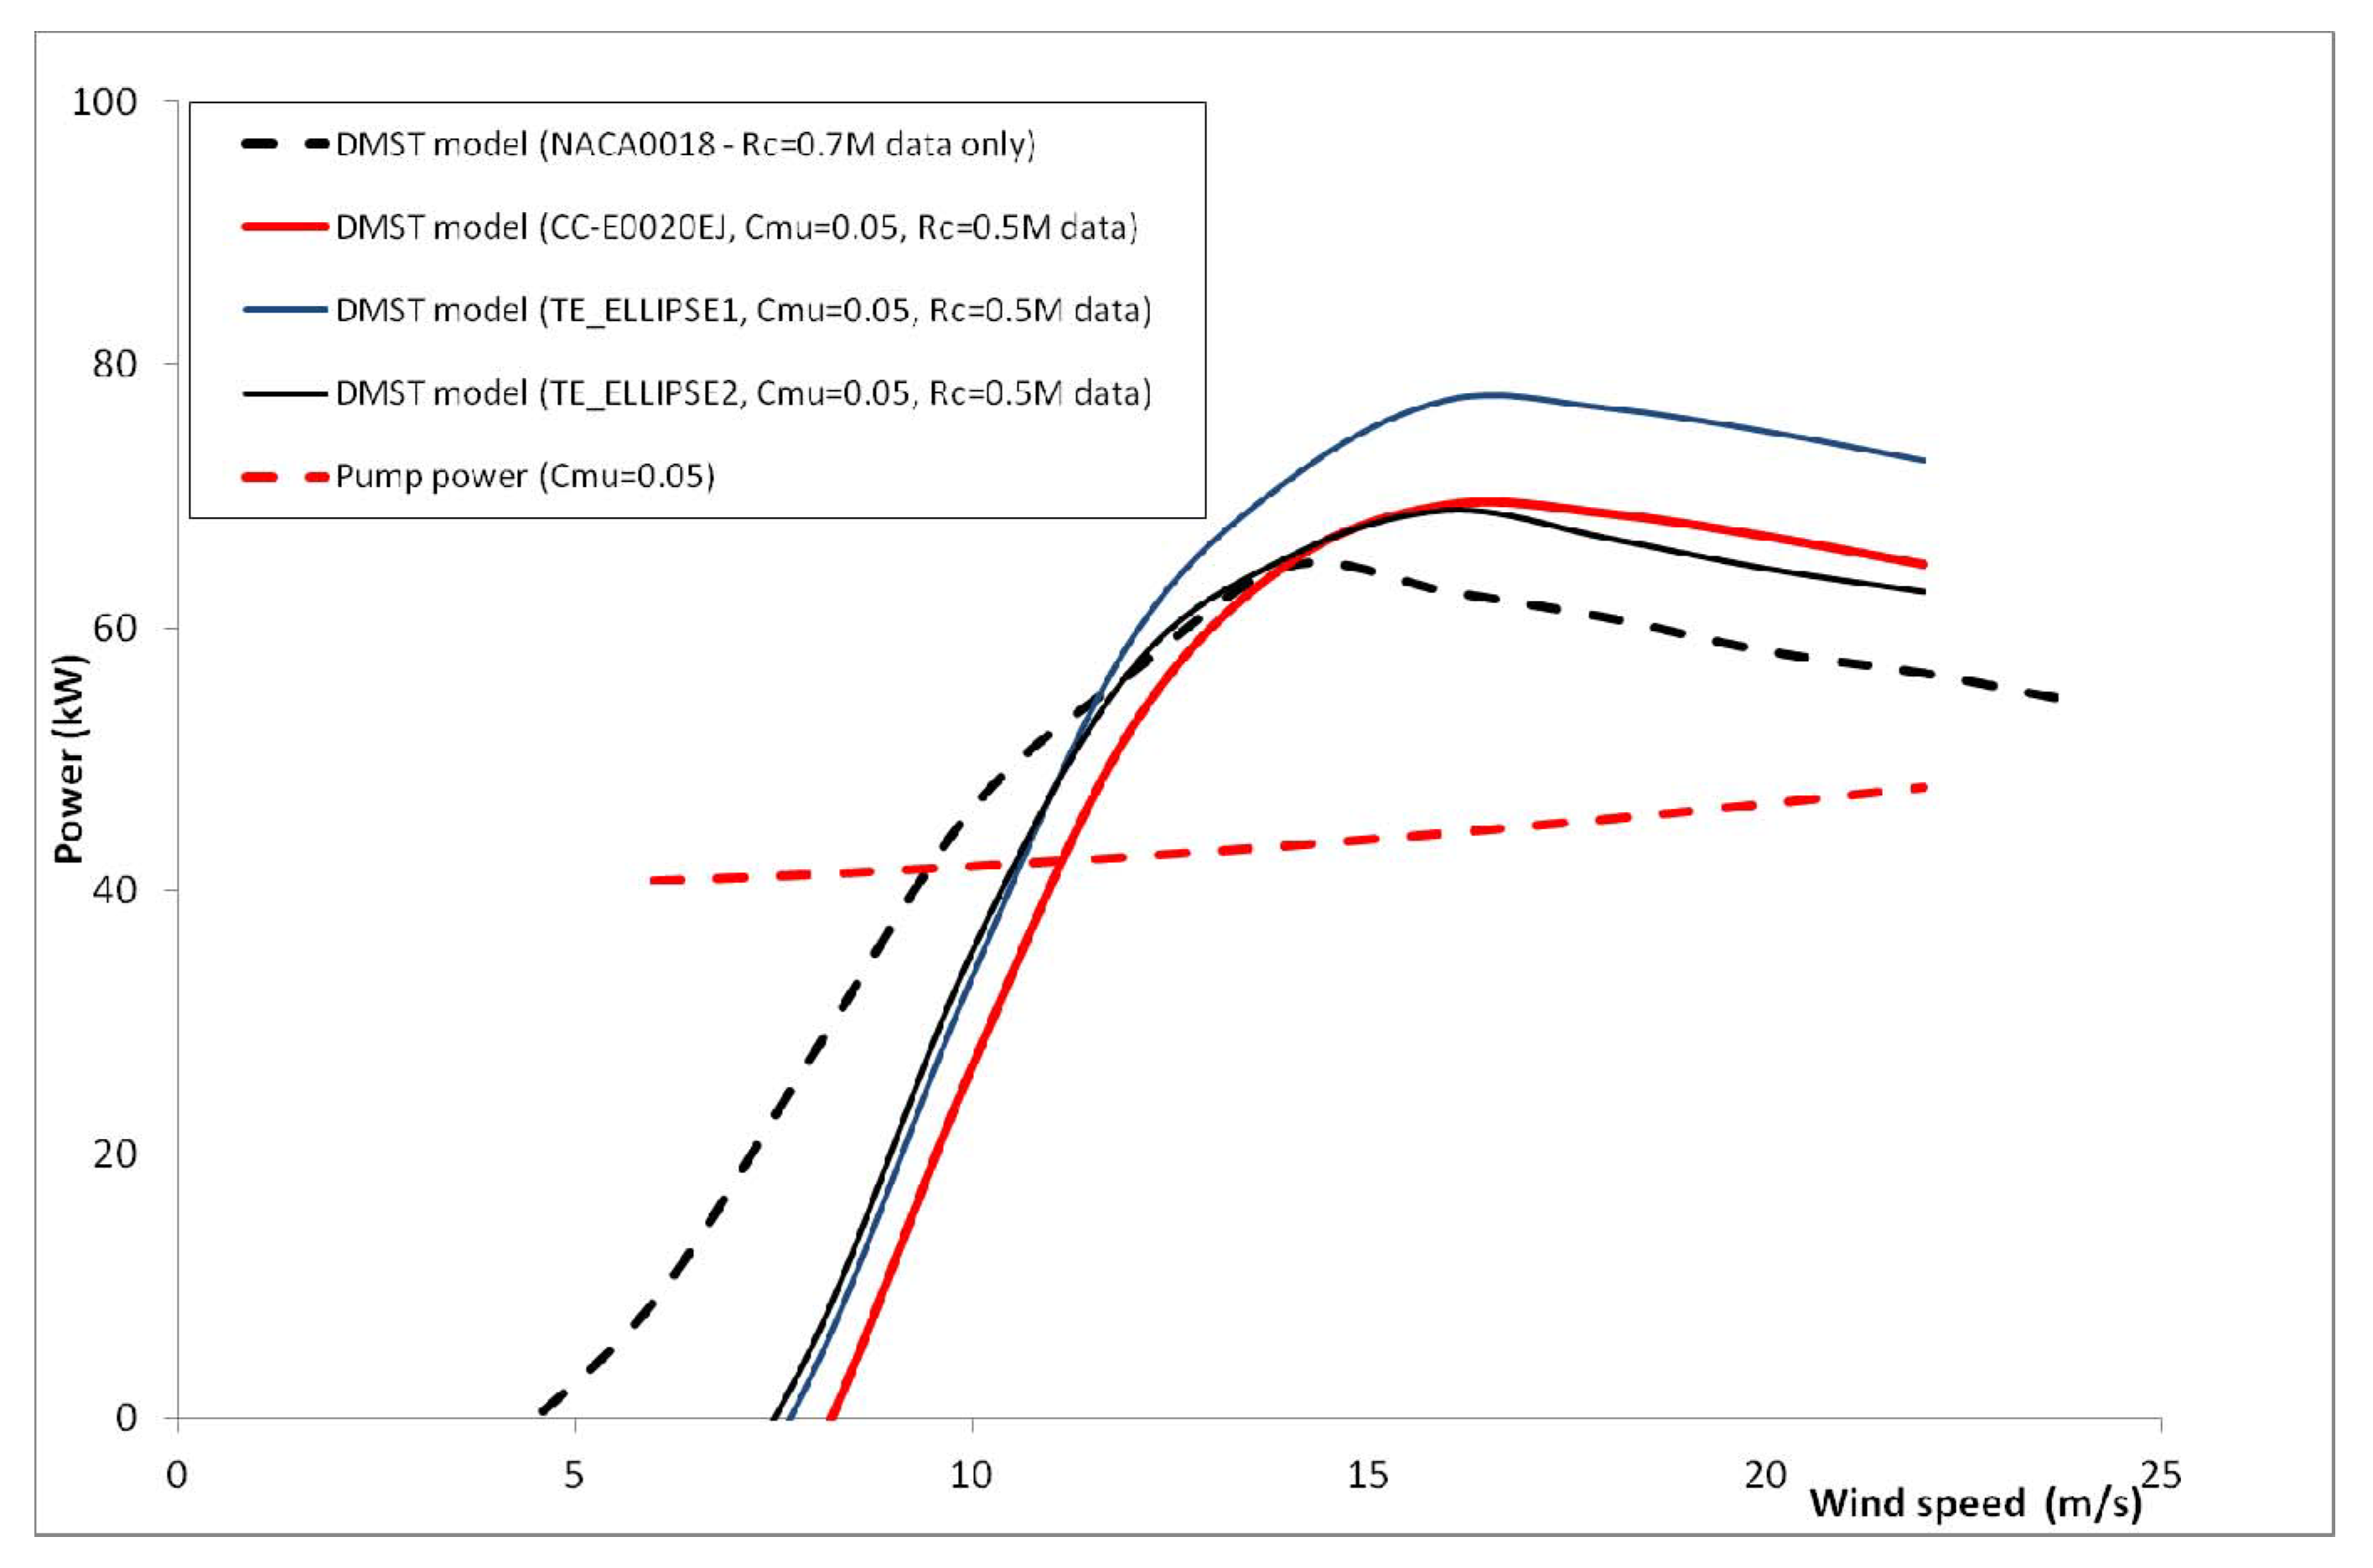
The resulting net power curve in
Figure 16 shows a significant improvement compared to that in
Figure 15 for the continuous blowing case, although the optimum momentum coefficients are similar to those used for the continuous blowing case (
i.e.,
Cμ = 0.05). This improvement is largely due to a pump power reduction of approximately 50% over the wind speed range, achieved by switching off the CC system when not needed. Consequently, the net power matches that for the NACA0018 blade section at low wind speeds and exceeds it for wind speeds over 8 m/s. However, we should note again that the stall characteristics are assumed for the TE_ELLIPSE2 section, and will influence performance for wind speeds above approximately 10 m/s.
Figure 16.
Predicted power of VAWT-260 H-rotor with optimised CC.
Figure 16.
Predicted power of VAWT-260 H-rotor with optimised CC.
Although the performance of the TE_ELLIPSE2 blade section with optimized CC does not seem to offer significant benefits over a NACA0018 section considering the additional system requirements for CC, it should be noted that this section shape is relatively simple. It is envisaged that optimization of the leading and trailing edge shapes for this application will yield significant improvements. Furthermore since CC is more effective over the upwind cycle, a Coanda surface is not necessary for the lower surface, which should reduce base drag further.


