Damping Wind and Wave Loads on a Floating Wind Turbine

Automation and Control, Department of Electronic Systems, Aalborg University, Fredrik Bajers vej 7C, Aalborg Øst 9220, Denmark
*
Author to whom correspondence should be addressed.
Energies 2013, 6(8), 4097-4116; https://doi.org/10.3390/en6084097
Submission received: 22 April 2013
/
Revised: 11 July 2013
/
Accepted: 23 July 2013
/
Published: 9 August 2013
(This article belongs to the Special Issue Wind Turbines 2013)
Abstract
:Offshore wind energy capitalizes on the higher and less turbulent wind speeds at sea. To enable deployment of wind turbines in deep-water locations, structures are being explored, where wind turbines are placed on a floating platform. This combined structure presents a new control problem, due to the partly unconstrained movement of the platform and ocean wave excitation. If this additional complexity is not dealt with properly, this may lead to a significant increase in the structural loads and, potentially, instability of the controlled system. In this paper, the wave excitation is investigated, and we show the influence that both wind speed, wave frequencies and misalignment between wind and waves have on the system dynamics. A new control model is derived that extends standard turbine models to include the hydrodynamics, additional platform degrees of freedom, the platform mooring system and tower side-side motion, including gyroscopic effects. The models support a model-based design that includes estimators for wind speed and wave frequency. The design is applied to a number of examples representing different wind and wave conditions and successfully demonstrates a reduction in the structural oscillations, while improving power performance.
1. Introduction
In the field of wind energy, new and promising wind turbine concepts are being developed. More reliable wind turbines make it possible to install them in harsher environments, such as offshore, where the winds are stronger and the visual impact is less. In shallow waters, it is possible to install monopiles, but in places where water depths are greater than 60 m, floating wind turbines are being investigated, although their financial competitiveness remains to be demonstrated in commercial plants.
The main objective is to produce energy reliably at a competitive cost. To achieve that, maximizing the power and minimizing the fatigue is necessary. Fatigue is basically the wear accumulated over time on key components, such as the tower, gearbox, blades and bearings. If a wind turbine is operated to maximize power production regardless of fatigue loads, the lifetime of key components will significantly decrease, and the cost of energy will go up. This is especially important for a floating wind turbine, which, by nature, is influenced by a constant contribution of oscillations from wind and ocean waves. Therefore, a trade-off between maximization of the power production and minimization of the fatigue loads is required for optimal performance.
Applying conventional onshore control strategies to floating wind turbines has been shown to impose negative damped oscillations on the platform motion. The onshore controller causes the blade pitching to increase the rotor thrust as the wind speed decreases and vice versa, which couples with the platform dynamics in a way that produces large oscillations in platform pitch and, possibly, instability. Reducing the bandwidth of the pitch controller ensure stability, but performance deteriorates. The bandwidth problem is related to right half-plane zeros in the transfer function from pitch angle to generator speed; see, also, [1,2] for onshore and [3] for offshore wind turbines.
A tower damping control strategy was introduced in [4] using a wind estimator applied to a ballast-stabilized wind turbine, and it showed reduced tower oscillation at the cost of reduced power output. In [5], a gain scheduled proportional integrating (GSPI) controller showed good performance regarding tower oscillations, but overshoots rated power and generator speed, which may reduce the generator lifetime. The task of damping tower oscillations was addressed by [6], suggesting an influence of tower acceleration on blade pitch control. A linear quadratic regulator (LQR) was applied to a floating wind turbine in [7,8], which showed improved results in power stability and tower oscillations compared to [5]. Other, similar studies have been published in [9,10], e.g., [9] also used LQR on a floating wind turbine and presented error and platform motion reduction at the same time. In [11], individual blade pitch and constant generator torque was combined with speed reference feedback from the platform pitch.
In the references above, misalignment between wind and waves is not considered, due to the assumption that the waves over time align with the wind.
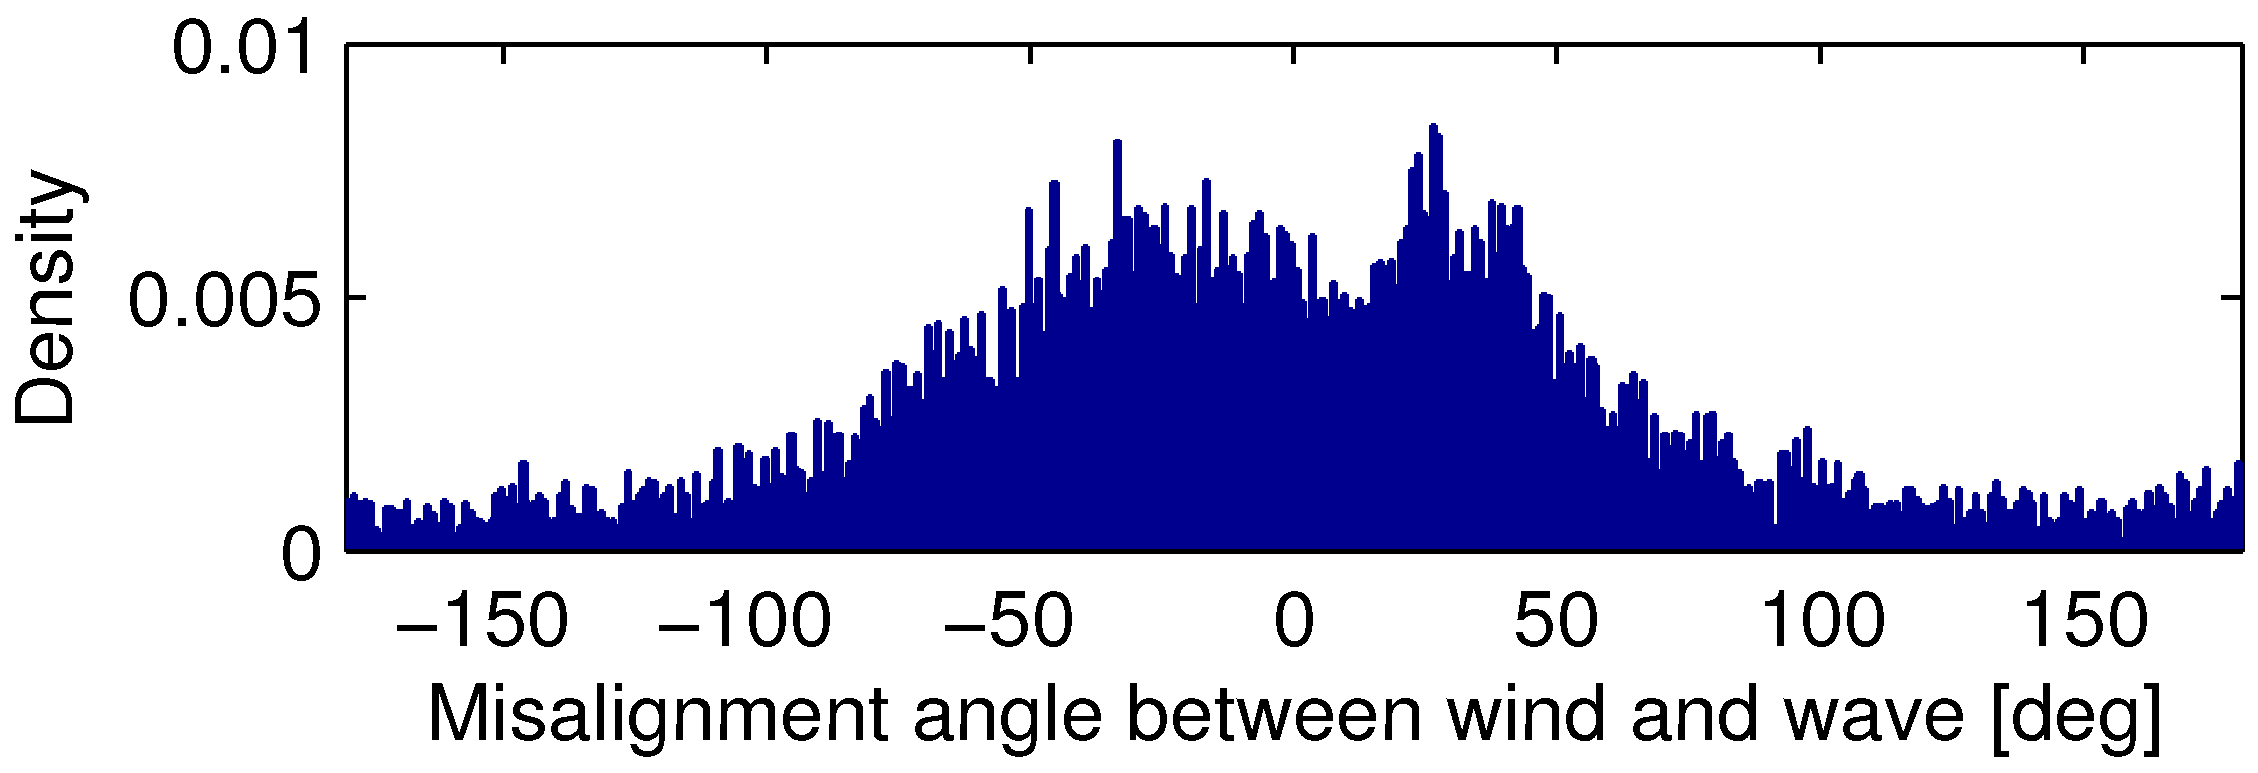
Data from the floating wind turbine, Hywind Demo (delivered by Statoil), is presented in Figure 1. It shows that misalignments do occur, and it is hence relevant to address this in control design.
Furthermore, the literature on the control strategies of floating wind turbines does not account for the frequency dependence of the hydrodynamic damping. In this paper, we show that both wind speed and wave frequencies have a substantial influence on the total system damping.
In the context of model-based control, this paper contributes with a new control model of a floating wind turbine, which accounts for hydrodynamics, additional platform degrees of freedom, the platform mooring system, tower side-side motion and gyroscopic effects. This model allows us to address the topics above in the control design.
Figure 1.
Probability density function of wave misalignment at the Hywind location, sampled primary during the first five months of 2010.
Figure 1.
Probability density function of wave misalignment at the Hywind location, sampled primary during the first five months of 2010.
Based on the model, a new control structure is presented, which includes estimates of wind speed and wave frequency in the controller. The result is a control strategy capable of actively damping structural oscillations, while fulfilling the objective of maximizing power. The control strategy allows us to operate at the designed bandwidth of the wind turbine pitch system, while avoiding stability problems.
2. Methods
2.1. A Coupled Aero- and Hydro-Dynamic Control Model
A simulation tool such as the Fatigue, Aerodynamics, Structures, and Turbulence code (FAST) [12], is able to simulate a floating wind turbine and linearize the system at some operating point. FAST can generate a set of linearized models for a given set-point, but they are not parameterized in wind speed and wave frequency, which will prove valuable in the control design here. The model presented here is parameterized in wind speed and wave frequency.
The forces acting on the system can be described by:
The forces are both linear and nonlinear, where are the structural masses; q represents degrees of freedom (DOF) and are the hydrodynamic added masses and damping. are forces from mooring lines; are gravitational forces; are gyroscopic effects and are tower defection forces. The external forces are thrust force from the wind, denoted , and wave induced loads, denoted . The forces induced by the actuators are denoted .
The degrees of freedom of the system can be described by:
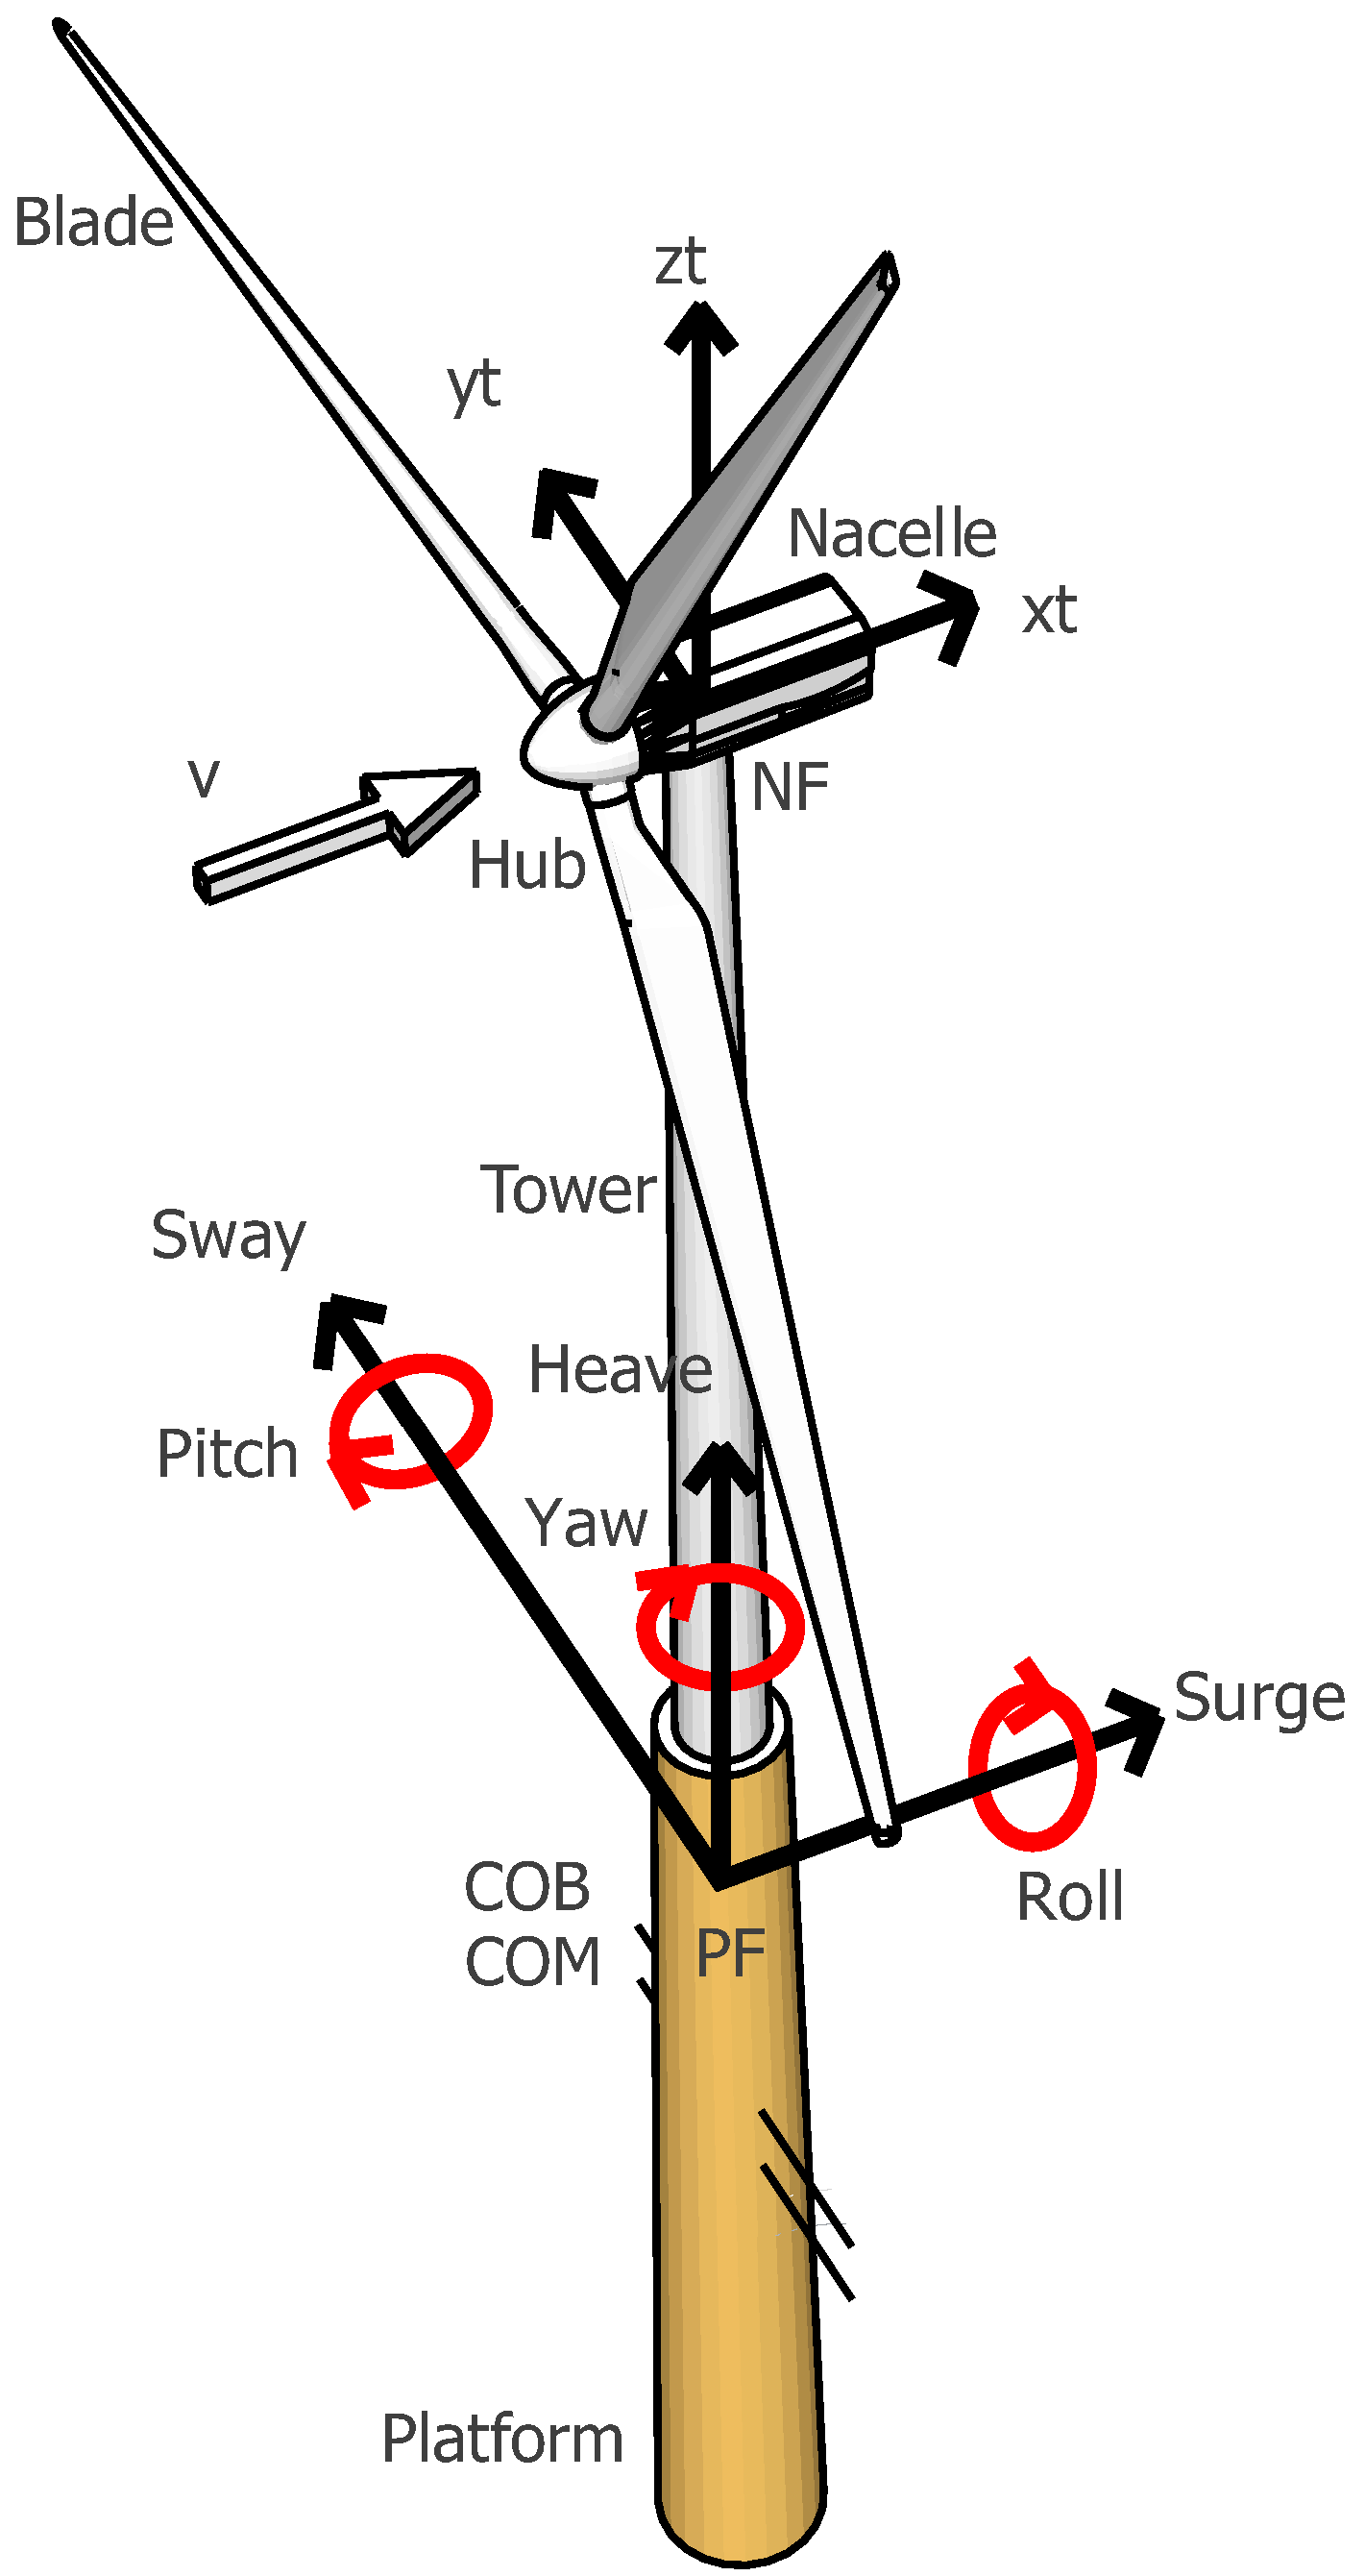
![Energies 06 04097 i001]() which describes platform translation and rotation (, , ); tower deflection (, ) and actuator dynamics (τ, β). Figure 2 illustrates the six platform degrees of freedom and the two tower degrees of freedom.
which describes platform translation and rotation (, , ); tower deflection (, ) and actuator dynamics (τ, β). Figure 2 illustrates the six platform degrees of freedom and the two tower degrees of freedom.

Figure 2.
Floating wind turbine comprising a wind turbine mounted on a floating spar buoy platform (note: the mooring system is not shown). Drivetrain torsion, torque actuator and pitch actuator are not described. COM is the total center of mass and COB is the total center of buoyancy.
Figure 2.
Floating wind turbine comprising a wind turbine mounted on a floating spar buoy platform (note: the mooring system is not shown). Drivetrain torsion, torque actuator and pitch actuator are not described. COM is the total center of mass and COB is the total center of buoyancy.

The model is based on well known wind turbine models from the literature on onshore wind turbines comprising aerodynamics, tower dynamics, drivetrain dynamics and actuator dynamics [13]. However, the hydrodynamic effects on the masses and friction of the platform have been included in the model [14,15,16]. Wind and wave loads can influence both the tower fore-aft and side-side dynamics; thus, these dynamics are also included in the model. The ability of the platform to move in translational directions is closely related to the dynamics of the mooring system. This system is designed to prevent the platform for drifting away and to ensure yaw stiffness. This stiffness is important to keep the wind turbine upwind. However, an uneven wind distribution on the rotor plane can induce yaw moment on the platform. Another effect, which can induce yaw moments, is the gyroscopic effect of the rotor caused by fore-aft motions. Therefore, both the mooring system and the gyroscopic effect are included in the model.
The combined system can be described as a nonlinear system, which depends on the wind speed and the wave frequency:
where is the frequency of the propagating ocean wave. The notation of is relaxed to , thus:
Here, represents the inertia; is the damping and is the stiffness. These matrices include terms, where represents the platform; is the tower; is the drivetrain and is the actuator. The system properties are defined at the sea water level (SWL) about the vertical centerline of the platform. The mass matrix, , is not diagonal in general, but has non-zero cross terms from, i.e., pitch and surge. The version used here is simplified to represent the dominating diagonal elements only; a fact that has been supported by simulations that show a limited impact of the cross terms (simulation not included here).
In the following, all parameters going into , and are referred to as inertia, damping and stiffness, even though some are not in a physical sense. Note that the models of wind and wave loads are simplified and only valid for moderate wave heights and wind.
2.2. Modeling of Mass and Inertia
To keep the text compact, the matrix notation is simplified using, e.g., the notation, and , as representations of diagonal matrices. To model how a structure moves or rotates in water, the mass and inertia of the displaced water must be included. This mass and inertia are referred to as the added mass and must be summed with the mass and inertia of the platform and the turbine, , where the total system has a mass of m, pitch inertia of , roll inertia of and yaw inertia of . The turbine mass and inertias are insignificant compared to the mass and inertia of the platform and the added mass. The frequency of the ocean waves is denoted by , which determines the quantity of added mass from the water, . However, note that the significant quantity of added mass for the given spar (Hywind Demo) platform only varies a few percent over frequency. The added mass matrix can be generated using a wave interaction analysis tool, such as WAMIT, for the platform [14,17].
The wind turbine is mounted on top of the platform and has a mass of , where is the identity matrix and comprises the mass of the tower, nacelle hub and blades. Of course, the wind turbine has an impact on the platform and vice versa in both rotation and translation, , where , and is the distance from SWLto the center of mass of the turbine.
The inertias of the drivetrain are defined by , where is the rotating inertia and is the inertia of the rotor low speed shaft. The possibility of altering the operation of the generator and rotor effectiveness is achieved using actuators. The inertias of the actuators are defined by , where is the inertia of the blade pitch actuator and is the inertia of the generator torque actuator.
2.3. Modeling of Damping
The damping of the platform is affected by gyroscopic effects, hydrodynamics and linear damping: . The rotor causes a damping force on the platform, due to the gyroscopic effect between the platform yaw and the pitch, , where is the inertia of one blade about the rotor axis and is speed of the rotor. The hydrodynamic damping, , is caused by platform movement or rotation in the water. In contrast to the added mass, hydrodynamic damping is highly frequency-dependent. Hydrodynamic damping can also be generated using a wave interaction analysis tool, such as WAMIT [14,17]. The linear damping, , is an empirical damping verified in [14] to resemble the Hywind Demo in the OC3 Hywind FAST simulator [12].
The tower deflection has a damping of , where is the tower damping. However, the tower deflection has a damping effect on the platform rotation, hence .
The drivetrain has a friction defined by , where resembles the viscous friction of the torsion in the flexible shaft of the drivetrain.
The damping of the actuators are defined by , where resembles the electrical damping of the generator, while resembles the mechanical damping in the pitch actuator.
2.4. Modeling of Stiffness
The stiffness of the platform is defined by , where is the hydrostatic restoring stiffness, is the stiffness caused by the mooring lines and is the stiffness due to gravity.
The stiffness of the flexible tower is defined by , where is the tower stiffness. However, the flexible tower also has an impact on the platform stiffness, , where g is the gravitational acceleration and .
The stiffness related to the drivetrain is defined by , where is the stiffness in the torsion of the drivetrain. There is also a stiffness related to the actuator, defined by , where is the stiffness related to the electrical torque generation and is the mechanical stiffness in the blade pitch system. However, the generator torque also has an impact on the drivetrain, , where N is the gear ratio, and also an impact on the tower’s side-side deflection, , and since the tower deflection is only relative to the platform, , where and is the height from the SWL to the hub.
2.5. Aerodynamic Forces
The aerodynamic force of the wind is defined by , where the aerodynamic rotor thrust; , and torque, , have a nonlinear effect on the system, given by and , where is the ratio between the blade tip speed and the relative wind speed. The relative wind speed, , is defined by ; where v is the ambient wind speed; is the platform surge velocity; is the height from SWL to hub; is the platform pitch and is relative tower displacement. Since this expression includes some of the system states, an impact on the system damping is expected. The partial derivatives of the aerodynamic thrust force, , and , , and the aerodynamic moments, , , and , are thus included in the damping matrix, , and the stiffness matrix, .
2.6. Wave Excitation Force
The wave excitation force describes the impact of a single incident wave on the platform by , where is the wave height; is a normalized wave excitation force vector; is the wave frequency and is the wave’s direction. As wave excitation force does not depend on any DOF’s of the control model, the wave excitation force has no impact on the natural damping of the system.
2.7. Inputs Reference
The system has two controllable inputs, which are defined by , where is the reference for the generator torque and is the reference for blade pitch angle.
2.8. Model Validation of Control Model
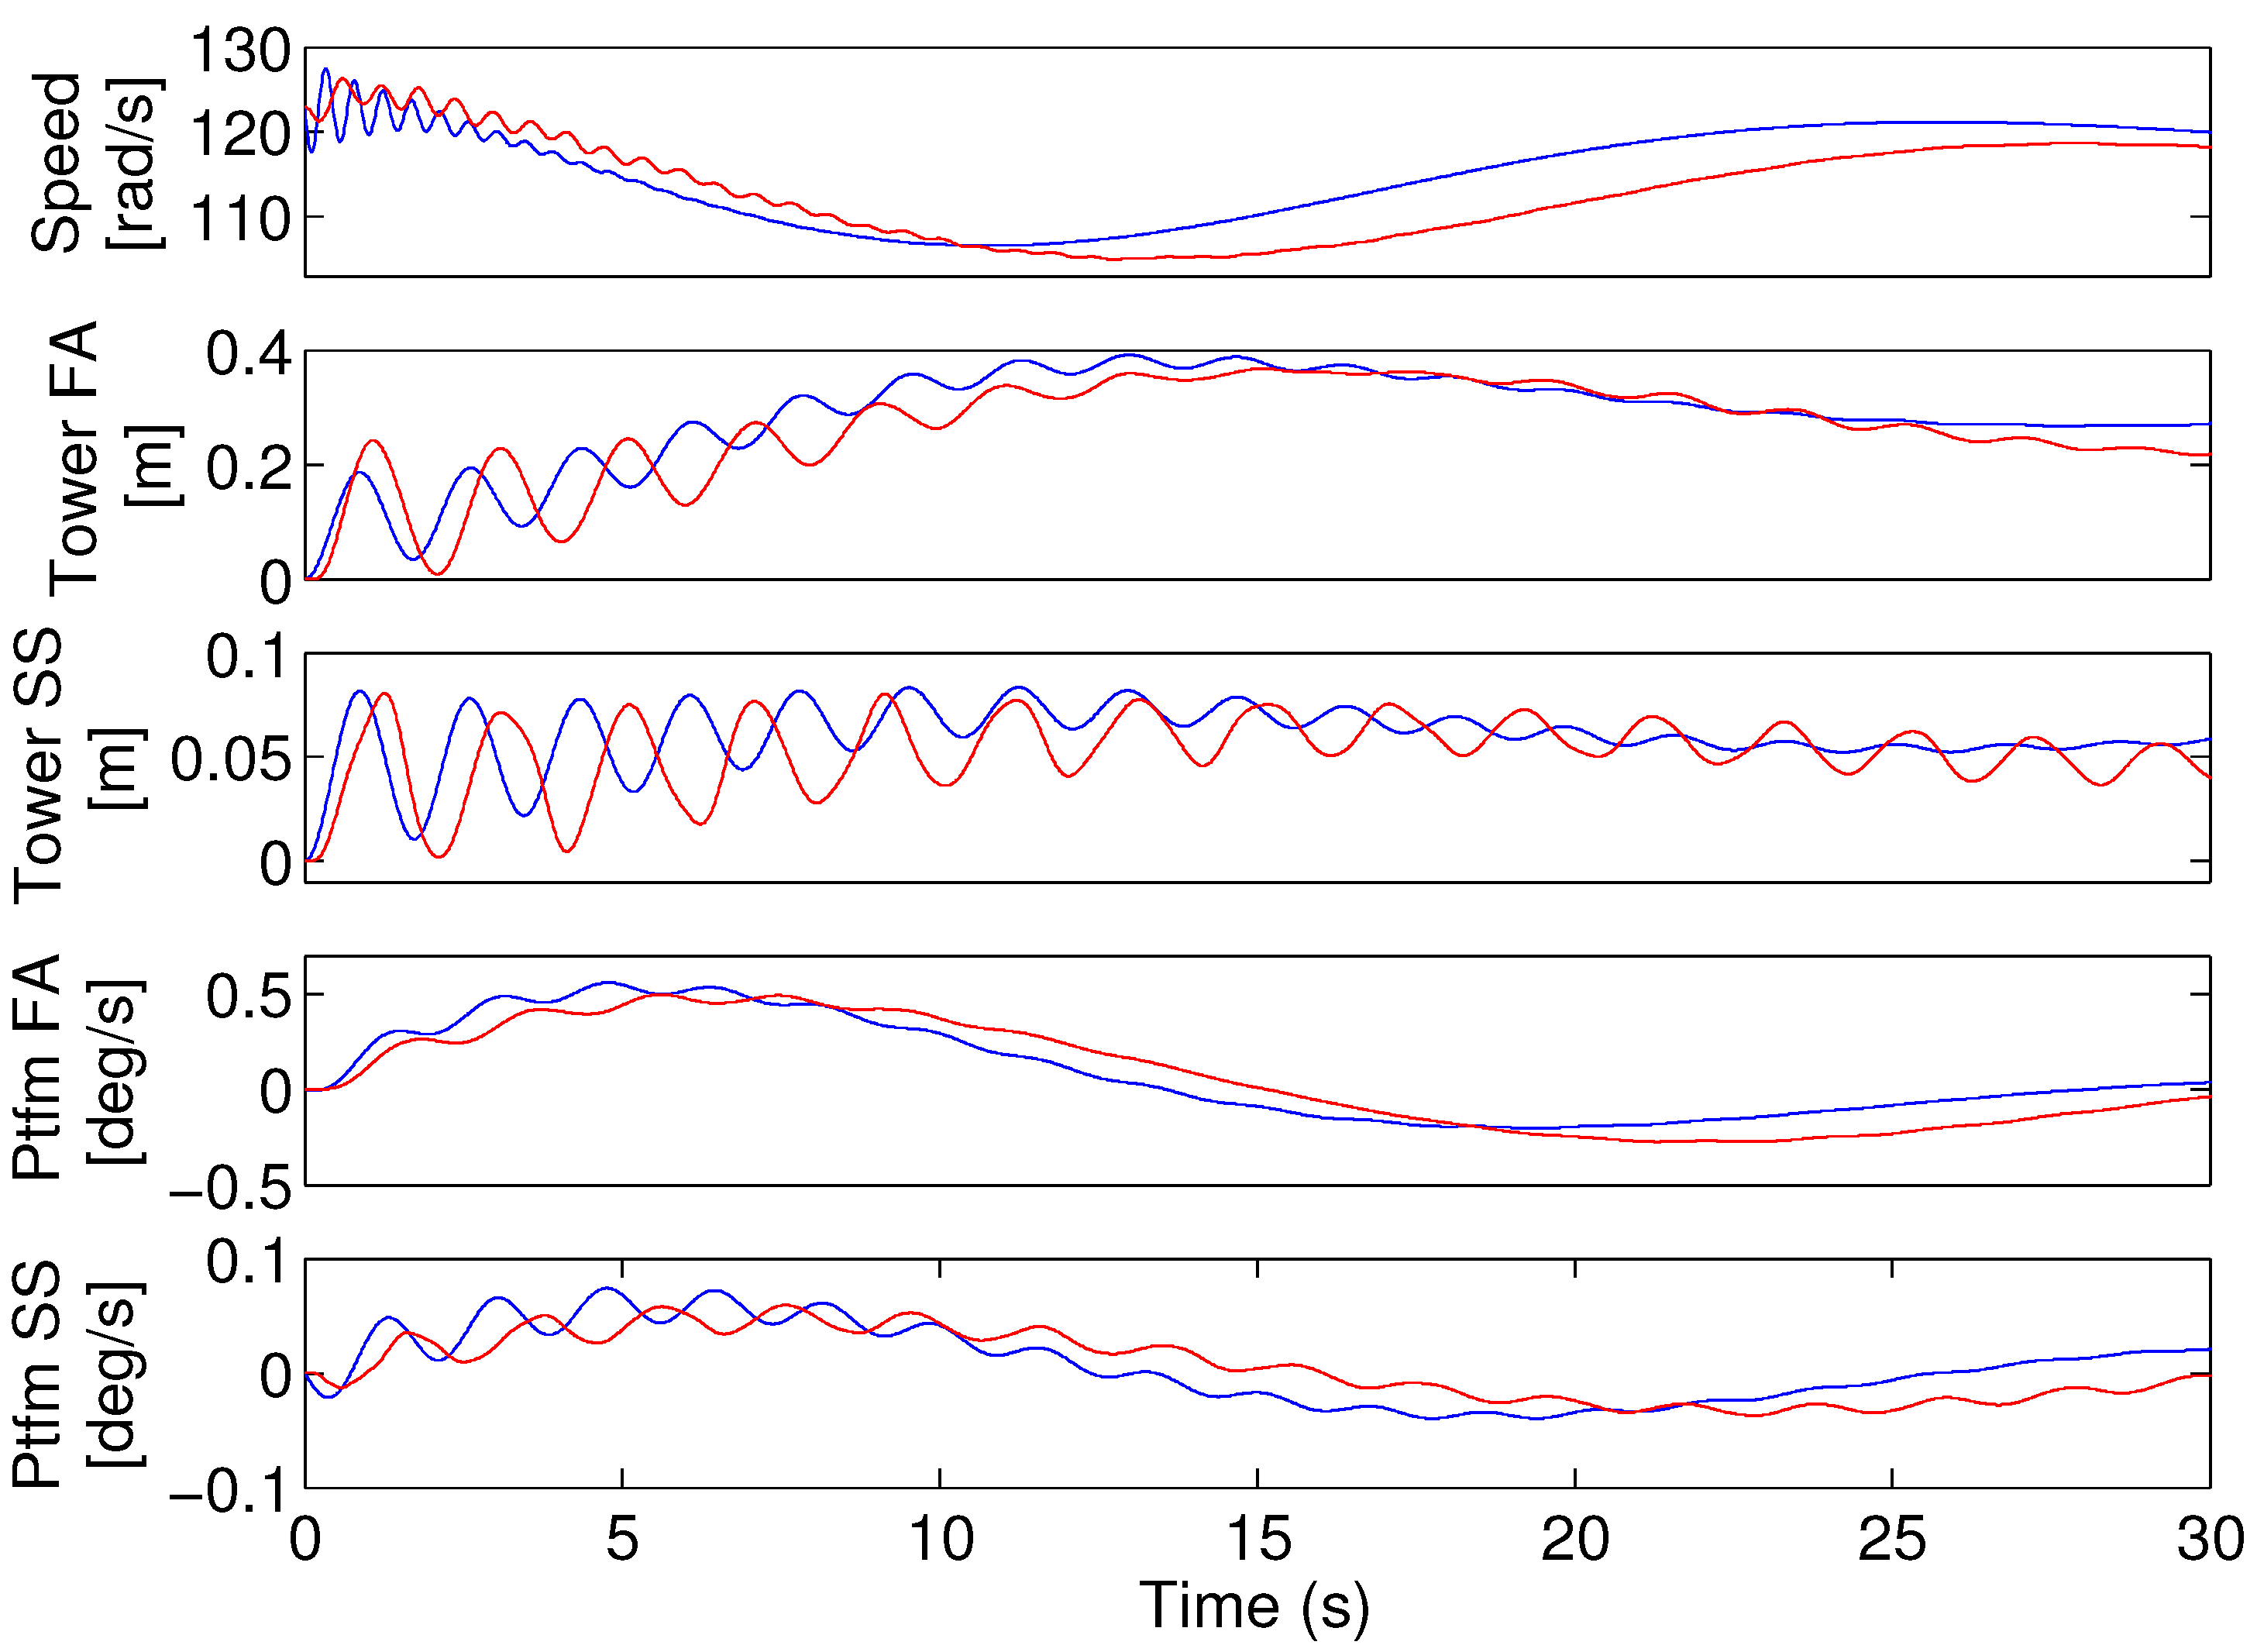
To validate the presented model, a time series comparison is presented in Figure 3 between the OC3 Hywind model of a floating wind turbine (FWT) and the presented control model. The figure shows the response of the FWT when released from a horizontal orientation at time zero.
Figure 3.
Model validation of selected states, where red is the FAST code simulation and blue is the presented control model. At time zero, the floating wind turbine (FWT) is released from the horizontal in still waters at a wind speed of 14 m/s.
Figure 3.
Model validation of selected states, where red is the FAST code simulation and blue is the presented control model. At time zero, the floating wind turbine (FWT) is released from the horizontal in still waters at a wind speed of 14 m/s.

The presented states are generator speed, tower deflection in fore-aft and side-side and platform rotation in fore-aft and side-side.
The rotor is spinning at rated speed, with constant generator torque and blade pitch angle. The wind speed and the wave frequency are the parameters in the presented model; thus, the model is validated at a wind speed of 14 m/s in still waters. Disturbances from the turbulence of the wind and incident waves are not included in the comparison study.
The figure shows comparable behavior between the two models, in terms of the amplitude and frequency. The presentation of the design model validation is limited, but the final validation of the controller later in the chapter using data from FAST is an indirect indication of the validity of the design model.
2.9. Combined Aero- and Hydro-Dynamic Damping
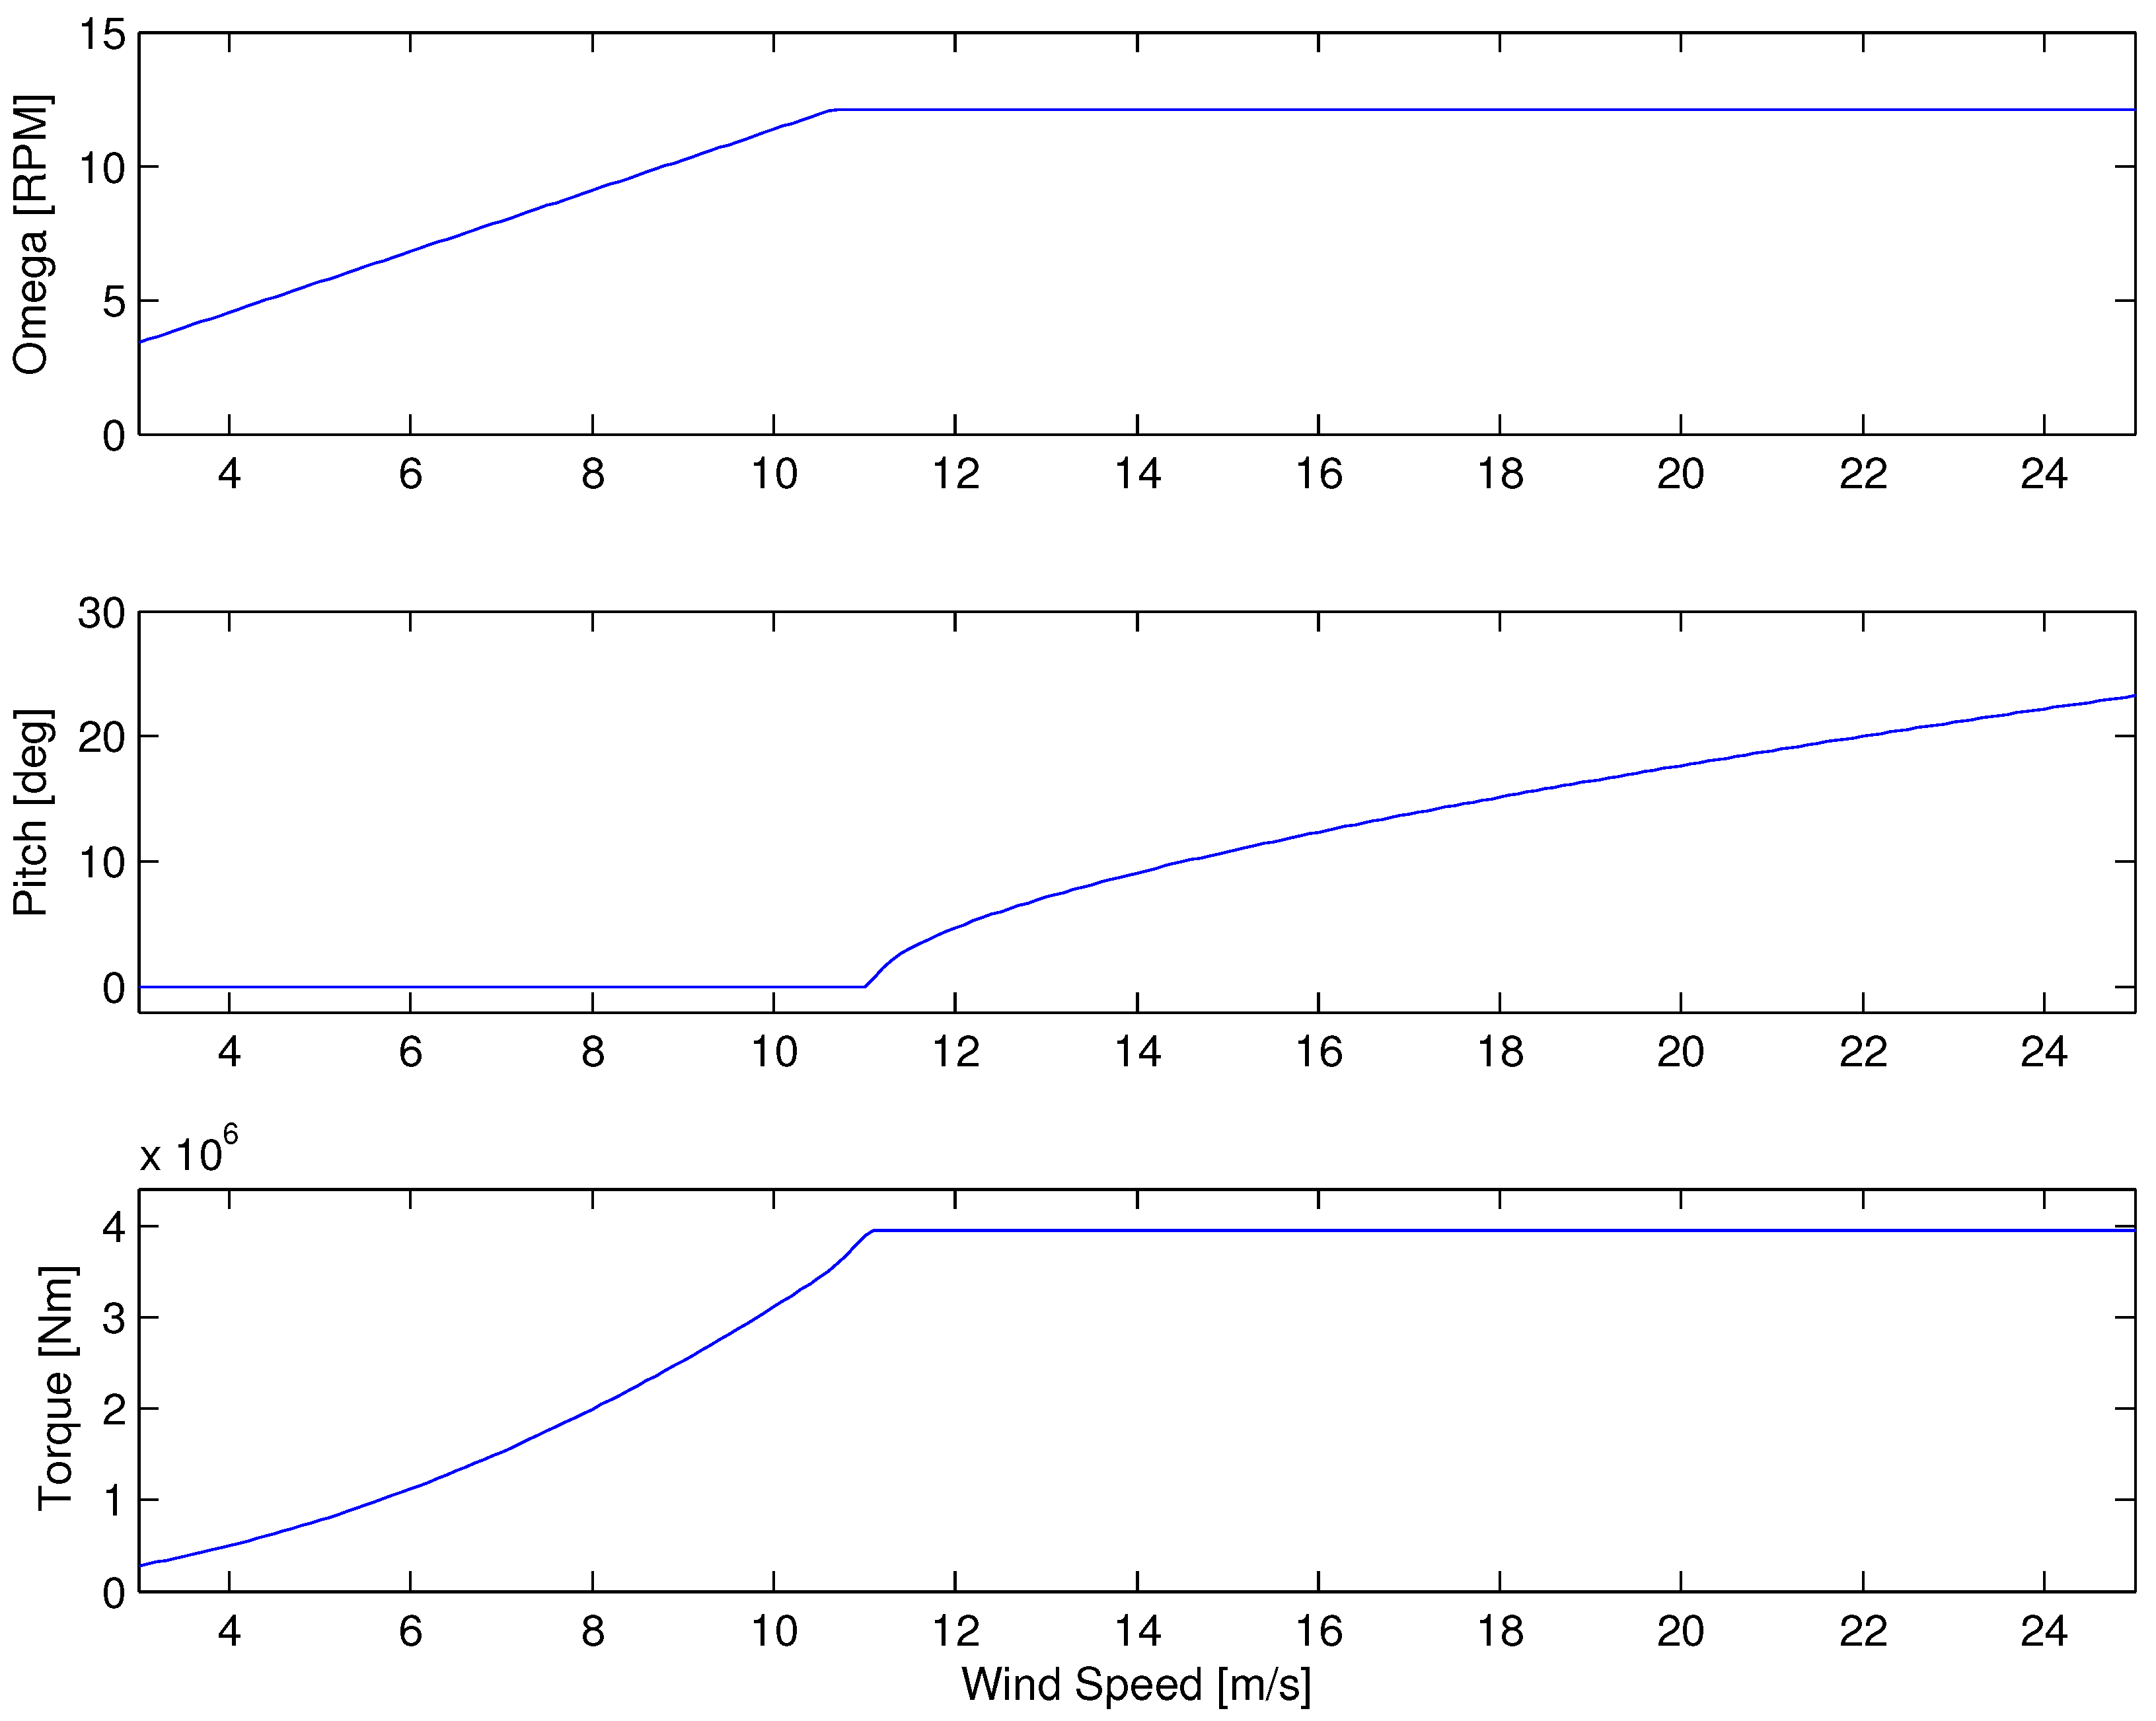
To determine the combined damping of the open-loop system, it is necessary to understand the aerodynamic damping. The aerodynamic damping depends on the control objectives of the wind turbine. At low wind speeds, the objective is to optimize power; however, at a defined rated wind speed, the objective changes to limit the electrical power output. In Figure 4, these objectives are presented as trajectories for generator speed, blade pitch angle and generator torque.
Figure 4.
Ideal closed-loop operating strategy to maximize power below rated wind speed and to reduce loads and keep rated power above rated wind speed.
Figure 4.
Ideal closed-loop operating strategy to maximize power below rated wind speed and to reduce loads and keep rated power above rated wind speed.

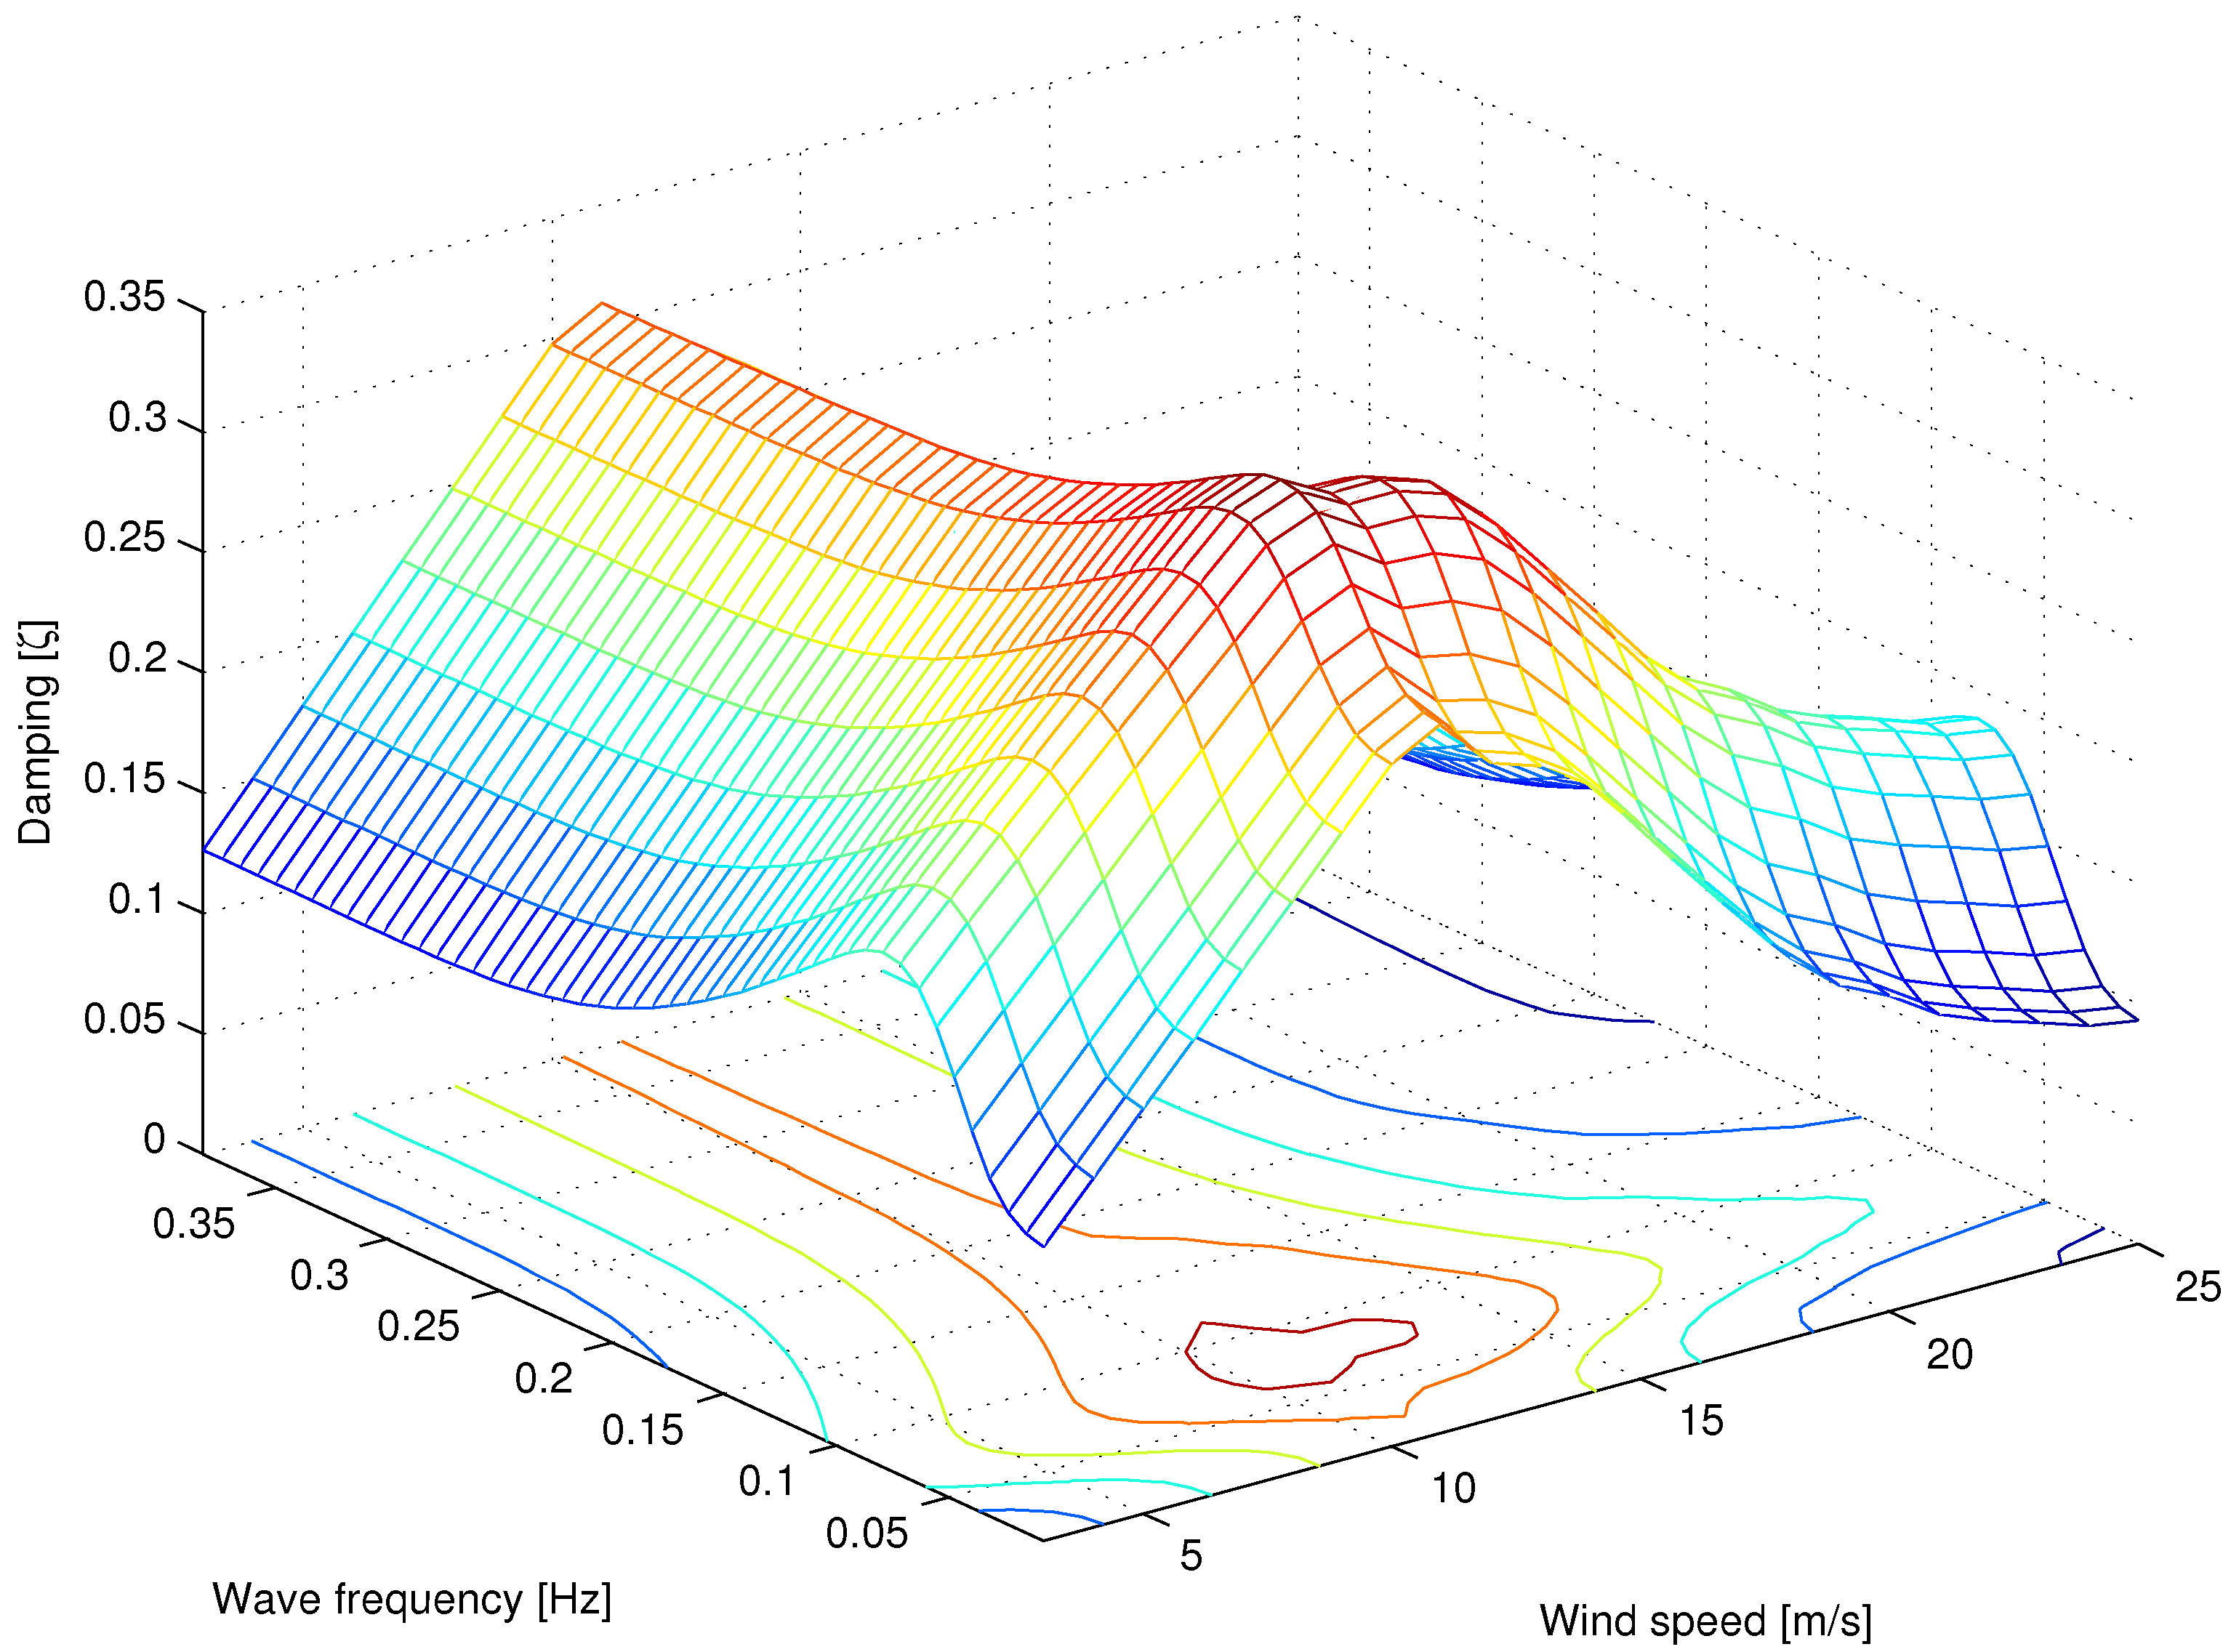
Based on these trajectories, the damping of the open loop system is presented in Figure 5 and Figure 6, which illustrate the open loop linearized damping of the platform rotation and the relation to the wind speed and wave frequency. Due to nonlinearities (and variance in the aero- and hydro-dynamics) the presented model is linearized at an interval of 0.5 m/s from 3 m/s to 25 m/s. The state space model is linearized, using standard Taylor approximation. Eigenvalues and associated physical modes associate. The damping of the eigenvalues in the complex plane is then used. The figure shows that the maximum damping of the platform rotation is achieved at a wind speed of 10.4 m/s and a wave frequency of 0.09 Hz. Figure 5 and Figure 6 demonstrate that the variation in damping is considerable, indicating that there could be benefits from a control design that incorporates wind speed and wave frequency.
In platform roll, the wind speed has no dynamical impact. The third rotational degree of freedom is platform yaw. It is assumed that the impact of the wind and wave dynamics are insignificant on a spar buoy platform compared to other dynamics acting on the yaw, such as gyroscopic effects and the rotor yaw moments induced by the wind.
Figure 5.
Open loop damping in platform pitch as a function of wave frequency and wind speed.

Figure 6.
Open loop damping in platform roll as a function of wave frequency and wind speed.
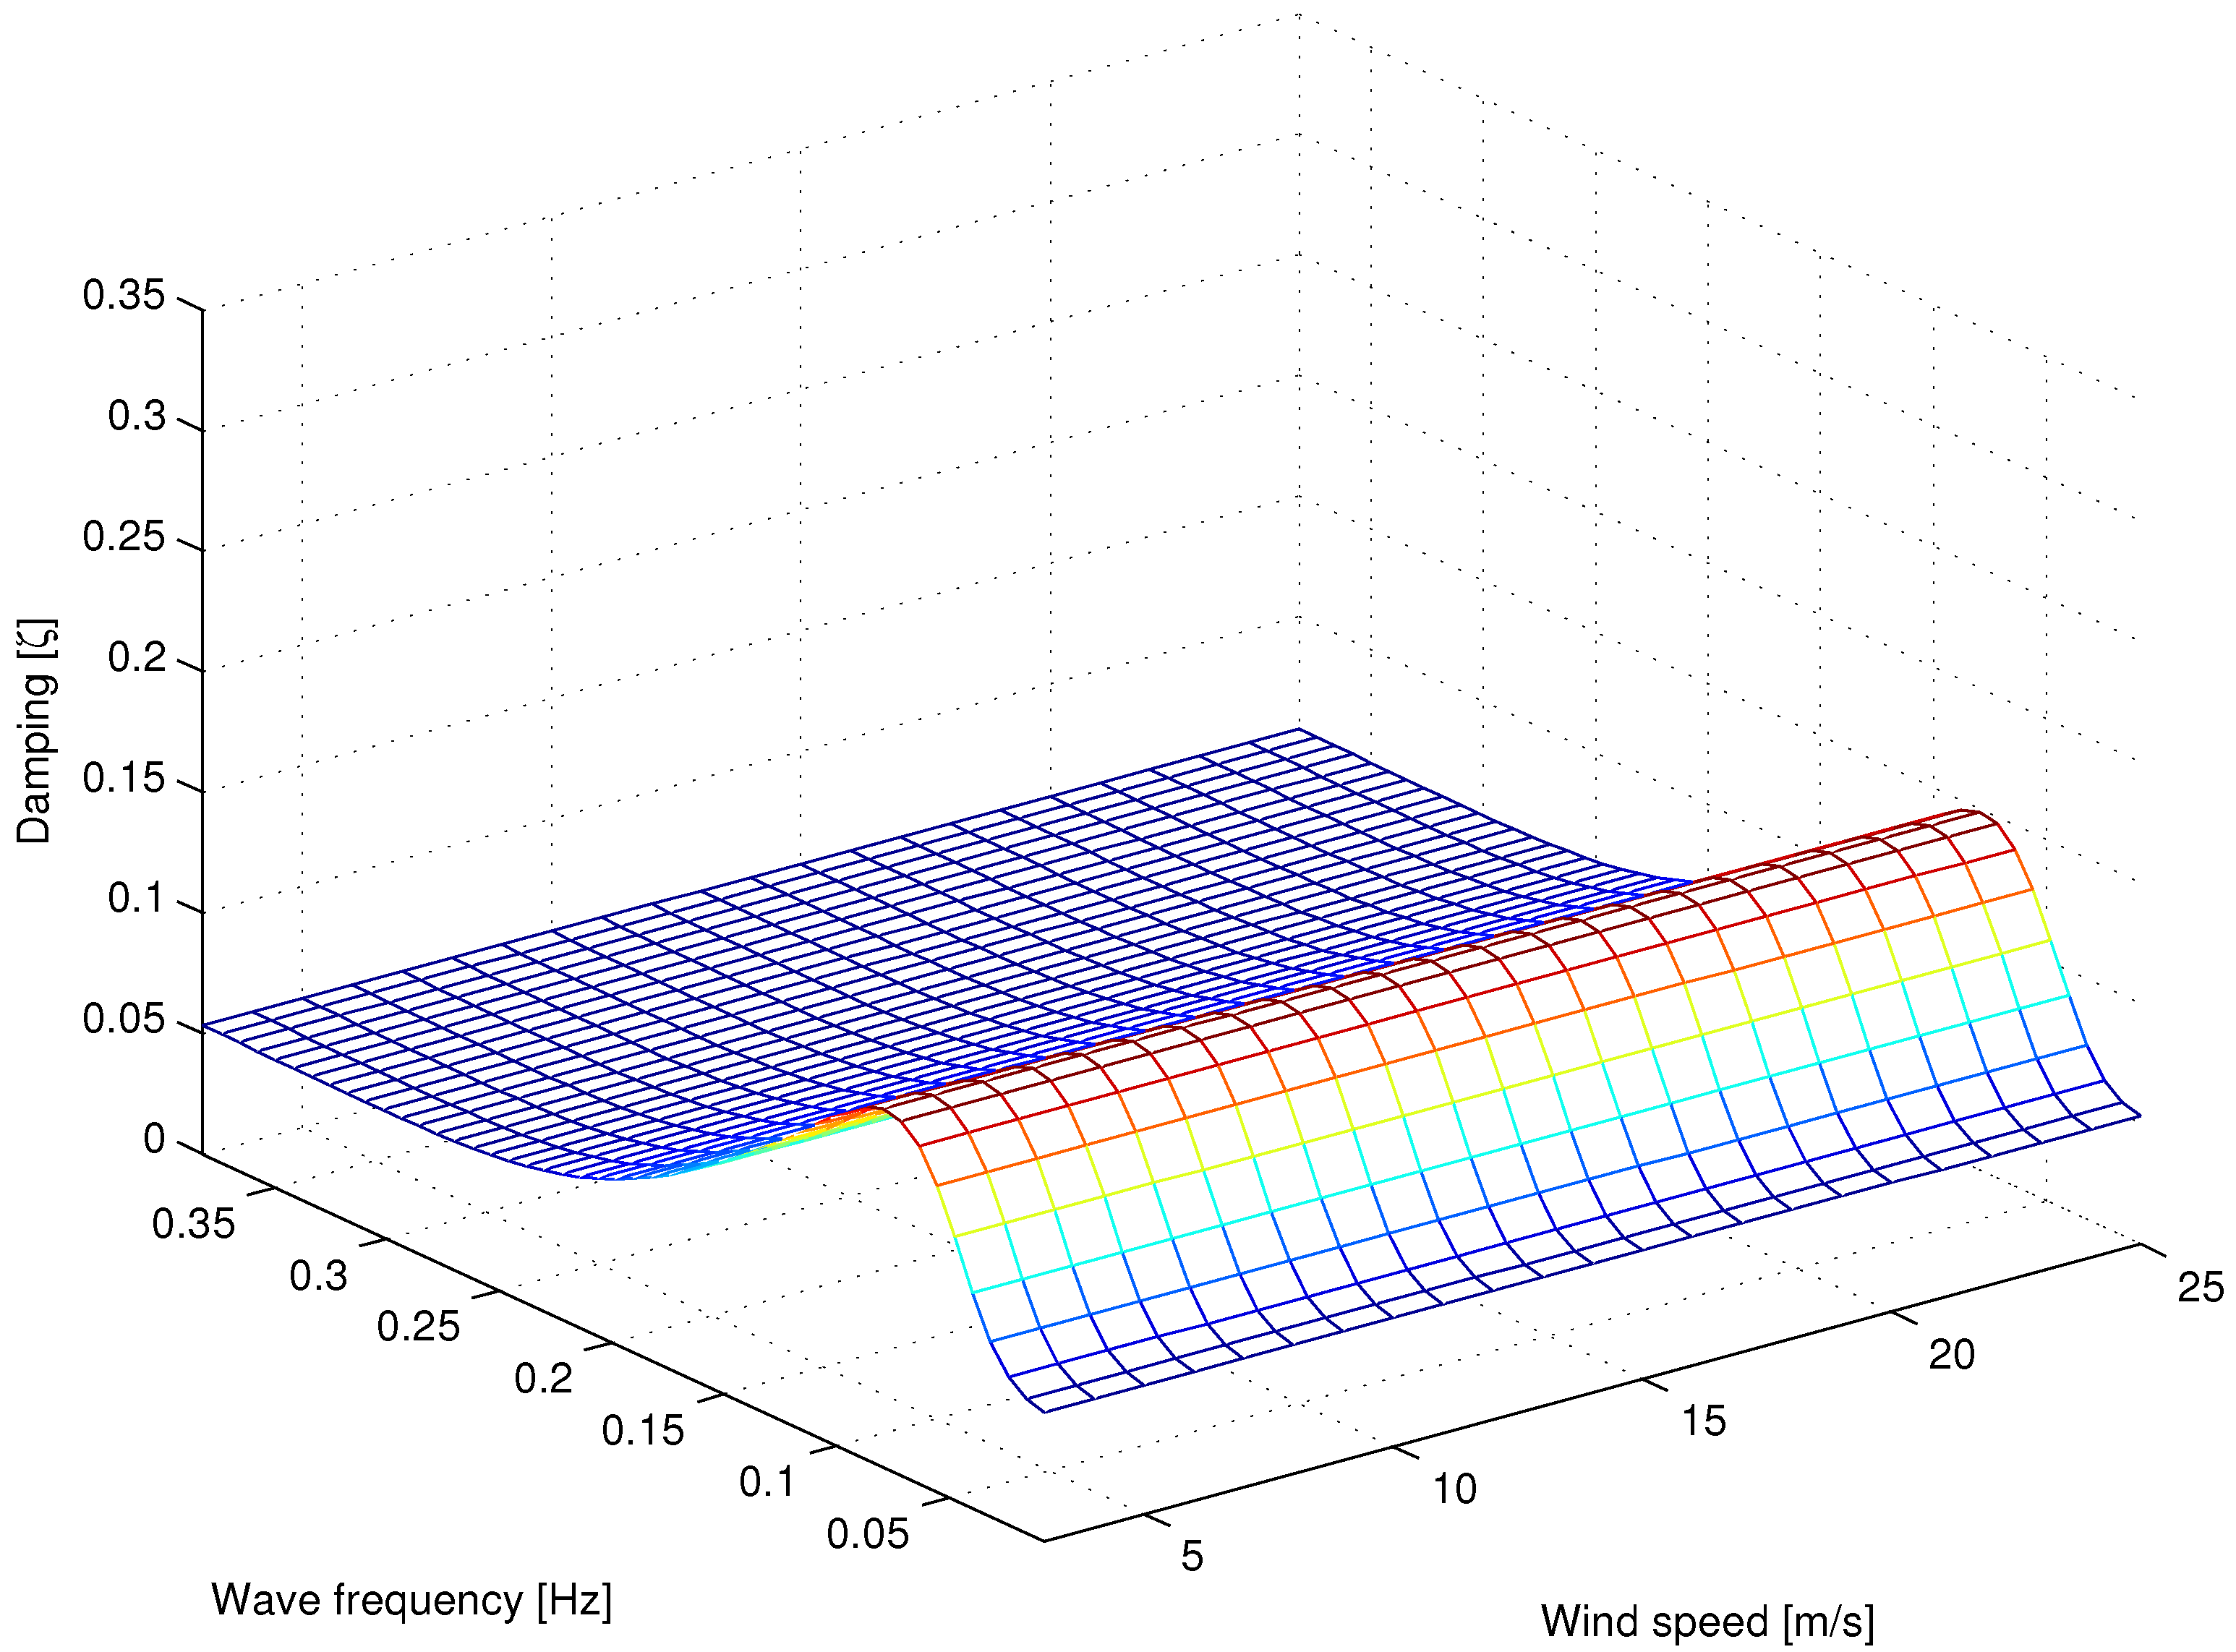
The hydrodynamic damping of the system can be explained by hydrodynamic drag, which varies over the relative wave velocity and due to the geometric and surface smoothness of the platform [18]. For deep waters, the wave velocity can be defined by at the free surface, where a is the wave amplitude and is the wave frequency. The wave amplitude is closely related to the wave spectrum, which, again, depends on the wave frequency. Thus, the hydrodynamics damping is presented in Figure 5 and Figure 6 as a function of wave frequency [19].
“Proportional to” has been replaced by “increasing with”. The next sentence is reformulated to “The trust force and hence the damping...”
The aerodynamic damping increases with the aerodynamic trust force. The thrust force and, hence, the damping increase below the rated wind speed and decrease above the rated wind speed, due to thrust reduction. In Figure 5, the damping seems to have a different behavior at about 10–12 m/s, which may be explained by the change in operation strategy in Figure 4, where constant generator speed is reached. At this point, the tip-speed-ratio goes from constant to decreasing as the wind speed increases.
2.10. Control Strategy Above Rated Wind Speed
A model-based control strategy is chosen to control and damp the system. Despite that the control model is presented for the full wind range, a controller is designed only for wind speed above the rated wind speed to avoid transitions between objectives.
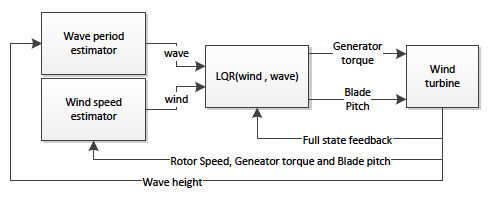
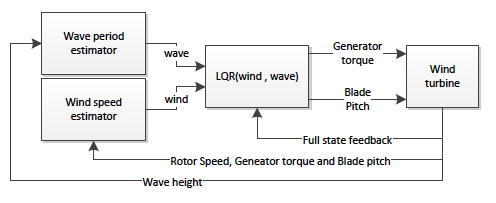
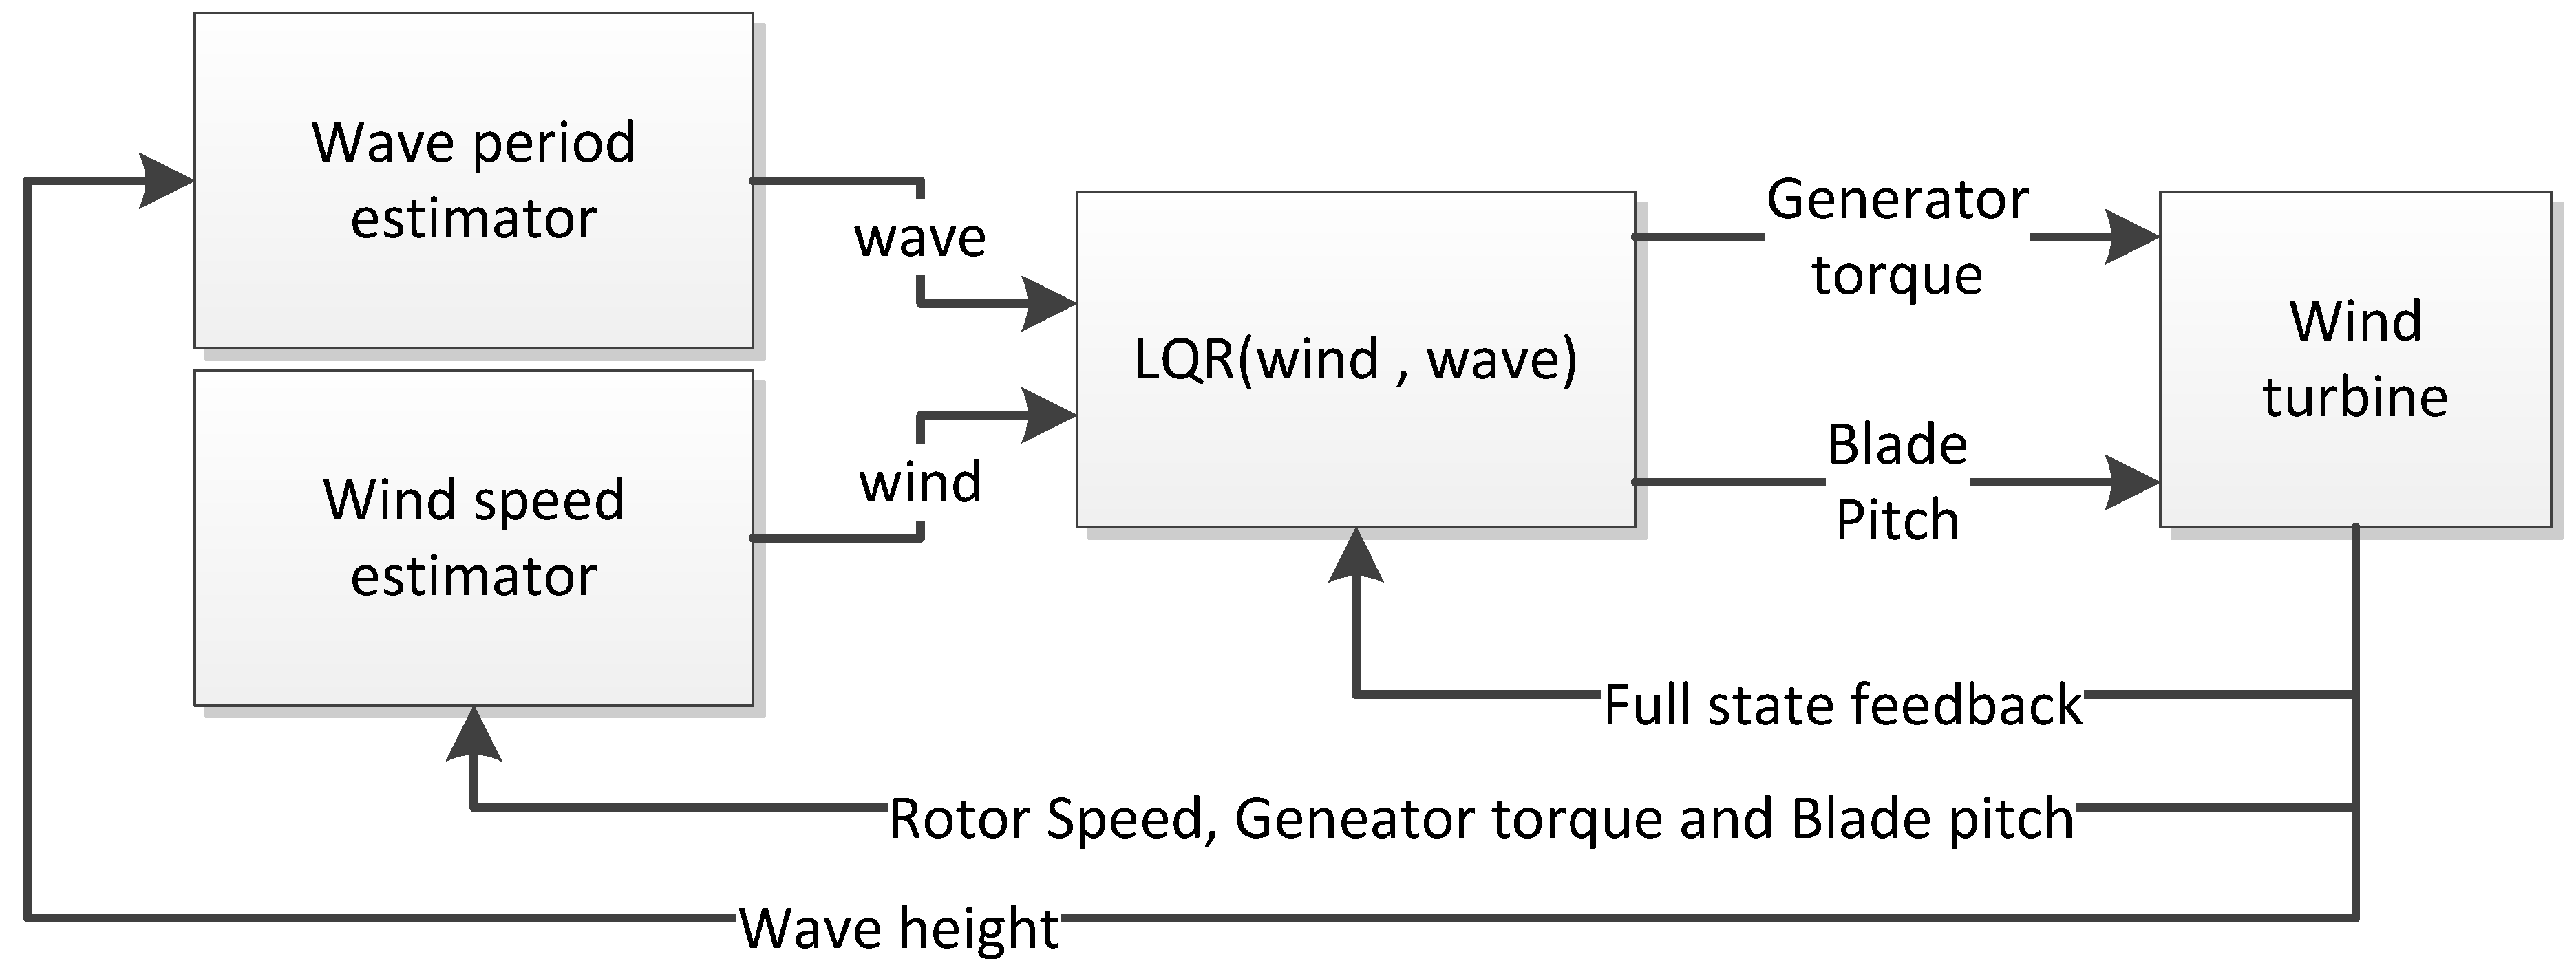
The proposed control strategy is shown in Figure 7, comprising a gain-scheduled LQR controller combined with wind speed and wave period estimators. Full-state feedback is assumed, since the focus of this paper concerns damping, based on estimates of wind speed and wave frequency.
Figure 7.
Overview of control strategy.

The LQR controller is a linear controller, which requires a linear model of the system, and several controllers are, hence, for various operating points of wind speeds and wave frequencies. This is achieved using the control law, , where , and represent the operating points as functions of the mean wind speed. The controller, , is a gain-scheduled LQR controller, which uses the slow varying mean wind speed and wave frequency as scheduling variables.
Based on the control model, the controller is designed offline and implemented as a lookup table for wind speed above the rated wind speed with an interval of 0.5 m/s and wave frequencies of 0 rad/s to 5 rad/s at an interval of 0.1 rad/s. When running online, at each time step, the controller interpolates the operating point and the controller gain.
2.11. Wave Period Estimator
To determine the hydrodynamic contribution, the wave frequency is required. The wave period of a regular wave is straightforward to estimate. However, irregular waves are more difficult to handle. In this paper, a simple auto-regressive algorithm is implemented to estimate a model of the waves based on current wave height. The desired wave frequency is, thus, derived for the model as the natural frequency. The wave height is modeled as , where is a second order system; is the wave height and is white noise. The estimated wave height is defined by a second order model as , where θ is a vector of the parameters of the estimation model, . The estimation error, , is minimized using a least squares method by updating the model properties in θ. The wave frequency is determined by the natural frequency of the system, .
2.12. Wind Speed Estimator
The wind speed can be estimated based on measurements of the rotor velocity, blade pitch angle and the generator torque. In this study, an extended Kalman filter (EKF) is used to estimate the wind speed, as suggested in [20].
The drivetrain is modeled as a first order system assuming a stiff drive train and neglecting losses:
where I is the inertia of the drivetrain; is the rotor speed and N is the gear ratio. The wind is modeled as a second order system:
where and are the wind turbulence and mean, respectively; is a wind speed dynamic parameter related to the turbulence length scale and and are Gaussian white noise.
2.13. The Linear Quadratic Regulator
In order to apply linear quadratic control methods, the model is transformed from a system of second order differential equations into a system of first order differential equations:
where ; and F is a reformulation of ; such that , where and .
A controller is designed that minimizes the performance function: . The controller weighting matrices, Q and R, were designed based on an initial guess of proper state weighting using Bryson’s rule, followed by an iterative trial and error process. Constant Q and R were used at all wind speeds above rated.
Using Bryson’s rule, the LQR input weighting matrix, R, is handled by allowing the blade pitch angle to vary 60 degrees. A constant torque approach is chosen for generator torque.
The LQR state weighting matrix, Q, is defined in such a way that the rotor angle, ψ, is limited to vary only 20 rad. The rotor angle can be interpreted as the integral action of the rotor speed, which can be used to reduce oscillations in mean power. In wind turbine control systems, the integral action of the rotor speed is often an interesting signal. By modeling the drivetrain as a second order system, the integral action is conveniently represented as a state.
Using Bryson’s rule, the platform rotation is punished to vary only 1 degrees/s for both platform pitch and roll in the weighting matrix.
Two LQR controllers are designed to demonstrate the advantage of the LQR controller. One controller, LQR1, is a controller designed for similar performance as the detuned baseline controller, OC3-Hywind [14], by punishing the blade pitch rate to vary only five degrees/s. The bandwidth of the OC3-Hywind controller is reduced compared to conventional turbine control to avoid instability, as discussed in the Introduction. Another controller, LQR2, is designed for a higher level of pitch activity by punishing the blade pitch rate, , to vary only eight degrees/s. This reflects the bandwidth of conventional wind turbine controllers. In contrast to the OC3-Hywind baseline controller, this is possible with a more advanced control strategy, as presented in this paper, without stability problems. Increased bandwidth of the controller causes increased blade pitch actuation, which will reduced the actuator lifetime. However, as an example, the Hywind Demo is a standard wind turbine. In the context of actuator lifetime, the actuator is designed for conventional controller bandwidth and not detuned bandwidth. Thus, we suggest to increase the bandwidth to eight degrees/s using LQR2.
2.14. Software
The controllers are simulated on a 5 MW wind turbine mounted on a ballast stabilized buoy to resemble an upscaled version of the 2.3 MW Hywind Demo wind turbine. The floating wind turbine has a flexible tower and drivetrain, a rotor radius of 63 m and a height of 90 m. The platform has a draft of 120 m, with six degrees of freedom in translation and rotation. The platform is constrained by three mooring lines. The wind turbine is a three bladed upwind 5 MW OC3-Hywind reference wind turbine specified by the National Renewable Energy Laboratory (NREL)in [13] and implemented in the wind turbine high fidelity aeroelastic simulation tool, FAST, which is well recognized in the OC3 code benchmark [21]. The simulations were performed in Simulink Matlab v7.9.0 (R2009b) linked with FAST v7.00.00a-bjj and AeroDyn v13.00.00a-bjj compiled for the OC3-Hywind running Windows 7, 32 bit.
3. Environmental Setup
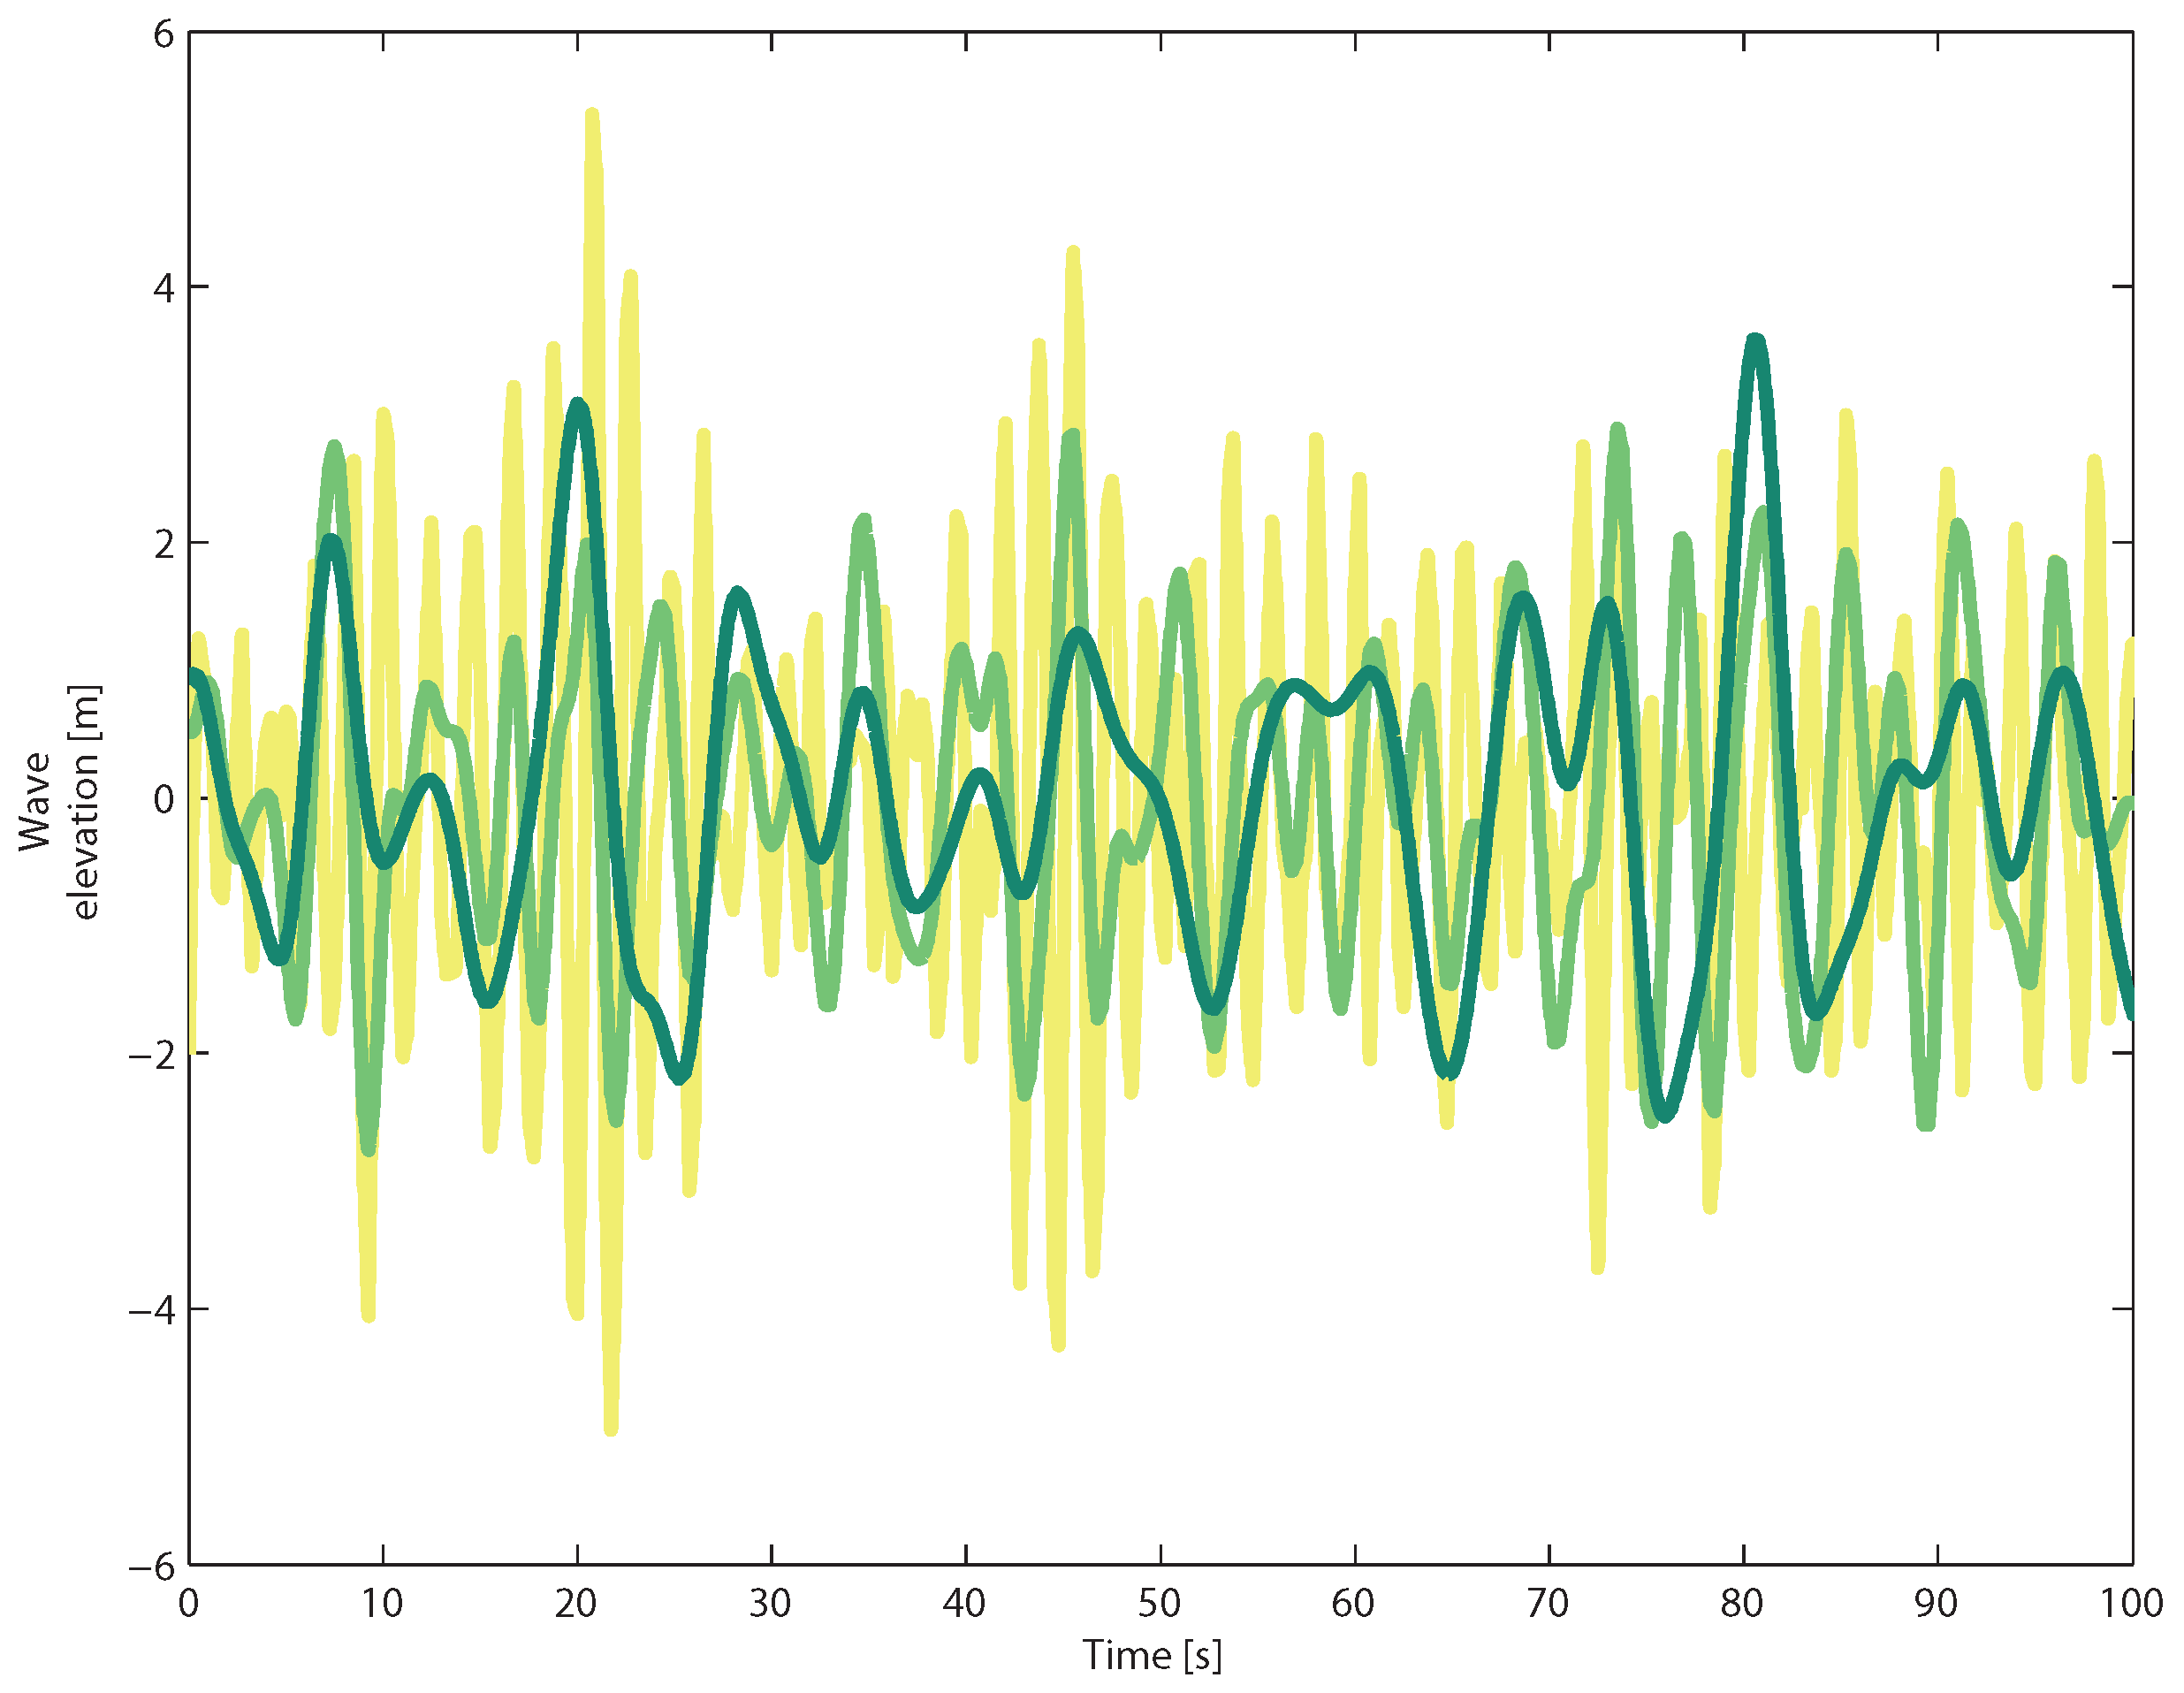
The wind profile used in the simulations has a mean wind speed of 18.0 m/s with a turbulence intensity of 14.9%. The significant wave height is 6.0 m, simulated with a peak wave period of 2, 5 and 10 s. Figure 8 shows three difference sequences of wave elevations. The simulation does not include the ocean current. The system is simulated at 80 Hz, while the control system operates at 10 Hz.
Figure 8.
Wave height over time where yellow, light green and dark green represent peak wave periods of 2, 5 and 10 s, respectively. The figure shows 100 s of the 600 s sequences.
Figure 8.
Wave height over time where yellow, light green and dark green represent peak wave periods of 2, 5 and 10 s, respectively. The figure shows 100 s of the 600 s sequences.

4. Results
The performance of the suggested controllers are compared to the performance of the OC3-Hywind baseline controller [14]. The responses of the controllers are compared in a case, where the waves are aligned with the wind, and in another case, where the waves are perpendicular to the wind.
In Figure 9, the performance of the baseline controller and the LQR1 controller are compared with aligned wind-wave forces and with a peak wave period of 10 s.
Figure 9.
Aligned wind-wave forces with a peak wave period of 10 s: statistical analysis of relative controller performance with respect to the mean and standard deviation (std).
Figure 9.
Aligned wind-wave forces with a peak wave period of 10 s: statistical analysis of relative controller performance with respect to the mean and standard deviation (std).
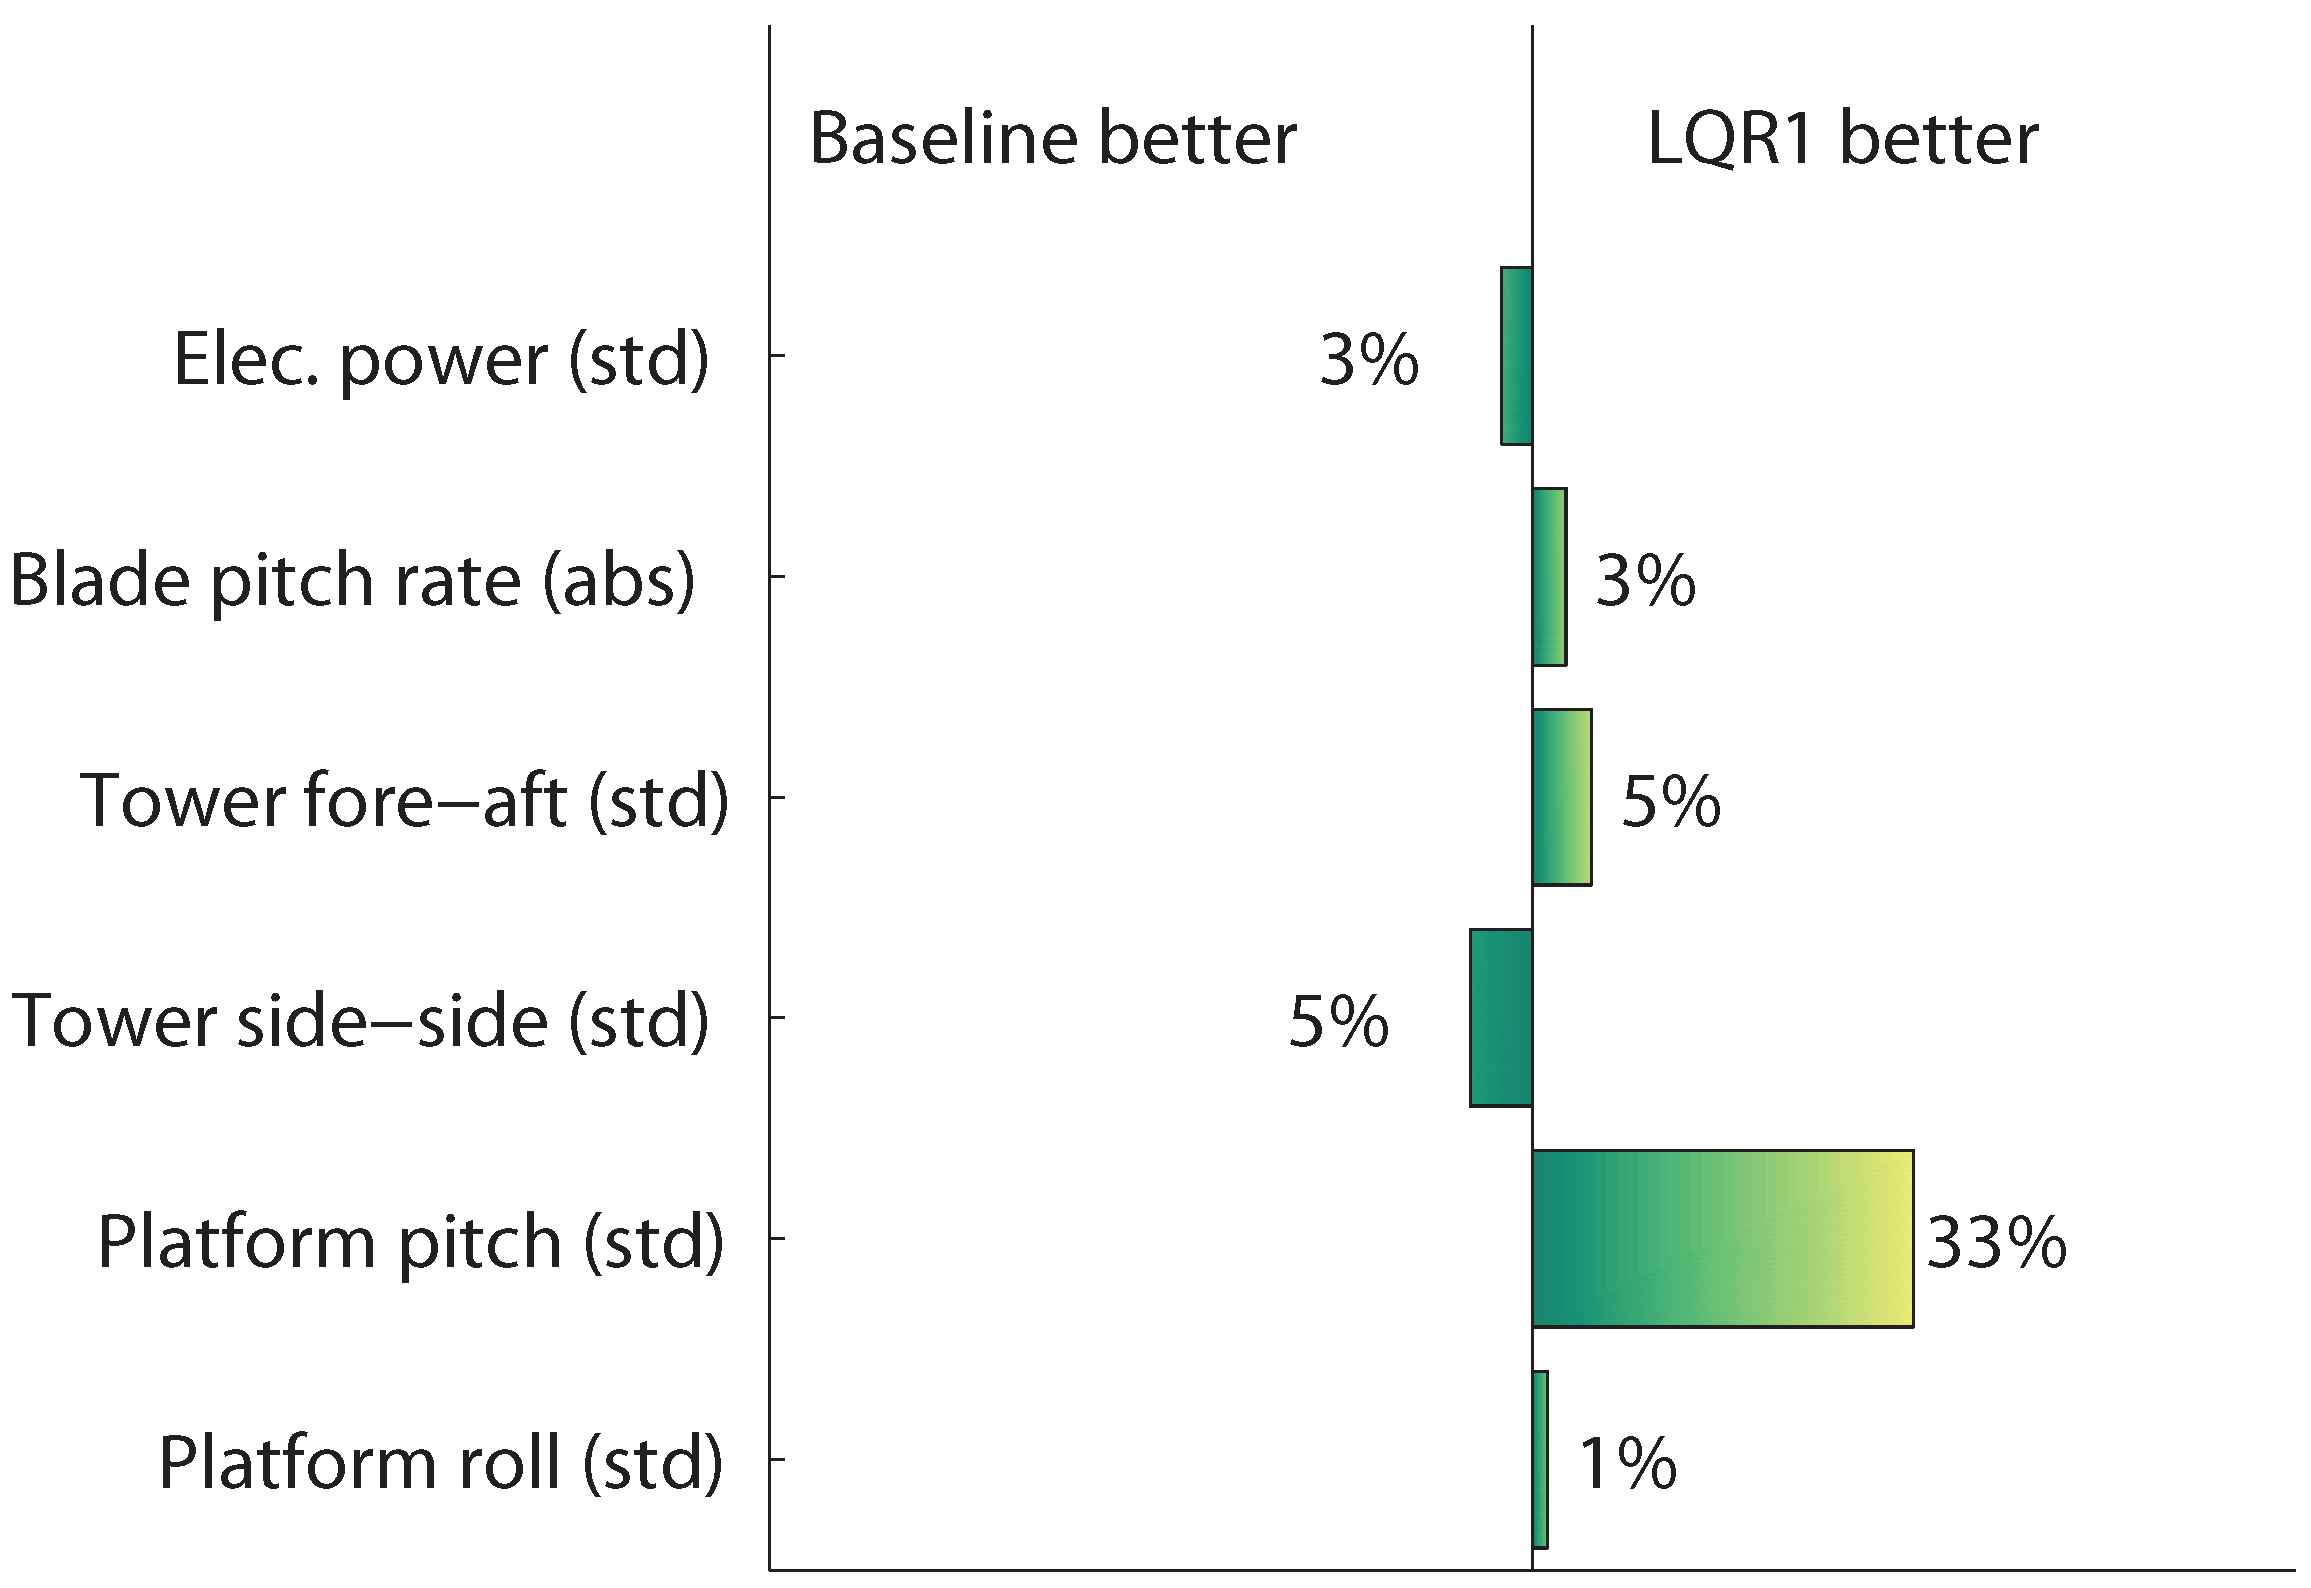
Figure 10, Figure 11 and Figure 12 show the results of aligned wind and waves with a peak wave frequency of 10 s. Figure 13, Figure 14 and Figure 15 make the same comparison for the case of perpendicular wind and waves.
Figure 10.
Aligned wind-wave forces with a peak wave period of 10 s: blade pitch angle. The green is the LQR2 controller, while the black is the baseline.
Figure 10.
Aligned wind-wave forces with a peak wave period of 10 s: blade pitch angle. The green is the LQR2 controller, while the black is the baseline.
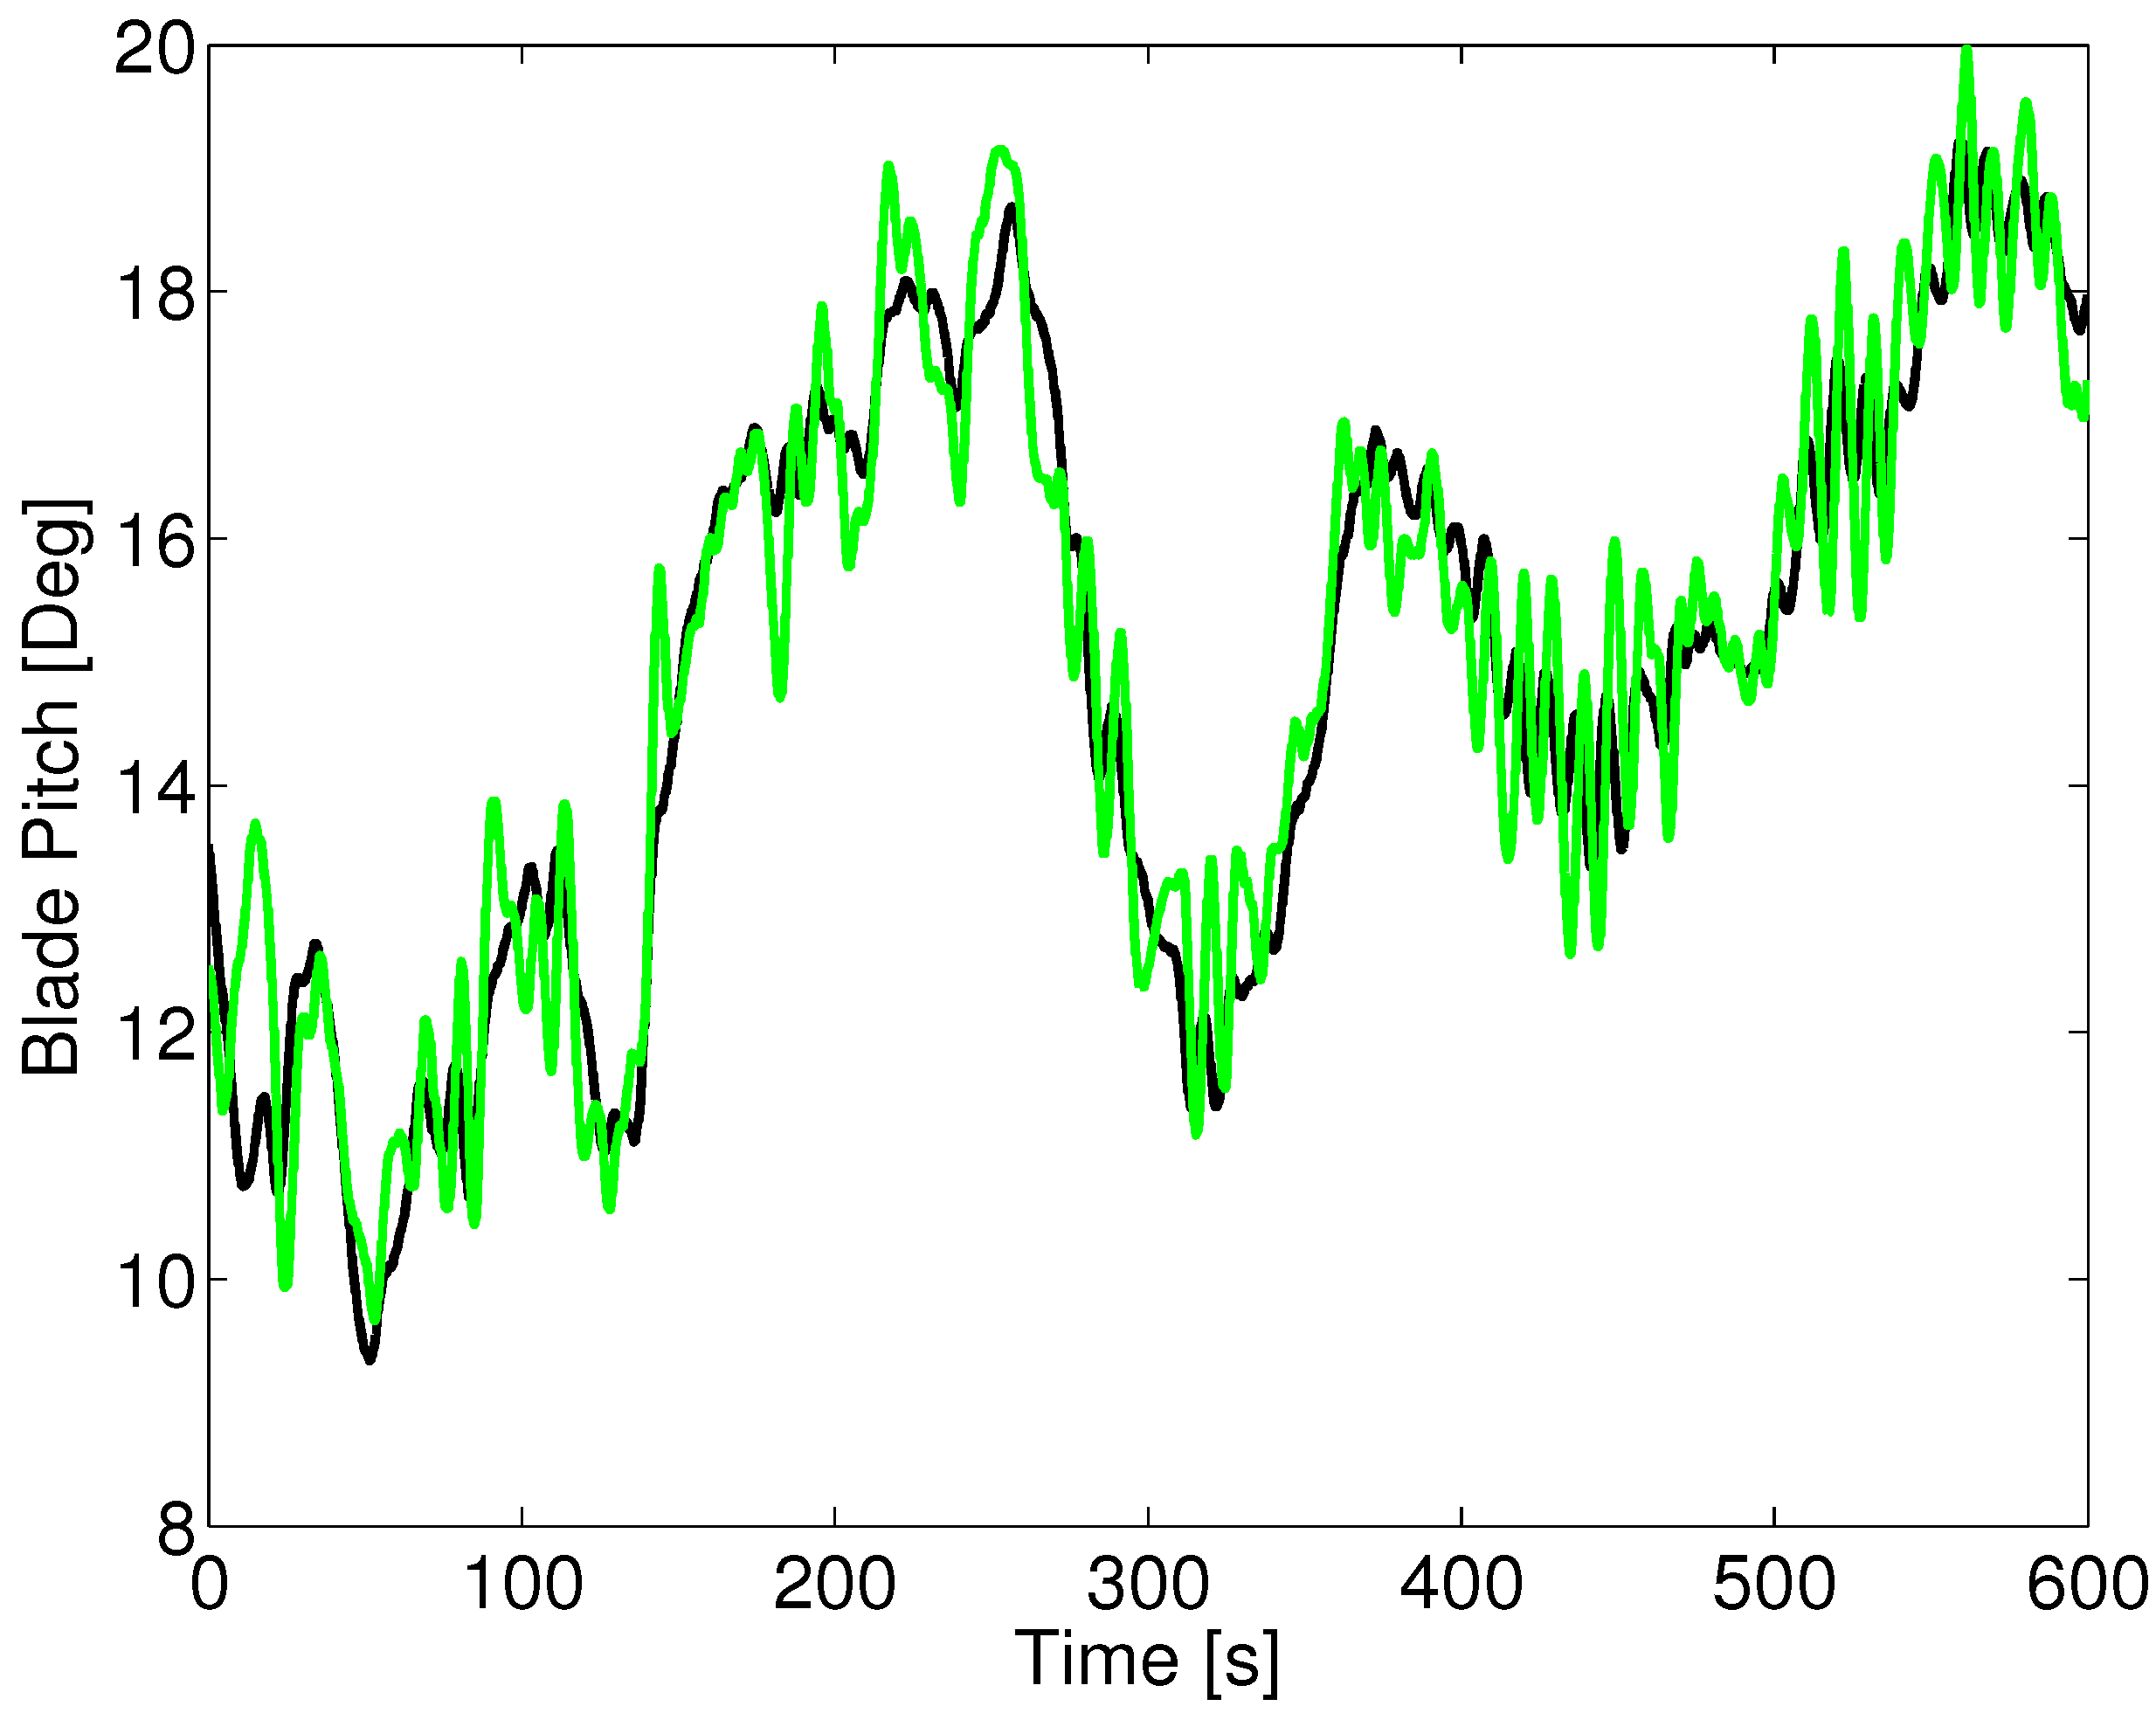
Figure 11.
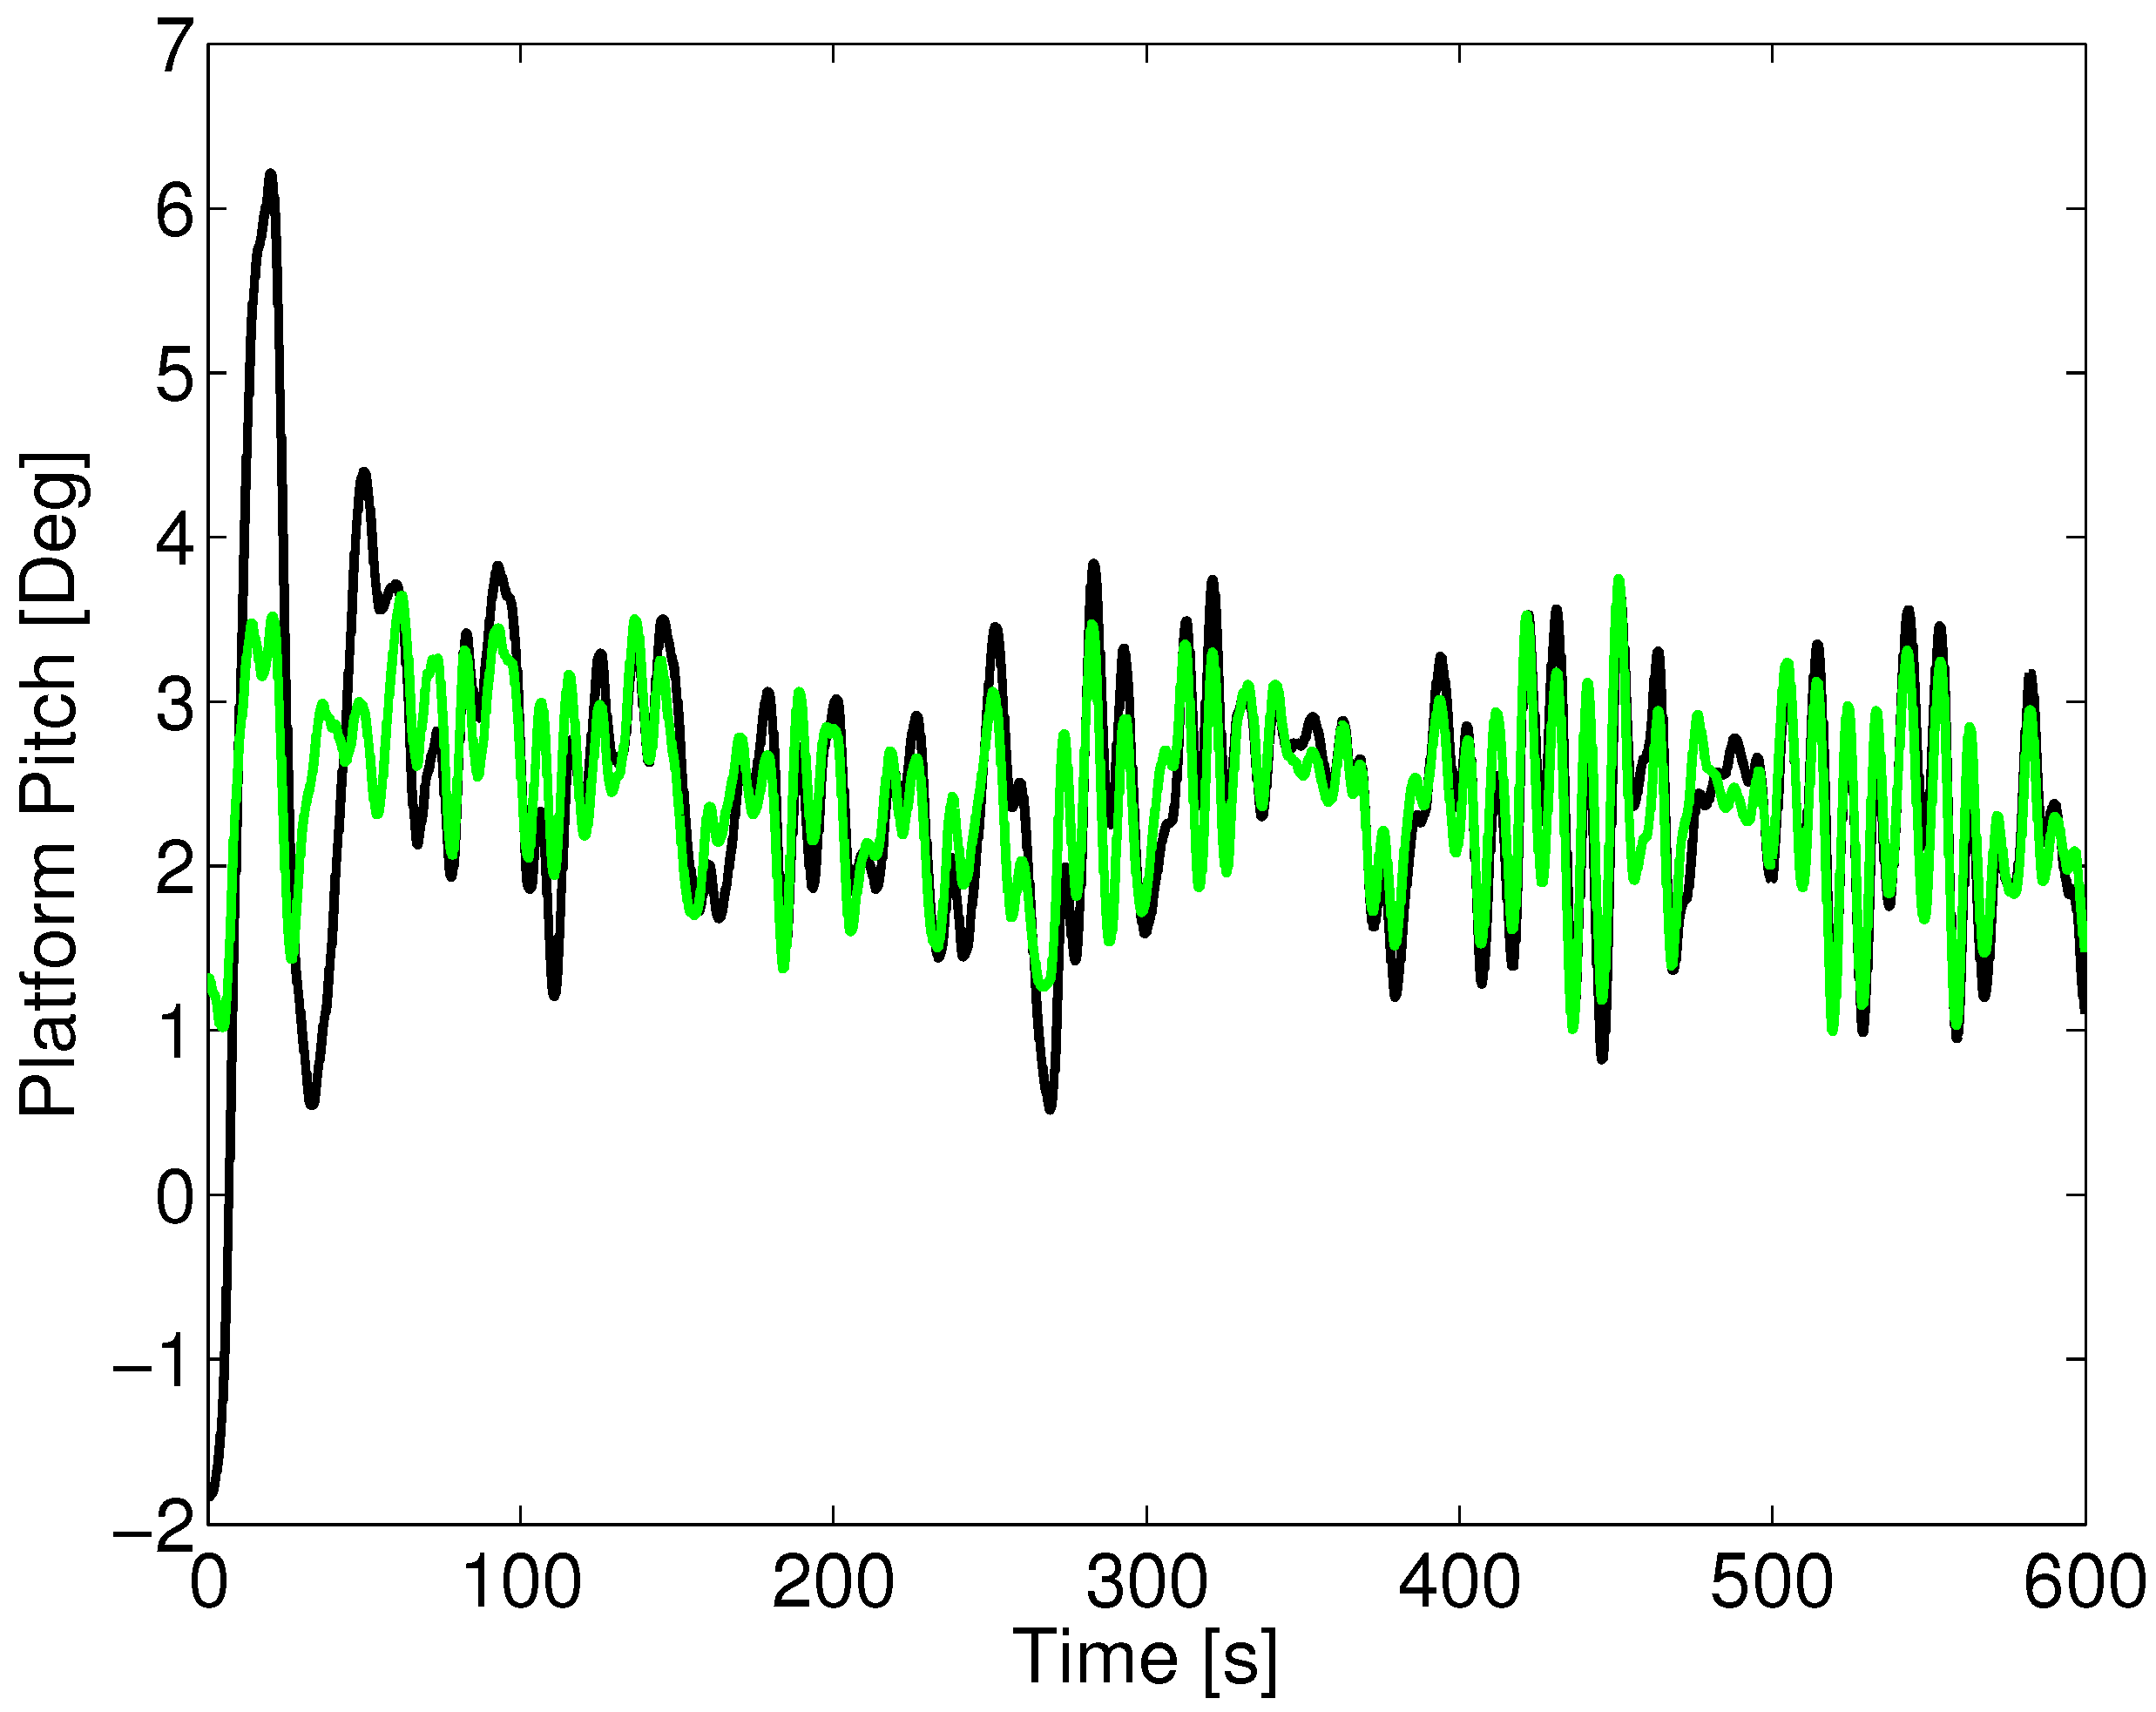
Aligned wind-wave forces with a peak wave period of 10 s: platform pitch. The green is the LQR2 controller, while the black is the baseline.
Figure 11.
Aligned wind-wave forces with a peak wave period of 10 s: platform pitch. The green is the LQR2 controller, while the black is the baseline.

Figure 12.
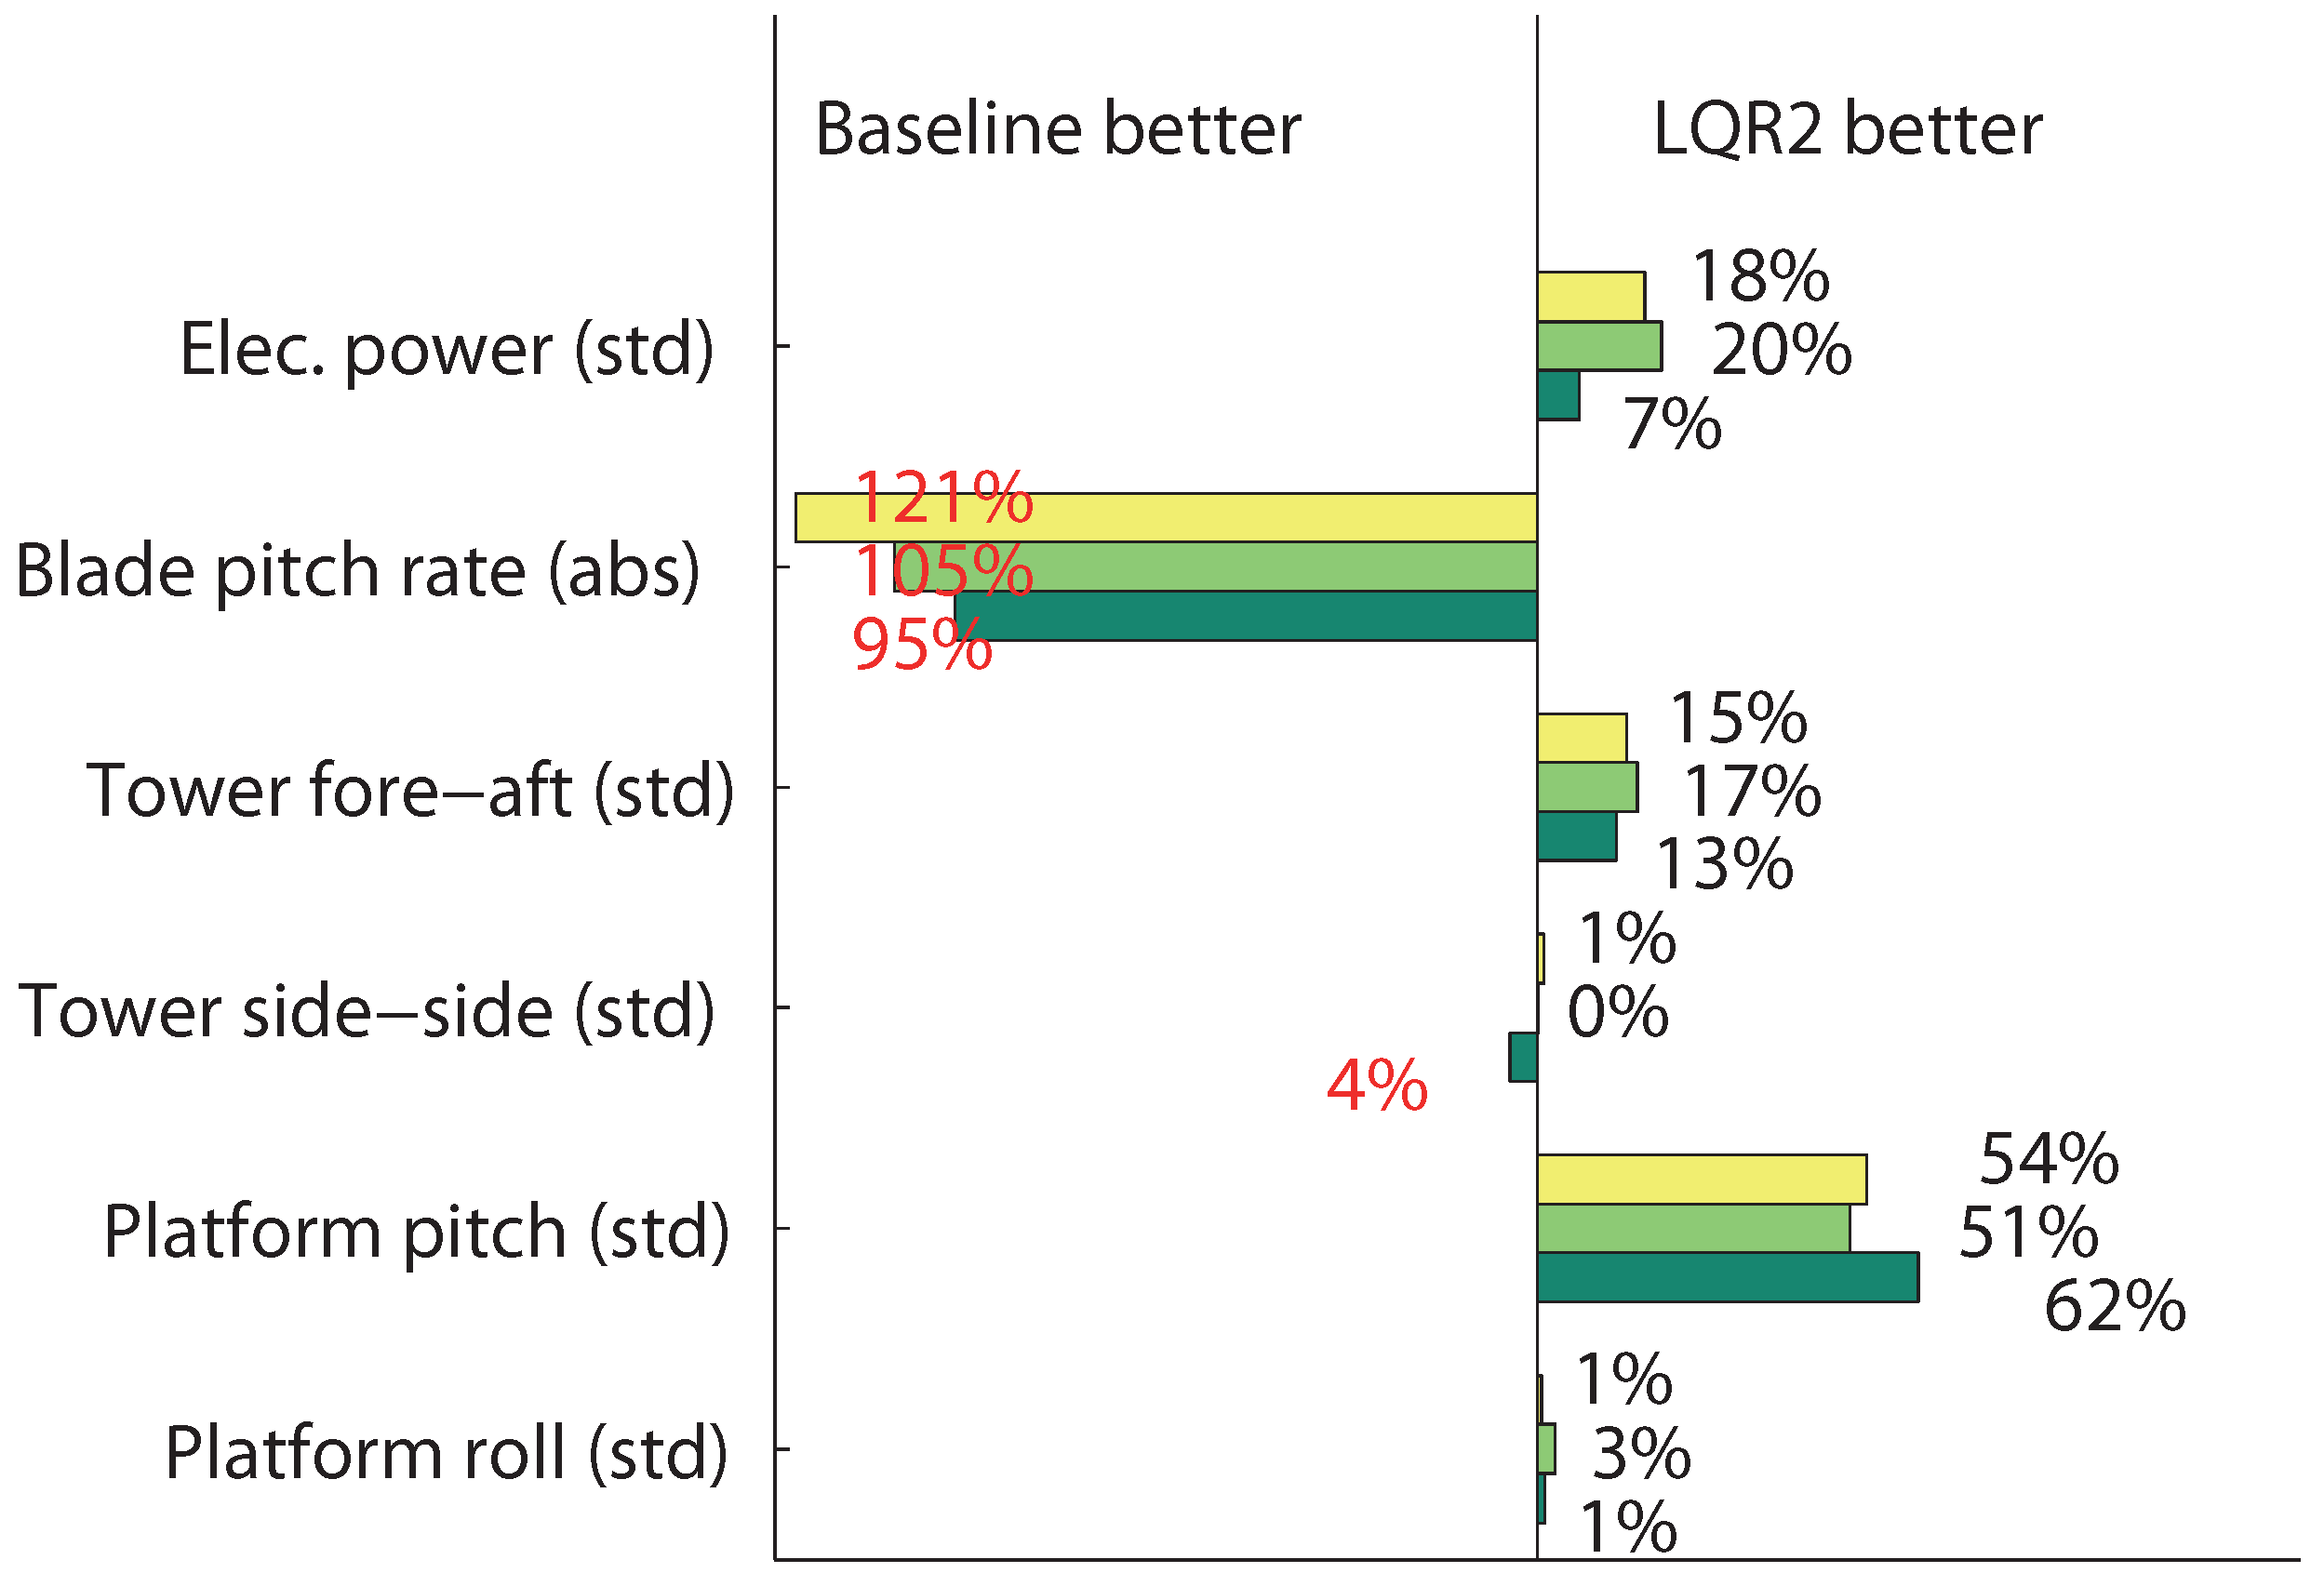
Aligned wind-wave forces: statistical analysis of relative controller performance, where yellow, light green and dark green represent peak wave periods of 2, 5 and 10 s, respectively.
Figure 12.
Aligned wind-wave forces: statistical analysis of relative controller performance, where yellow, light green and dark green represent peak wave periods of 2, 5 and 10 s, respectively.
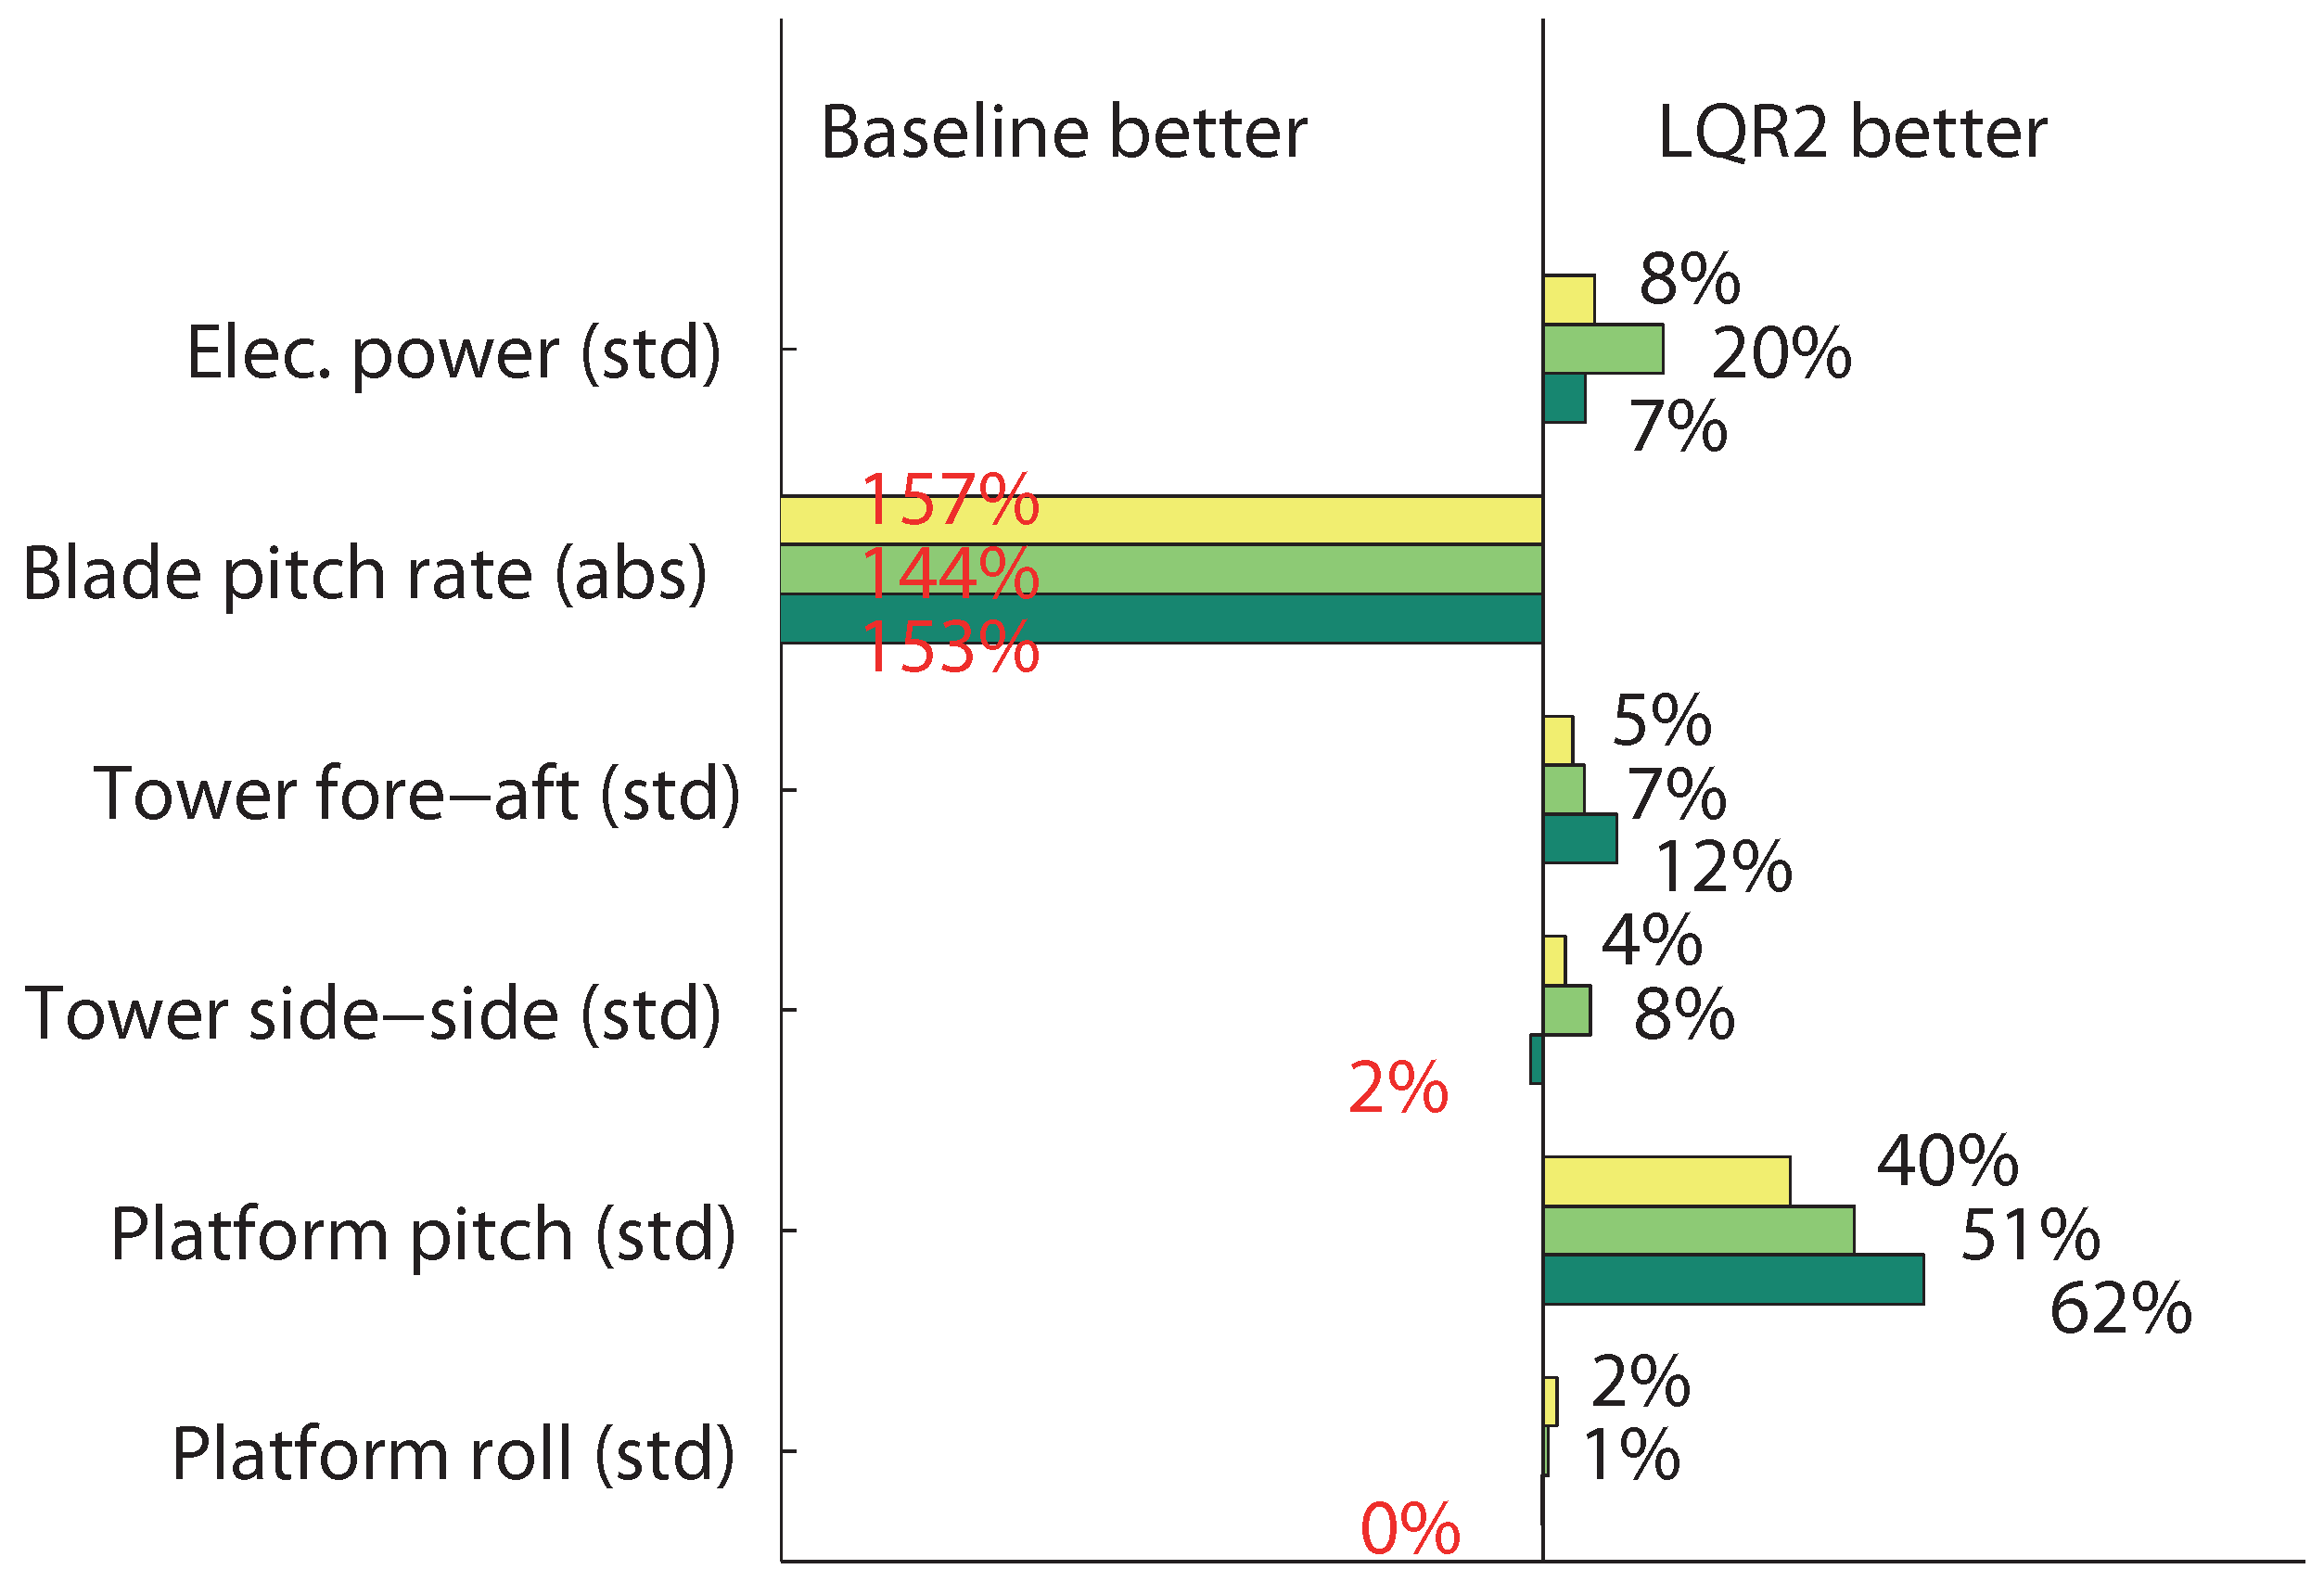
Figure 13.
Perpendicular wind-wave forces with a peak wave period of 10 s: blade pitch angle. The blue is the LQR2 controller, while the black is the baseline.
Figure 13.
Perpendicular wind-wave forces with a peak wave period of 10 s: blade pitch angle. The blue is the LQR2 controller, while the black is the baseline.
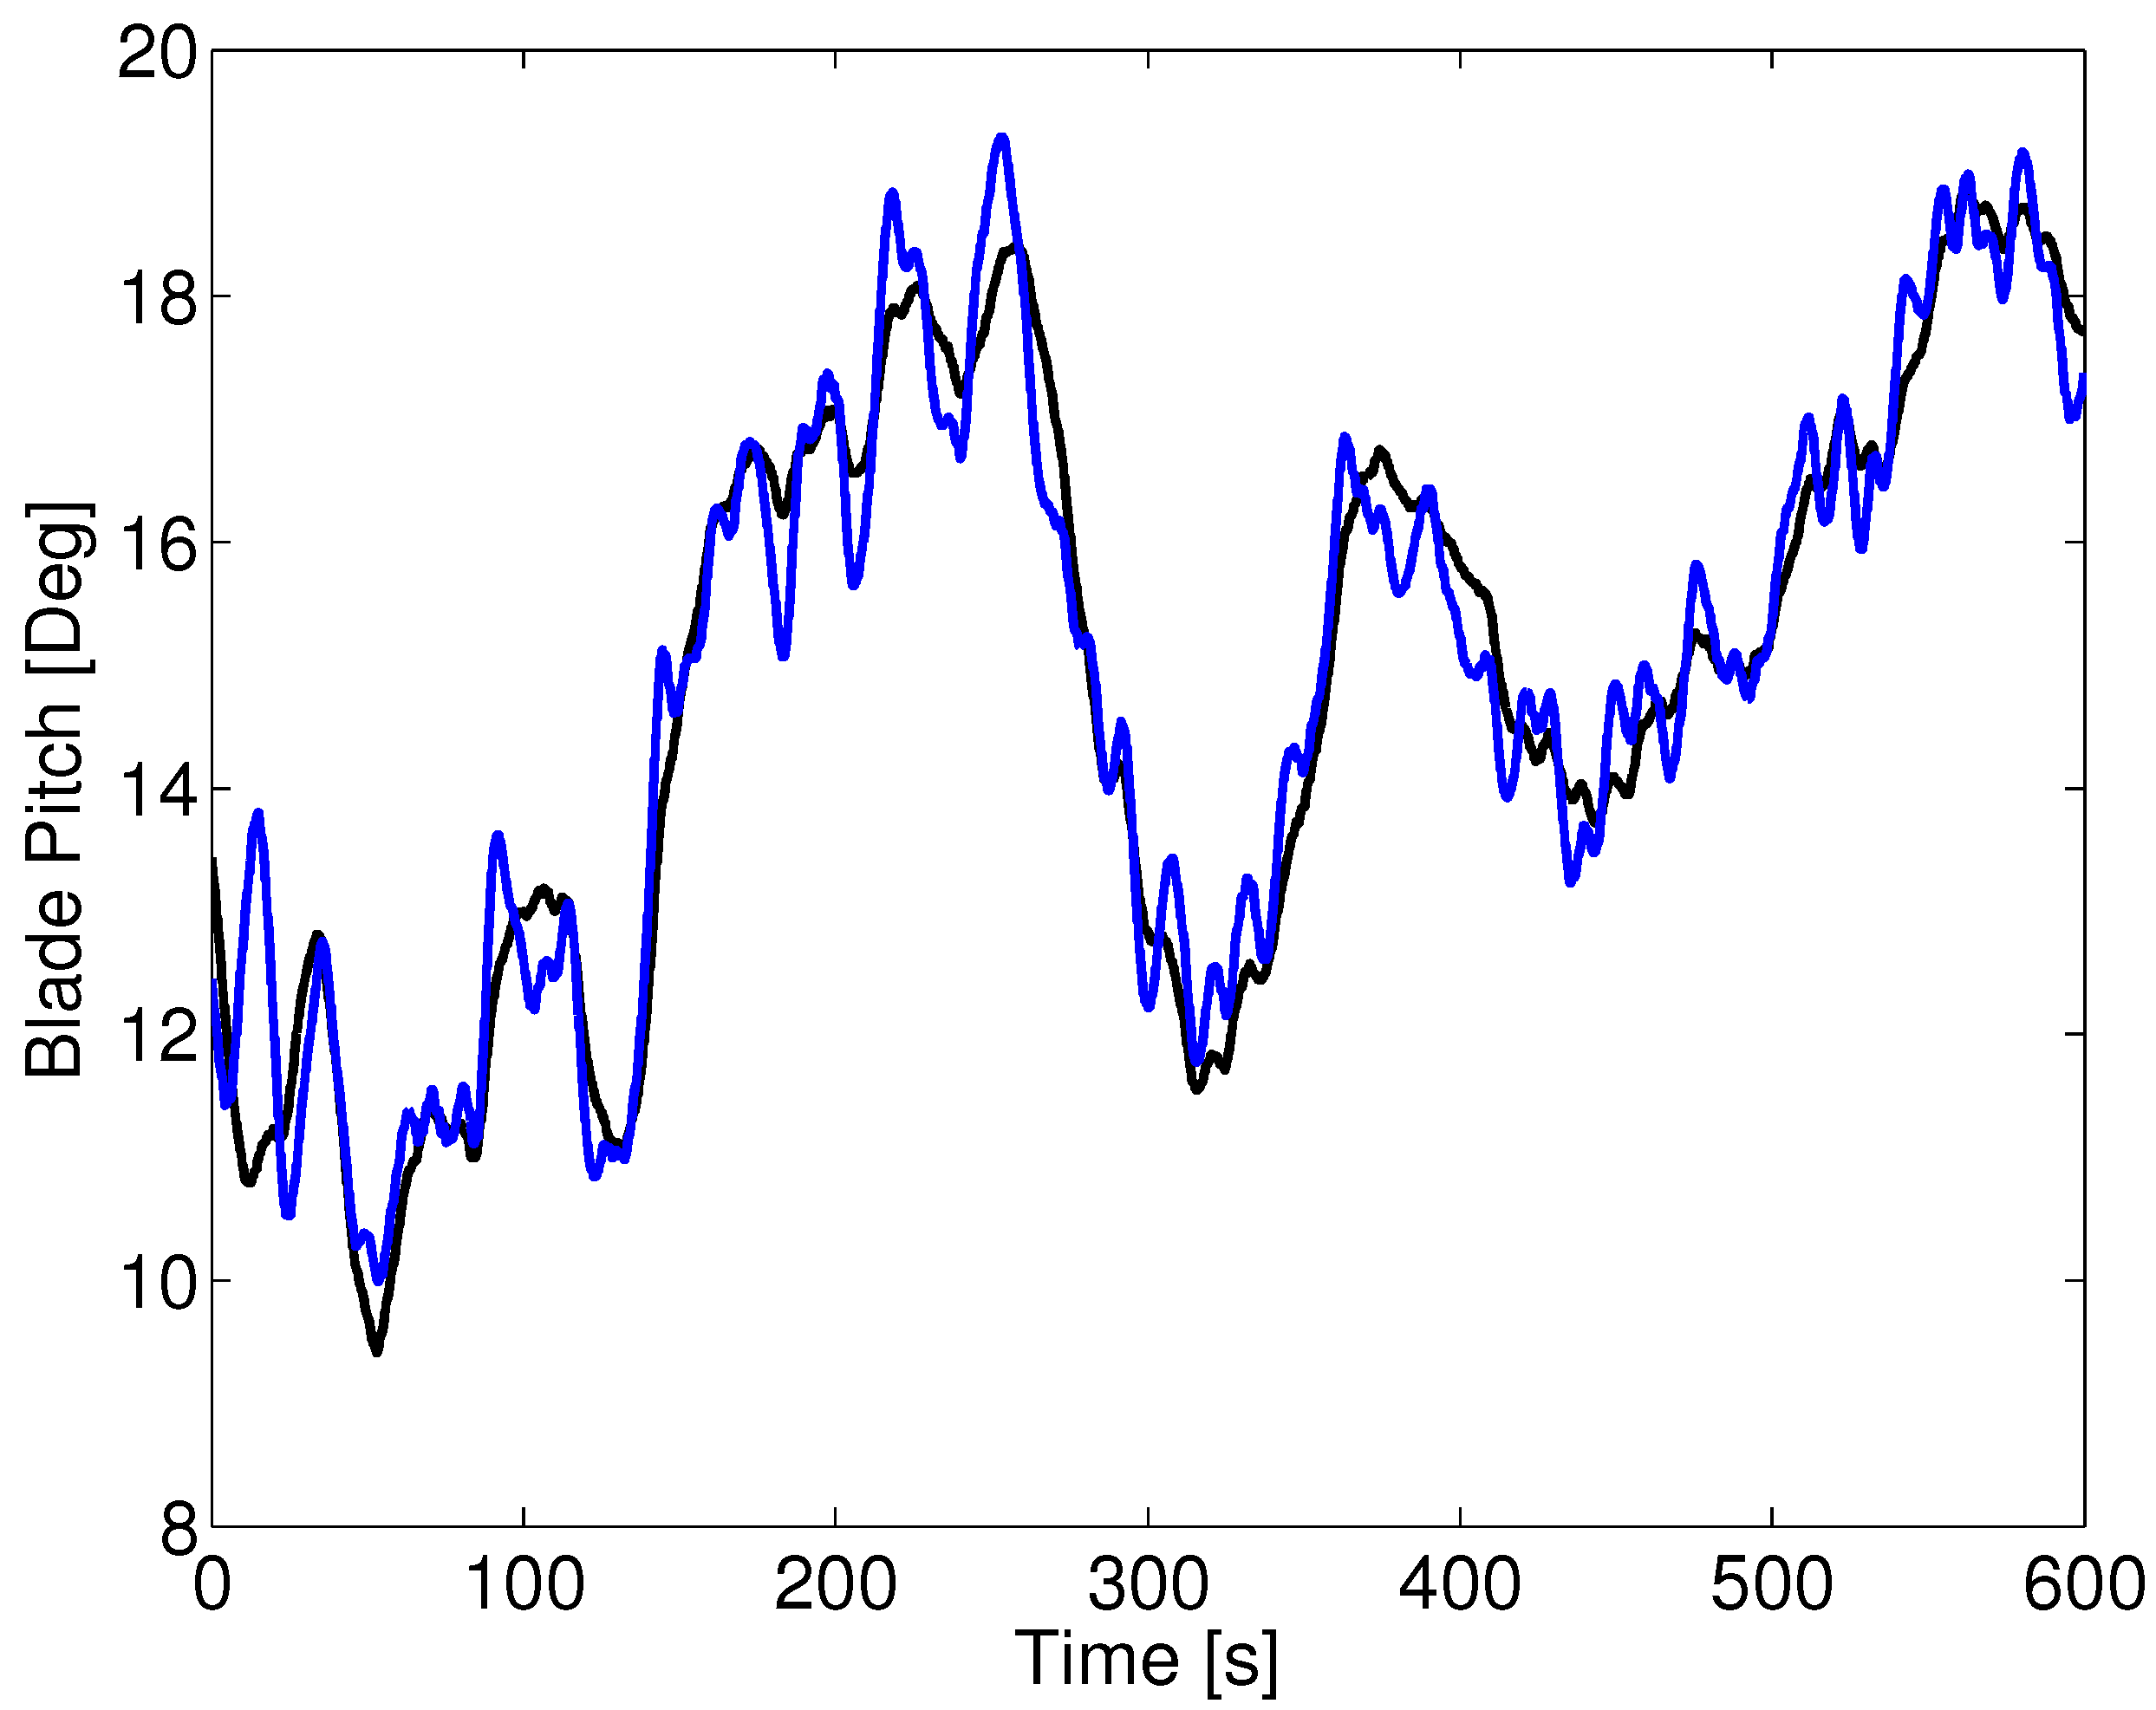
Figure 14.
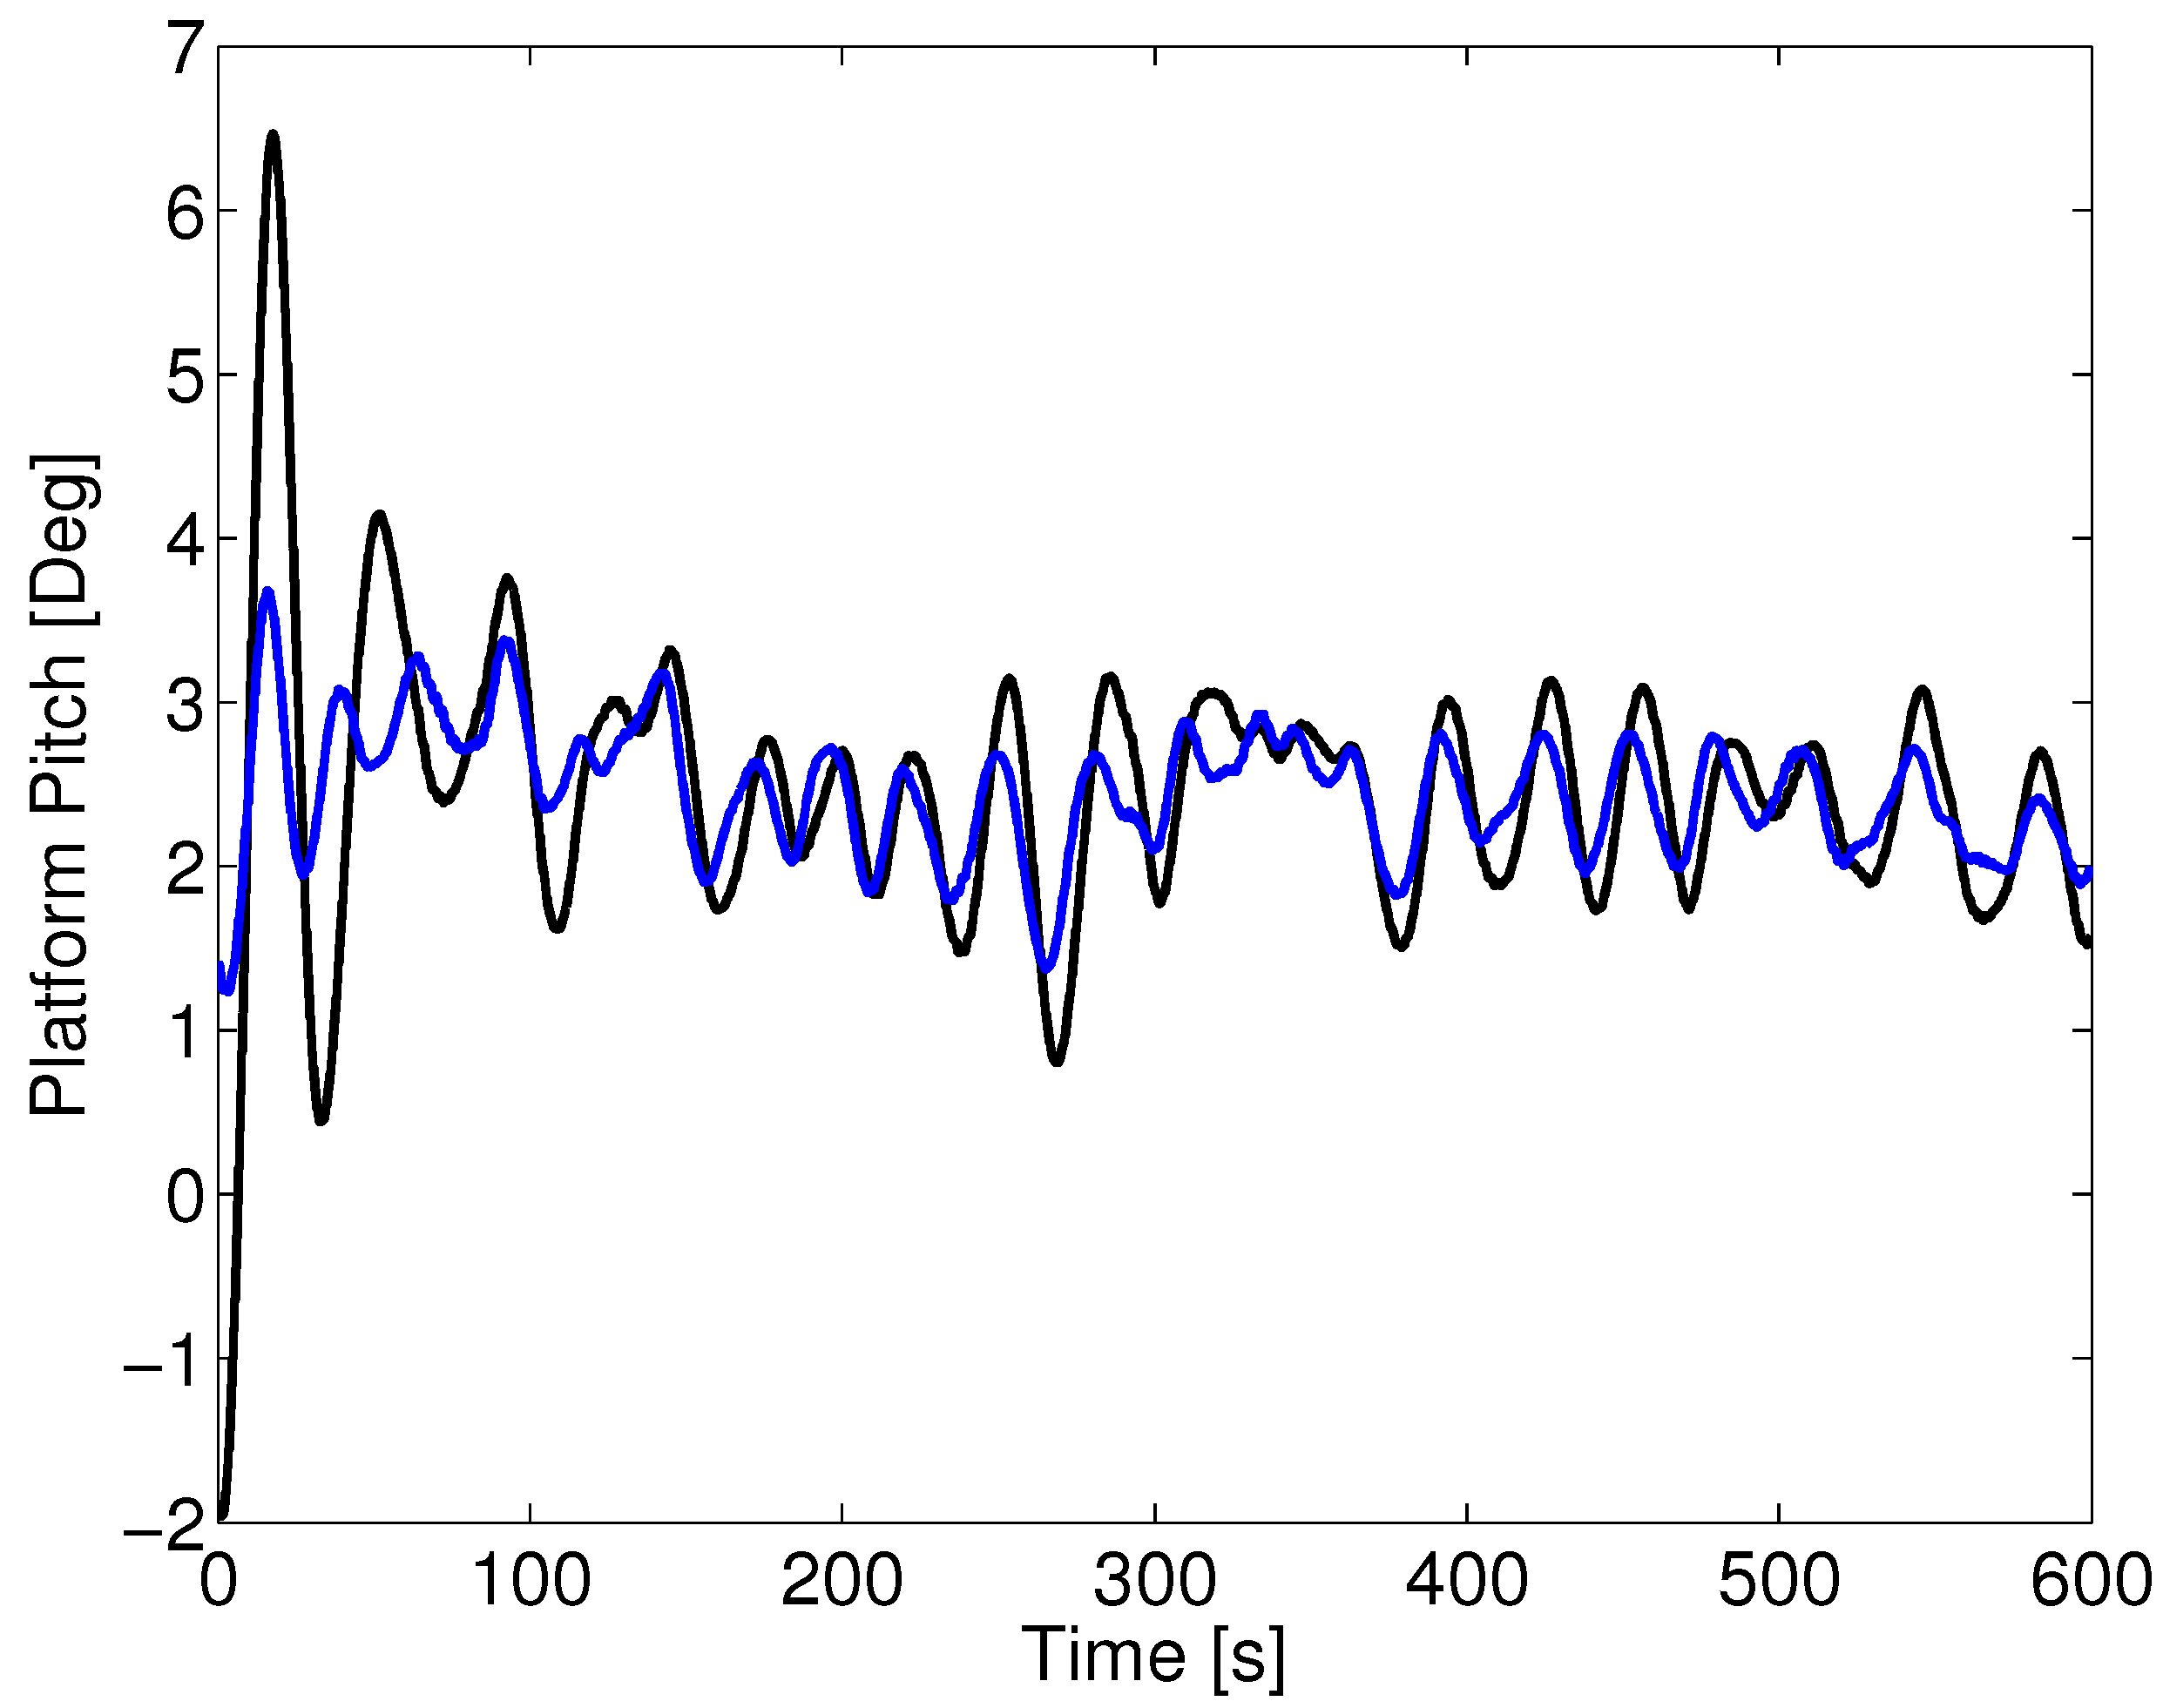
Perpendicular wind-wave forces with a peak wave period of 10 s: platform pitch. The blue is the LQR2 controller, while the black is the baseline.
Figure 14.
Perpendicular wind-wave forces with a peak wave period of 10 s: platform pitch. The blue is the LQR2 controller, while the black is the baseline.

Figure 15.
Perpendicular wind-wave forces: statistical analysis of relative controller performance, where yellow, light green and dark green represent peak wave periods of 2, 5 and 10 s, respectively.
Figure 15.
Perpendicular wind-wave forces: statistical analysis of relative controller performance, where yellow, light green and dark green represent peak wave periods of 2, 5 and 10 s, respectively.

The performances are compared in terms of blade pitch angle in Figure 10 and Figure 13 and platform pitch in Figure 11 and Figure 14.
An overall performance analysis is presented in Figure 12 and Figure 15, where, also, electrical power, tower deflections and platform motions are compared. These key performance indicators are compared in terms of absolute values (abs) and standard deviations (std). The absolute values are defined by , which describes the distance traveled by the blade pitch.
Initially, the platform pitch angle is set to zero degrees, which is seen in Figure 14, and the platform is then pushed in the aft direction by the wind. This is a translational effect and has not been excluded in the performance assessment.
5. Discussion
In Figure 9, a comparison is presented between the detuned baseline controller and the LQR1 controller. Except from platform pitch, the comparison demonstrates similar behaviors between the two controllers, with insignificant fluctuations. The purpose of this comparison is to demonstrate that the presented LQR control strategy can perform just as the detuned baseline controller. However, the bandwidth of these controller implementations is very slow and does not comply with conventional wind turbine standards.
The performance of the detuned baseline controller also demonstrates the limit of this controller. If the bandwidth of the detuned baseline controller was increased, the system would become unstable. However, using a model-based control strategy, it is possible to operate at a conventional bandwidth, while maintaining stability of the system.
In Figure 10, Figure 11, Figure 12, Figure 13, Figure 14 and Figure 15, a comparison is presented between the detuned baseline controller and the LQR2 controller. The performance of the two controllers are compared at three different wave sequences with turbulent wind. As the buoy has the same dynamic properties in all direction, we demonstrate the two worst case scenarios: aligned forces and perpendicular forces.
The results show that it is possible to significantly improve the platform pitch oscillations by approximately 50%, when forces are both aligned and perpendicular. The cost is an increase in blade pitch activity by approximately 150%, when forces are aligned and approximately, 100%, when forces are perpendicular.
Improvements in electrical power (7%–20%) and tower fore-aft deflection (5%–17%) are observed, when forces are both aligned and perpendicular.
Insignificant improvement are observed in platform roll and tower side-side deflection. As both control strategies uses a constant torque approach, there is only indirect actuation in both platform roll and tower side-side deflection. In the perspectives of using the generator torque for damping oscillation on the platform, the torque induced by the generator is less than 10% of the perpendicular torque induced by the rotor thrust force. Furthermore, using generator torque to damp platform roll and tower side-side dynamics will cause power oscillations and, thus, will change focus and require further research.
Comparing the results between aligned and perpendicular forces, it should be noted that misaligned forces in the range of degrees occur at much higher probability than perpendicular forces. Thus, the results on aligned forces should be weighted more importantly.
6. Conclusions
In the context of model-based control, a new model of a floating wind turbine is presented that captures the effect of the aerodynamics, hydrodynamics, structural dynamics and actuator dynamics. To address the disturbance and misalignment of wind and waves, a control model is presented that requires estimates of the wind speed and the wave frequency, which offers an improved model for model-based control.
A control strategy is taken based on a gain-scheduled LQR controller. The result is a wind and wave control strategy capable of actively damping structural oscillations, while fulfilling the objective of maximizing power.
Using the same bandwidth as a conventional wind turbine controller, the suggested model-based control strategy shows convincing performance in reducing platform pitch oscillations, while improving the electrical power and tower fore-aft deflections.
Misaligned wind and waves were also addressed. Worst-case wind and waves forces have successfully been damped. While oscillations in platform pitch and tower fore-aft were actively reduced, oscillations in platform roll and tower side-side were only damped passively, due to lack of sideways controllability using the suggested strategy.
The complexity and the limitations of the proposed control strategy present an obstacle to commercial use. To get one step further towards commercial use requires an effort with a commercial partner that by analysis and reflection on the results and by finding less complex ways to capture central mechanisms.
Acknowledgment
This work has been funded by the Norwegian Centre for Offshore Wind Energy (NORCOWE) under grant 193821/S60 from the Research Council of Norway (RCN). NORCOWE is a consortium with partners from industry and science, hosted by Christian Michelsen Research.
Conflict of Interest
The authors declare no conflict of interest.
References
- Leithead, W.E.; Dominguez, S. Coordinated Control Design for Wind Turbine Control Systems. In Proceedings of European Wind Energy Conference and Exhibition, Athens, Greece, 27 February–2 March 2006.
- Sønderby, I.; Hansen, M.H. Open-loop frequency response analysis of a wind turbine using a high-order linear aeroelastic model. Wind Energy 2013. [Google Scholar] [CrossRef]
- Fischer, B. Reducing Rotor Speed Variations of Floating Wind Turbines by Compensation of Non-Minimum Phase Zeros. In Proceedings of European Wind Energy Conference and Exhibition, Copenhagen, Denmark, 16–19 April 2012.
- Skaare, B.; Hanson, T.D.; Nielsen, F.G. Importance of Control Strategies on Fatigue Life of Floating Wind Turbines. In Proceedings of 26th International Conference on Offshore Mechanics and Arctic Engineering, San Diego, CA, USA, 10–15 June 2007.
- Jonkman, J.M. Influence of Control on the Pitch Damping of a Floating Wind Turbine. In Proceedings of 2008 ASME Wind Energy Symposium, Reno, NV, USA, 7–10 January 2008.
- Burton, T.; Sharpe, D.; Jenkins, N.; Bossanyi, E. Wind Energy Handbook; Wiley: Chichester, UK, 2001. [Google Scholar]
- Namik, H.; Stol, K. Individual blade pitch control of floating offshore wind turbines. Wind Energy 2009, 13, 74–85. [Google Scholar] [CrossRef]
- Christiansen, S.; Knudsen, T.; Bak, T. Optimal Control of a Ballast-Stabilized Floating Wind Turbine. In Proceedings of IEEE Multi-Conference on Systems and Control, Denver, CO, USA, 26–30 September 2011.
- Namik, H.; Stol, K.; Jonkman, J. State-Space Control of Tower Motion for Deepwater Floating Offshore Wind Turbines. In Proceedings of 46th AIAA Aerospace Science Meeting and Exhibit, Reno, NV, USA, 07–10 January 2008.
- Namik, H.; Stol, K. Disturbance Accommodating Control of Floating Offshore Wind Turbines. In Proceedings of 47th AIAA Aerospace Sciences Meeting, Orlando, FL, USA, 5–8 January 2009.
- Namik, H.; Stol, K.; Jonkman, J. Controlling platform motions and reducing blade loads for floating wind turbines. Wind Eng. 2010, 33, 541–553. [Google Scholar]
- Jonkman, J. NWTC Design Codes; National Renewable Energy Laboratory: Golden, CO, USA, 2010.
- Jonkman, J.; Butterfield, S.; Musial, W.; Scott, G. Definition of a 5-MW Reference Wind Turbine for Offshore System Development; Technical Report NREL/TP-500-38060; National Renewable Energy Laboratory: Golden, CO, USA, 2007.
- Jonkman, J. Definition of the Floating System for Phase IV of OC3; Technical Report; National Renewable Energy Laboratory: Golden, CO, USA, 2010.
- Kristiansen, E.; Hjulstad, A.; Egeland, O. State-space representation of radiation forces in time-domain vessel models. Ocean Eng. 2005, 32, 2195–2216. [Google Scholar] [CrossRef]
- Wayman, E.; Sclavounos, P.; Butterfield, S.; Jonkman, J.; Musial, W. Coupled Dynamic Modeling of Floating Wind Turbine Systems. In Proceedings of Offshore Technology Conference, Houston, TX, USA, 1–4 May 2006.
- WAMIT—User Manual—The State of The Art in Wave Interaction Analysis; WAMIT, Inc.: Chestnut Hill, MA, USA, 2006.
- Burcharth, H.F. Current and Wave Power on Rigid Bodies; Technical Report; Department of Civil Engineering, Aalborg University: Aalborg, Denmark, 2002. [Google Scholar]
- Andersen, T.L.; Frigaard, P. Lecture Notes for the Course in Water Wave Mechanics; Technical Report; Department of Civil Engineering, Aalborg University: Aalborg, Denmark, 2011. [Google Scholar]
- Knudsen, T.; Bak, T.; Soltani, M. Prediction models for wind speed at turbine locations in a wind farm. Wind Energy 2011, 14, 877–894. [Google Scholar] [CrossRef]
- Passon, P.; Kuhn, M.; Butterfield, S.; Jonkman, J.; Camp, T.; Larsen, T.J. OC3—Benchmark Exercise of Aero-Elastic Offshore Wind Turbine Codes. In Proceedings of The Science of Making Torque from Wind, Lyngby, Denmark, 28–31 August 2007.
© 2013 by the authors. Licensee MDPI, Basel, Switzerland. This article is an open access article distributed under the terms and conditions of the Creative Commons Attribution license ( http://creativecommons.org/licenses/by/3.0/).
Share and Cite
MDPI and ACS Style
Christiansen, S.; Bak, T.; Knudsen, T. Damping Wind and Wave Loads on a Floating Wind Turbine. Energies 2013, 6, 4097-4116. https://doi.org/10.3390/en6084097
AMA Style
Christiansen S, Bak T, Knudsen T. Damping Wind and Wave Loads on a Floating Wind Turbine. Energies. 2013; 6(8):4097-4116. https://doi.org/10.3390/en6084097
Chicago/Turabian StyleChristiansen, Søren, Thomas Bak, and Torben Knudsen. 2013. "Damping Wind and Wave Loads on a Floating Wind Turbine" Energies 6, no. 8: 4097-4116. https://doi.org/10.3390/en6084097