Design of a Novel Experimental Facility for Testing of Tidal Arrays


School of Engineering, Cranfield University, Bedford MK43 0AL, UK
*
Author to whom correspondence should be addressed.
Energies 2013, 6(8), 4117-4133; https://doi.org/10.3390/en6084117
Submission received: 2 May 2013
/
Revised: 11 July 2013
/
Accepted: 22 July 2013
/
Published: 12 August 2013
(This article belongs to the Special Issue Energy from the Ocean - Wave and Tidal Energy)
Abstract
:In order to obtain the maximum amount of energy from tidal stream extraction devices, deployment in large arrays should be studied. The area of seabed with favorable conditions is fairly limited; therefore layout spacing has to be optimized. In this paper a feasibility study for a novel experimental facility, suitable for the testing of an array of tidal devices, is presented. To avoid space and scale limitations of towing tanks, testing is proposed to be performed in large lakes or calm seas using a self-propelled vessel, which will carry an array of devices with variable spacing, creating relevant speed differences and measuring their performance and loading. Using hydrodynamic scaling laws, an appropriate size for test turbines and the range of vessel speed was determined to fulfill experimental requirements. Computational fluid dynamic simulations, using the actuator disc method, have suggested a suitable turbine array configuration to resemble real application conditions. A simplified model of the vessel was analyzed using the finite elements method to determine the main scantlings. The hull resistance calculated by empirical formulae was found to be negligible compared to the resistance of the tested turbine. It was confirmed that turbine size and speed determined by scaling laws are also reasonable from a propulsion point of view.
1. Introduction
Tidal stream energy is a very reliable source of renewable energy due to the fact that the behavior of tides is predictable to a great extent. The main advantages of tidal stream devices are their relatively low environmental impact, modularity and scalability. A recent report from the Carbon Trust [1] estimates that the UK could practically and economically capture around 21 TWh/year. This accounts almost for 6% of current electricity needs in the UK. The price of electricity from tidal devices, however, is still very high, but the report suggests that with current rate of technology development, it could become competitive with other sources of renewable energy by the mid-2020s.
Tidal streams of sufficient velocity to be exploited for energy generation mainly occur in areas with a large tidal range. Streams must somehow be restricted by seabed and coast configuration to reach a suitable velocity. Such locations could be straits between islands, river estuaries, fiords, headlands, etc. [1]; however, limitations are imposed by seabed configuration, stream properties, environmental restrictions, other sea users, etc. When all these factors are taken into account, it can be concluded that locations for the efficient deployment of tidal devices are fairly limited. To make full use of favorable conditions and reach maximum energy yield, devices at the commercial stage will be placed in arrays or farms. If they are spaced too closely to each other, especially in the stream-wise direction, their efficiency will be considerably reduced and fatigue loading on blades will increase due to turbulence. Therefore it is a very important aspect to optimize the spacing of devices on each particular location. A solution to the problem is pertinent because leading companies in tidal energy have already announced the deployment of the first arrays in the next few years [2]. Knowledge of spacing distance will also help to estimate energy extraction potential in particular areas more accurately and thus better plan overall energy policy.
This paper aims to present the findings of a preliminary design of an experimental facility for the testing of tidal device arrays, which is a floating vessel with its own propulsion. To do this, the most important design parameters are identified and studied.
2. Tidal Devices and Arrays
2.1. Effects of Tidal Device Interaction
Interaction of tidal stream devices placed in an array can be studied from at least two different points of view, power production and loading on the devices. Regarding the power production of devices, they can be spaced in such a way that the efficiency of each one is only slightly affected by the others and maximum energy yield per device is reached. Since it is expected that the area of seabed on which they can be placed is limited, the most important parameter for optimization could be power density, defined as the ratio between power production and seabed area occupied by the device. Further analysis in this paper will be done for horizontal axis tidal turbines because they are the most advanced concept of tidal stream devices and will become commercialized first [2].
Power density should not be the only parameter requiring optimization. Overall energy yield does not depend only on power production efficiency, but also on device availability. To reach high availability, time to failure has to be as long as possible and time to repair has to be short. Experience from the wind industry [3], shows that moving mechanical components, such as blade pitching and rotor yawing mechanism, provide some of the most common reasons for turbine downtime. Even though tidal turbines are smaller compared to wind turbines, they are still exposed to very high loading, especially to unsteady loads from turbulence. With a combination of difficult access and potentially long repair times, it is crucial that the failure rate of tidal turbines is kept low. This can be achieved with a more accurate description and reduction of loads coming from turbine interaction, or by decreasing the number of moving parts.
To reduce fatigue damage, a turbine should operate in a flow with low turbulence intensity. Turbulence is generated by upstream turbines and by flow interaction with the seabed. Another approach is to explore the effects on power production performance of eliminating mechanical systems for turbine control. Rotor blades can have a fixed pitch, which means that turbine must rely on alternative control strategies to maintain high energy yield under variable flow speed. Bianchi et al. [4] classify such strategies for wind turbines to fixed-speed fixed-pitch and variable-speed fixed-pitch. Changes in turbine rotational speed and blade pitch angle may affect the flow behavior of the whole array, which means different optimal spacing will be required. This is supported by conclusions of Turnock et al. [5] that turbulent mixing of the wake is sensitive to the mechanical turbulence induced by the blades.
There are no data about failure rates of particular components of tidal turbines, because only a few prototypes have been installed so far. It is only possible to estimate failure rates of some sub systems with regression analysis [3]. Because currently existing tidal devices face significant reliability and maintenance issues, substantial benefits are expected from increased availability if some critical sub systems are excluded from the design.
2.2. Experimental Facilities
There are three fundamental approaches to studying the flow of water through tidal turbines: analytical, numerical and experimental. The numerical approach has recently been receiving more and more attention because of an increase in available computational resources and the development of powerful simulation software. Regardless of how sophisticated numerical methods will become in the future, the need for their experimental validation will always remain.
Experimental tests of single tidal turbines can be performed in circulating water channels and towing tanks. The physical nature of hydrodynamic experiments is such that results at different scales can be compared only through non dimensional scaling laws. To resemble a full scale tidal turbine, the miniature prototype has to be geometrically similar and also have a Reynolds number above a certain limit [6]. The Reynolds number is controlled by flow velocity and size of prototype. The range of achievable parameters is practically constrained; therefore experimental models of tidal turbines cannot be arbitrarily small. For the testing of single turbines, many existing experimental facilities are suitable, but testing an array may be more demanding. Presumably at least three turbines in direction perpendicular to the flow are needed to resemble array conditions. Turbine in the middle is then affected by the one located to left and right and giving it the first approximation of an array. Taking into account also the range of lateral spacing between them then the required width of testing facility becomes significant. To avoid excessive interaction with the water surface and the bottom wall, depth of the testing facility is important as well. Even though towing tanks are generally the largest experimental facilities available they are not designed specifically for turbine testing, therefore their width is small compared to length. The largest towing tank in the UK belongs to the defense company QinetiQ (Haslar, Portsmouth, UK) and is 270 m long, 12 m wide and 5.5 m deep. This is possibly just enough to test an array with three parallel turbines in appropriate scales. Around the world there are not many towing tanks larger than this [7]. Conventional experimental facilities, such as towing tanks, are used in all fields of naval architecture and marine engineering, therefore competition for testing time may be challenging. An experimental facility designated only for testing tidal devices will overcome this problem and offer more opportunities for experimental work to a young and emerging tidal industry.
The original idea of this project is that testing would be conducted in the sea or a lake where tidal devices would be attached to a vessel, which would tow them through water while their performance and loading is being measured. This would eliminate the effect of wall proximity in towing tanks and allow the testing of larger units and arrays. There have already been some similar experiments with a single turbine [8,9,10] mounted on a boat-like structure. Coiro et al. [11] tested a large array of turbines moored stationary in the natural tidal channel of Messina Strait, but it seems nobody has ever done an experiment for an array of turbines with a self-propelled vessel. This novel approach would allow us more control over flow parameters. If a cost effective experimental configuration is designed, that could mean a big breakthrough in the understanding of multiple tidal device interactions.
3. Past Work in the Interaction of Units in an Array
Wind turbines have already been deployed in large arrays for decades and much research about their wake interaction has been done. Tidal turbine technology can significantly benefit by using that knowledge, because of the similarity between horizontal axis wind and tidal turbines. An extensive survey of modeling methods for wind turbine wakes was done by Crespo et al. [12]. Firstly analytical models of large farms, based on distributed surface roughness, and models of individual wakes, based on theory of co-flowing jets, were used. With the development of computer facilities Computational Fluid Dynamic (CFD) models have become more popular. Wind turbines in these models were represented as momentum sink, either with an actuator disc method or with an advanced method of actuator surface and actuator line. Usually models used the Reynolds Averaged Navier-Stokes (RANS) approach to turbulence modeling, but the more computationally demanding Large Eddy Simulation (LES) is nowadays used more often. Interesting experimental campaign has been done by Dabiri [13], who found out that power density of vertical-axis wind turbines can be greatly enhanced by close packing of counter rotating devices. He claims similar effects can be applicable to underwater turbines.
Despite the similarity between wind and tidal turbines, there are some important differences which pose limitations to the transfer of knowledge from one field to another. For example, tidal turbines can experience the effect of free surface, there is the possibility of cavitation, sometimes the assumption of bidirectional flow is valid, etc. Often methods from wind industry can be therefore used only as the first engineering approximations. The following is a brief review of what has been done in CFD simulations of tidal devices in the last five years.
Sun et al. [14] successfully applied the actuator disc method in 2D and 3D with a RANS model. They validated it by experiments with a porous metal disc which represented the turbine or momentum sink. In a narrow channel the porous disc had a significant effect on the fluid free surface, because the ratio of disc area to inlet cross-sectional area was rather large. A similar study is explained in detail by Harrison et al. [15] who compared a RANS CFD simulation to an experiment with a small scale porous disc (0.1 m diameter) in a circulating water channel. A good matching of results was obtained in the far wake region although mismatching in the near wake region indicated some limitations of the actuator disc method.
Harrison et al. [16] still used the actuator disc approach but instead of having uniform momentum sink across the rotor plane, the RANS model was coupled with blade element theory (BE) which provides momentum sink variation over the radius. The RANS+BE approach modeled a better increased turbulence in the near wake which caused faster mixing and wake dissipation downstream. These improvements to the model add little to the computational cost. Turnock et al. [5] used the same RANS+BE approach to precisely describe the turbine wake and make some estimates of power output per area covered with tidal turbines. They claim that the optimal arrangement is to have the turbine laterally very close but far away longitudinally in a staggered configuration. The practical value of the results is questionable because their model did not include multiple turbine interaction.
Bai and Spence [17] continued the work of their predecessors to simulate an array of turbines using the actuator disc method. They varied the turbine arrangements, and latitudinal and longitudinal spacing to observe their wake interactions. They also studied the impact of computational domain size on simulation results. The array of turbines produced some counterintuitive results, i.e., power production of turbines reduced with larger longitudinal spacing. The authors are quite confident that the reason for this is not a modeling error and they call for experimental validation of this phenomenon.
Churchfield et al. [18] went even further in complexity by using LES in modeling a tidal turbine array. In this case the geometry of the turbine blades was not physically modeled, instead rotating actuator lines were used to apply body forces on the flow field. Special attention was paid to the accurate modeling of environmental turbulence. It was discovered that vertical shear due to the seabed, combined with wake rotation causes a laterally asymmetric wake. Two configurations of turbine array, non-staggered and staggered, were considered and later configuration proved to be more efficient with the same longitudinal spacing.
Experimental research so far has been done with models of different complexity depending on the focus of the experiment. Myers and Bahaj [19] used small discs made of mesh or perforated metal in a tilting flume (water channel) to approximate flow around a tidal turbine using actuator disc theory. They claim that previous studies from the wind turbine industry have proved that a far wake behind a porous disc closely resembles one behind an actual turbine. The main parameter to compare the disc and an actual turbine is the thrust force exerted by fluid to the rotor, expressed as a thrust coefficient (CT). They found that higher ambient turbulence intensity causes wake to dissipate faster.
Myers and Bahaj [20] extended their research to the use of multiple discs and studied their wake interactions. At certain lateral separations they observed the formation of a fast jet of water between discs that could be exploited to increase power production of real turbine downstream in a staggered configuration. The combined wakes of three discs persisted longer downstream and took more time to dissipate.
In the experimental testing of scaled models of “real” turbines, research has been carried out by Bahaj et al. [21]. A turbine with 800 mm diameter was tested in a towing tank and cavitation channel. Turbine blades and testing rig were custom built for testing performance in different flow velocities, tip speed ratios, blade pitching, immersion depths and rotor yaw. The conclusion was that the most suitable TSR for maximum power production is between five and seven, for that particular geometry and settings. A significant reduction of power extraction was observed for the yawed rotor and this should be taken into account if tidal flow at a specific site is multi directional.
There has been already some field testing of scaled prototypes. Kirke [9] performed tests with vertical axis Darrieus type turbines. A single turbine was mounted on a motorized barge and pushed through still water while its performance was measured. It is interesting to note that only low speeds (<1 m/s) were achieved due to propulsion with outboard motor, which was not suitable for the task. Higher speed was reached by mounting the turbine on large barge.
Regarding the horizontal axis tidal turbines Rose et al. [10] performed experiments on a small lake with a towed vessel in catamaran configuration on which one turbine with 1.5 m diameter was mounted. They focused on wake characterization with Acoustic Doppler Velocimetry. Kinsey et al. [8] described their testing of an oscillating hydrofoils hydrokinetic device. An approximately 10 m long catamaran barge was built to drag two 1.68 m wide hydrofoils through the water at a speed of 2 m/s, propelled by an outboard motor. Hydrofoils were coupled to special mechanisms to convert the oscillating motion to a rotating motion and run the generator.
An experiment with an array of turbines was done by Coiro et al. [11] where they mounted several horizontal axis turbines in a row on the same long shaft. They placed two such rows in parallel an attached them to a boat moored in fast flowing current in Messina Strain in the south of Italy, where flow velocity reaches up to 2.5 m/s.
4. Novel Experimental Configuration
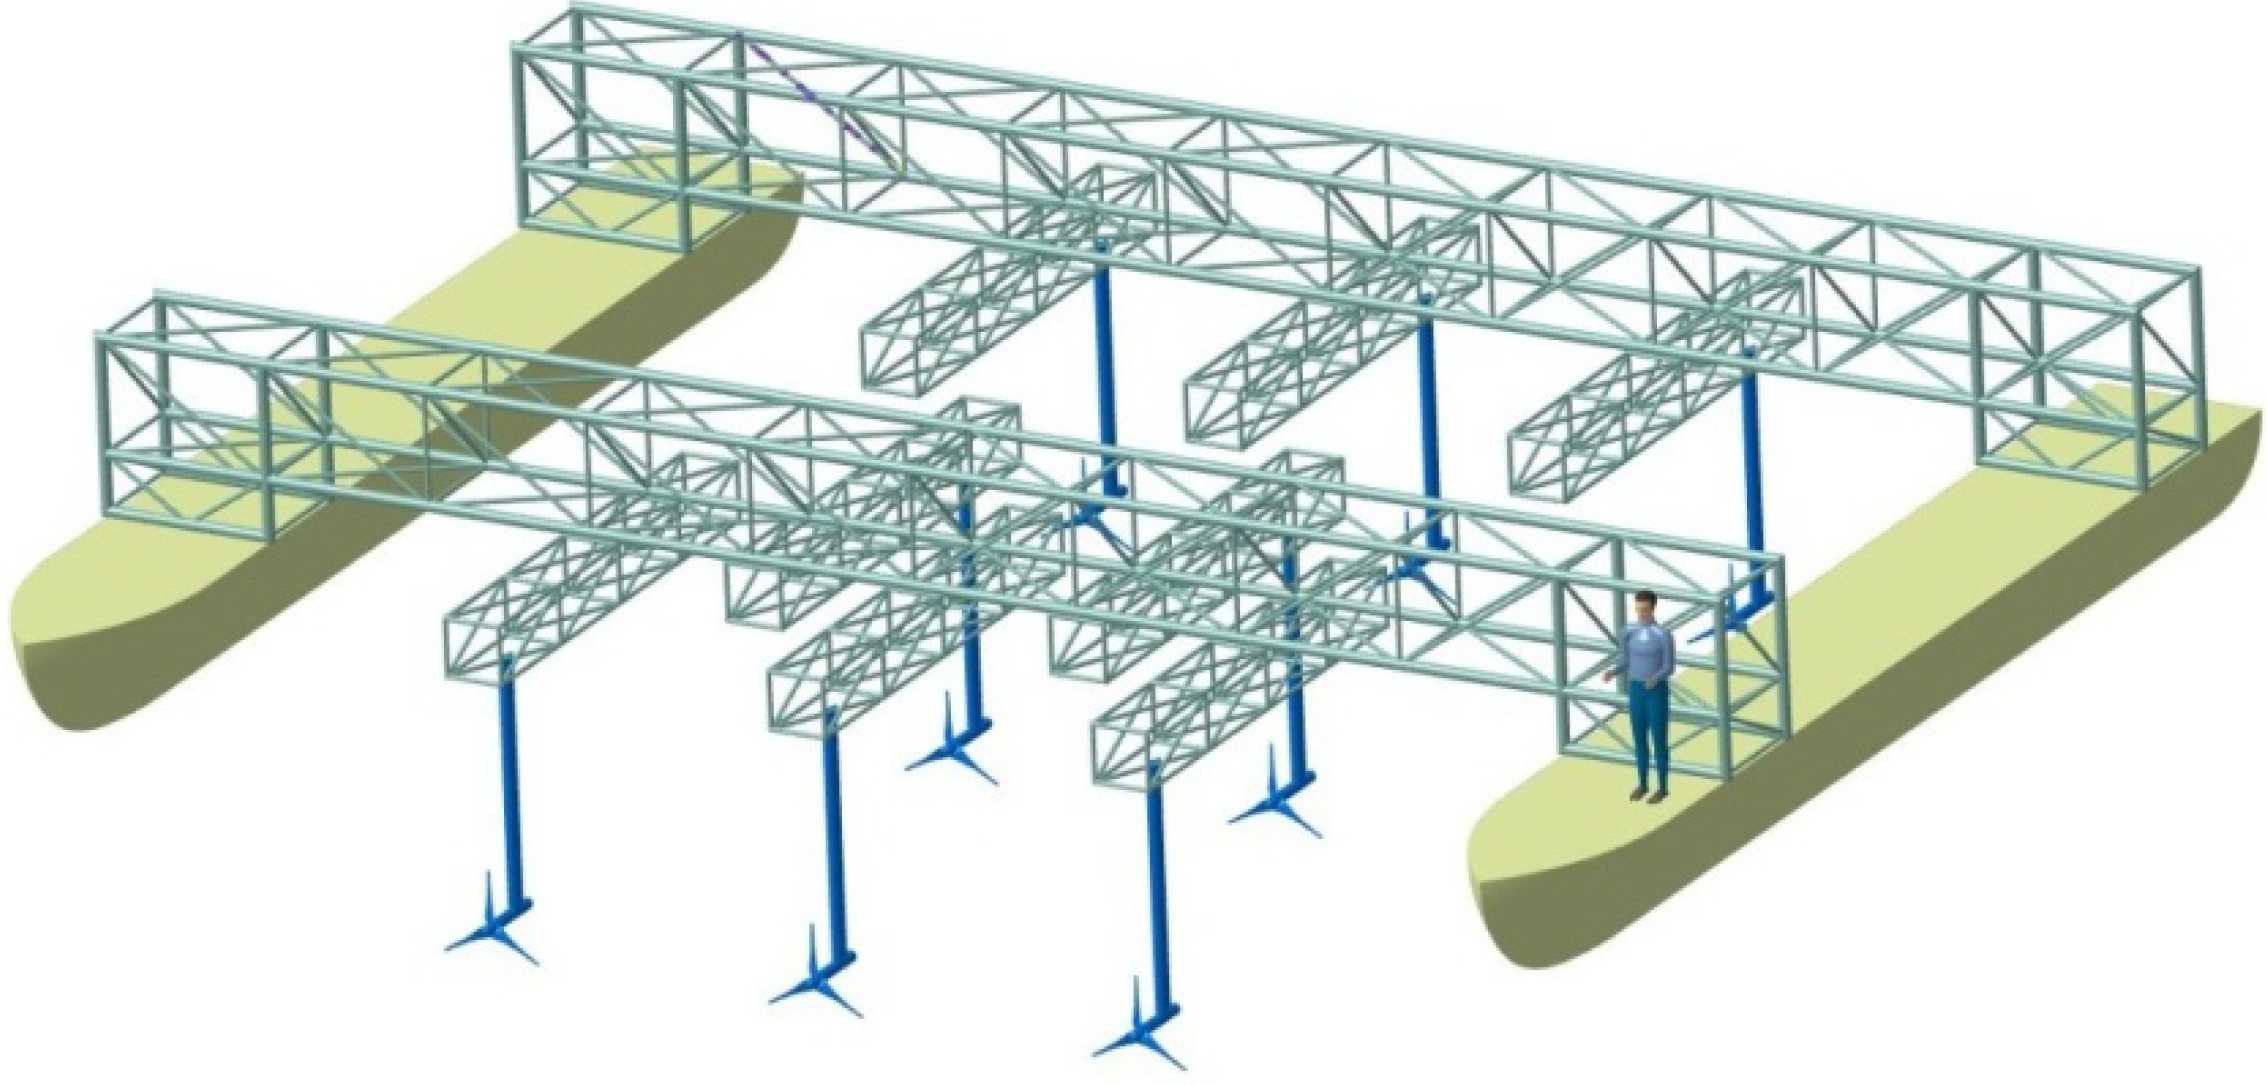
The proposed testing facility requires using a vessel in the shape of a catamaran and in the void between hulls an array of devices to be placed, see Figure 1. The devices are mounted on beams, which are able to move and change their position. Attention should be paid to minimize the effect of hull proximity on performance and behavior of the tested devices. While this is outside of the scope of the present study it definitely needs to be evaluated in the future. The type of vessel propulsion is not defined yet but probably a large slow propeller with high thrust would be suitable, similar to tug boats. Theoretically all sorts of tidal devices could be accommodated. According to the literature review, horizontal axis turbines are currently the most advanced concept, therefore these are considered within the design of the testing vessel. We are aware that testing vessel has a limitation by neglecting the seabed boundary effects, but this is the trade-off we have to accept.
Turbines are held underwater by a special mounting system attached to positioning beams. An example of a mounting system is shown in Bahaj et al. [21]. Their design also enables yawing of the turbine in order to test its performance if it is not oriented perpendicular to the flow. The only proposed change to their design is that the vertical tube is shaped more hydro-dynamically to reduce drag and eliminate possible vibration, induced by periodical vortex shedding behind the cylindrical shape. The mounting system could, in the future, be improved by adding its ability to be lifted out of the water. That would facilitate mooring in shallow waters and faster extraction during experiments. To simulate turbulence present in real tidal streams, turbulence generators could be placed in front of the first tested turbines. It is a matter for further research to determine how close this approach can resemble natural boundary layer turbulence.
Currently vessels have a broad range of available construction materials. After a quick comparison of the advantages and disadvantages of wood, steel, aluminum and fiber reinforced plastics, it has been decided that the testing vessel will be made out of marine grade aluminum. It has good corrosion properties, high strength to weight ratio and high durability. Even though raw aluminum is more expensive than steel and labor costs are significantly higher, benefits can be obtained through the lower weight of the structure. This will require less propulsion power and make transport over land easier. The main advantages of the novel experimental configuration are:
- Scalability. The vessel can accommodate prototypes of larger scale and larger turbine arrays, compared to the most of the towing tanks.
- Low CAPEX cost. The vessel will probably cost only a fraction of a comparable large towing tank. Facilities of different scales can be designed;
- Small size and modular design. Comparing the modular geometry and size of the vessel and the scale of prototypes that can accommodate the existing towing tanks around the world, the size of the new facility is considered very small.
Figure 1.
3D model of the testing vessel.

5. Results of a Preliminary Study of the Concept
It is assumed that the following four main parameters have the largest impact on the shape and size of the vessel:
- Maximum diameter of tested turbines;
- Range of testing speeds of the vessel;
- Maximum number of turbines and shape of the array;
- Maximum distance between turbines.
The following subsections explain the methodology followed in determining values for those parameters. Details are thoroughly explained in the thesis by Pintar [22].
5.1. Non-Dimensional Scaling
A general requirement for determining the size of tested turbines is that they have to give sufficiently accurate results while keeping the turbines as small as possible. A larger tested model means that more material is needed, larger sensors, larger vessel structure, more powerful propulsion, etc. Another important factor that influences turbine sizing is the vessel’s range of testing speeds.
A study of the non-dimensional scaling of tidal turbines was done by Mason-Jones et al. [6]. Using the established Buckingham Pi theorem they calculated that turbines coefficient of power (CP) and coefficient of thrust (CT) are functions of Reynolds number (Re), and tip speed ratio (TSR), but after some critical value, Re, based on turbine diameter, no longer has any effect. These values are turbine characteristic properties and are defined as:
where P is turbine power; T is thrust force; ρ is water density; V is flow speed; A is turbine swept area; D is turbine diameter; ω is angular velocity; and μ is water dynamic viscosity.
Therefore two geometrically similar turbines can be compared if their TSR matches and their Re are above critical value. For a particular turbine, as in the case of Mason-Jones et al. [6], critical value was Re = 5 × 10⁵, but this can change depending on the geometry.
We assume some margin to be sure that results are valid for all types of turbines and therefore set critical Re to 106. Then for the turbine with a 1 m diameter, the minimum testing speed should be 1 m/s. This is convenient, because it is close to the typical cut-in speed of a real full scale tidal turbine. Maximum testing speed should not be too high; in order to avoid the need for very high propulsion, 2 m/s seems a reasonable limit. We also assume that sample tested turbine has constant TSR of 5, which is in agreement with Bahaj et al [21].
5.2. CFD of Tidal Turbine Array
To better understand wake interaction between multiple tidal turbines, a number of two dimensional (2D) CFD simulations was done with the popular commercial software FLUENT (ANSYS, Canonsburg, PA, USA). The main purpose was to determine what should be the configuration of the tested turbine array, which accurately enough represents the very large array deployed in reality. A smaller array, with fewer turbines, would be easier to test, but at the same time the results would be less accurate or valuable. Turbines were represented with actuator disc method, which is one of the simplest CFD models, but we assume it is suitable for a rough engineering approximation.
The computational domain had a rectangular shape with an inlet boundary of 10 diameters upstream of the first rotor, and an outlet boundary of 30 diameters downstream of the last rotor. The width of the domain had to be large enough to give the impression of a free stream and minimize blockage effects. It was chosen in accordance with findings in Bai and Spence [17] in which they compared the influence of domain width on actuator disc behavior in three dimensional simulations. It was found that, if the ratio of disc area to domain inlet area is 2.5% or less, it can be safely considered that the blockage effect is negligible. This ratio translated into a 2D simulation means that the whole domain width was 40 rotor diameters. Bai and Spence [17] also confirmed that using symmetry boundary conditions for symmetric configurations yields valid results, so this assumption was used in simulations. Turbulence was modeled with a k-ε model.
According to the actuator disc theory, the turbine rotor acts as a momentum sink in a flow field. In FLUENT this is called a “porous jump” boundary condition. Its parameters are shown in Table 1 and should represent a turbine operating at maximum power coefficient. The parameters were determined according to Harrison [15] by expressions, which correlate the coefficient of thrust to the resistance coefficient of the porous disc. Similar values were chosen by Bai and Spence [17].

| Zone | Name of Boundary Condition | Value of Parameter |
|---|---|---|
| Inlet | Velocity inlet | Magnitude (uniform): 2 m/s |
| Turbulence intensity: 1% | ||
| Turbulence length scale: 1 m | ||
| Outlet | Outflow | - |
| Side wall | Symmetry | - |
| Middle line | Symmetry | - |
| Turbine (rotor—actuator disc) | Pressure jump | Face permeability (α): 1010 m2 |
| Porous media thickness (∆m): 0.01 m | ||
| Pressure jump coefficient (C): 200 m−1 |
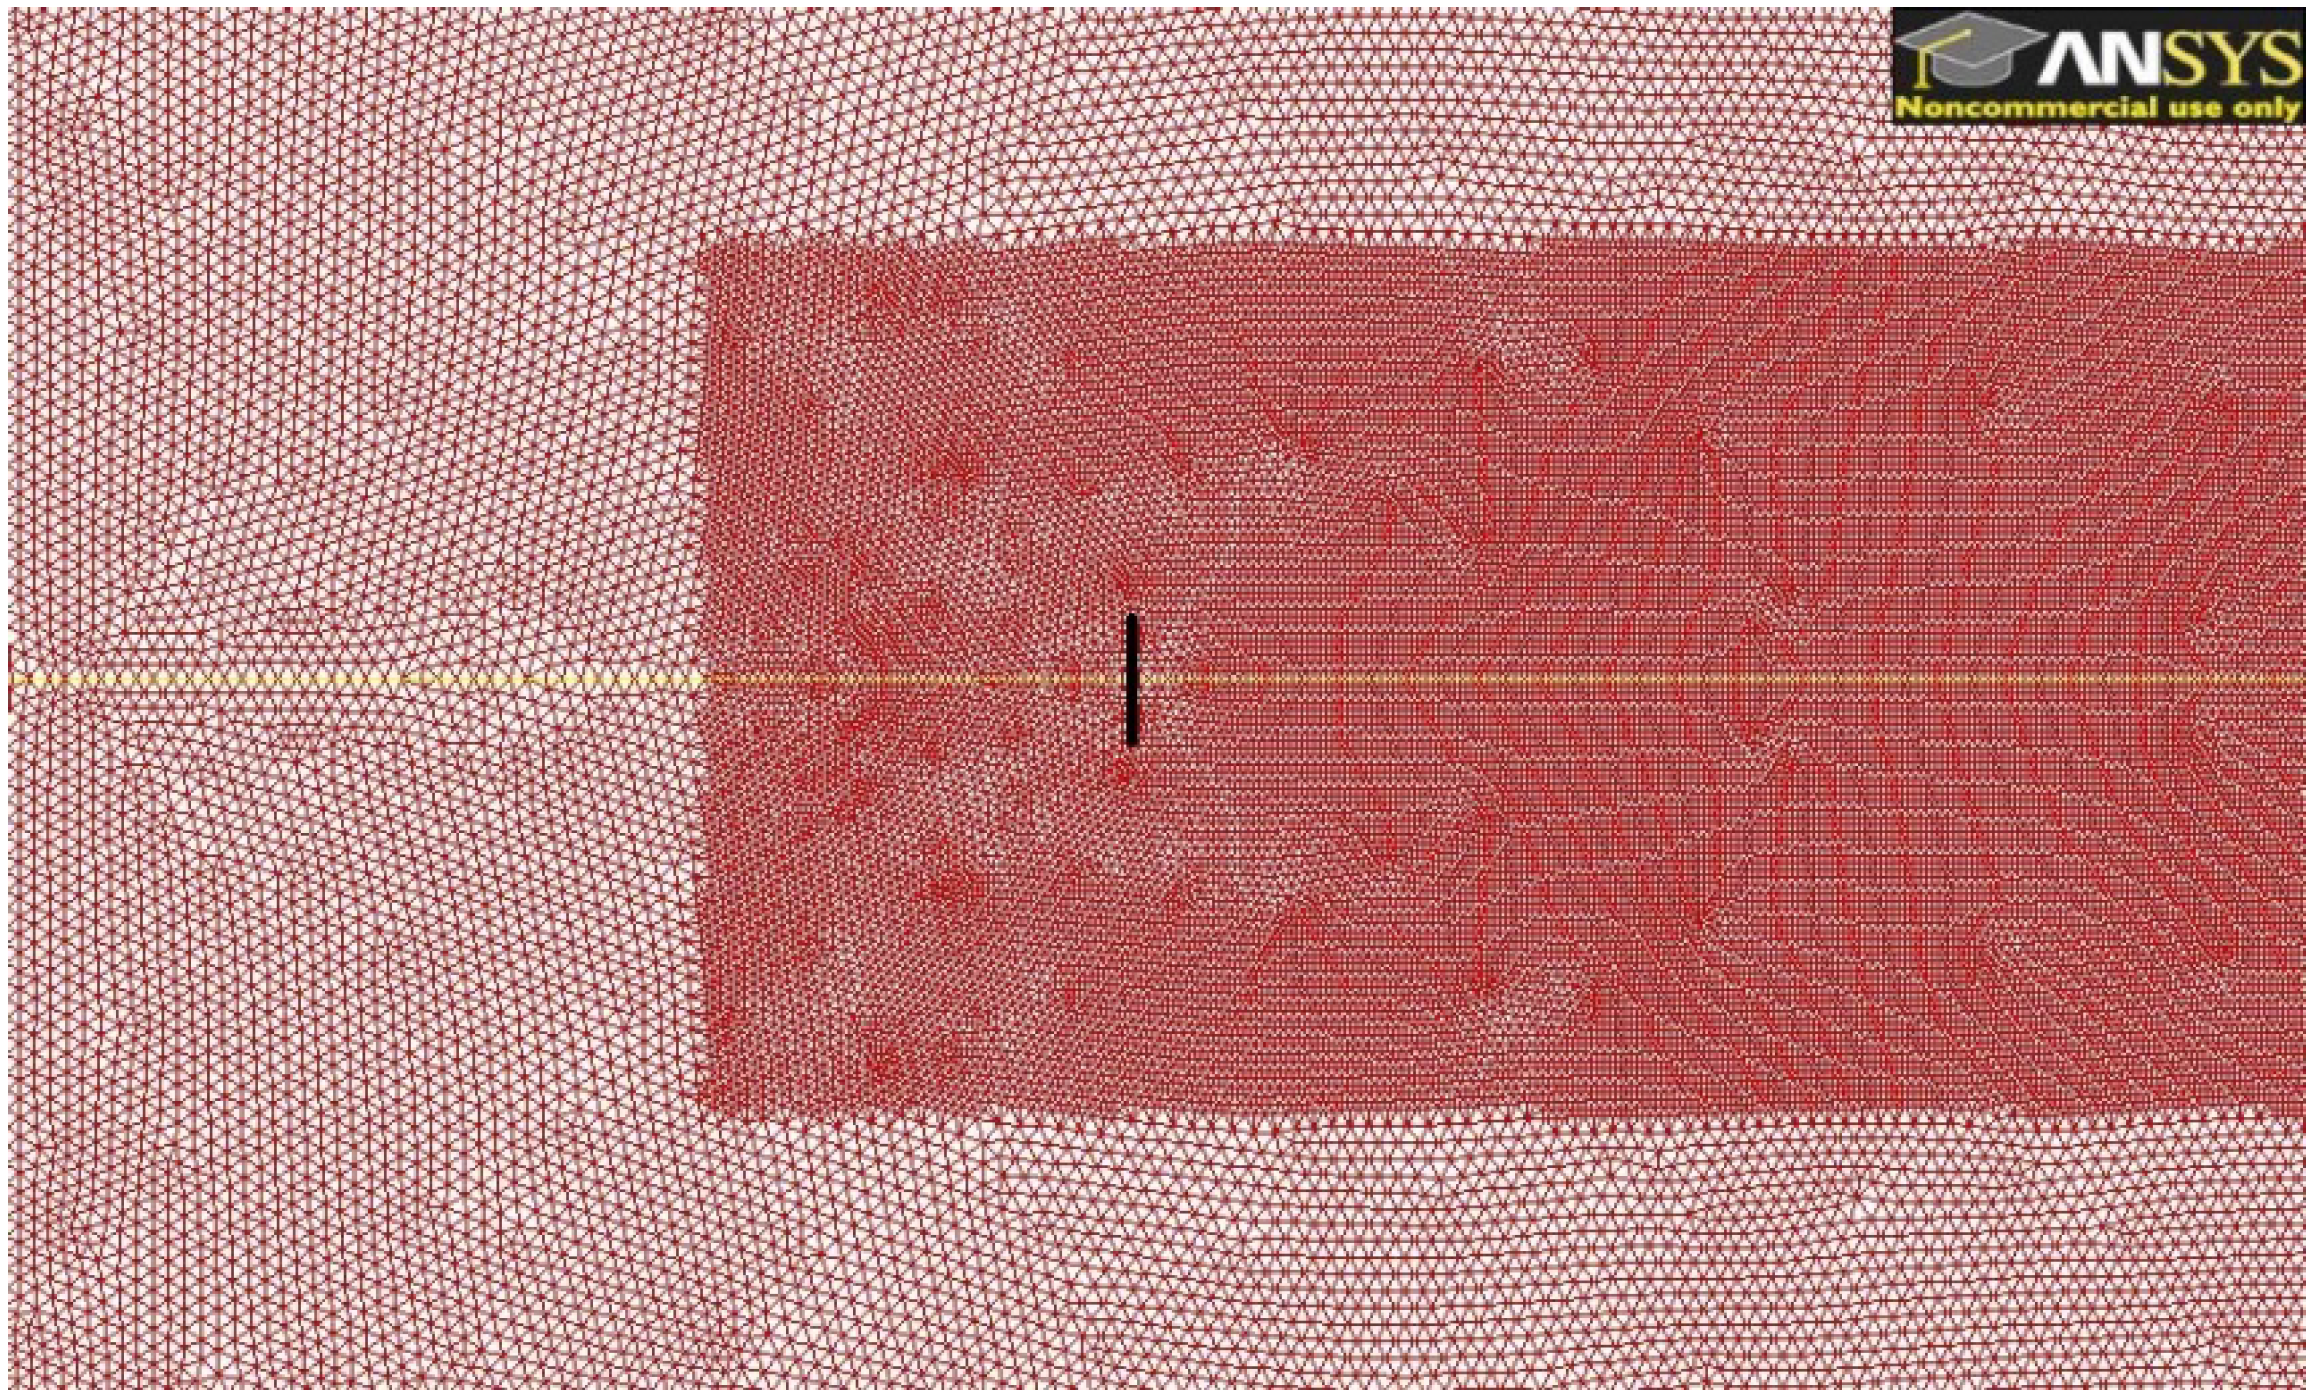
Figure 2 shows part of the computational mesh around the turbine model (rotor). The mesh is unstructured and made of triangular elements. The turbine rotor was represented as a 1 m long line in the 2D domain. Mesh independence was checked with three different mesh densities and the chosen mesh had a maximum size of 0.15 m with a refinement area around the turbine and in the wake, with a maximum cell size of 0.075 m. For validation of the modeling procedure, work performed by Harrison et al. [15] was reproduced. The results show a fairly good match with the reference CFD simulation and an even better match with the corresponding experiment.
Figure 2.
Unstructured mesh around turbine model.

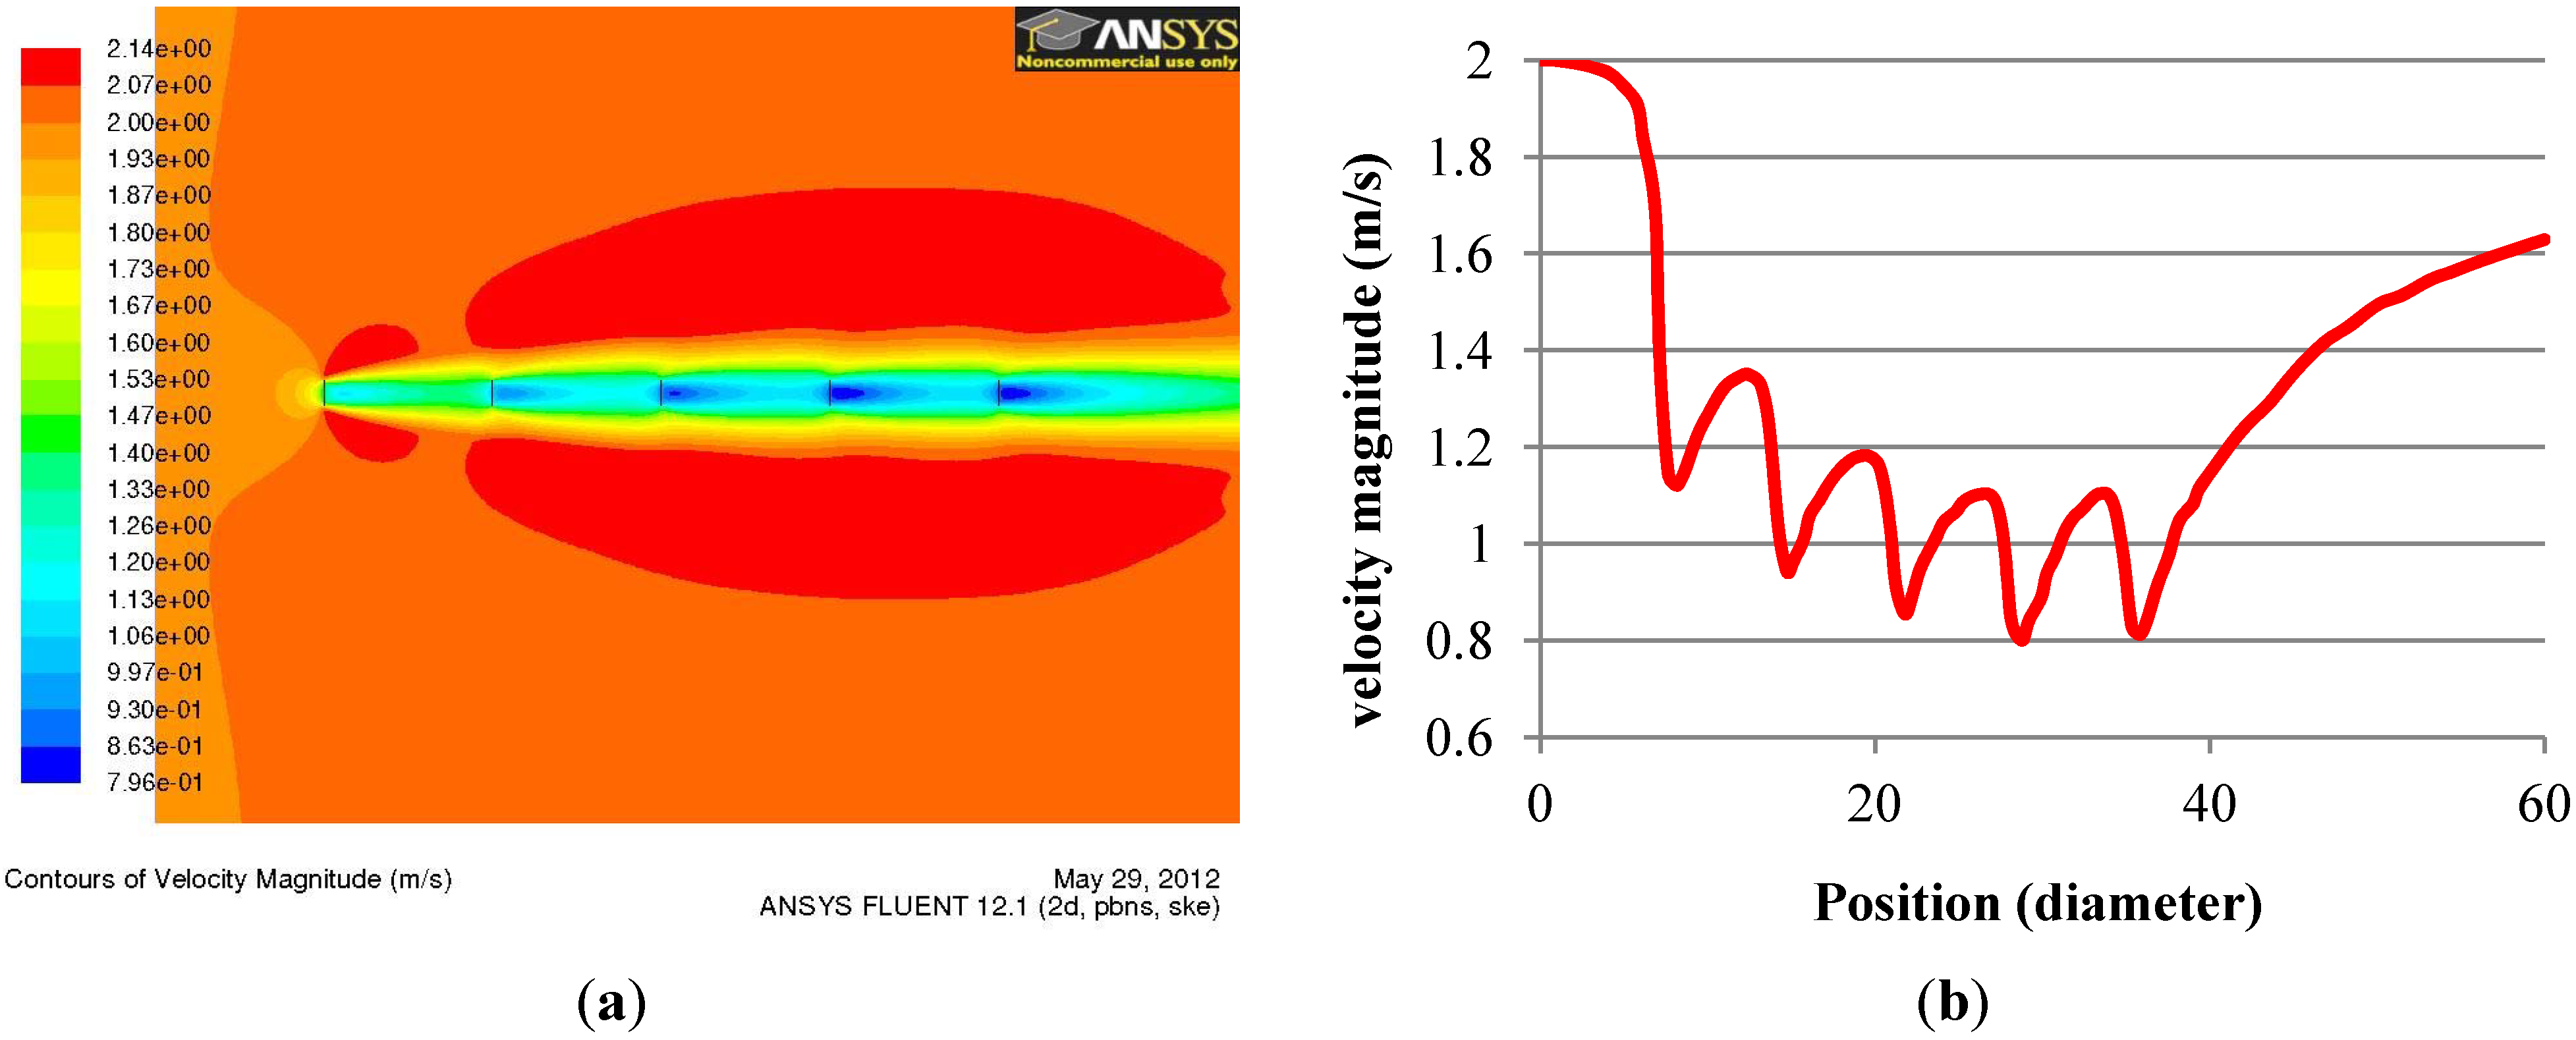
Simulation with five turbines in a row was done to see how the flow field changes deep in the turbine array (Figure 3a). In Figure 3b we can see that after two or three turbines, velocity drops in the centerline of the turbines were almost constant, which means their behavior was similar. The same observations were confirmed during numerical and experimental studies of wind farms [12]. This fact is very important because it confirms that the behavior of turbines in the second or third row satisfactorily represents all other turbines further inside the array.
Figure 3.
Velocity field around five turbines in a row.

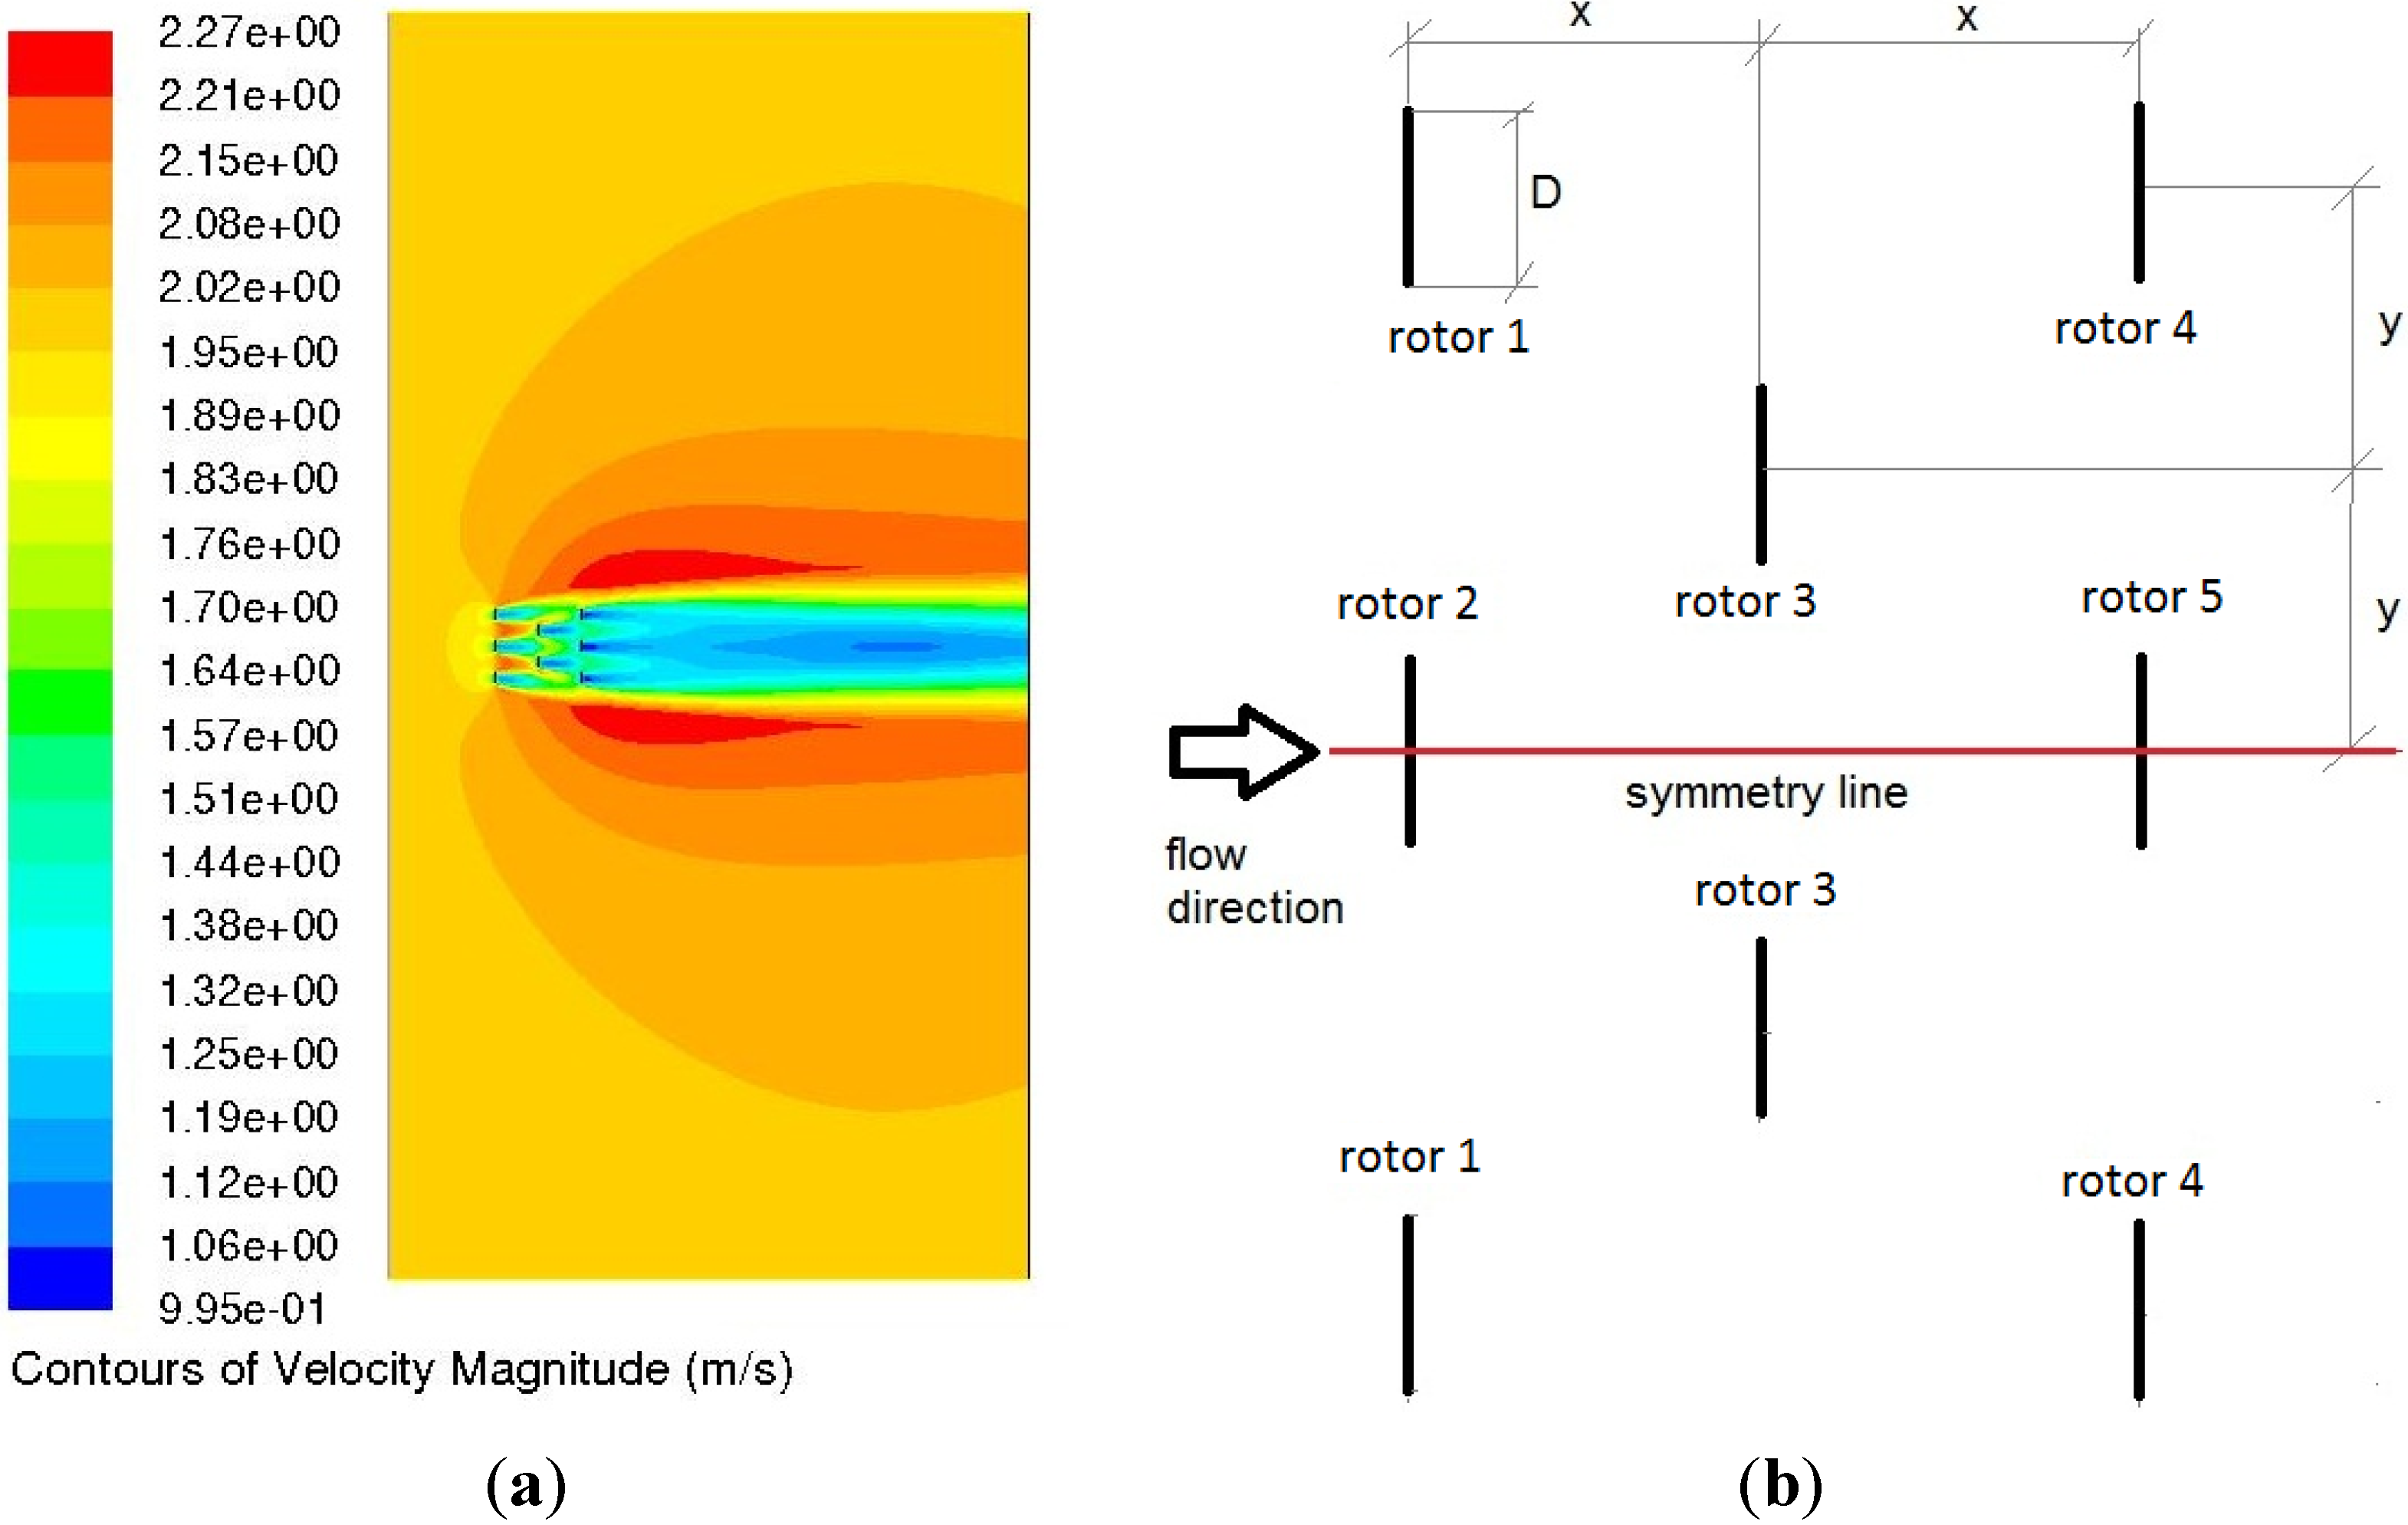
Figure 4a shows the velocity magnitude of the flow around the proposed testing array with eight staggered turbines. The whole width of the domain is shown. Figure 4b shows the details of the layout. The middle turbine in the last column (rotor 5) is the one most affected by the other turbines and is therefore considered to be the best approximation of a turbine in a large array. Its power density is used to estimate the performance of the whole array.
Figure 4.
Velocity field around an 8-turbine array.

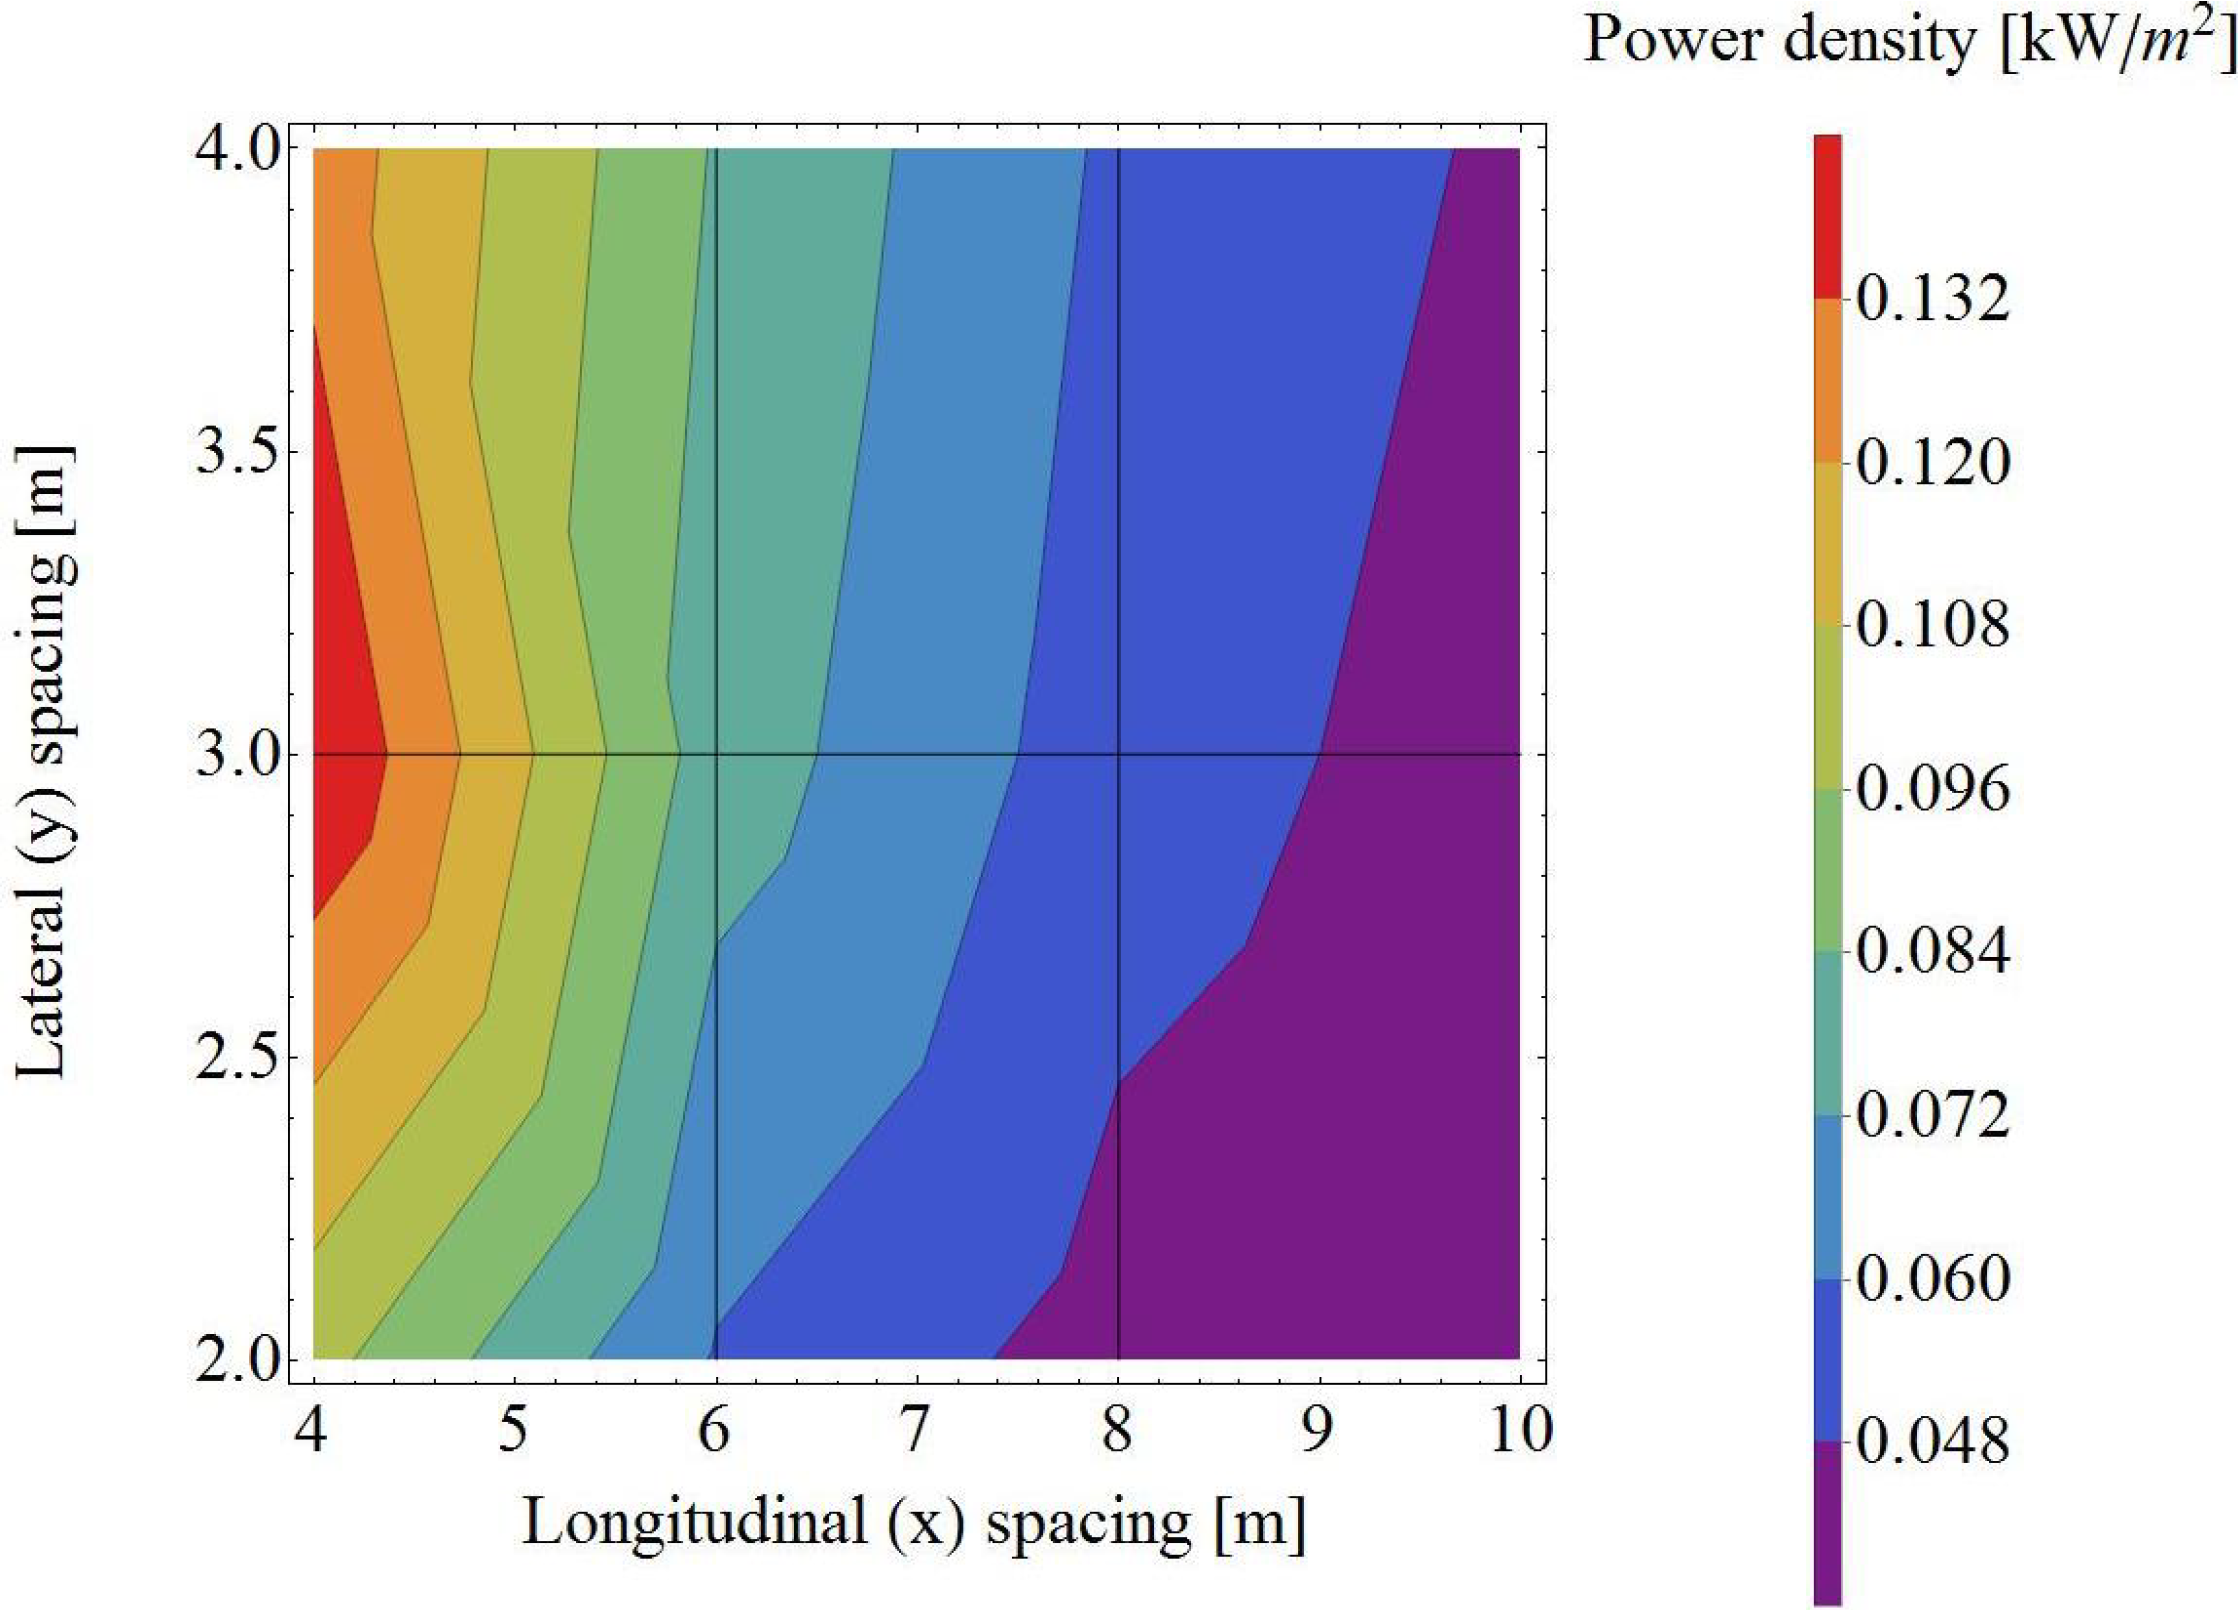
Finding an optimal spacing distance is essential for the design of a testing vessel, because it will only be able physically to test a certain spacing range and the optimal value has to lie within. Twelve different simulations were made, with all possible combinations between two sets of longitudinal and lateral spacing expressed in multiples of turbine diameter, (x ∈ [4,6,8,10], y ∈ [2,3,4]). The area which one turbine occupies is calculated by multiplying longitudinal and lateral spacing.
Figure 5 shows power density for a representative turbine under the assumption that its diameter is 1 m. Here power density refers to ratio between turbine power and area that it would occupy on the seabed. We can see that the power density function is always increasing with smaller longitudinal spacing and shows some kind of peak in a lateral direction. The value for lateral spacing conforms to expectations, but the results for longitudinal spacing show that turbines are more efficient when closer together. This may be because turbines closely spaced in either lateral or longitudinal direction present more overall blockage, forcing flow through them instead of around them. Similar results were found by Bai and Spence [17] and the reasons for this interesting behavior should be studied further. Nevertheless, a conclusion of this analysis is that the chosen testing array has eight turbines with maximum spacing between them: four diameters laterally and five diameters longitudinally.
Figure 5.
Graph of power density depending on turbine spacing.
5.3. Structural Design and Analysis
After the size of the test turbines and array configuration had been determined, different components of the vessel were assembled together and analysed with a finite elements analysis method in the commercial software Abaqus (Dassault Systemes, Paris, France). The main aim of this section was to determine the basic shape and dimensions of the components. This gave information about whether the concept is feasible from a structural strength point of view and also the first estimation of the vessel’s weight.
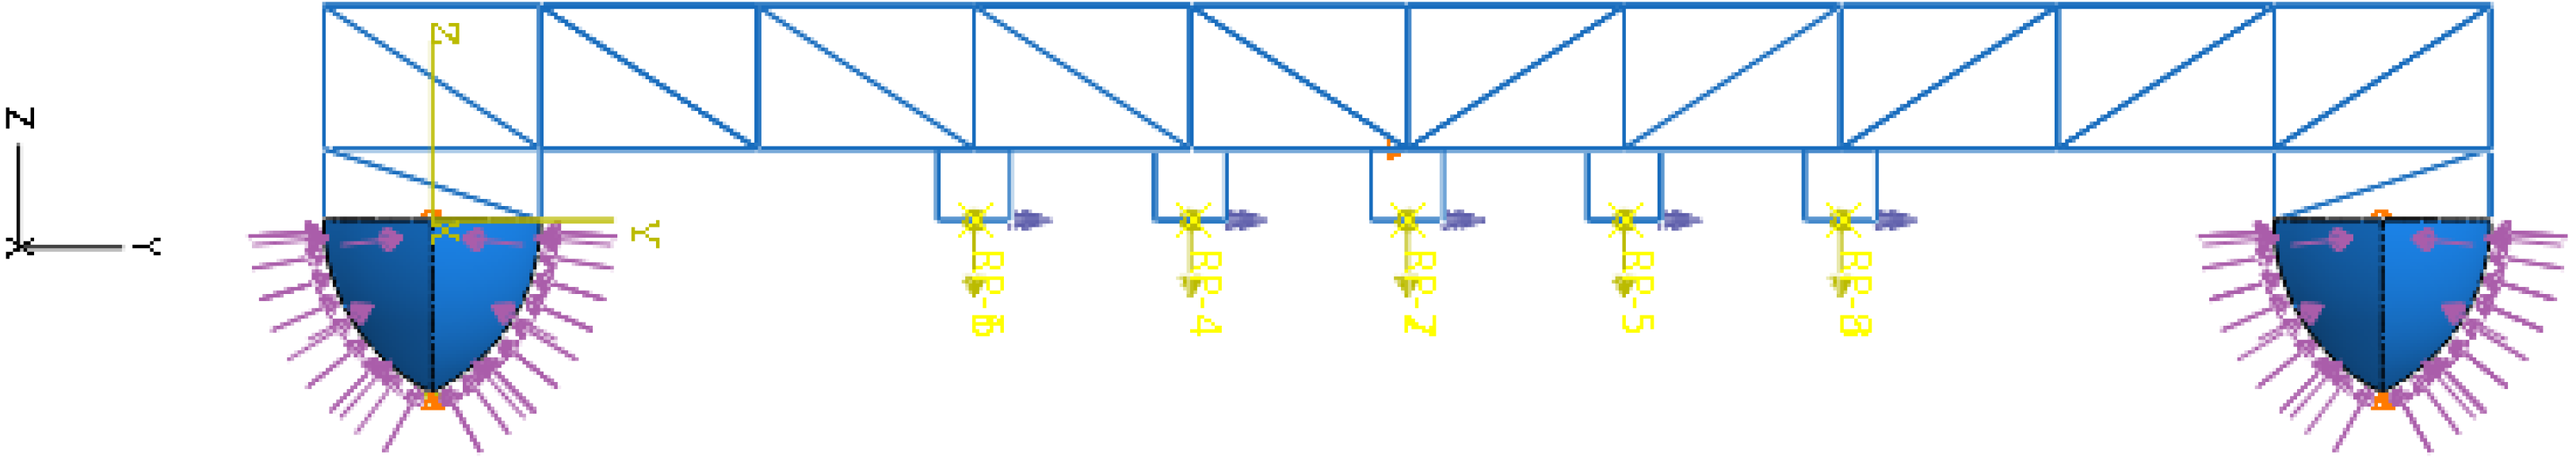
Every vessel hull has its own properties in terms of resistance, stability, strength, amount of space inside, etc. All the required properties of the vessel are still unknown or their importance is unknown, therefore a simple hull shape was considered in the beginning. The testing vessel is subjected to loads from its own weight and to loads that come from turbines (see Figure 6). These loads are thrust force, moment created by thrust force and the turbine’s own weight, the latter being chosen arbitrarily. They are applied at certain points on the positioning beams. The worst load case was chosen to be eight turbines in the chosen configuration, operating at CT = 1 at 2 m/s.
Because the vessel floats on the water’s surface, forces from the hydrostatic pressure must be opposite and equal to the sum of all the other vertical forces. Practically speaking, it is impossible to achieve a complete matching of these two values; therefore the model must be pinned in a few points to prevent rigid body movement. Boundary conditions for global vessel analysis were applied as suggested by Det Norske Veritas [23]. Two points on the keel of each hull were pinned in a vertical direction. A few points on the stern hull were pinned in the direction of movement, to represent a propulsion effect, and one point in the middle of the structure was pinned in lateral direction, which is the least important direction in this analysis.
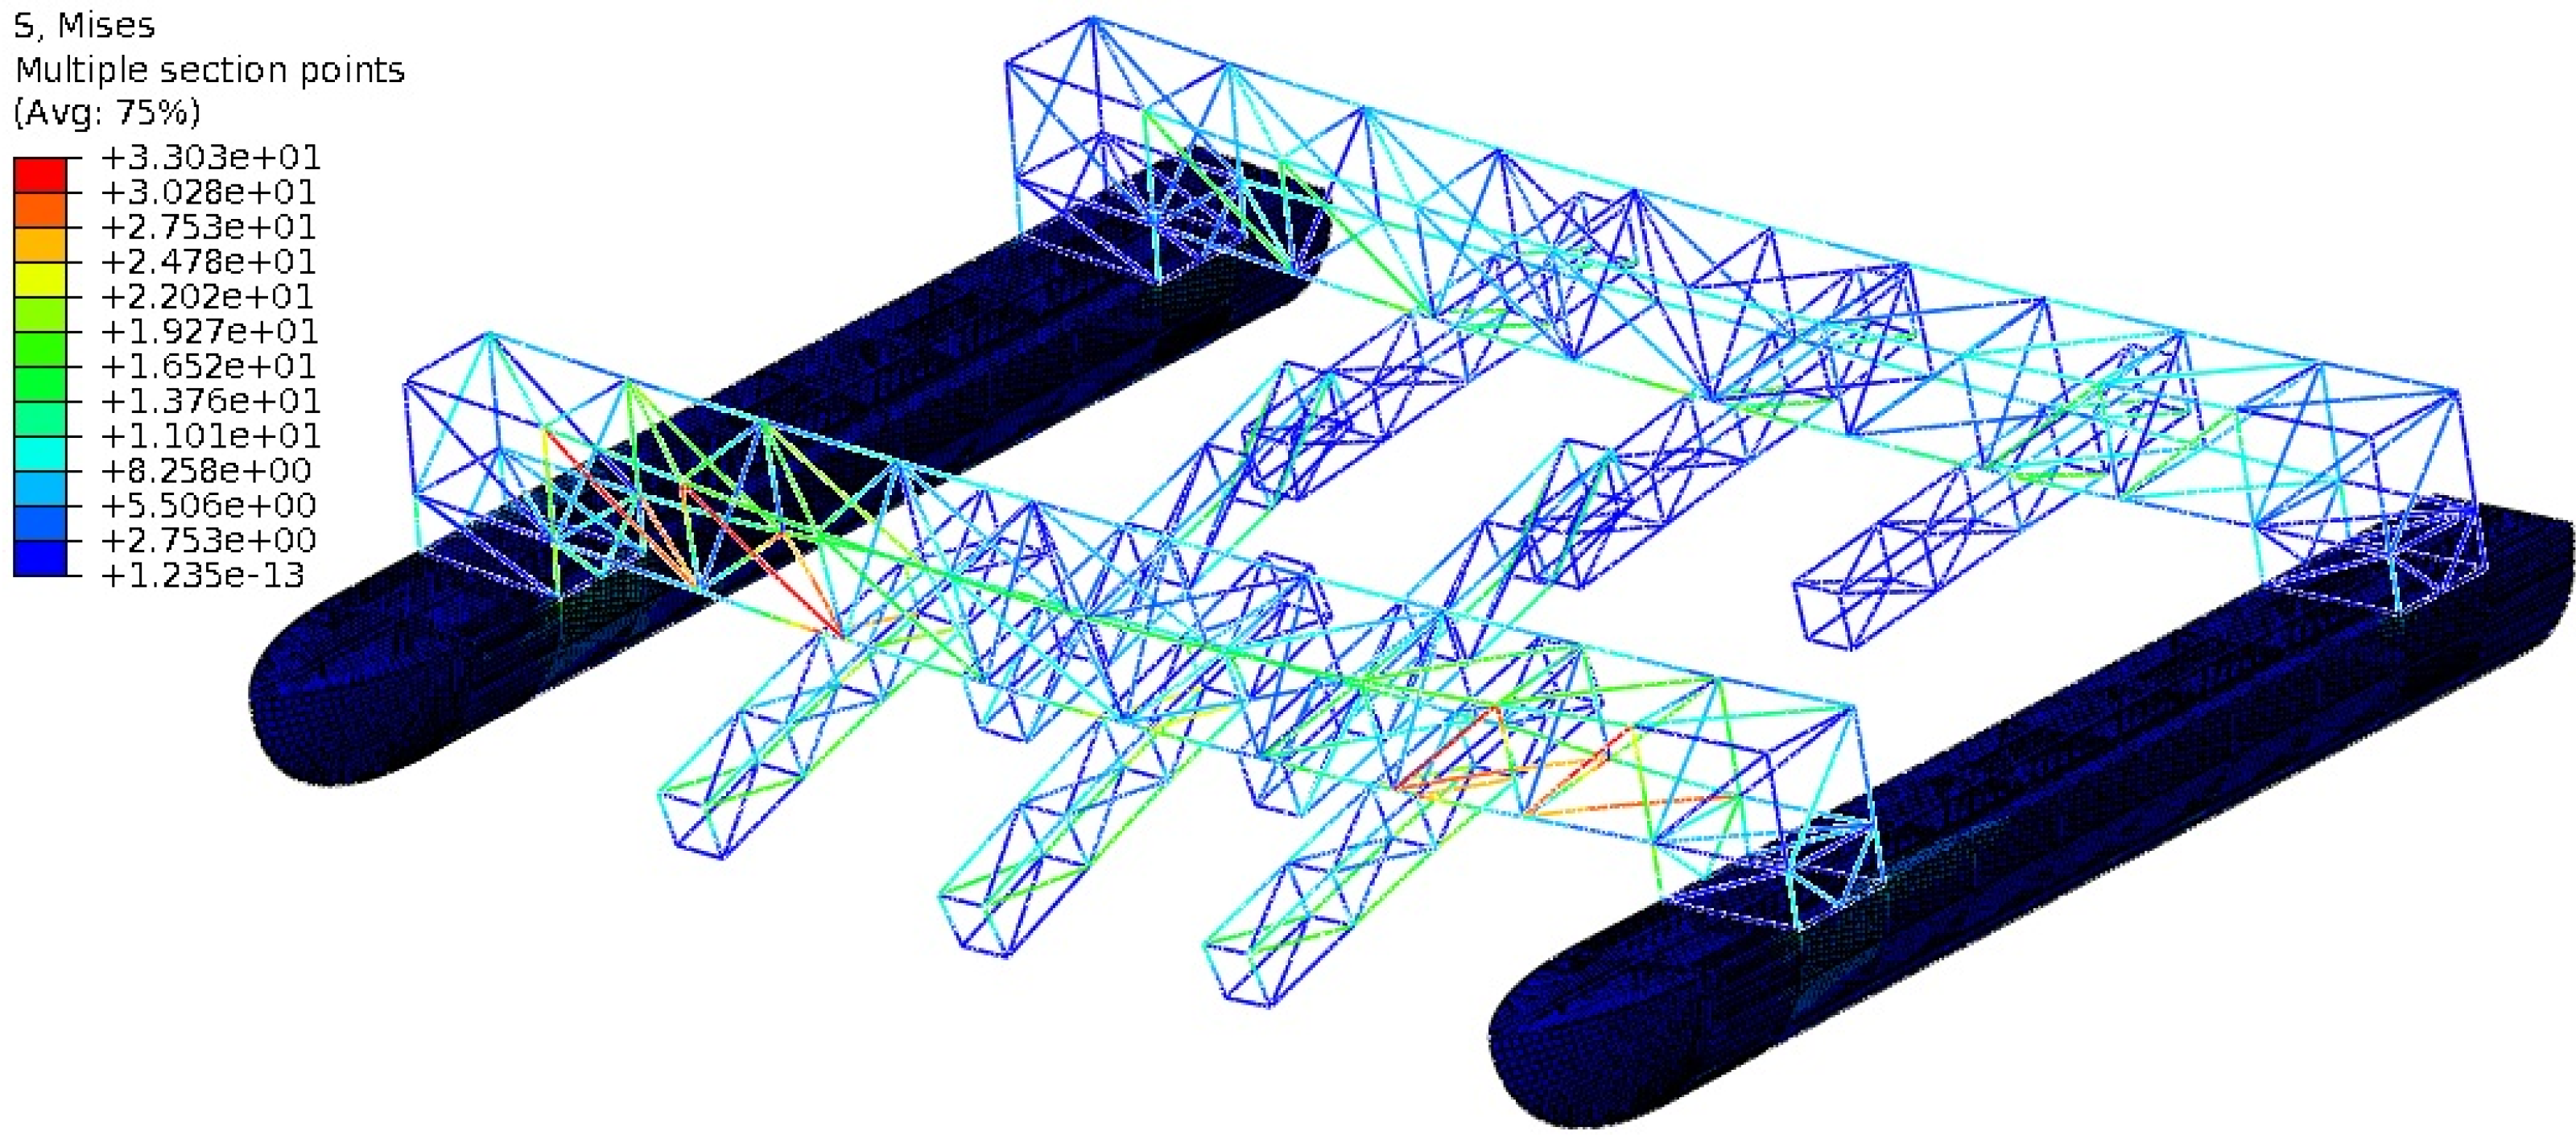
It was assumed that failure occurs when Von Mises stress reaches 83 MPa, which is 2/3 of the yield stress of the chosen aluminum alloy NV-5083 with H112 temper treatment. This alloy is approved also by Det Norske Veritas. The maximum allowed absolute displacement was set to 50 mm. Figure 7 shows stress distribution on the vessel in deformed configuration (deformation is not to scale).
Figure 6.
Loads applied to the model for finite element analysis (FEA).

Finite elements analysis was repeated several times, each time with changed dimensions to reduce the weight of the vessel. Finally, the thickness of the hull was 2 mm, with several longitudinal and transversal stiffeners 6 mm thick. The dry weight of the structure was 1820 kg and total displacement, taking into account the arbitrarily chosen weight of the tested turbines and propulsion system, was 3160 kg. The whole vessel was 12 m long, 15 m wide and 2.7 m high. The width was determined by assuming maximum possible lateral distance between axes of turbines to be 4 m, plus arbitrarily chosen distance 2 m between hull and turbine, plus width of the hull 1.5 m.
Figure 7.
Stress distribution on the FEA model.
5.4. Resistance and Propulsion
Vessel hydrodynamics is a very complex science, especially under changing environmental conditions. For the purpose of this work some simplifications are made, which can be justified by the nature of the vessel. It is an experimental vessel, designed to be used in an unexposed and controlled environment. First of all, only water resistance is considered, air resistance is neglected. Vessel resistance can be significantly changed in rough seas, but only the calm water components of resistance are discussed here. The testing vessel has two hulls and there is some interaction between them, but here they are considered as the sum of two independent monohulls. Only resistance coming from a naked hull is considered, neglecting any interaction with the propulsion system.
For an estimation of the testing vessel resistance, empirical methods based on model series tests are used. Two different methods were applied; the first is described by Larsson and Eliasson [24] and is based on experiments with sailing yacht models. It is convenient that the hull shape of a sailing yacht may be similar to that of the testing vessel. The second is Hollenbach’s method, described by Schneekluth and Bertram [25], and based on an analysis of 433 contemporary hulls. Both methods use for calculations a set of dimensionless parameters derived from the main dimensions of one hull, shown in Table 2.
| Main dimension of the hull | value | units |
|---|---|---|
| Volumetric displacement ∇ | 1.541 | m3 |
| Length of waterline LWL | 11.27 | m |
| Maximum beam of waterline BWL | 0.83 | m |
| Maximum draught T | 0.32 | m |
| Prismatic coefficient Cprism | 0.57 | / |
| Hull wetted area Awet | 11.57 | m2 |
| Longitudinal centre of buoyancy LCB | −5 | % |
Prismatic coefficient is defined as following, where Ax is area of maximum hull cross-section:
Note that value of longitudinal centre of buoyancy (LCB) is a measure of distance from midship expressed in percentage of LWL. Negative value means aft of midship.
A problem with all empirical resistance methods is that they are derived from the hull series of a particular type, for example: cargo ships, tankers, yachts, etc. Therefore they are valid only for similar hull shapes or only over a range of parameters. If one of the parameters of the hull is outside the valid range, the resistance estimation is unreliable.
To gain more confidence in the results specialized marine software DelftShip (DelftShip marine software, Hoofddorp, The Netherlands) was used, which also estimates resistance using empirical methods. One of these is called “Kaper” and was developed for canoe and kayak hulls. The software manual unfortunately does not provide information about formulae used but similarities between the hull of the testing vessel and a typical kayak suggests that the method may yield more reliable results; therefore it was used in further calculations. The results are compared in Table 3.
| Method source | Total resistance force (N) | Calculated at speed (m/s) |
|---|---|---|
| Larsson and Eliasson | 92 | 2 |
| Schneekluth and Bertram | 77 | 2 |
| DelftShip (“Kaper”) | 200 | 2 |
The final goal of this section is to estimate the propulsion power that the testing vessel needs to be able to move at the maximum testing speed (2 m/s). Resistance of all vessel components, i.e., two hulls and all turbines, are summed together.
Figure 8 shows the effective power required to move the whole vessel and separately two hulls and eight turbines. The power required to move two hulls is negligible compared to the power required to move the turbines. Note that effective power is not the same as real required engine power.
Figure 8.
Required effective power for the vessel and its components.
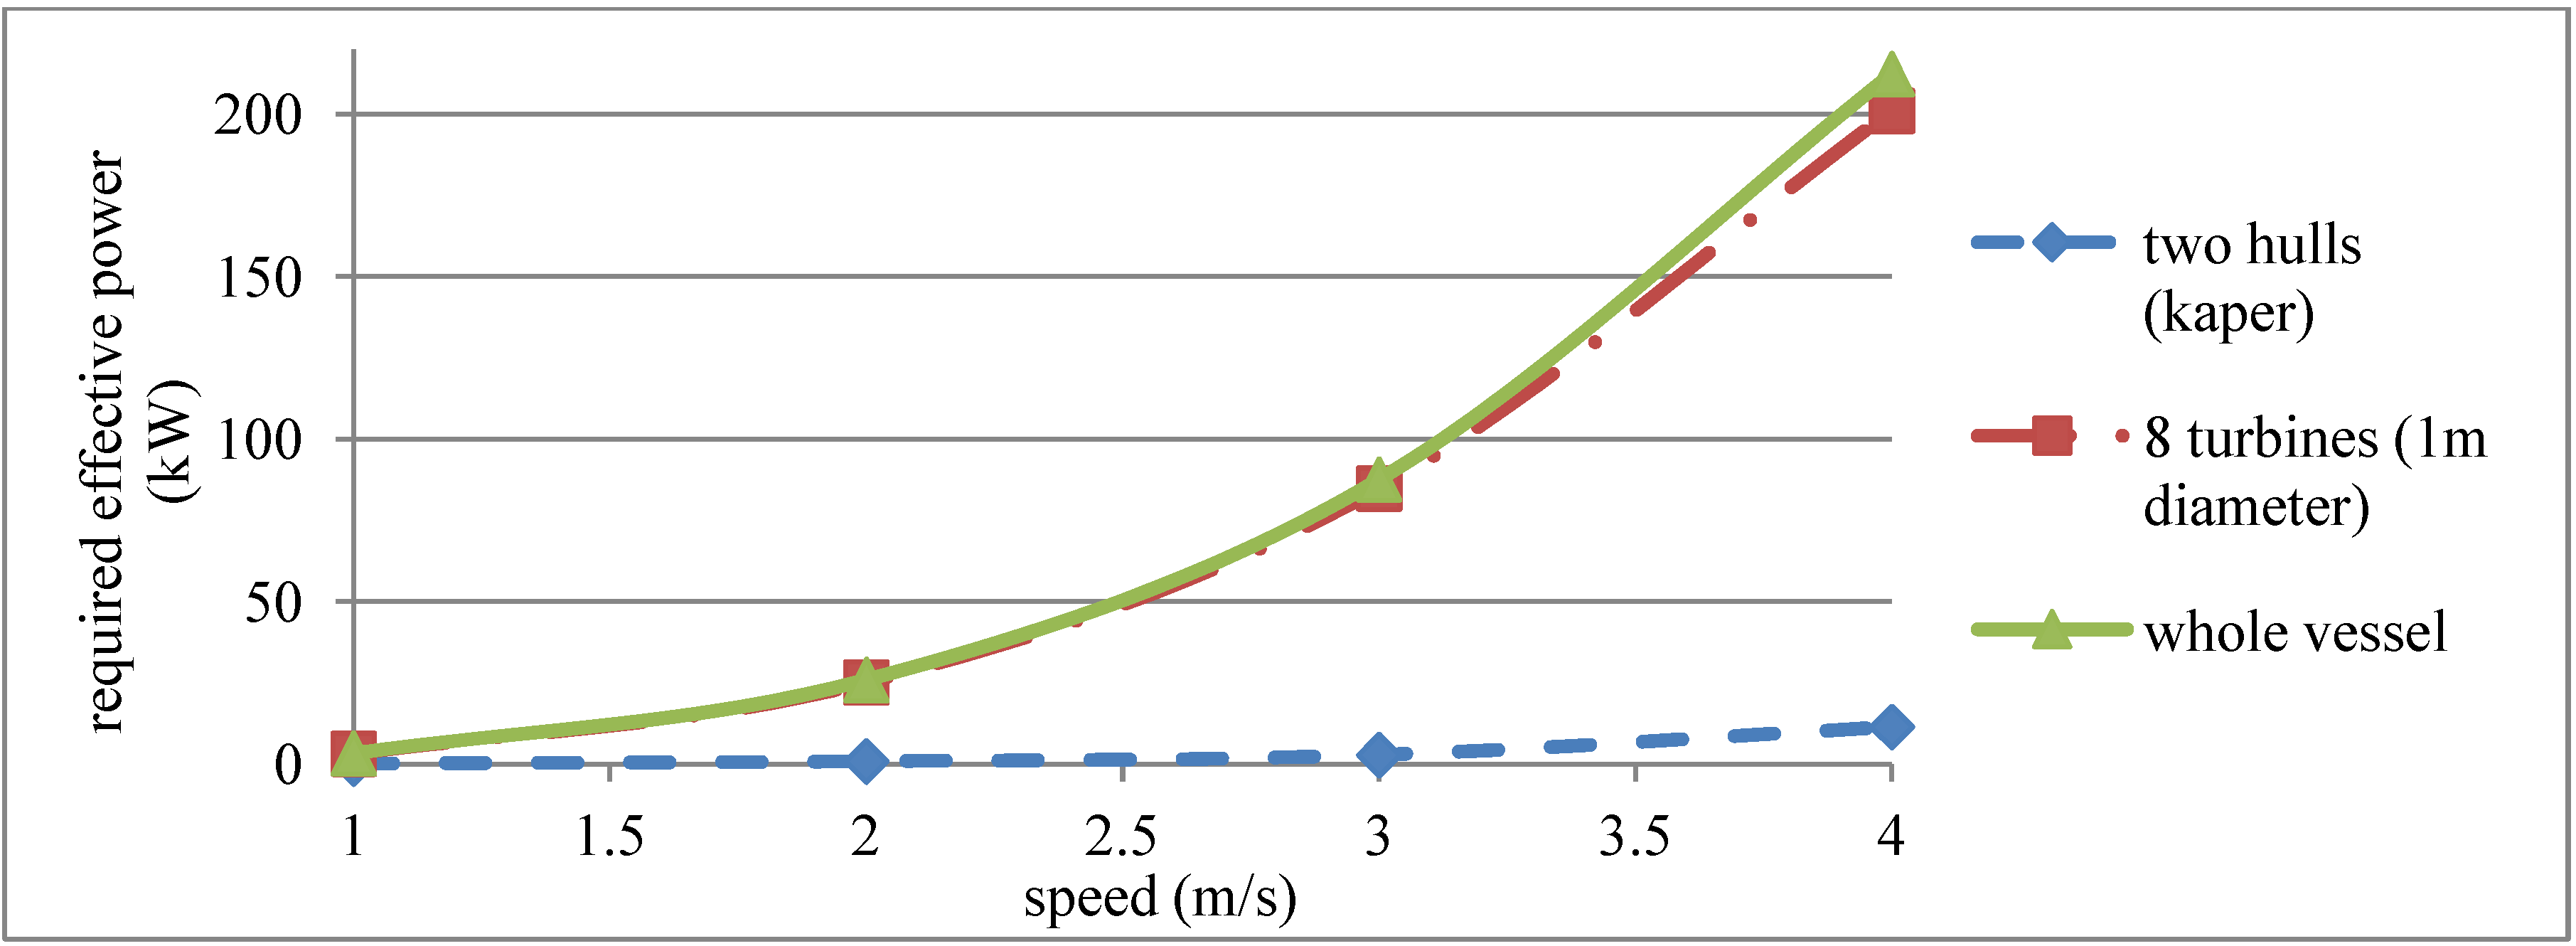
This graph is very important for the whole testing vessel concept, because it shows that hull shape plays a minor role in determining propulsion power. Instead of trying to reduce its resistance, the next designs of the hull could be more focused on optimization from other points of view. Not all power developed by the propulsion source is used for moving the vessel; a large portion is lost due to propulsion inefficiency. It is assumed that propulsion efficiency in this case is 0.5 [25], which means the true propulsion power required is double that of the effective power.
The choice of maximum testing speed seems reasonable; otherwise the required true propulsion power becomes huge. For 2 m/s, the effective power needed is 35 horse power (HP) and for true propulsion power should be at least 70 HP (see Table 4). In the future it will be necessary to evaluate maneuverability and sea keeping of the vessel. Uneven loads on turbines could make it difficult to maintain straight heading.
| Vessel speed (m/s) | True power required (kW) | True power required (HP) |
|---|---|---|
| 1 | 6.7 | 9 |
| 2 | 52.2 | 70 |
| 3 | 176 | 236 |
| 4 | 425 | 570 |
6. Conclusions
This paper aims to evaluate the feasibility of a novel testing facility for an array of tidal devices. To avoid the limitations of the towing tank, tests will be performed in a large lake or calm seas with a testing vessel, which will tow devices through still water while their performance and loading is measured. The testing facility was designed to best suit horizontal axis tidal turbines, although it can accommodate other types as well. Special attention was paid to scaling issues to ensure that results from the tested models will be adaptable to full scale devices. A turbine with a 1 m diameter and flow speed range of 1–2 m/s should fulfill the experimental requirements.
Two dimensional CFD simulations using the actuator disc method suggest that eight turbines placed in a staggered shape could be an appropriate testing configuration. It was assumed that the middle turbine in the last row resembles the behavior of a member of a large array. Simulations with chosen array shapes were repeated at different spacing to find the configuration with optimal power density.
Analysis of the simplified vessel model was done using the finite elements method. Resistance of the hull was calculated with empirical formulae and it was found to be negligible compared to the resistance of the tested turbine; therefore optimization of the hull shape is of lesser importance. Vessel propulsion power was estimated and it was found that turbine size and speed determined by scaling methods are also reasonable from a propulsion point of view.
To improve the design and refine the analysis, the next steps are proposed:
- Repeat CFD simulation of the tidal turbine array in 3D, considering even more realistic simulation settings, including free surface effects, and determine the minimum distance between the hull and tested turbines in order to avoid unwanted interactions;
- Perform thorough structural dynamics and hydrodynamics analyses in order to produce an even more realistic design of the vessel and the interaction of its individual components;
- Instrumentation and other experimental equipment should be determined;
- Determination of possible testing locations (lake, sea or both), define relevant operational conditions and possible experiments that could be performed on the facility. Review relevant legislation and planning of the commissioning process;
- Perform a thorough techno-economic analysis deriving the optimum scale range of tidal devices that the facility can accommodate.
Conflict of Interest
The authors declare no conflict of interest.
References
- Carbon Thrust. In Accelerating Marine Energy: The Potential for Cost Reduction—Insights from the Carbon Trust Marine Energy Accelerator; Carbon Thrust: London, UK, 2011.
- Bahaj, A.S. Generating electricity from the oceans. Renew. Sustain. Energy Rev. 2011, 15, 3399–3416. [Google Scholar] [CrossRef]
- Delorm, T.M.; Zappala, D.; Tavner, P.J. Tidal stream device reliability comparison models. J. Risk Reliab. 2012, 226, 6–17. [Google Scholar]
- Bianchi, F.D.; Battista, H.; Mantz, R.J. Wind Turbine Control Systems: Principles, Modelling and Gain Scheduling Design; Springer: Berlin, Germany, 2007. [Google Scholar]
- Turnock, S.R.; Phillips, A.B.; Banks, J.; Nicholls-Lee, R. Modelling tidal current turbine wakes using a coupled RANS-BEMT approach as a tool for analysing power capture of arrays of turbines. Ocean Eng. 2011, 38, 1300–1307. [Google Scholar] [CrossRef]
- Mason-Jones, A.; O’Dohtery, D.M.; Morris, C.E.; O’Dohtery, T.; Byrne, C.B.; Prickett, P.W.; Grosvenor, R.I.; Owen, I.; Tedds, S.; Poole, R.J. Non-dimensional scaling of tidal stream turbines. Energy 2012, 44, 820–829. [Google Scholar] [CrossRef]
- International Towing Tank Conference: Catalogue of Facilities. Available online: http://ittc.sname.org/Catalogue%20of%20facilities/index.pdf (accessed on 20 August 2012).
- Kinsey, T.; Dumas, G.; Lalande, G.; Ruel, J.; Mehut, A.; Viarouge, P.; Lemay, J.; Jean, Y. Prototype testing of a hydrokinetic turbine based on oscillating hydrofoils. Renew. Energy 2011, 36, 1710–1718. [Google Scholar] [CrossRef]
- Kirke, B.K. Tests on ducted and bare helical and straight blade Darrieus hydrokinetic turbines. Renew. Energy 2011, 36, 3013–3022. [Google Scholar] [CrossRef]
- Rose, S.; Good, A.; Atcheson, M.; Hamill, G.; Johnstone, C.; MacKinnon, P.; Robinson, D.; Grant, A.; Whittaker, T. Investigating Experimental Techniques for Measurement of the Downstream Near Wake of a Tidal Turbine. In Proceedings of the 9th European Wave and Tidal Energy Conference, Southampton, UK, 4–9 September 2011.
- Coiro, D.P.; Scherillo, F.; Familio, R.; Maisto, U.; Troise, G. Experimental Test Campaign on an Innovative Device to Harness Clean Energy from Tidal and River Current. In Proceedings of the International Conference on Clean Electrical Power, Capri, Italy, 9–11 June 2009.
- Crespo, A.; Hernandez, J.; Frandsen, S. Survey of modelling methods for wind turbine wakes and wind farms. Wind Energy 1999, 2, 1–24. [Google Scholar] [CrossRef]
- Dabiri, J.O. Potential order-of-magnitude enhancement of wind farm power density via counter-rotating vertical-axis wind turbine arrays. J. Renew. Sustain. Energy 2011, 3, 1–12. [Google Scholar] [CrossRef]
- Sun, X.; Chick, J.P.; Bryden, I.G. Laboratory-scale simulation of energy extraction from tidal currents. Renew. Energy 2008, 33, 1267–1274. [Google Scholar] [CrossRef]
- Harrison, M.E.; Batten, W.M.J.; Myers, L.E.; Bahaj, A.S. Comparison between CFD simulations and experiments for predicting the far wake of horizontal axis tidal turbines. IET Renew. Power Gener. 2010, 4, 613–627. [Google Scholar] [CrossRef]
- Harrison, M.E.; Batten, W.M.J.; Bahaj, A.S. A Blade Element Actuator Disc Approach Applied to Tidal Stream Turbines. In Proceedings of the OCEANS 2010, Seattle, WA, USA, 20–23 September 2010.
- Bai, L.; Spence, R.R.G. Investigation of the Influence of Array Arrangement and Spacing on Tidal Energy Converter (TEC) Performance Using a 3-Dimensional CFD Model. In Proceedings of the 8th European Wave and Tidal Conference, Uppsala, Sweden, 7–10 September 2009.
- Churchfield, M.J.; Li, Y.; Moriarty, P.J. A Large-Eddy Simulation Study of Wake Propagation and Power Production in an Array of Tidal-Current Turbines. In Proceedings of the 9th European Wave and Tidal Energy Conference, Southampton, UK, 4–9 September 2011.
- Myers, L.E.; Bahaj, A.S. Experimental analysis of the flow field around horizontal axis tidal turbines by use of scale mesh disk rotor simulators. Ocean Eng. 2010, 37, 218–227. [Google Scholar] [CrossRef]
- Myers, L.E.; Bahaj, A.S. An experimental investigation simulating flow effects in first generation marine current energy converter arrays. Renew. Energy 2012, 37, 28–36. [Google Scholar] [CrossRef]
- Bahaj, A.S.; Molland, A.F.; Chaplin, J.R.; Batten, W.M.J. Power and thrust measurements of marine current turbines under various hydrodynamic flow conditions in a cavitation tunnel and a towing tank. Renew. Energy 2007, 32, 407–426. [Google Scholar] [CrossRef]
- Pintar, M. Design of Novel Experimental Configuration for Tidal Arrays. Master’s Thesis, Cranfield University, Cranfield, UK, 2012. [Google Scholar]
- Det Norske Veritas. Classification Notes: CSA-Direct Analysis of Ship Structures, 2013. Available online: http://exchange.dnv.com/publishing/cn/CN34-1.pdf (accessed on 7 August 2013).
- Larsson, L.; Eliasson, R. Principles of Yacht Design, 2nd ed.; McGraw-Hill: New York, NY, USA, 2000. [Google Scholar]
- Schneekluth, H.; Bertram, V. Ship Design for Efficiency and Economy; Butterworth-Heinemann: Oxford, UK, 1998. [Google Scholar]
© 2013 by the authors; licensee MDPI, Basel, Switzerland. This article is an open access article distributed under the terms and conditions of the Creative Commons Attribution license (http://creativecommons.org/licenses/by/3.0/).
Share and Cite
MDPI and ACS Style
Pintar, M.; Kolios, A.J. Design of a Novel Experimental Facility for Testing of Tidal Arrays. Energies 2013, 6, 4117-4133. https://doi.org/10.3390/en6084117
AMA Style
Pintar M, Kolios AJ. Design of a Novel Experimental Facility for Testing of Tidal Arrays. Energies. 2013; 6(8):4117-4133. https://doi.org/10.3390/en6084117
Chicago/Turabian StylePintar, Matevz, and Athanasios J. Kolios. 2013. "Design of a Novel Experimental Facility for Testing of Tidal Arrays" Energies 6, no. 8: 4117-4133. https://doi.org/10.3390/en6084117