Optimum Application of Thermal Factors to Artificial Neural Network Models for Improvement of Control Performance in Double Skin-Enveloped Buildings

Abstract
:1. Introduction


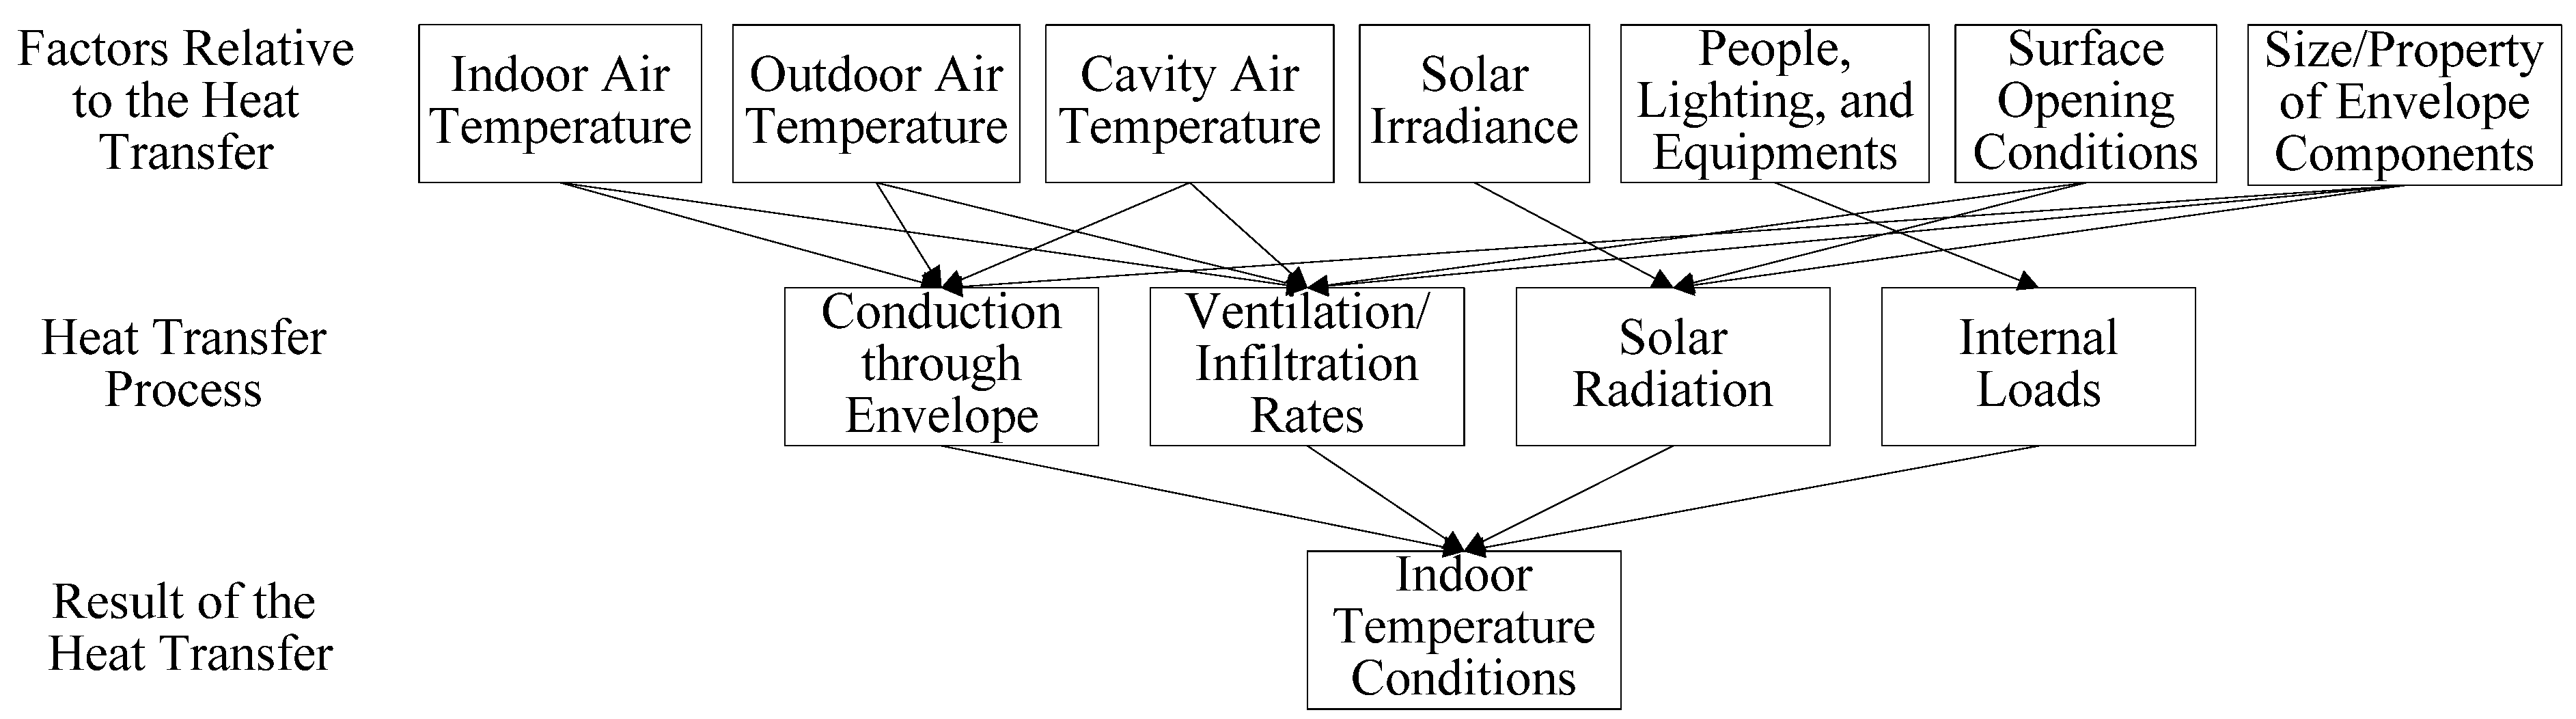
2. Determination of Relationships between Thermal Factors
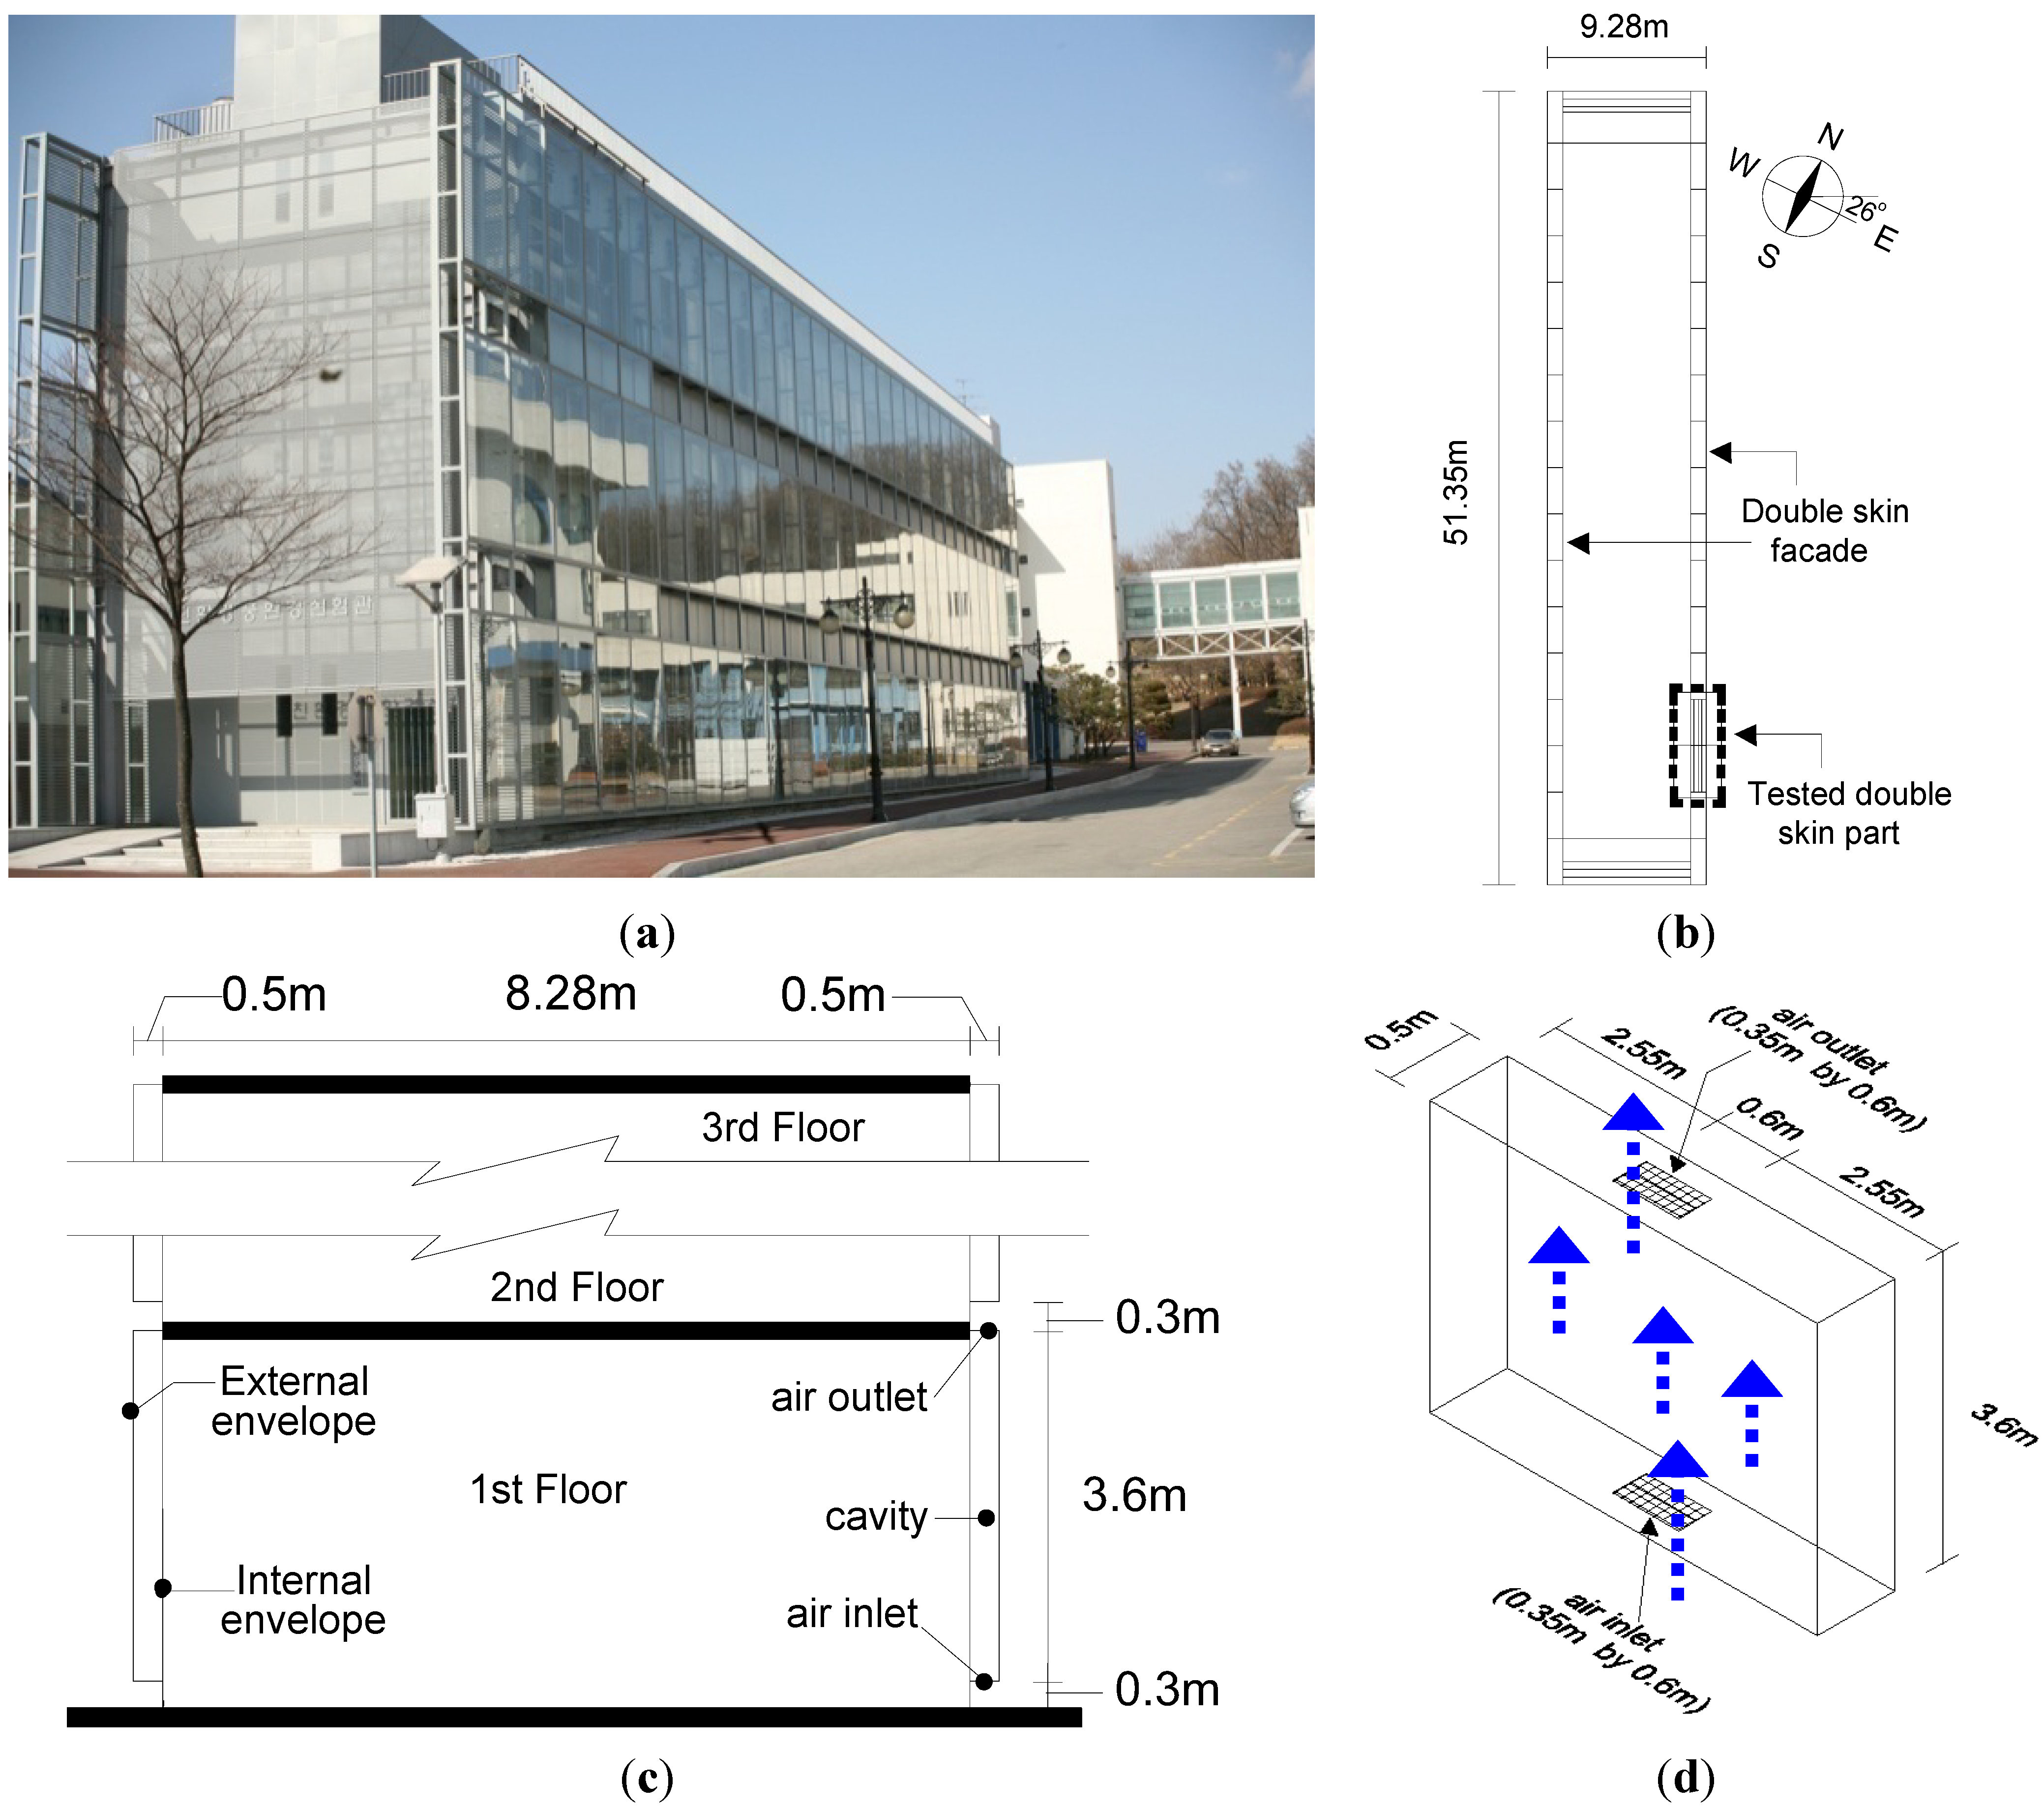
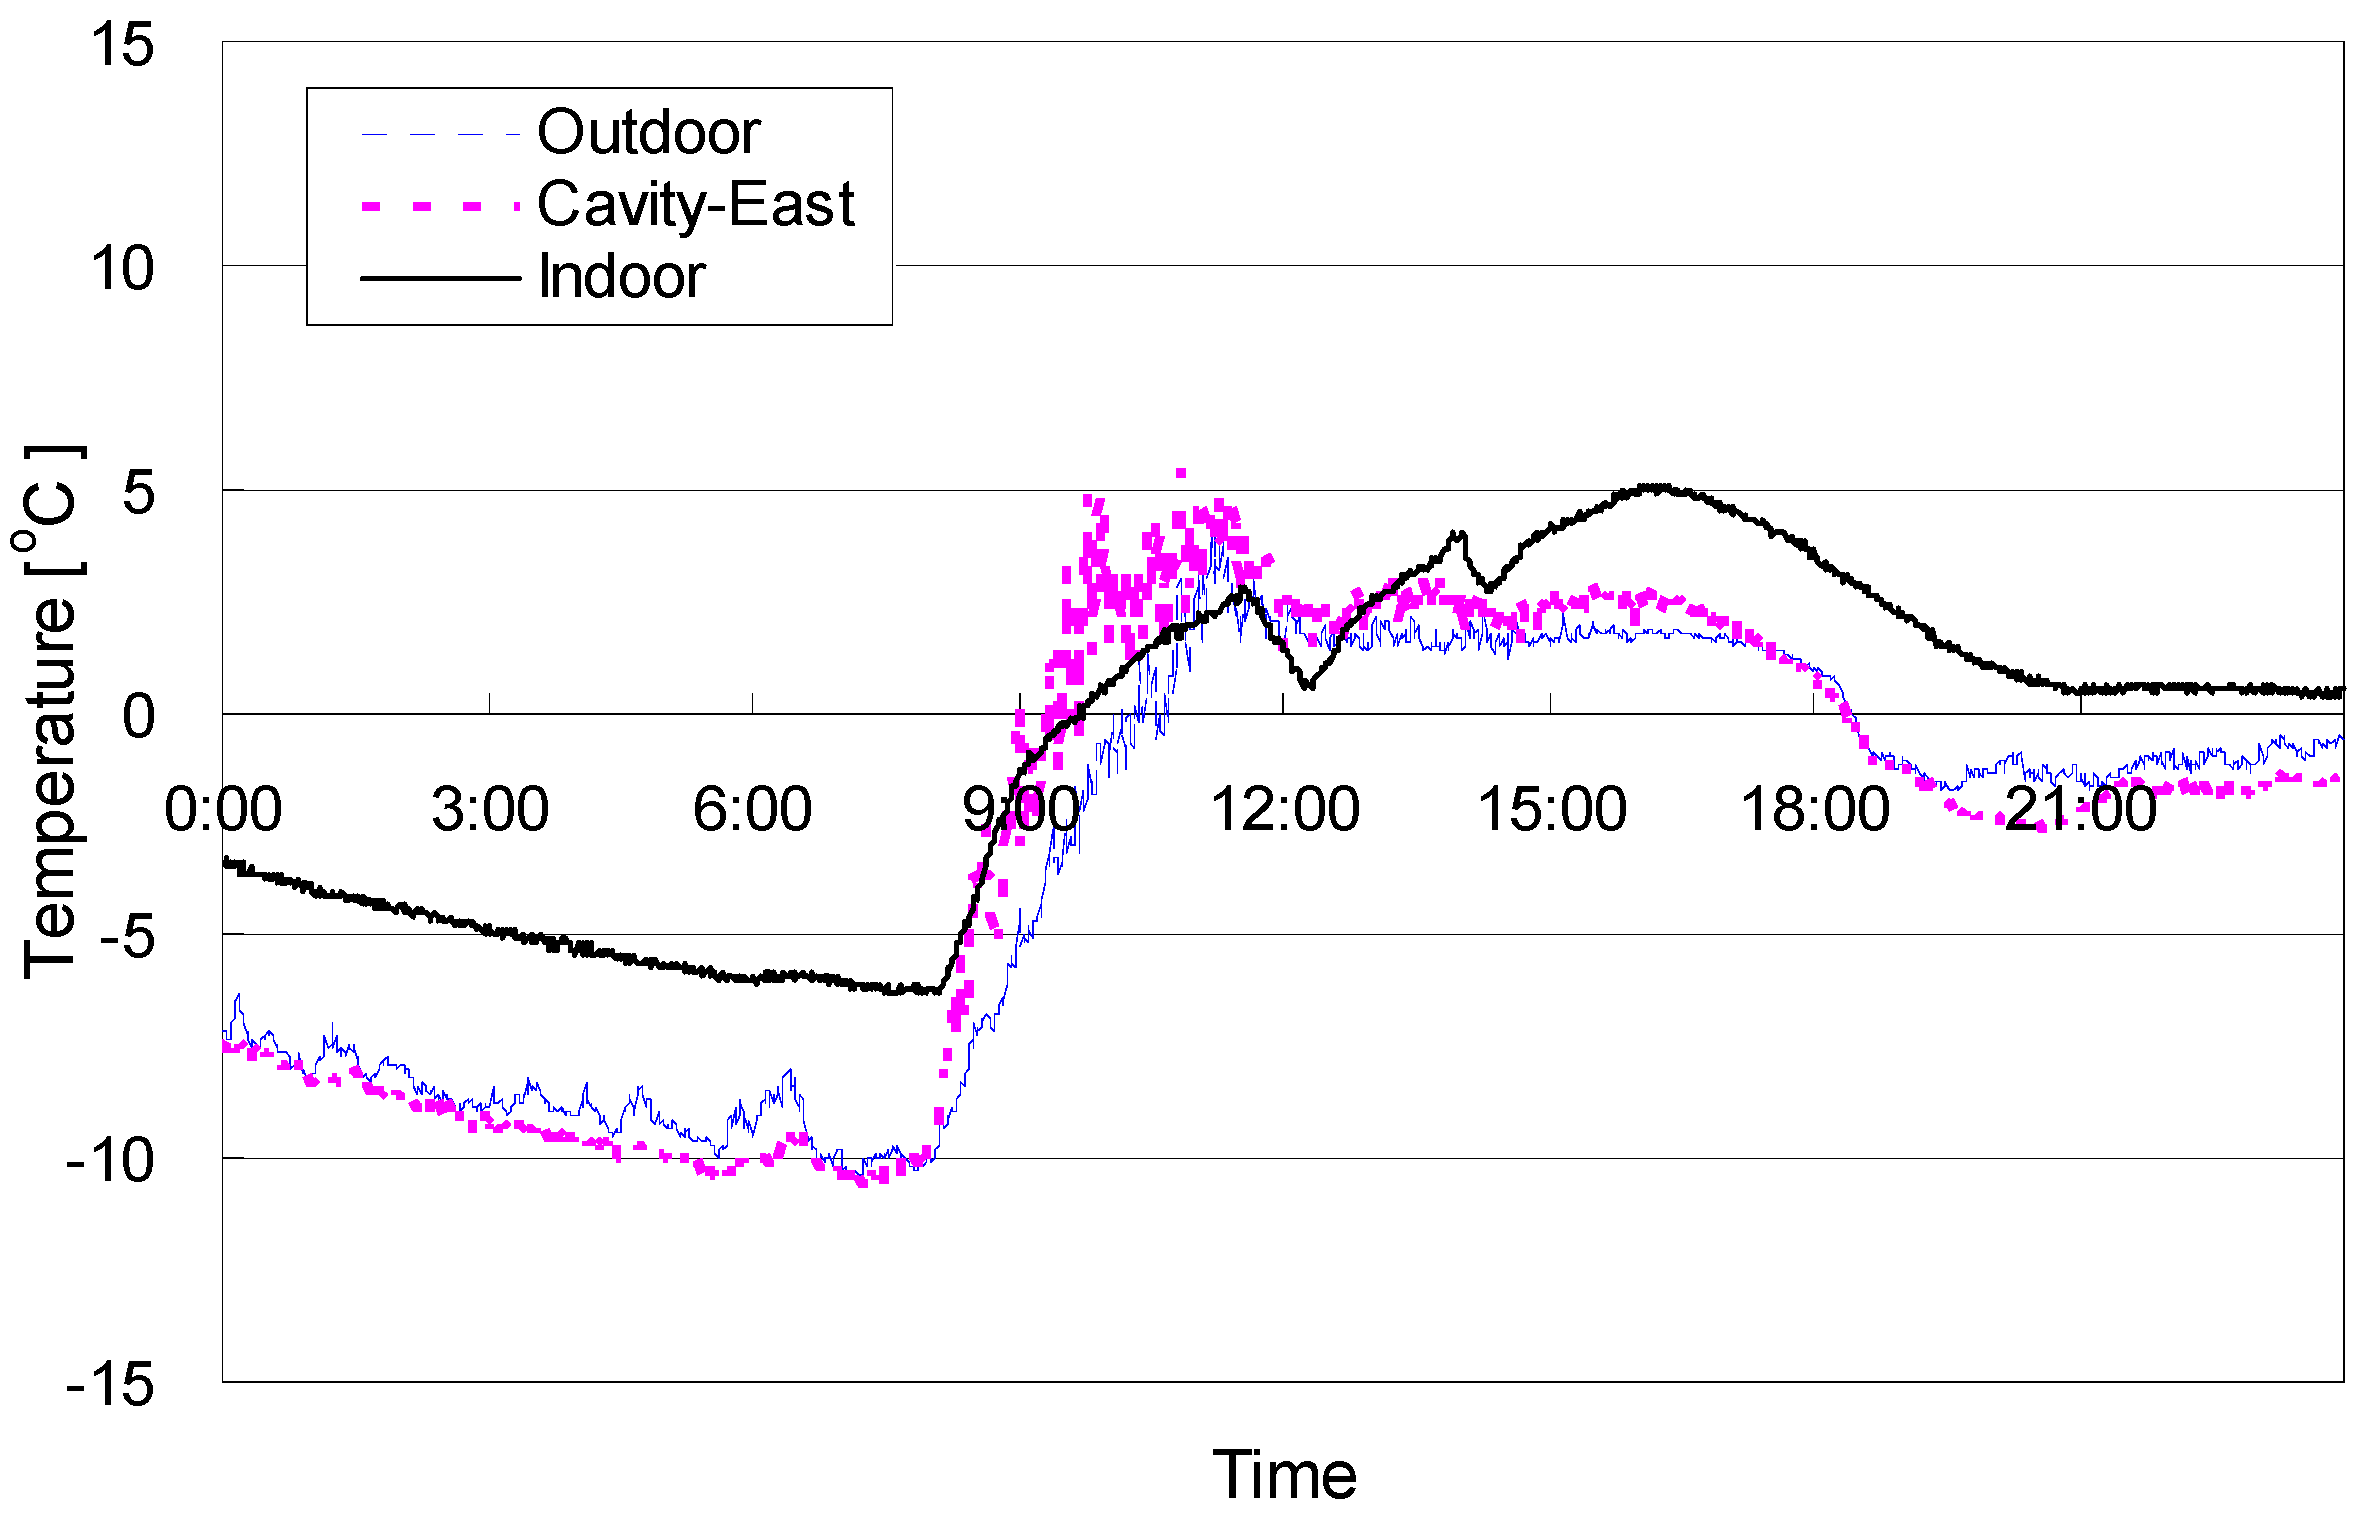
2.1. Field Measurement Conditions
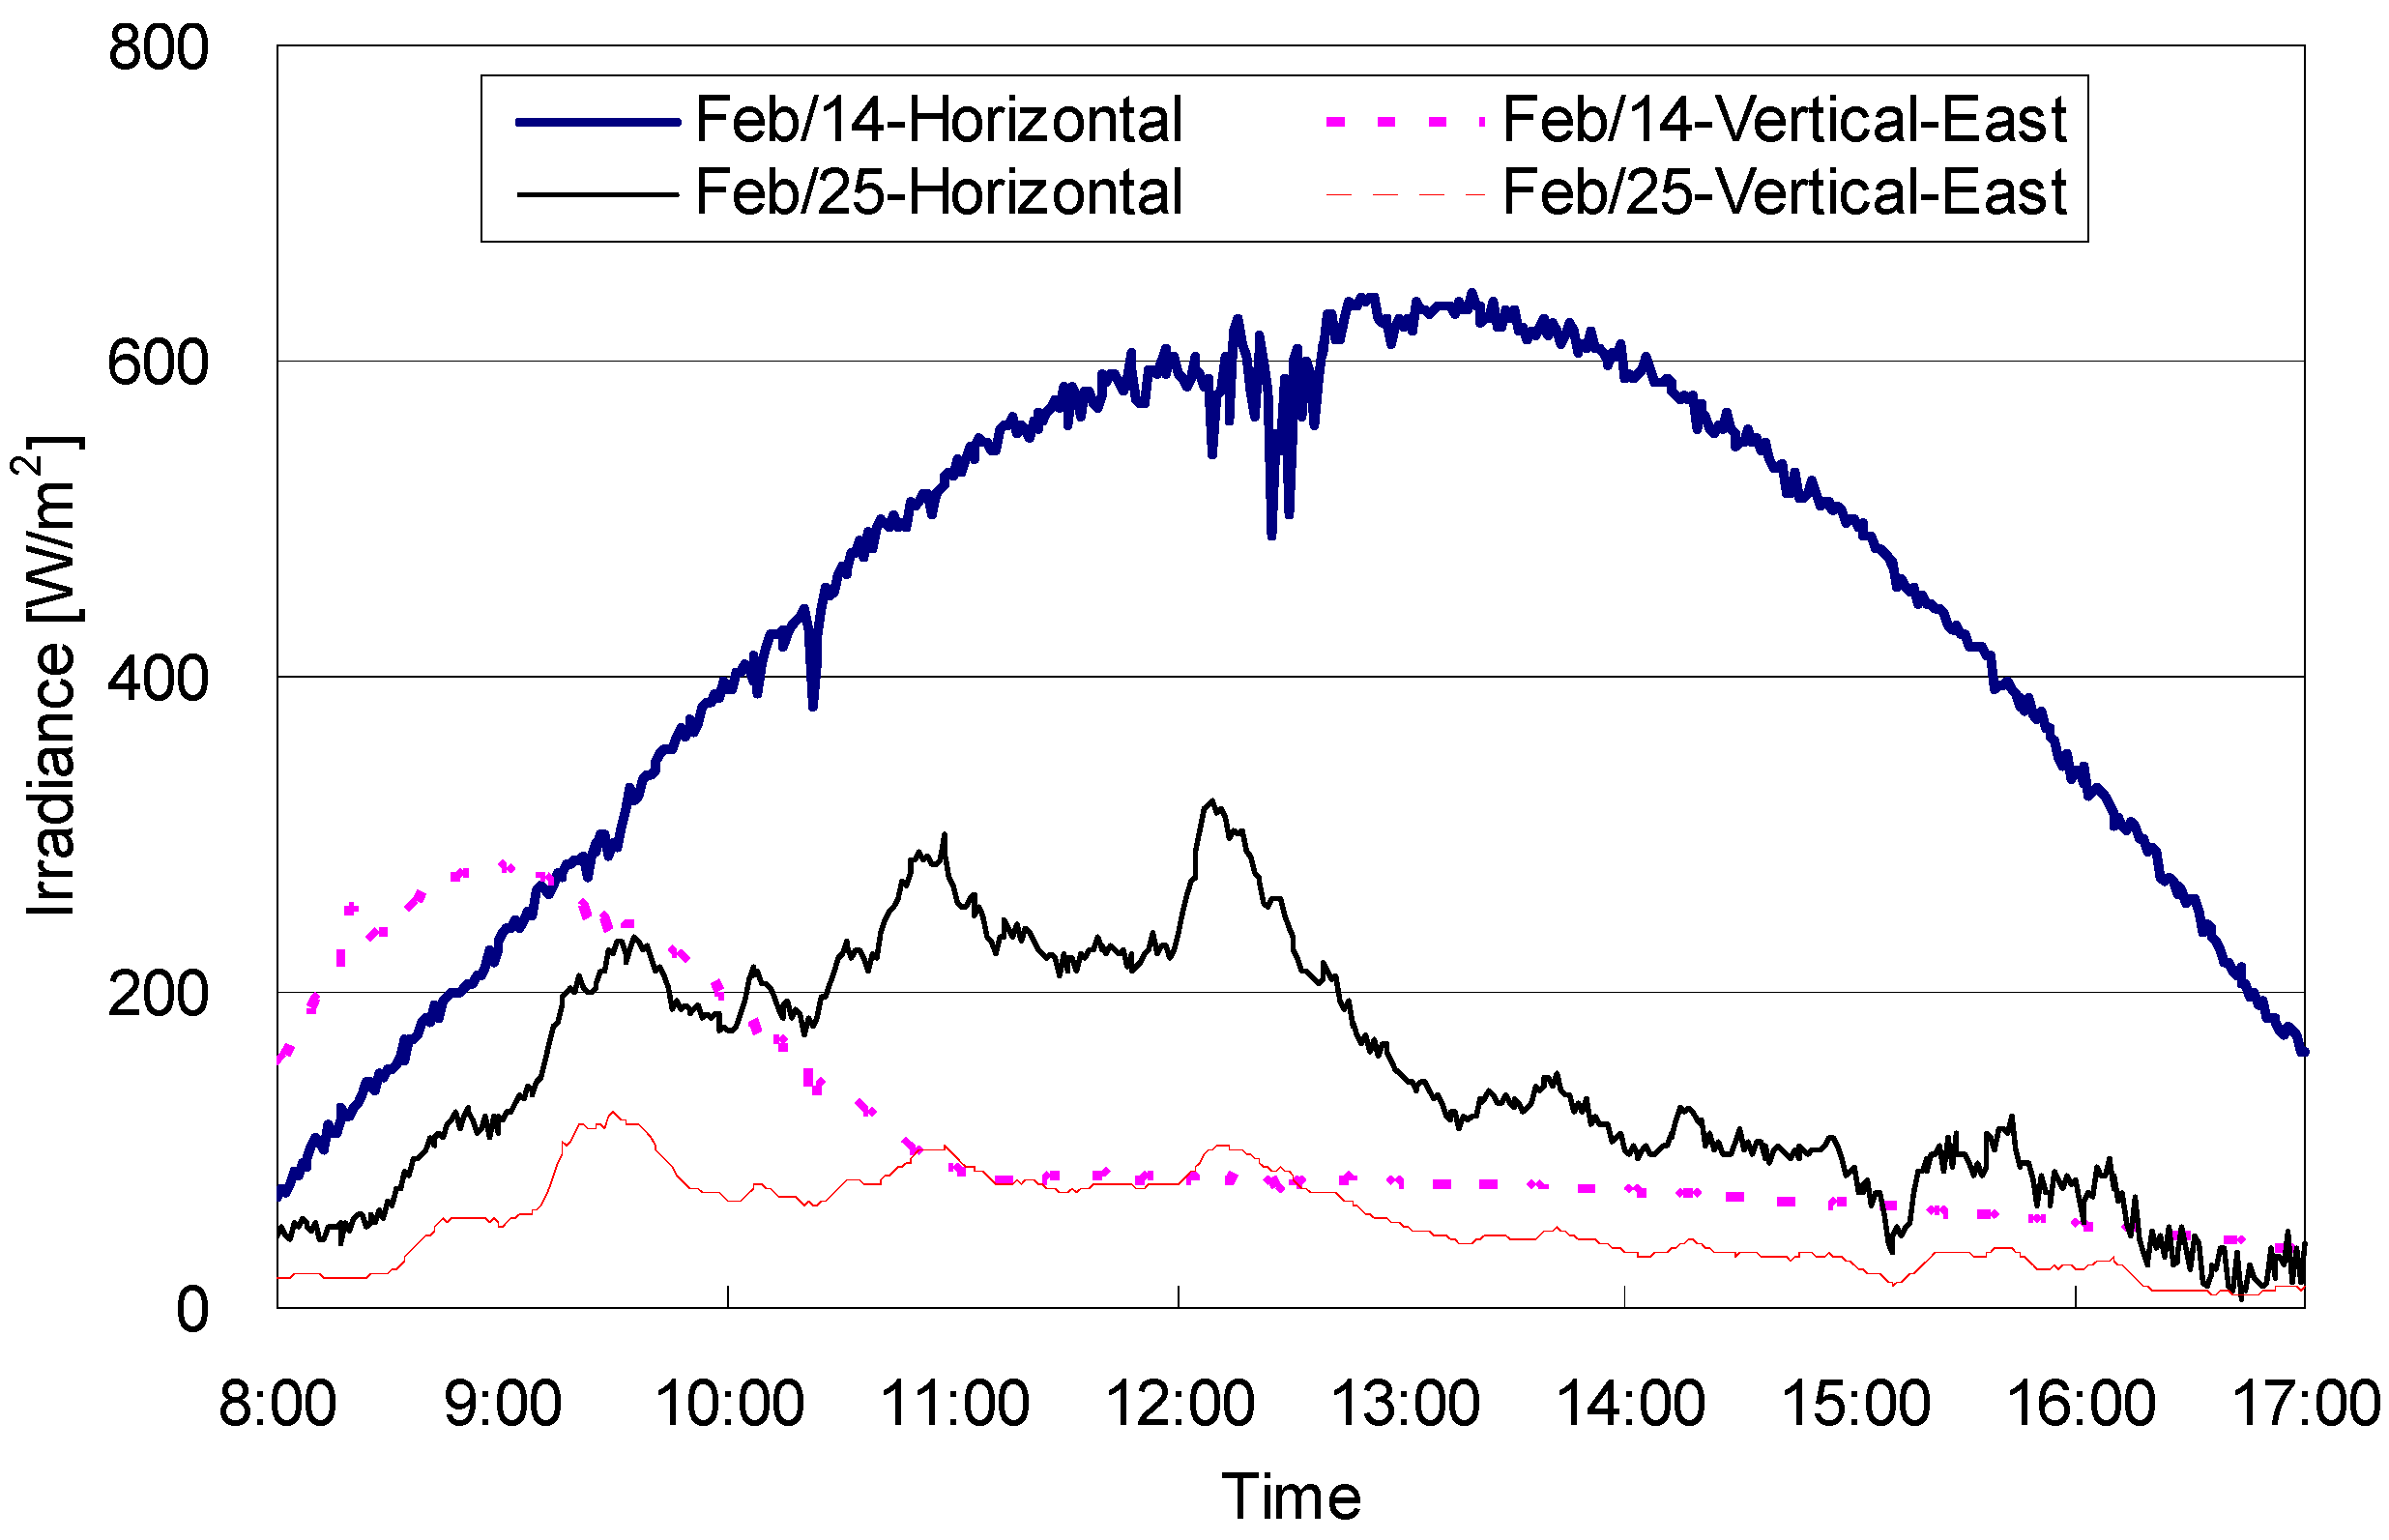
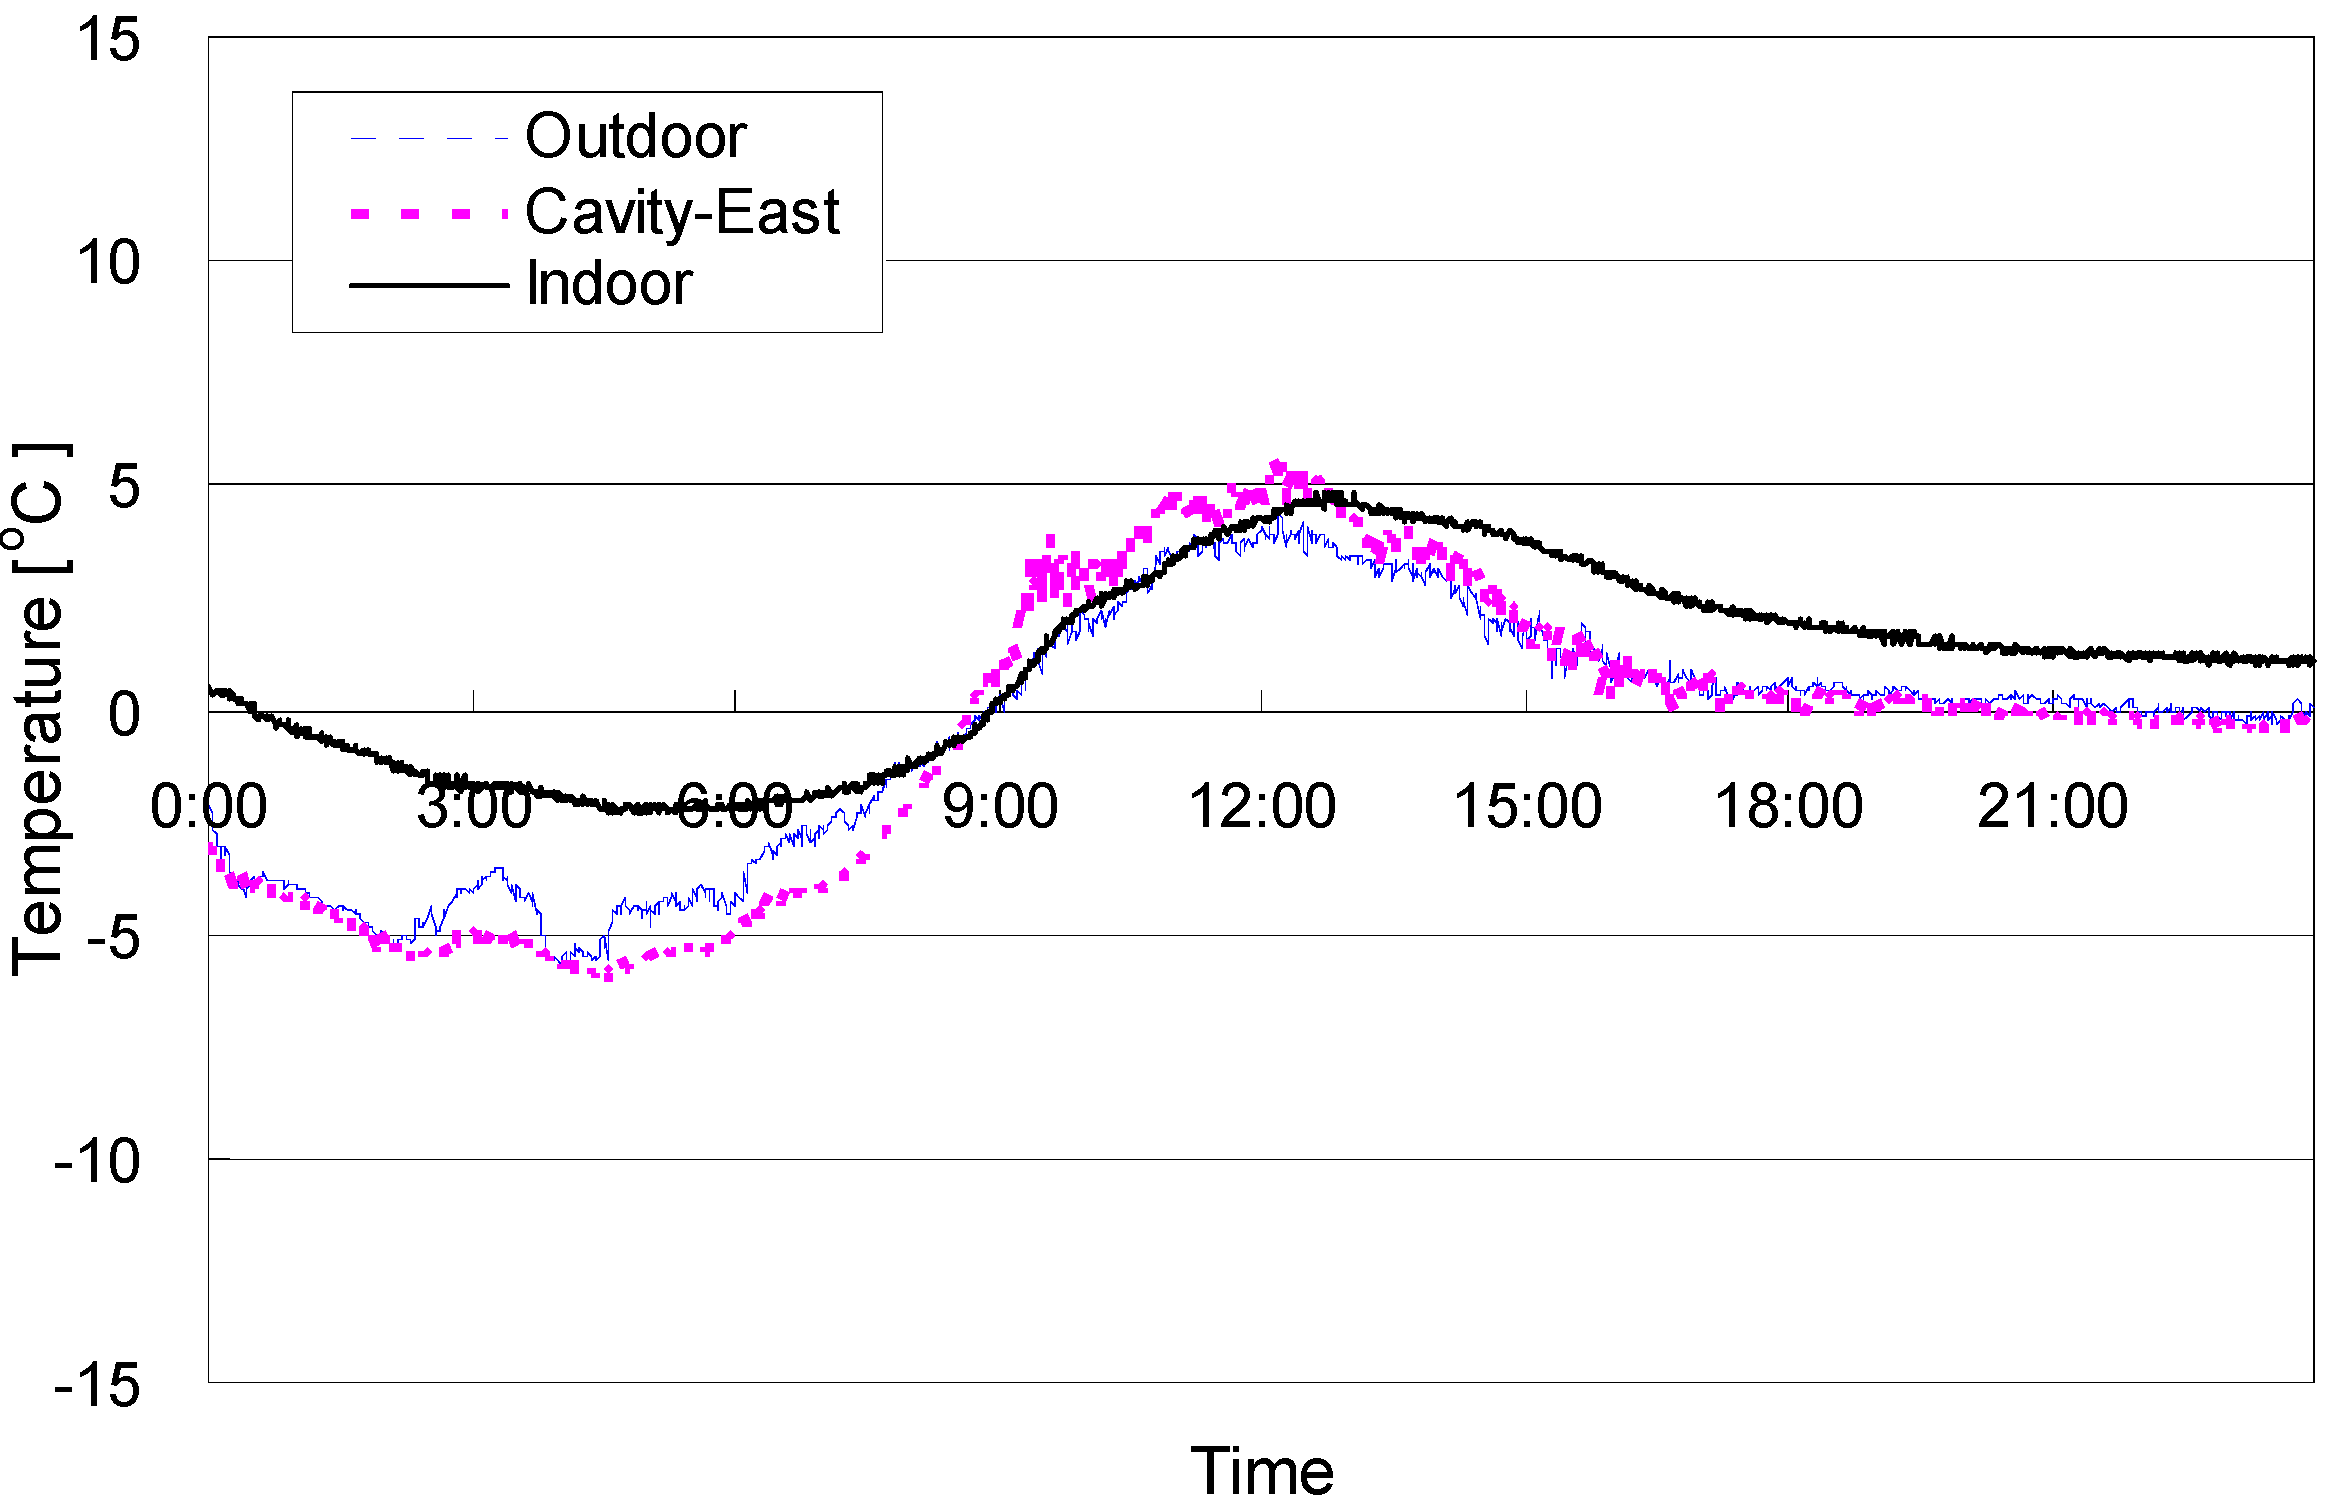
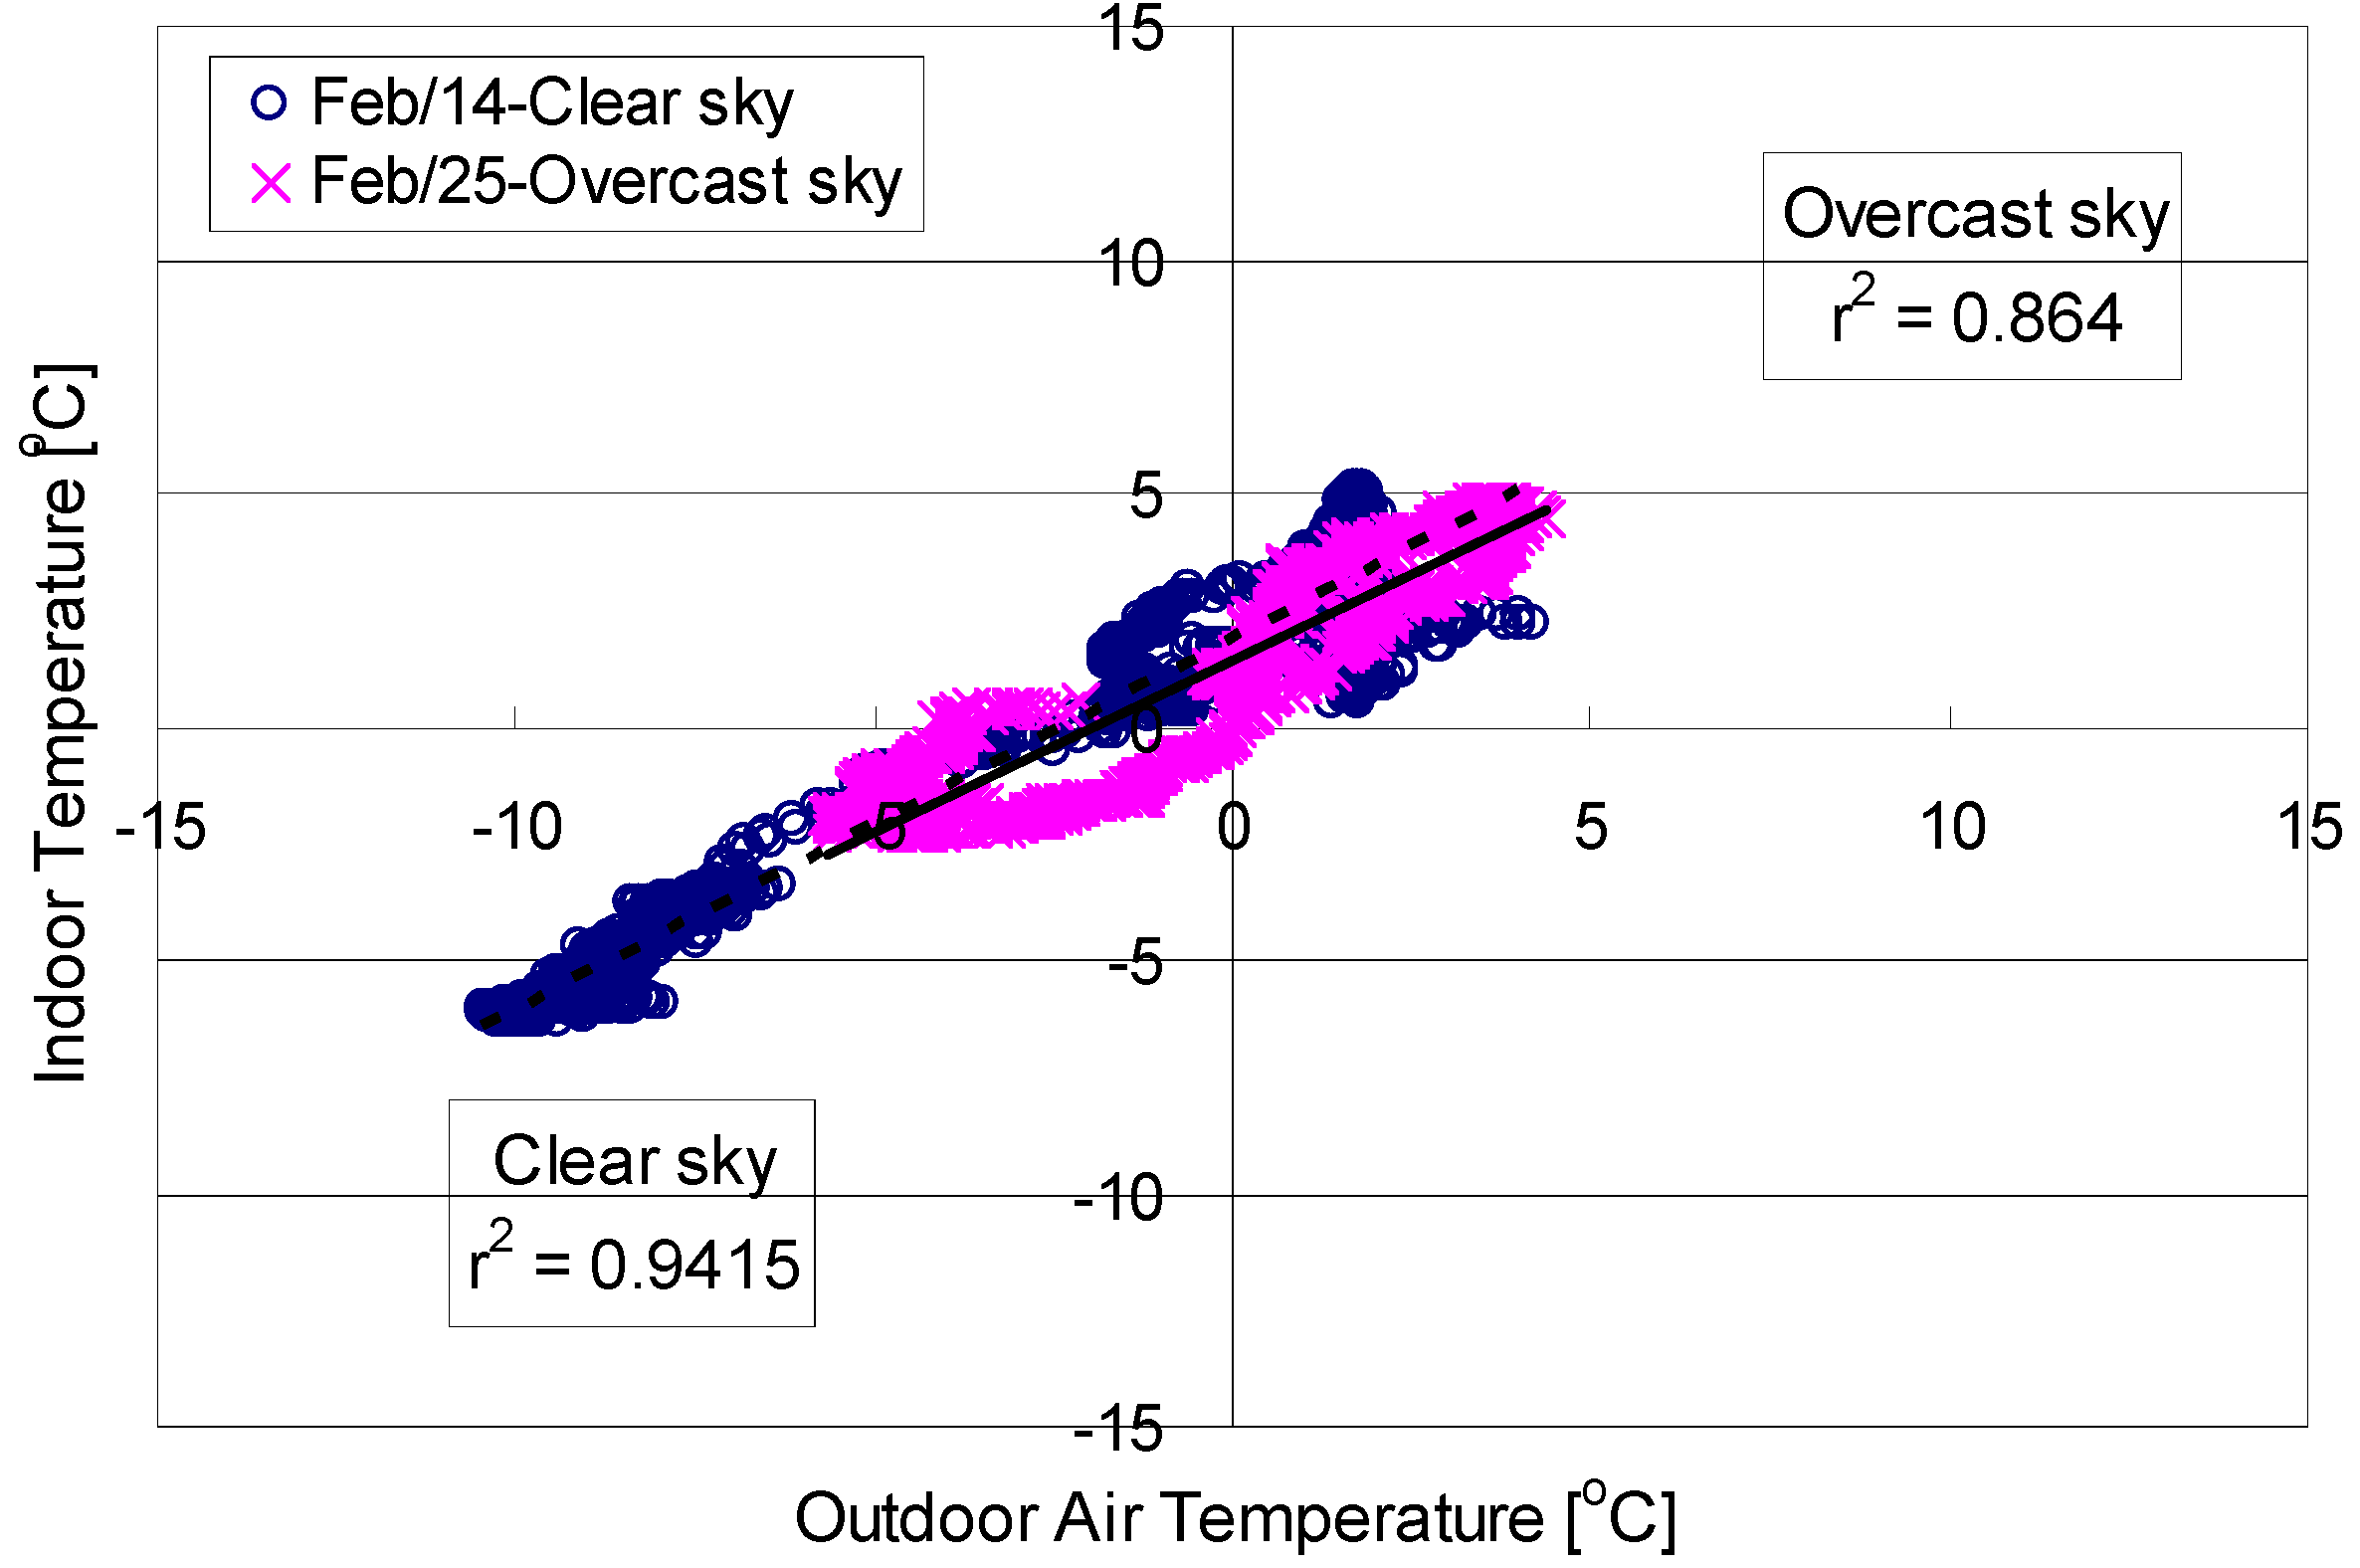
2.2. Relationship among Thermal Factors Based on Field Measurement


| Sky | Factor | Variables in model | Unstandardized coefficients | t | Sig. | r2 | ANOVA | |
|---|---|---|---|---|---|---|---|---|
| B | Std. Error | |||||||
| Clear | Irradiance | (Constant) | 3.1414 | 0.06 | 54.73 | 0.00 | 0.0853 | F(1,8815) = 821.76, Sig. = 0.00 |
| VA | −0.0140 | 0.00 | −28.67 | 0.00 | ||||
| Outdoor air | (Constant) | −0.5430 | 0.02 | −24.78 | 0.00 | 0.7525 | F(1,8815) = 26796.74, Sig. = 0.00 | |
| OA | 0.5247 | 0.00 | 163.70 | 0.00 | ||||
| Cavity | (Constant) | 1.1041 | 0.02 | 68.69 | 0.00 | 0.7833 | F(1,8815) = 31817.91, Sig. = 0.00 | |
| CA | 0.8039 | 0.00 | 178.53 | 0.00 | ||||
| Partly cloudy | Irradiance | (Constant) | 4.6924 | 0.12 | 38.40 | 0.00 | 0.0060 | F(1,2850) = 17.15, Sig. = 0.00 |
| VA | −0.0056 | 0.00 | −4.14 | 0.00 | ||||
| Outdoor air | (Constant) | 0.5033 | 0.07 | 7.69 | 0.00 | 0.5802 | F(1,2850) = 3938.55, Sig. = 0.00 | |
| OA | 0.5118 | 0.01 | 62.76 | 0.00 | ||||
| Cavity | (Constant) | 0.8559 | 0.04 | 20.74 | 0.00 | 0.7598 | F(1,2850) = 9015.88, Sig. = 0.00 | |
| CA | 0.7993 | 0.01 | 94.95 | 0.00 | ||||
| Overcast | Irradiance | (Constant) | 3.5199 | 0.07 | 51.79 | 0.00 | 0.0204 | F(1,5408) = 112.80, Sig. = 0.00 |
| VA | −0.0120 | 0.00 | −10.62 | 0.00 | ||||
| Outdoor air | (Constant) | 1.5439 | 0.03 | 58.73 | 0.00 | 0.6221 | F(1,5408) = 8902.67, Sig. = 0.00 | |
| OA | 0.5171 | 0.01 | 94.35 | 0.00 | ||||
| Cavity | (Constant) | 1.2501 | 0.01 | 88.23 | 0.00 | 0.8913 | F(1,5408) = 44334.54, Sig. = 0.00 | |
| CA | 0.7265 | 0.00 | 210.56 | 0.00 | ||||

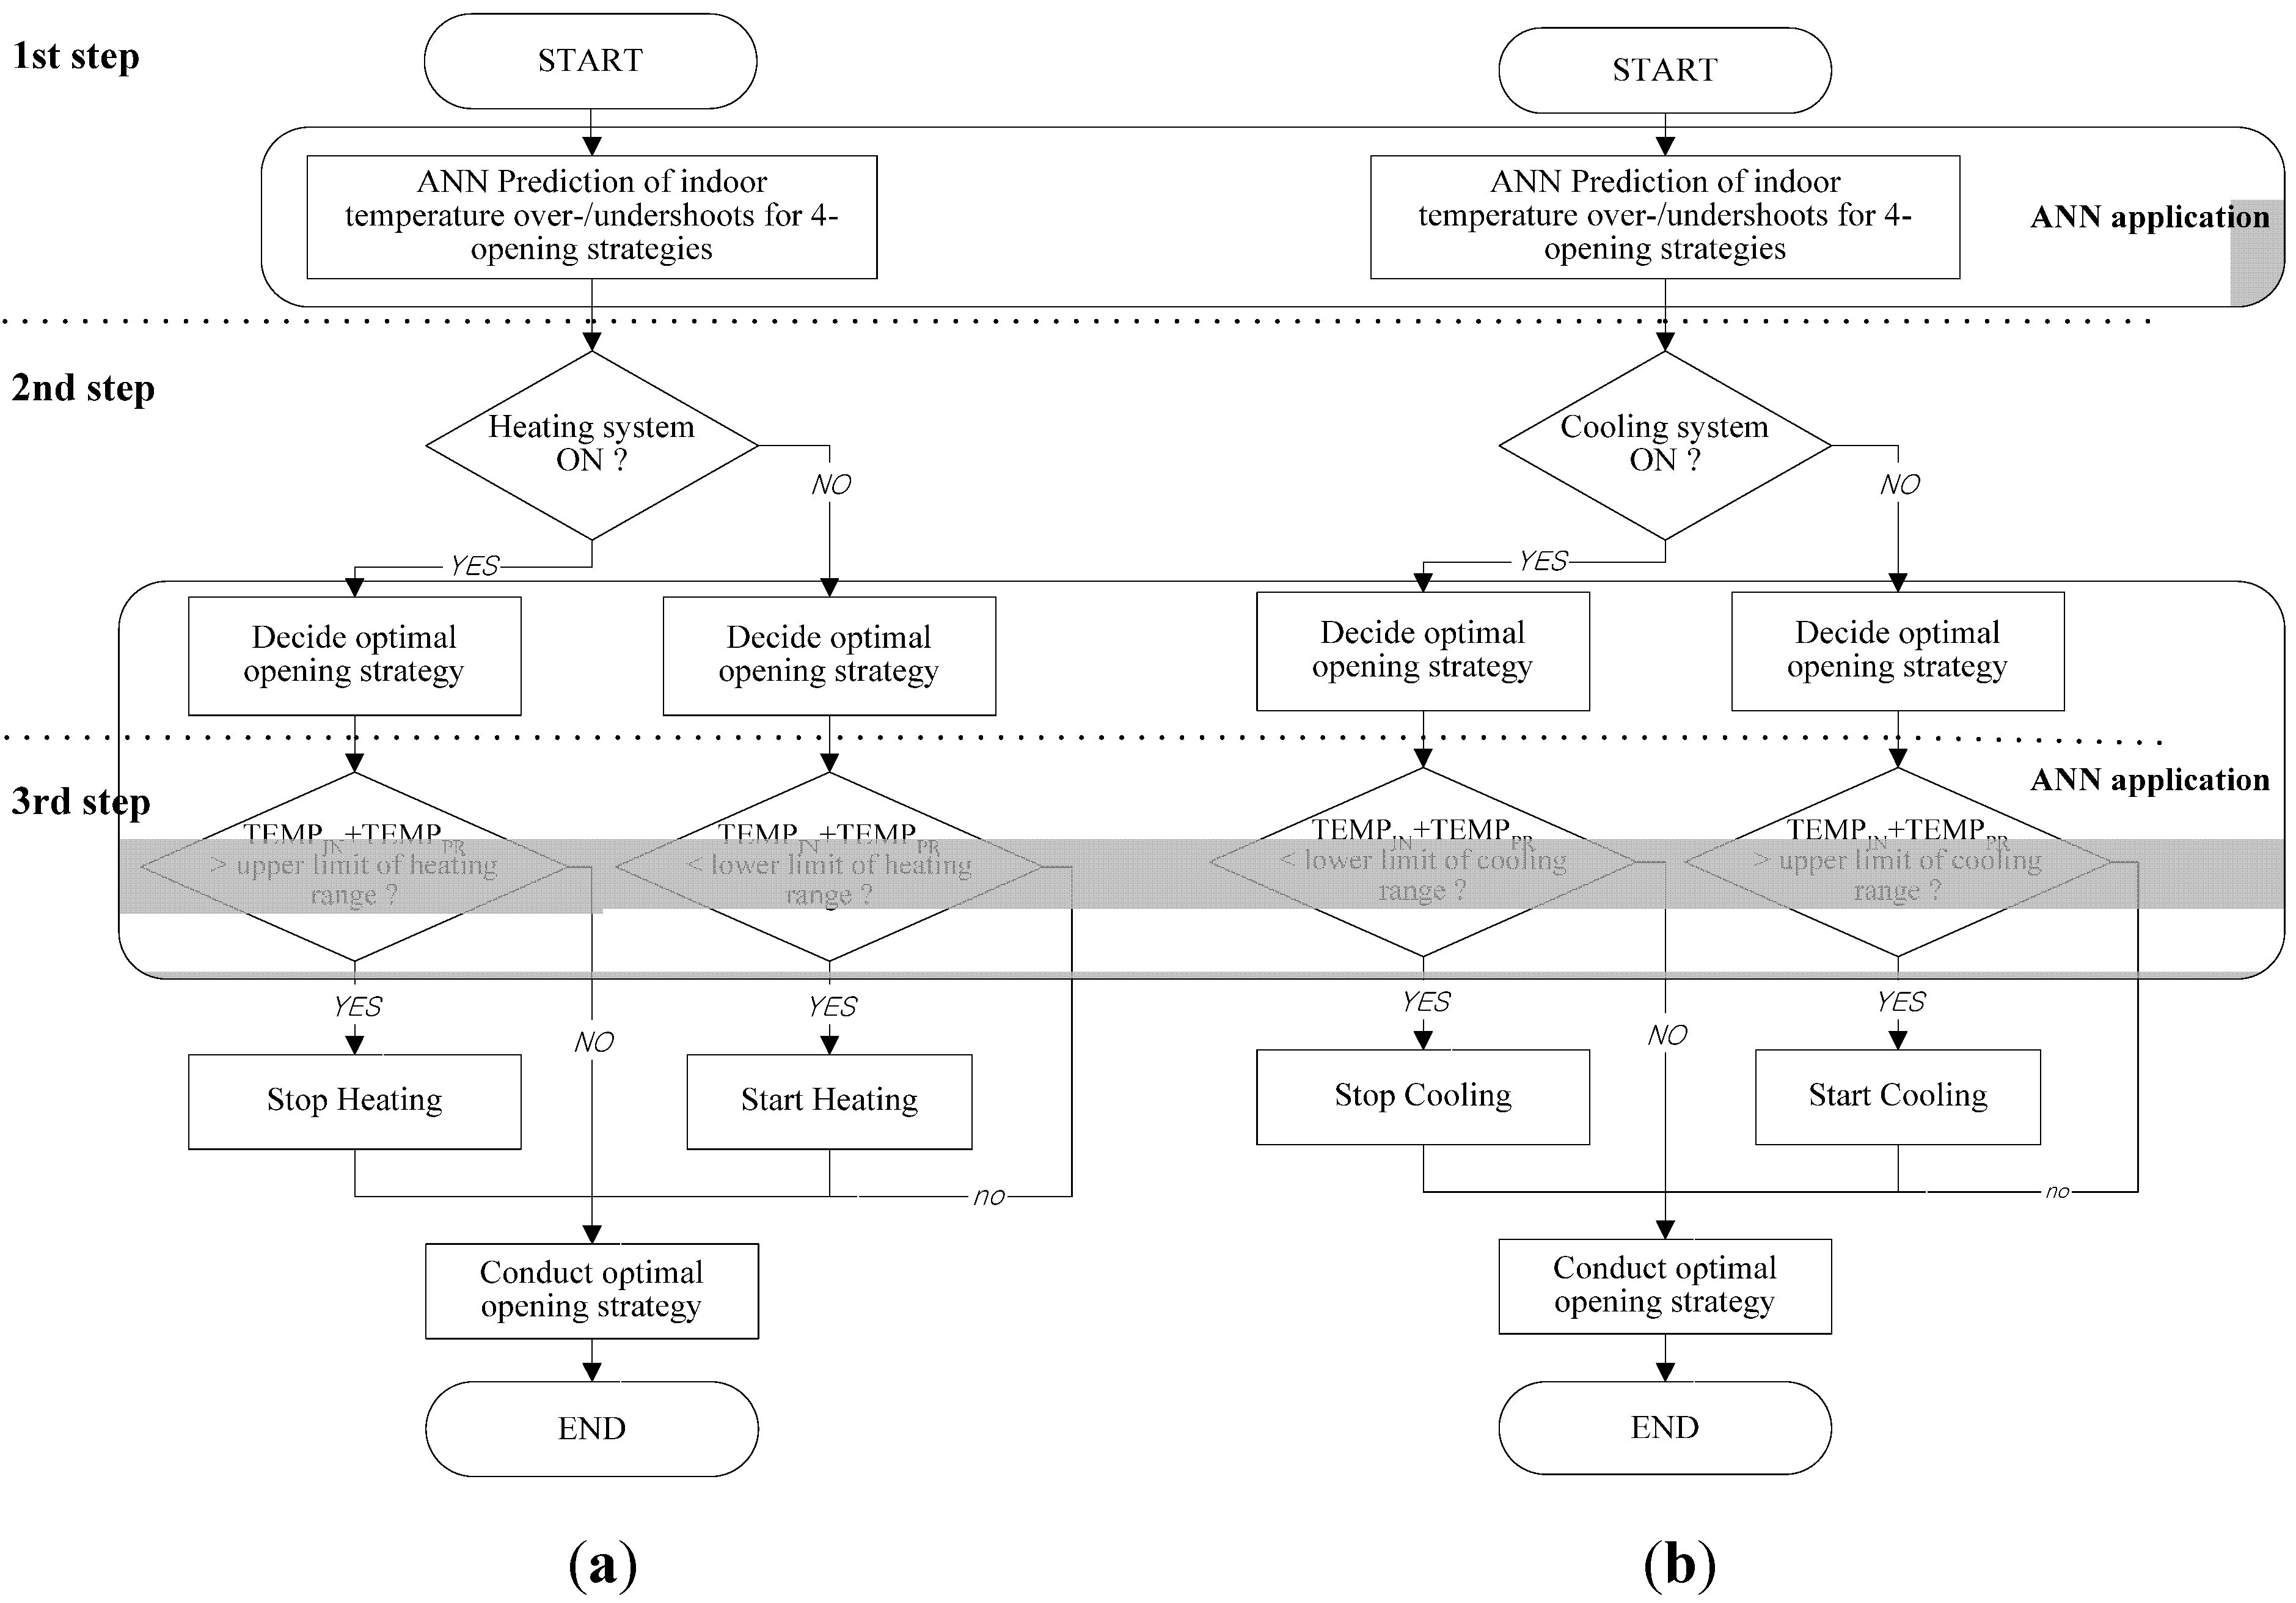
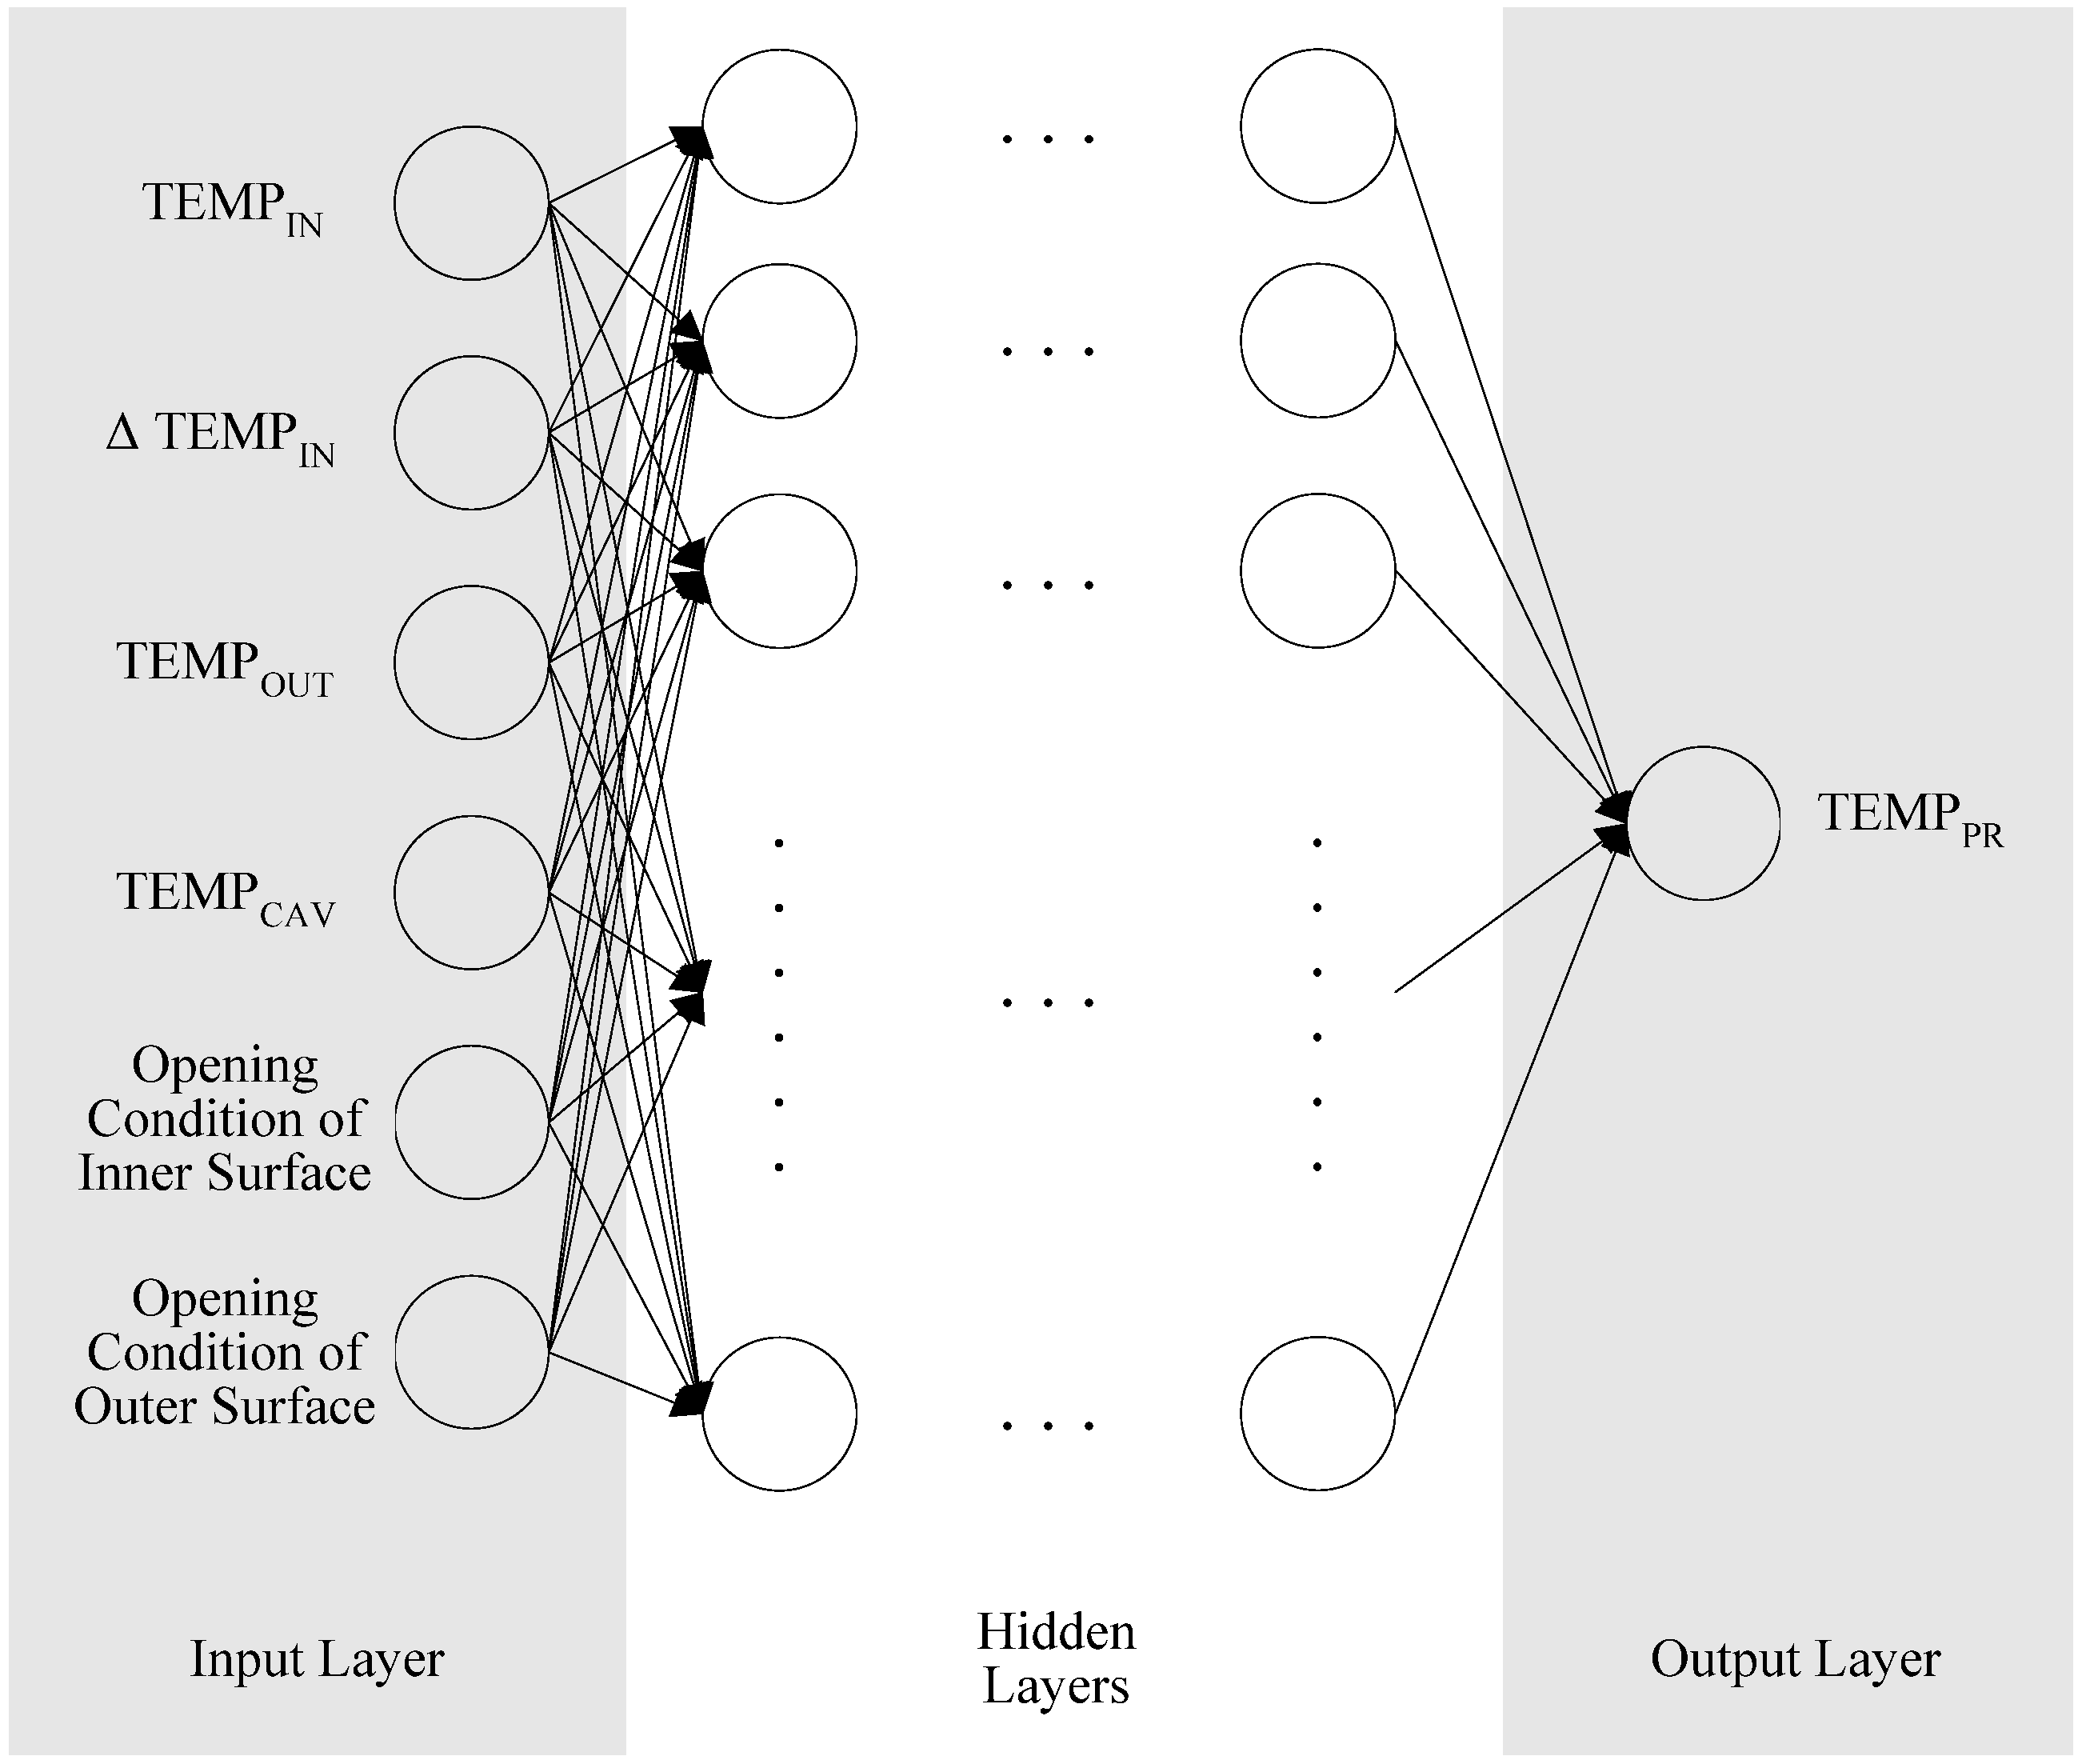
3. Development of a New ANN Model

4. Optimization of the New ANN Model
5. Performance Tests of the Optimized ANN Model
5.1. Description of the Performance Tests
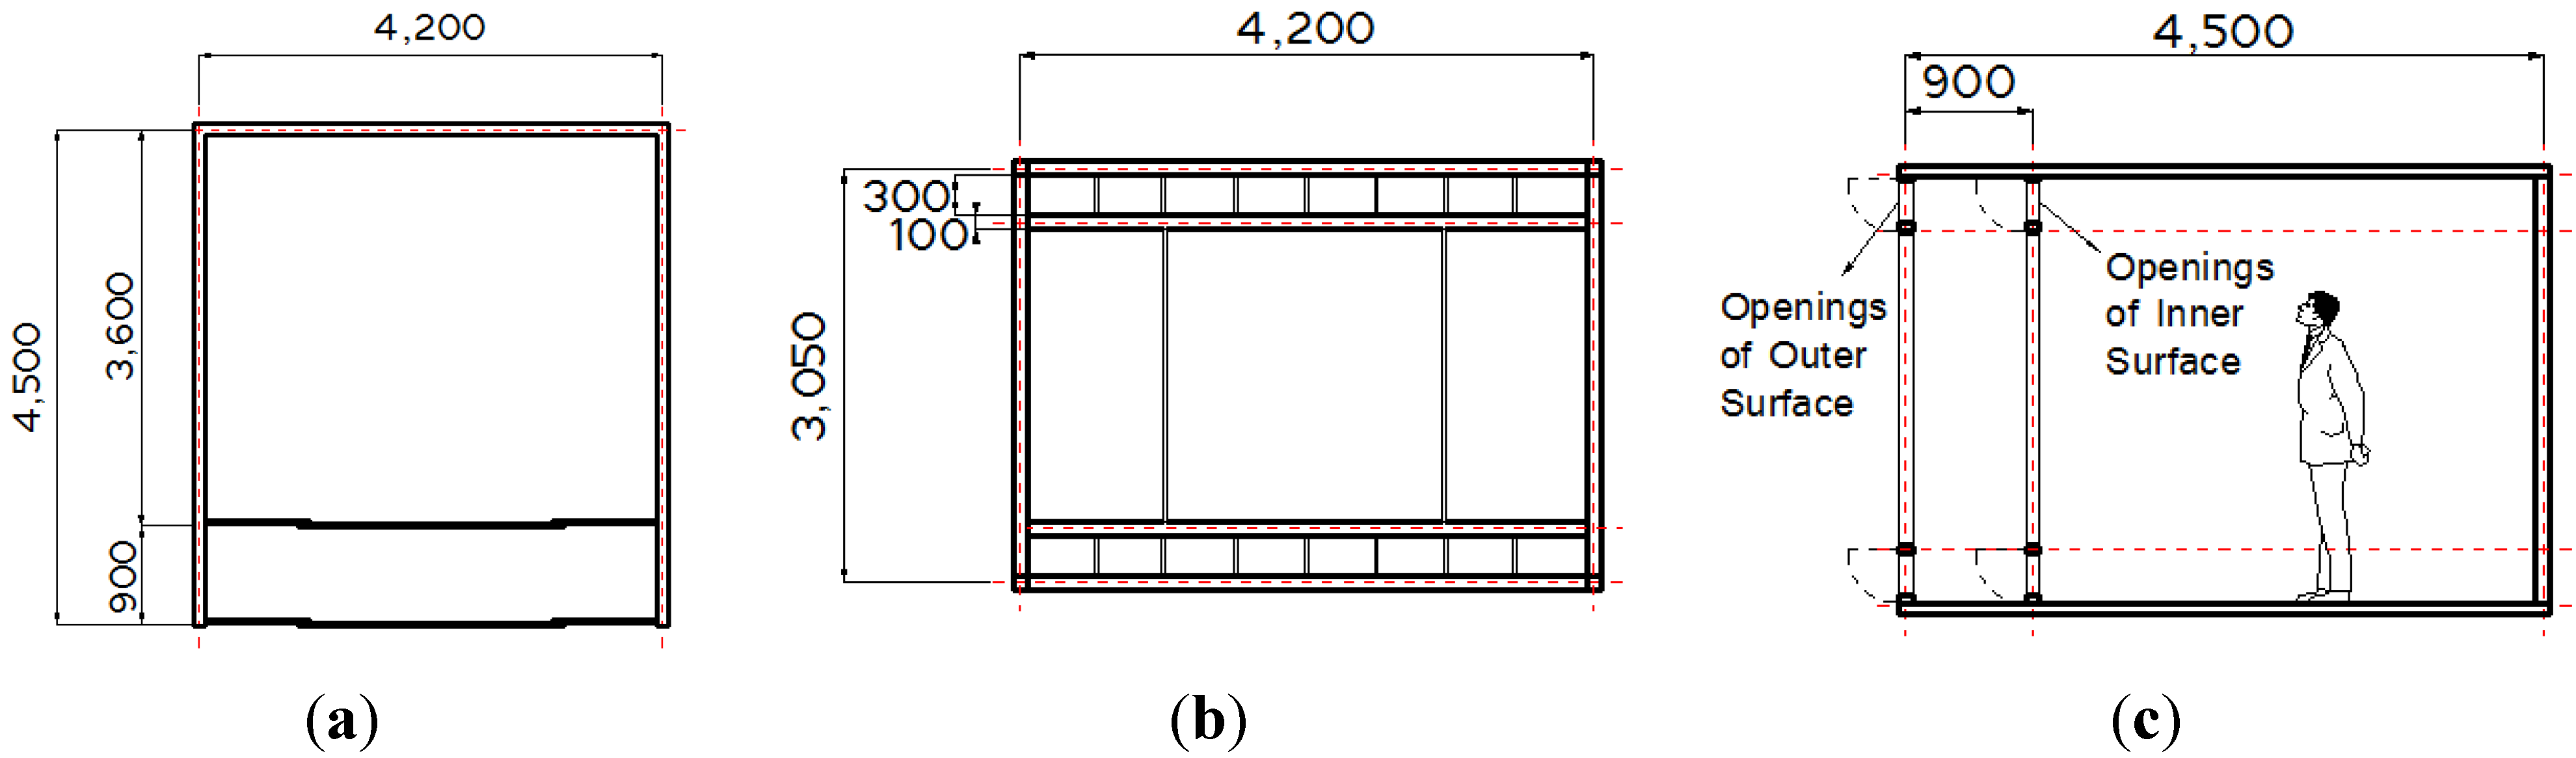
| Location for Weather Data | Seoul, South Kroea (latitude: 37.56° N, longitude: 126.98° E) | |
| Spcae Configuration | Dimension: 4.2 m (width) × 4.5 m (depth) × 3.05 m (height) Total area: 18.9 m2 (Indoor area: 15.12 m2, Cavity area:3.78 m2) | |
| Envelope Insulation (°K m2/W) [14] | Walls | 2.78 |
| Roof | 5.00 | |
| Floor | 2.44 | |
| Windows | 0.18 for the external envelope (24 mm clear glass) 0.77 for the internal envelope (6 mm gray glass + 16 mm argon gas + 6 mm gray glass) | |
| Doors | 0.2 | |
| Internal Gain | 2 seated, light work, typing occupants 2 computers with printer 5 W/m2 lighting fixtures | |
| Infiltration Rate [15] | 0.7 ACH | |
| Systems Applied [15] | Radiative heating: 7172 kJ/h heat supply Convective cooling: 6315 kJ/h heat removal | |
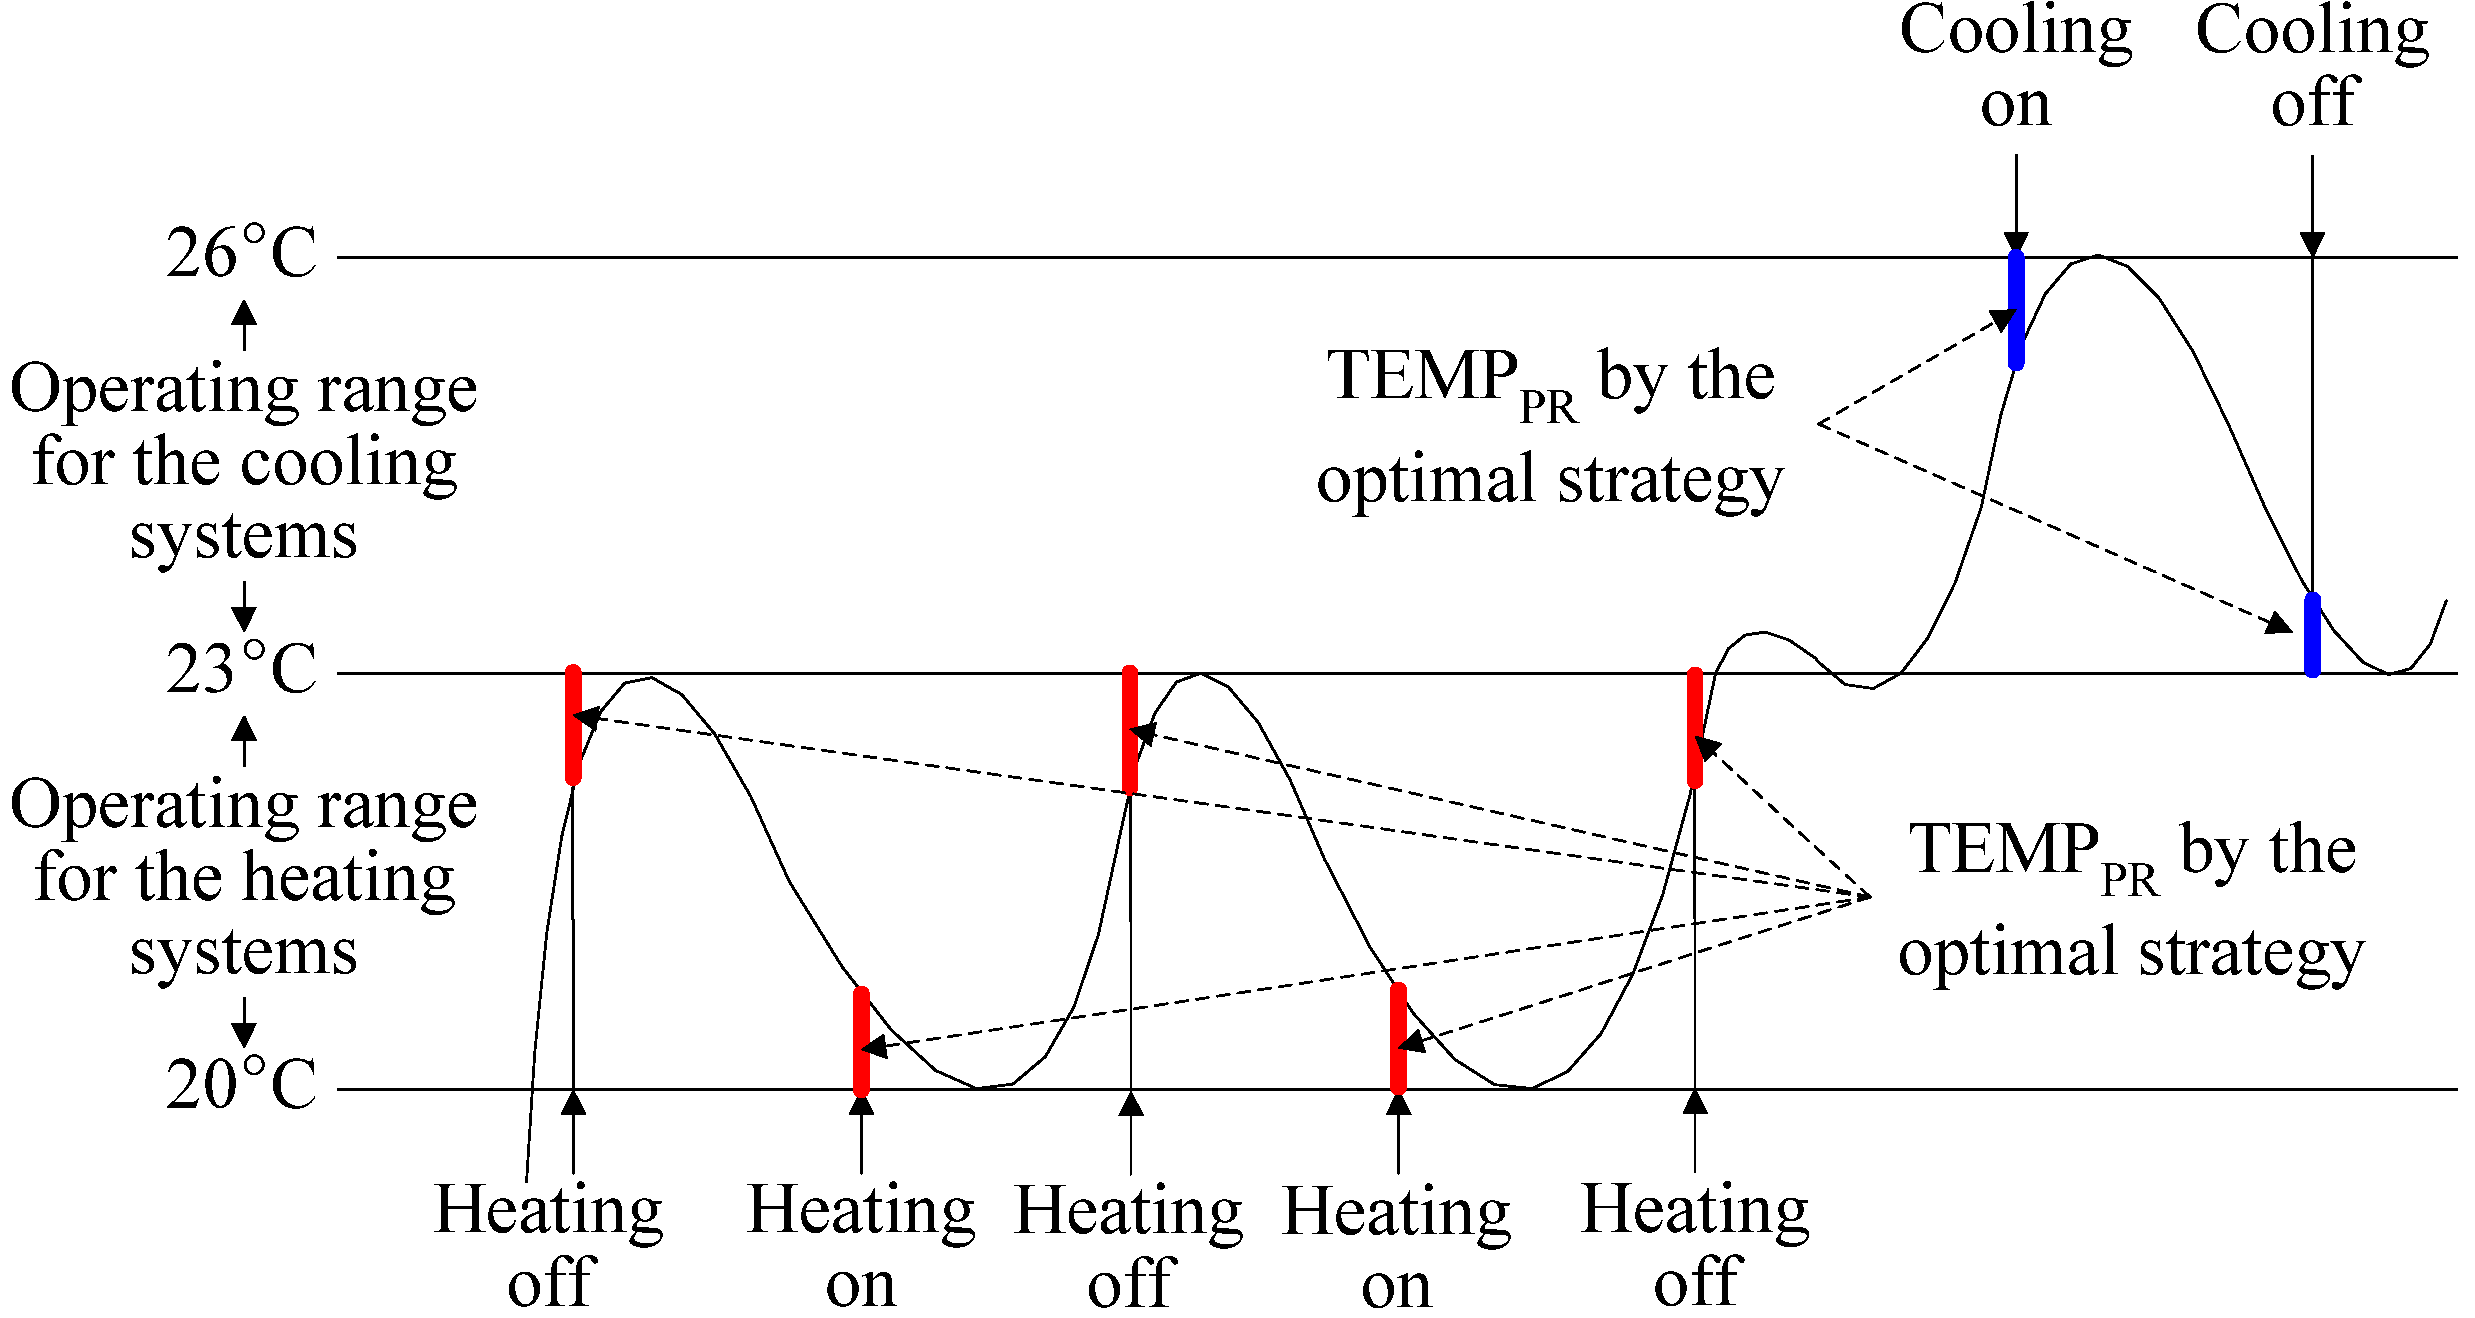
| System Operation Ranges [16] | Heating: 20–23 °C Cooling: 23–26 °C | |
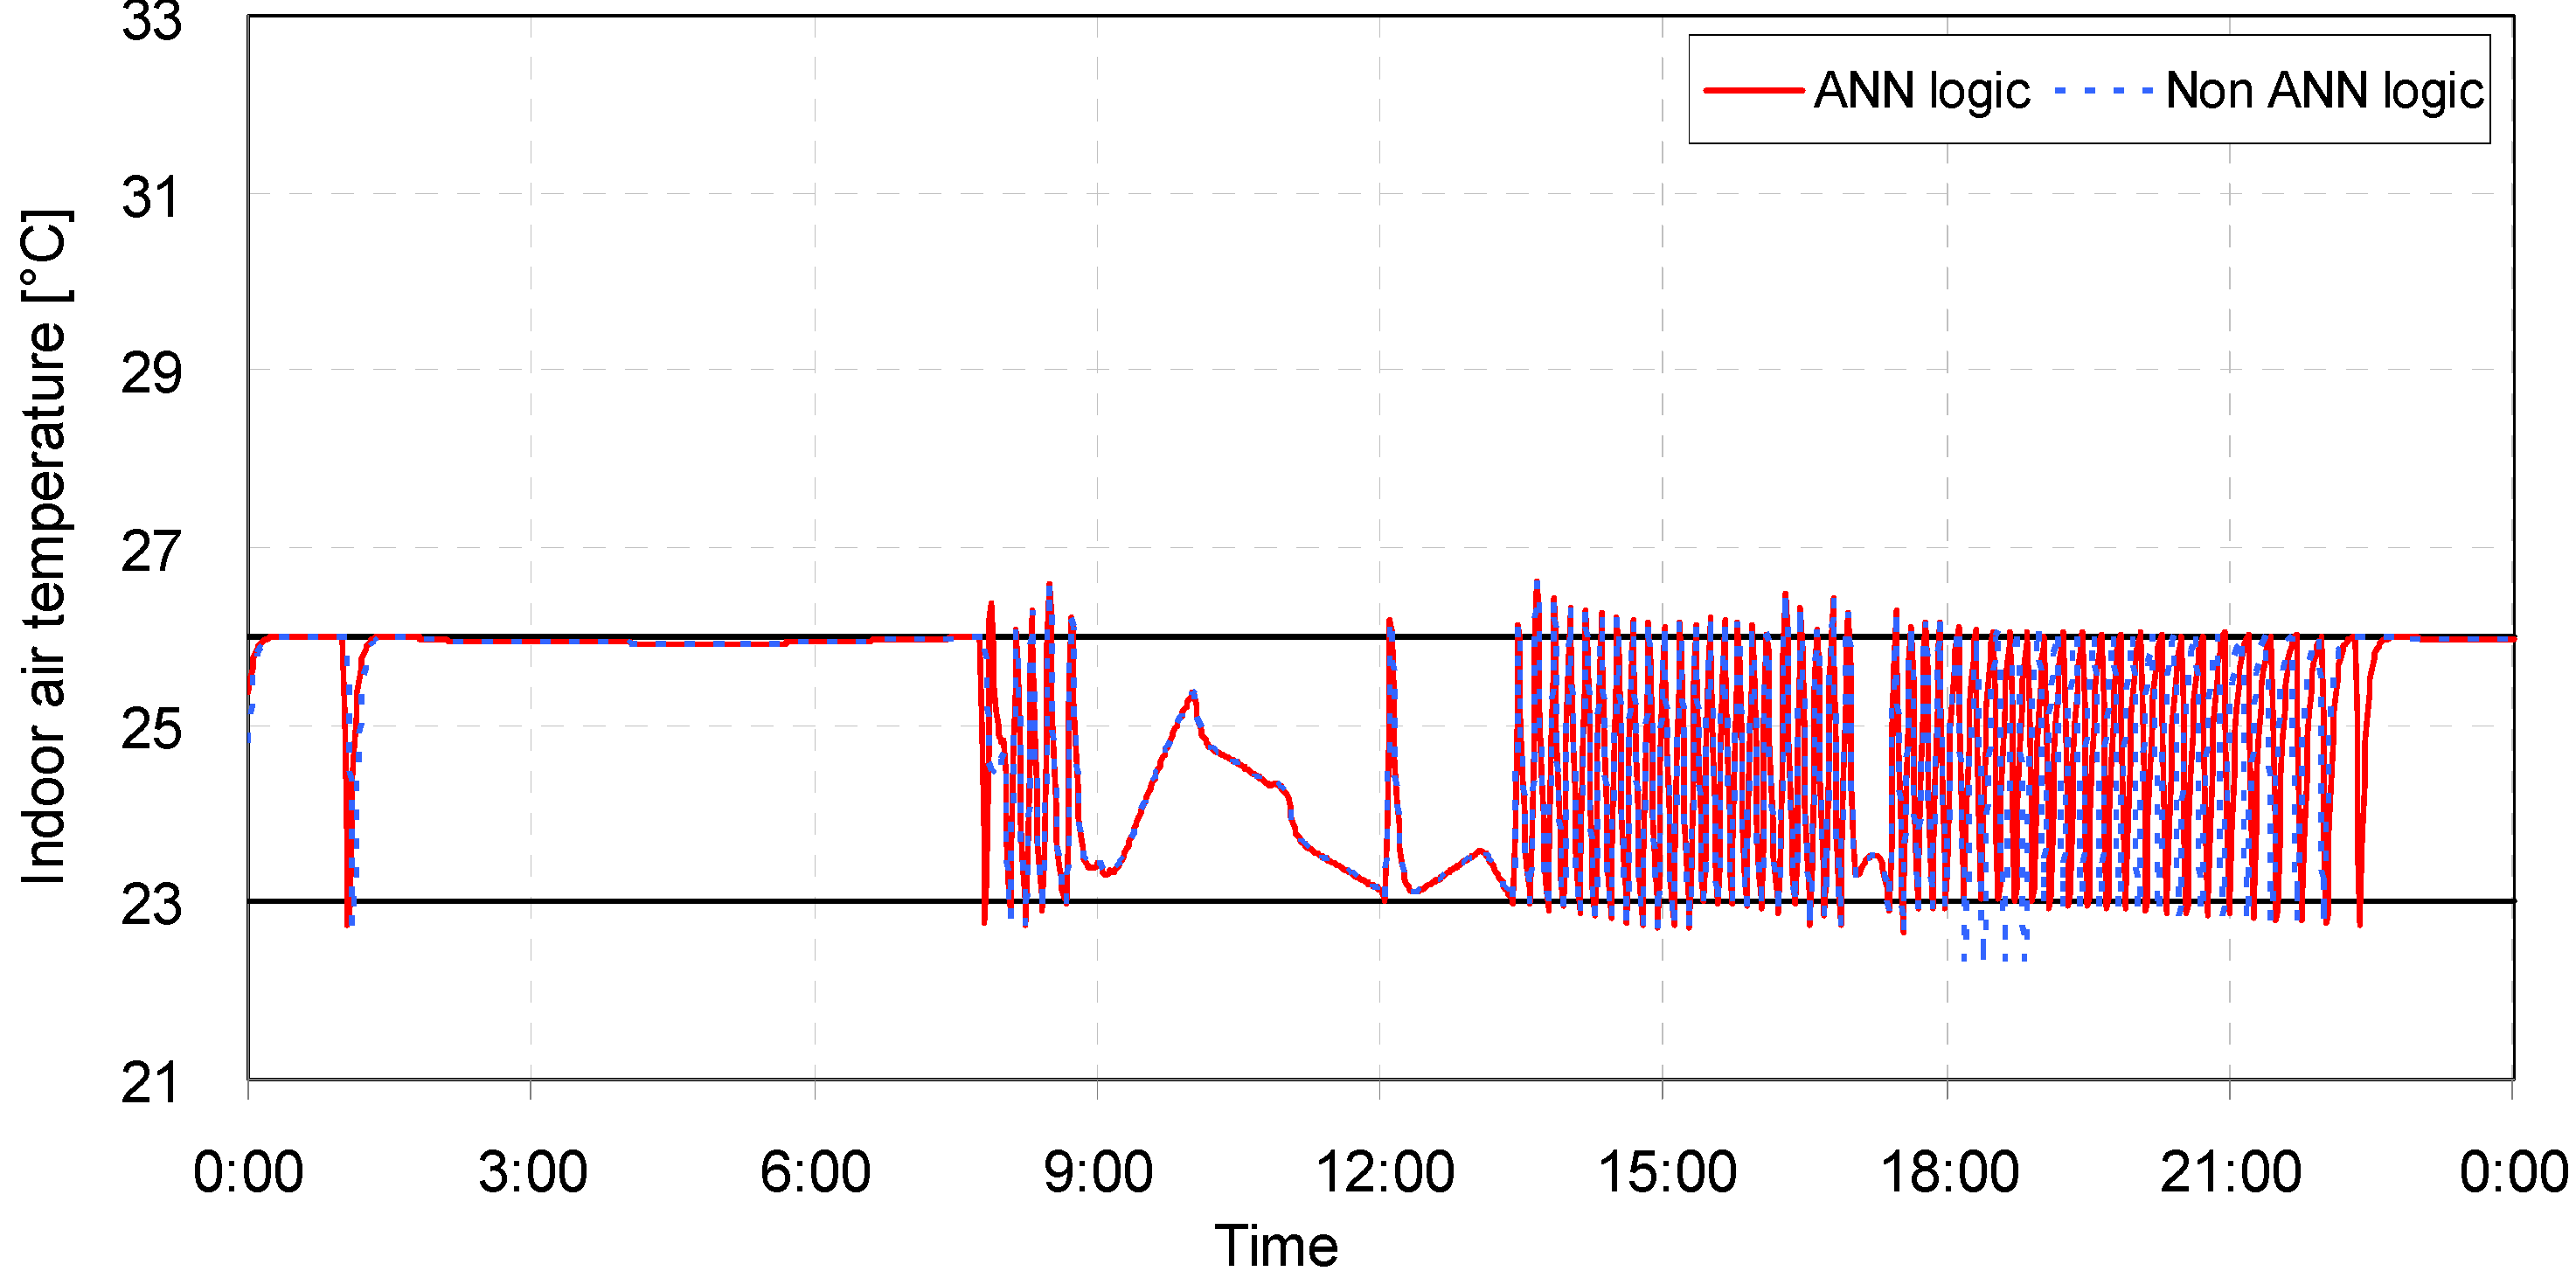
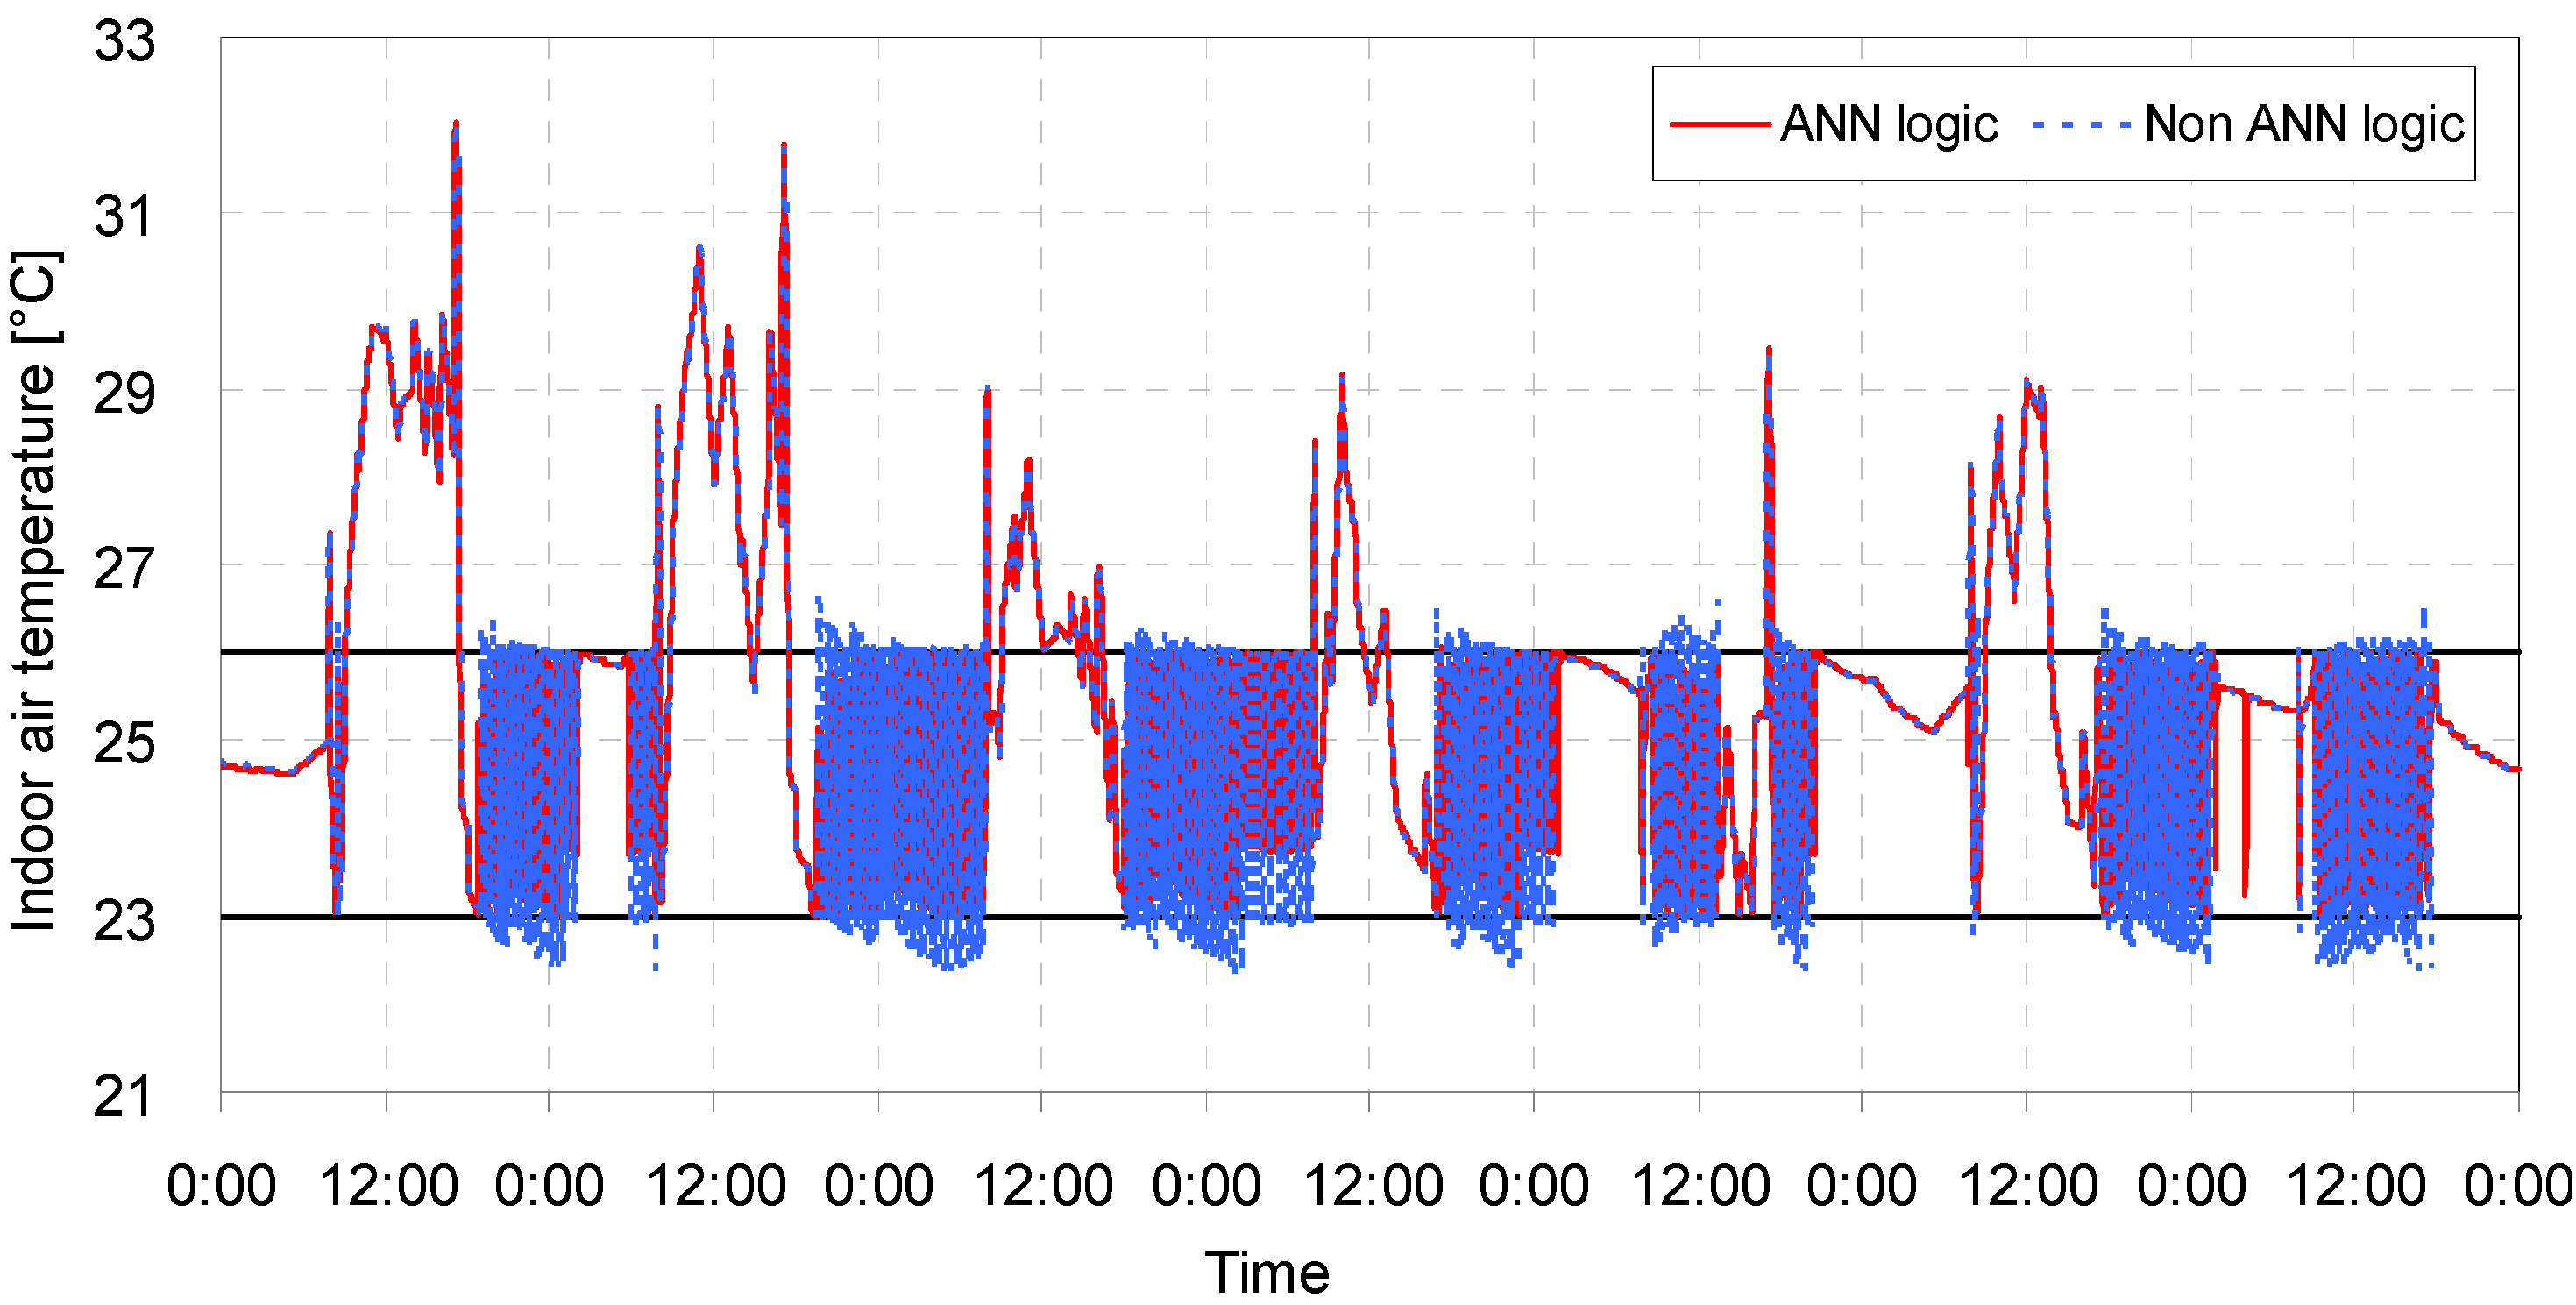
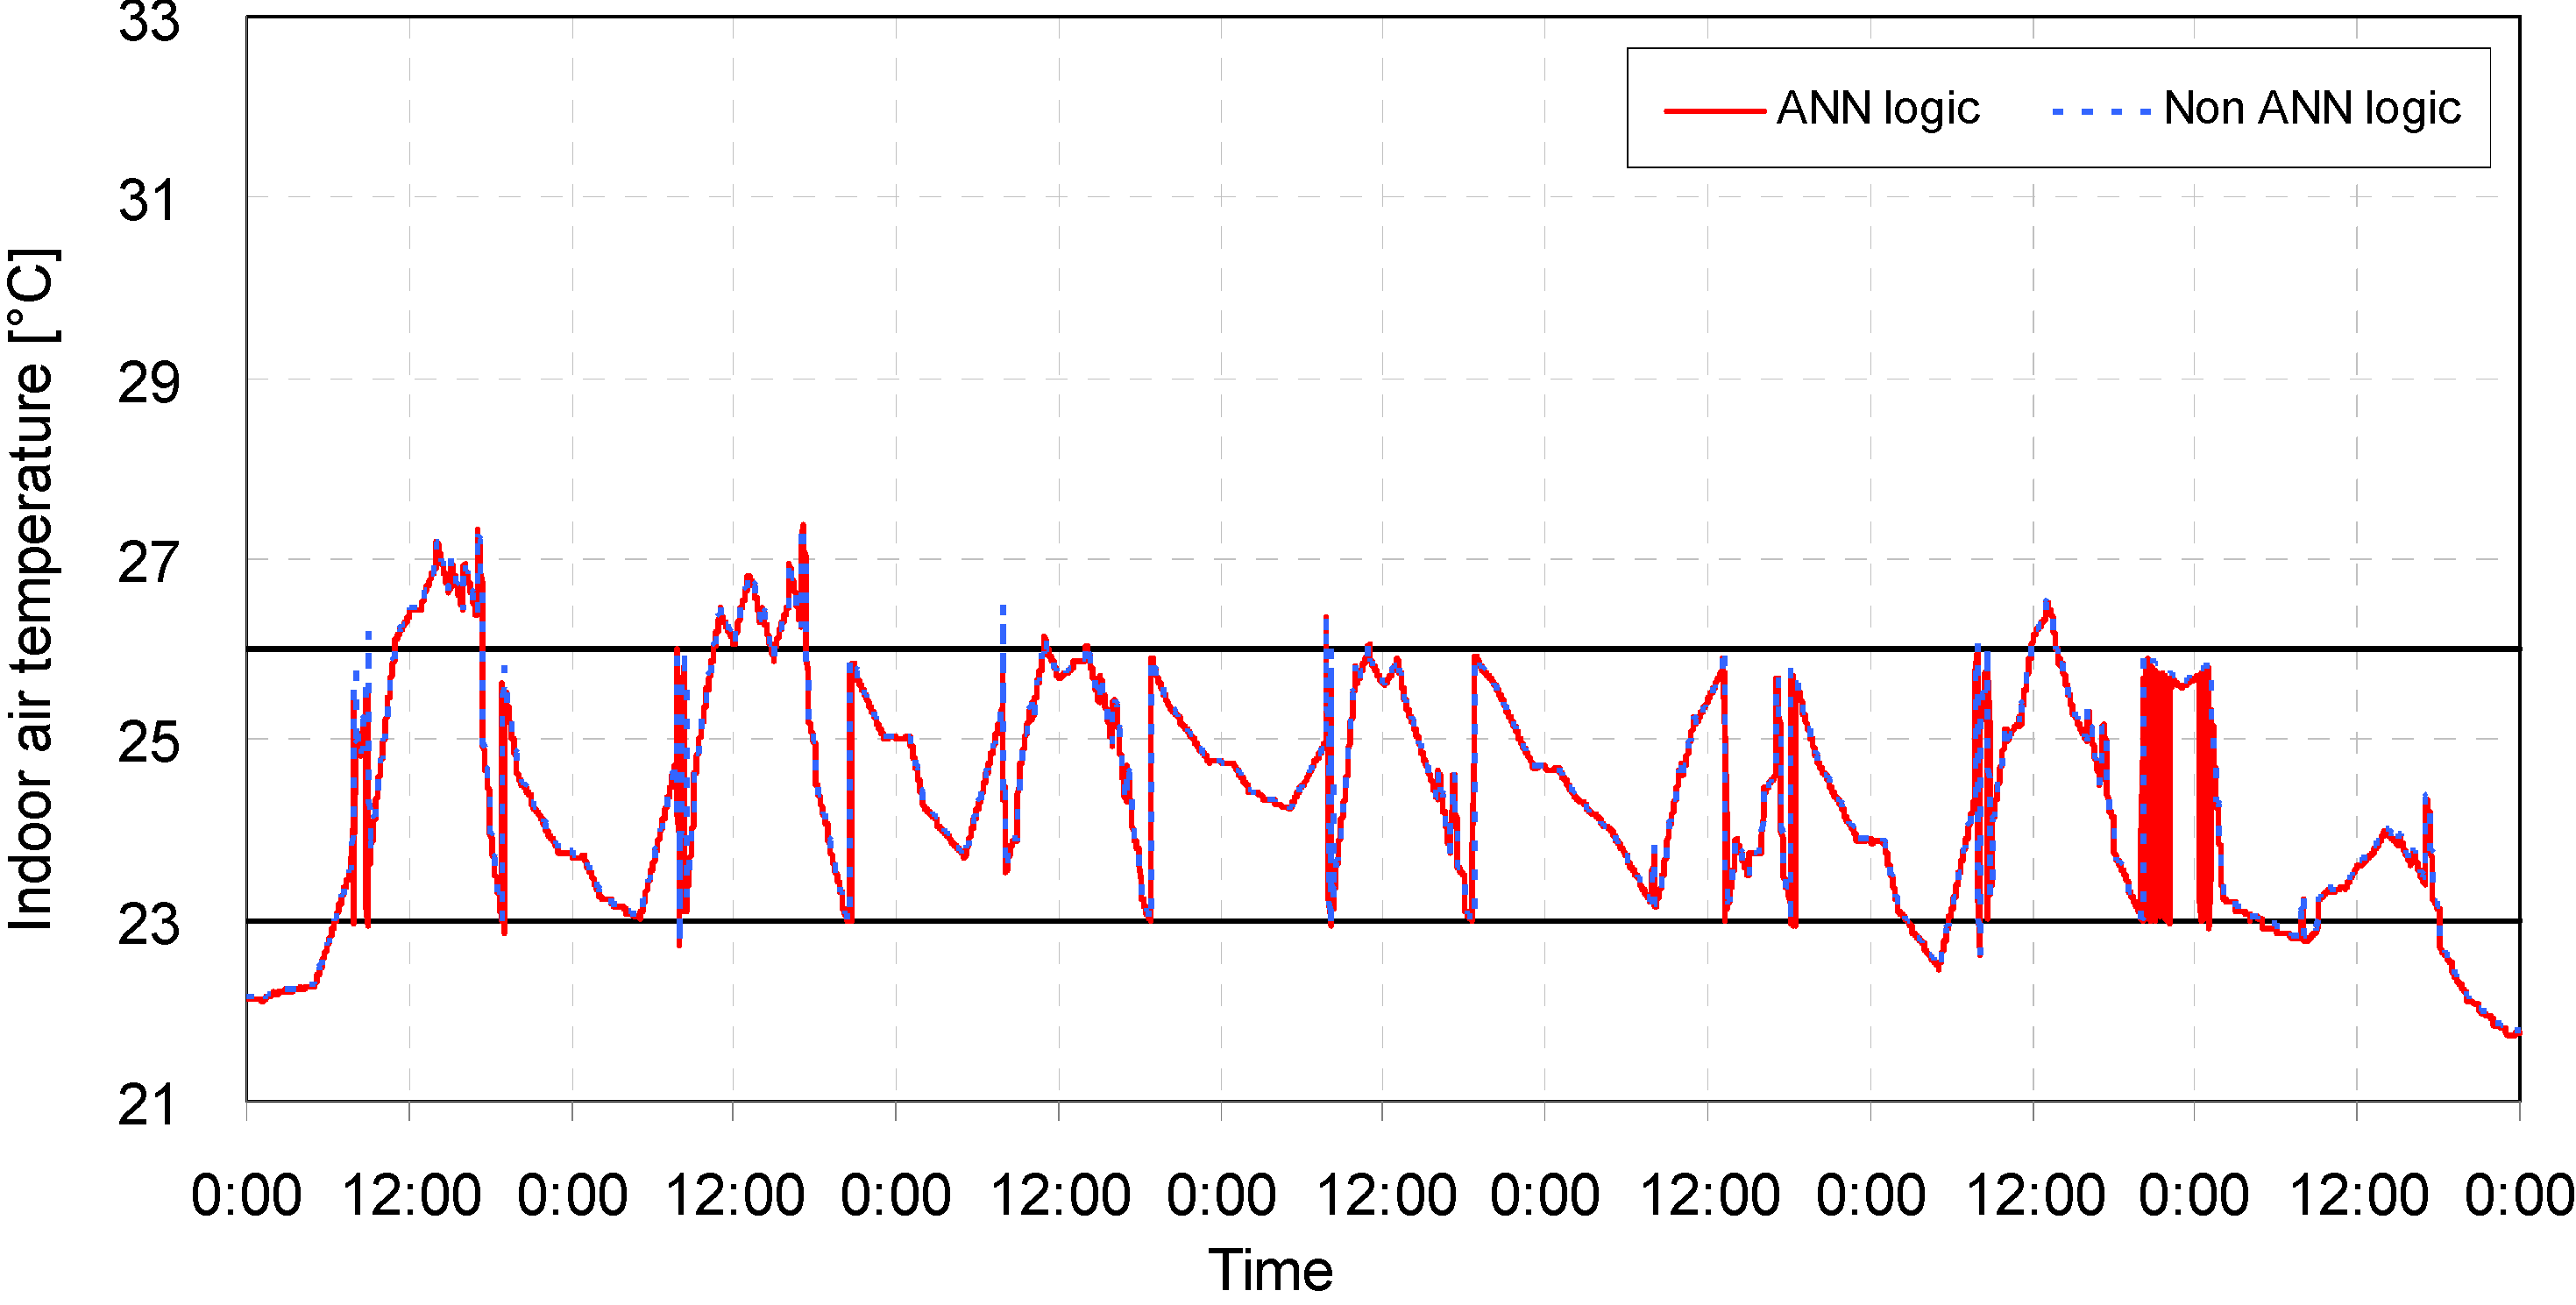
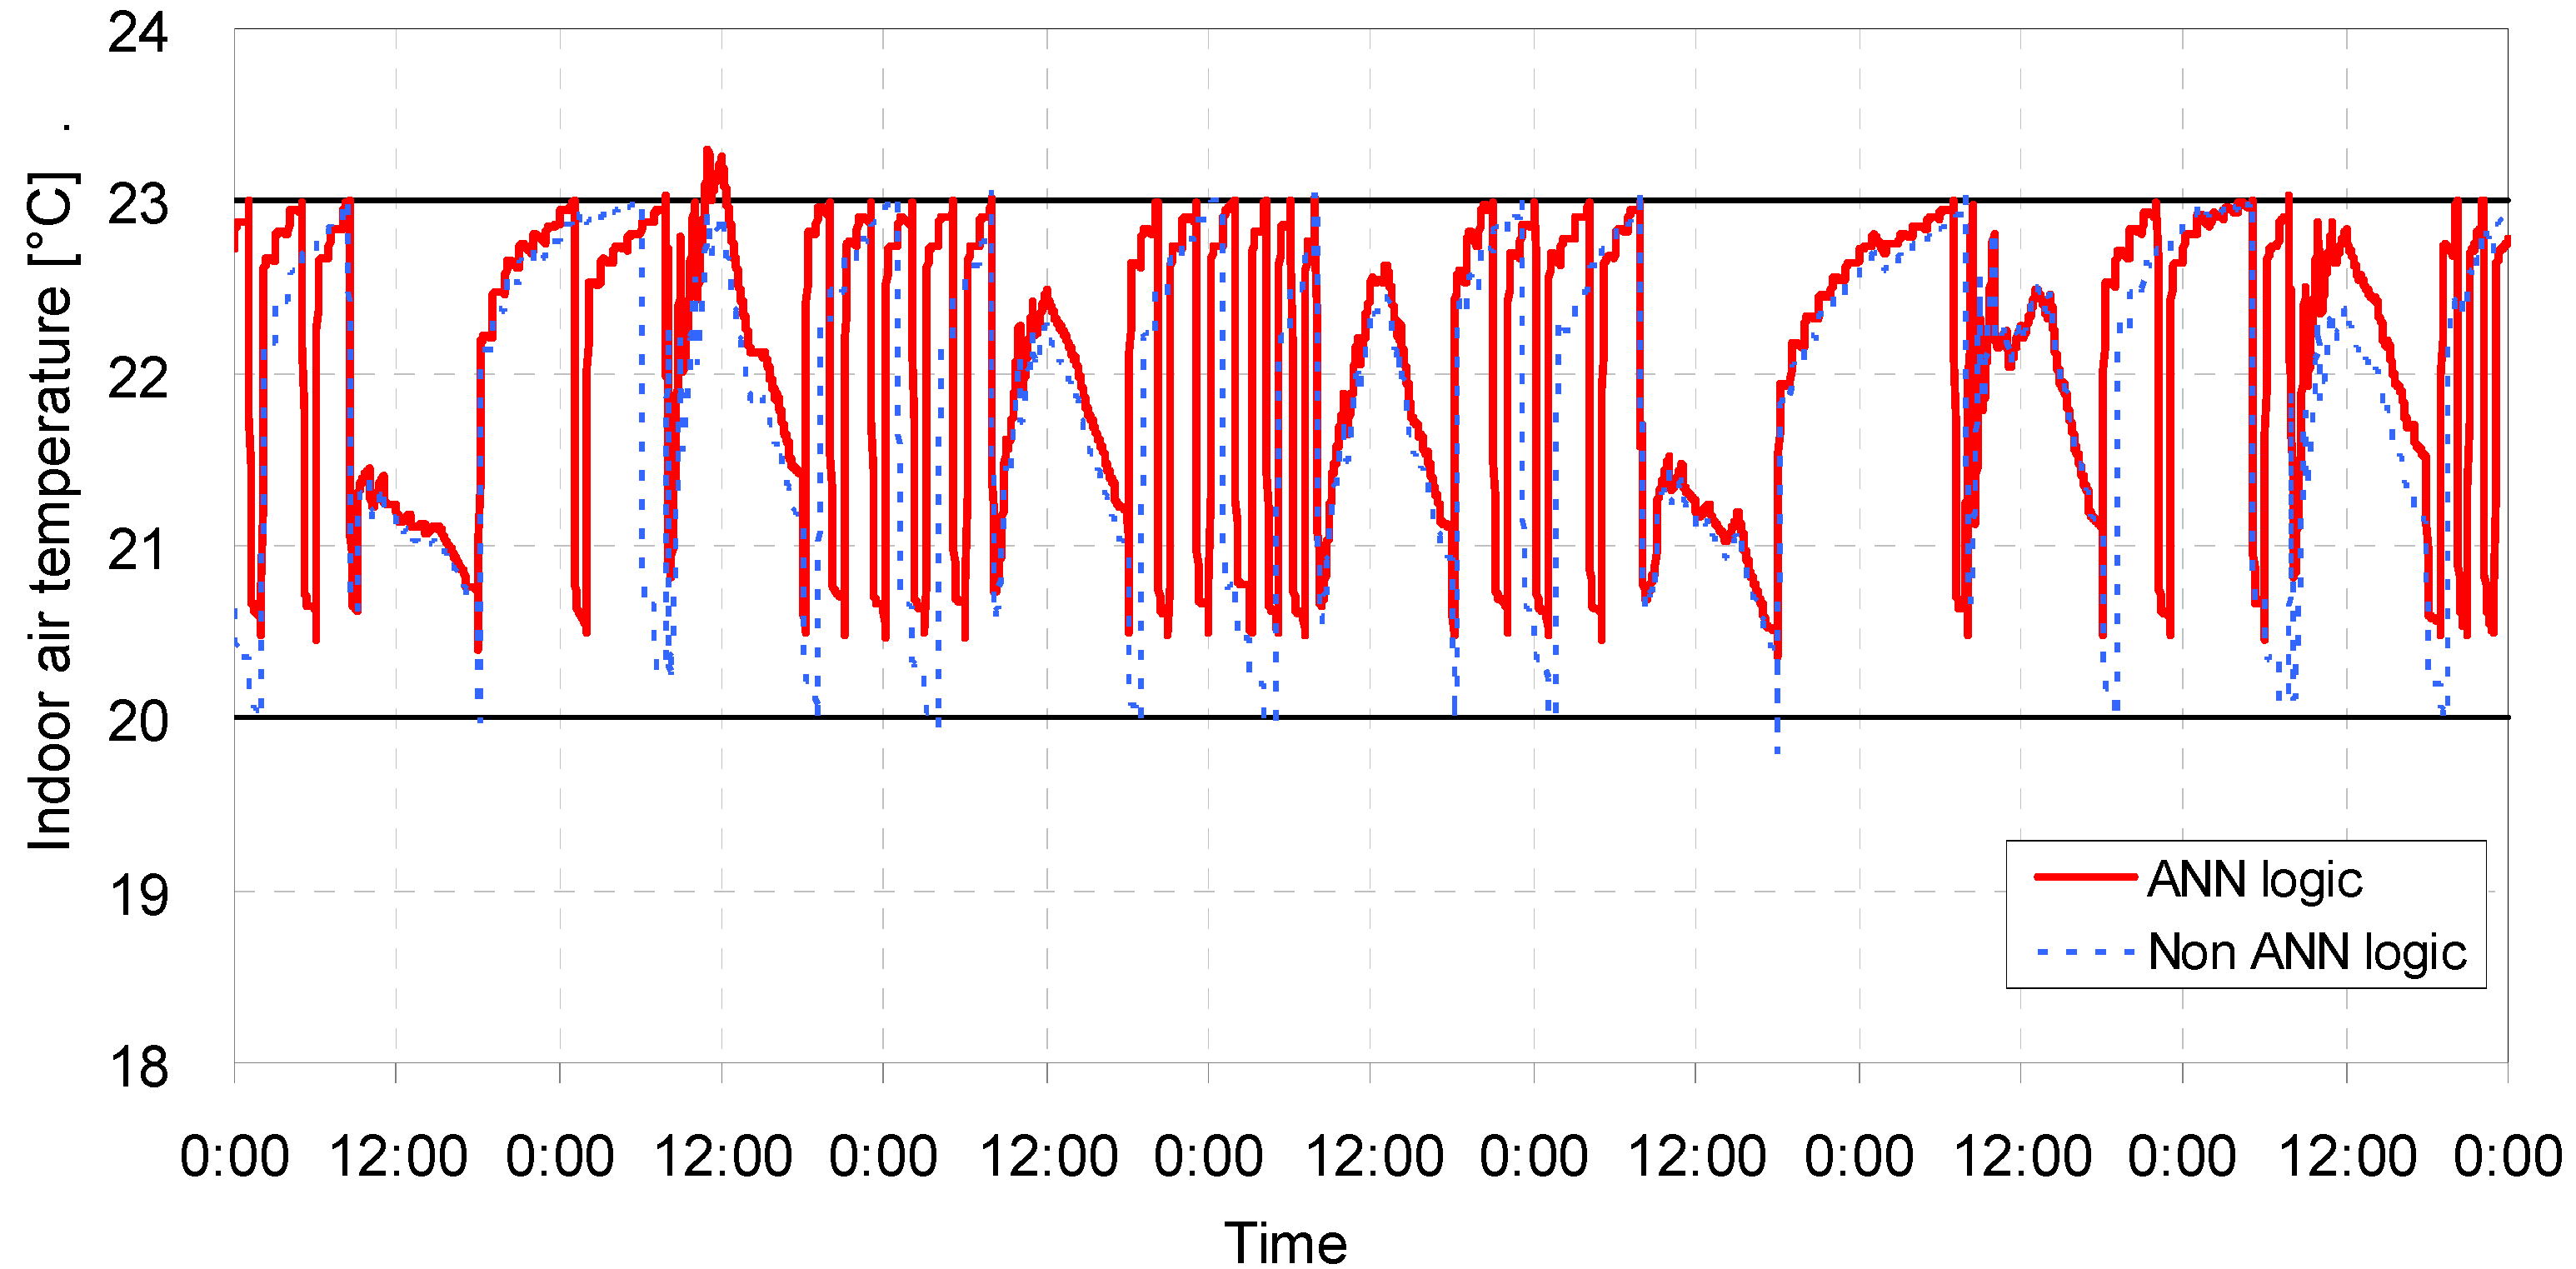
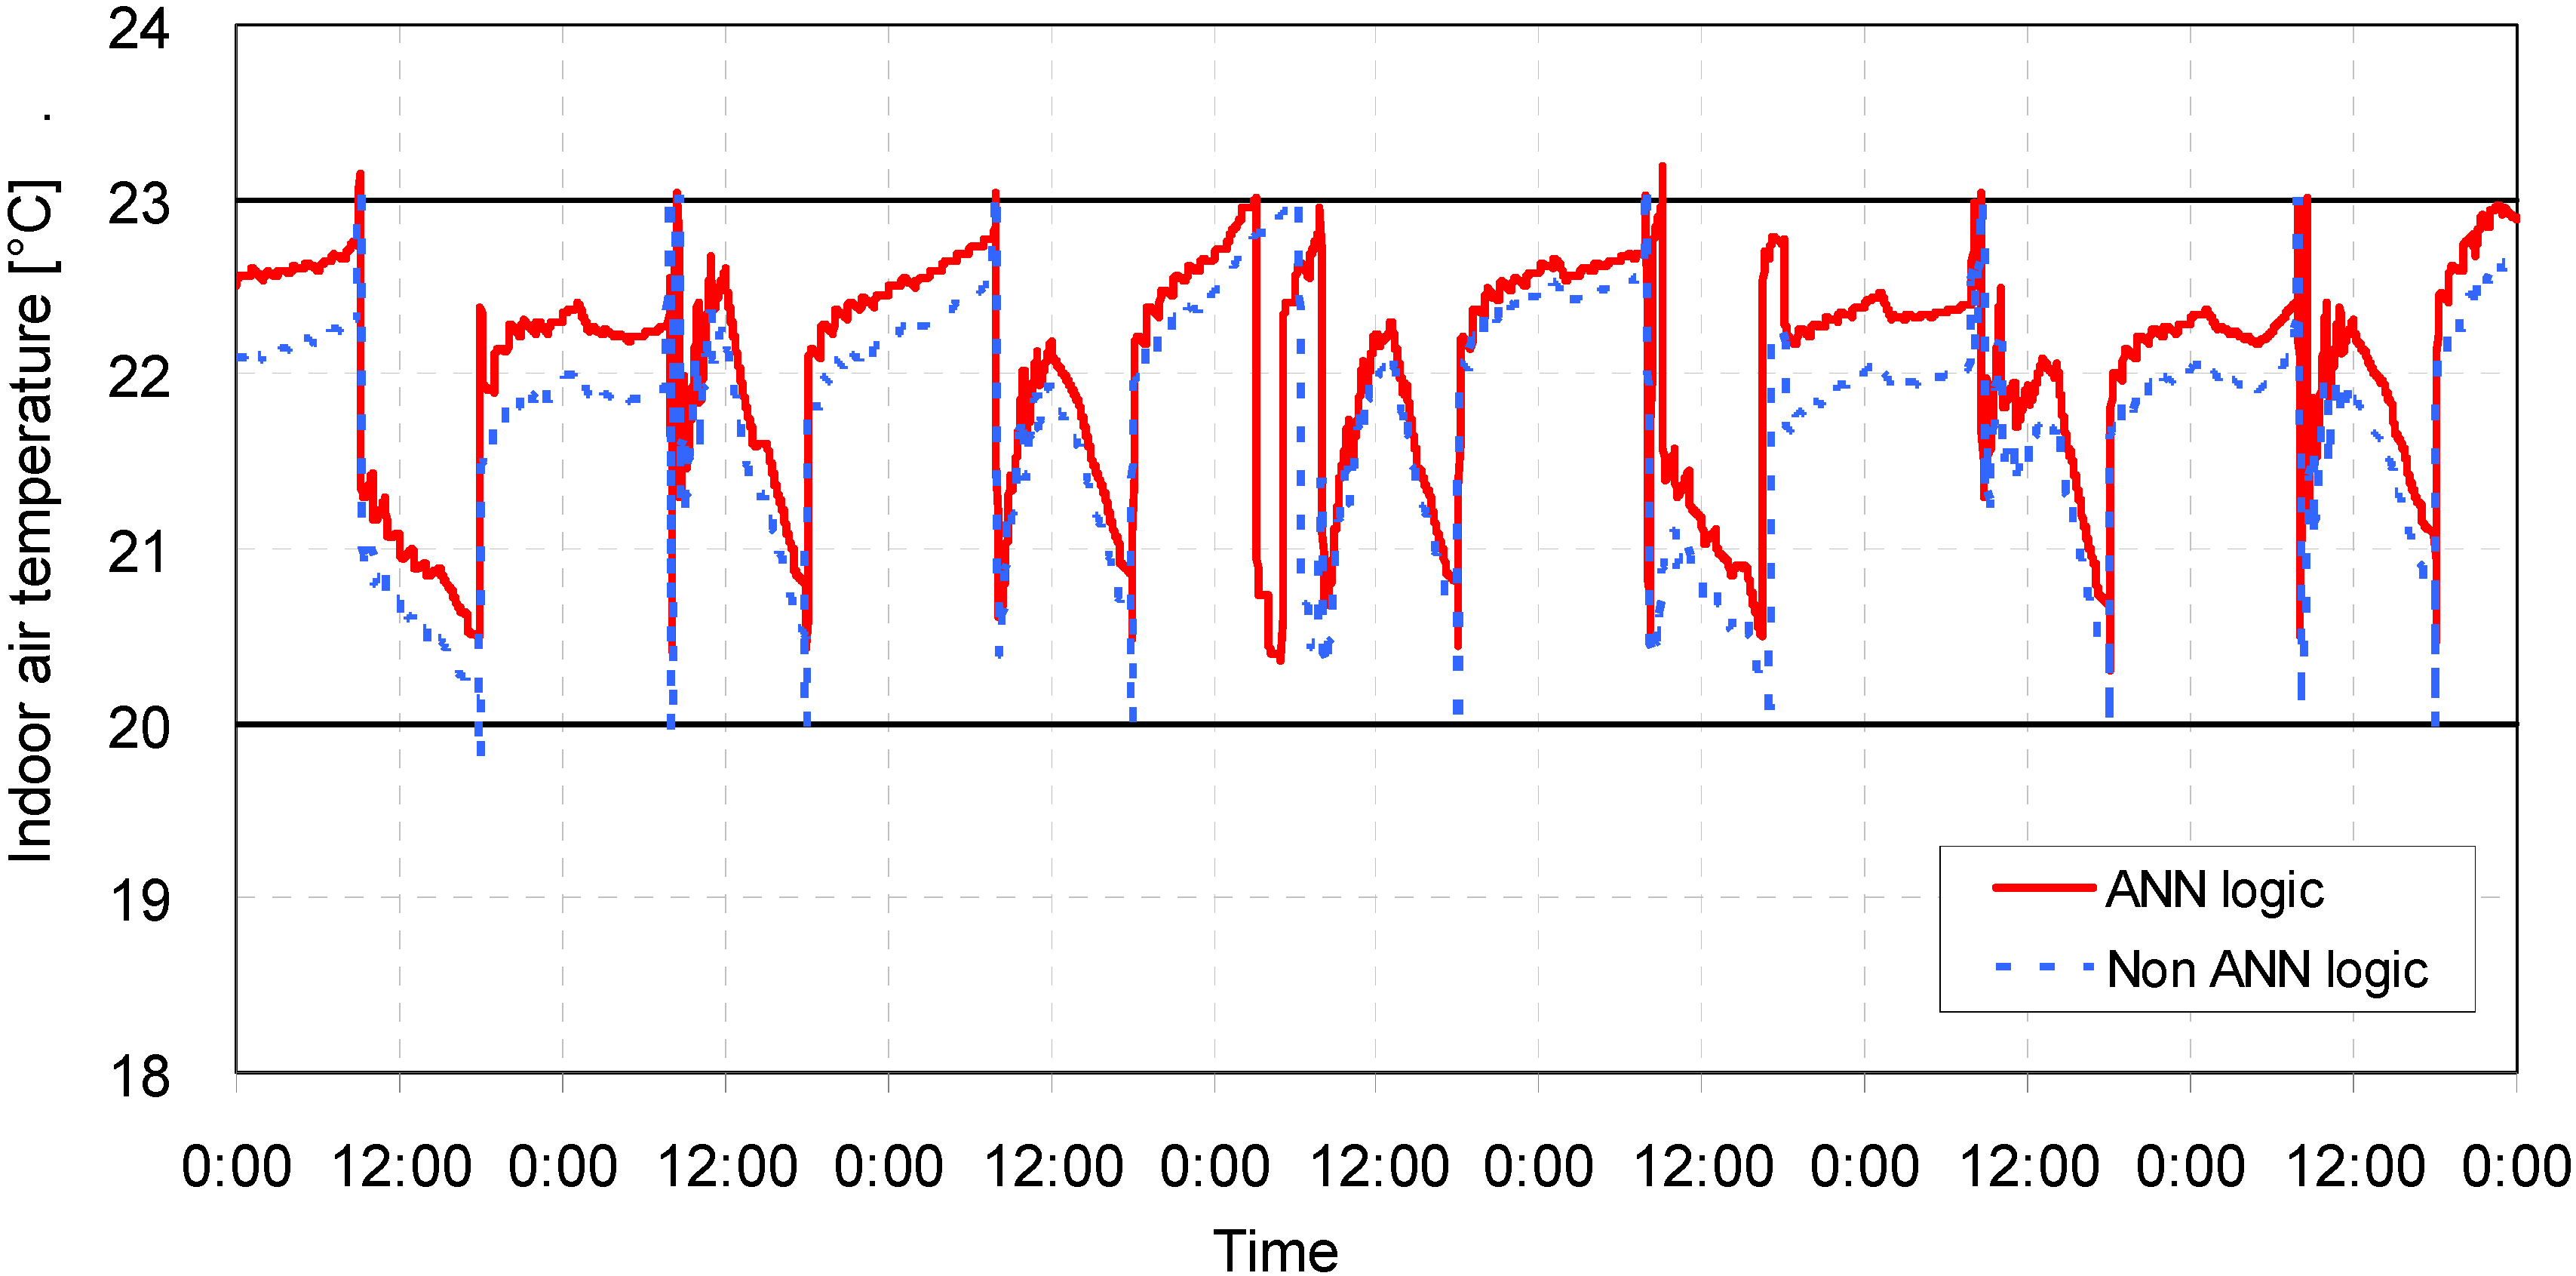
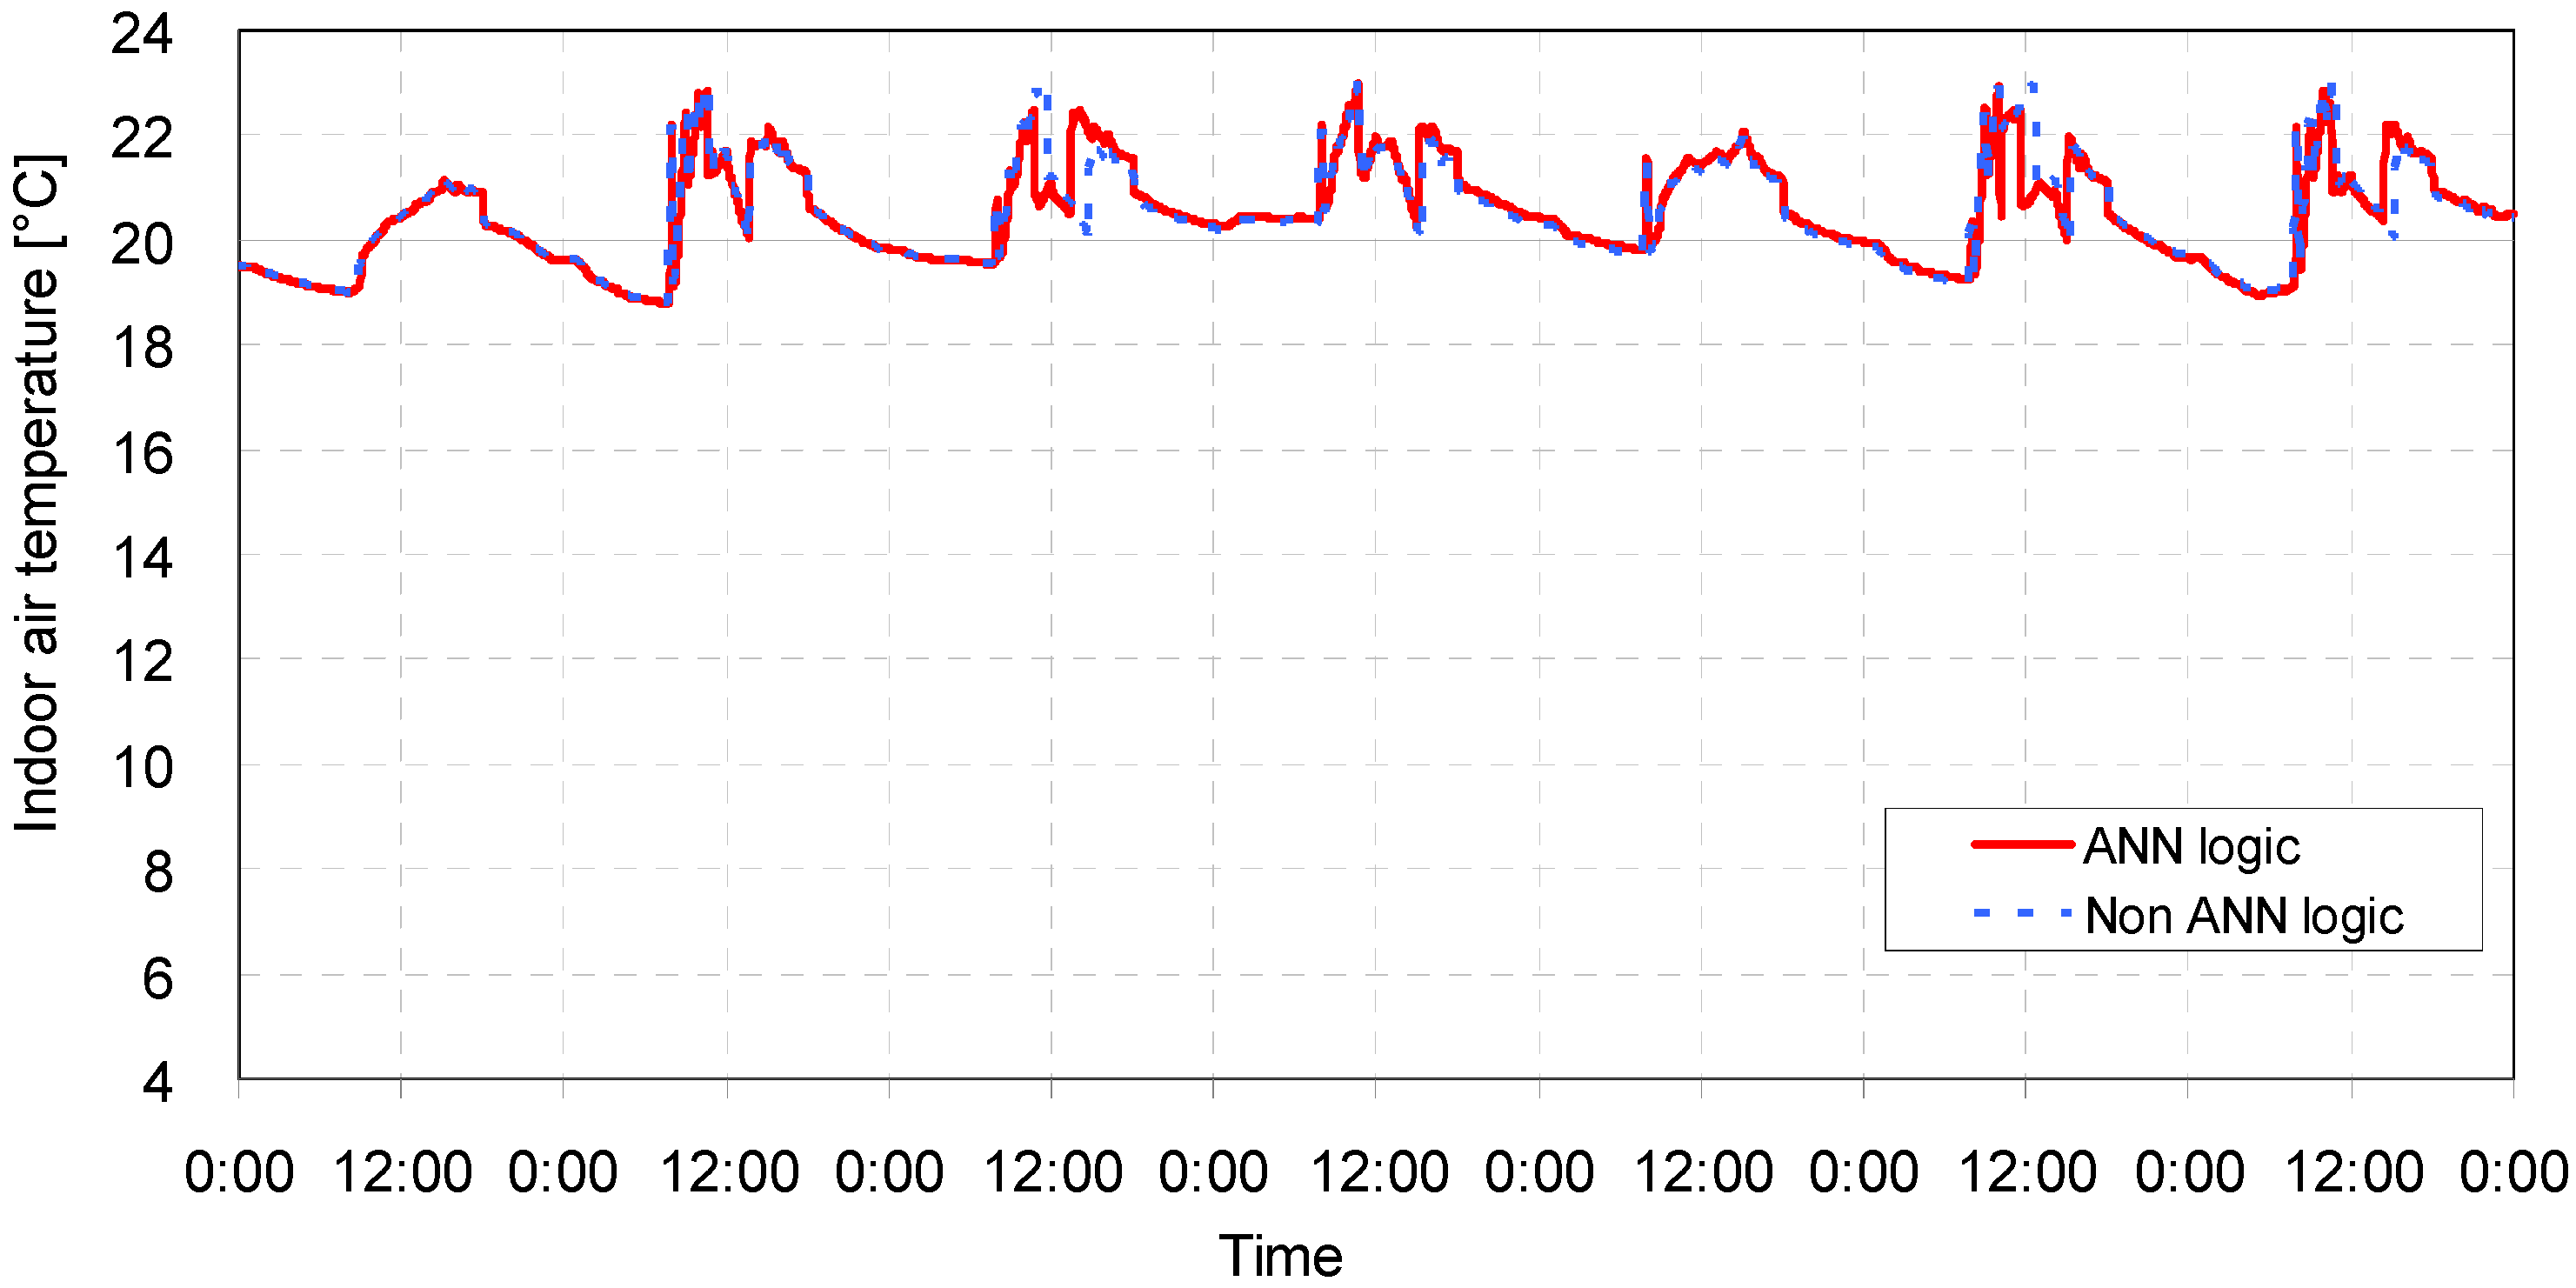
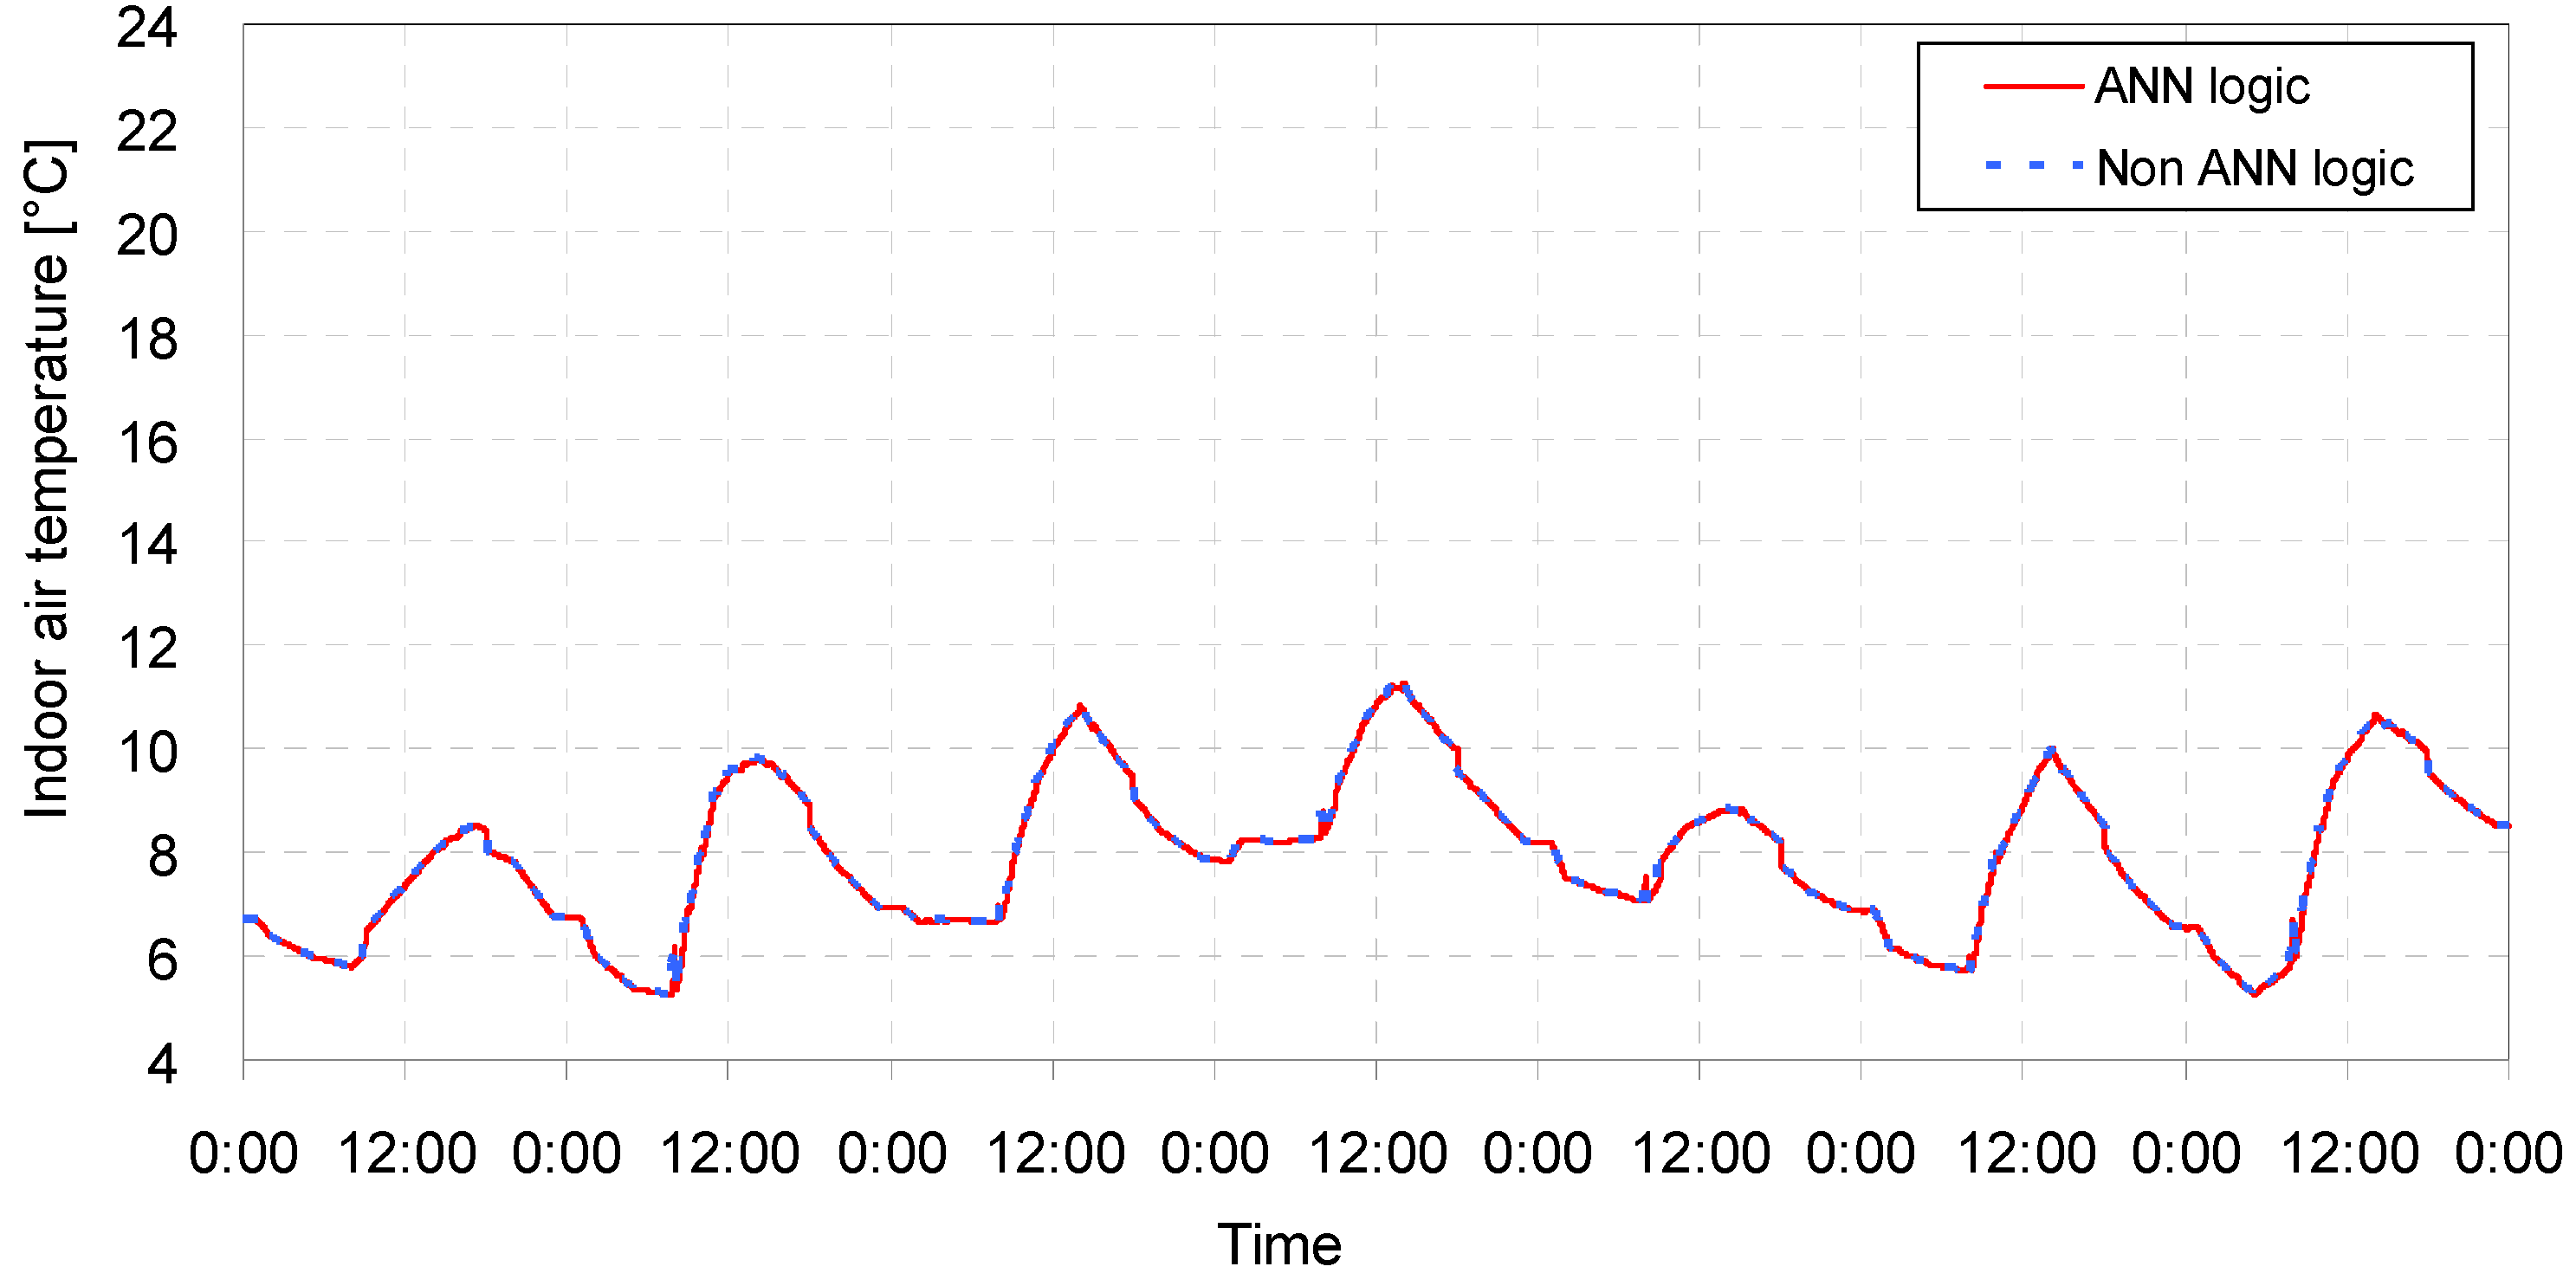
5.2. Result Analysis
| Case | Opening conditions | ANN model application | Comfortable period in percentile | Uncomfortable period in percentile | Average temperature (°C) | Amount of heat supply (KJ) | ||
|---|---|---|---|---|---|---|---|---|
| Internal envelope | External envelope | Over comfort range | Under comfort range | |||||
| 1 | Closed | Closed | No | 99.78 | 0.10 | 0.12 | 21.89 | 548,538 |
| Yes | 99.90 | 0.10 | 0.00 | 22.07 | 555,830 | |||
| 2 | Closed | Open | No | 99.81 | 0.09 | 0.10 | 21.74 | 709,669 |
| Yes | 99.90 | 0.10 | 0.00 | 22.05 | 719,232 | |||
| 3 | Open | Closed | No | 64.27 | 0.07 | 35.66 | 20.44 | 1,072,214 |
| Yes | 66.34 | 0.00 | 33.66 | 20.48 | 1,078,669 | |||
| 4 | Open | Open | No | 0.01 | - | 99.99 | 7.91 | 1,204,896 |
| Yes | 0.01 | - | 99.99 | 7.91 | 1,204896 | |||
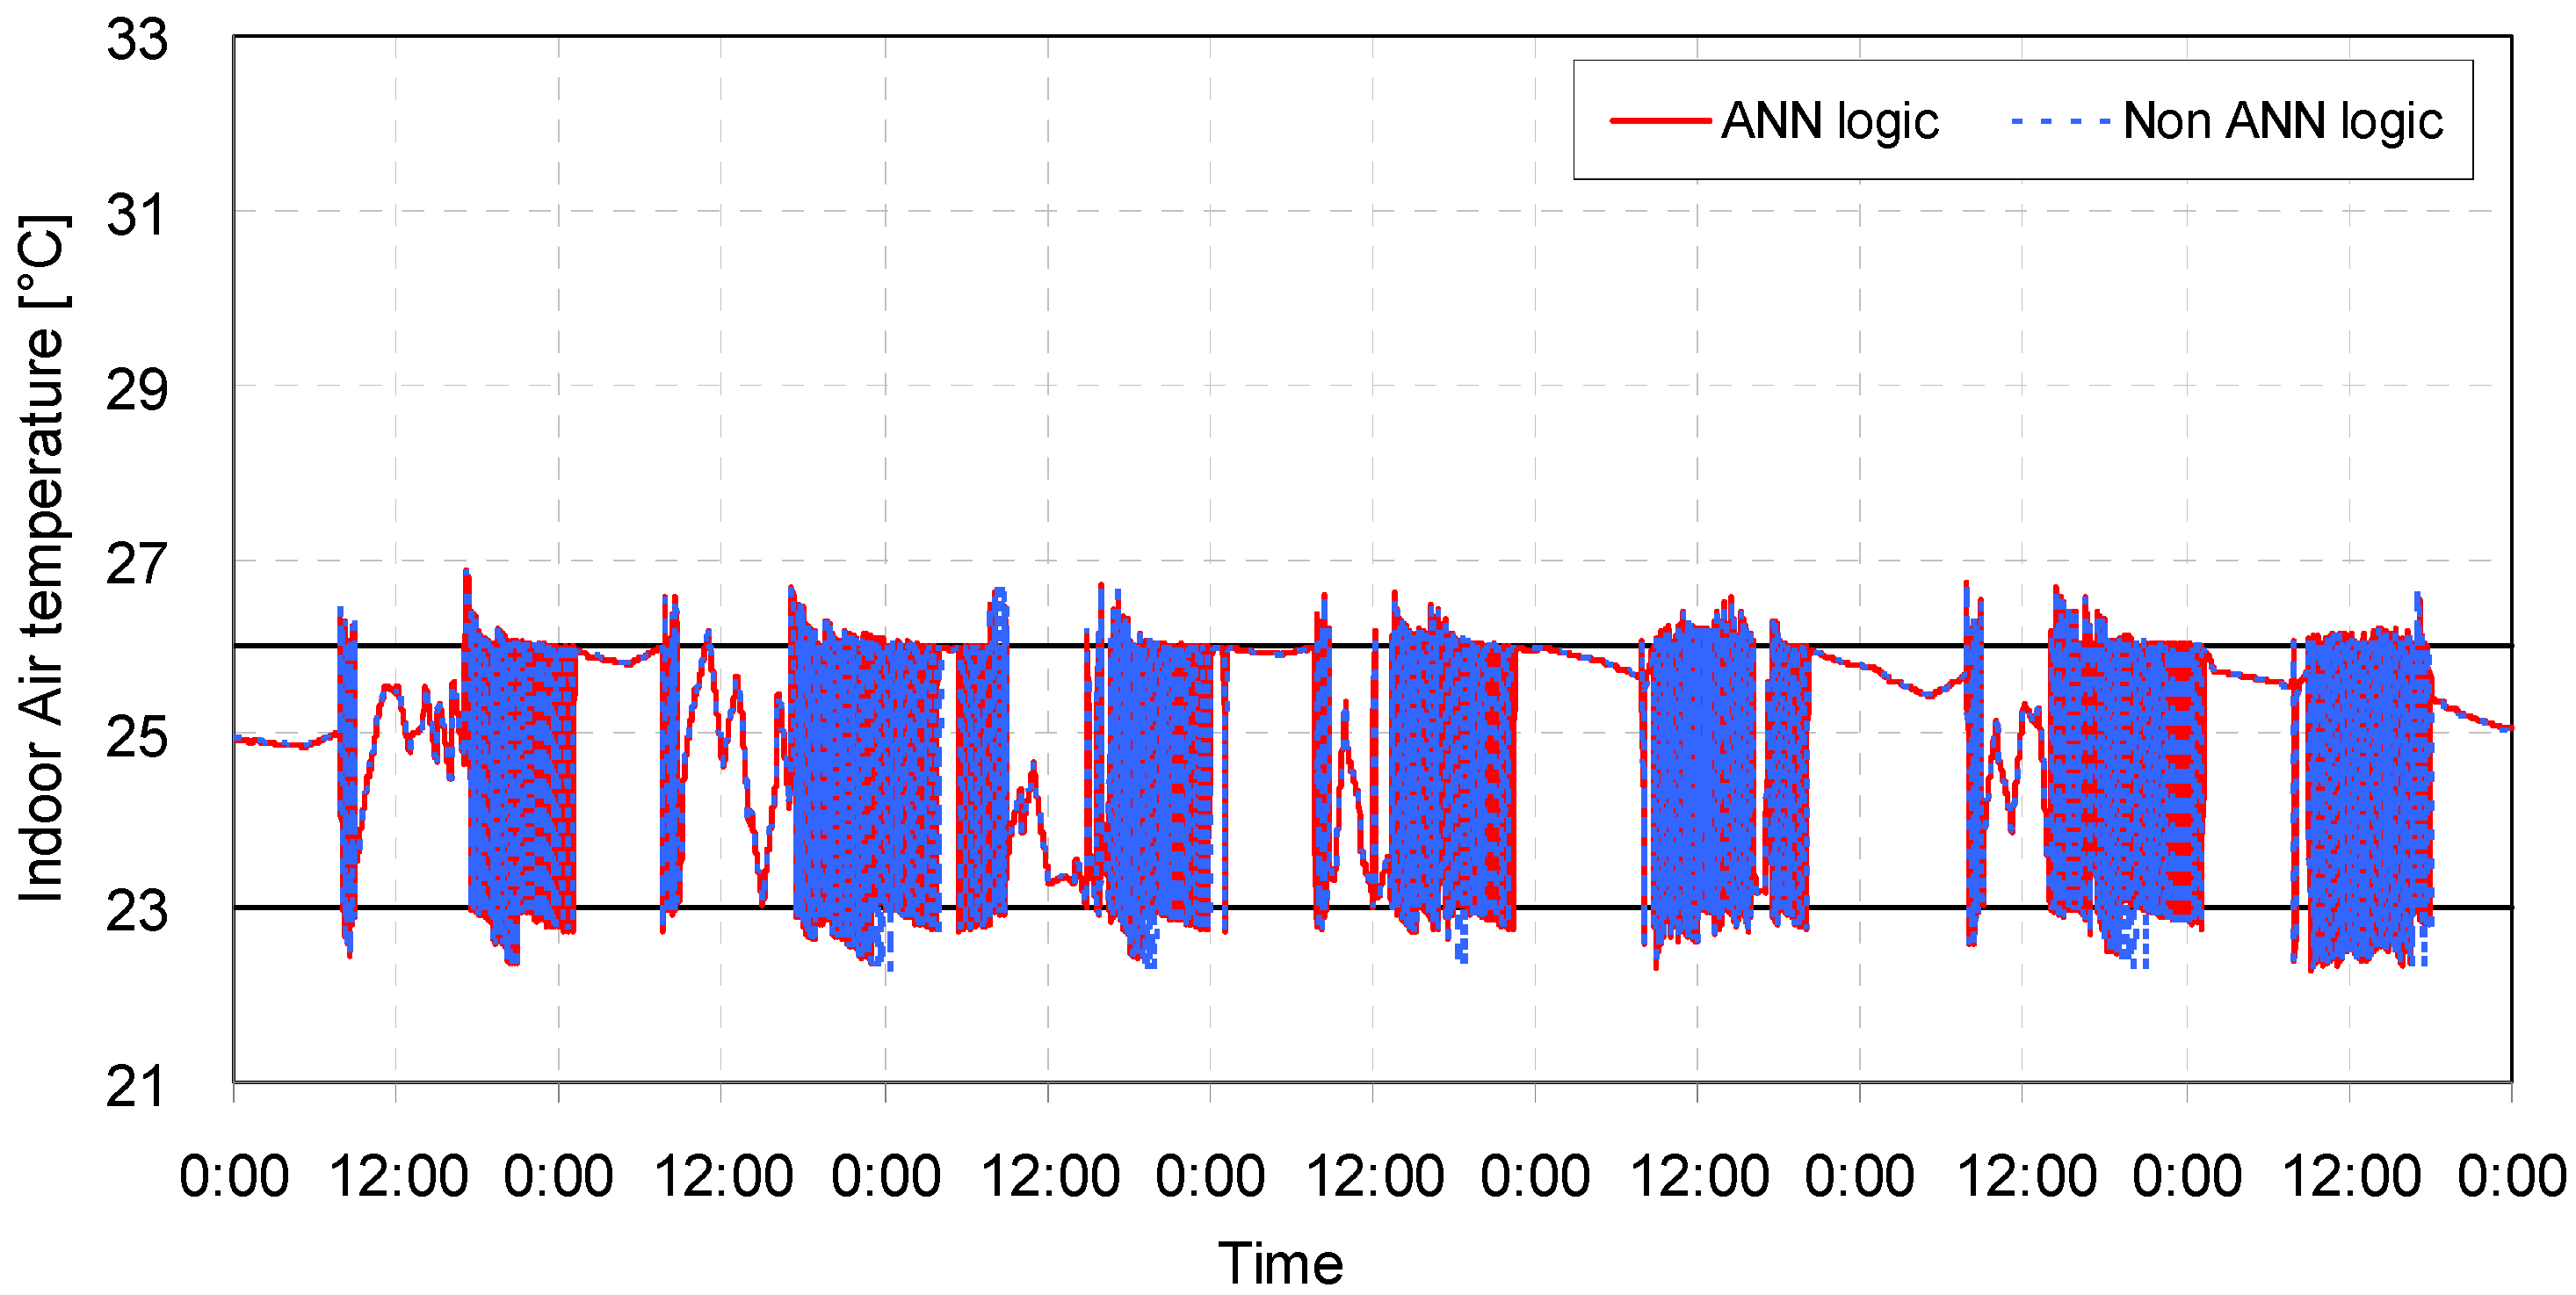

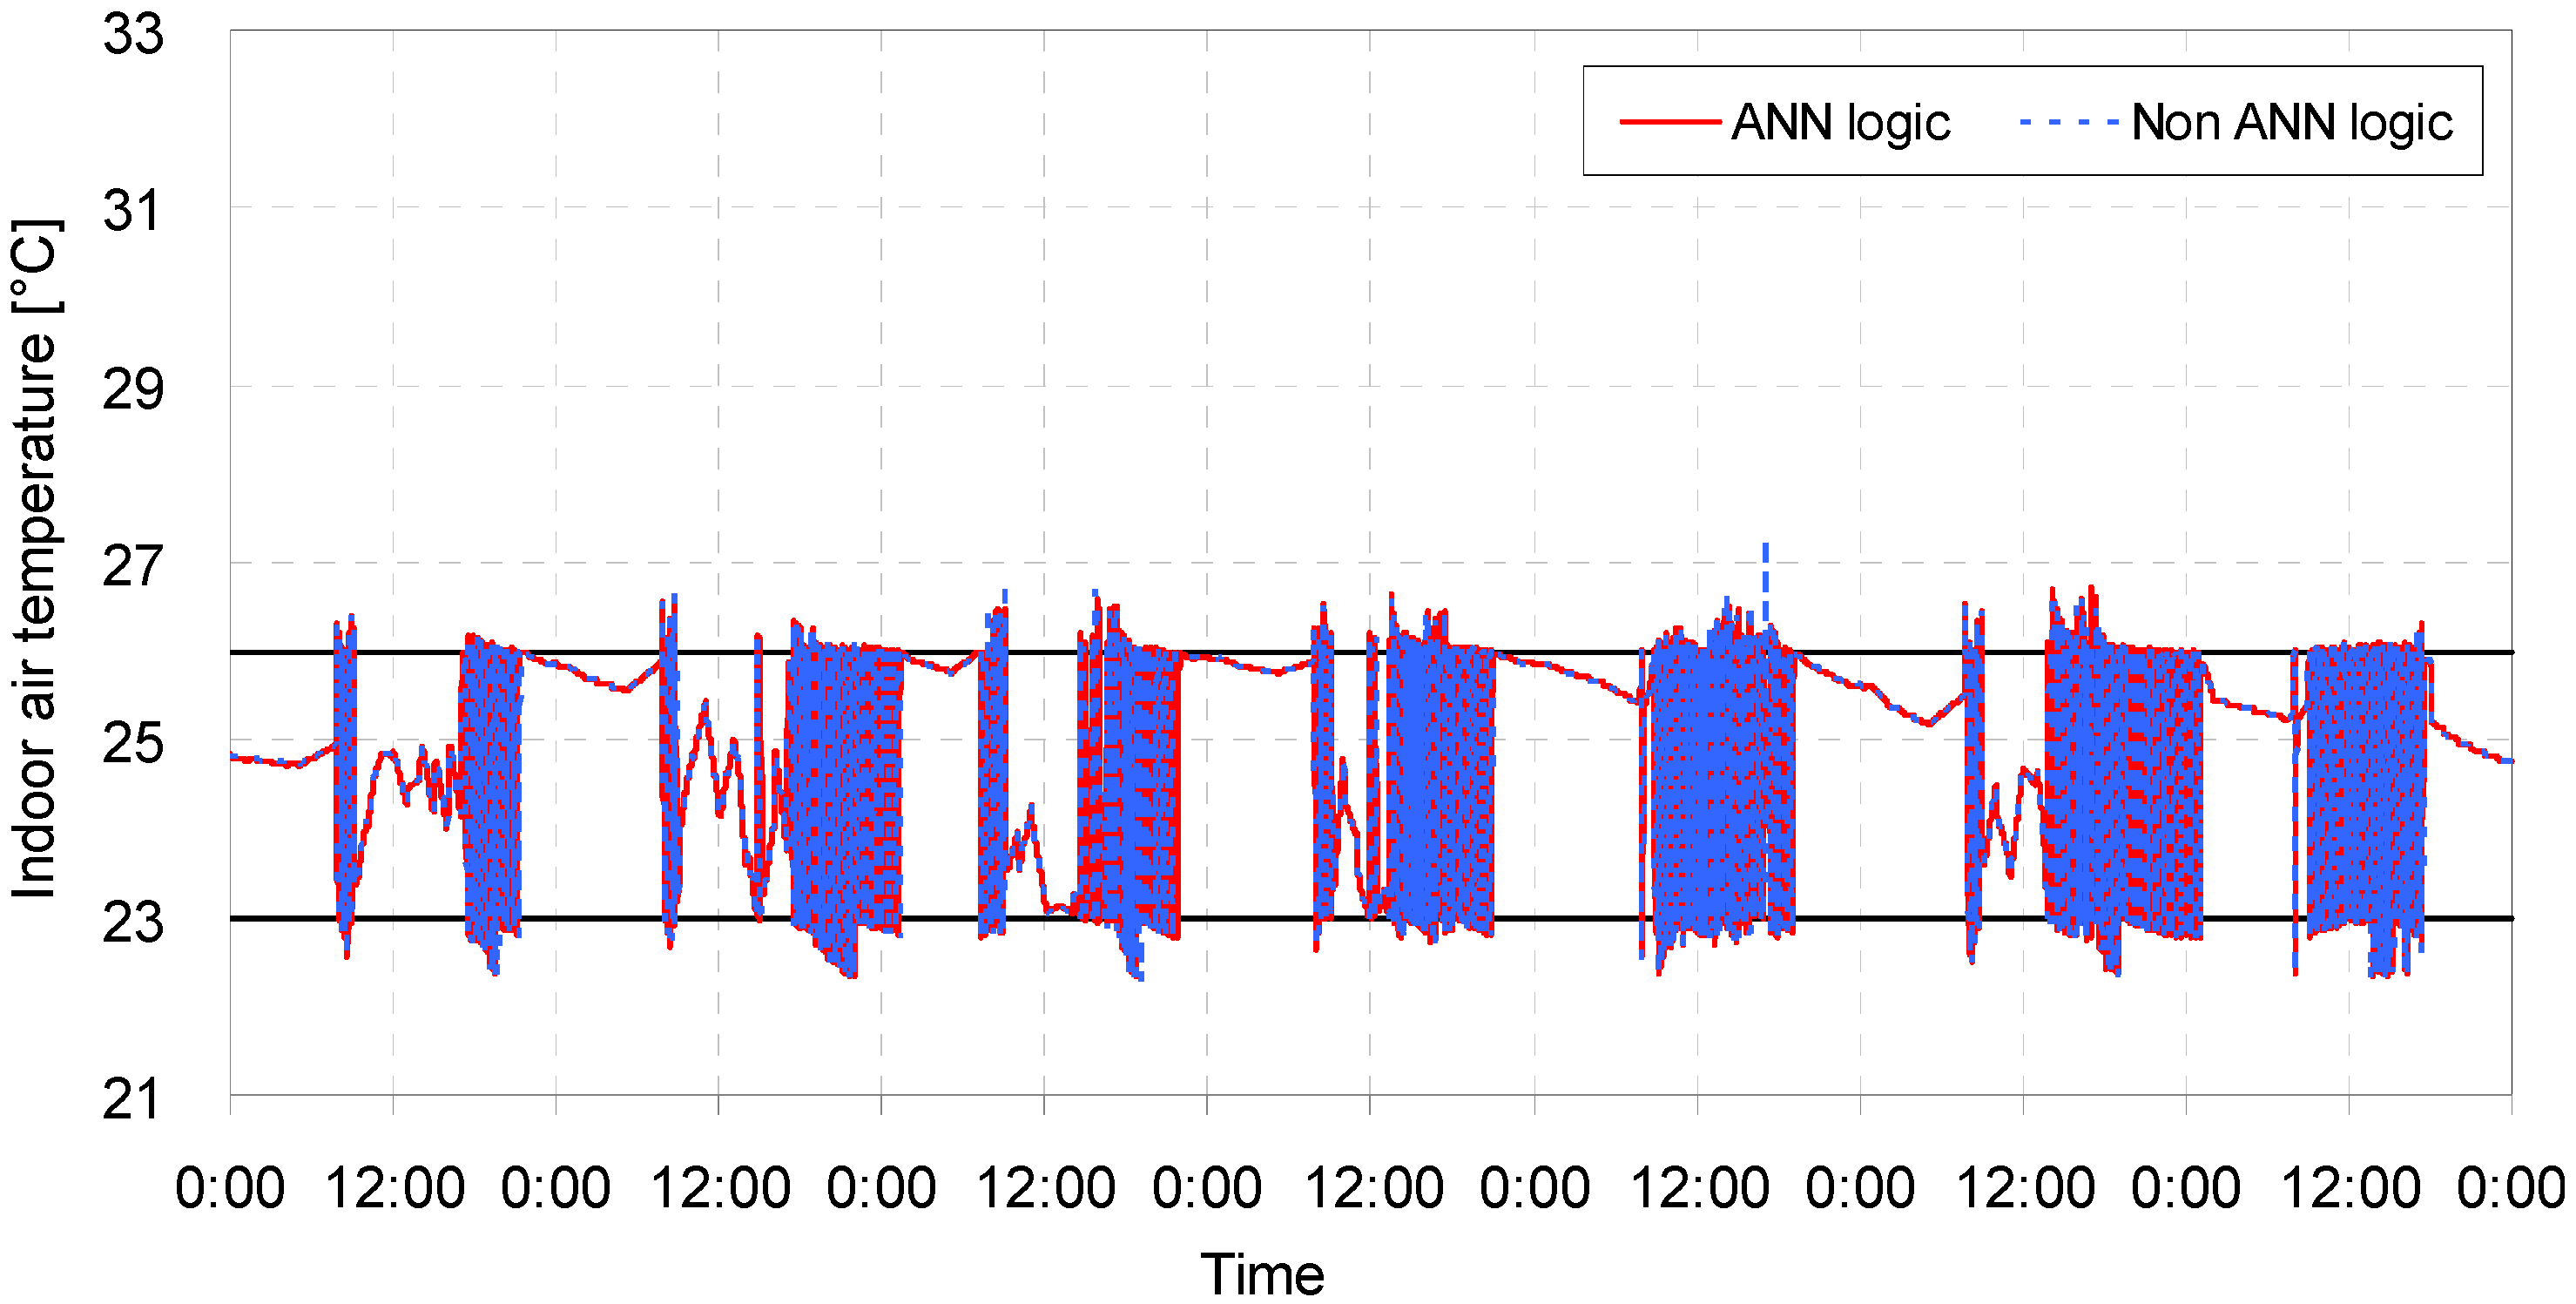


| Case | Opening conditions | ANN model application | Comfortable period in percentile | Uncomfortable period in percentile | Average temperature (°C) | Amount of heat removal (kJ) | ||
|---|---|---|---|---|---|---|---|---|
| Internal envelope | External envelope | Over comfort range | Under comfort range | |||||
| 1 | Closed | Closed | No | 90.11 | 4.57 | 5.32 | 24.98 | 956,625 |
| Yes | 90.79 | 4.32 | 4.89 | 24.98 | 956,386 | |||
| 2 | Closed | Open | No | 92.36 | 3.57 | 4.07 | 24.97 | 851,555 |
| Yes | 92.56 | 3.52 | 3.92 | 24.96 | 852,392 | |||
| 3 | Open | Closed | No | 72.60 | 23.05 | 4.36 | 25.62 | 1,222,348 |
| Yes | 80.60 | 19.39 | 0.00 | 25.61 | 1,222,109 | |||
| 4 | Open | Open | No | 79.00 | 9.37 | 11.63 | 24.66 | 945,389 |
| Yes | 79.02 | 9.23 | 11.76 | 24.62 | 969,415 | |||
6. Conclusions
Nomenclature:
| TEMPIN | Indoor air temperature (°C) |
| ΔTEMPIN | Indoor air temperature change from the preceding cycle (°C) |
| TEMPOUT | Outdoor air temperature (°C) |
| TEMPCAV | Cavity air temperature (°C) |
| TEMPPR | Indoor air temperature change predicted by the ANN model (°C) |
| Ni | Number of neurons in the input layer |
| Nh | Number of neurons in the hidden layer |
| No | Number of neurons in the output layer |
| Nd | Number of training data sets |
Acknowledgments
Conflicts of Interest
References
- Moon, J.W.; Yoon, S.H.; Kim, S. Development of an artificial neural network model based thermal control logic for double skin envelopes in winter. Build. Environ. 2013, 61, 149–159. [Google Scholar] [CrossRef]
- Moon, J.W.; Chang, J.D.; Kim, S. Artificial Neural Network for Controlling the Openings of Double Skin Envelopes and Cooling Systems. In Proceedings of the 2012 International Conference on Sustainable Design and Construction, Fort Worth, TX, USA, 2012; pp. 81–89.
- Kim, Y.M.; Lee, J.H.; Kim, S.M.; Kim, S. Effect of double skin envelopes on natural ventilation and heating loads in office buildings. Energy Build. 2011, 43, 2118–2126. [Google Scholar] [CrossRef]
- Kim, Y.M.; Sohn, J.Y.; Shin, S.W.; Kim, S. Contribution of natural ventilation in a double skin envelope to heating load reduction in winter. Build. Environ. 2009, 44, 2235–2244. [Google Scholar]
- Baldinelli, G. Double skin facades for warm climate regions: Analysis of a solution with an integrated movable shading system. Build. Environ. 2009, 44, 1107–1118. [Google Scholar] [CrossRef]
- Yoon, S.H.; Park, C.S. Control levels of a double skin façade. J. Archit. Inst. Korea Plan. Des. 2010, 26, 307–326. [Google Scholar]
- Gratia, E.; De Herde, A. Natural cooling strategies efficiency in an office building with a double-skin façade. Energy Build. 2004, 36, 1139–1152. [Google Scholar] [CrossRef]
- Moon, J.W.; Kim, S. Artificial neural network for the control of the openings and cooling systems of the double skin envelope buildings. Adv. Mater. Res. 2013, 610, 2859–2865. [Google Scholar]
- MathWorks. MATLAB 14. Available online: http://www.mathworks.com (accessed on 17 October 2008).
- Moon, J.W.; Kim, S. Application of artificial neural network for optimum controls of windows and heating systems of double-skinned buildings. Korean J. Air-Condit. Refrig. Eng. 2012, 8, 627–635. [Google Scholar] [CrossRef]
- Asdrubali, F.; Cotana, F.; Messineo, A. On the evaluation of solar greenhouse efficiency in building simulation during the heating period. Energies 2012, 5, 1864–1880. [Google Scholar] [CrossRef]
- Kalogirou, S.A.; Bojic, M. Artificial neural networks for the prediction of the energy consumption of a passive solar building. Energy 2000, 25, 479–491. [Google Scholar] [CrossRef]
- University of Wisconsin. TRNSYS16.1. Available online: http://sel.me.wisc.edu/trnsys/ (accessed on 10 December 2010).
- Design of Environmental-Friendly Houses and Guidelines for Performance Evaluation; Ministry of Land, Transport and Maritime Affairs: Gwacheon, Korea, 2009.
- Alpine. Sizing Estimator for Heating & Cooling Equipment. Available online: http://www.alpinehomeair.com/view.cfm?objID=4A176770-C3EB-4E97-AAED-C34B81D7AFED (accessed on 23 November 2012).
- American Society of Heating, Refrigerating and Air Conditioning Engineers (ASHRAE). Energy-Efficient Design of Low-Rise Residential Buildings; ANSI-ASHRAE Standard 90.2-2004; ASHRAE: Atlanta, GA, USA, 2004. [Google Scholar]
© 2013 by the authors; licensee MDPI, Basel, Switzerland. This article is an open access article distributed under the terms and conditions of the Creative Commons Attribution license (http://creativecommons.org/licenses/by/3.0/).
Share and Cite
Moon, J.W.; Chin, K.-I.; Kim, S. Optimum Application of Thermal Factors to Artificial Neural Network Models for Improvement of Control Performance in Double Skin-Enveloped Buildings. Energies 2013, 6, 4223-4245. https://doi.org/10.3390/en6084223
Moon JW, Chin K-I, Kim S. Optimum Application of Thermal Factors to Artificial Neural Network Models for Improvement of Control Performance in Double Skin-Enveloped Buildings. Energies. 2013; 6(8):4223-4245. https://doi.org/10.3390/en6084223
Chicago/Turabian StyleMoon, Jin Woo, Kyung-Il Chin, and Sooyoung Kim. 2013. "Optimum Application of Thermal Factors to Artificial Neural Network Models for Improvement of Control Performance in Double Skin-Enveloped Buildings" Energies 6, no. 8: 4223-4245. https://doi.org/10.3390/en6084223