A Dynamic Model for the Normal Impact of Fly Ash Particle with a Planar Surface

Abstract
:1. Introduction
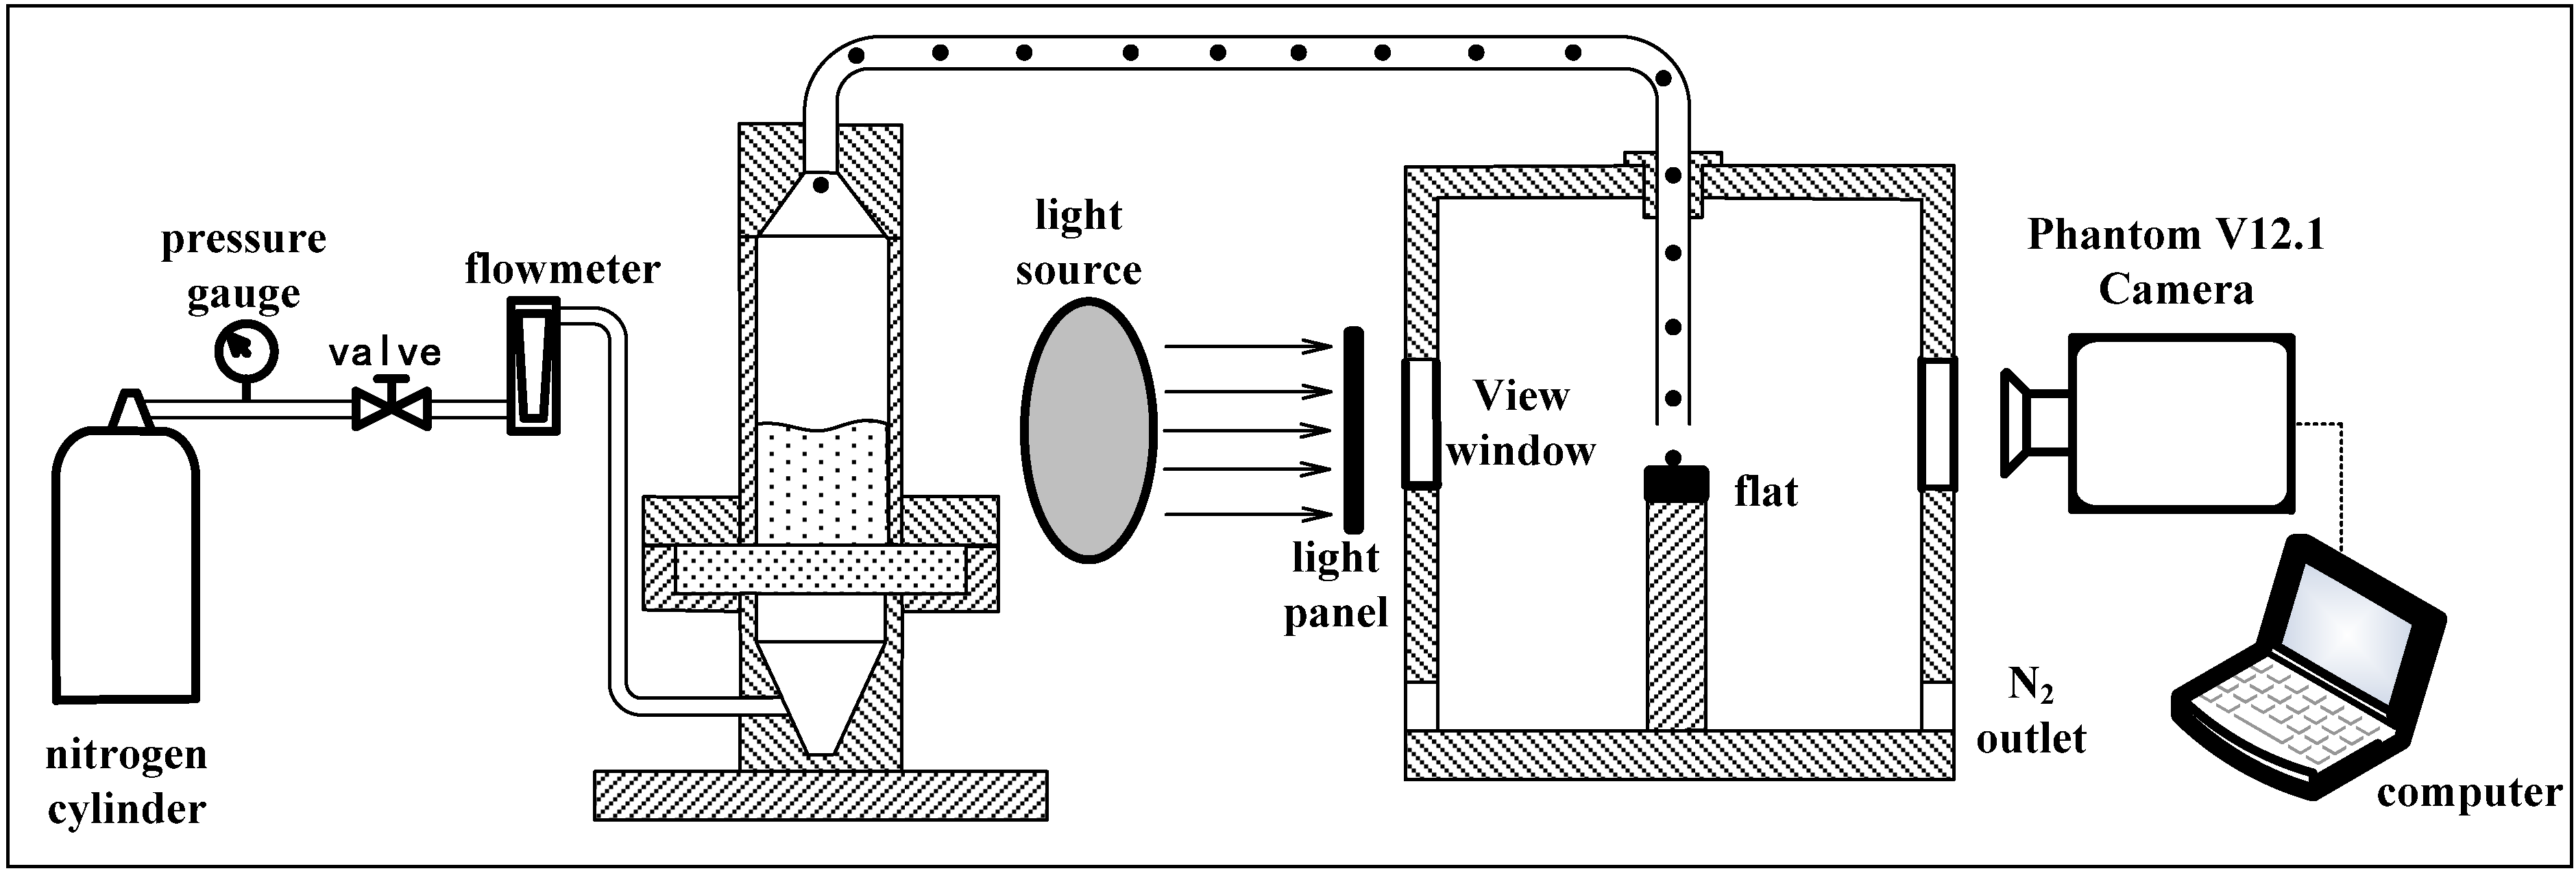
2. Description of Experiments


| Particle size (mesh) | Total cryscrystalline phase (vol%) | Quart (zvol%) | Mullite (vol%) |
|---|---|---|---|
| 104 μm (230) | 67.31 | 10.19 | 57.12 |
| 96 μm (270) | 55.02 | 6.29 | 48.73 |
| 88 μm (325) | 49.28 | 1.65 | 47.63 |
3. Theoretical
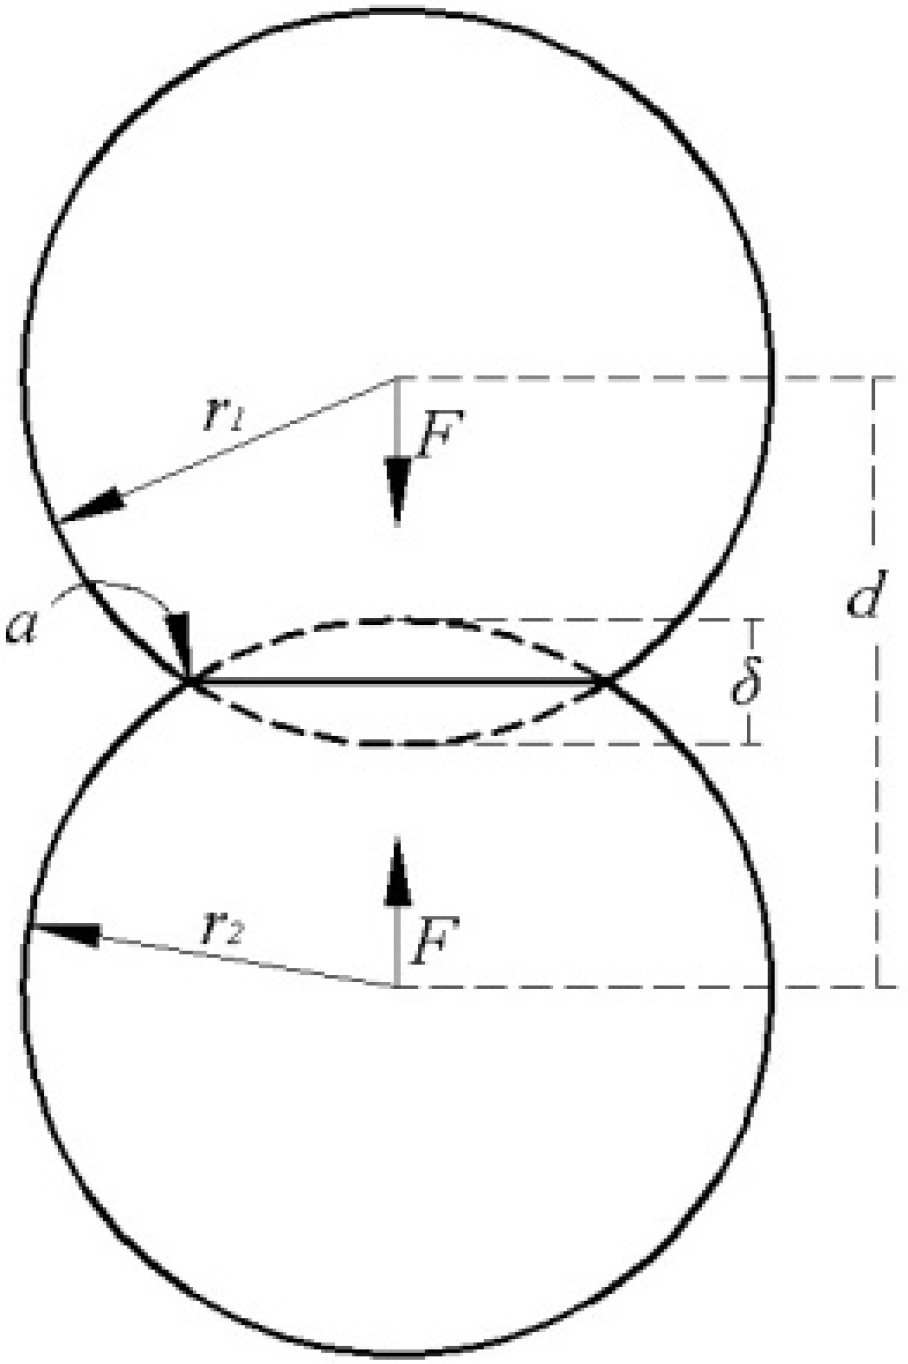
3.1. Dynamic Model

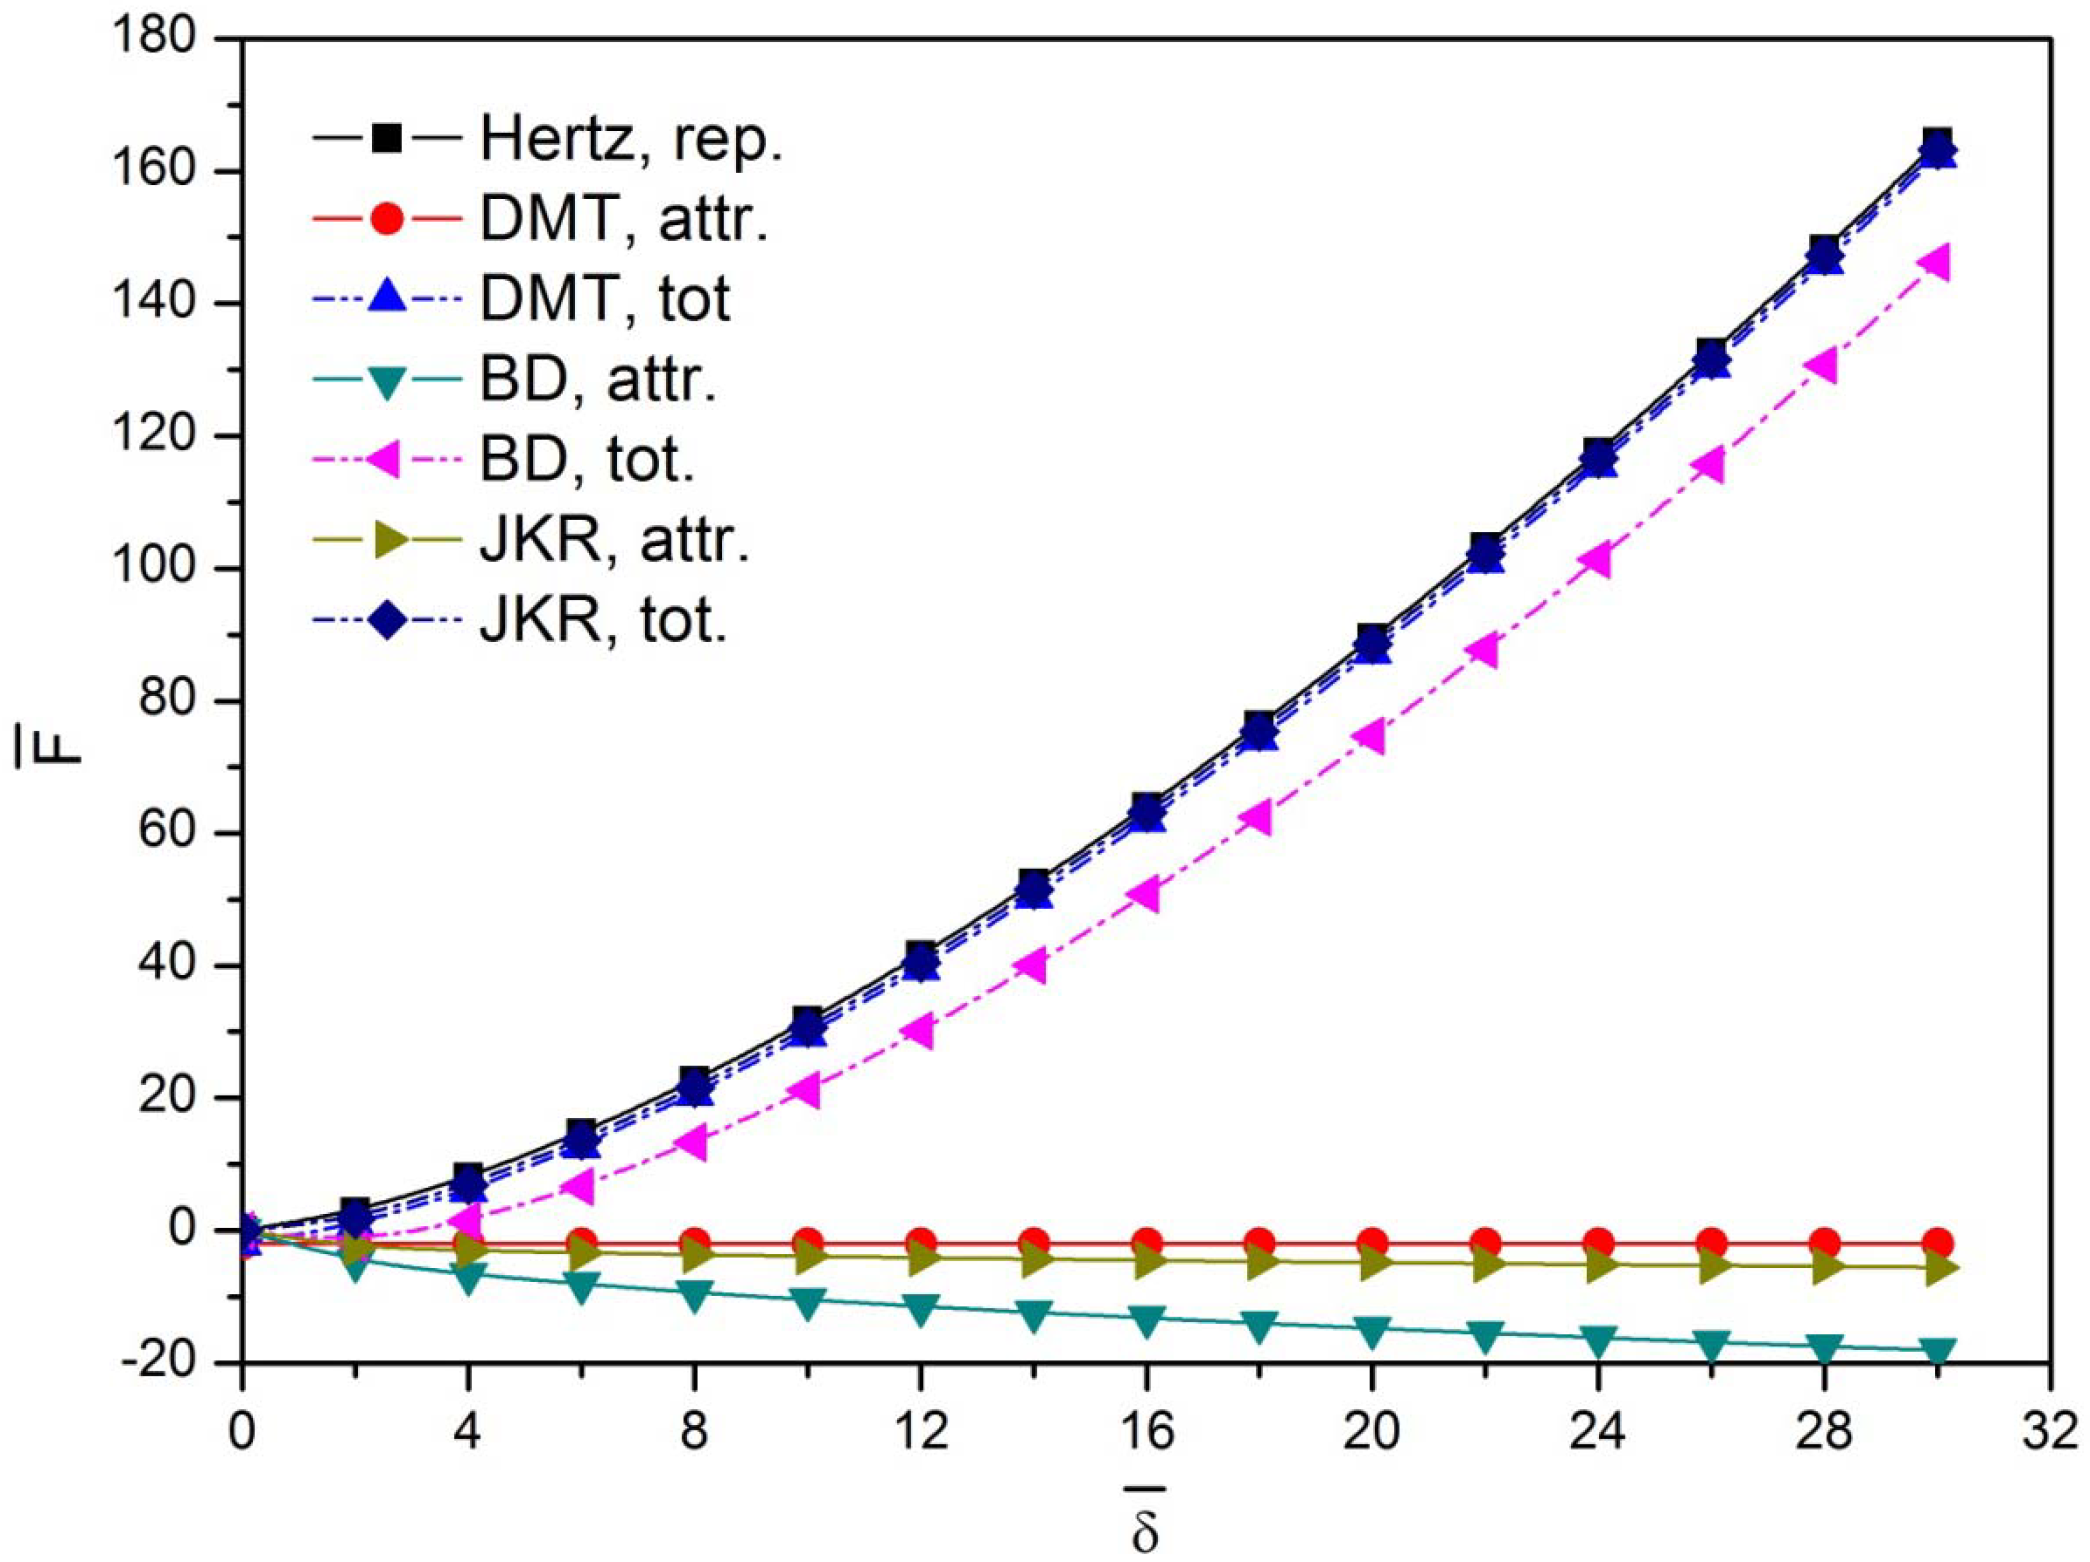
3.2. Energy Dissipation
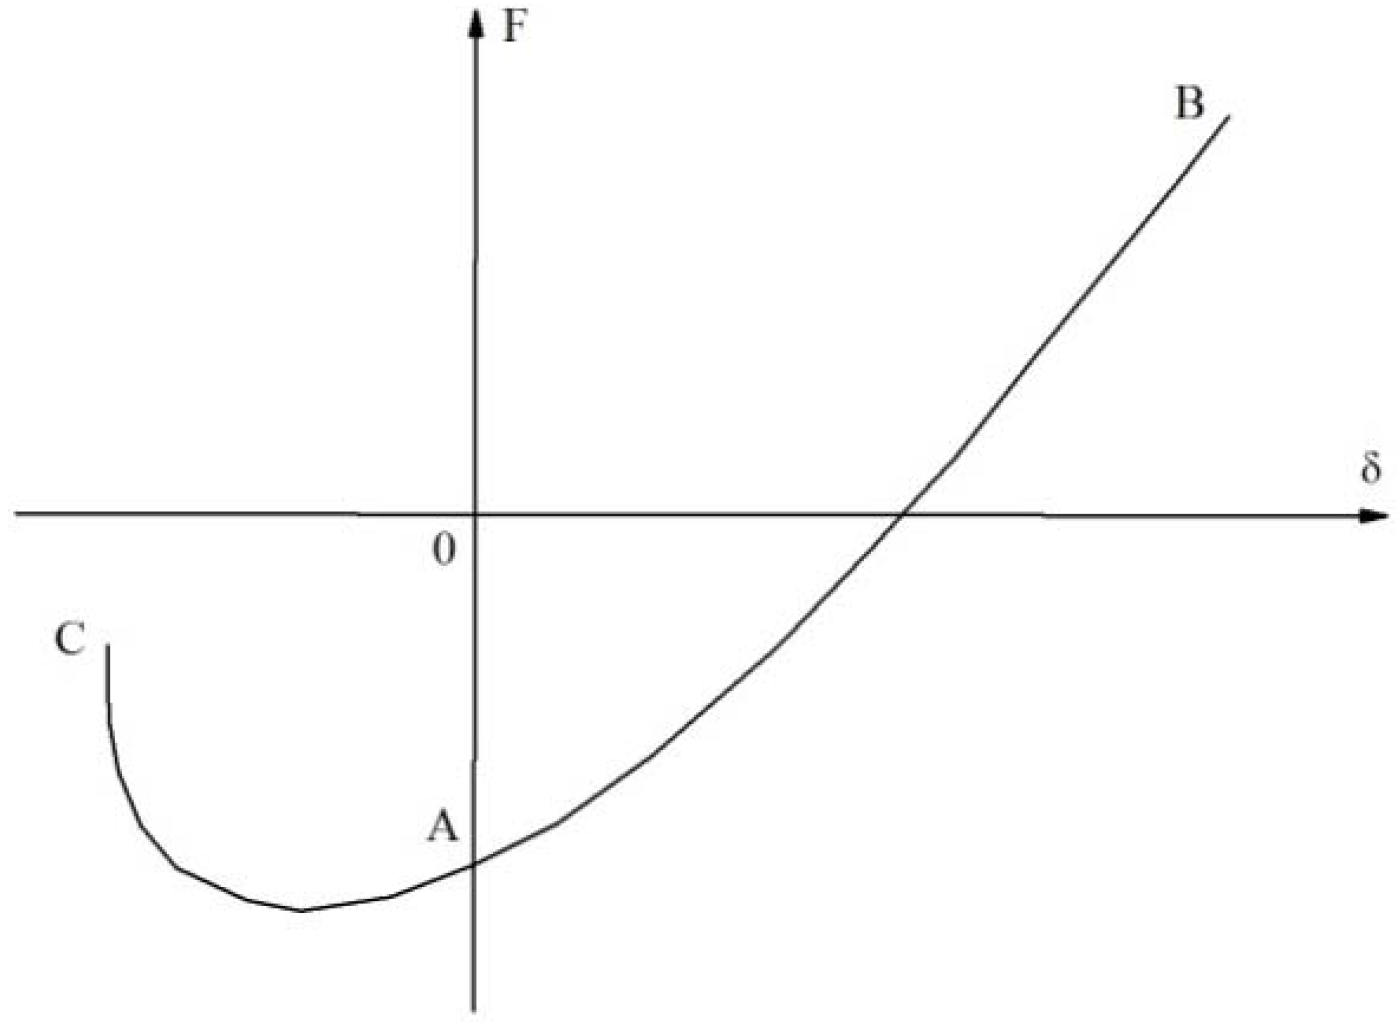
3.3. Models Solution
4. Results and Discussion
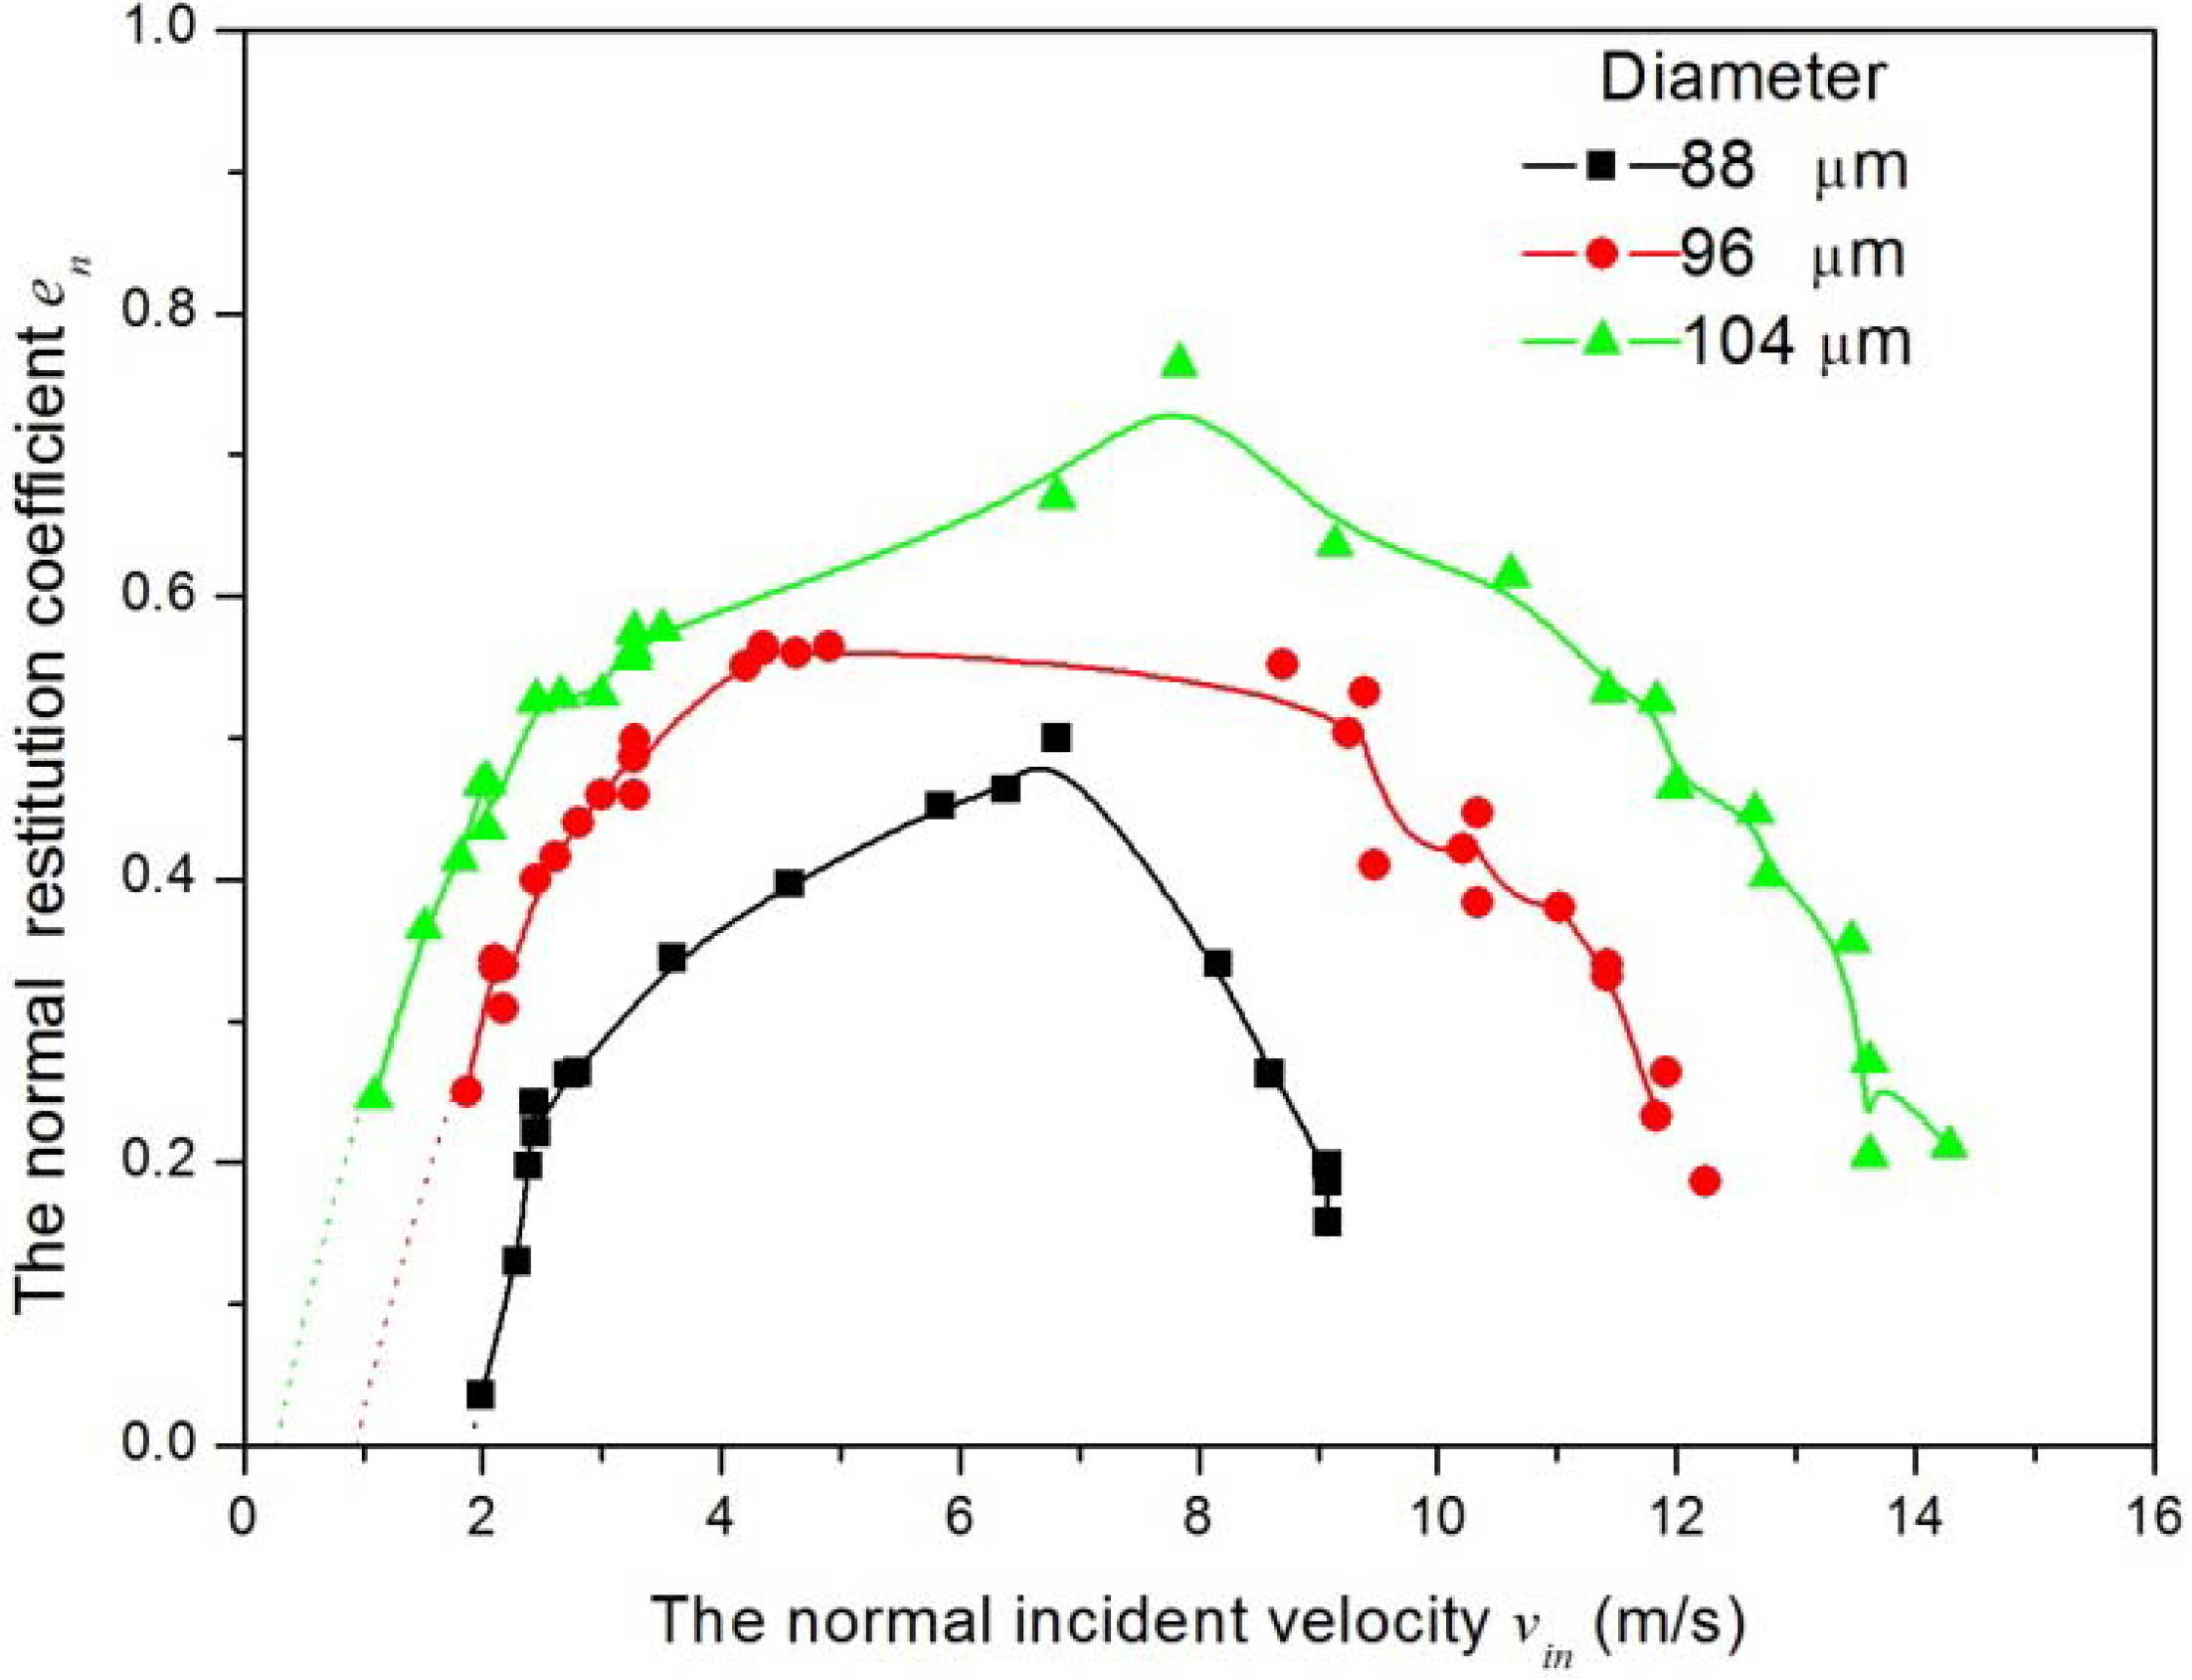
4.1. Experimental Results

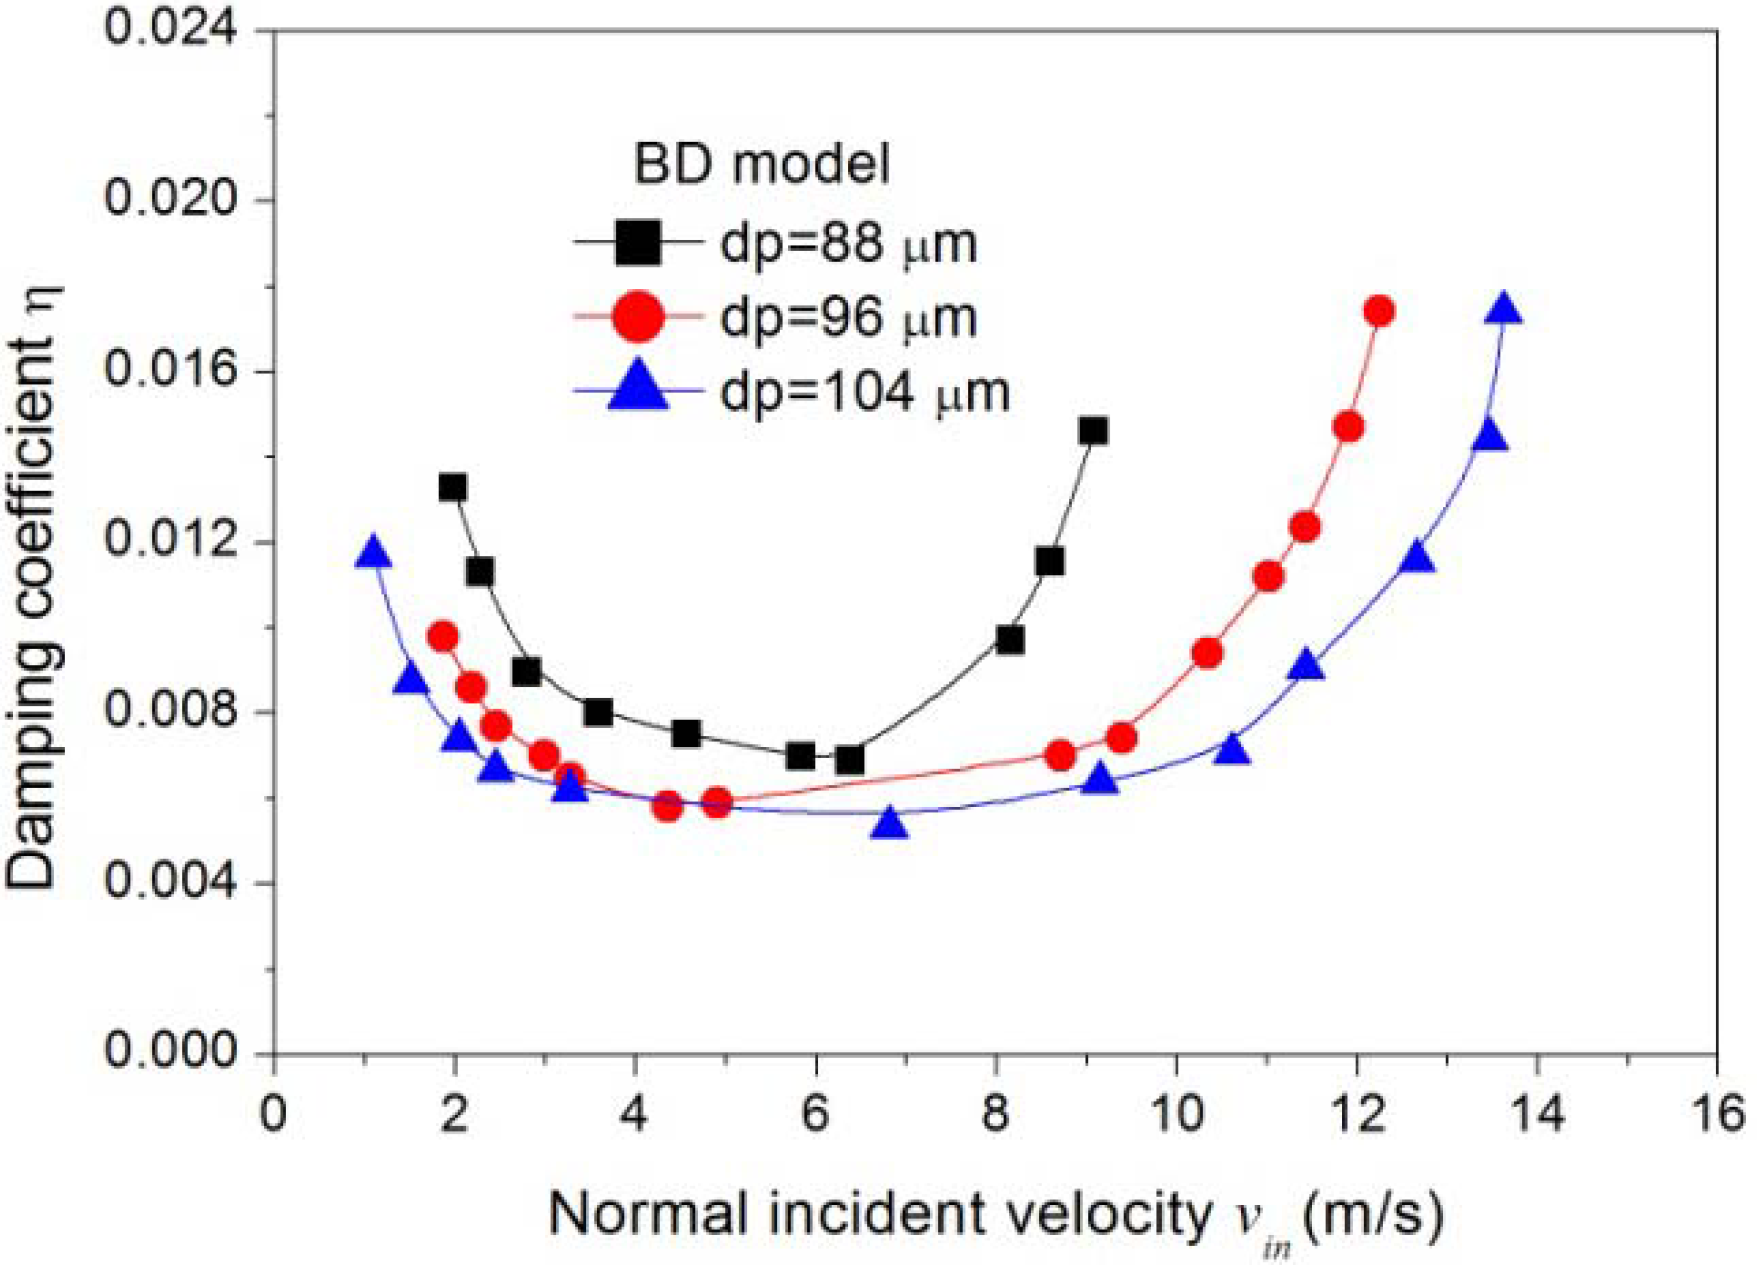
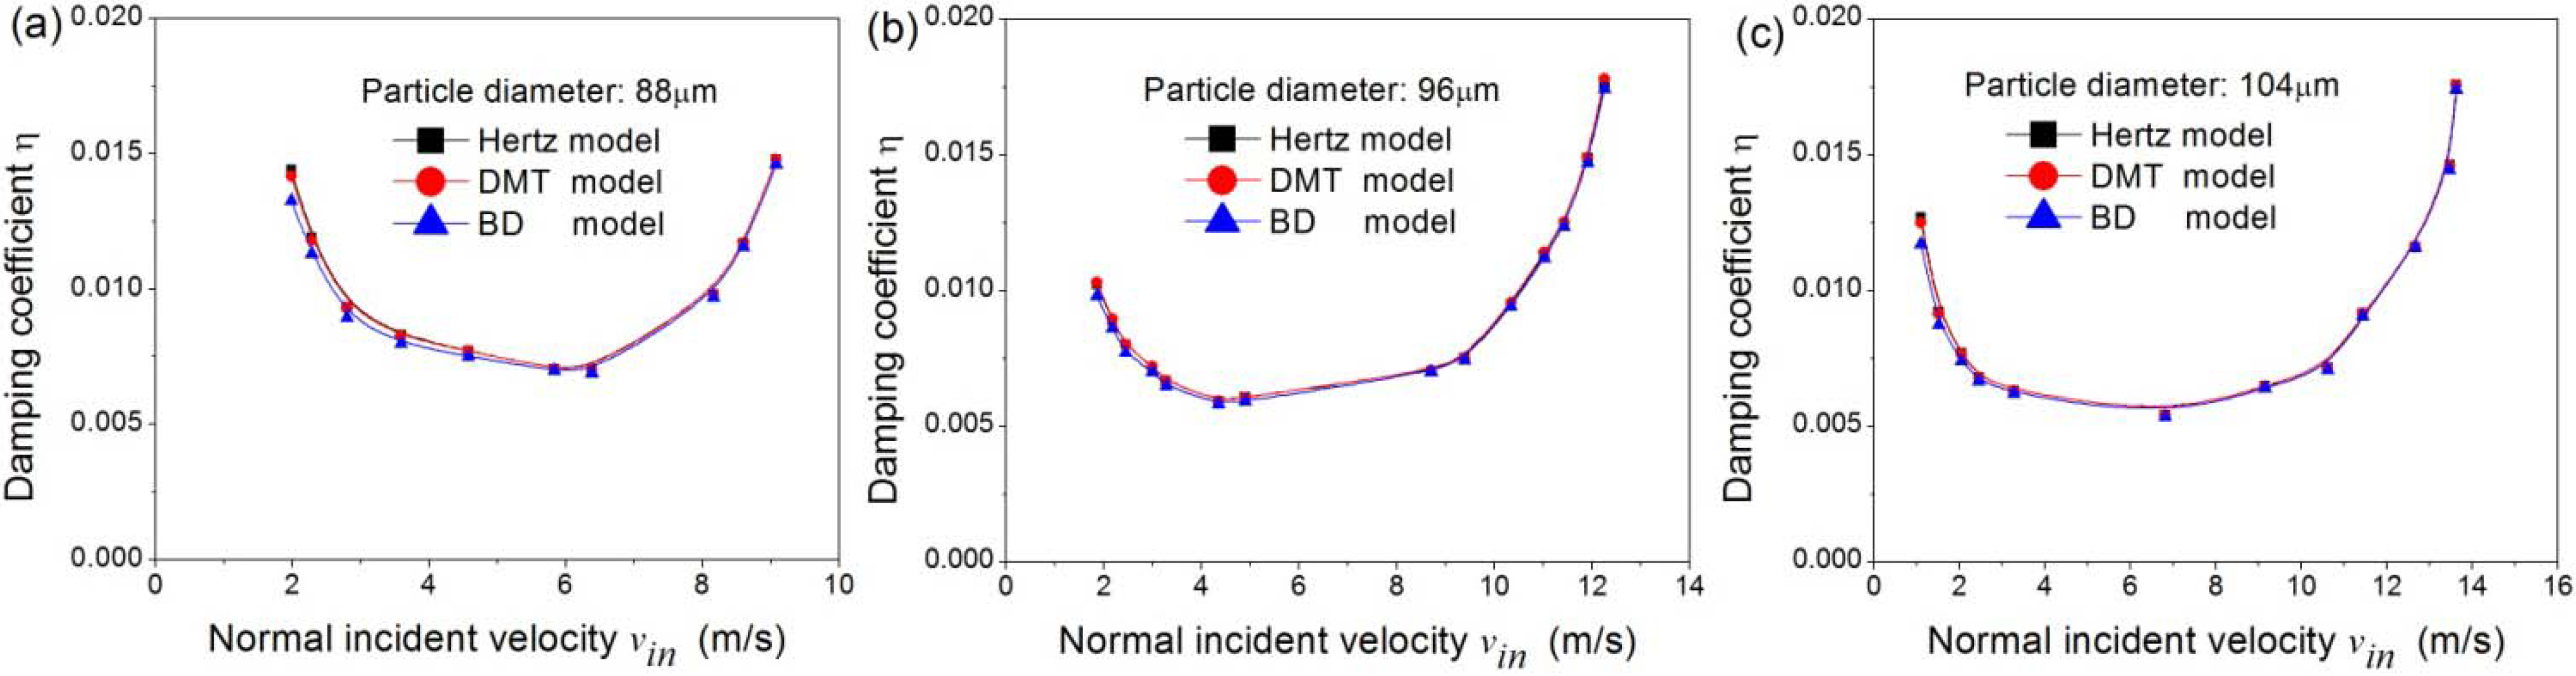
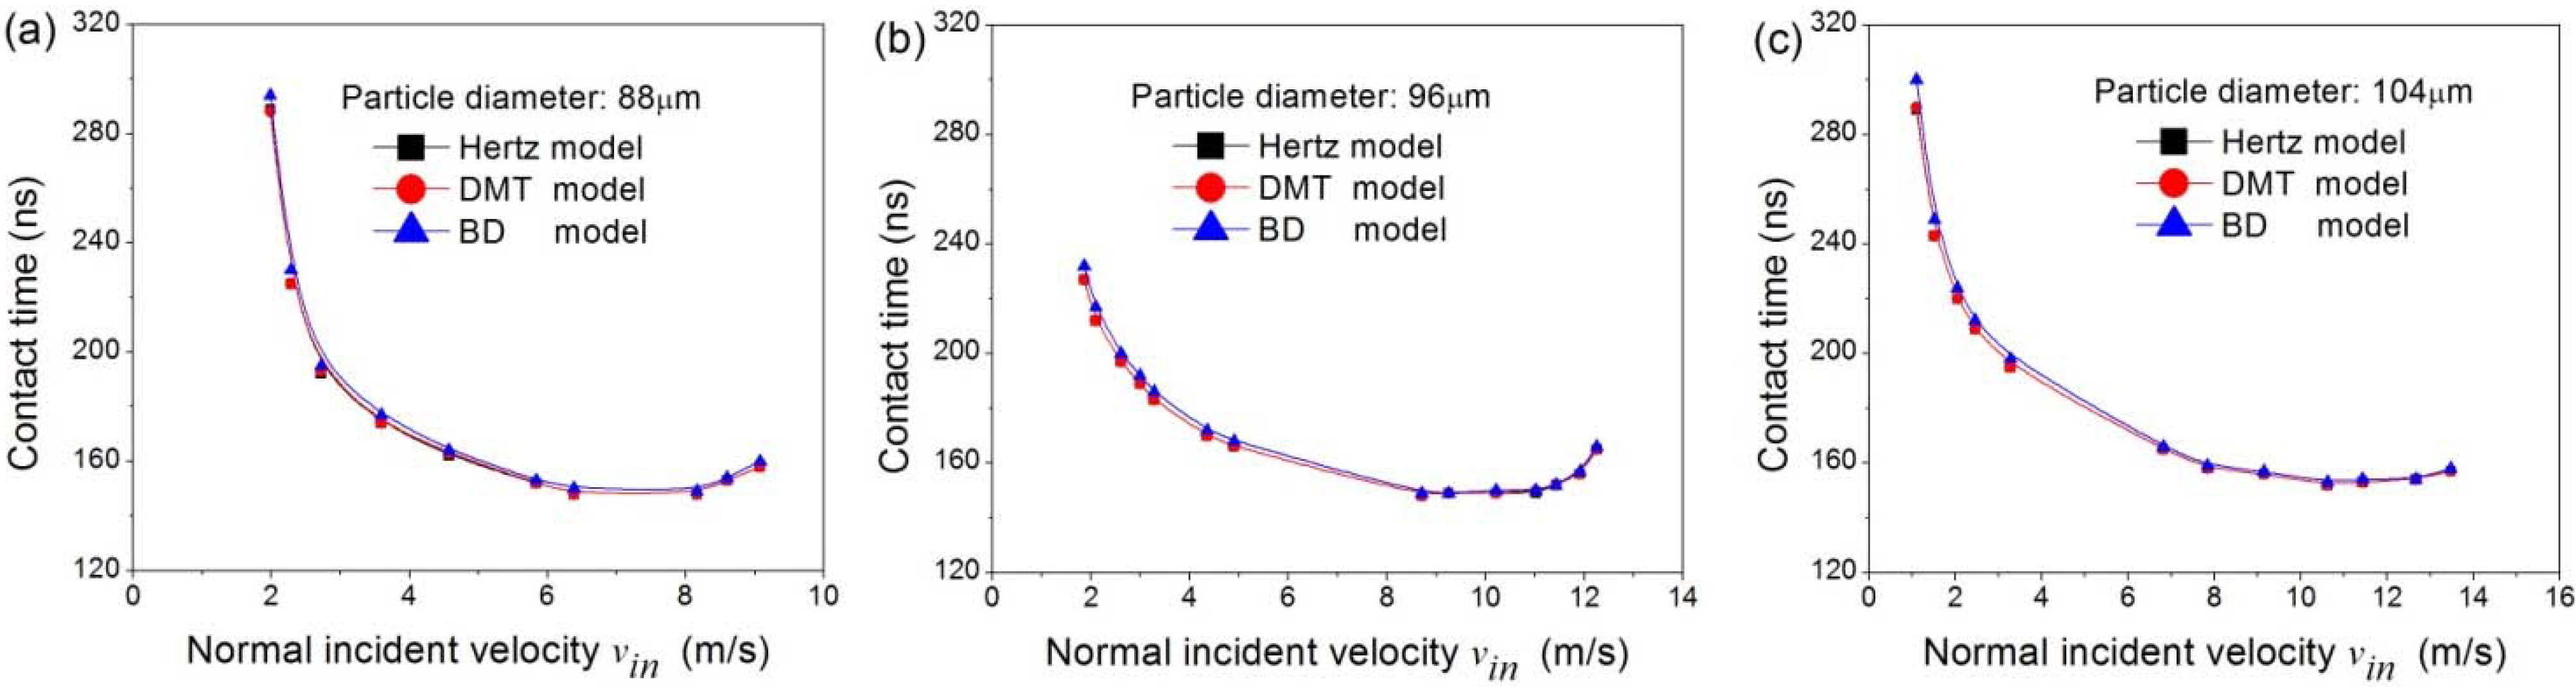
4.2. Dependence of Damping Coefficient on Incident Velocity

4.3. Critical Normal Impact Velocity
| Models dp (μm) | Hertz model | DMT model | BD model |
|---|---|---|---|
| 88 | η = 0.0238en2 − 0.0291en + 0.0153 | η = 0.0223en2 − 0.0279en + 0.0151 | η = 0.0193en2 − 0.0247en + 0.0141 |
| 96 | η = 0.0104en2 − 0.0229en + 0.0155 | η = 0.0115en2 − 0.0235en + 0.0156 | η = 0.0101en2 − 0.0213en + 0.0149 |
| 104 | η = 0.0074en2 − 0.0217en + 0.0163 | η = 0.0065en2 − 0.0206en + 0.016 | η = 0.0043en2 − 0.017en + 0.0145 |
| Particle diameter (μm) | Hertz model | DMT model | BD model |
|---|---|---|---|
| 88 | 0.0153 | 0.0151 | 0.0141 |
| 96 | 0.0155 | 0.0156 | 0.0149 |
| 104 | 0.0163 | 0.0160 | 0.0145 |
| Particle diameter (μm) | Hertz model (m/s) | DMT model (m/s) | BD model (m/s) | Experimental results |
|---|---|---|---|---|
| 88 | 1.57 | 1.85 | 1.93 | 1.92 |
| 96 | 0.71 | 1.05 | 1.27 | 1.25 |
| 104 | 0.42 | 0.64 | 0.72 | 0.69 |
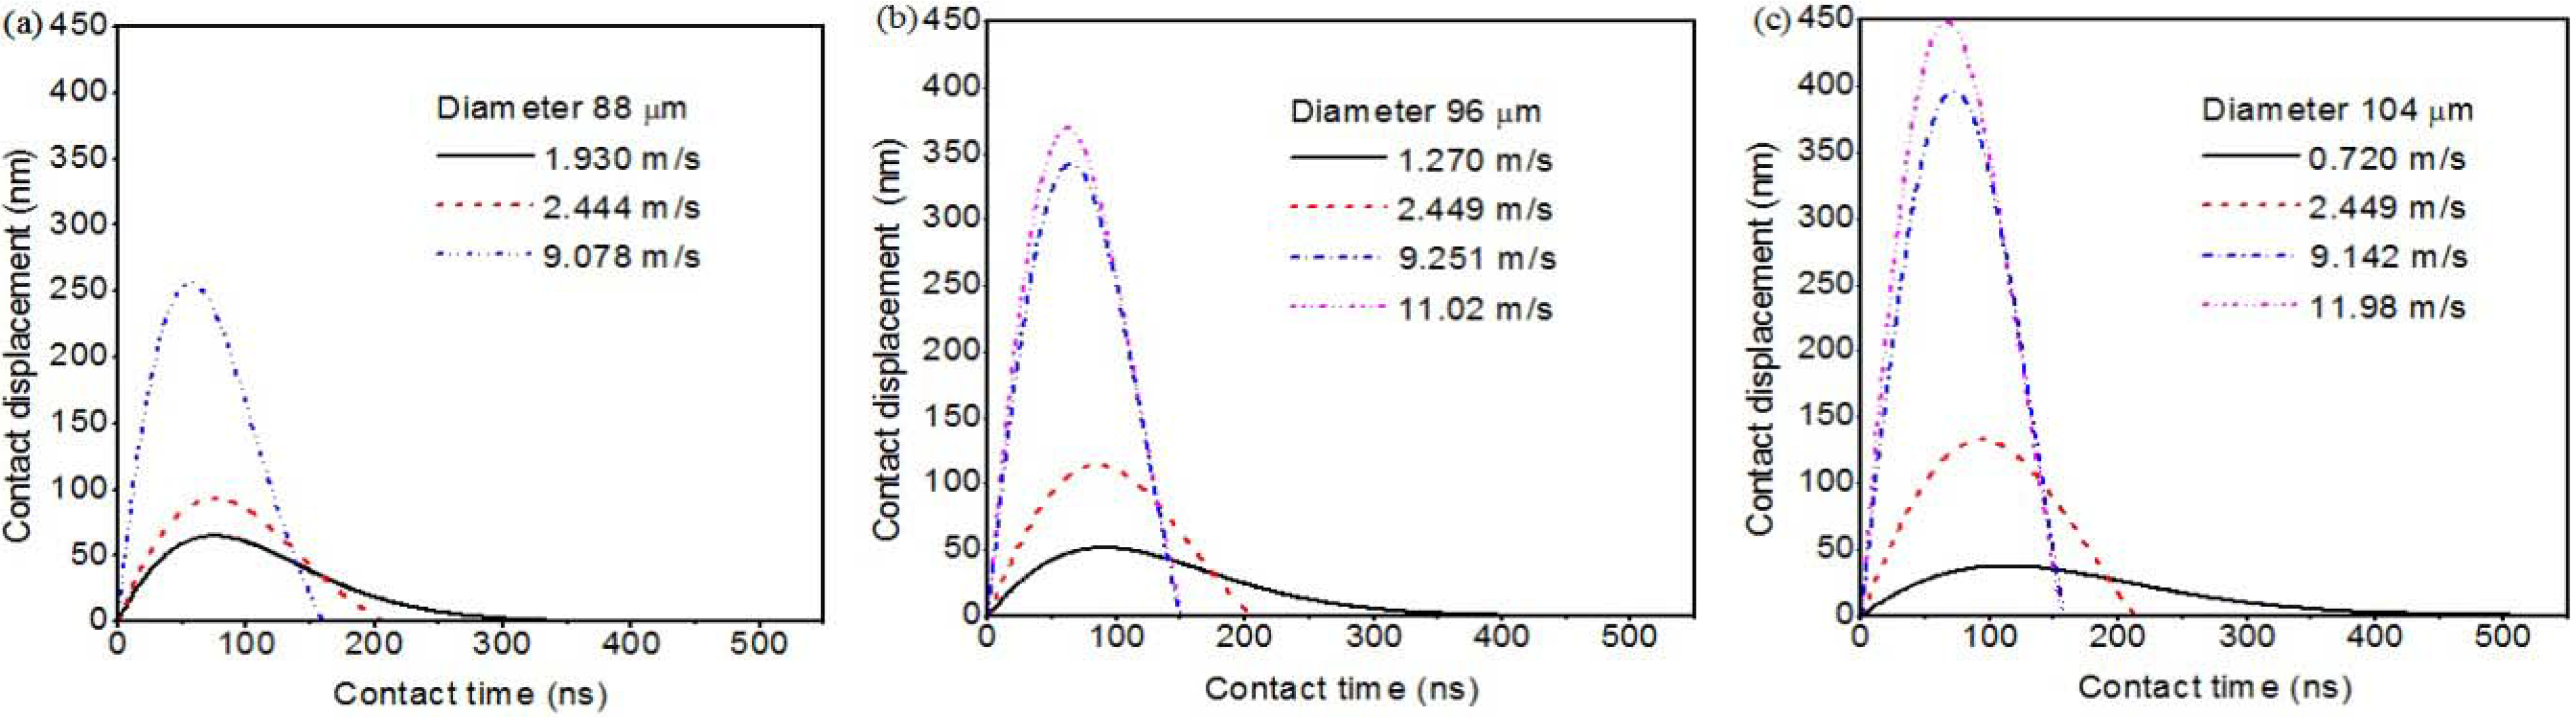
4.4. Contact Displacement-Contact Time Curve
5. Conclusions
- (1)
- The impact of fly ash particles with a rigid substrate shows some differences than that of elastic spheres, especially at higher incident velocities. For fly ash particles, it can be found that the normal restitution coefficient rapidly increases with increasing incident velocity for the incident velocity is less than the yield velocity, and rapidly decreases with increasing incident velocity for the incident velocity is greater than the yield velocity.
- (2)
- The variation of damping coefficient with normal incident velocity can be roughly divided into three parts. In the first part, damping coefficient decreases with increasing normal incident velocity. In the second part, damping coefficient is little changed with increasing normal incident velocity. In the third part, damping coefficient rapidly increases with increasing normal incident velocity. In all parts, damping coefficient calculated based on the three models tend to be consistent for the same normal incident velocity.
- (3)
- For lower incident velocities, viscoelastic dissipation plays a more important role in the impact process than plastic deformation. The contact time increases with decreasing incident velocity. On the other hand, when the incident velocity exceeds the yield limit velocity, plastic deformation dissipation dominates the impact behavior. The contact time increases with increasing the normal incident velocity.
- (4)
- The critical velocity decreases with increasing particle size. Comparing the critical velocities obtained by the three models with that obtained by experiment; we can find the results calculated by the BD model are close to the experimental value, which shows the BD model is applicable for describing the interaction behavior between ash particles and planar surfaces. Generally, the line force approximation adopted by the BD model has overestimated the adhesion force. According to this, the BD model is applicable for describing the interaction behavior between ash particles and planar surfaces under the present conditions.
- (5)
- The contact time in the incoming stage is larger than that in the rebounding stage, and the difference of contact time in the incoming and rebound stages decreases with increasing incident velocity. For the critical incident velocity, the contact time increases with increasing particle diameter. For the normal incident velocity is greater than the critical incident velocity, the maximum contact displacement increases with increasing incident velocity. For the same normal incident velocity, the maximum contact displacement increases with increasing diameter.
Acknowledgments
Conflict of Interest
References
- Losurdo, M.; Spliethoff, H.; Kiel, J. Ash deposition modeling using a visco-elastic approach. Fuel 2012, 102, 145–155. [Google Scholar] [CrossRef]
- Baxter, L.L.; De Sollar, R.W. A mechanistic description of ash deposition during pulverized coal combustion: Predictions compared with observations. Fuel 1993, 72, 1411–1418. [Google Scholar] [CrossRef]
- Kostoglou, M.; Konstandopoulos, A.G. Particulate deposit shape evolution on cylinders in cross-flow at high stokes numbers. J. Aerosol Sci. 1999, 31, 427–436. [Google Scholar] [CrossRef]
- Brach, R.M.; Dunn, P.F. A mathematical model of the impact and adhesion of microspheres. Aerosol Sci. Technol. 1992, 16, 51–64. [Google Scholar] [CrossRef]
- Dahneke, B. Measurements of the bouncing of small latex spheres. J. Colloid Interface Sci. 1973, 45, 584–590. [Google Scholar] [CrossRef]
- Dahneke, B. Further measurements of the bouncing of small latex spheres. J. Colloid Interface Sci. 1975, 51, 58–65. [Google Scholar] [CrossRef]
- Rogers, L.N.; Reed, J. The adhesion of particles undergoing an elastic-plastic impact with a surface. J. Phys. D Appl. Phys. 1984, 17, 677–689. [Google Scholar] [CrossRef]
- Dunn, P.F.; Brach, R.M.; Caylor, M.J. Experiments on the Low-Velocity Impact of Microspheres with Planar Surfaces. Aerosol Sci. Technol. 1995, 23, 80–95. [Google Scholar] [CrossRef]
- Kim, O.V.; Dunn, P.F. Direct visualization and model validation of microsphere impact and surface capture. J. Aerosol Sci. 2008, 39, 373–375. [Google Scholar] [CrossRef]
- Wall, S.; John, W.; Wang, H.C.; Goren, S.L. Measurements of kinetic energy loss for particles impacting surfaces. Aerosol Sci. Technol. 1990, 12, 926–946. [Google Scholar] [CrossRef]
- Brach, R.M.; Dunn, P.F. Macrodynamics of microparticles. Aerosol Sci. Technol. 1995, 23, 51–71. [Google Scholar] [CrossRef]
- Konstandopoulos, A.G. Deposit growth dynamics: Particle sticking and scattering phenomena. Powder Technol. 2000, 109, 262–277. [Google Scholar] [CrossRef]
- Guanqing, L.; Shuiqing, L.; Qiang, Y. A JKR-based dynamic model for the impact of micro-particle with a flat surface. Powder Technol. 2011, 207, 215–223. [Google Scholar] [CrossRef]
- John, W. Particle-surface interactions: charge transfer, energy loss, resuspension, and deagglomeration. Aerosol Sci. Technol. 1995, 23, 2–24. [Google Scholar] [CrossRef]
- Dahneke, B. Particle bounce or capture-search for an adequate theory: I. Conservation-of-energy model for a simple collision process. Aerosol Sci. Technol. 1995, 23, 25–39. [Google Scholar] [CrossRef]
- Andres, R.P. Inelastic energy transfer in particle/surface collisions. Aerosol Sci. Technol. 1995, 23, 40–50. [Google Scholar] [CrossRef]
- Kostoglou, M.; Konstandopoulos, A.G. Particulate deposit shape evolution oncylinders in cross-flow at high Stokes numbers. J. Aerosol Sci. 2000, 31, 427–436. [Google Scholar] [CrossRef]
- Thornton, C.; Ning, Z. A theoretical model for the stick/bounce behaviour of adhesive, elastic-plastic spheres. Powder Technol. 1998, 99, 154–162. [Google Scholar] [CrossRef]
- Cundall, P.A.; Strack, O.D.L. A discrete numerical model for granu-lar assemblies. Geotechnique 1979, 29, 47–65. [Google Scholar] [CrossRef]
- Marshall, J.S. Discrete-element modeling of particulate aerosol flows. J. Comput. Phys. 2009, 228, 1541–1561. [Google Scholar] [CrossRef]
- Shuiqing, L.; Marshall, J.S. Discrete element simulation of micro-particle deposition on a cylindrical fiber in an array. J. Aerosol Sci. 2007, 38, 1031–1046. [Google Scholar] [CrossRef]
- Cheng, W.; Brach, R.M.; Dunn, P.F. Three-dimensional modeling of microsphere contact/impact with smooth, flat surfaces. Aerosol Sci. Technol. 2002, 36, 1045–1060. [Google Scholar] [CrossRef]
- Kim, O.V.; Dunn, P.F. A microsphere-surface impact model for implementation in computational fluid dynamics. J. Aerosol Sci. 2007, 38, 532–549. [Google Scholar] [CrossRef]
- Johnson, K.L.; Kendall, K.; Roberts, A.D. Surface energy and the contact of elastic solids. Proc. R. Soc. Lond. A 1971, 324, 301–313. [Google Scholar] [CrossRef]
- Adb-Elhady, M.S.; Rindt, C.C.M.; Wijers, J.G.; van Steenhoven, A.A. Modelling the impaction of a micron particle with a powdery layer. Powder Technol. 2006, 165, 53–64. [Google Scholar] [CrossRef]
- Matsunaga, T.; Kim, J.K.; Rohatgi, P.K. Crystallinity and selected properties of fly ash particles. Mater. Sci. Eng. A 2002, 325, 333–343. [Google Scholar] [CrossRef]
- Chung, F.H. Quantitative interpretation of X-ray diffraction patterns of mixtures. 11. Adiabatic principle of X-ray diffraction analysis of mixtures. J. Appl. Crystallogr. 1974, 7, 526–531. [Google Scholar] [CrossRef]
- Shackelford, J.F.; Alexander, W. The CRC Materials Science and Engineering Handbook; CRC Press: Boca Raton, FL, USA, 1992; pp. 436–438. [Google Scholar]
- Johnson, K.L. Contact Mechanics; Cambridge University Press: Cambridge, UK, 1985. [Google Scholar]
- Maugis, D. Contact, Adhesion and Rupture of Elastic Solids; Springer: New York, NY, USA, 2000. [Google Scholar]
- Derjaguin, B.V.; Muller, V.M.; Toporov, Y.P. Effect of contact deformations on the adhesion of particles. J. Colloid Interface Sci. 1975, 53, 314–326. [Google Scholar] [CrossRef]
- Muller, V.M.; Yushchenko, V.S.; Derjaguin, B.V. On the influence of molecular forces on the deformation of elastic spheres and its sticking to a rigid plane. J. Colloid Interface Sci. 1980, 77, 91–101. [Google Scholar] [CrossRef]
- Li, X.; Dunn, P.F.; Brach, R.M. Experimental and numerical studies on the normal impact of microspheres with surfaces. J. Aerosol Sci. 1999, 30, 439–449. [Google Scholar] [CrossRef]
- Hunt, K.H.; Crossley, F.R.E. Coefficient of restitution interpreted as damping in vibroimpact. ASME J. Appl. Mech. 1975, 97, 440–445. [Google Scholar] [CrossRef]
© 2013 by the authors; licensee MDPI, Basel, Switzerland. This article is an open access article distributed under the terms and conditions of the Creative Commons Attribution license (http://creativecommons.org/licenses/by/3.0/).
Share and Cite
Dong, M.; Han, J.; Li, S.; Pu, H. A Dynamic Model for the Normal Impact of Fly Ash Particle with a Planar Surface. Energies 2013, 6, 4288-4307. https://doi.org/10.3390/en6084288
Dong M, Han J, Li S, Pu H. A Dynamic Model for the Normal Impact of Fly Ash Particle with a Planar Surface. Energies. 2013; 6(8):4288-4307. https://doi.org/10.3390/en6084288
Chicago/Turabian StyleDong, Ming, Jian Han, Sufen Li, and Hang Pu. 2013. "A Dynamic Model for the Normal Impact of Fly Ash Particle with a Planar Surface" Energies 6, no. 8: 4288-4307. https://doi.org/10.3390/en6084288