1. Introduction
The Covenant of Mayors is the leading European movement that involves the local and regional authorities in which they agreed to increase energy efficiency and the use of renewable energy sources in their territories [
1]. Through their commitment to the Covenant signatories profess their intention to meet and exceed the European Union (EU) target of 20% reduction in CO
2 emissions by 2020. This project, promoted by the European Commission, currently involves 4627 municipalities and regional authorities (covering about 176 million inhabitants): most of them are in Italy (2300) and in Spain (1202). An interesting and innovative characteristic of this project, promoted on a voluntary basis, is the bottom-up approach for the development and implementation of the actions needed in order to achieve an improved level of sustainability.
The Sustainable Energy Action Plan (SEAP) is the planning tool of the Covenant of Mayors to promote the strategies involved. The SEAP contains concrete actions that can be implemented to achieve the target of reductions in global CO2 emissions. The number of applications of the SEAP currently submitted stands at 2348 (of which 1029 in Italy), while 519 of these were accepted by the European Commission. Local authorities can seriously reduce emissions only by increasing the environmental awareness of local citizens and stakeholders and helping them to take appropriate actions, especially in the building sector.
The new European Directive on the energy performance of buildings [
2] requires each state to implement policies to improve the efficiency of buildings, until new buildings must have almost zero energy consumption by 2020. However, a real reduction of emissions in the building sector can be achieved only by acting on the existing building stock.
The reduction of energy consumption in the residential sector in Italy, where approximately 60% of buildings were built before the first law regarding energy saving [
3], can be achieved only by retrofitting existing dwellings, a solution which is also more respectful of the urban landscape and avoids occupation of new, “green-field” land. Retrofitting not only reduces the used energy, lowering the energy bills, but also improves indoor air quality and reduces noise pollution, increasing the market value of property.
The topic covered in this work is part of this complex framework. The objective of the methodology proposed, and applied in a case study of a typical municipality of the Northern Italy, is to serve as a reference method to support Public Administration/Local Authorities in implementing SEAP in the sector of existing buildings.
Promoting actions to improve energy efficiency in the existing building stock is strategic; studies conducted in medium-sized municipalities show that this sector is responsible for at least 60% of CO
2 emissions [
4]. A first strategic step is to define the actions within a SEAP. The approach usually used is an economic one that privileges actions that, given the same initial investment, generate the greatest energy savings. This approach, however, is limited since it does not consider many aspects which are important such as those technologically critical (maintenance and replacement costs), those environmentally critical (impact during disposal technologies at the end of their useful life) and finally those which are socially critical. So far as this last issue is concerned, we believe that an important strategy for the energy renovation of existing building should primarily involve all the local economic realities (technicians, contractors, designers, businesses and artisans). For this very reason we considered interesting and useful the use of the approach proposed in multi-criteria analysis.
Multi-criteria analysis has many applications in different disciplines, not least of which in the energy sector. Roulet
et al. [
5] developed a multi-criteria rating methodology to check the compliance of a building with regulations and to evaluate the efficiency of retrofits. The aim of the methodology was to rate or to rank office buildings and retrofit scenarios of the same building according to an extended list of aspects, including energy use for heating, cooling and other appliances, impact on the outside environment, indoor environment quality and costs.
The issue of the choice between different alternative energy approaches to the redevelopment of existing buildings is analyzed by Kaklauskas
et al. [
6] who developed and tested a method of multi-variant design and multi-criteria analysis of a building refurbishment. Alanne
et al. [
7] considered the selection of a residential energy supply system as being a multi-criteria creating problem, which involves both financial and environmental issues. In the paper the authors compared micro-cogeneration heating with traditional heating systems, considering many aspects thereof. The multi-objective optimization for building retrofit strategies is the theme analyzed by Asadi
et al. [
8] who propose and apply a model to assist stakeholders in the definition of the measures necessary for the retrofit works. The aspects considered by the authors are centered on the reduction to a minimum of the energy usage in the building in a cost effective manner, whilst satisfying the occupant needs and requirements.
The approach adopted in the SEAP is quite similar to the general approach adopted for energy planning. SEAP and energy planning do not in fact operate simply at the level of the building but rather at the level of the territory involved (municipality or region). Beccali
et al. [
9] show an application of a multi-criteria methodology used to assess an action plan for the diffusion of renewable energy technologies at regional scale. In the analysis of the criteria, the authors consider technological, energy and environment, social and economic criteria. In this paper similar concepts are applied but at a different scale, not at a regional level but at that of a municipality.
2. Description of the Methodology
The methodology implemented to support municipalities for the preparation of SEAP is outlined in the flowchart in
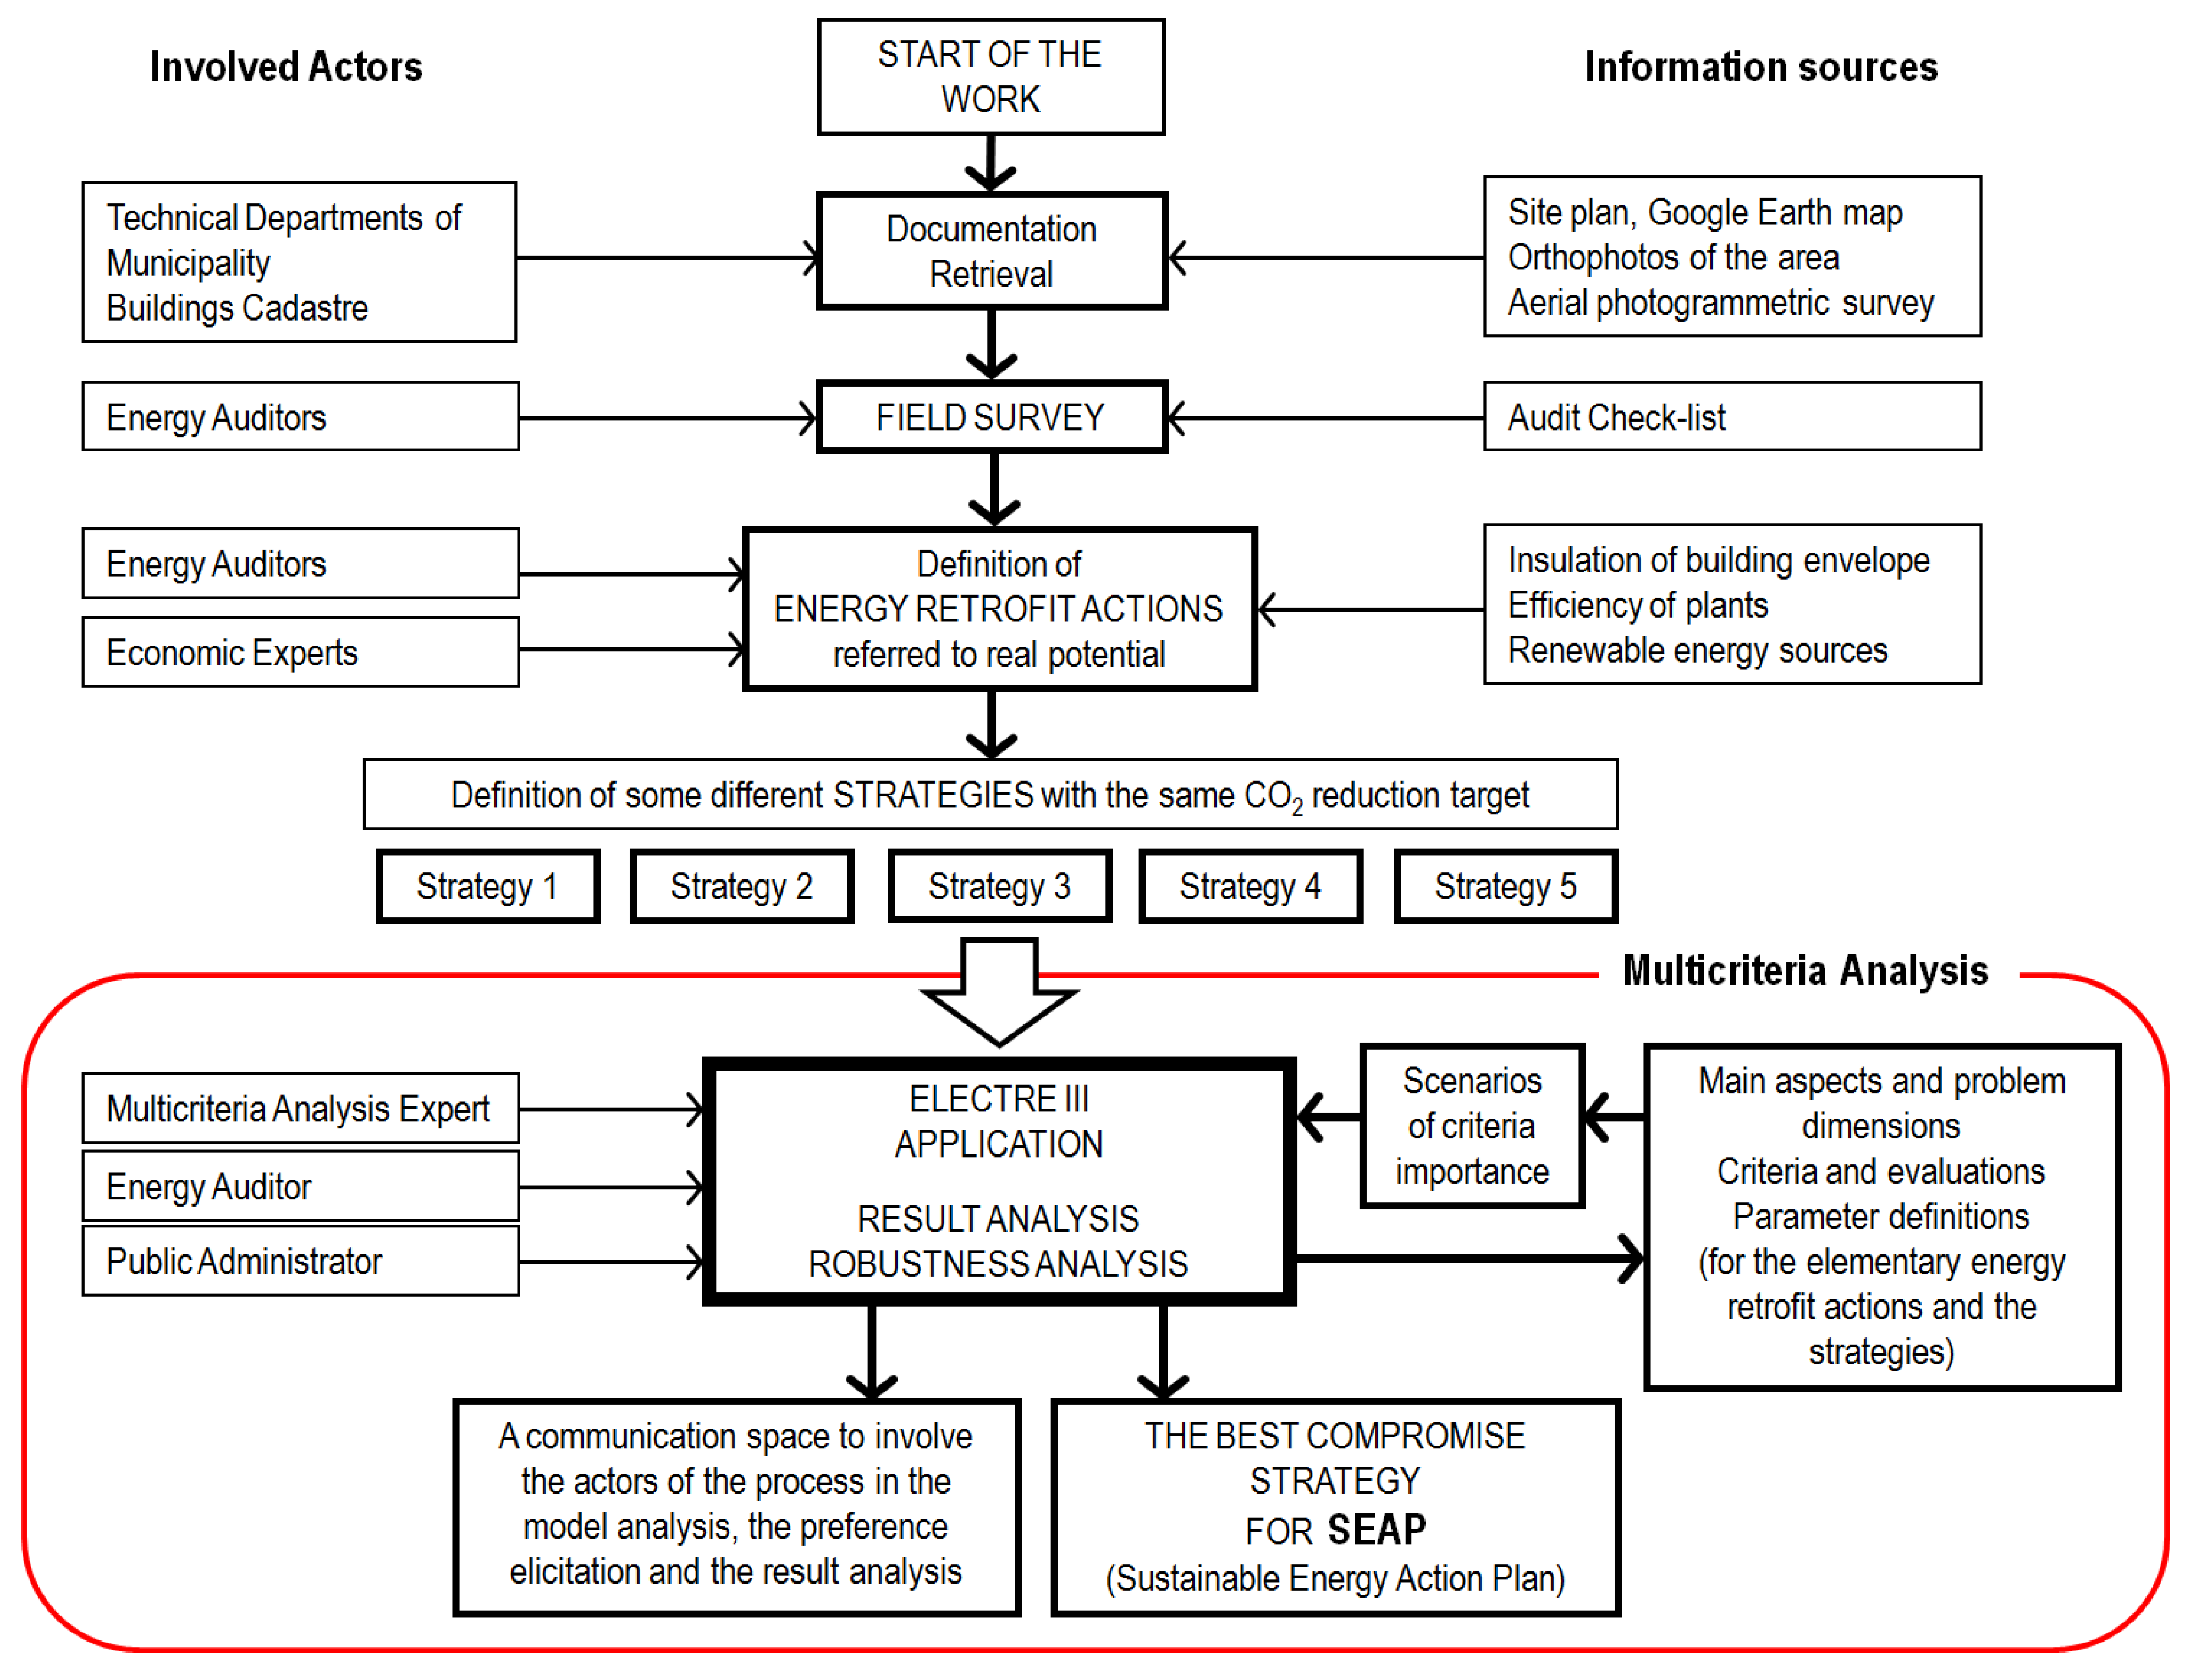
Figure 1. It is worthwhile remembering that the actions considered in our methodology improve the energetic and environmental quality of the existing building stock. The different phases are identified in the central part of the diagram, the actors involved are on the left-hand side and the data acquisition from some information sources on the right-hand side.
All activities of the procedure can be ideally divided into two macro-phases: an initial macro-phase that includes activities from acquisition and processing of energy data to the identification of actions and a second macro-phase, highlighted in the chart, which includes the multi-criteria analysis. The application of the methodology, therefore, requires a working group that includes not only experts in energy audit but also experts in multi-criteria analysis: in fact with this type of approach the results obtained could be very reliable.
The first phase involves the acquisition of the documentation on the existing building on an urban scale (i.e., site plan, aerial photogrammetric survey, orthophotos of the area, etc.). This information can be provided by the Municipality Technical Department: the availability of a building cadastre is also very useful.
At this point a field survey should be organized in order to observe and define the thermo-physical characteristics of the building stock. The methodology adopted in this phase is illustrated and discussed in [
4]: in the proposed approach, by having a detailed description of the characteristics of the building stock, it is possible to identify which energy retrofit interventions are feasible from a technical, legal and economic point of view.
Figure 1.
Flow diagram of the methodology.
Figure 1.
Flow diagram of the methodology.
The result is a tool that does not overestimate the potential energy savings since, through an analysis of all the buildings of the municipality, one can be aware of every retrofit action already performed by users.
The analysis carried out up to this point allows one to determine which energy retrofit actions can be scheduled to reach a predetermined target to a year: for example 30% of CO2 reductions by 2020.
The energy retrofit actions used for the implementation of the methodology, have been chosen in function of those mentioned nell’Annex C “Green Energy Retrofit Report” contained in the Municipality of Melzo SEAP [
10], which also correspond to those most widely used in the interventions of retrofit and that have benefited from the incentive for the last five years as mentioned in the website of National agency for new technologies, Energy and sustainable economic development (ENEA) [
11]. In fact, the energy retrofit actions may relate to measures that improve the energy efficiency of the building (e.g., replacement of windows, insulation of the opaque envelope with the ETICS—External thermal insulation composite systems—technology) the energy efficiency of the plants (e.g., replacement of the heating boiler with a condensing boiler) or the use of renewable energy resources [e.g., installation of a solar thermal plant or a solar photovoltaic (PV) plant]. The same target of CO
2 reduction could be reached with different mixes of actions: it is more correct to think about strategies for intervening, each strategy composed of a different set and quantity of actions.
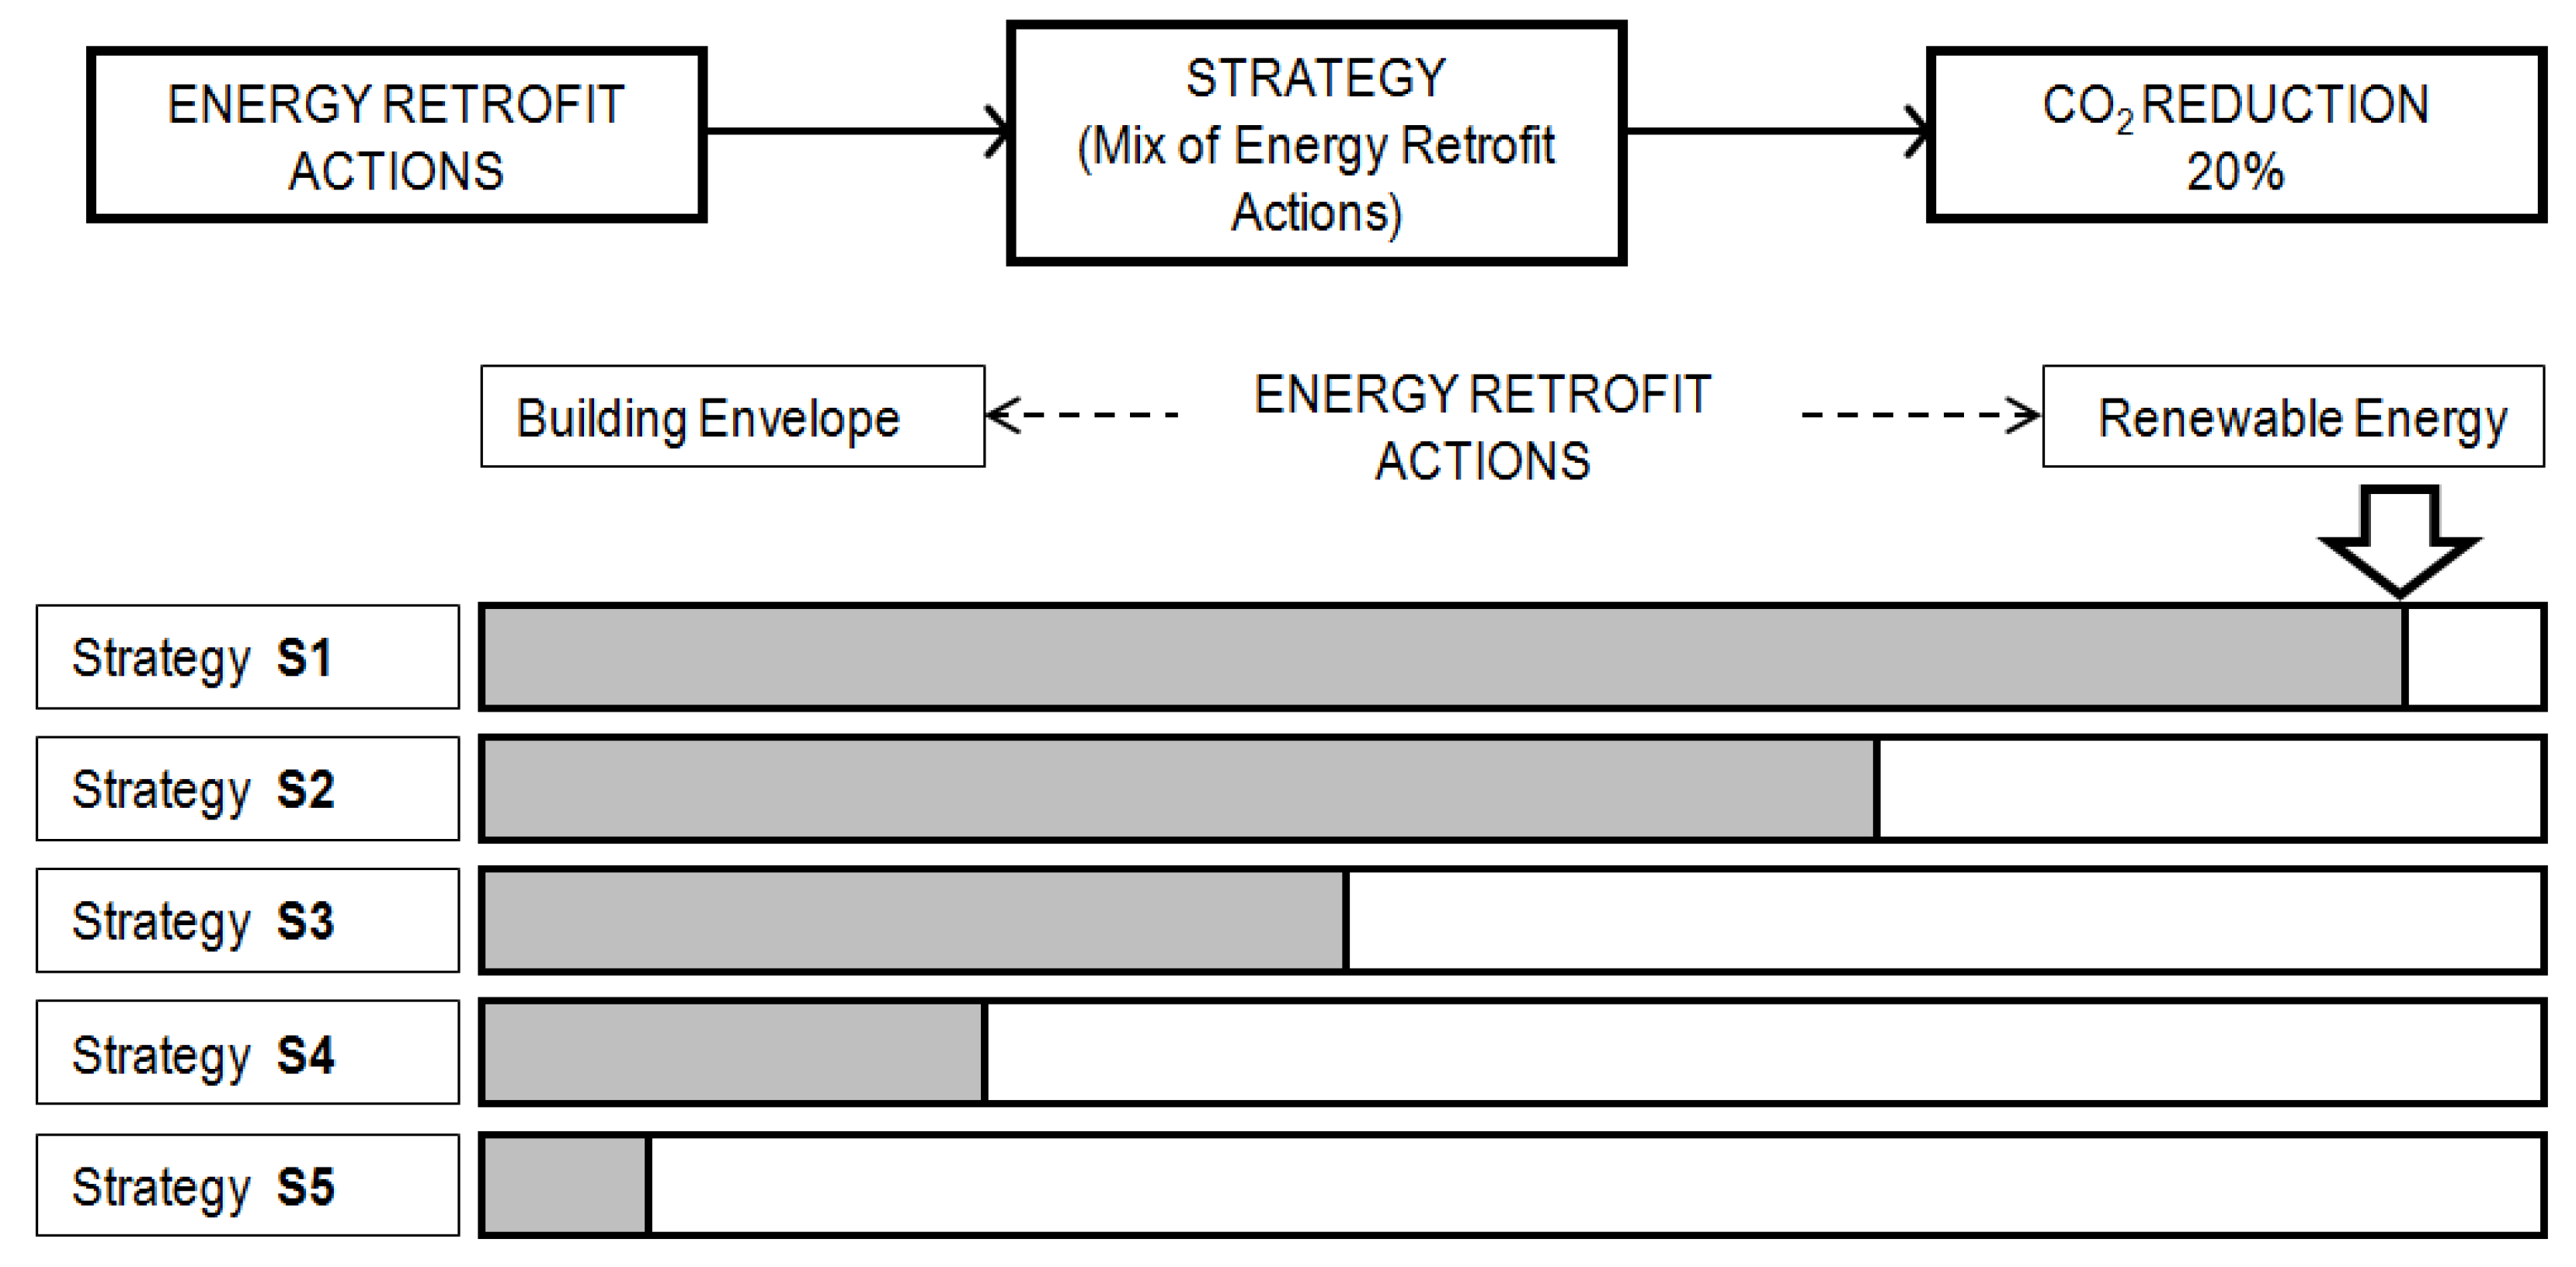
We create five different strategies, one in which the retrofit of building envelopes is strongly promoted, through to one that reflects compliance with the limits defined by law, where the emphasis in on greater use of renewable energy sources (see
Section 3.3) and the amount of retrofit action for the envelope is reduced in favor of actions for the exploitation of renewables (
Figure 2). The first strategy S1 proposes mainly measures to improve the efficiency of the building envelope while Strategy S5 proposes mainly the use of renewable energy sources. Between the two extreme strategies, S1 and S5, there are intermediate strategies with different mixes of energy efficiency and renewable energy. Defining the best strategy depends upon the approach that one wants to have.
Figure 2.
Scheme for the definition of strategies starting from the mix of the Energy Retrofit Actions.
Figure 2.
Scheme for the definition of strategies starting from the mix of the Energy Retrofit Actions.
The standard approach considers only the economic aspects: the best strategy in this case, is the most cost-effective strategy. A better and more complete approach is to choose the best strategy analyzing all the involved points of view.
A multiplicity of aspects has to be taken into account in order to compare the strategies: not only the technological, environmental and energy issues but also economic and social issues.
The complexity of this systematic approach is definitely greater since it requires knowledge about all the different aspects and the consequences of an action plan, but the result is more consistent with local policies to promote citizens’ interests. The implementation of a SEAP based only on economic evaluations would be too limitative, so we adopt a comprehensive analysis of the problem and we develop a multi-criteria model for the application of ELECTRE III as multi-criteria method of decision aiding.
Using models and methods of the multi-criteria analysis a more complete knowledge of the situation can be acquired. Additionally the identified strategies can be compared and ranked, in relation to all the aspects which are incorporated into the model as criteria and to the preference system of the involved actors. Scenarios of weights, i.e., of coefficients that indicate the relative importance of the criteria, can be proposed and used to include local policies in the model. A robustness analysis, in relation to the model components and parameters, and the definition of weighting scenarios that express a multiplicity of preference systems, is used to facilitate the convergence towards the strategy that corresponds to the best compromise between the different objectives.
Multi-Criteria Decision Aiding and the ELECTRE III Method
Decision-aiding consists of trying to provide answers to questions raised by actors involved in a decision process using a clearly specified model, as stated Roy [
12] and Bouyssou [
13]. This model should include the whole multiplicity of points of view concerning the problem and a specification of each component element; its structure should be simple, easily understandable and rigorous.
The modeling process is of great importance in decision-aiding and requires a great deal of expertise. Ill-structured problems in particular require specific emphasis on the activities of conceptualization and problem specification which lead to a good correspondence between the problem situation and its empirically supported model. The analyst’s recognition of the problem situation is related to his or her initial perception of the complexity of the situation and to the adopted approach. The modeling and validation process, according to Landry
et al. [
14], comes together with the understanding of different contingent situations and the evolution of the formulation of the problem, together with information requirements and processing.
There is a debate concerning the concept of model validity and in the multi-criteria decision aiding field it can be related to some analyses about the robustness of the decision-aiding conclusions, see Vincke [
15] and Roy [
16], and to studies about the development of multi-criteria classification models, see for instance Dias and Climaco [
17] and Dias
et al. [
18]. One of the main ideas is that the sources of critical aspects and uncertainty can be several and these must be analyzed and reduced to guarantee robust conclusions, this activity being essential in order to formalize a model apt to adequately express the problem situation.
A multi-criteria model can be defined as a “good” model because it constitutes a richer modeling language than one made up of a single criterion, a language common to all the actors of the decision process and which is operational in a variety of issues (implementation of simple reasoning and also sophisticated methods, data analysis and support for reflection, communication, negotiation, creativity, etc.). The possibility of dealing with all kinds of data and then choosing a multi-criteria method which is consistent with the nature of the data prevents a great deal of descriptive, interpretative and communication constraints. This is so mainly in the first steps of the work, when the analysts need a simple vehicle for communication and a structured context to identify and validate the essential elements of the problem and the model.
These models can be used in a learning phase to explore decision and action contexts, the solution space and the evaluation space. Stable and shared models can therefore introduce methods that reduce uncertainty on information and consequent decision-making.
A formal multi-criteria model can be considered as an “evolutive system” based on different elements, mainly the statement of the problem, the set of possible actions and the family of criteria, which can change during the modeling process. Often none of these elements is known at the outset of the process and different analysis and modeling steps have the principal task of identifying the elements, or of elaborating and rendering them operational. It rarely happens that the actions and criteria of a decision problem are objective realities which are easy to grasp and model. Multi-criteria aid to decisions implies that the scientist, before attempting to apply a method, should help the decision-maker to define these elements, and the latter may be one of his most arduous tasks, as stated Vincke [
15].
In real-world studies, defining possible actions and coherent criteria represents the greatest part of the analyst’s work, see Bouyssou [
13] and Norese [
19]. Very often, the search for a legible, operational and coherent family of criteria leads the analyst to reconsider the definition of some criteria, to introduce new ones into the family and to aggregate some of them. Thus the choice of a coherent family of criteria interacts with the construction of the various criteria. When the analyst gradually progresses towards those elements which are necessary to solve a problem, some initial data can cease to be pertinent, others may appear, new questions may be substituted for the original ones, even though the initial problem has not fundamentally changed, see Roy [
20]. If the nature of the actions and/or the problem statement partially or globally change(s), the dimensions and criteria of the previous model must be re-analyzed because they can change nature or meaning. However they are always an essential and formalized information base and enable one to move more easily towards a coherent family of criteria.
Multi-criteria modeling procedures enable a good understanding of problematic contexts and a collective development of models. Some multi-criteria procedures that have been used to support structuring and modeling are proposed in Norese and Ostanello [
21]. Important approaches to problem structuring are presented in Rosenhead [
22] and Belton and Stewart [
23] advocate that different “approaches should be seen as complementary ways of helping the decision-makers to think about the situation and to determine relevant values”.
ELECTRE III, an outranking method which ranks actions from best to worst in relation to a preference system, is here used to implement a modeling hypothesis, in terms of a coherent family of criteria and several sets of importance coefficients, in relation to a set of possible strategies, as stated Roy [
12] and [
24]. ELECTRE III starts by comparing each action (a strategy in this case) to each of the others, in relation to all the criteria. It builds the model for the fuzzy outranking relation by the notion of concordance and discordance and the computation of a concordance index, a discordance index and an outranking degree (phase I of the method). The method uses this result in the second phase of fuzzy relation exploitation, to construct two complete preorders through a descending and an ascending distillation procedure. The two complete preorders are usually not the same. When they are similar but present alternative actions that are not in the same position in both complete preorders, one needs to elaborate a partial preorder which is the intersection of the two complete preorders.
3. Application of the Methodology to the Case Study
We applied the methodology discussed in this paper to the town of Melzo in Italy, which undersigned the Covenant of Mayors in 2010 and, after defining the “balance of emissions”, has started to design SEAP using some results of this study for the energy retrofit actions in existing buildings. The commitment required by the Covenant of Mayors is to reduce CO2 emissions by at least 20%, on those of reference year 2005, by 2020. We decided to extend the evaluation period to 2030 by putting the target of CO2 reductions at 30% instead of 20%. The reason for this choice is that, applying a multi-criteria analysis, for some criteria considered in the analysis a period of fifteen years is too short.
Moreover, within the European Commission further commitments to reduce emissions beyond 2020 are under discussion: our choice is therefore fully justified.
3.1. Characteristics of the Municipality
The city of Melzo is a municipality located on the outskirts of Milan in Lombardy (Italy).
Table 1 shows the main territorial and population data derived from the latest National Institute of Statistics (ISTAT) census (2011) [
25]. The population of Melzo in Italy had increased significantly from 1961 (2526) to 1981 (17,996), then remaining nearly constant until the current number of 18,210 inhabitants. The average age of the population is quite high, so the average income per capita is also quite high.
Table 1.
Territorial and population data for the city of Melzo in Italy (Source ISTAT census 2011 [
25]).
Table 1.
Territorial and population data for the city of Melzo in Italy (Source ISTAT census 2011 [25]).
| Item | Units | Value |
|---|
| Inhabitants | No. | 18,210 |
| amilies | No. | 7,928 |
| Average age | Years | 44.6 |
| Income per capita | Euro | 15,056 |
| Territorial extension | km2 | 1,916.5 |
| Density | inhabitants/km2 | 9.5 |
| Flats | No. | 7,838 |
| Inhabitants/flat | No./flat | 2.32 |
3.2. Definition of the Energy Retrofit Measures
In order to define the possible energy retrofit measures in the existing building stock, the first step is to identify the measures and the second is to verify, through the field survey, the feasibility of application of measures. Diakary
et al. [
26] state that the various measures that may be considered for the improvement of the energy efficiency in buildings can be distinguished in the following basic categories:
measures for the improvement of the building envelope (addition to or improvement of insulation, change of color, placement of heat-insulating door and window frames, increase of thermal mass, building shaping, superinsulated building envelopes, etc.);
measures for reducing the heating and cooling loads (exploitation of the principles of bioclimatic architecture, incorporation of passive heating and cooling techniques, i.e., cool coatings, control of solar gains, electrochromic glazing, etc.);
use of renewables (solar thermal systems, building-integrated PVs , hybrid systems, etc.);
use of “intelligent” energy management, i.e., advanced sensors, energy control (zone heating and cooling) and monitoring systems;
measures for the improvement of the indoor comfort conditions in parallel with minimization of the energy requirements (increase in the ventilation rate, use of mechanical ventilation with heat recovery, improvement of boilers and air-conditioning, efficient use of multi-functional equipment, i.e., integrated water heating with space cooling, etc.); and
use of energy efficient appliances and compact fluorescent lighting.
The complexity of energy retrofit in existing buildings, during the implementation phase requires a detailed energy audit for each building. In [
27] about 100 energy retrofit actions are considered and discussed. Instead, the evaluation of the energy retrofit actions on an urban scale, for example a city district or a small municipality, requires a simplification of the analysis approach and a drastic reduction of the set of actions that can be implemented.
Table 2 shows the list of the energy retrofit measures that were considered in the case study and the costs that are associated with the “Potential”,
i.e., maximum use of each specific measure derived from [
10].
Table 2.
List of the energy retrofit measures that were considered in the case study and the relative costs and real potentials [
28].
Table 2.
List of the energy retrofit measures that were considered in the case study and the relative costs and real potentials [28].
| Code | Retrofit measures | Cost | Unit | Potential | Total cost |
|---|
| a1 | external wall thermal insulation | 83 | €/m2 | 445,721 | €36,914,621.50 |
| a2 | roof thermal insulation | 95 | €/m2 | 324,763 | €30,725,788.45 |
| a3 | replacement of windows | 480 | €/m2 | 7,452 | €17,961,094.92 |
| a4 | boiler replacement | 2,500 | €/piece | 5,897 | €14,743,270.00 |
| a5 | installation of Thermostatic Radiator Valve (TRV) | 45 | €/piece | 27,522 | €1,238,490.00 |
| a6 | electric lighting replacement | 10 | €/piece | 41,283 | €412,830.00 |
| a7 | replacement of electric home appliances | 550 | €/piece | 16,448 | €9,046,533.53 |
| a8 | solar thermal collector | 1,386 | €/m2 | 6,158 | €8,534,338.45 |
| a9 | installation of photovoltaic modules | 3,938 | €/kWp | 8,686 | €34,208,420.38 |
| - | €153,785,387.23 |
An important step in verifying the applicability of the measures is the on-site survey. The purpose of this activity is to obtain all the elements of information needed to complete the framework of the status of the building stock from an energy efficiency and conservation point of view. Through the survey, the auditor must determine whether the building needs retrofitting, if some improvements have already been made, or if technical or historical constraints impede further energy retrofitting. On-site surveying is, therefore, a strategic activity which evaluates the real potential and not just the theoretical potential of energy retrofits on the building envelope.
In the definition of the energy performance improvements of building envelopes it is assumed that opaque walls, roofs and windows are adjusted to the new standards required by the laws of the Lombardy Region. A complete description of this approach and a summary of the methodology for evaluating energy savings obtained is shown in [
4] whilst the evaluation of the real potential energy savings are summarized, for single intervention, in
Table 2.
3.3. Definition of the Energy Retrofit Strategies
We define five strategies with the same target of a reduction of CO
2 emissions in the existing building stock by 30% in the period 2005–2030. While the target is the same, the costs of individual actions are different (see
Table 2) and may indeed vary. In the period 2005–2010 the inhabitants have already made energy retrofit actions so spontaneous and other actions will be made, even without incentives, from 2011 to 2030.
Table 3 shows the five strategies that we have assumed and that will be compared using the multi-criteria methodology, application percentages have been chosen based on the coverage of the range of 5 strategies assumed.
Table 3.
Application percentages for intervention in five energy retrofit strategies a1_ETICS: external wall resulted by the field survey as easily ETICSable, a1_pETICS: external wall resulted by the field survey as potentially ETICSable.
Table 3.
Application percentages for intervention in five energy retrofit strategies a1_ETICS: external wall resulted by the field survey as easily ETICSable, a1_pETICS: external wall resulted by the field survey as potentially ETICSable.
| Strategies | a1_ETICS | a1_pETICS | a2 | a3 | a4 | a5 | a6 | a7 | a8 | a9 | CO2 eq (ton) |
|---|
| s1 | 80% | 50% | 73% | 80% | 50% | 70% | 70% | 70% | 3% | 5% | 11,060 |
| s2 | 75% | 45% | 70% | 75% | 50% | 70% | 70% | 70% | 10% | 13% |
| s3 | 70% | 40% | 60% | 70% | 50% | 70% | 70% | 70% | 20% | 26% |
| s4 | 60% | 30% | 45% | 60% | 50% | 70% | 70% | 70% | 40% | 49% |
| s5 | 40% | 15% | 25% | 40% | 50% | 70% | 70% | 70% | 80% | 82% |
The measures concerning the efficiency of electrical installations and heating plants (a4–a7) remain as a constant in all the strategies, because they are imposed by law, whilst the measures on the efficiency of building envelopes (facades, windows, roofing) and the use of renewable sources (solar thermal and PV) are modulated. For this reason, the measures a4–a7 were not considered in the criteria development and in the evaluations of the strategies.
The costs of each retrofit measure and of its required maintenance are presented in
Table 4. They are the costs of
Table 2 but this time they are given relative to the percentage of the retrofit measure that is present in each strategy. The number of maintenance activities that are required in thirty years of life of each measure (excluding the maintenance performed by the user, e.g., for the lighting) and their costs, as a percentage of the total costs [
28], are also included in
Table 4.
Table 4.
Retrofit and maintenance costs that are required in thirty years of the five energy retrofit strategies a1_ETICS: external wall resulted by the field survey as easily ETICSable, a1_pETICS: external wall resulted by the field survey as potentially ETICSabl.
Table 4.
Retrofit and maintenance costs that are required in thirty years of the five energy retrofit strategies a1_ETICS: external wall resulted by the field survey as easily ETICSable, a1_pETICS: external wall resulted by the field survey as potentially ETICSabl.
| Retrofit costs | a1_ETICS | a1_pETICS | a2 | a3 | a4 | a5 | a6 | a7 | a8 | a9 | Total costs (considering a1l_ETICS) | Total costs (considering a1l_pETICS) |
| Units | €/m2 | €/m2 | €/m2 | €/piece | €/piece | €/piece | €/piece | €/m2 | €/kWp |
| Total costs of the retrofit measures | €36,914,622 | €30,725,788 | €17,961,095 | €14,743,270 | €1,238,490 | €359,575 | €9,046,534 | €8,534,338 | €34,208,420 | - | - |
| s1 | €29,531,697 | €18,457,311 | €22,429,826 | €14,368,876 | €7,371,635 | €619,245 | €6,332,574 | €6,332,574 | €5,974,037 | €1,710,421 | €94,670,884 | €83,596,497 |
| s2 | €23,044,341 | €13,826,605 | €21,508,052 | €13,470,821 | €7,371,635 | €619,245 | €6,332,574 | €6,332,574 | €5,974,037 | €4,447,095 | €89,100,373 | €79,882,636 |
| s3 | €12,572,766 | €7,184,438 | €18,435,473 | €12,572,766 | €7,371,635 | €619,245 | €6,332,574 | €6,332,574 | €5,974,037 | €8,894,189 | €79,105,259 | €73,716,931 |
| s4 | €8,845,962 | €4,422,981 | €13,826,605 | €10,776,657 | €7,371,635 | €619,245 | €6,332,574 | €6,332,574 | €5,974,037 | €16,762,126 | €76,841,414 | €72,418,433 |
| s5 | €495,396 | €185,773 | €7,681,447 | €7,184,438 | €7,371,635 | €619,245 | €6,332,574 | €6,332,574 | €5,974,037 | €28,050,905 | €70,042,250 | €69,732,627 |
| Maintenance costs | a1_ETICS | a1_pETICS | a2 | a3 | a4 | a5 | a6 | a7 | a8 | a9 | - | - |
| % incidence of maintenance costs compared to the initial costs* | 25% | 25% | 25% | 5% | 100% | 130% | 1% | 1% | 30% | 20% | Total costs | Annual cost |
| Cost of measures | €2,684,422.31 | €6,564,290.51 | €7,713,111 | €898,848 | €14,743,270 | €1,610,037 | €3,596 | €90,4654 | €2,560,302 | €6,840,989 |
| No. of maintenance measures | 1 | 1 | 1 | 1 | 0** | 0** | 0** | 0** | 4 | 4 |
| s1 | €2,147,537.85 | €3,282,145.26 | € 5,630,571 | € 719,078 | - | - | - | - | €307,236 | €1,368,198 | €13,454,767 | € 448,492 |
| s2 | €2,013,316.73 | €2,953,930.73 | € 5,399,178 | € 674,136 | - | - | - | - | €1,024,121 | €3,557,314 | €15,621,996 | € 520,733 |
| s3 | €1,879,095.62 | €2,625,716.21 | € 4,627,867 | € 629,194 | - | - | - | - | €2,048,241 | €7,114,629 | €18,924,742 | € 630,825 |
| s4 | €1,610,653.39 | €1,969,287.15 | € 3,470,900 | € 539,309 | - | - | - | - | €4,096,482 | €13,408,339 | €25,094,971 | € 836,499 |
| s5 | €1,073,768.93 | € 984,643.58 | € 1,928,278 | € 3,595,399 | - | - | - | - | €8,192,965 | €22,438,445 | €34,977,639 | €1,165,921 |
4. Description of Criteria
A SEAP that is really intended to promote the sustainable development of a municipality must consider several aspects:
the cost of the measures should be consistent with the financial availability of the population;
the proposed measures have to be efficient in terms of energy saving but at the same time they have to generate the least possible impact in terms of their life cycle costs;
management and maintenance of the proposed measures have to be analyzed;
measures can also be an opportunity to improve the perceived quality of the town or city (architectonic impact);
the proposed measures should provide greater independence from fossil fuels; and
the proposed measures can stimulate the local economy and increase employment.
According to the above considerations, nine criteria were identified in relation to the Technological, Environmental and Socio-economical dimensions, or macro-aspects. Each criterion can adopt a different cardinal or ordinal scale. The units that were adopted for the different scales are indicated in
Table 5. The criteria are described in the following paragraphs.
Table 5.
Dimensions, criteria and evaluation scale units.
Table 5.
Dimensions, criteria and evaluation scale units.
| Dimensions | Criteria | Code | Unit |
|---|
| Technological | Service life | A1 | % of a8 and a9 measures |
| Maintenance | A2 | €/thirty years |
| In situ performance | A3 | % of a8 measure |
| Environmental | Embodied energy | B1 | GJ |
| Renewable energy | B2 | MWh |
| Waste production | B3 | Kg |
| Socio-economical | Local employment | C1 | man-day |
| Family investment | C2 | €/family |
| Architectural impact | C3 | rank |
4.1. Technological Aspects
4.1.1. Service Life (A1)
This criterion considers the durability of the whole strategy in relation to the service life of each retrofit measure. Long-lasting strategies also bring long-lasting benefits for the municipality. The service life of the measures a1, a2 and a3 is thirty years [
29], that of the other measures that distinguish the strategies, a8 and a9, is only 15 years, whereas the service life of a4, a5, a6 and a7 is not considered since they are identical for each strategy (see
Table 6). The percentage of the a8 and a9 measures in each strategy can be used, in this criterion, to indicate the difference, in terms of service life, between in the different strategies. A higher percentage of the a8 and a9 measured indicates a higher reduction of the service life. Therefore the criterion preference indirectly grows with its evaluation.
Table 6.
Service life of each measure.
Table 6.
Service life of each measure.
| Retrofit measures | a1_cap | a1_pot | a2 | a3 | a4 | a5 | a6 | a7 | a8 | a9 |
|---|
| Units | Years | Years | Years | Years | Years | Years | Years | Years | Years | Years |
| Time in work | 30 | 30 | 30 | 30 | 15 | 6 | 6 | 6 | 15 | 15 |
4.1.2. Maintenance (A2)
In order to maintain the performance over time is important that the maintenance is due with diligence. The procedure that calculates the maintenance costs per year is described in
Table 4.
4.2. Environmental Aspects
4.2.1. Embodied Energy (B1)
For the environmental aspect it is important to consider the embodied energy from “cradle to grave”, thus considering the life cycle of each retrofit measures (
Table 8). We use the Inventory of Carbon & Energy (ICE), a large dataset which provides measures of embodied energy and CO
2 emissions for over 300 materials, by cross-referencing the potential of installation (
Table 2) with the percentage of retrofit measures that are present in each proposed strategy (
Table 3).
4.2.2. Renewable Energy (B2)
Thanks to the detailed survey is possible to estimate the amount of energy produced by renewable sources. For the photovoltaic system we consider as average yearly electricity production 1050 kWh/m2 and for the solar thermal collector an average yearly energy production of about 827 kWh/m2. The available south-facing area on the buildings’ roofs is known and it is compared with the area needed to cover the energy consumption of buildings.
Table 8.
Embodied energy in each measure and in each strategy.
Table 8.
Embodied energy in each measure and in each strategy.
| Measures | a1_ETICS | a1_pETICS | a2 | a3 | a8 | a9 | - |
|---|
| Quantity MAX | 129,370 | 316,351 | 324,763 | 37,452 | 6,158 | 60,878 | - |
| Embodied energy | 248 | 248 | 248 | 249 | 2,885 | 4,079 | - |
| Unit | MJ/m2 | MJ/m2 | MJ/m2 | MJ/m2 | MJ/m2 | MJ/m2 | - |
| Embodied energy MAX | 32,094,048 | 78,480,443 | 80,567,103 | 9,323,988 | 17,766,633 | 248,319,776 | - |
| Scenarios | Embodied energy | Total (GJ) |
| s1 | 25,675,238 | 39,240,221 | 58,813,985 | 7,459,190 | 532,999 | 12,415,989 | 144,138 |
| s2 | 24,070,536 | 35,316,199 | 56,396,972 | 6,992,991 | 1,776,663 | 32,281,571 | 156,835 |
| s3 | 22,465,833 | 31,392,177 | 48,340,262 | 6,526,791 | 3,553,327 | 64,563,142 | 176,842 |
| s4 | 19,256,429 | 23,544,133 | 36,255,196 | 5,594,393 | 7,106,653 | 121,676,690 | 213,433 |
| s5 | 12,837,619 | 11,772,066 | 20,141,776 | 3,729,595 | 14,213,306 | 203,622,216 | 266,317 |
From these data collected in Melzo [
10], the maximum production potential of solar thermal collectors was derived, being equal to 5,034,307 kWh (up to 6158 m
2) and that of photovoltaic solar panels 19,881,951 kWh (for 60,878 m
2). Cross-referencing these data with those of potential installation (
Table 2) can be obtained for each scenario the total MWh for retrofit activities a8 and a9 (
Table 9).
Table 9.
Maximum potential for thermal and PV solar systems.
Table 9.
Maximum potential for thermal and PV solar systems.
| Scenarios | a8 | a9 | Total (kWh) | Total (MWh) |
|---|
| s1 | 151,029 | 994,098 | 1,145,127 | 1,145 |
| s2 | 503,431 | 2,584,654 | 3,088,084 | 3,088 |
| s3 | 1,006,861 | 5,169,307 | 6,176,169 | 6,176 |
| s4 | 2,013,723 | 9,742,156 | 11,755,879 | 11,756 |
| s5 | 4,027,446 | 16,303,199 | 20,330,645 | 20,331 |
4.2.3. Waste Production (B3)
In the environmental balance sheet, it is important to consider also the waste disposal at the end of the life of the measure. The amount in ton of non-recyclable waste that could be produced in a thirty year time frame [
10], is calculated considering dismissal and maintenance (
Table 10).
Table 10.
Production of non-recyclable waste for each measure.
Table 10.
Production of non-recyclable waste for each measure.
| Measures | a1_cap | a1_pot | a2 | a3 | a8 | a9 | - | - |
|---|
| MAX use of each measure (m2) | 129,370 | 316,351 | 324,763 | 37,452 | 6,158 | 60,878 | - | - |
| weight of waste (kg) | 1,034,958 | 2,530,811 | 2,078,481 | 1,273,368 | 123,151 | 1,217,552 | - | - |
| recyclability rate | 10% | 10% | 80% | 90% | 90% | 80% | - | - |
| N. dismissals | 1 | 1 | 1 | 1 | 2 | 2 | - | - |
| Max non-recyclable waste | 931,462 | 2,277,730 | 415,696 | 127,337 | 24,630 | 487,021 | Total (kg) | Total (ton) |
| s1 | 745,170 | 1,138,865 | 303,458 | 101,869 | 739 | 24,351 | 2,314,452 | 2,314 |
| s2 | 698,597 | 1,024,978 | 290,987 | 95,503 | 2,463 | 63,313 | 2,175,841 | 2,176 |
| s3 | 652,024 | 911,092 | 249,418 | 89,136 | 4,926 | 126,625 | 2,033,220 | 2,033 |
| s4 | 558,877 | 683,319 | 187,063 | 76,402 | 9,852 | 238,640 | 1,754,154 | 1,754 |
| s5 | 372,585 | 341,659 | 103,924 | 50,935 | 19,704 | 399,357 | 1,288,164 | 1,288 |
4.3. Socio-Economical Aspects
4.3.1. Local Employment (C1)
For a Mayor it is important that the local workforce increases to ensure a healthy municipality, so we consider the amount of manpower requested by each measure, in installation and maintenance phases. Since the interest is just at the municipality level we do not consider the manpower necessary to produce the building materials or machinery. The requested man-days are calculated, in relation to a national reference [
29], for each measure and each strategy (
Table 11).
Table 11.
Manpower in the installation and maintenance of the measures developed 100% of the potential in thirty years.
Table 11.
Manpower in the installation and maintenance of the measures developed 100% of the potential in thirty years.
| Measures | a1_cap | a1_pot | a2 | a3 | a8 | a9 | - |
|---|
| Cost of the measure (Table 4) | 10,714,403 | 26,200,219 | 30,725,788 | 17,961,095 | 8,534,338 | 34,208,420 | - |
| Maintenance cost (Table 4) | 2,684,422 | 6,564,291 | 7,713,111 | 8,988,498 | 6,764 | 6,840,989 | - |
| Global manpower cost (€) | 13,398,825 | 32,764,509 | 38,438,900 | 26,949,593 | 8,541,102 | 41,049,409 | - |
| Team cost per day (€) | 1,342 | 1,342 | 1,342 | 582 | 512 | 512 | - |
| No. of workmen per team | 7 | 7 | 7 | 3 | 3 | 3 | - |
| Man-days for installation MAX | 69,906 | 170,944 | 200,549 | 138,954 | 49,999 | 240,299 | - |
| No. of interventions | 349 | 841 | 1,748 | 524 | 1,650 | 1,663 | - |
| No. maintenance in thirty years | 1 | 1 | 1 | 1 | 4 | 4 | - |
| No. of workmen for maintenance | 5 | 5 | 5 | 2 | 2 | 2 | - |
| Days for maintenance | 4.0 | 4.0 | 2.0 | 1.5 | 0.5 | 0.5 | - |
| Man-days for maintenance MAX | 6,980 | 16,820 | 17,477 | 1,571 | 6,600 | 6,651 | Man-day |
| s1 | 61,509 | 93,882 | 159,159 | 112,420 | 1,698 | 12,347 | 441,015 |
| s2 | 57,665 | 84,494 | 152,618 | 105,394 | 5,660 | 32,103 | 437,933 |
| s3 | 53,820 | 75,105 | 130,815 | 98,367 | 11,320 | 64,207 | 433,635 |
| s4 | 46,132 | 56,329 | 98,111 | 84,315 | 22,640 | 121,005 | 428,532 |
| s5 | 30,754 | 28,165 | 54,506 | 56,210 | 45,279 | 202,499 | 417,413 |
4.3.2. Family Investment (C2)
Since this work is focused on the residential building stock it is important to know if the strategies could be financially sustainable for the citizens. This criterion consists in the average cost per household, calculated as the ratio between the cost of the strategy and the number of families living in the municipality (
Table 12). The result of the calculation is the cost of all work under the assumption that each household implements them in full. In reality in some cases the cost per household will vary, depending upon the peculiarities retrained on each house and in relation to any existing incentive systems, not considered here.
Table 12.
Costs of the measures per family in thirty years.
Table 12.
Costs of the measures per family in thirty years.
| Measures | a1_cap | a1_pot | a2 | a3 | a8 | a9 | - |
|---|
| Total cost of the strategy (Table 4) | €10,714,403 | €26,200,219 | €30,725,788 | €17,961,095 | €8,534,338 | €34,208,420 | - |
| No. of involved families | 1,430.63 | 3,447.45 | 7,164.11 | 2,147.13 | 6,763.97 | 6,815.99 | - |
| Cost for family (€/fam.) | 7,489.28 | 7,599.88 | 4,288.85 | 8,365.18 | 1,261.74 | 5,018.84 | Total (€/fam.) |
| s1 | 5,991 | 3,800 | 3,131 | 6,692 | 38 | 251 | 19,903 |
| s2 | 5,617 | 3,420 | 3,002 | 6,274 | 126 | 652 | 19,092 |
| s3 | 5,242 | 3,040 | 2,573 | 5,856 | 252 | 1,305 | 18,269 |
| s4 | 4,494 | 2,280 | 1,930 | 5,019 | 505 | 2,459 | 16,687 |
| s5 | 2,996 | 1,140 | 1,072 | 3,346 | 1,009 | 4,115 | 13,679 |
4.3.3. Architectural Impact (C3)
We use this criterion to take into account the improvement that some measures will bring, in terms that are not limited to the actions on energy usage. The aesthetic quality of a town or a city is an important social aspect, to discourage carelessness or even vandalism in the municipality.
In this criterion retrofit measures that lead to aesthetic improvement of the town or city achieve higher scores. Five levels of impact are described in
Table 13, with the reference to the specific measures that induce each kind of impact. This criterion adopts an ordinal scale with the rank of the strategies, from the best (s1) to the worst (s5) in relation to the presence of measures that produce positive/negative impacts (
Table 14).
Table 13.
Architectural impact criterion.
Table 13.
Architectural impact criterion.
| Positive | great positive impact | a1: ETICS |
| positive impact | a3: windows replacement |
| - | no impact | a2: roof insulation; a4: boiler replacement; a5: TRV; a6: lighting replacement |
| Negative | little negative impact | a8: PV |
| negative impact | a7: solar thermal collector |
Table 14.
Evaluations of the architectural impact.
Table 14.
Evaluations of the architectural impact.
| Strategies | s1 | s2 | s3 | s4 | s5 |
|---|
| Item | Rank | Rank | Rank | Rank | Rank |
| No. | 1 | 2 | 3 | 4 | 5 |
5. Results and Discussion
ELECTRE III, which develops an outranking relation between all the couples of actions in the first phase, elaborates two complete preorders in the second phase, by means of two distillation procedures, and a partial preorder (the final graph) as intersection of the two complete preorders. In this case, ELECTRE III was applied four times to the model of
Table 15 (each time for a different weighting scenario).
Table 15 shows the evaluations of the five strategies in relation to the nine criteria. The need of model parameters (
v,
q and
s,
i.e., veto, indifference and/or preference thresholds) must be identified and quantified in relation to each criterion. The indifference thresholds (and in part also the preference threshold) are introduced to reduce and control the negative consequences of a limited precision of some evaluations that are used in the model. The resulted four final graphs are presented in
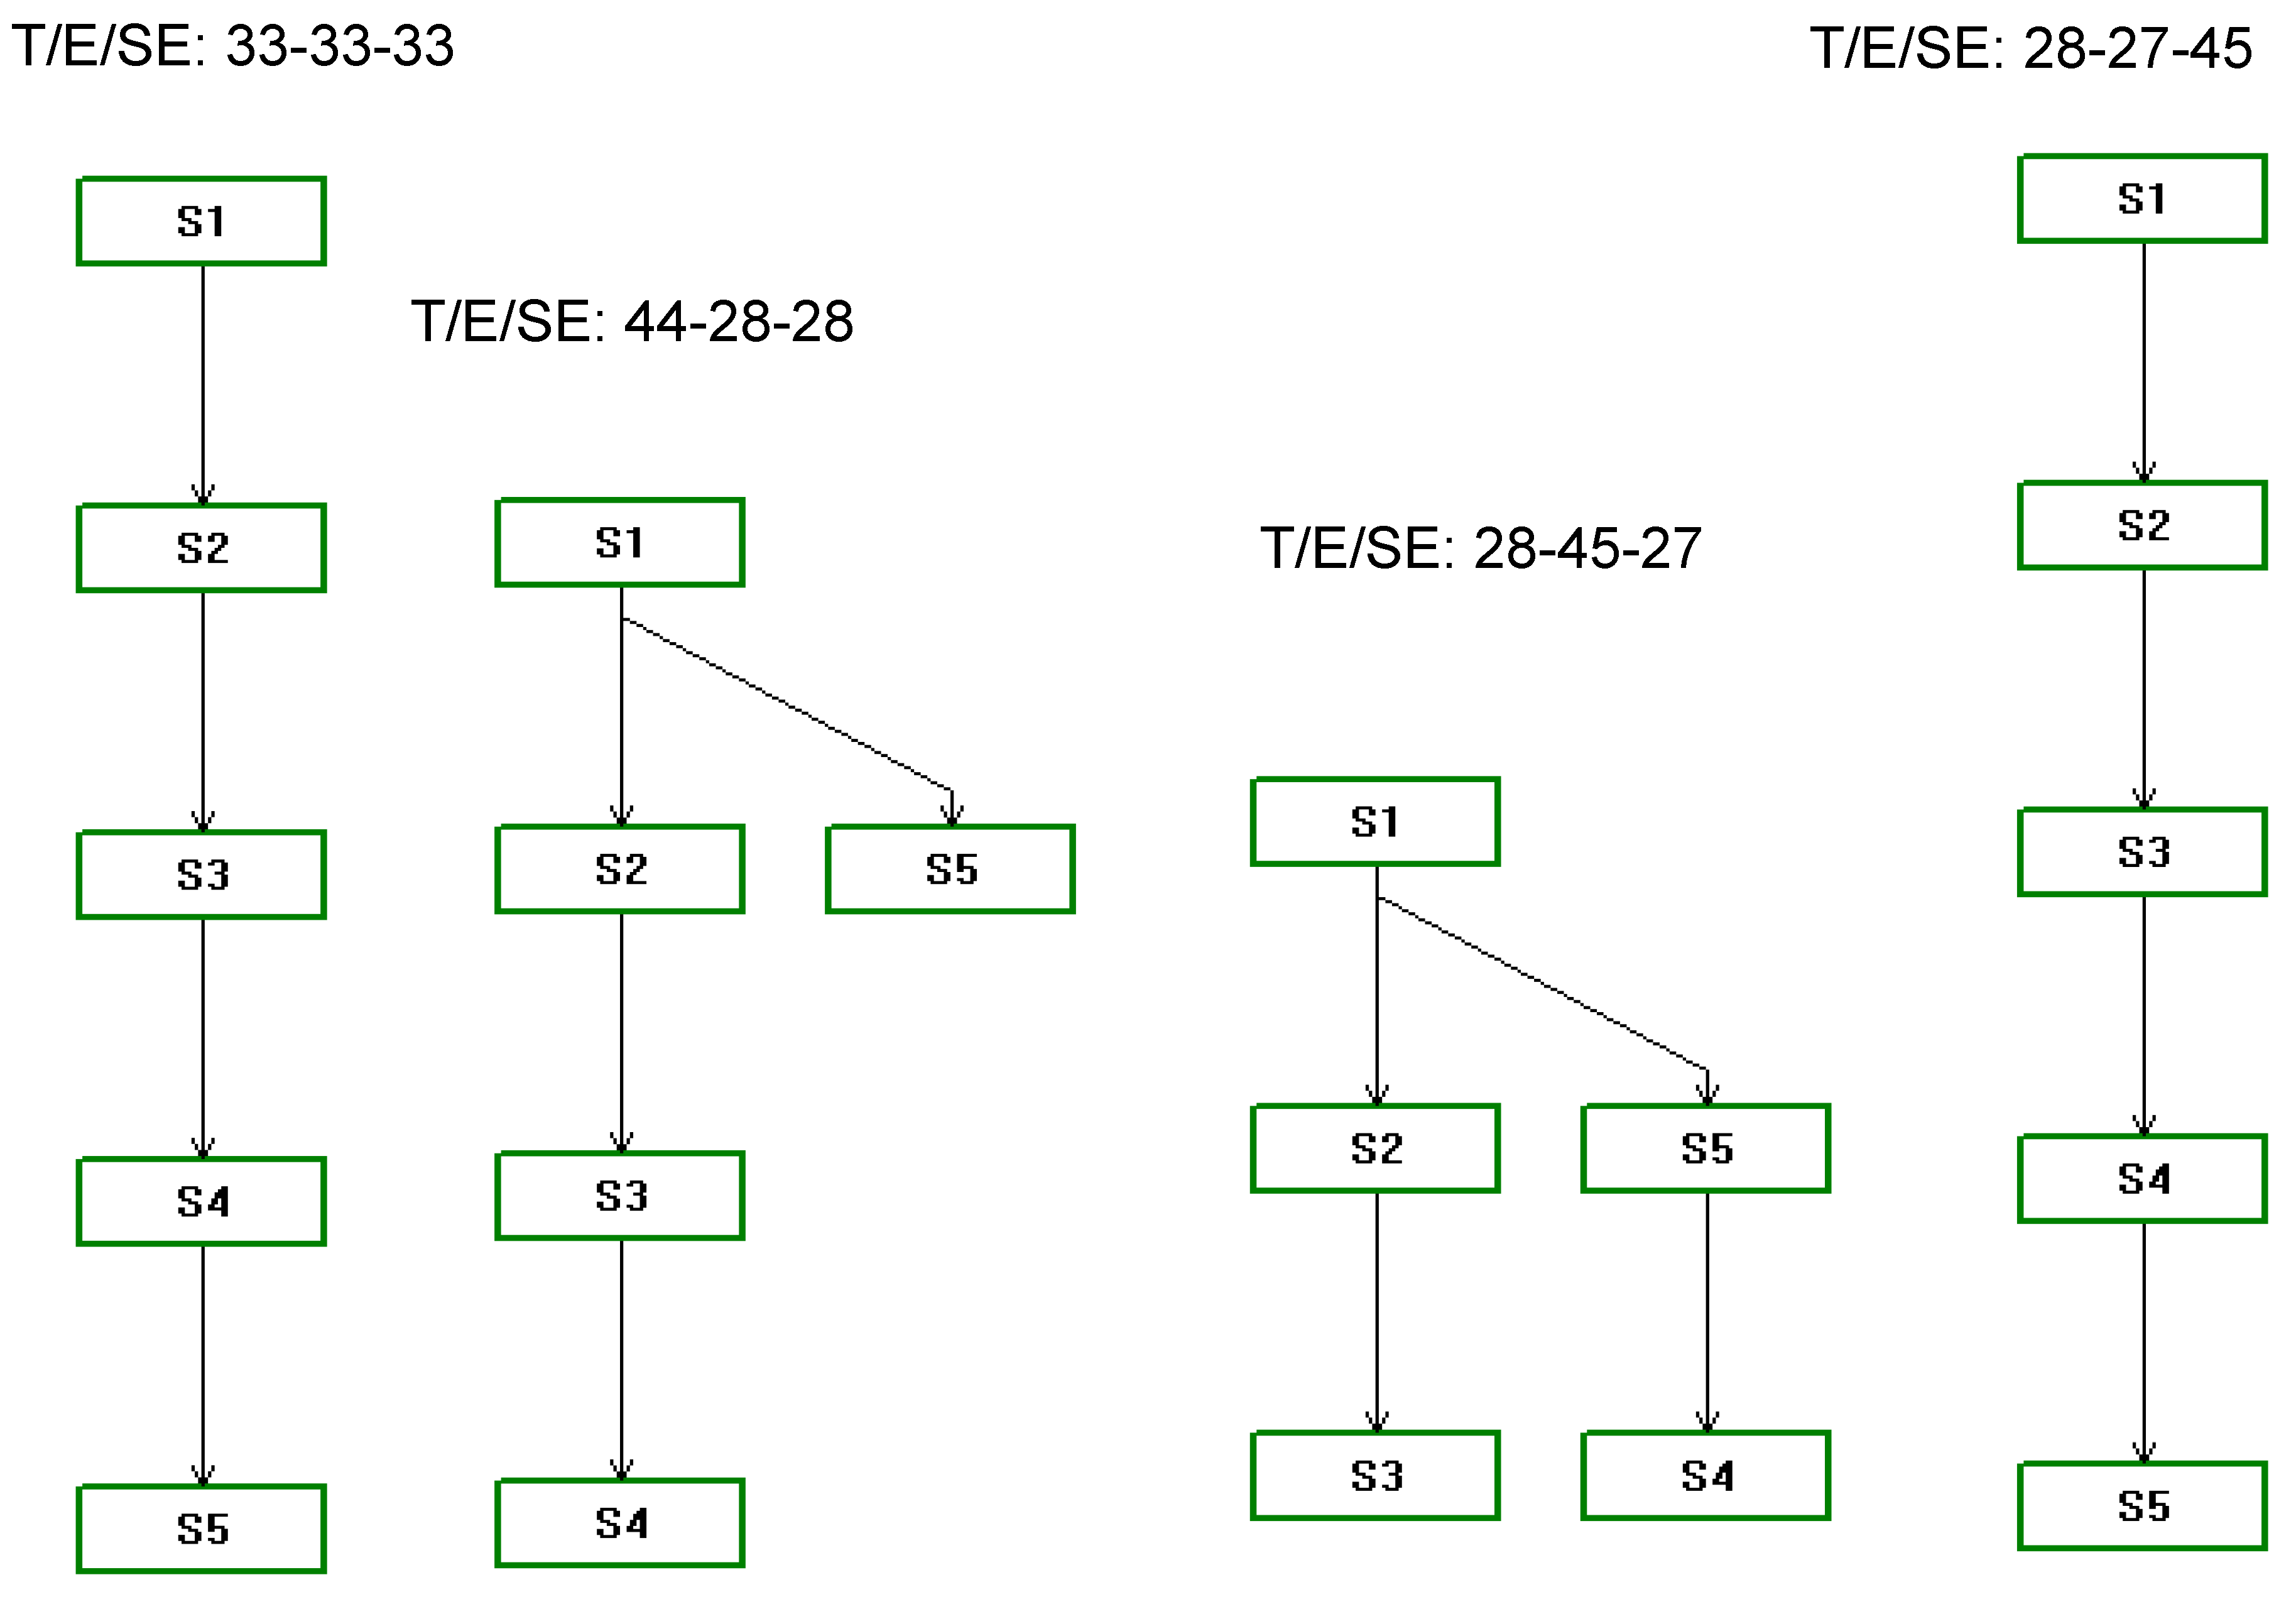
Figure 3. The first relates to a preference system that considers the three dimensions (Technological, Environmental and Socio-Economic) to be equivalent (
i.e., 33.3% of importance to each). The other three refer to preference systems which orient the preference to the first dimension (44-28-28), the second (28-45-27) and the third (28-27-45). The distribution of the weights (that the ELECTRE methods define as relative importance coefficients), into each dimension between its criteria, is described in
Table 15 and was developed above all from the expert point of view, in this first application, and with the municipality of Melzo during the result analysis. The definition of the preference system should be the result of a deep interaction between experts and decision makers in all the future applications.
A final graph can present a single path, from the best to the worst alternative, such as for the first and the last scenarios, or more than one, such as for the second and the third scenario, when the complete preorders are different and present local contradictions. The path that includes the maximum number of alternatives in the final graph is the main path, the others are considered secondary paths. When two alternatives are in two different paths, in the same position in the ranking or in different positions, they are incomparable.
Table 15.
Strategy evaluations, thresholds of indifference (q), preference (s) and veto (v), scenarios of weights for dimensions and criteria (%).
Table 15.
Strategy evaluations, thresholds of indifference (q), preference (s) and veto (v), scenarios of weights for dimensions and criteria (%).
| Dimensions | Technological | Environmental | Socio-Economical |
|---|
| Criteria | A1 | A2 | A3 | B1 | B2 | B3 | C1 | C2 | C3 |
| Unit (preference versus) | % (↓) | € (↓) | % (↓) | GJ (↓) | MWh (↑) | Ton (↓) | Man-day (↑) | €/fam (↓) | Rank (↓) |
| s1 | 8 | 448,492 | 3 | 144,138 | 1,145 | 2,314 | 441,015 | 19,903 | 1 |
| s2 | 23 | 520,733 | 10 | 156,835 | 3,088 | 2,176 | 437,933 | 19,092 | 2 |
| s3 | 46 | 630,825 | 20 | 176,842 | 6,176 | 2,033 | 433,635 | 18,269 | 3 |
| s4 | 89 | 836,499 | 40 | 213,433 | 11,756 | 1,754 | 428,532 | 16,687 | 4 |
| s5 | 162 | 1,165,921 | 80 | 266,317 | 20,331 | 1,288 | 417,413 | 13,679 | 5 |
| q | - | 50,000 | - | 10,000 | 2,000 | 200 | 1,500 | 200 | - |
| s | 20 | 100,000 | 10 | 20,000 | 5,000 | 500 | 3,000 | 500 | - |
| v | 130 | 600,000 | - | - | - | 1,000 | - | 6,000 | 5 |
| weight 33-33-33 | 8.3 | 16.7 | 8.3 | 11.1 | 11.1 | 11.1 | 11.1 | 11.1 | 11.1 |
| weight 44-28-28 | 11 | 22 | 11 | 9.33 | 9.33 | 9.33 | 9.33 | 9.33 | 9.33 |
| weight 28-45-27 | 7 | 14 | 7 | 15 | 15 | 15 | 9 | 9 | 9 |
| weight 28-27-45 | 7 | 14 | 7 | 9 | 9 | 9 | 15 | 15 | 15 |
Figure 3.
Results in relation to four scenarios of different importance of the Technological (T), Environmental (E) and Socio-Economical (SE) dimensions.
Figure 3.
Results in relation to four scenarios of different importance of the Technological (T), Environmental (E) and Socio-Economical (SE) dimensions.
In this case, three of the four final graphs are different but all present the same strategy in the first position (s1) and s2, and then s3, after s1. The strategy s4 is always in the fourth or in the last position of its path. The strange element is s5, that can be or in the second or in the last position. The strategy s5 is incomparable with s2, s3 and s4, in the second scenario, and with s2 and s3 in the third. For the scenario 44-28-28, s5 is not only incomparable with s2, s3 and s4, but also in any critical situation: s5 is both in the second and in the last position, because it is in the second position in the ranking but also in the last position in its secondary path.
We affected a sequence of changes in the model parameters in order to understand whether the incomparability that is present in some results of
Figure 3 corresponds to an actual limited comparability of s5 or if it is a consequence of some limitations in the model. This last possibility is frequent when the analyzed decision problem is new, complex and ill structured [
30,
31,
32,
33].
The first change was introduced through the municipality of Melzo in Italy which was required to propose a set of weights (always 28-27-45 but with a different distribution of the importance coefficients between the criteria), consistent with their preference system in the present economic scenario. The result of this new application of ELECTRE III was identical to the result in relation to the second scenario 44-28-28. Other changes were introduced, in relation to some parameters of the model, above all the veto thresholds (see in
Table 15), that make the basic discordance notion of the outranking relation operational, and the indifference and preference thresholds
q and
s, that are introduced to reduce the impact of informative and/or preferential uncertainties on the results. All the times, the application of ELECTRE III in relation to the model variants reproduced the same result of the original model or one of the results of
Figure 3.
The main path in the ranking (with s1, s2, s3 and s4) and the incomparability of s5 were confirmed by this first testing procedure. Therefore a more structural change was effected. A new model, the second was created by eliminating a criterion and restructuring into two dimensions the other criteria. The Service life criterion was eliminated because its evaluations of the strategies, in relation to the analyzed municipality, presented a very limited discriminating power. Only a very great usage of renewables can determine a significant reduction in the durability of a whole strategy. Only s5 presents a true durability reduction, in the case of Melzo in Italy, because the durability reduction of the others can be estimated in terms of few months.
The criterion A1 was eliminated in the second model and the criterion A2 (maintenance costs) was associated with the Socio-Economic dimension, because it impacts directly on families. Also the criterion A3 (in situ performance) was associated to the Socio-Economic dimension because it can impact technically on the economic performance of a strategy.
The second model (see
Table 16) includes three technical weighting scenarios, plus the technical translation into weights of the Melzo preferences. The four new applications of ELECTRE III produced the results that are presented synthetically in
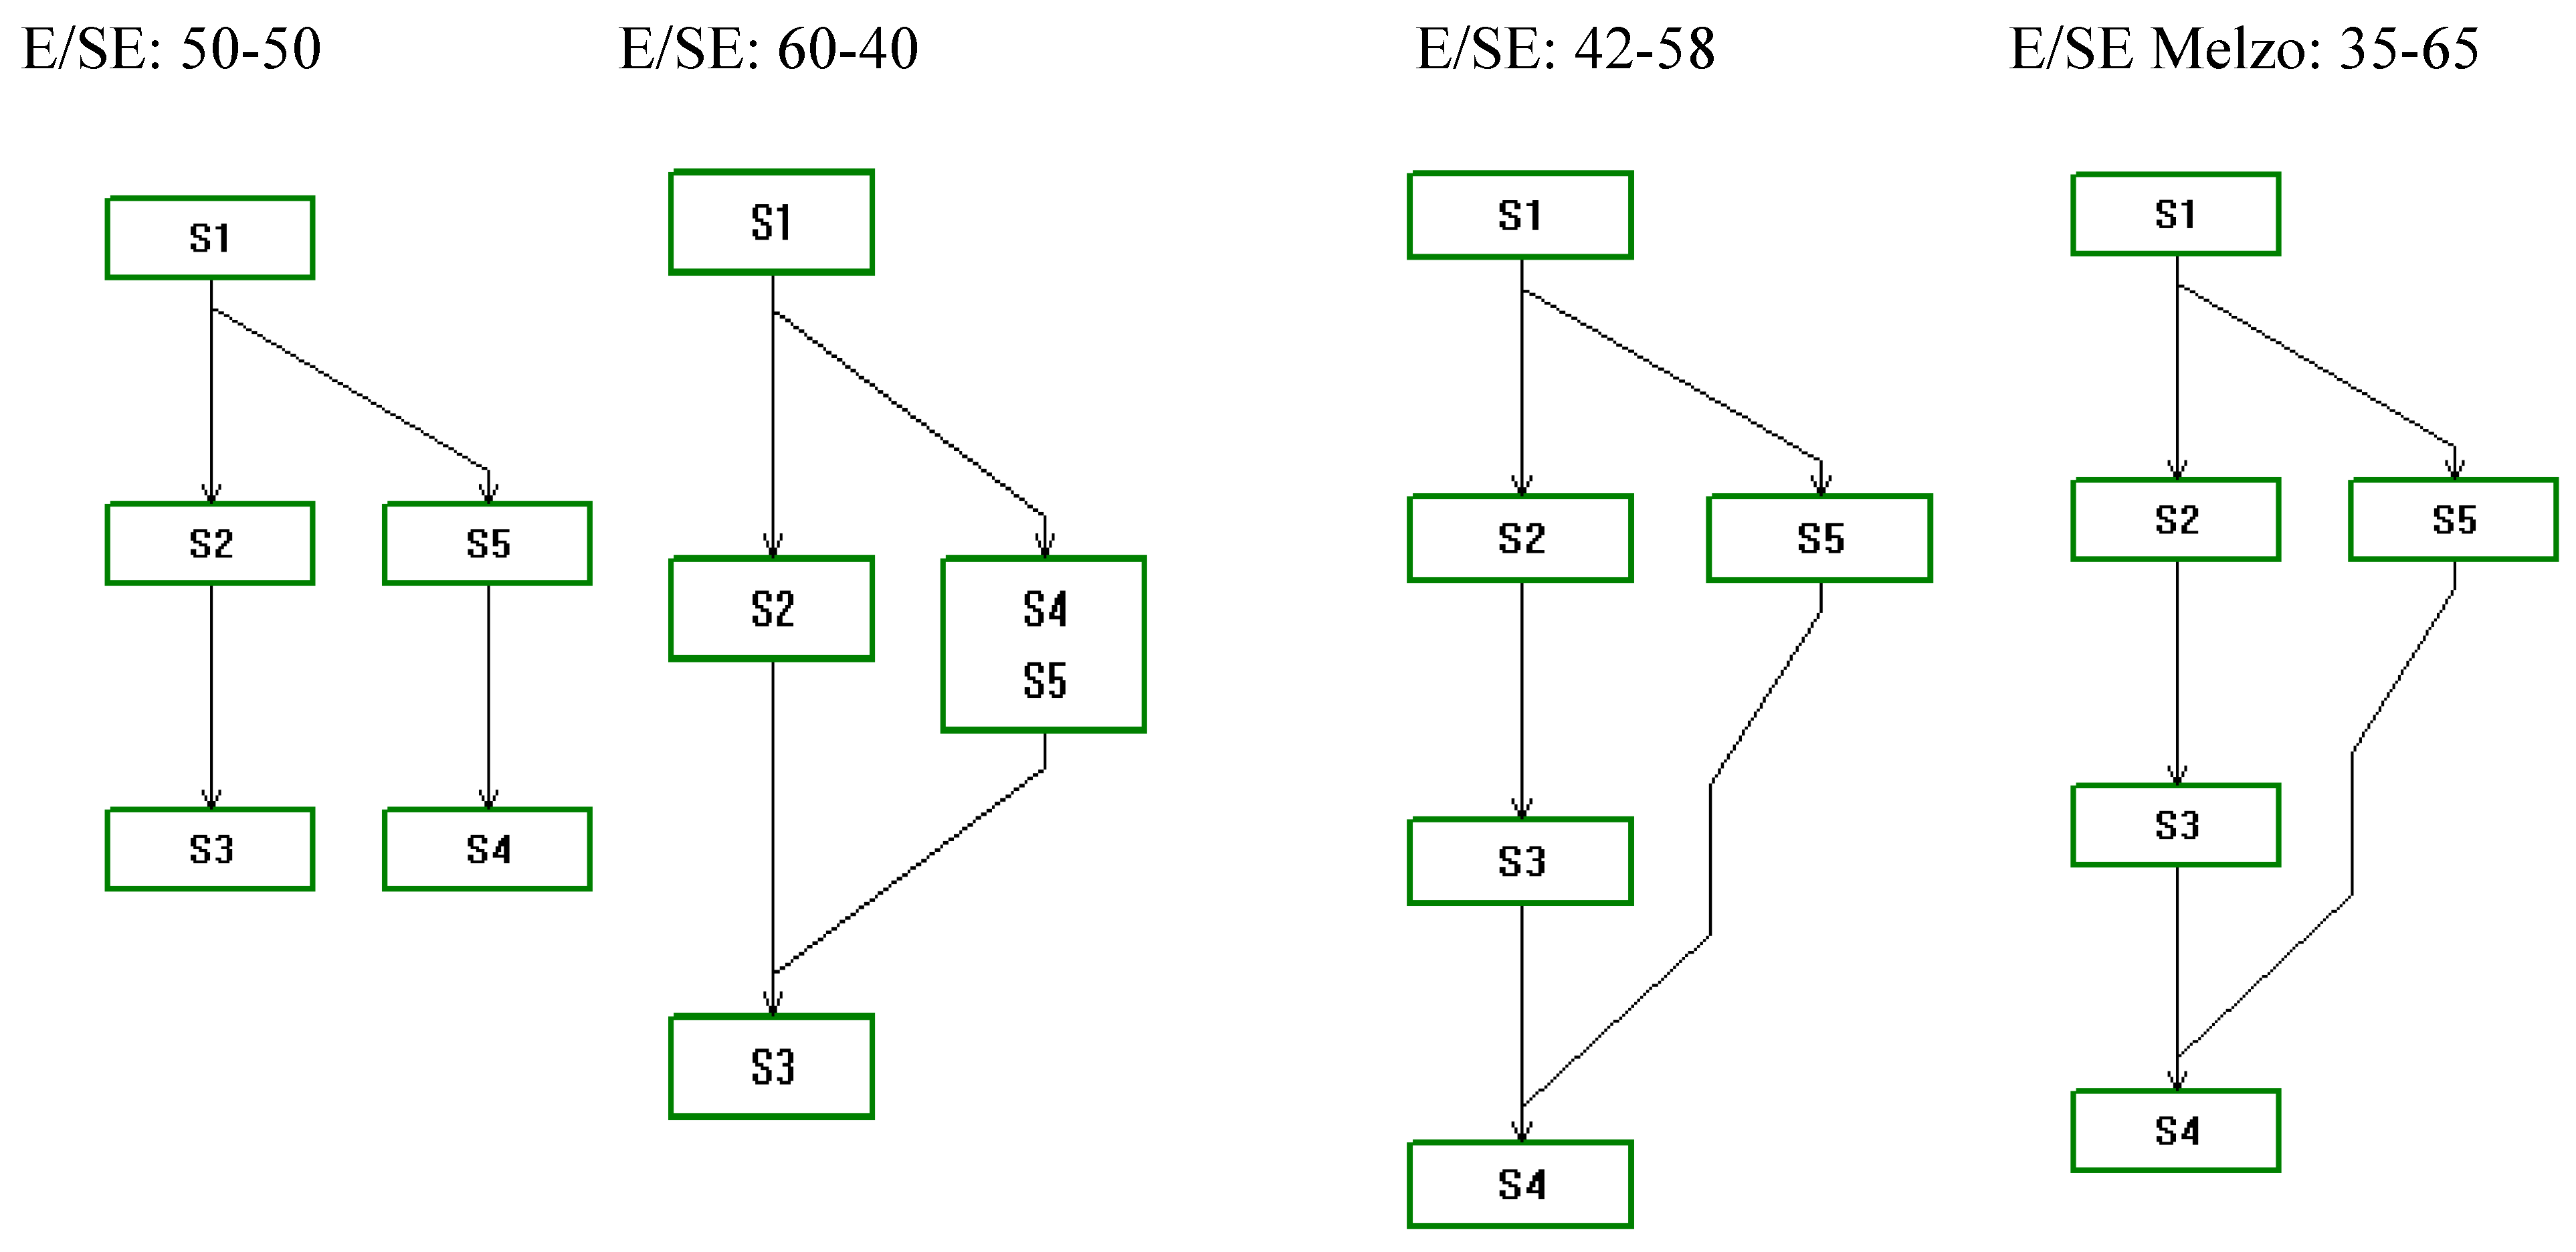
Figure 4. The first result is the same as that of the first model in relation to its third scenario. The scenarios 42-58 and 35-65 produce the same result, which is not so different from the 60-40 scenario result.
The second model confirms both the ranking (of s1, s2, s3 and s4) and the incomparability of s5, but in this case s5 is always in the second position, at the same level of s2, but incomparable because s5 presents performances that are totally different from those of s2.
Therefore s1 is the best strategy and both s2 and s5 are candidates for the second place. This indication is robust enough for the Melzo situation and can support their planning. At the same time the model can be considered flexible enough to be marginally changed in relation to specific situations in other municipalities.
Table 16.
Evaluations of the strategies, thresholds of indifference (q), preference (s) and veto (v) and weighting scenarios of the dimensions and criteria (%).
Table 16.
Evaluations of the strategies, thresholds of indifference (q), preference (s) and veto (v) and weighting scenarios of the dimensions and criteria (%).
| Dimensions | Environmental | Socio-Economical |
|---|
| Criteria | B1 | B2 | B3 | A2 | A3 | C1 | C2 | C3 |
| Unit | GJ (↓) | MWh (↑) | Ton (↓) | € (↓) | % (↓) | Man-day (↑) | €/fam (↓) | Ranking (↓) |
| S1 | 144,138 | 1,145 | 2,314 | 448,492 | 3 | 441,015 | 19,903 | 1 |
| S2 | 156,835 | 3,088 | 2,176 | 520,733 | 10 | 437,933 | 19,092 | 2 |
| S3 | 176,842 | 6,176 | 2,033 | 630,825 | 20 | 433,635 | 18,269 | 3 |
| S4 | 213,433 | 11,756 | 1,754 | 836,499 | 40 | 428,532 | 16,687 | 4 |
| S5 | 266,317 | 20,331 | 1,288 | 1,165,921 | 80 | 417,413 | 13,679 | 5 |
| q | 10,000 | 2,000 | 200 | 50,000 | - | 1,500 | 200 | - |
| s | 20,000 | 5,000 | 500 | 100,000 | 10 | 3,000 | 500 | - |
| v | - | - | 1,000 | 600,000 | - | - | 6,000 | 5 |
| weight a 50-50 | 16 | 18 | 16 | 12 | 8 | 11 | 11 | 8 |
| weight b 60-40 | 19 | 22 | 19 | 10 | 6 | 9 | 9 | 6 |
| weight c 42-58 | 13 | 16 | 13 | 12 | 10 | 13 | 13 | 10 |
| weight d 35-65 | 11 | 13 | 11 | 14 | 6 | 22 | 15 | 8 |
Figure 4.
Results in relation to three technical weighting scenarios [Environmental (E) and Socio-Economical (SE) dimensions] and the fourth scenario from the municipality of Melzo in Italy.
Figure 4.
Results in relation to three technical weighting scenarios [Environmental (E) and Socio-Economical (SE) dimensions] and the fourth scenario from the municipality of Melzo in Italy.
6. Conclusions
The correct definition of the strategies in order to improve the energy quality of the existing building stock is a key factor in the energy planning within a Sustainable Energy Action Plan. The target of reducing emissions by 2020, under the European Project Covenant of Mayors, can be achieved through different strategies of energy retrofits that can focus principally on energy efficiency, on renewable energy technologies or on a variable mix of the two types of action. The most common policy to guide the choices is that of the economics: priority must be given, in this way, to those scenarios which permit achievement of the goal with the least financial investment. Energy planning an extended geographical area such as a municipality, however, makes it necessary to analyze aspects other than only the economics: for example, the social ones, those linked to the local economy (indirect employment), those of environmental impact of the technological choices.
In this paper, the application of multi-criteria analysis is considered for the town of Melzo in Italy, a medium-sized municipality located close to Milan in Italy. Five strategies with different combinations of individual energy retrofits actions are evaluated and compared in order to rank them in terms of priority and to identify which the best among them. The results obtained, and discussed, demonstrate the validity of the approach which shows that the use of only the economic vision is not only incomplete but, above all, leads to results that do not take into account the major objective of the Covenant of Mayors. This is not only to reduce the emissions of greenhouse gases but rather is principally to increase the sustainability of the whole community. The multi-criteria analysis is also confirmed for this application to be an effective tool for policy makers, in this case the mayors. The work of analysis contained in this article may be deemed to be a reference for those who programmed the actions of energy planning in a more complete manner and more particularly it is more consistent with the current economic situation. The conditions of each municipality (in terms of existing buildings and their thermo-physical characteristics) have to be analyzed, in order to select a complete set of possible strategies, and the criteria and the evaluations of the proposed model can be used as a reference, to facilitate discussion, analysis and expression of specific needs and requirements for the new model, that could include all the original criteria or be improved by means of new criteria or new evaluations procedures. The weighting factors, that are important elements of the decision maker preference system, have to be expressed using the proposed model as a reference or analyzing local past experiences that can impact and orient each new decision.


