A Liquid Inorganic Electrolyte Showing an Unusually High Lithium Ion Transference Number: A Concentrated Solution of LiAlCl4 in Sulfur Dioxide

Abstract
:1. Introduction
2. Results and Discussion


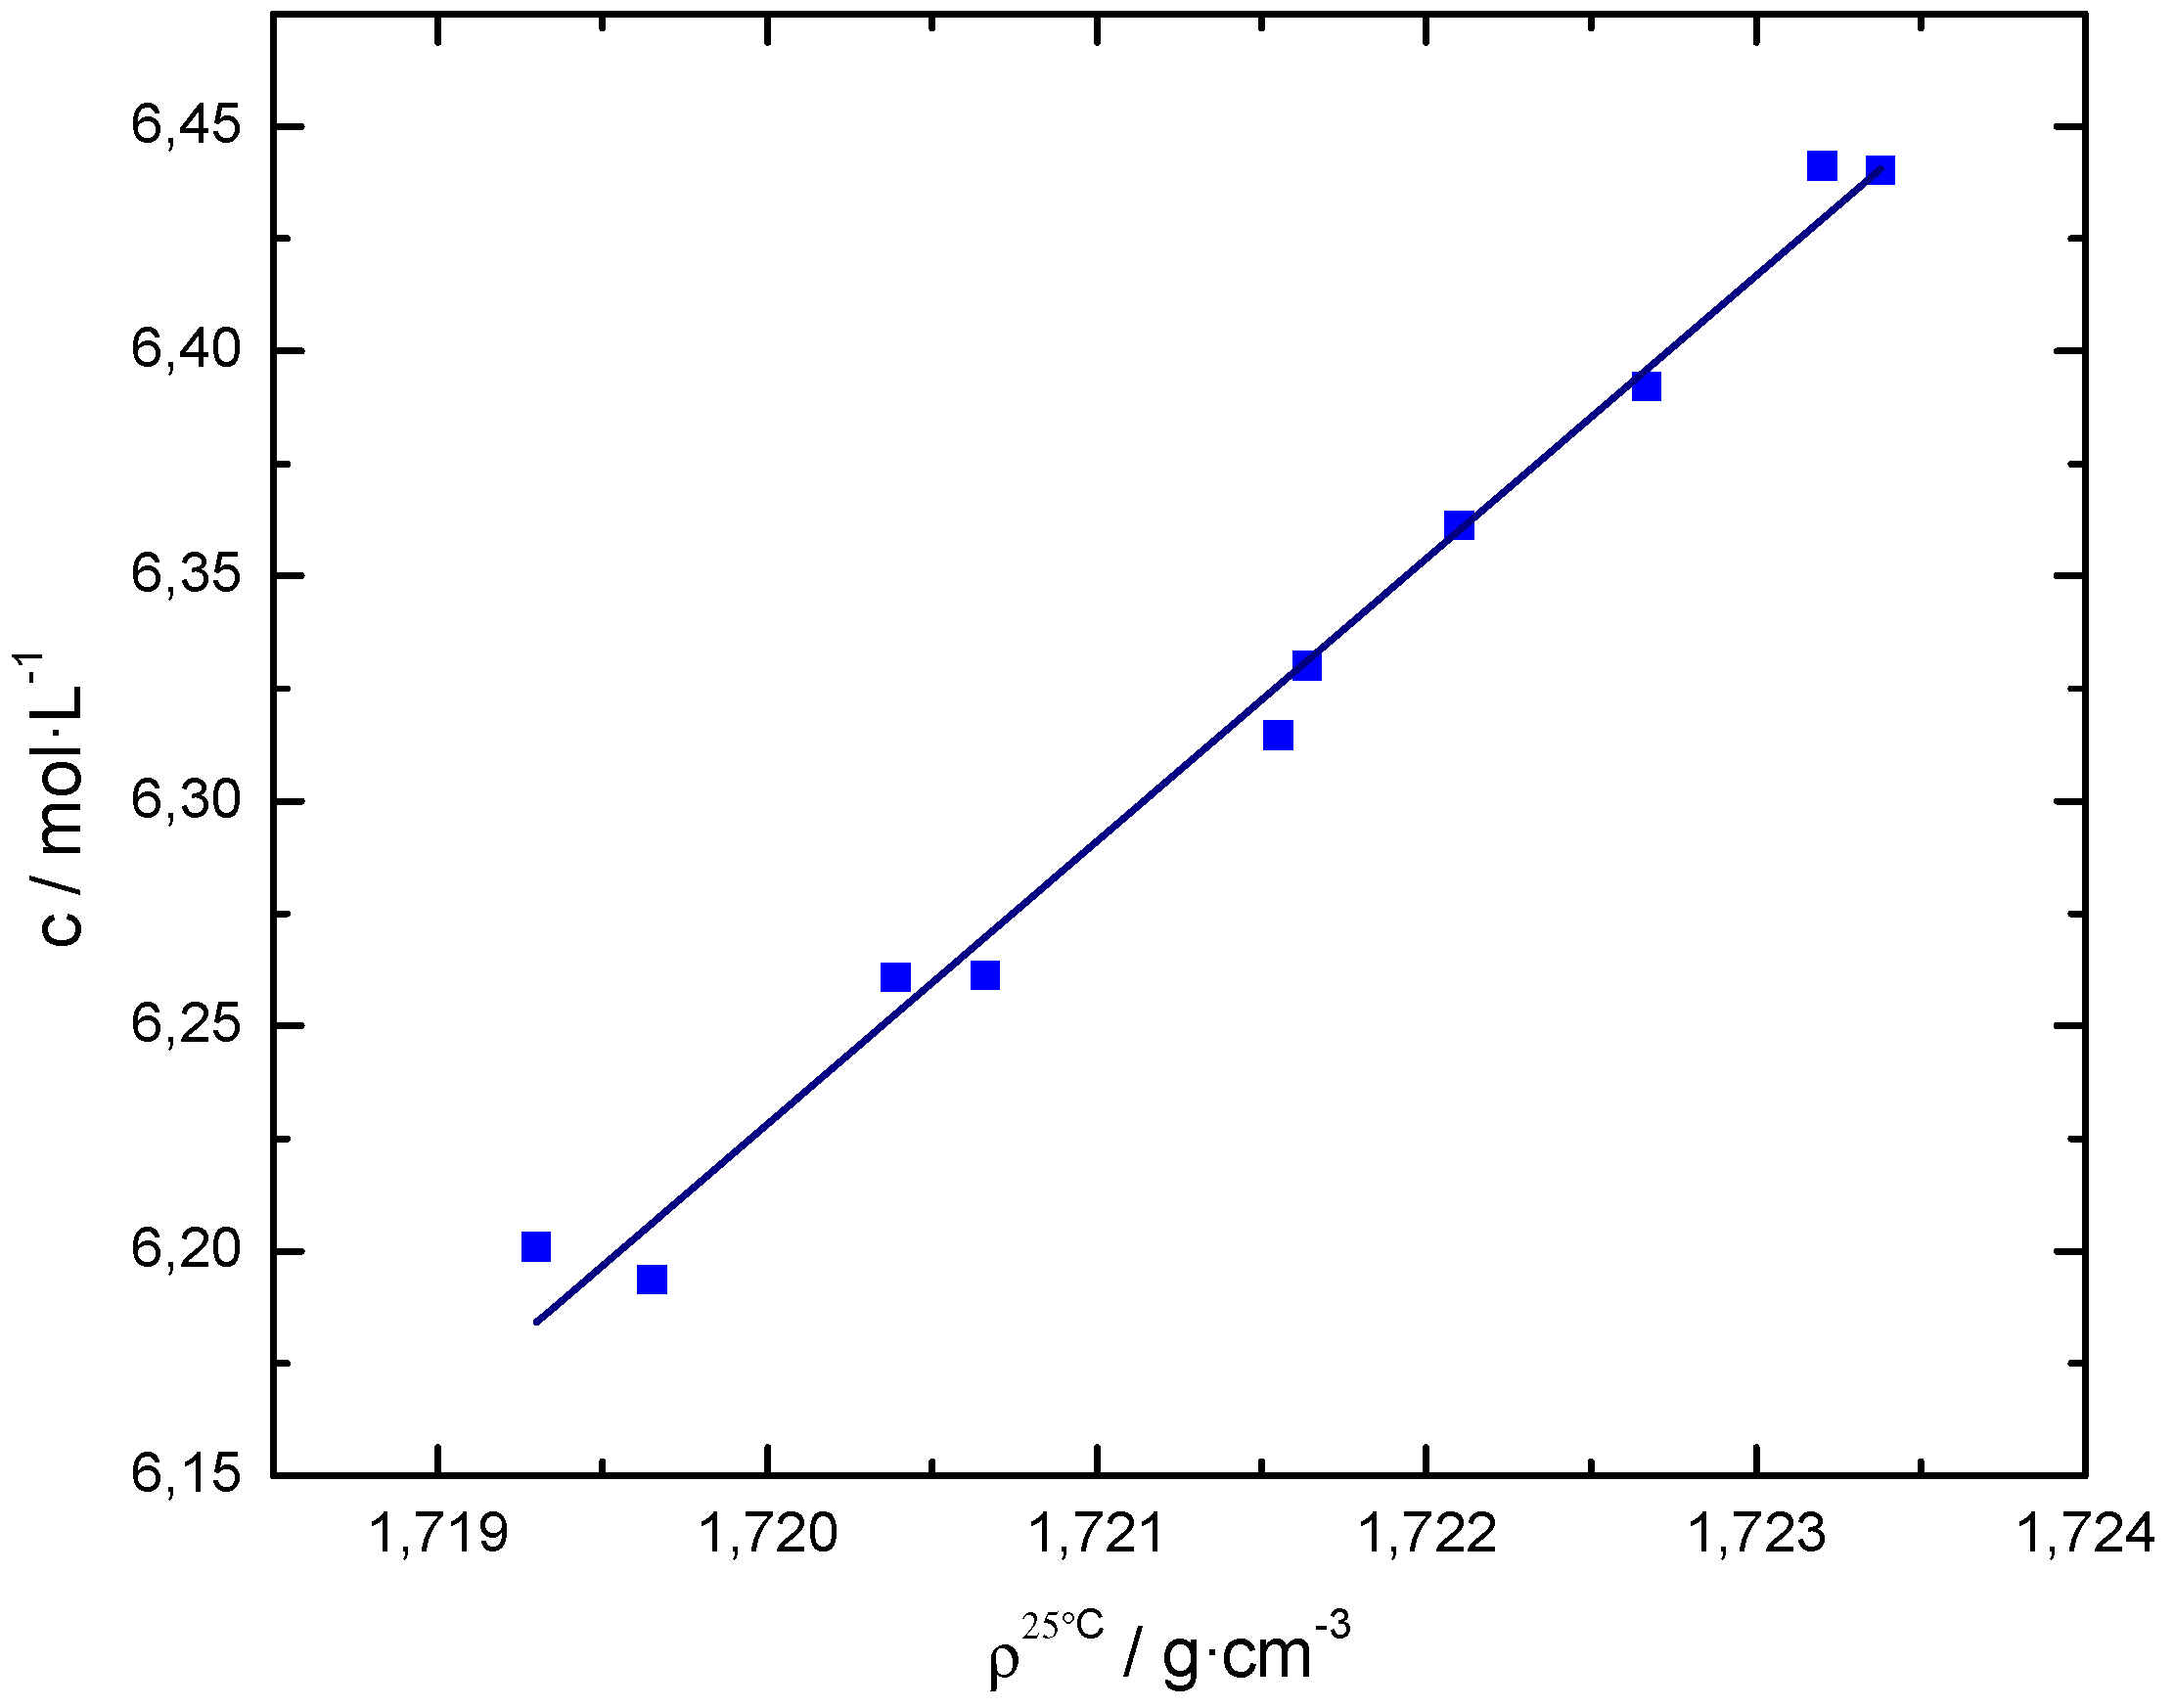
| Sample | V/mL | /g cm−3 | /mol L−1 | Q/A s | t+ | |
|---|---|---|---|---|---|---|
| Electrolyte | 3.3350 | 1.71965 | 6.194 | 1665 | 0.69 ± 0.03 | 0.59 ± 0.07 |
| Anodic compartment | 21.9024 | 1.72320 | 6.441 | |||
| Middle compartment | 24.2503 | 1.72039 | 6.261 | |||
| Electrolyte | 4.5914 | 1.71930 | 6.201 | 1877 | 0.74 ± 0.03 | 0.59 ± 0.07 |
| Anodic compartment | 21.3192 | 1.72338 | 6.440 | |||
| Middle compartment | 23.3370 | 1.72164 | 6.330 |
| c/mol L−1 | T/K | /104 S m2 mol−1 | DLi/10−10 m2 s−1 | DAl/10−10 m2 s−1 | H | |
|---|---|---|---|---|---|---|
| 4.7 | 300 | 20.85 | 4.86 | 3.11 | 0.61 | 0.70 |
| 6.2 | 340 | 22.10 | 6.82 | 4.20 | 0.62 | 0.61 |
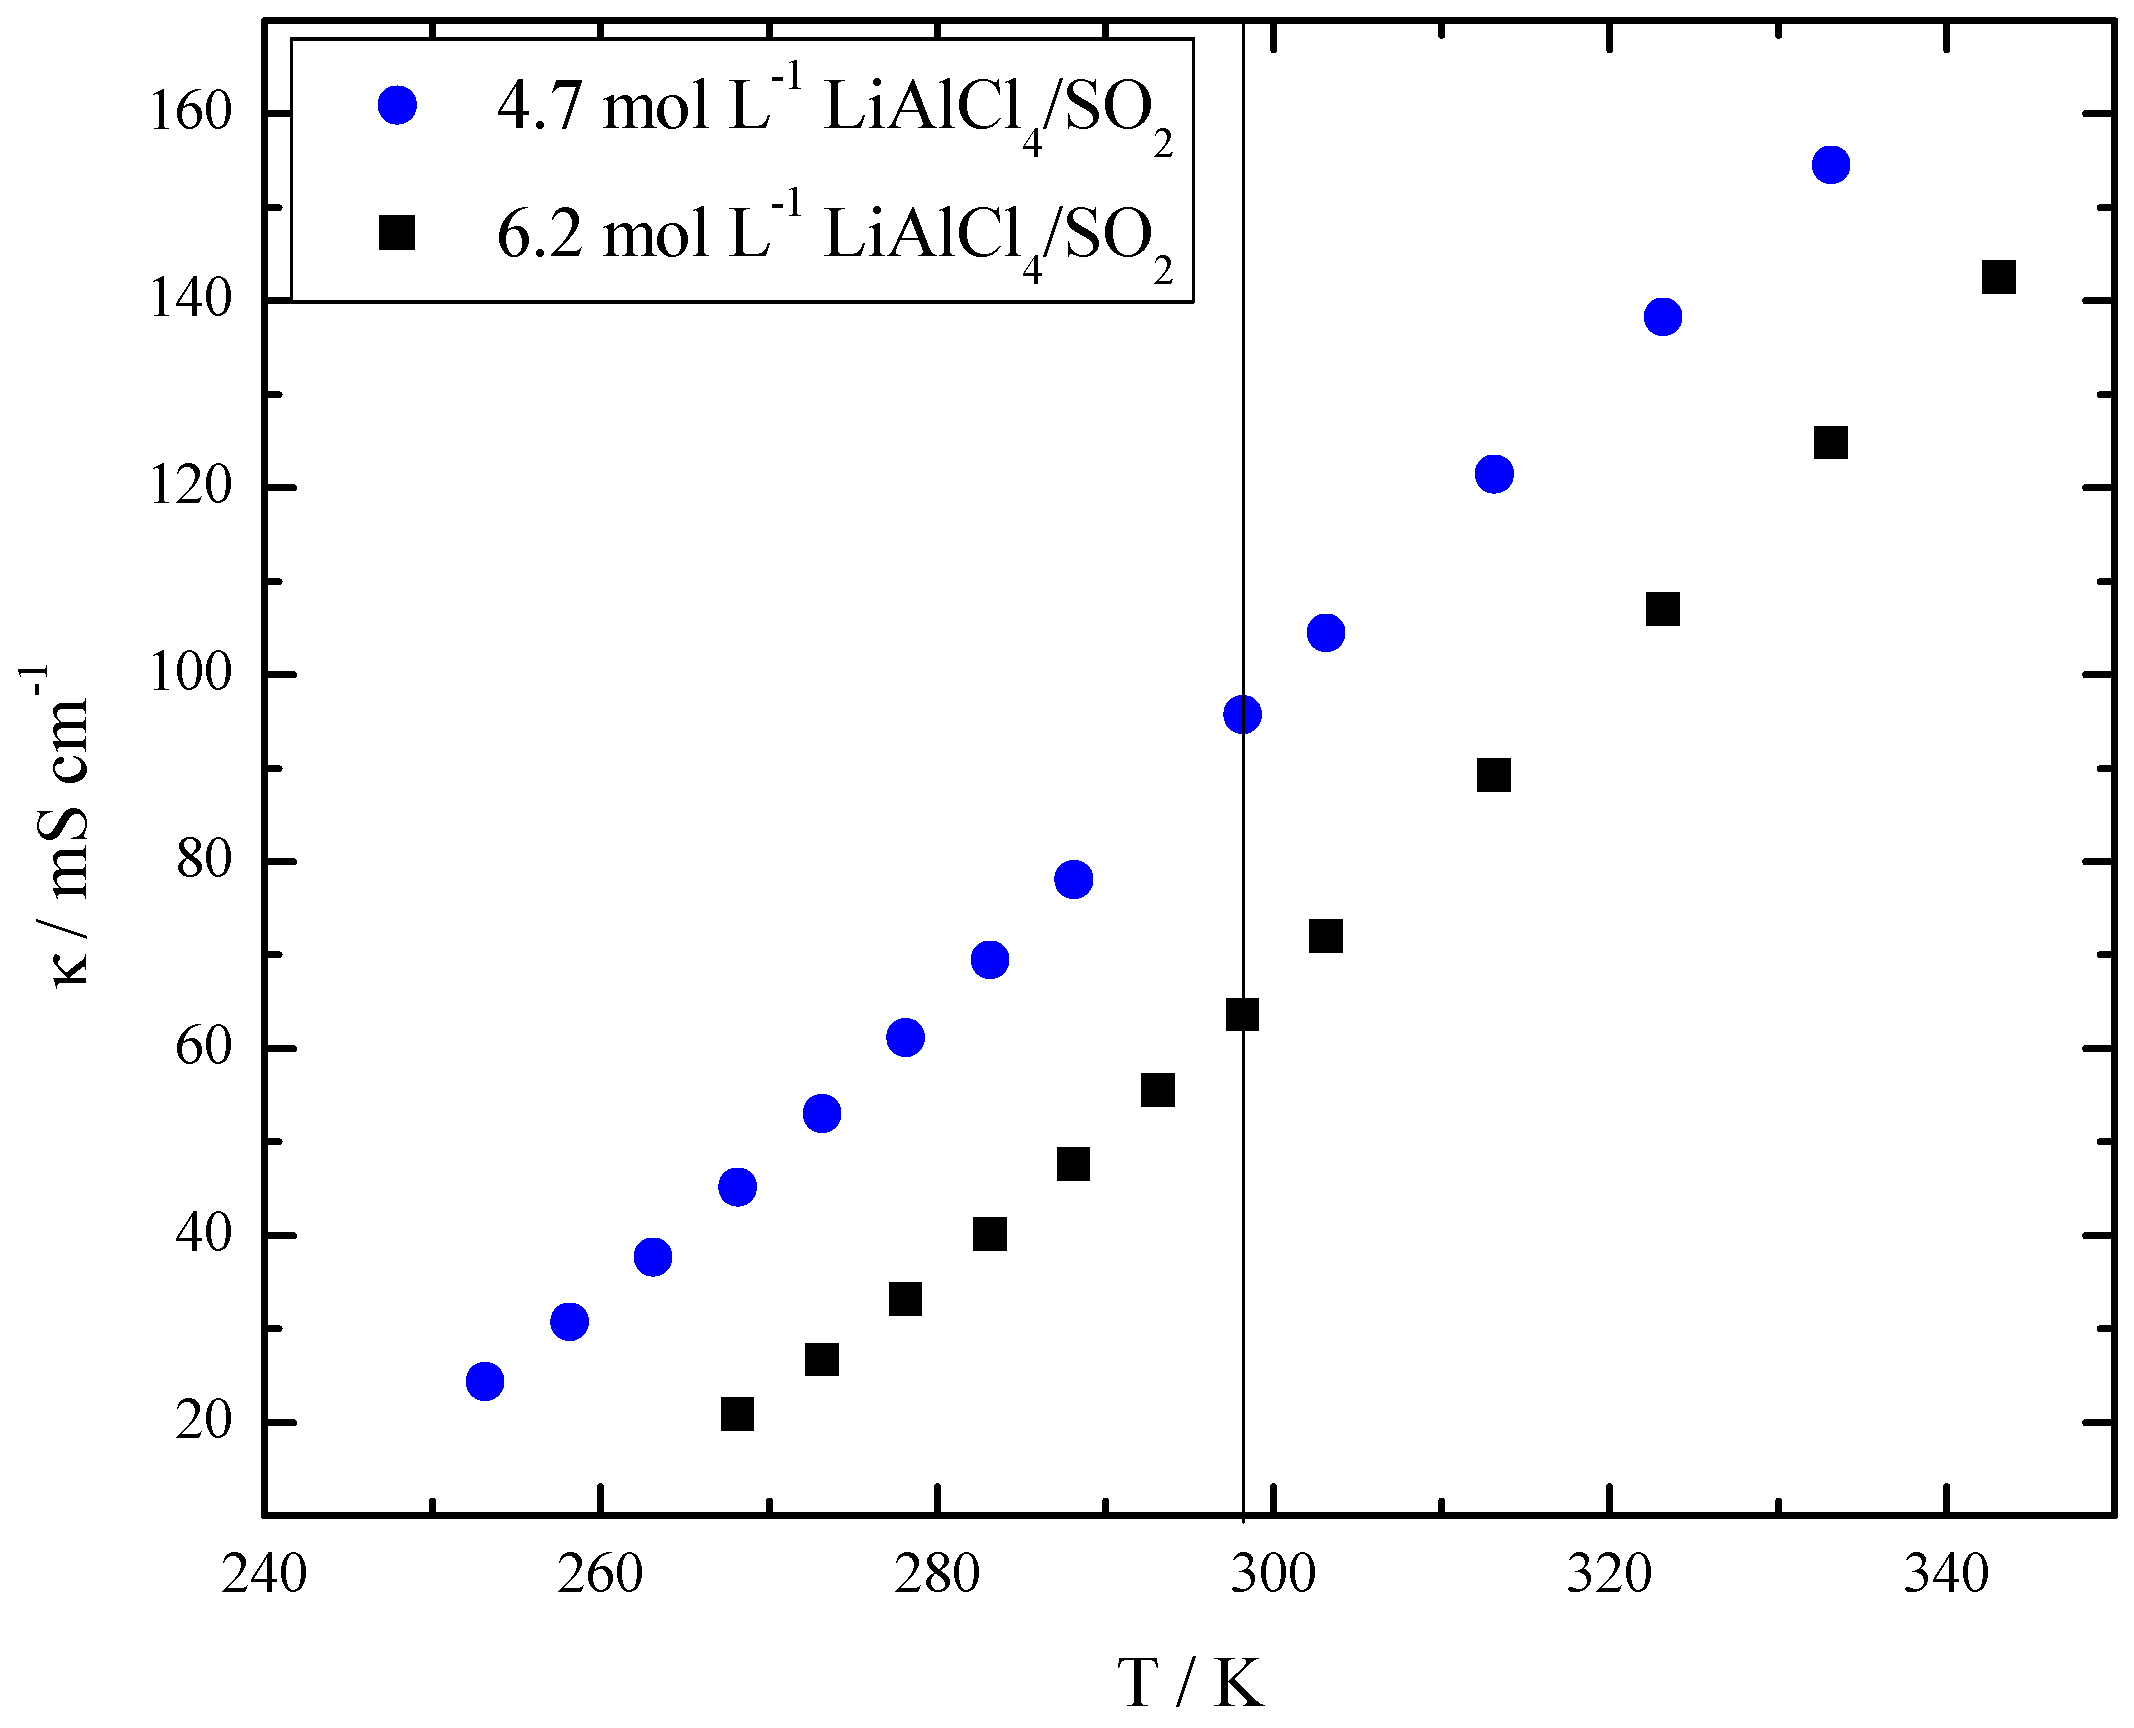

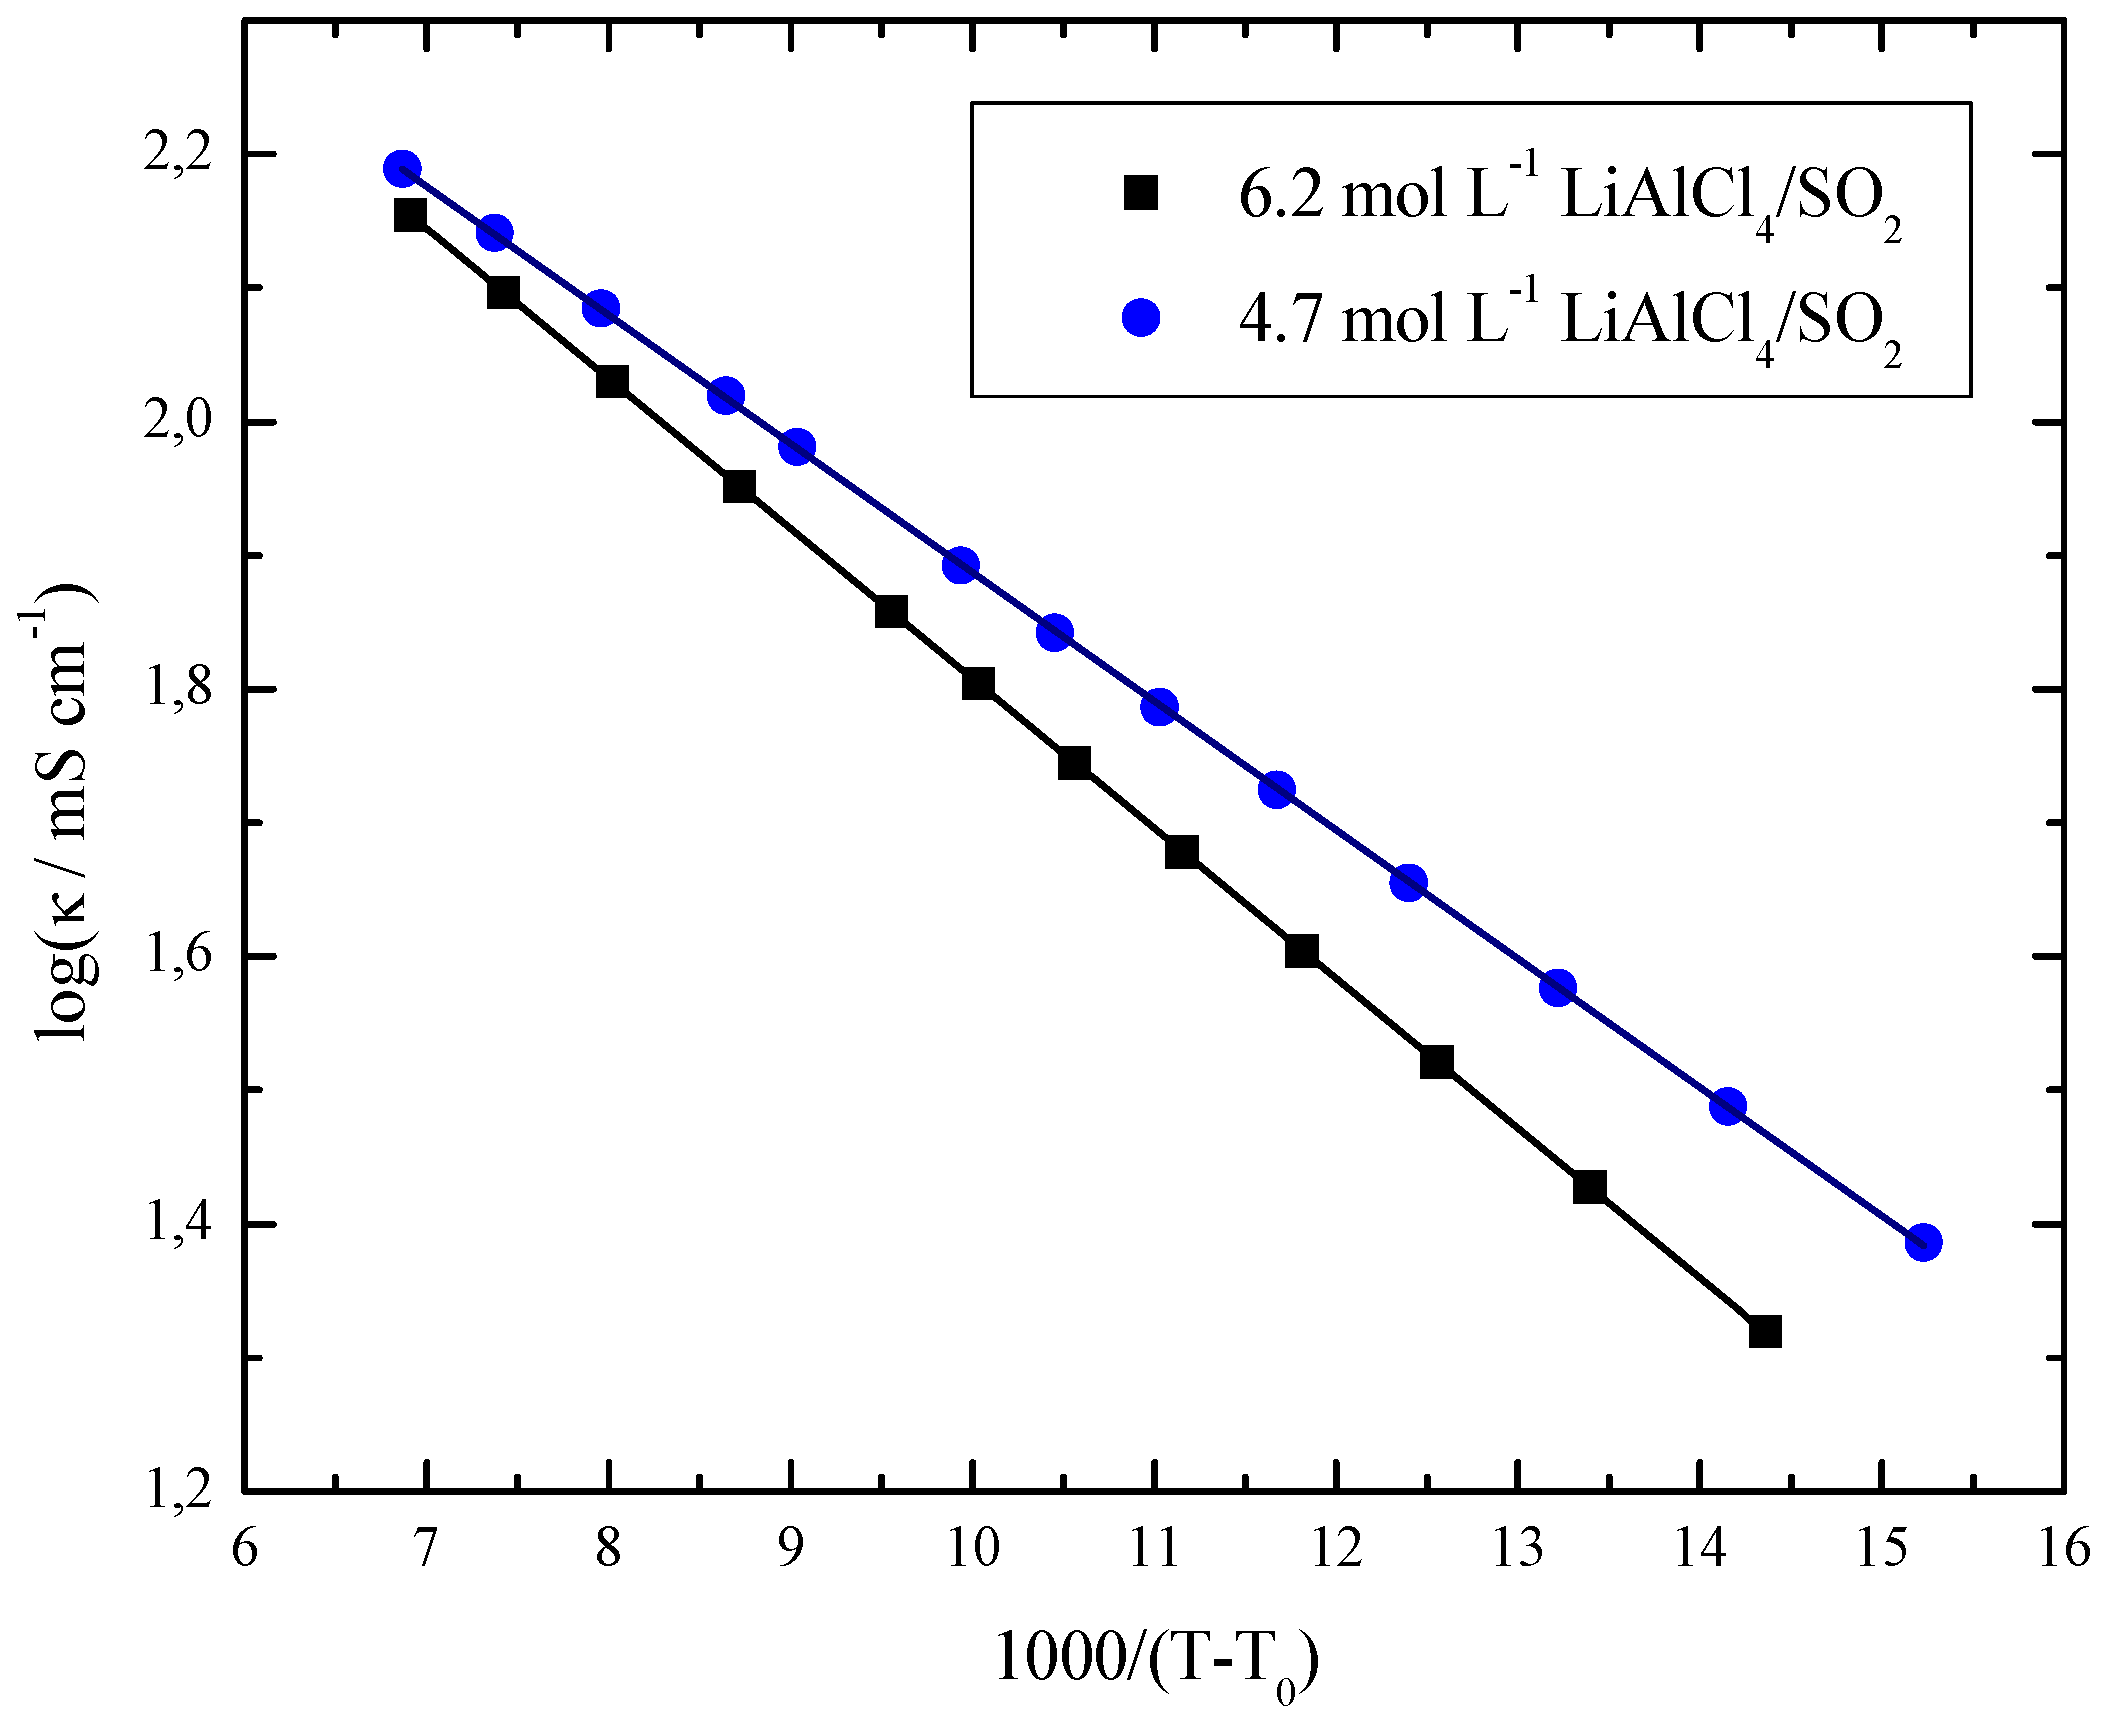
| c/mol L−1 | κ0 ± σ(κ0)]/mS cm−1 | [B ± σ(B)]/K | [T0 ± σ(T0)]/K |
|---|---|---|---|
| 4.7 | 711.3 ± 10.2 | 222.1 ± 3.1 | 187.5 ± 0.7 |
| 6.2 | 849.9 ± 1.8 | 258.2 ± 0.5 | 198.5 ± 0.1 |
3. Experimental Section
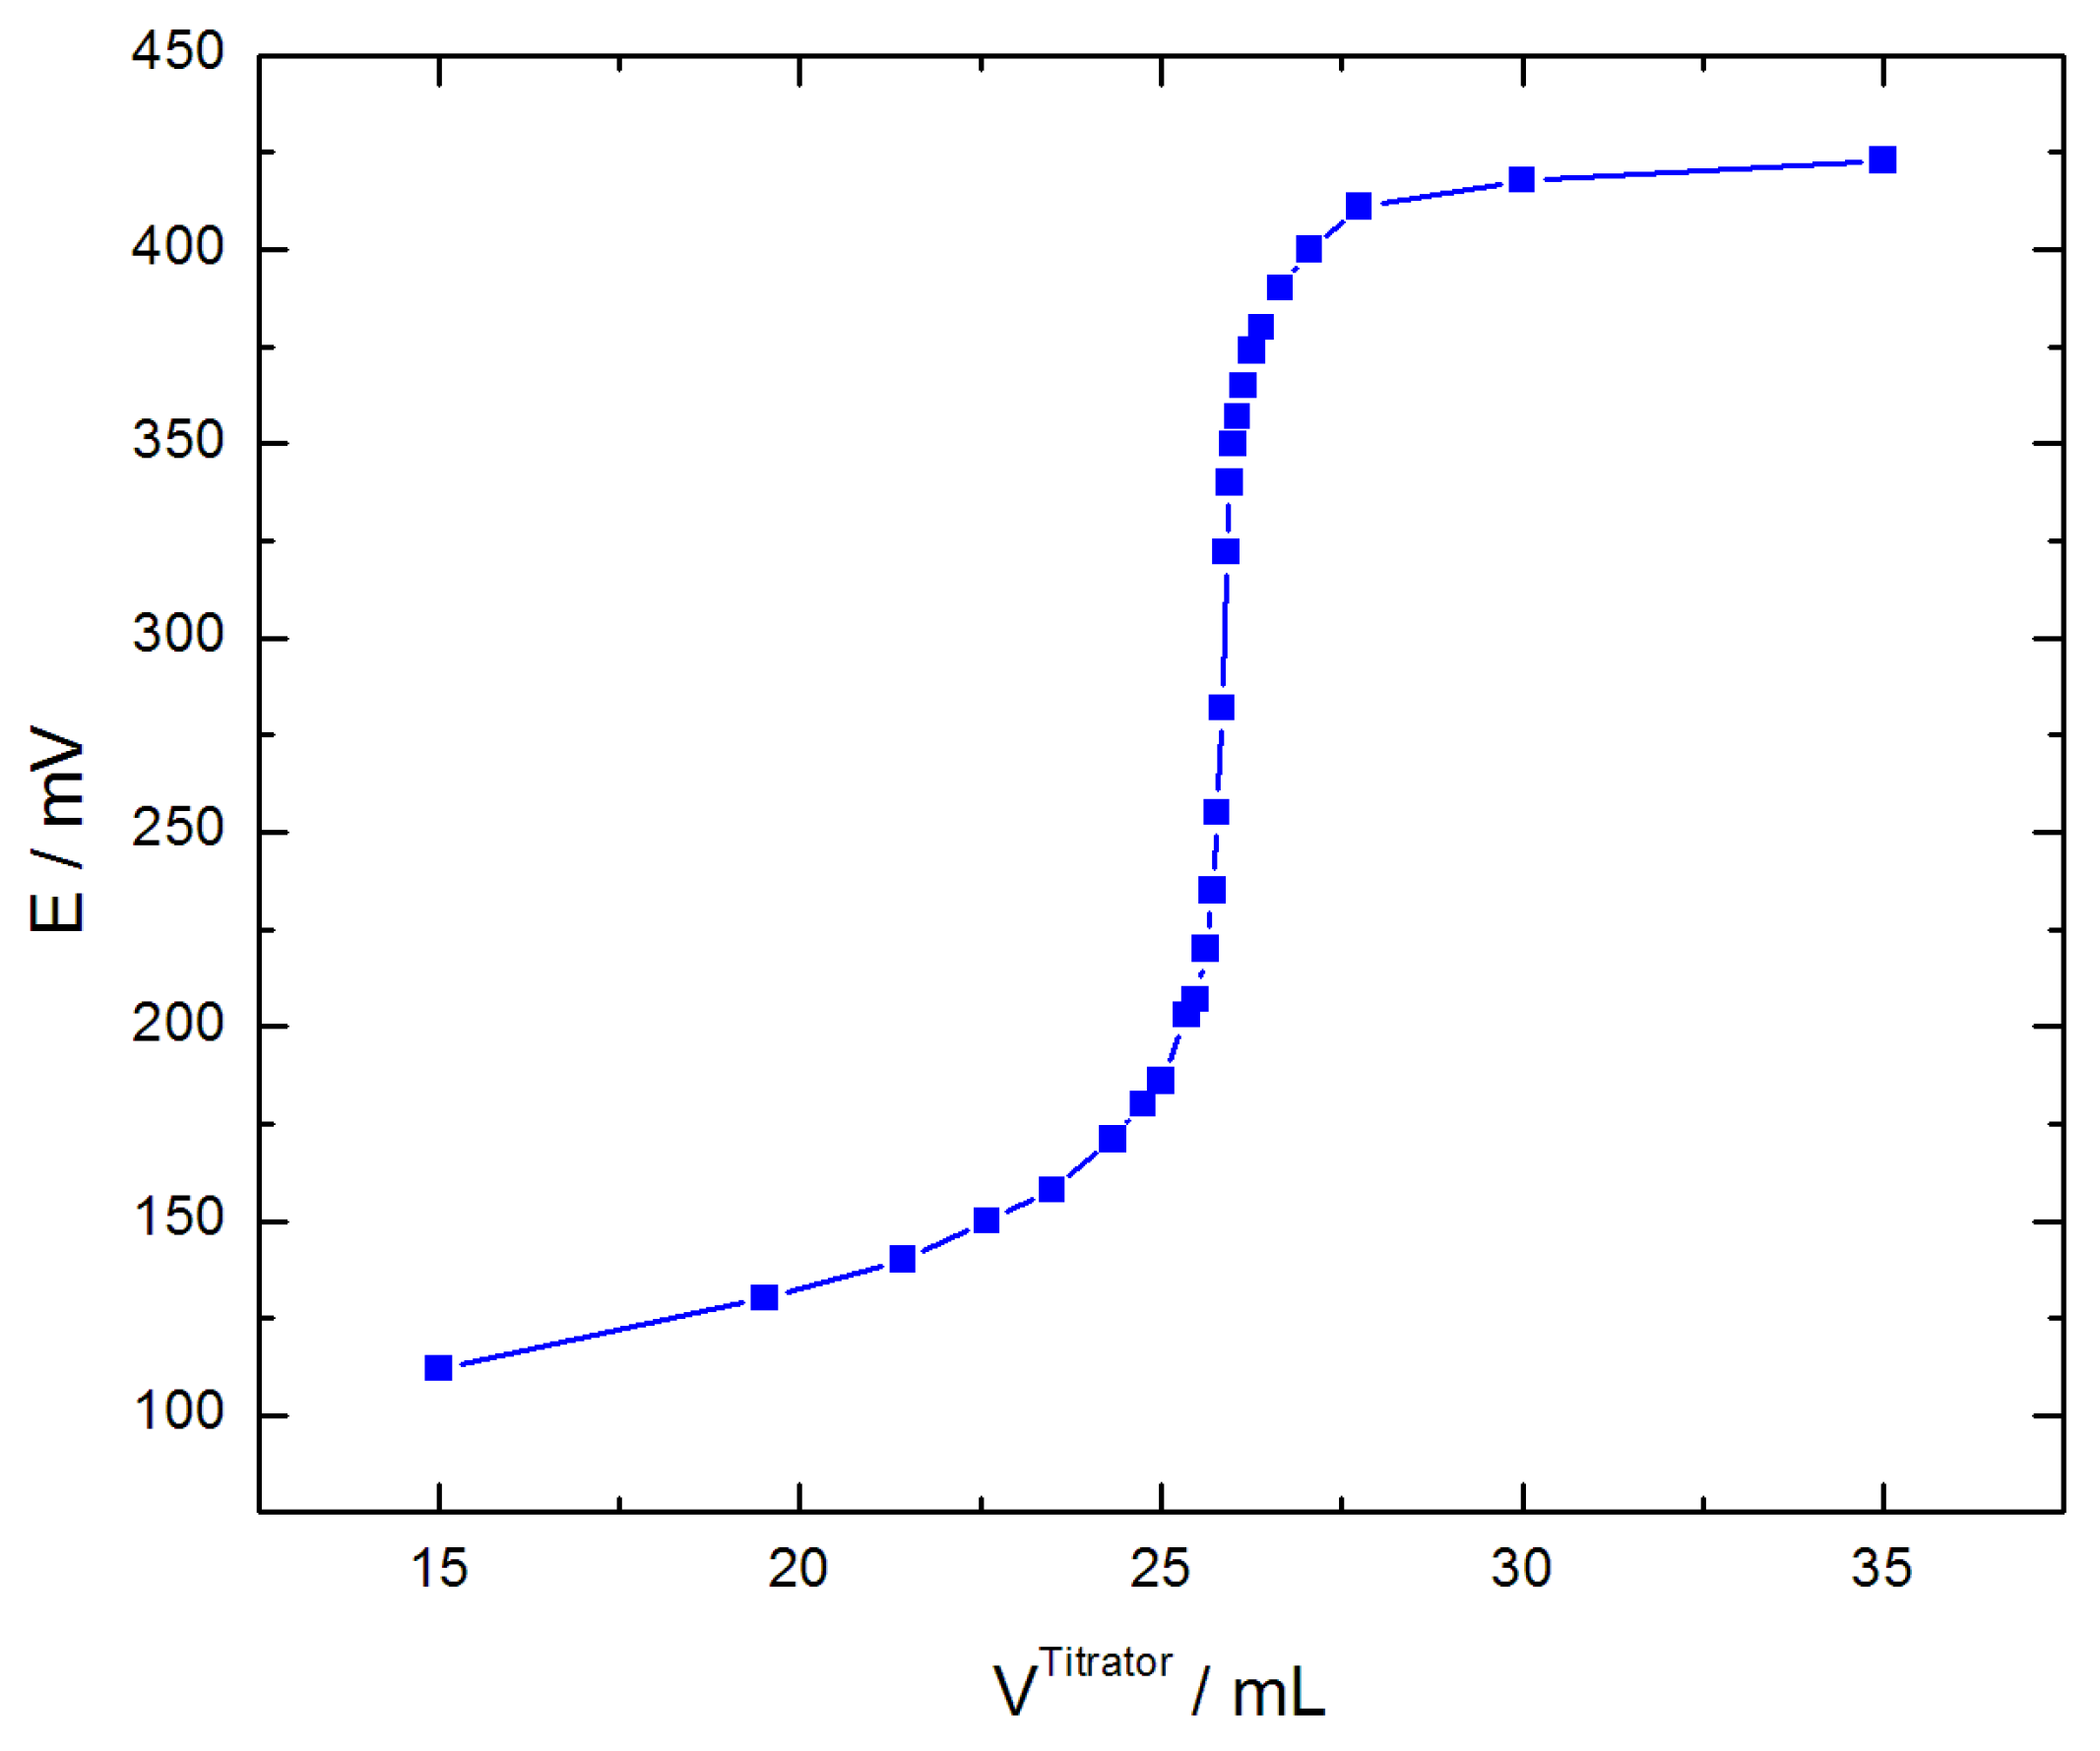
3.1. Potentiometric Titration
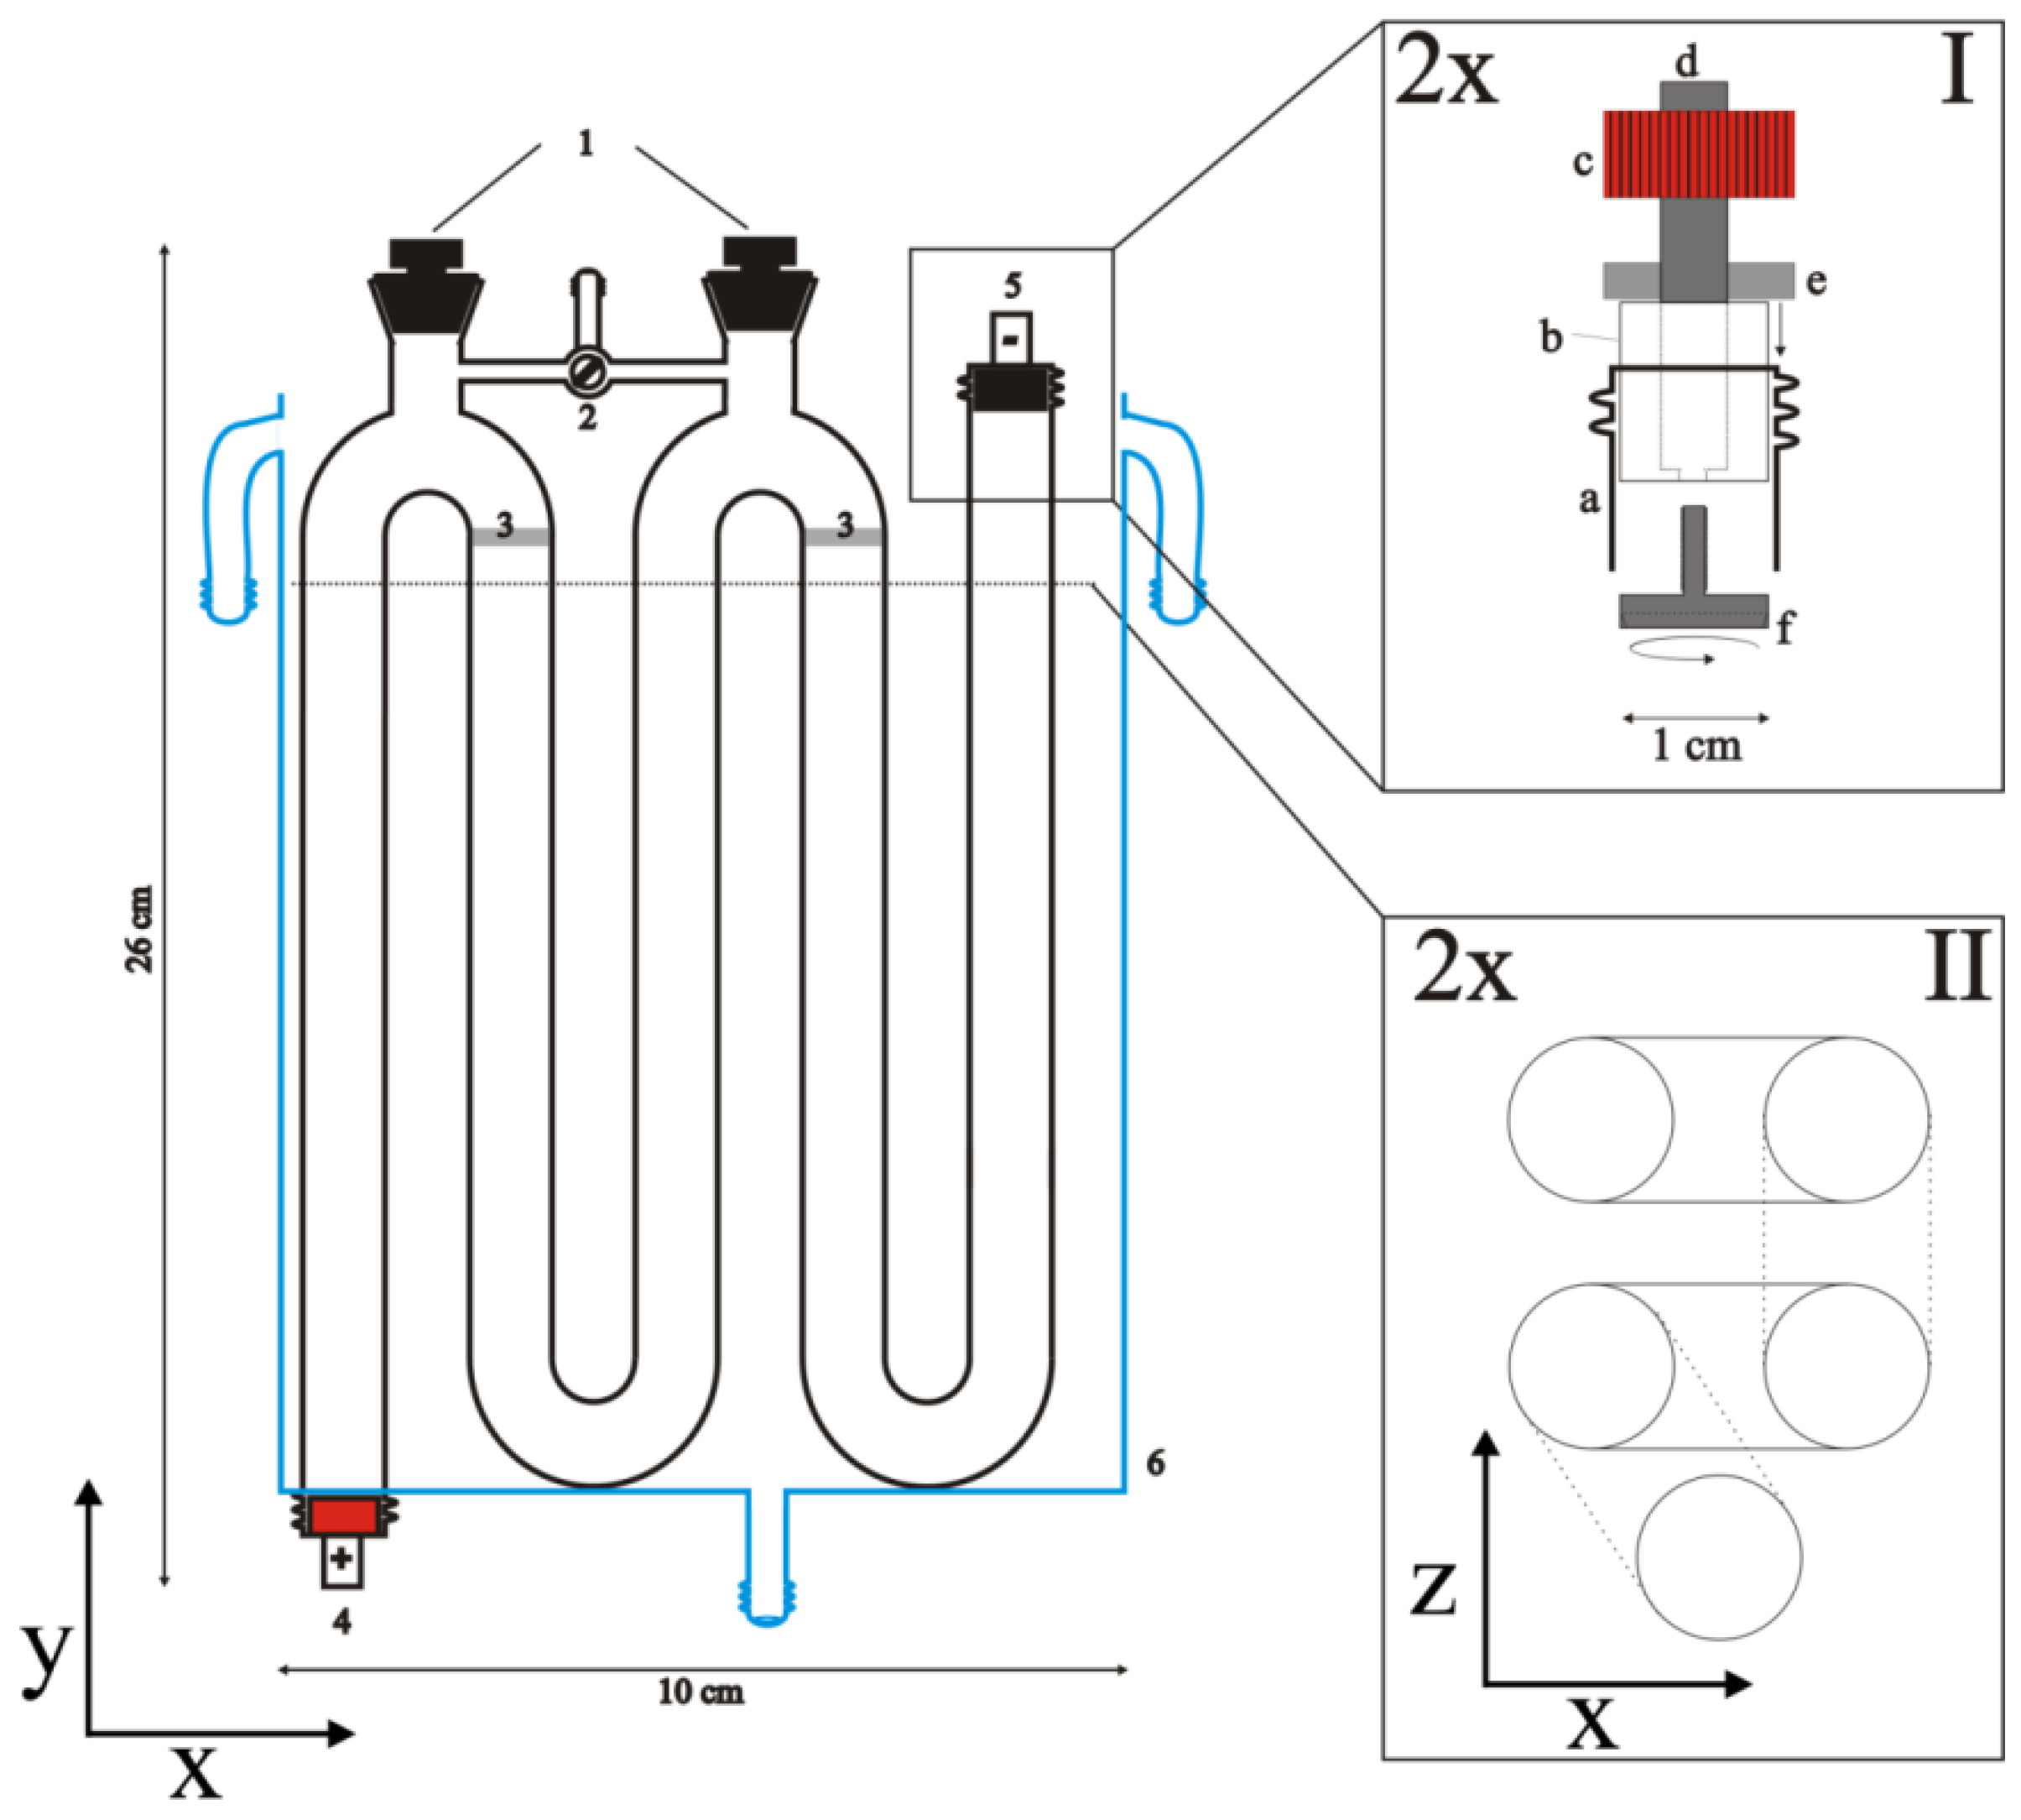
3.2. Transference Number Measurements via Hittorf’s Method

3.3. Conductivity Measurement
3.4. DOSY-NMR Measurements
4. Conclusions
Acknowledgments
Conflicts of Interest
References
- Besenhard, J.O.; Winter, M. Insertion reactions in advanced electrochemical energy storage. Pure Appl. Chem. 1998, 70, 603–608. [Google Scholar] [CrossRef]
- Wagner, R.; Preschitschek, N.; Passerini, S.; Leker, J.; Winter, M. Current research trends and prospects among the various materials and designs used in lithium-based batteries. J. Appl. Electrochem. 2013, 43, 481–496. [Google Scholar] [CrossRef]
- Winter, M.; Besenhard, J.O. Wiederaufladbare batterien [in German]. Chem. Unserer Zeit 1999, 33, 252–266. [Google Scholar] [CrossRef]
- Gores, H.J.; Barthel, J.; Zugmann, S.; Moosbauer, D.; Hartl, R.; Amereller, M.; Maurer, A. Liquid Nonaqueous Electrolytes. In Handbook of Battery Materials, 2nd ed.; Daniel, C., Besenhard, J.O., Eds.; Wiley-VCH: Weinheim, Germany, 2011; Chapter 17; pp. 525–626. [Google Scholar]
- Xu, K. Nonaqueous liquid electrolytes for lithium-based rechargeable batteries. Chem. Rev. 2004, 104, 4303–4418. [Google Scholar] [CrossRef] [PubMed]
- Winter, M.; Imhof, R.; Joho, F.; Novak, P. FTIR and DEMS investigations on the electroreduction of chloroethylene carbonate-based electrolyte solutions for lithium-ion cells. J. Power Sources 1999, 81–82, 818–823. [Google Scholar]
- Olivier, J.P.; Winter, M. Determination of the absolute and relative extents of basal plane surface area and “non-basal plane surface” area of graphites and their impact on anode performance in lithium ion batteries. J. Power Sources 2001, 97–98, 151–155. [Google Scholar]
- Korepp, C.; Santner, H.; Fujii, T.; Ue, M.; Besenhard, J.O.; Moeller, K.C.; Winter, M. 2-Cyanofuran—A novel vinylene electrolyte additive for PC-based electrolytes in lithium-ion batteries. J. Power Sources 2006, 158, 578–582. [Google Scholar] [CrossRef]
- Buqa, H.; Blyth, R.I.R.; Golob, P.; Evers, B.; Schneider, I.; Santis Alvarez, M.V.; Hofer, F.; Netzer, F.P.; Ramsey, M.G.; Winter, M.; Besenhard, J.O. Negative electrodes in rechargeable lithium ion batteries—Influence of graphite surface modification on the formation of the solid electrolyte interphase. Ionics 2000, 6, 172–179. [Google Scholar] [CrossRef]
- Kraemer, E.; Passerini, S.; Winter, M. Dependency of aluminum collector corrosion in lithium ion batteries on the electrolyte solvent. ECS Electrochem. Lett. 2012, 1, C9–C11. [Google Scholar] [CrossRef]
- Kraemer, E.; Schedlbauer, T.; Hoffmann, B.; Terborg, L.; Nowak, S.; Gores, H.J.; Passerini, S.; Winter, M. Mechanism of anodic dissolution of the aluminum current collector in 1 M LiTFSI EC:DEC 3:7 in rechargeable lithium batteries. J. Electrochem. Soc. 2013, 160, A356–A360. [Google Scholar] [CrossRef]
- Linden, D.E.J.; Reddy, T.B. Handbook of Batteries, 3rd ed.; McGraw-Hill: New York, NY, USA, 2002. [Google Scholar]
- Tasaki, K.; Goldberg, A.; Winter, M. On the difference in cycling behaviors of lithium-ion battery cell between the ethylene carbonate- and propylene carbonate-based electrolytes. Electrochim. Acta 2011, 56, 10424–10435. [Google Scholar] [CrossRef]
- Wrodnigg, G.H.; Besenhard, J.O.; Winter, M. Cyclic and acyclic sulfites: New solvents and electrolyte additives for lithium ion batteries with graphitic anodes? J. Power Sources 2001, 97–98, 592–594. [Google Scholar]
- Schedlbauer, T.; Krueger, S.; Schmitz, R.; Schmitz, R.W.; Schreiner, C.; Gores, H.; Passerini, S.; Winter, M. Lithium difluoro(oxalato)borate: A promising salt for lithium metal based secondary batteries? Electrochim. Acta 2013, 92, 102–107. [Google Scholar] [CrossRef]
- Zhang, S.S. An unique lithium salt for the improved electrolyte of Li-ion battery. Electrochem. Commun. 2006, 8, 1423–1428. [Google Scholar] [CrossRef]
- Besenhard, J.O.; Winter, M.; Yang, J.; Biberacher, W. Filming mechanism of lithium-carbon anodes in organic and inorganic electrolytes. J. Power Sources 1995, 54, 228–231. [Google Scholar] [CrossRef]
- Zinck, L.; Borck, M.; Ripp, C.; Hambitzer, G. Purification process for an inorganic rechargeable lithium battery and new safety concepts. J. Appl. Electrochem. 2006, 36, 1291–1295. [Google Scholar] [CrossRef]
- Stassen, I.; Hambitzer, G. Metallic lithium batteries for high power applications. J. Power Sources 2002, 105, 145–150. [Google Scholar] [CrossRef]
- Gores, H.J.; Schweiger, H.; Multerer, M. Optimizing the Conductivity of Electrolytes for Lithium Ion-Cells. In Advanced Materials and Methods for Lithium-Ion Batteries; Zhang, S.S., Ed.; Transworld Research Network: Kerala, India, 2007; Chapter 11; pp. 257–278. [Google Scholar]
- Petrowsky, M.; Frech, R. Concentration dependence of ionic transport in dilute organic electrolyte solutions. J. Phys. Chem. B 2008, 112, 8285–8290. [Google Scholar] [CrossRef] [PubMed]
- Hartl, R.; Neueder, R.; Gores, H.J. Temperature dependence of association constants of LiAlCl4 in liquid sulfur dioxide. Acta Chim. Slov. 2009, 56, 109–114. [Google Scholar]
- Barthel, J.; Krienke, H.; Kunz, W. Physical Chemistry of Electrolyte Solutions; Steinkopff Verlag: Darmstadt, Germany, 1998; Volume 5. [Google Scholar]
- Takezawa, S.; Kondo, Y.; Tokura, N. Conductance of electrolytes in liquid sulfur dioxide at 25.deg. J. Phys. Chem. 1972, 77, 2133–2137. [Google Scholar] [CrossRef]
- Zugmann, S.; Fleischmann, M.; Amereller, M.; Gschwind, R.M.; Wiemhöfer, H.D.; Gores, H.J. Measurement of transference numbers for lithium ion electrolytes via four different methods, a comparative study. Electrochim. Acta 2011, 56, 3926–3933. [Google Scholar] [CrossRef]
- Bruce, P.G.; Vincent, C.A. Steady state current flow in solid binary electrolyte cells. J. Electroanal. Chem. Interfacial Electrochem. 1987, 225, 1–17. [Google Scholar] [CrossRef]
- Ma, Y.P.; Doyle, M.; Fuller, T.F.; Doeff, M.M.; de Jonghe, L.C.; Newman, J. The measurement of a complete set of transport properties for a concentrated solid polymer electrolyte solution. J. Electrochem. Soc. 1995, 142, 1859–1868. [Google Scholar] [CrossRef]
- MacInnes, D.A.; Beattie, J. The free energy of dilution and the transference numbers of lithium chloride solutions. J. Am. Chem. Soc. 1920, 42, 1117–1128. [Google Scholar] [CrossRef]
- Mauro, V.; D’Aprano, A.; Croce, F.; Salomon, M. Direct determination of transference numbers of LiClO4 solutions in propylene carbonate and acetonitrile. J. Power Sources 2005, 141, 167–170. [Google Scholar] [CrossRef]
- Spiro, M. Transference Numbers. In Physical Methods of Chemistry: Electrochemical Methods; Weissberger, A., Rossiter, B.W., Eds.; Wiley-Interscience: New York, NY, USA, 1971; Volume 1, Chapter 4; pp. 205–295. [Google Scholar]
- Mizuhata, M.; Ito, F.; Deki, S. Transport properties of non-aqueous lithium electrolyte coexisting with porous solid materials: Montmorillonite-based electrolyte composite system. J. Power Sources 2005, 146, 365–370. [Google Scholar] [CrossRef]
- Steel, B.J.; Stokes, R.H. A Hittorf transference number apparatus employing conductimetric analysis of the solutions. J. Phys. Chem. 1958, 62, 450–452. [Google Scholar] [CrossRef]
- Strachan, E.K.; Chu, V.G. The transference number, conductance, and ionization of hydriodic acid at 25°. J. Am. Chem. Soc. 1914, 36, 810–819. [Google Scholar] [CrossRef]
- Ronge, G.; Wagner, C. Transference numbers of solid potassium chloride with strontium chloride, potassium oxide, and sodium sulfide as additives. J. Chem. Phys. 1950, 18, 74–76. [Google Scholar] [CrossRef]
- MacInnes, D.A.; Dole, M. Differential potentiometric titration. III. An improved apparatus and its application to precision measurements. J. Am. Chem. Soc. 1929, 51, 1119–1127. [Google Scholar] [CrossRef]
- MacInnes, D.A.; Dole, M. The transference numbers of potassium chloride. New determinations by the Hittorf method and a comparison with results obtained by the moving-boundary method. J. Am. Chem. Soc. 1931, 53, 1357–1364. [Google Scholar] [CrossRef]
- Gill, D.S.; Singh, R.; Ali, V.; Singh, J.; Rehani, S.K. Transport and compressibility studies of some copper(I) perchlorates in binary mixtures of benzonitrile and acetonitrile. J. Chem. Soc. Faraday Trans. 1994, 90, 583–586. [Google Scholar] [CrossRef]
- Paul, R.C.; Singla, J.P.; Narula, S.P. Transference numbers and ionic solvation of lithium chloride in dimethylformamide. J. Phys. Chem. 1969, 73, 741–743. [Google Scholar] [CrossRef]
- Gillespie, R.J.; Wasif, S. 44. Solutions in sulphuric acid. Part X. Transport-number measurements. J. Chem. Soc. 1953, 209–215. [Google Scholar] [CrossRef]
- Joshi, Y.M.; Kwak, J.C.T. Transference numbers, polyion mobilities, and charge fractions in aqueous solutions of lithium, sodium, and potassium dextransulfate. Biophys. Chem. 1980, 12, 323–328. [Google Scholar] [CrossRef] [PubMed]
- Saito, Y.; Yamamoto, H.; Nakamura, O.; Kageyama, H.; Ishikawa, H.; Miyoshi, T.; Matsuoka, M. Determination of ionic self-diffusion coefficients of lithium electrolytes using the pulsed field gradient NMR. J. Power Sources 1999, 81–82, 772–776. [Google Scholar]
- Saito, Y.; Umecky, T.; Niwa, J.; Sakai, T.; Maeda, S. Existing condition and migration property of ions in lithium electrolytes with ionic liquid solvent. J. Phys. Chem. B 2007, 111, 11794–11802. [Google Scholar] [CrossRef] [PubMed]
- Bayley, P.M.; Novak, J.; Khoo, T.; Britton, M.M.; Howlett, P.C.; Macfarlane, D.R.; Forsyth, M. The influence of water and metal ions on the transport properties of Trihexyl(tetradecyl)phosphonium chloride. Austr. J. Chem. 2012, 65, 1542–1547. [Google Scholar] [CrossRef]
- Castiglione, F.; Ragg, E.; Mele, A.; Appetecchi, G.B.; Montanino, M.; Passerini, S. Molecular environment and enhanced diffusivity of Li+ ions in lithium-salt-doped ionic liquid electrolytes. J. Phys. Chem. Lett. 2011, 2, 153–157. [Google Scholar] [CrossRef]
- Besenhard, J.; Wagner, M.; Winter, M.; Jannakoudakis, A.; Jannakoudakis, P.; Theodoridou, E. Inorganic film-forming electrolyte additives improving the cycling behaviour of metallic lithium electrodes and the self-discharge of carbon-lithium electrodes. J. Power Sources 1993, 44, 413–420. [Google Scholar] [CrossRef]
- Fleischmann, M. NMR Investigations on Catalysts and Conformations in Organo- and Photocatalytic Reactions, and Characterization of Electrolytes and Supramolecular Switchable Container Molecules. Ph.D. Thesis, University of Regensburg, Regensburg, Germany, 2011. [Google Scholar]
- Takeuchi, M.; Kameda, Y.; Umebayashi, Y.; Ogawa, S.; Sonoda, T.; Ishiguro, S.I.; Fujita, M.; Sano, M. Ion-ion interactions of LiPF6 and LiBF4 in propylene carbonate solutions. J. Mol. Liq. 2009, 148, 99–108. [Google Scholar] [CrossRef]
- Froemling, T.; Kunze, M.; Schoenhoff, M.; Sundermeyer, J.; Roling, B. Enhanced lithium transference numbers in ionic liquid electrolytes. J. Phys. Chem. B 2008, 112, 12985–12990. [Google Scholar] [CrossRef] [PubMed]
- Vogel, H. Das temperaturabhaengigkeitsgesetz der viskositaet von fluessigkeiten [in German]. Phys. Zeit. 1921, 22, 645–646. [Google Scholar]
- Fulcher, G.S. Analysis of recent measurements of the viscosity of glasses. J. Am. Ceram. Soc. 1952, 8, 339–355. [Google Scholar] [CrossRef]
- Tammann, G.; Hesse, W. Die abhaengigkeit der viscositaet von der temperatur bei unterkuehlten fluessigkeiten [in German]. Z. Anorg. Allg. Chem. 1926, 156, 245–257. [Google Scholar] [CrossRef]
- Schreiner, C.; Zugmann, S.; Hartl, R.; Gores, H.J. Temperature dependence of viscosity and specific conductivity of fluoroborate-based ionic liquids in light of the fractional Walden rule and Angell’s fragility concept. J. Chem. Eng. Data 2010, 55, 4372–4377. [Google Scholar] [CrossRef]
- Gu, G.Y.; Bouvier, S.; Wu, C.; Laura, R.; Rzeznik, M.; Abraham, K.M. 2-Methoxyethyl (methyl) carbonate-based electrolytes for Li-ion batteries. Electrochim. Acta 2000, 45, 3127–3139. [Google Scholar] [CrossRef]
- Barthel, J.; Gores, H.J.; Schmeer, G. The temperature dependence of the properties of electrolyte solutions. III. Conductance of various salts at high concentrations in propylene carbonate at temperatures from −45 °C to +25 °C. Ber. Bunsenges. Phys. Chem. 1979, 83, 911–920. [Google Scholar] [CrossRef] [Green Version]
- Bohmer, R.; Ngai, K.L.; Angell, C.A.; Plazek, D.J. Nonexponential relaxations in strong and fragile glass formers. J. Chem. Phys. 1993, 99, 4201–4209. [Google Scholar] [CrossRef]
- Vilgis, T.A. Strong and fragile glasses: A powerful classification and its consequences. Phys. Rev. B 1993, 47, 2882–2885. [Google Scholar] [CrossRef]
- Valtz, A.; Coquelet, C.; Richon, D. Vapor-liquid equilibrium data for the sulfur oxide (SO2) + difluoromethane (R32) system at temperatures from 288.07 to 403.16 K and at pressures in up to 7.31 MPa. Int. J. Thermophys. 2004, 25, 1695–1711. [Google Scholar] [CrossRef]
- Barthel, J.; Gores, H.J. Solution Chemistry: A Cutting Edge in Modern Electrochemical Technology. In Chemistry of Nonaqueous Solutions; Mamantov, G., Popov, A.I., Eds.; VCH: New York, NY, USA, 1994; Chapter 1; pp. 1–148. [Google Scholar]
- Carl, E. Neue Elektrolyte in Organischen Carbonatloesungen zur Anwendung in Sekundaeren Lithium-Ionen-Batterien [in German]. Ph.D. Thesis, University of Regensburg, Regensburg, Germany, 1998. [Google Scholar]
- Barthel, J.; Wachter, R.; Gores, H.J. Temperature Dependence of Conductance of Electrolytes in Nonaqueous Solutions. In Modern Aspects of Electrochemistry; Conway, B.E., Bockris, J.O.M., Eds.; Plenum: New York, NY, USA, 1979; Volume 13, Chapter 1; pp. 1–79. [Google Scholar]
- Barthel, J.; Feuerlein, F.; Neueder, R.; Wachter, R. Calibration of conductance cells at various temperatures. J. Solut. Chem. 1980, 9, 209–219. [Google Scholar] [CrossRef]
- Wachter, R.; Barthel, J. Temperature-dependence of the properties of electrolyte-solutions. 2. Determination of the conductance over a wide temperature-range. Ber. Bunsenges. Phys. Chem. 1979, 83, 634–642. [Google Scholar] [CrossRef]
- Barthel, J. Electrolytes in non-aqueous solvents. Pure Appl. Chem. 1979, 51, 2093–2124. [Google Scholar] [CrossRef]
© 2013 by the authors; licensee MDPI, Basel, Switzerland. This article is an open access article distributed under the terms and conditions of the Creative Commons Attribution license (http://creativecommons.org/licenses/by/3.0/).
Share and Cite
Hartl, R.; Fleischmann, M.; Gschwind, R.M.; Winter, M.; Gores, H.J. A Liquid Inorganic Electrolyte Showing an Unusually High Lithium Ion Transference Number: A Concentrated Solution of LiAlCl4 in Sulfur Dioxide. Energies 2013, 6, 4448-4464. https://doi.org/10.3390/en6094448
Hartl R, Fleischmann M, Gschwind RM, Winter M, Gores HJ. A Liquid Inorganic Electrolyte Showing an Unusually High Lithium Ion Transference Number: A Concentrated Solution of LiAlCl4 in Sulfur Dioxide. Energies. 2013; 6(9):4448-4464. https://doi.org/10.3390/en6094448
Chicago/Turabian StyleHartl, Robert, Matthias Fleischmann, Ruth M. Gschwind, Martin Winter, and Heiner Jakob Gores. 2013. "A Liquid Inorganic Electrolyte Showing an Unusually High Lithium Ion Transference Number: A Concentrated Solution of LiAlCl4 in Sulfur Dioxide" Energies 6, no. 9: 4448-4464. https://doi.org/10.3390/en6094448