To Re-Explore the Causality between Barriers to Renewable Energy Development: A Case Study of Wind Energy

Abstract
:1. Introduction
2. Methodology
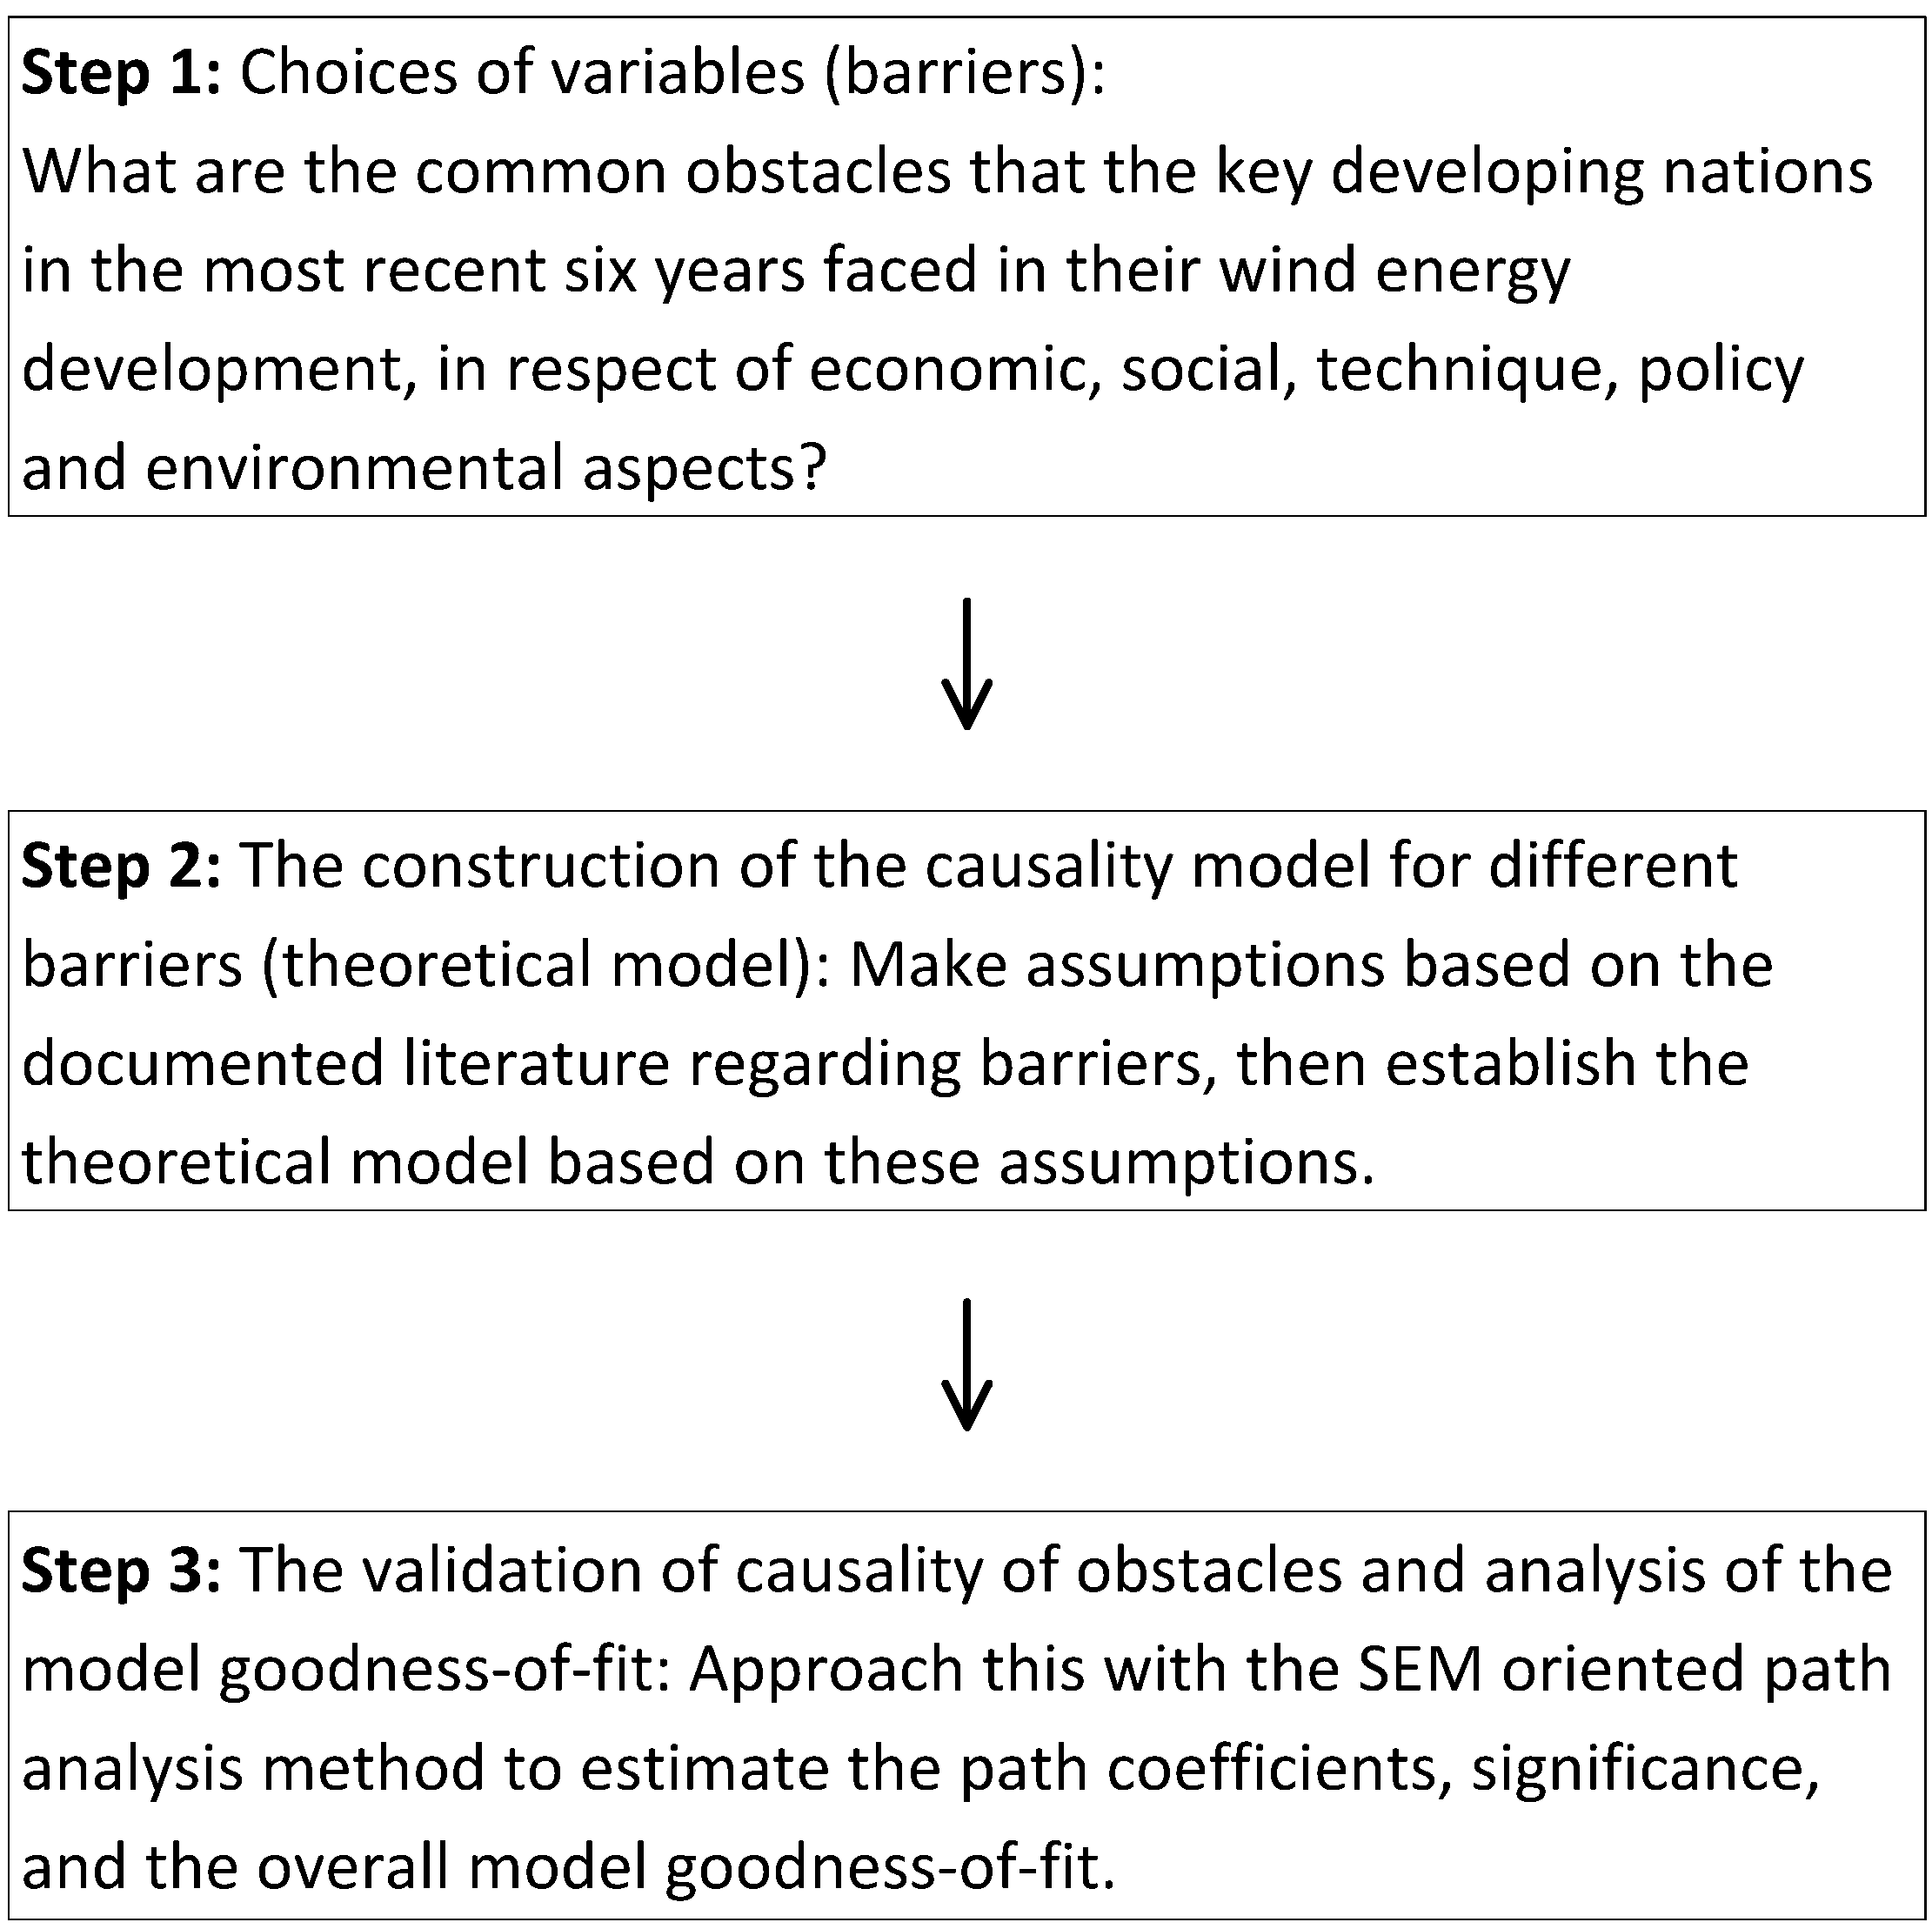
2.1. Research on Choices of Variables (Barriers)
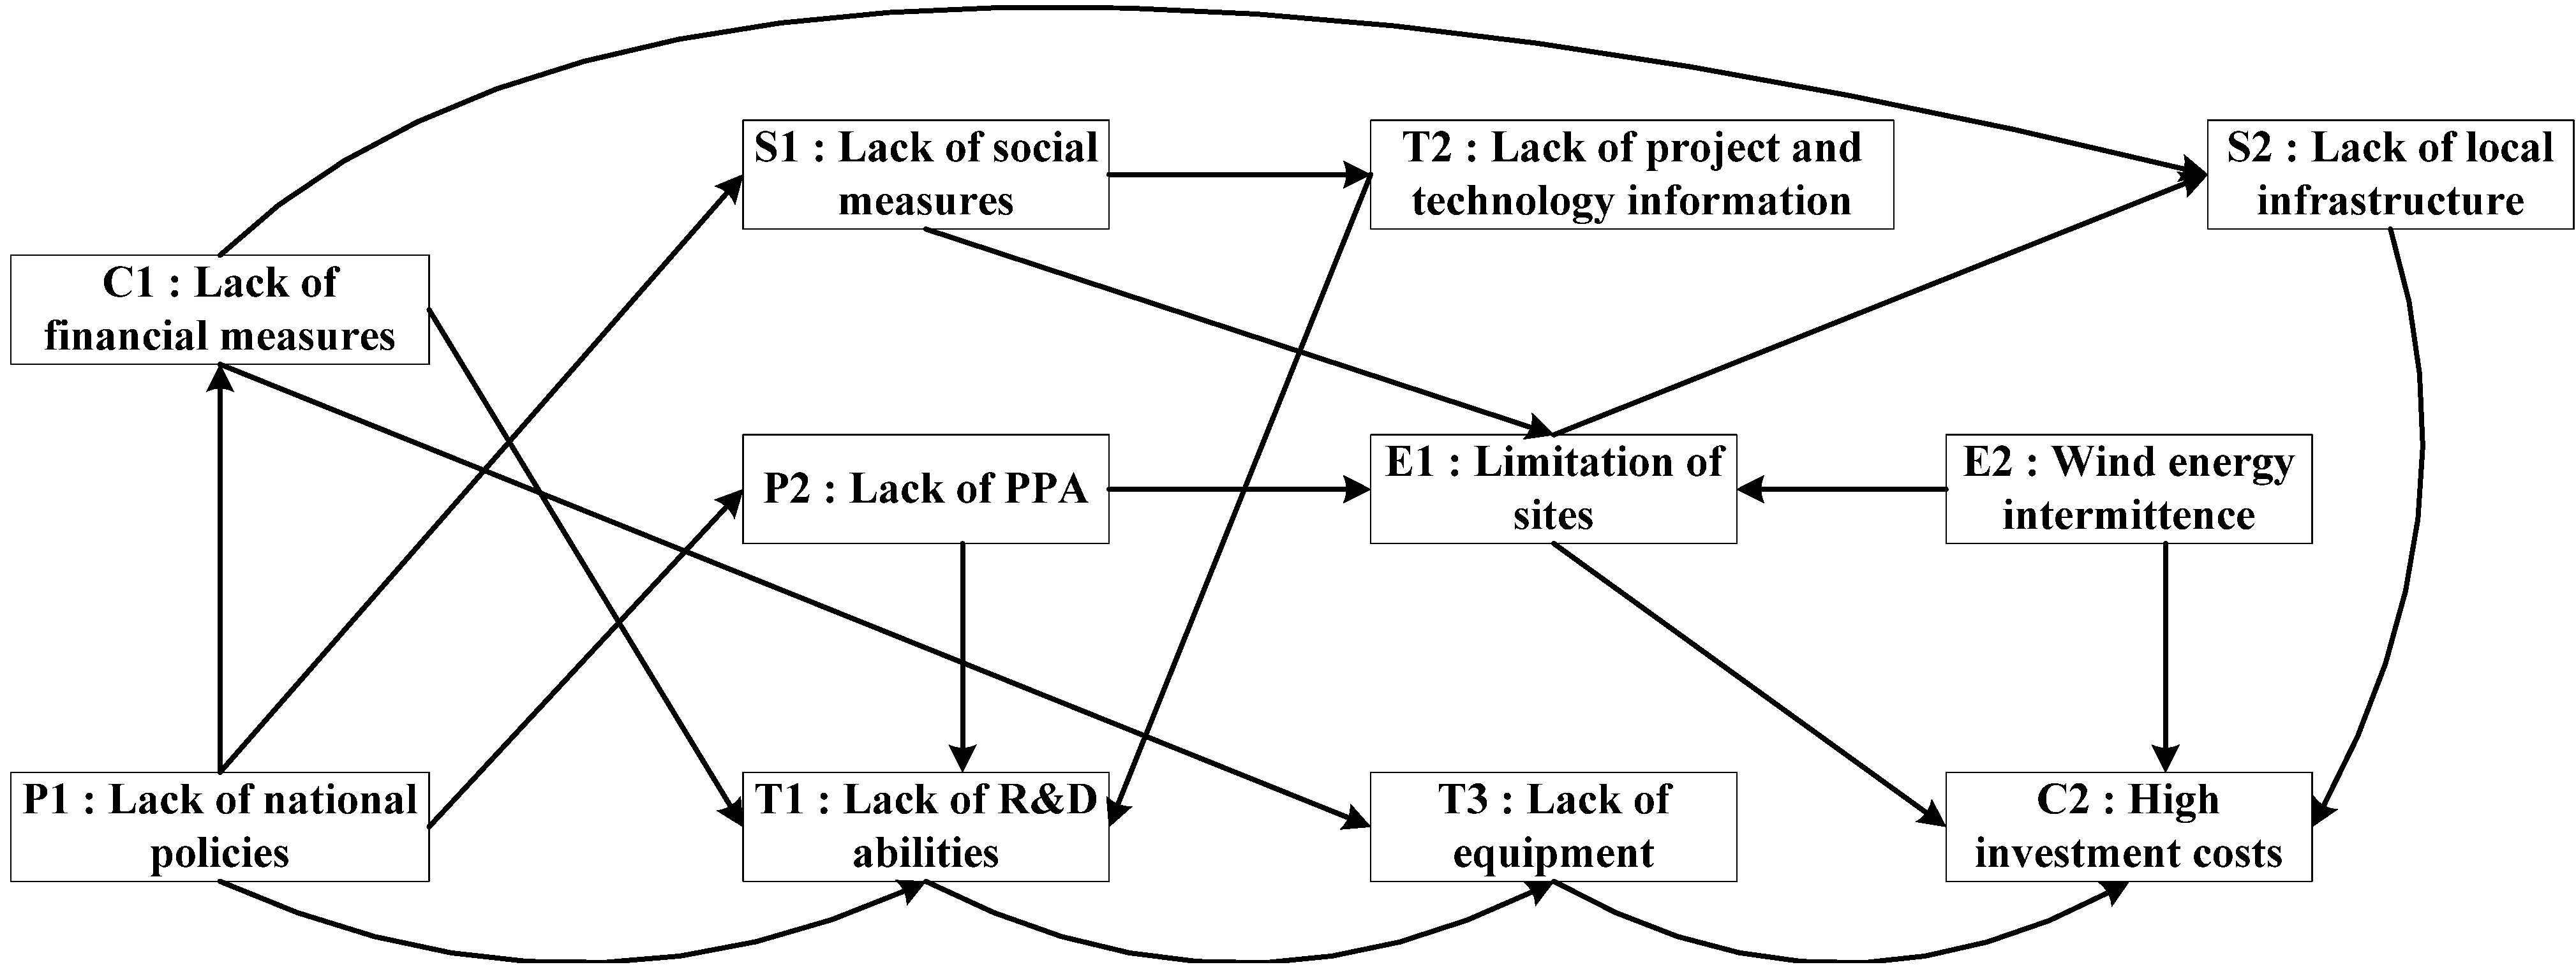
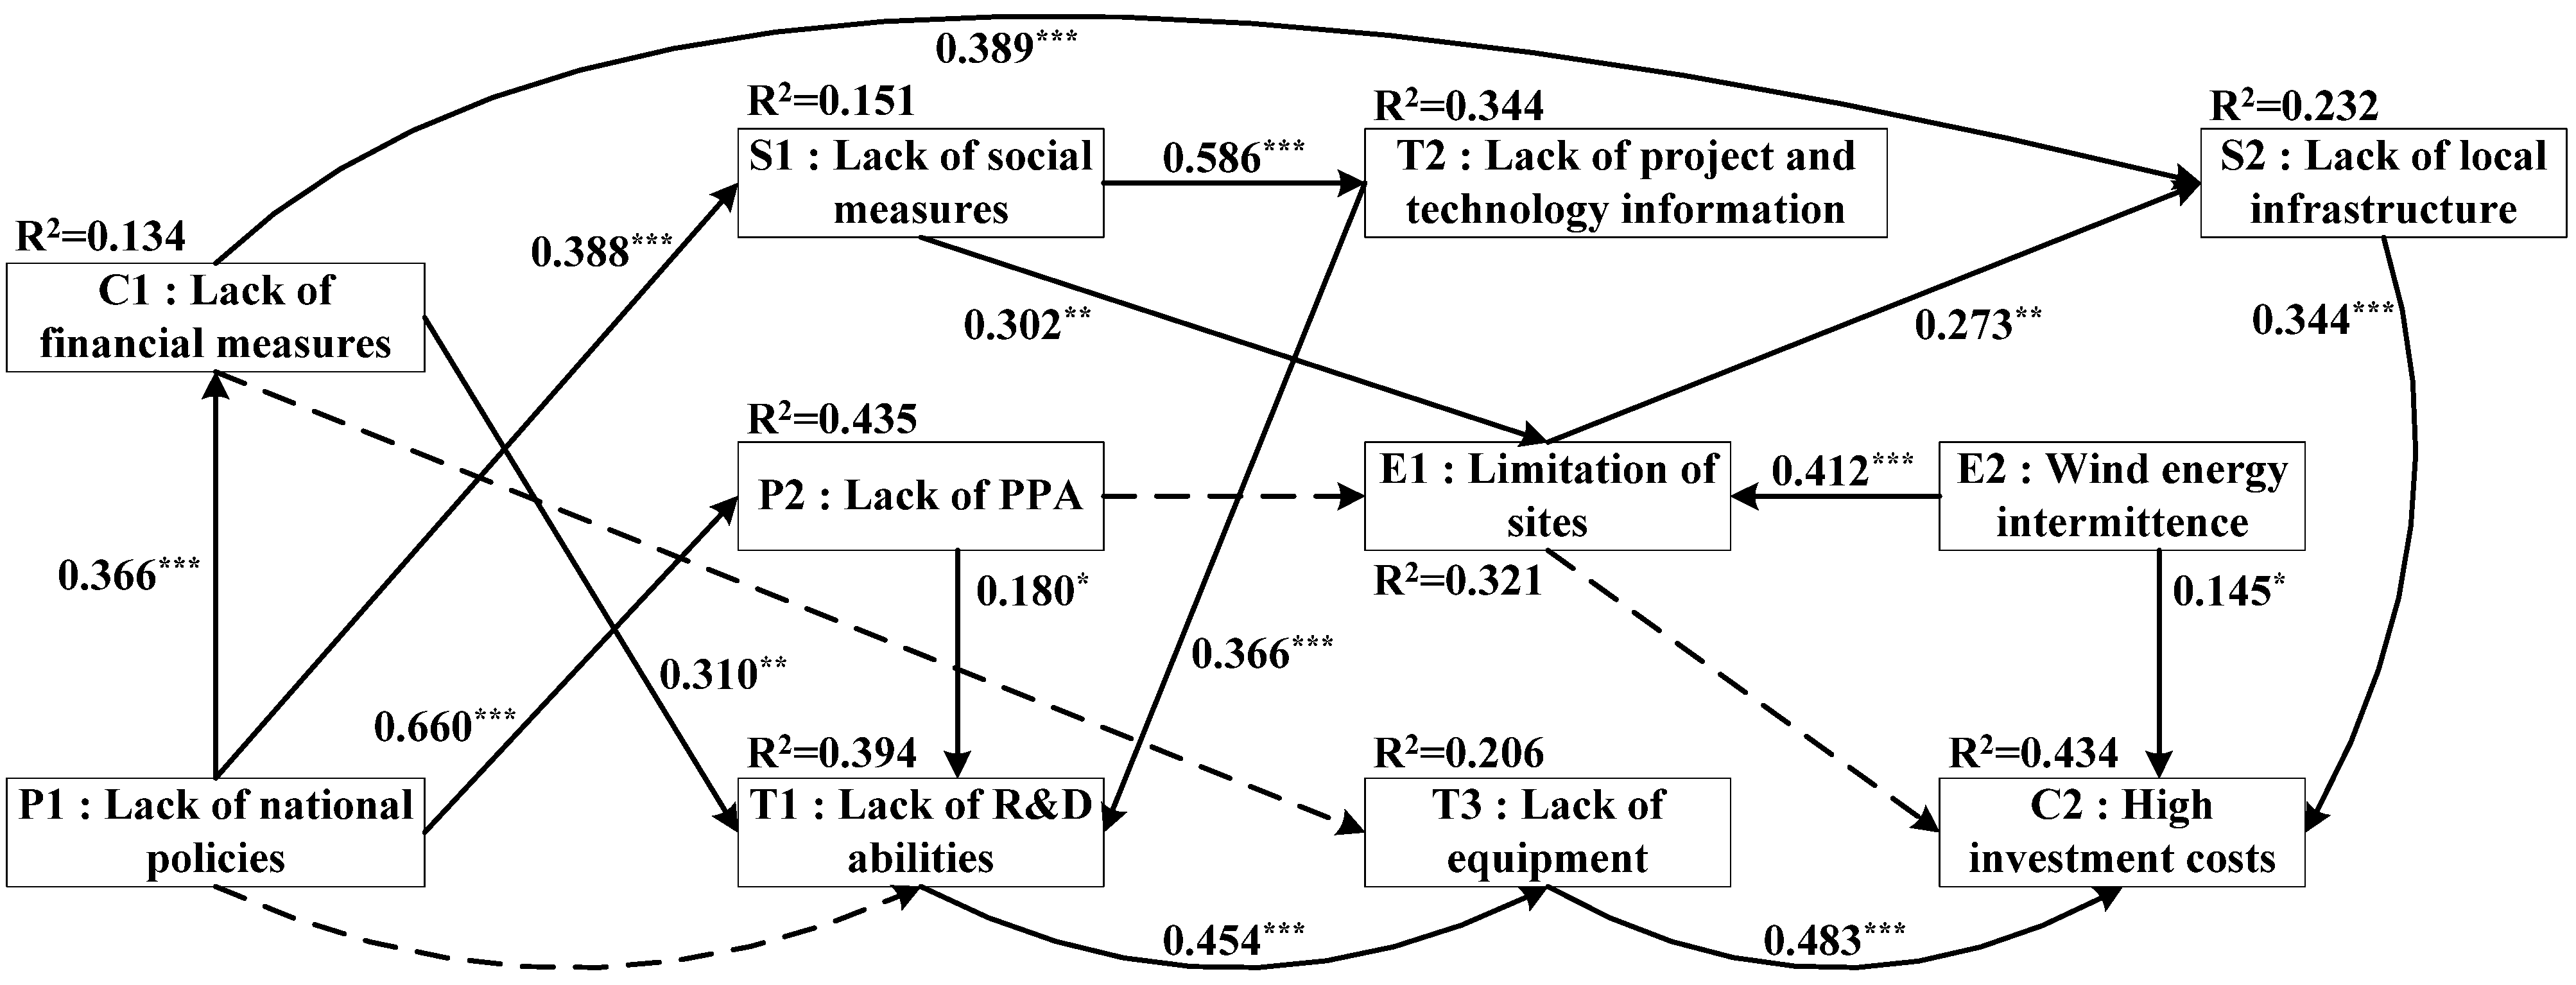
2.2. The Establishment of the Causality Model of Barriers (Theoretical Model)
- Lack of national policies: a healthy policy environment is not only a prerequisite for a nation’s sustainable development [14,17,22,28,44], but it also minimizes the conflict between RE and non-RE. If a nation does not have mandatory objectives in its development or a clear legal basis, it is easy to cause prejudice among various departments over the implementation of the subsidies. Thus, a higher financial risk in wind energy development resulting from inaccessibility to a reasonable purchase price of electricity restricts the participation of potential developers and penetration of the technology [42]. Furthermore, the lack of a central authority in charge of the wind energy development projects, one which can conduct a detailed assessment and assess the related information, results in a lack of public understanding regarding wind energy development and its economic, social and ecological benefits [26], while the lack of clear norms and an appropriate institutional framework also hinders participation of the private sector due to the deficiency of channels through which to exchange views between the decision makers and stakeholders [48,50]. From a technical aspect point of view, the lack of coordination among different sectors and setting of the research program is one of the main reasons leading to the redundancy of R&D activities, and will delay the commercialization and promotion of the technology [40,43,45]. Based on the above discussion, we assume that insufficient national policy may result in a lack of financial incentives and social measures, the occurrence of inappropriate PPA, and incapability in the RE industry’s R&D;
- Lack of appropriate PPA: a reasonable purchase price of electricity is an important condition to ensure the successful development of wind energy. Therefore, if the decision-makers did not consider the characteristics of wind energy development, for example, high investment costs and long-term investment returns, to set a reasonable price rate on electricity, this may provide inadequate compensation to the local population that results in issues of restriction on land availability [12,43,48]. In addition, an erratic pricing policy reduces the potential developers’ willingness to invest, and limits R&D in turbine and other technologically related industries [40,44]. It is worth noting that a reasonable pricing policy not only elevates the economic potential brought by the wind energy [14,26,51,56,57,58], but also promotes integration between wind energy and national grids [28,42]. From the discussion above, we assume that the absence of an appropriate PPA may limit the site availability and R&D capacity of the related industries;
- Inadequate fiscal incentives: how to get enough profit during the generation of wind energy is the key issue for the future development of wind energy. Therefore, the absence of adequate financial incentives, such as subsidy imports or tariff exemptions, etc., may result in high duties on imported components that hinder the industry’s creation, operation and maintenance [45], and stagnates future development [1,12,39,47]. On the contrary, the implementation of appropriate fiscal incentives encourages potential developers to invest voluntarily in wind energy [50], while also stimulating the development of related industries and promoting technology [17,40,43,44]. Furthermore, the financial support to provide operating capital, such as special loans and preferential interest rates, will help construct the local infrastructure—the physical facilities such as roads and substations, transmission grids and distribution networks set up in the early stages. Such capital can also effectively drive consumers to participate in the development of the RE market to increase RE market demand [26,46]. From the discussion above, we assume that the lack of fiscal incentives may result in the deficiency of appropriate equipment and fundamental infrastructure to develop wind energy, as well as resulting in the incapability of industrial R&D;
- Lack of social promotional measures: public awareness of RE development is an important condition for a successful outcome. Therefore, to improve public awareness and education on the subject [40], the establishment of a mechanism of information transmission between governments and stakeholders, including the collection and feedback of opinions, delivery of projects and technology information [49], has become the main purpose of implementing social promotional measures [26]. Therefore, it is understood that in the absence of information transmission to potential developers, insufficient knowledge regarding new technologies and their applicable information may result in reductions in the efficiency of the wind power generated [45,50]. Similarly, failure to improve public awareness and understanding on the subject, that may result in the choice of site may become an issue due to the “not in my back yard” (NIMBY) syndrome; often this results in the plant being located in remote areas, and these areas typically have insufficient infrastructure [44,48]. Thus, potential developers must invest additional funds in infrastructure such as building power grids and substations in the early stages of wind energy development [12,14,17,28,42,43,46,51]. Based on the above discussion, we assume that the lack of social promotion measures may result in insufficient knowledge regarding projects and technology information, with the limitations on site availability;
- Lack of local infrastructure: the establishment of infrastructure through full grid transmission and network distribution for the future development of wind energy will help the integration between wind power and the nation grid [22,28,39,45]. This can also reduce the cost of construction and operation of wind energy developments [40,48]. On the contrary, the lack of appropriate physical infrastructure will force potential developers to invest additional funds in the power grid or other infrastructural improvement projects [8]. Studies have pointed out that turbines, related equipment imports and infrastructure construction account for a very high proportion of the overall investment cost of wind energy [12]. Based on the above discussion, we assume that the lack of local infrastructure may lead to the occurrence of high investment costs;
- Lack of R&D capabilities: wind energy is a cross-cutting discipline [28]. For the future development of wind energy, R&D assistance provided by the government through power storage, technology research grants and related information transmission, and the elevation of the industry’s innovative capability, will contribute to the penetration of wind energy technology [39,40,44,47]. Therefore, the lack of R&D capability in the domestic industry may require necessary equipment imports from overseas, such as turbines and other important components that support wind energy development and indirectly increase the overall costs [59]. Conversely, the cost of investment in wind energy development can be reduced when the use of local equipment and technology is enhanced [12,42,45]. It is understandable that the planning of innovation and development of technology must be according to demand and based on the resources of the country or region, rather than exclusively relying on the introduction of foreign technology [50]. Based on the above discussion, we assume that the lack of industrial R&D capacity may lead to the problem of storing equipment used for the development of wind energy;
- Lack of projects and technology information: an information sharing system can greatly improve the economic potential of wind energy [42], as well as contributing to the long-term development of this renewable resource [28,48]. Therefore, if potential developers do not have appropriate information, such as the implementation and maintenance of wind energy, then the cost of development and derivative effect assessment to evaluate this may reduce the efficiency of the wind power generated, due to the use of inappropriate equipment in the development and application for a selected site, or that is incompatible with the existing system. In the turbine industry, the lack of projects and technology information, such as durability and reliability assessments to develop new technologies, will limit research in industrial technology and innovation, and hinder technological promotions [45,50,51]. Based on the above discussion, we assume that the lack of projects and technology information may result in an inadequate R&D capacity of the industry;
- Lack of facilities required for wind energy development: research has confirmed that localized equipment manufacturing is one of the vital factors to reduce the investment cost and lead to the successful implementation of wind energy development [50]. Therefore, if the domestic industry does not have equipment manufacturing and maintenance capabilities then turbine components, such as rotors and gearboxes, must be imported from overseas. Since turbines and other import setting devices account for a considerable proportion of the total cost of wind energy production [42,45], the lack of equipment and components will require a substantial increase in the investment and production costs of wind energy development [8,12,22]. Based on the above discussion, we assume that the lack of equipment required for wind energy development may lead to high investment costs;
- The intermittency of wind energy: the wind energy resource is an important criterion for its development [12,40]. However, by considering wind power variability and specific site selections in the large-scale development of wind energy, some managers believe that this will demand additional technology and applicable devices in power storage to ensure the stability of the grid integration. Thus, the initial investment costs of wind energy will be significantly increased [1,14,28,45,46,51]. Considering site availability issues, a detailed assessment of wind energy resources, including the size of the available sites, economic assessment and map information is imperative. Without such a report, it is easily to overlook the possible issues of accessibility to a potential site with good wind, or the condition of the site development capacity, which then results in limited choices of sites [42]. Based on the above discussion, we assume that wind intermittency may lead to high investment costs and limitations on site availability;
- The limitations on site availability: appropriate site selection will help the long-term development of wind energy and enhance its economic and technical performance. However, in the absence of social promotion measures, the choice of site may become an issue due to the NIMBY factor; often this results in plants being located in remote areas, and these areas typically have insufficient infrastructure [17,43,46], which results in low plant factors [42,51]. In addition, the limitations of the transmission pricing schemes, which are based on the transmission distance, will also increase the generation cost of wind energy. It is worth noting that site selection will be subjected to the limits of traditional land use rights; often requiring extensive consultations that result in paying huge subsidies or rent, thus, the cost of investment in wind energy increases [12,14,28,45,50]. Based on the above discussion, we assume that the limitations on site availability may result in insufficient infrastructure and high investment costs.
2.3. The Validation of Causality between Obstacles and Model Goodness-of-Fit Analysis

| Variables | Means | SD | VIF | Skewness | Kurtosis |
|---|---|---|---|---|---|
| National policies (P1) | 1.1437 | 1.0604 | 1.000 | 0.400 | −1.081 |
| PPA (P2) | 1.1066 | 1.0410 | 2.967 | 0.352 | −1.086 |
| Financial measures (C1) | 1.2836 | 1.1784 | 5.950 | 0.231 | −1.402 |
| Investment costs (C2) | 1.2122 | 0.8902 | 6.540 | 0.155 | −0.636 |
| Social measures (S1) | 0.7066 | 0.9062 | 3.159 | 0.909 | −0.471 |
| Local infrastructure (S2) | 0.7088 | 0.7610 | 5.059 | 0.671 | −0.200 |
| R&D capabilities (T1) | 0.5528 | 0.9906 | 3.630 | 1.680 | 1.652 |
| Projects and technology information (T2) | 0.9280 | 1.1558 | 7.416 | 0.958 | −0.338 |
| Equipment (T3) | 1.0636 | 0.9414 | 8.540 | 0.496 | −0.492 |
| Sites (E1) | 0.6818 | 0.9073 | 3.830 | 1.054 | 0.233 |
| Wind intermittence (E2) | 1.8161 | 1.0112 | 4.749 | 0.210 | −0.765 |
| Variables | 1 | 2 | 3 | 4 | 5 | 6 | 7 | 8 | 9 | 10 | 11 |
|---|---|---|---|---|---|---|---|---|---|---|---|
| National policies (P1) | 1.000 | ||||||||||
| PPA (P2) | 0.660 ** | 1.000 | |||||||||
| Social measures (S1) | 0.388 ** | 0.260 ** | 1.000 | ||||||||
| R&D capabilities (T1) | 0.251 ** | 0.279 ** | 0.586 ** | 1.000 | |||||||
| Sites (E1) | 0.222 ** | 0.049 | 0.401 ** | 0.121 | 1.000 | ||||||
| Wind intermittence (E2) | 0.273 ** | 0.187 * | 0.243 ** | 0.197 * | 0.485 ** | 1.000 | |||||
| Local infrastructure (S2) | 0.093 | 0.099 | 0.277 ** | 0.203 * | 0.285 ** | 0.178 * | 1.000 | ||||
| Financial measures (C1) | 0.366 ** | 0.378 ** | 0.273 ** | 0.232 ** | 0.031 | 0.093 | 0.398 ** | 1.000 | |||
| Investment costs (C2) | 0.052 | −0.006 | 0.278 ** | 0.315 ** | 0.206 * | 0.279 ** | 0.402 ** | 0.279 ** | 1.000 | ||
| Projects and technology information (T2) | 0.266 ** | 0.399 ** | 0.330 ** | 0.488 ** | 0.085 | 0.160 | 0.192 * | 0.462 ** | 0.337 ** | 1.000 | |
| Equipment (T3) | 0.129 | 0.131 | 0.257 ** | 0.246 ** | 0.163 | 0.152 | 0.066 | 0.230 ** | 0.528 ** | 0.454 ** | 1.000 |


| Models | X2 | df | p-Value | CFI | TLI | RMSEA | SRMR |
|---|---|---|---|---|---|---|---|
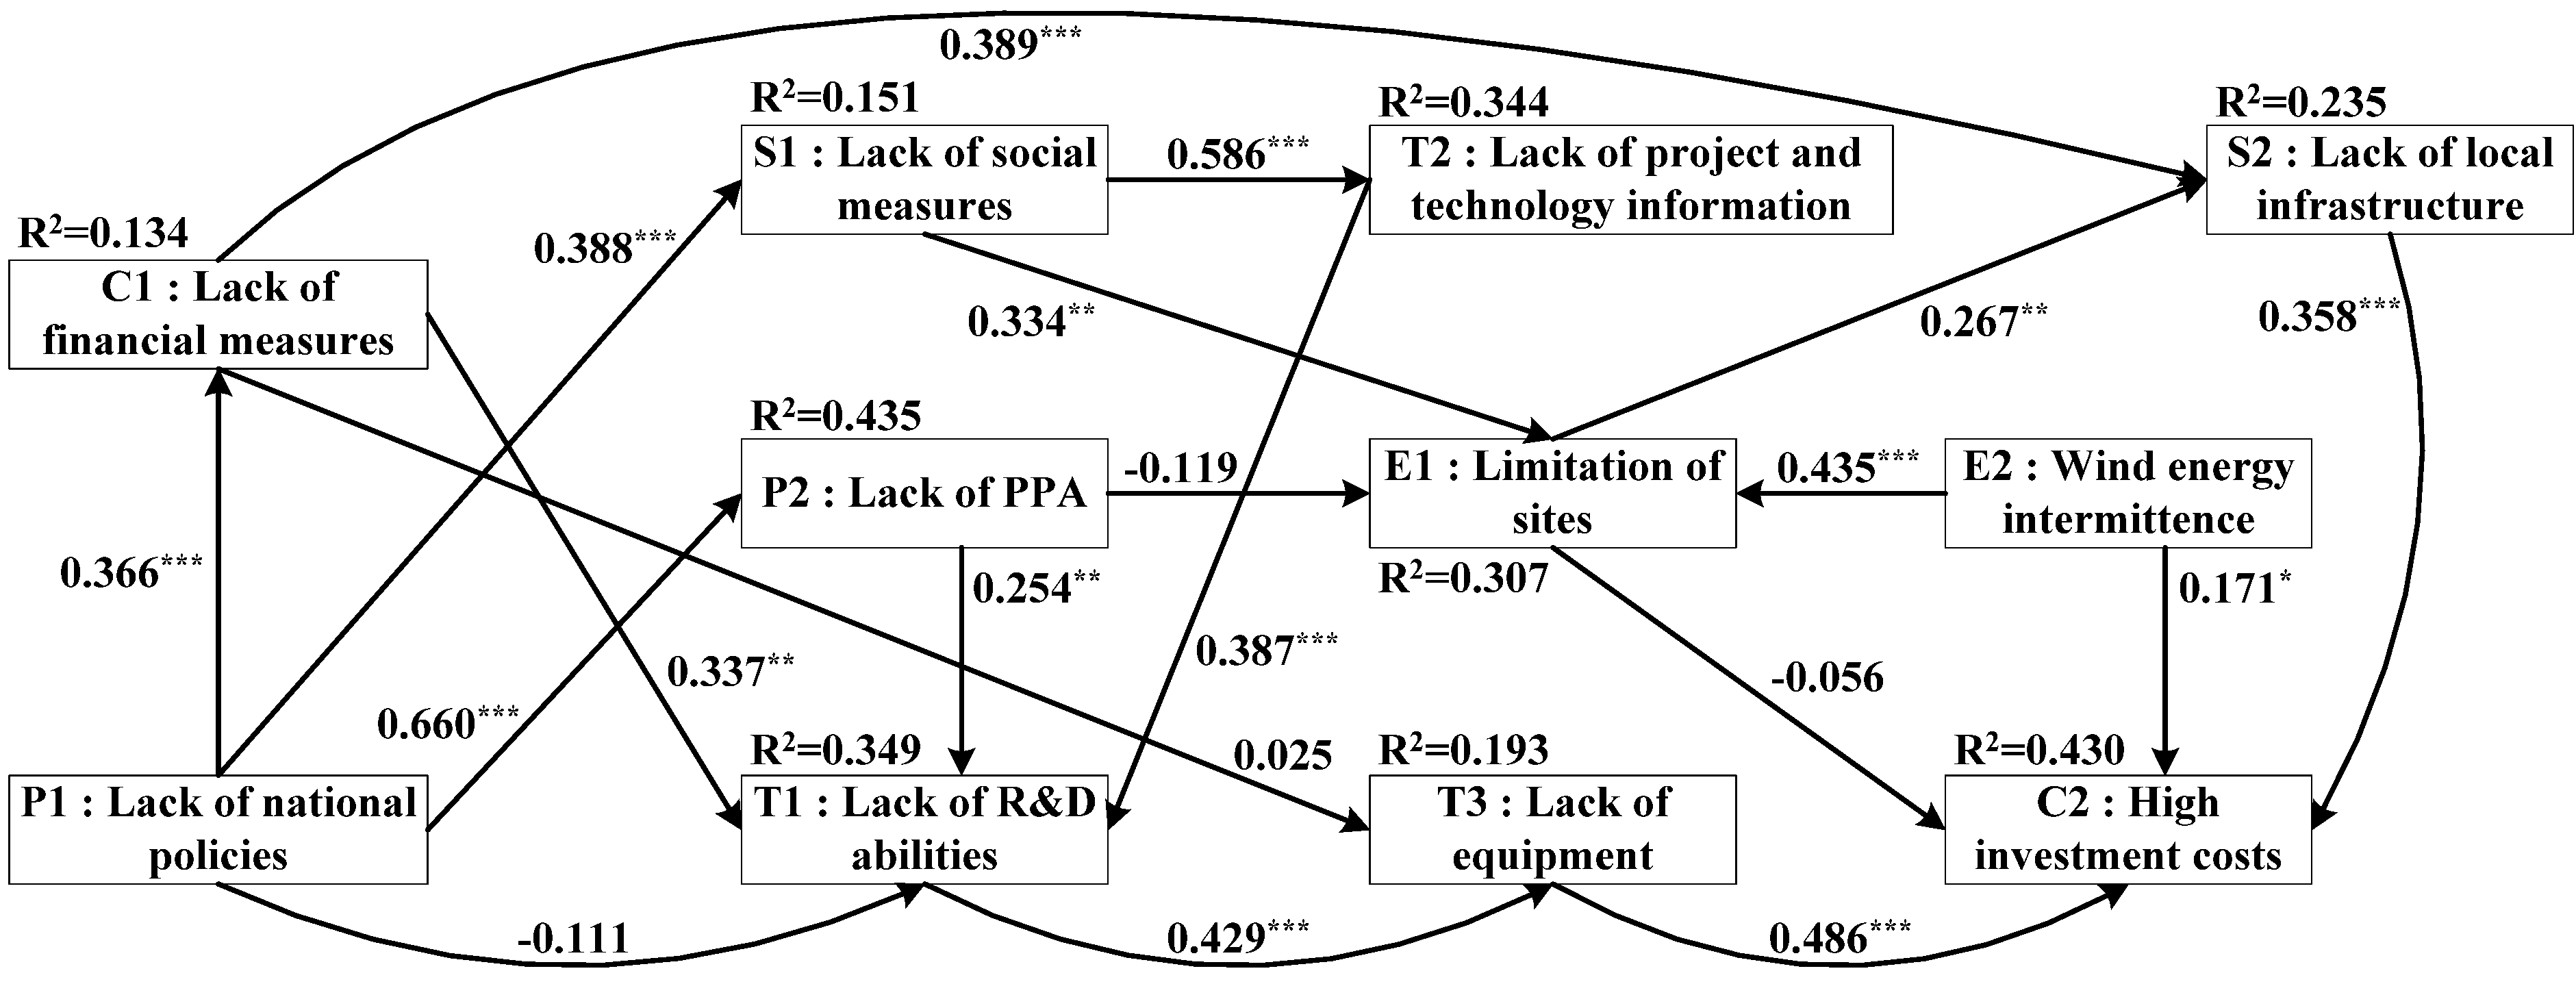
| Model I-Preliminary analysis | 49.546 | 35 | 0.0526 | 0.969 | 0.952 | 0.054 | 0.068 |
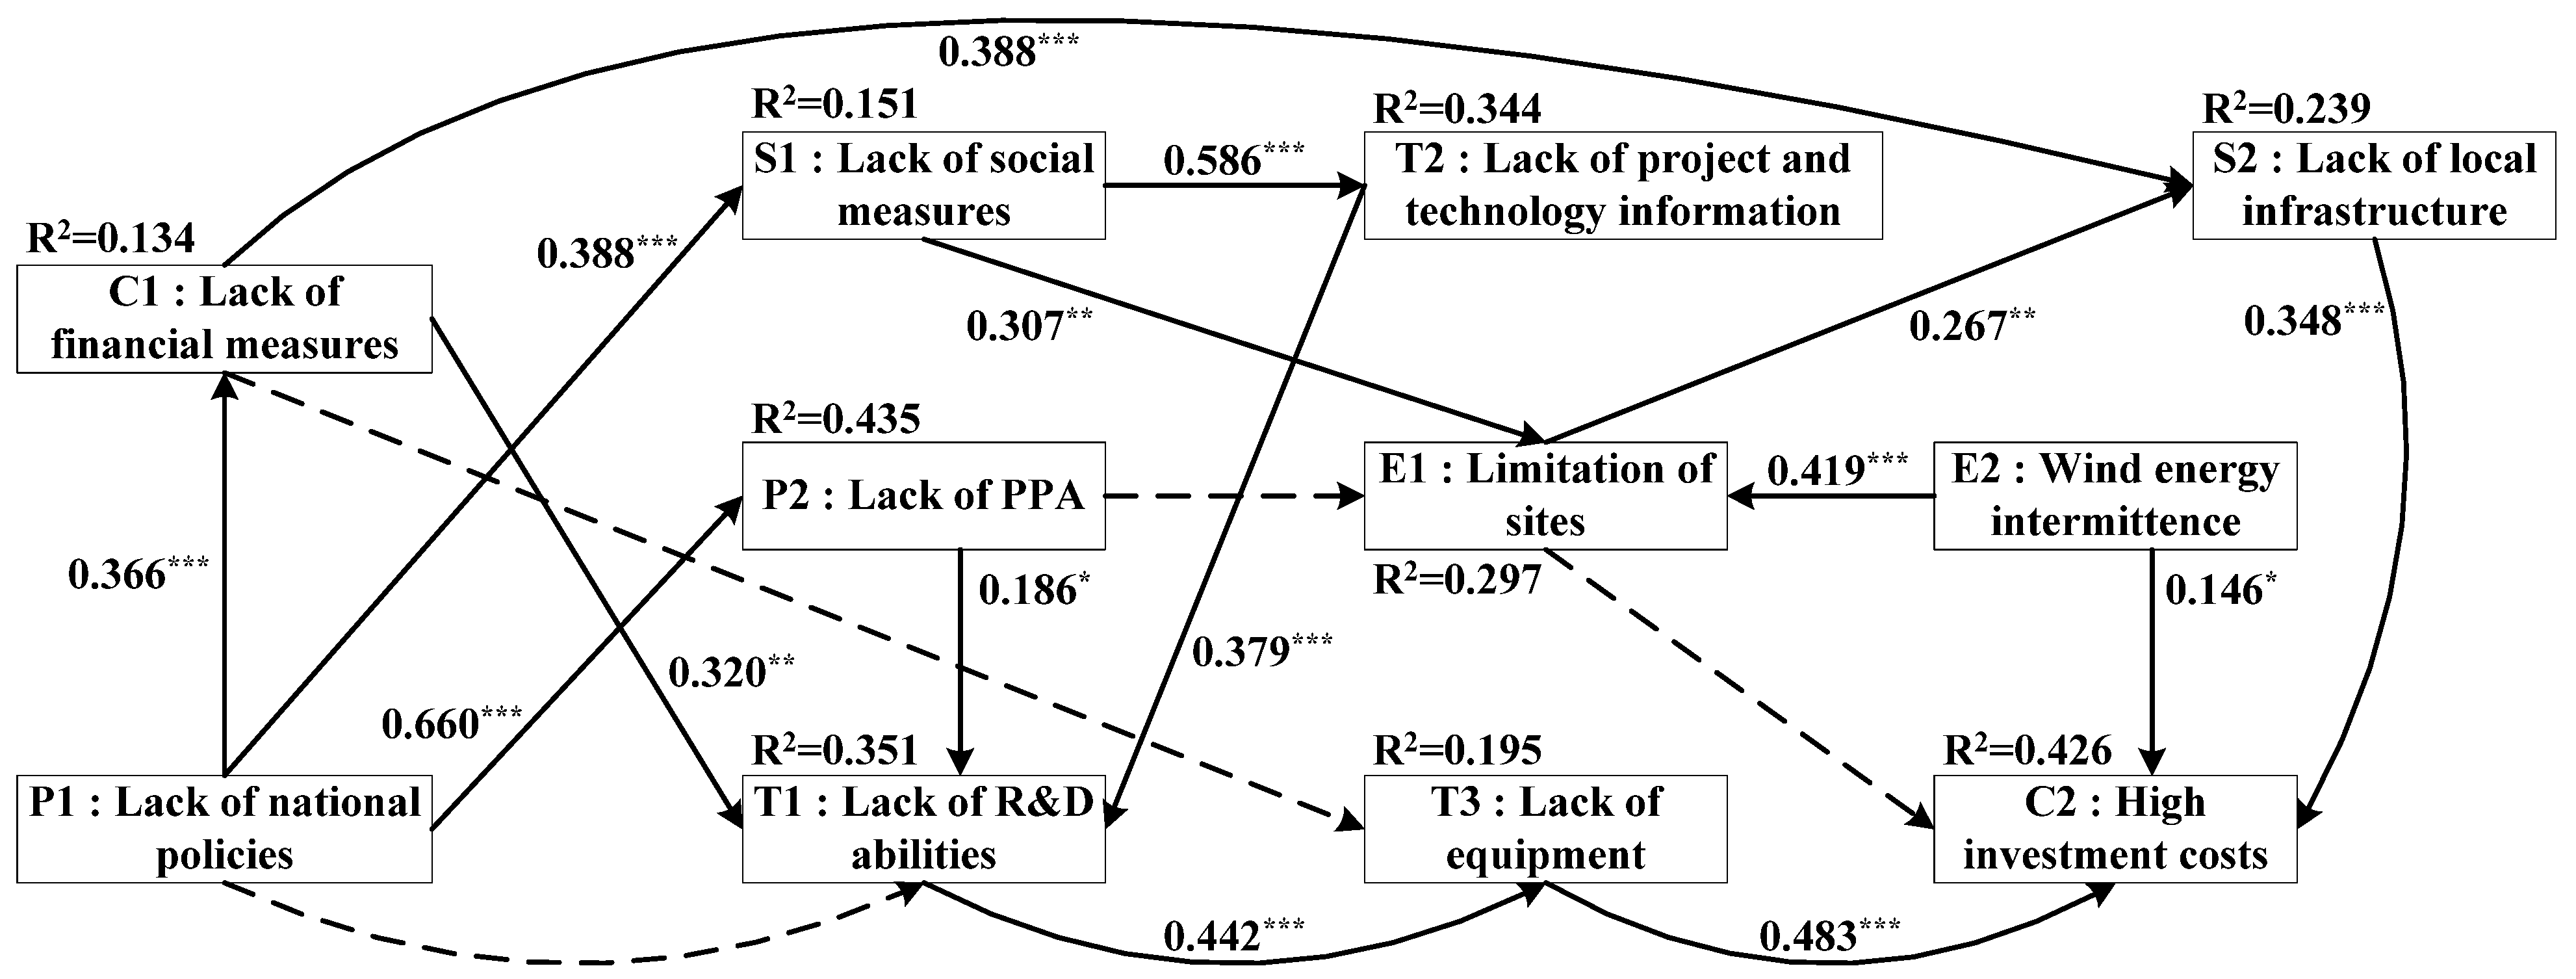
| Model II-Final model | 54.332 | 39 | 0.0523 | 0.967 | 0.954 | 0.052 | 0.069 |

| Effects from A to B | Mplus | SmartPLS | ||||
|---|---|---|---|---|---|---|
| Effects | Effects | |||||
| Direct | Sum of indirect | Total | Direct | Sum of indirect | Total | |
| P1 → C1 | 0.366*** | N.A. | 0.366*** | 0.366*** | N.A. | 0.366*** |
| P1 → P2 | 0.660*** | N.A. | 0.660*** | 0.660*** | N.A. | 0.660*** |
| P1 → S1 | 0.388*** | N.A. | 0.388*** | 0.388*** | N.A. | 0.388*** |
| P1 → C2 | N.A. | 0.104*** | 0.104*** | N.A. | 0.129*** | 0.129*** |
| P2 → T1 | 0.186* | N.A. | 0.186* | 0.180* | N.A. | 0.180* |
| P2 → C2 | N.A. | 0.040* | 0.040* | N.A. | 0.040* | 0.040* |
| C1 → T1 | 0.320** | N.A. | 0.320** | 0.310** | N.A. | 0.310** |
| C1 → S2 | 0.388*** | N.A. | 0.388*** | 0.389*** | N.A. | 0.389*** |
| C1 → C2 | N.A. | 0.203*** | 0.203*** | N.A. | 0.202*** | 0.202*** |
| S1 → T2 | 0.586*** | N.A. | 0.586*** | 0.586*** | N.A. | 0.586*** |
| S1 → E1 | 0.307** | N.A. | 0.307** | 0.302** | N.A. | 0.302** |
| S1 → C2 | N.A. | 0.076*** | 0.076*** | N.A. | 0.075** | 0.075** |
| S2 → C2 | 0.348*** | N.A. | 0.348*** | 0.344*** | N.A. | 0.344*** |
| T1 → T3 | 0.442*** | N.A. | 0.442*** | 0.454*** | N.A. | 0.454*** |
| T1 → C2 | N.A. | 0.214*** | 0.214*** | N.A. | 0.220*** | 0.220*** |
| T2 → T1 | 0.379*** | N.A. | 0.379*** | 0.366*** | N.A. | 0.366*** |
| T2 → C2 | N.A. | 0.081*** | 0.081*** | N.A. | 0.080** | 0.080** |
| T3 → C2 | 0.483*** | N.A. | 0.483*** | 0.483*** | N.A. | 0.483*** |
| E1 → S2 | 0.267** | N.A. | 0.267** | 0.273** | N.A. | 0.273** |
| E1 → C2 | ─ | 0.093** | 0.093** | ─ | 0.094** | 0.094** |
| E2 → E1 | 0.419*** | N.A. | 0.419*** | 0.412*** | N.A. | 0.412*** |
| E2 → C2 | 0.146* | 0.039** | 0.185* | 0.145* | 0.038** | 0.183* |
3. Results and Discussion
3.1. The Causality between Barriers
3.2. The Inferential Effect of Obstacles
4. Conclusions and Limitations
Acknowledgments
Conflicts of Interest
References
- Kumar, A.; Kumar, K.; Kaushik, N.; Sharma, S.; Mishra, S. Renewable energy in India: Current status and future potentials. Renew. Sustain. Energy Rev. 2010, 14, 2434–2442. [Google Scholar]
- Masui, T.; Hanaoka, T.; Hikita, S.; Kainuma, M. Assessment of CO2 reductions and economic impacts considering energy-saving investments. Energy J. 2006, 1, 175–190. [Google Scholar]
- Gessinger, G. Lower CO2 emissions through better technology. Energy Convers. Manag. 1997, 38, S25–S30. [Google Scholar]
- Kang, H.Y.; Hung, M.C.; Pearn, W.L.; Lee, A.H.I.; Kang, M.S. An integrated multi-criteria decision making model for evaluating wind farm performance. Energies 2011, 4, 2002–2026. [Google Scholar]
- Chien, T.; Hu, J.L. Renewable energy: An efficient mechanism to improve GDP. Energy Policy 2008, 36, 3045–3052. [Google Scholar]
- Wee, H.M.; Yang, W.H.; Chou, C.W.; Padilan, M.V. Renewable energy supply chains, performance, application barriers, and strategies for further development. Renew. Sustain. Energy Rev. 2012, 16, 5451–5465. [Google Scholar]
- Schenk, N.J.; Moll, H.C.; Potting, J.; Benders, R.M.J. Wind energy, electricity, and hydrogen in the Netherlands. Energy 2007, 32, 1960–1971. [Google Scholar]
- Surendra, K.C.; Khanal, S.K.; Shrestha, P.; Lamsal, B. Current status of renewable energy in Nepal: Opportunities and challenges. Renew. Sustain. Energy Rev. 2011, 15, 4107–4117. [Google Scholar]
- Dehghan, A.A. Status and potentials of renewable energies in Yazd Province-Iran. Renew. Sustain. Energy Rev. 2011, 15, 1491–1496. [Google Scholar]
- Praene, J.P.; David, M.; Sinama, F.; Morau, D.; Marc, O. Renewable energy: Progressing towards a net zero energy island, the case of Reunion Island. Renew. Sustain. Energy Rev. 2012, 16, 426–442. [Google Scholar]
- Renewable Energy Policy Network for the 21st Century (REN21) Webpage. Renewables 2012 Global Status Report. Available online: http://www.ren21.net/gsr (accessed on 6 January 2013).
- Han, J.; Mol, A.P.J.; Lu, Y.; Zhang, L. Onshore wind power development in China: Challenges behind a successful story. Energy Policy 2009, 37, 2941–2951. [Google Scholar]
- Chiu, C.L.; Chang, T.H. What proportion of renewable energy supplies is needed to initially mitigate CO2 emissions in OECD member countries? Renew. Sustain. Energy Rev. 2009, 13, 1669–1674. [Google Scholar]
- Wang, Q.; Chen, Y. Status and outlook of China’s free-carbon electricity. Renew. Sustain. Energy Rev. 2010, 14, 1014–1025. [Google Scholar]
- Tuğrul Oğulata, R. Energy sector and wind energy potential in Turkey. Renew. Sustain. Energy Rev. 2003, 7, 469–484. [Google Scholar]
- Luickx, P.J.; Delarue, E.D.; D’haeseleer, W.D. Impact of large amounts of wind power on the operation of an electricity generation system: Belgian case study. Renew. Sustain. Energy Rev. 2010, 14, 2019–2028. [Google Scholar]
- Ling, Y.; Cai, X. Exploitation and utilization of the wind power and its perspective in China. Renew. Sustain. Energy Rev. 2012, 16, 2111–2117. [Google Scholar]
- Lenzen, M. Current state of development of electricity-generating technologies: A literature review. Energies 2010, 3, 462–591. [Google Scholar]
- Kabouris, J.; Kanellos, F.D. Impacts of large scale wind penetration on energy supply industry. Energies 2009, 2, 1031–1041. [Google Scholar]
- Zhai, Q.; Cao, H.; Zhao, X.; Yuan, C. Cost benefit analysis of using clean energy supplies to reduce greenhouse gas emissions of global automotive manufacturing. Energies 2011, 4, 1478–1494. [Google Scholar]
- Shafiullah, G.M.; Oo, A.M.T.; Shawkat Ali, A.B.M.; Wolfs, P. Potential challenges of integrating large-scale wind energy into the power grid—A review. Renew. Sustain. Energy Rev. 2013, 20, 306–321. [Google Scholar]
- Bhutto, A.W.; Bazmi, A.A.; Zahedi, G. Greener energy: Issues and challenges for Pakistan-wind power prospective. Renew. Sustain. Energy Rev. 2013, 20, 519–538. [Google Scholar]
- Javadi, F.S.; Rismanchi, B.; Sarraf, M.; Afshar, O.; Saidur, R.; Ping, H.W.; Rahim, N.A. Global policy of rural electrification. Renew. Sustain. Energy Rev. 2013, 19, 402–416. [Google Scholar]
- Loring, J.M. Wind energy planning in England, Wales and Denmark: Factors influencing project success. Energy Policy 2007, 35, 2648–2660. [Google Scholar]
- Morthorst, P.E.; Chandler, H. The cost of wind power. The facts within the fiction. Renew. Energy World 2004, 7, 126–137. [Google Scholar]
- Nguyen, K.Q. Wind energy in Vietnam: Resource assessment, development status and future implications. Energy Policy 2007, 35, 1405–1413. [Google Scholar]
- Sovacool, B.K. The intermittency of wind, solar, and renewable electricity generators: Technical barrier or rhetorical excuse? Util. Policy 2009, 17, 288–296. [Google Scholar]
- Xu, J.; He, D.; Zhao, X. Status and prospects of Chinese wind energy. Energy 2010, 35, 4439–4444. [Google Scholar]
- Nalan, Ç.B.; Murat, Ö.; Nuri, Ö. Renewable energy market conditions and barriers in Turkey. Renew. Sustain. Energy Rev. 2009, 13, 1428–1436. [Google Scholar]
- International Energy Agency (IEA). Report: Towards a Sustainable Energy Future; IEA: Paris, France, 2008. [Google Scholar]
- Del Río, P. Analysing future trends of renewable electricity in the EU in a low-carbon context. Renew. Sustain. Energy Rev. 2011, 15, 2520–2533. [Google Scholar]
- Sathaye, J.; Lucon, O.; Rahman, A.; Christensen, J.; Denton, F.; Fujino, J.; Heath, G.; Mirza, M.; Rudnick, H.; Schlaepfer, A.; et al. IPCC Special Report on Renewable Energy Sources and Climate Change Mitigation; Cambridge University Press: Cambridge, UK, 2011. [Google Scholar]
- Agterbosch, S.; Glasbergen, P.; Vermeulen, W.J.V. Social barriers in wind power implementation in The Netherlands: Perceptions of wind power entrepreneurs and local civil servants of institutional and social conditions in realizing wind power projects. Renew. Sustain. Energy Rev. 2007, 11, 1025–1055. [Google Scholar]
- Richards, G.; Noble, B.; Belcher, K. Barriers to renewable energy development: A case study of large-scale wind energy in Saskatchewan, Canada. Energy Policy 2012, 42, 691–698. [Google Scholar]
- Sovacool, B.K. The cultural barriers to renewable energy and energy efficiency in the United States. Technol. Soc. 2009, 31, 365–373. [Google Scholar]
- Krupa, J. Identifying barriers to aboriginal renewable energy deployment in Canada. Energy Policy 2012, 42, 710–714. [Google Scholar]
- Liu, W.; Lund, H.; Mathiesen, B.V. Large-scale integration of wind power into the existing Chinese energy system. Energy 2011, 36, 4753–4760. [Google Scholar]
- Li, X.; Hubacek, K.; Siu, Y.L. Wind power in China—Dream or reality? Energy 2012, 37, 51–60. [Google Scholar]
- Ming, Z.; Song, X.; Mingjuan, M.; Xiaoli, Z. New energy bases and sustainable development in china: A review. Renew. Sustain. Energy Rev. 2013, 20, 169–185. [Google Scholar]
- Wang, Z.; Qin, H.; Lewis, J.I. China’s wind power industry: Policy support, technological achievements, and emerging challenges. Energy Policy 2012, 51, 80–88. [Google Scholar]
- Zhang, S.; Qi, J. Small wind power in China: Current status and future potentials. Renew. Sustain. Energy Rev. 2011, 15, 2457–2460. [Google Scholar]
- Liao, C.; Jochem, E.; Zhang, Y.; Farid, N.R. Wind power development and policies in China. Renew. Energy 2010, 35, 1879–1886. [Google Scholar]
- Mirza, U.K.; Ahmad, N.; Majeed, T.; Harijan, K. Wind energy development in Pakistan. Renew. Sustain. Energy Rev. 2007, 11, 2179–2190. [Google Scholar]
- Reddy, S.; Painuly, J.P. Diffusion of renewable energy technologies—barriers and stakeholders’ perspectives. Renew. Energy 2004, 29, 1431–1447. [Google Scholar]
- Mirza, U.K.; Ahmad, N.; Harijan, K.; Majeed, T. Identifying and addressing barriers to renewable energy development in Pakistan. Renew. Sustain. Energy Rev. 2009, 13, 927–931. [Google Scholar]
- Al-Badi, A.H.; Malik, A.; Gastli, A. Assessment of renewable energy resources potential in Oman and identification of barrier to their significant utilization. Renew. Sustain. Energy Rev. 2009, 13, 2734–2739. [Google Scholar]
- Sahir, M.H.; Qureshi, A.H. Assessment of new and renewable energy resources potential and identification of barriers to their significant utilization in Pakistan. Renew. Sustain. Energy Rev. 2008, 12, 290–298. [Google Scholar]
- Ghobadian, B.; Najafi, G.; Rahimi, H.; Yusaf, T.F. Future of renewable energies in Iran. Renew. Sustain. Energy Rev. 2009, 13, 689–695. [Google Scholar]
- Al-Badi, A.H.; Malik, A.; Gastli, A. Sustainable energy usage in Oman—Opportunities and barriers. Renew. Sustain. Energy Rev. 2011, 15, 3780–3788. [Google Scholar]
- Alam Hossain Mondal, M.; Kamp, L.M.; Pachova, N.I. Drivers, barriers, and strategies for implementation of renewable energy technologies in rural areas in Bangladesh—An innovation system analysis. Energy Policy 2010, 38, 4626–4634. [Google Scholar]
- Wijayatunga, P.D.C.; Siriwardena, K.; Fernando, W.J.L.S.; Shrestha, R.M.; Attalage, R.A. Strategies to overcome barriers for cleaner generation technologies in small developing power systems: Sri Lanka case study. Energy Convers. Manag. 2006, 47, 1179–1191. [Google Scholar]
- Valentine, S.V. A STEP toward understanding wind power development policy barriers in advanced economies. Renew. Sustain. Energy Rev. 2010, 14, 2796–2807. [Google Scholar]
- Klessmann, C.; Held, A.; Rathmann, M.; Ragwitz, M. Status and perspectives of renewable energy policy and deployment in the European Union—What is needed to reach the 2020 targets? Energy Policy 2011, 39, 7637–7657. [Google Scholar]
- Wu, M.L. Structural Equation Modeling—The Operation and Technology of AMOS; Chongqing University Press: Chongqing, China, 2009; pp. 1–7. [Google Scholar]
- Chiou, H.J. The Principle, Technology and Application of Structural Equation Modeling; Yen Yen Book Gallery: Taipei, Taiwan, 2003; pp. 1–25. [Google Scholar]
- Meyer, N.I. European schemes for promoting renewables in liberalized markets. Energy Policy 2003, 31, 665–676. [Google Scholar]
- Meyer, N.I.; Koefoed, A.L. Danish energy reform: Policy implications for renewables. Energy Policy 2003, 31, 597–607. [Google Scholar]
- Menanteau, P.; Finon, D.; Lamy, M.L. Prices versus quantities: Choosing policies for promoting the development of renewable energy. Energy Policy 2003, 31, 799–812. [Google Scholar]
- Oikonomou, E.K.; Kilias, V.; Goumas, A.; Rigopoulos, A.; Karakatsani, E.; Damasiotis, M.; Papastefanakis, D.; Marini, N. Renewable energy sources (RES) projects and their barriers on a regional scale: The case study of wind parks in the Dodecanese islands, Greece. Energy Policy 2009, 37, 4874–4883. [Google Scholar]
- Bryan, A.; Schmiege, S.J.; Broaddus, M.R. Mediational analysis in HIV/AIDS research: Estimating multivariate path analytic models in a structural equation modeling framework. AIDS Behav. 2007, 11, 365–383. [Google Scholar]
- Baron, R.M.; Kenny, D.A. The Moderator-mediator variable distinction in social psychological research: Conceptual, strategic, and statistical considerations. J. Personal. Soc. Psychol. 1986, 51, 1173–1182. [Google Scholar]
- Franche, R.L.; Williams, A.; Ibrahim, S.; Grace, S.L.; Mustard, C.; Minore, B.; Stewart, D.E. Path analysis of work conditions and work—family spillover as modifiable workplace factors associated with depressive symptomatology. Stress Health 2006, 22, 91–103. [Google Scholar]
- Honjo, K.; Tsutsumi, A.; Kawachi, I.; Kawakami, N. What accounts for the relationship between social class and smoking cessation? Results of a path analysis. Soc. Sci. Med. 2006, 62, 317–328. [Google Scholar]
- Holbert, R.L.; Stephenson, M.T. The importance of indirect effects in media effects research: Testing for mediation in structural equation modeling. J. Broadcast. Electron. Media 2003, 47, 556–572. [Google Scholar]
- Carson, N.J.; Rodriguez, D.; Audrain-McGovern, J. Investigation of mechanisms linking media exposure to smoking in high school students. Prev. Med. 2005, 41, 511–520. [Google Scholar]
- Kelly, S. Do homes that are more energy efficient consume less energy? A structural equation model of the English residential sector. Energy 2011, 36, 5610–5620. [Google Scholar]
- Clean Development Mechanism (CDM). Tool for the Demonstration and Assessment of Additionality; Version 7.0.0; UNFCCC: Bonn, Germany, 2012; Available online: https://cdm.unfccc.int/methodologies/PAmethodologies/tools (accessed on 6 January 2013).
- Muthén, L.K.; Muthén, B.O. Mplus User’s Guide, 7th ed.; Muthén & Muthén: Los Angeles, CA, USA, 2012; Available online: http://www.statmodel.com/ugexcerpts.shtml (accessed on 6 January 2013).
- Bentler, P.M. Comparative fit indexes in structural models. Psychol. Bull. 1990, 107, 238–246. [Google Scholar]
- Hu, L.T.; Bentler, P.M. Fit indices in covariance structure modeling: Sensitivity to under parameterized model misspecification. Psychol. Methods 1998, 3, 424–453. [Google Scholar]
- Hu, L.T.; Bentler, P.M. Cutoff criteria for fit indexes in covariance structure analysis: Conventional criteria versus. Struct. Equ. Model. 1999, 6, 1–55. [Google Scholar]
- Chin, W.W. The partial least squares approach for structural equation modeling. Mod. Methods Bus. Res. 1998, 22, 295–336. [Google Scholar]
- Chin, W.W. Issues and opinion on structural equation modeling. MIS Quarterly 1998, 22, 7–16. [Google Scholar]
- Chin, W.W.; Newsted, P.R. Structural equation modeling analysis with small samples using partial least squares. Stat. Strateg. Small Sample Res. 1999, 1, 307–341. [Google Scholar]
- Ringle, C.M.; Wende, S.; Will, S. SmartPLS, version 2.0.M3 Beta; SmartPLS: Hamburg, Germany, 2005; Available online: http://www.smartpls.de (accessed on 6 January 2013).
- Chen, F.; Lu, S.M.; Tseng, K.T.; Lee, S.C.; Wang, E. Assessment of renewable energy reserves in Taiwan. Renew. Sustain. Energy Rev. 2010, 14, 2511–2528. [Google Scholar]
© 2013 by the authors; licensee MDPI, Basel, Switzerland. This article is an open access article distributed under the terms and conditions of the Creative Commons Attribution license (http://creativecommons.org/licenses/by/3.0/).
Share and Cite
Huang, S.-C.; Lo, S.-L.; Lin, Y.-C. To Re-Explore the Causality between Barriers to Renewable Energy Development: A Case Study of Wind Energy. Energies 2013, 6, 4465-4488. https://doi.org/10.3390/en6094465
Huang S-C, Lo S-L, Lin Y-C. To Re-Explore the Causality between Barriers to Renewable Energy Development: A Case Study of Wind Energy. Energies. 2013; 6(9):4465-4488. https://doi.org/10.3390/en6094465
Chicago/Turabian StyleHuang, Shih-Chieh, Shang-Lien Lo, and Yen-Ching Lin. 2013. "To Re-Explore the Causality between Barriers to Renewable Energy Development: A Case Study of Wind Energy" Energies 6, no. 9: 4465-4488. https://doi.org/10.3390/en6094465