Product Yields and Characteristics of Corncob Waste under Various Torrefaction Atmospheres


Abstract
: Biomass is a promising energy source due to its abundant, carbon-fixing, and carbon-neutral properties. Torrefaction can be employed to improve the properties of biomass in an oxygen-free or nitrogen atmosphere. This study investigates the product yields and the solid product characteristics from corncob waste torrefaction at the temperatures of 250 °C and 300 °C for 1 h. Nitrogen, carbon dioxide, and a gas mixture of air and carbon dioxide are employed as the carrier gases. The solid product characteristics approach those of coal at the higher temperature, regardless of what the carrier gases are. The fixed carbon, higher heating value, and solid and energy yields using carbon dioxide as a carrier gas at 300 °C are close to those using nitrogen. The product safety and storage properties before and after torrefaction are revealed by the measurements of ignition temperature and hygroscopicity. A higher torrefaction temperature leads to a higher ignition temperature of treated biomass, except using the mixture of air and carbon dioxide as the carrier gas. Carbon dioxide is a better carrier gas than nitrogen for biomass torrefaction, from the storage and transportation points of view.1. Introduction
With increasing global energy demand and deteriorating atmospheric greenhouse effects, biomass has become a promising energy source due to its abundance, carbon-fixing, and carbon-neutral properties [1–3]. However, the applications of raw biomass in industry are limited because of its high hygroscopicity and moisture content, as well as its low volume and energy density [4–7]. Torrefaction is a process to keep biomass in an oxygen-free or nitrogen atmosphere at temperatures between 200 °C and 300 °C for several minutes to several hours. This pretreatment process has received a great deal of attention in recent years [8–12]. The physical and chemical characteristics of biomass can be improved from torrefaction and the torrefied biomass is more suitable than the raw biomass as an alternative fuel to fossil fuels [13–16]. However, torrefaction imposes additional costs because of nitrogen separation from air to maintain the biomass in an oxygen-free environment.
On the other hand, the temperatures of end-of-pipe emissions from general combustion processes can be as high as 350 °C. If flue gases in these processes are recycled as carrier gases for biomass torrefaction, waste heat can be reused, thereby significantly reducing the operating cost. It was reported that the major components from the emissions of boilers are nitrogen plus argon, carbon dioxide, water, sulfur dioxide, oxygen and ash, at the percentages of approximately 63.66 vol%, 22.45 vol%, 6.92 vol%, 0.27 vol%, 1.74 vol% and 4.97 vol%, respectively [17]. Recently, some attempts have been performed using different carrier gases to torrefy biomass. For example, Lu et al. [18] torrefied eucalyptus for 1 h using air as a carrier gas. Uemura et al. [19] and Chen et al. [20,21] investigated biomass torrefaction in the presence of oxygen at various concentrations. Eseltine et al. [22] performed biomass torrefaction in nitrogen and carbon dioxide atmospheres by means of the thermogravimetric analysis. Sarvaramini et al. [23] used the flue gas from a chemical looping combustion (CLC) system, mostly non-diluted carbon dioxide and steam, as the carrier gas for biomass torrefaction.
In reviewing the literatures concerning torrefaction, most of the studies focused on the applications of torrefied solid products rather than their safety and storage characteristics. In general, biomass is more combustible than coal due to its high volatile matter (VM). The ignition temperature of a solid fuel is a key indicator for combustibility when safety management is concerned. On the other hand, the hygroscopic nature of raw biomass will lead to biological degradation, and the material will decay faster if its moisture content increases during storage. Accordingly, it is essential to evaluate the hygroscopicity and reactivity of biomass when it is employed in industry, from the viewpoints of safety and storage.
As an alternative energy source, biomass has also raised the controversial issue of depleting food crop harvests as well as possibly natural forests, which can be solved by collecting farm wastes. A considerable amount of corncob wastes are produced annually because corn is one of the most important crops worldwide. However, only very few studies have been carried out on the handling or reuse of corncob wastes. In this study, the torrefaction of corncob waste is explored, while nitrogen, carbon dioxide, and the gas mixture of air and carbon dioxide (i.e., air + CO2) are individually adopted as the carrier gases to perform the pretreatment at the temperatures of 250 °C and 300 °C. Nitrogen is the conventional carrier gas used for biomass torrefaction. In addition to nitrogen, carbon dioxide and the gas mixture of air and carbon dioxide are also employed to pretreat corncob waste to evaluate the potential of using the greenhouse gas and the flue gas as the carrier gases. The safety and storage characteristics of biomass before and after torrefaction are also revealed from the analyses of ignition temperature and hygroscopicity.
2. Experimental Methods
2.1. Raw Material and Torrefaction Procedure
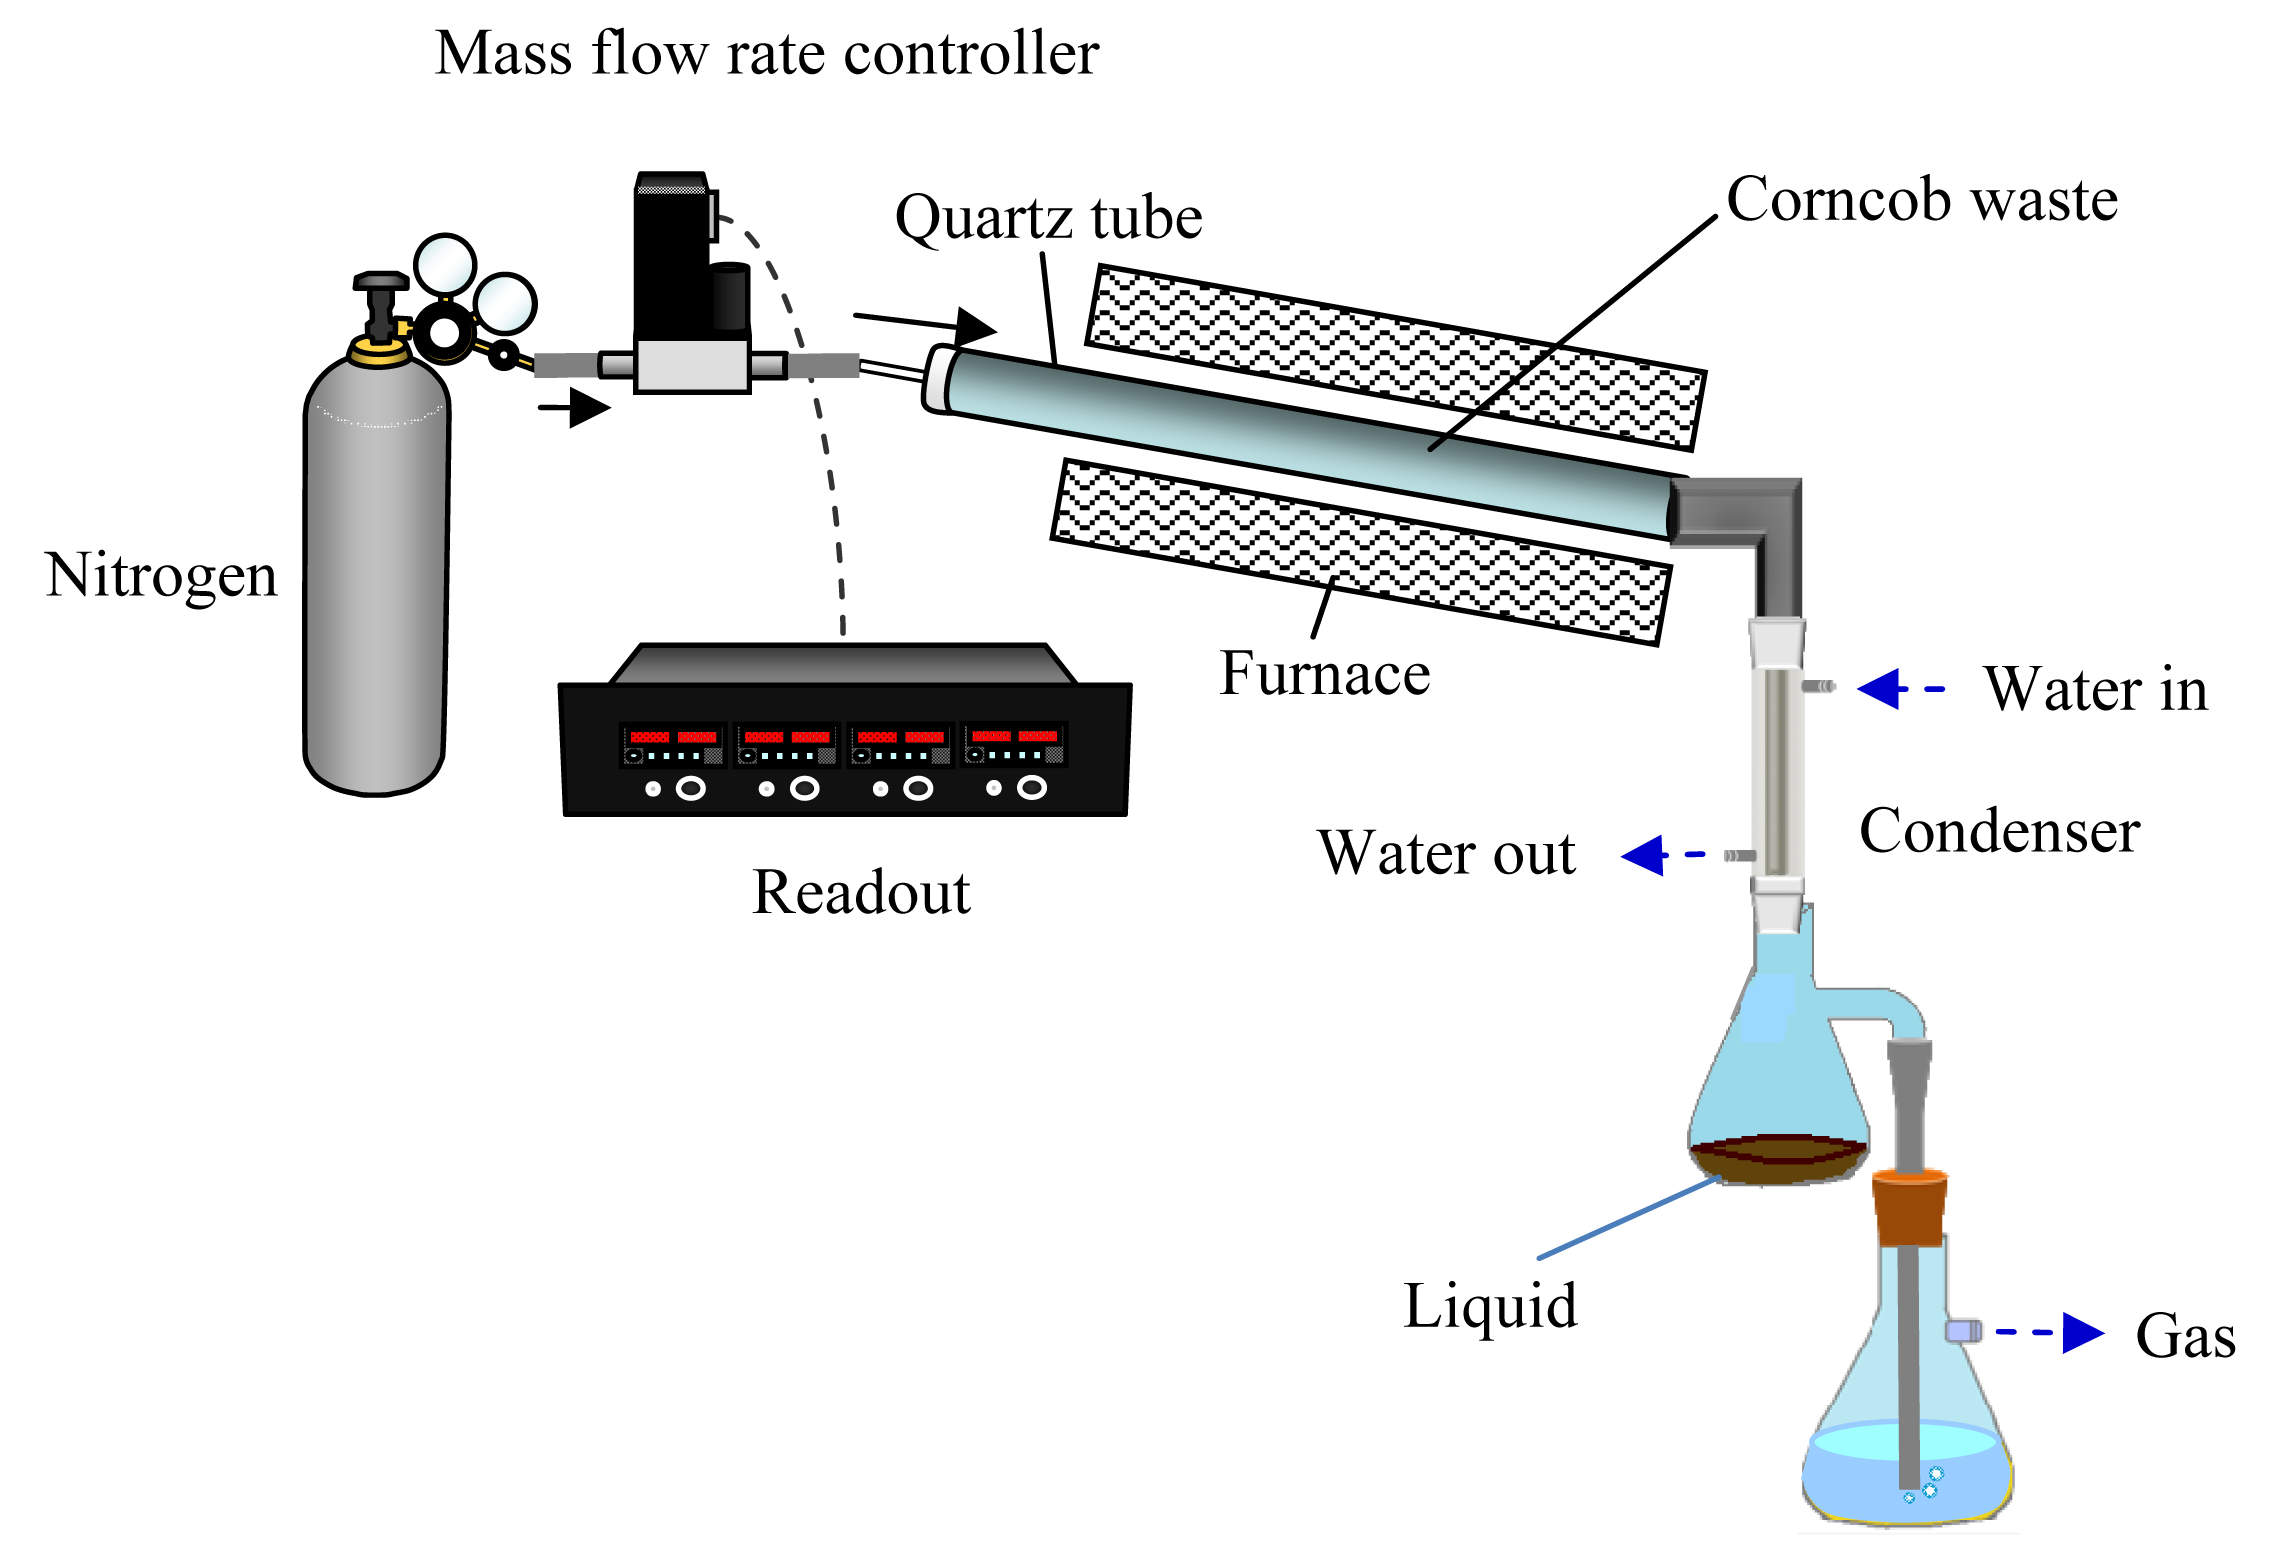
Corncob waste samples from southern Taiwan were adopted as the raw biomass. The samples were cut into pieces with 3 ± 0.5 mm in diameter and 10 ± 0.5 mm in length to equalize their sizes. All raw materials were dehydrated in an oven at 105 °C for 24 h to minimize the interference of surface water. The experimental system is shown in Figure 1 which consisted of a feeding unit, a reaction unit, a condenser, and a gas cleaning unit. The reaction unit included a quartz tube and an electric furnace. The carrier gas was first blown into the reactor for 10 min before torrefaction to ensure their complete filling in the reactor. A sample of 20 g (±5%) was placed in the tube which was situated in the furnace after the temperature was raised to 250 °C or 300 °C. Nitrogen, carbon dioxide, or the gas mixture of air and carbon dioxide (1:1) then flew through the tube individually at a flow rate of 100 mL min−1 as a carrier gas. All the torrefaction processes lasted for 1 h at the given temperatures. Soon after the gas mixture left the reactor, it was condensed to collect the condensable gas in the collection unit where the cooling water at 10 °C flew through the condenser at a flow rate of 1000 mL min−1. The non-condensable gas products were rinsed by water before emitting into the atmosphere. The solid and liquid products were weighed, and the weights of gas products were obtained by difference. All the experiments were conducted at least twice and their relative errors were smaller than ±3%.
2.2. Analytical Methods
The contents of cellulose, hemicellulose, and lignin of untreated corncob waste were measured by fiber analysis. The properties of raw and torrefied solid samples were tested by proximate analysis, elemental analysis, and calorific analysis (i.e., higher heat value, HHV). The density analysis, particle size analysis, hygroscopicity test, and ignition temperature measurement were also carried out.
The fiber analysis method can be found elsewhere [24]. The proximate analysis followed the standard method of ASTM E870-82. The elemental and calorific analyses were performed by an elemental analyzer (Vario EL III, Elementar Analysensysteme GmbH, Germany) and a bomb calorimeter (C5000 Basic, IKA, Staufen, Switzerland), respectively. To obtain the volumes of the tested samples, a fixed volume of water at room temperature was first put into a bucket. Then, the samples were totally immersed in the water. The rise of the water level was used to calculate the volumes of the samples. Accordingly, the densities of the samples were obtained from the measured volumes and weights. The particle size analysis followed the method conducted by Chen et al. [24].
In the past studies, the hydrophobic properties of torrefied product were examined using the immersion test [25,26] or the equilibrium moisture content (EMC) method [27,28]. In the immersion test, raw and torrefied biomass was submerged in water for a fixed duration. EMC applied static desiccator technique using saturated salt solution to attain required humidity. In order to evaluate the storage characteristics of biomass in a hot and humid environment in Taiwan, hygroscopicity tests were conducted. The average temperature and relative humidity of Taiwan between 1971 and 2000, were 29.55 °C and 80.79%, and used as the basis of the hygroscopicity test. Unlike the immersion test or EMC, a humidity simulator was constructed. About 1 g of the sample was placed in the humidity simulator at the conditions of 30 ± 2 °C and 80% ± 3% humidity. In the simulator, a fog generator with the supersonic frequency of 1.63 MHz and the fog producing rate of 24 mL min−1 was installed. Two different exposure periods of 1 h and 5 h, namely, 1-h and 5-h hygroscopicity tests, were carried out.
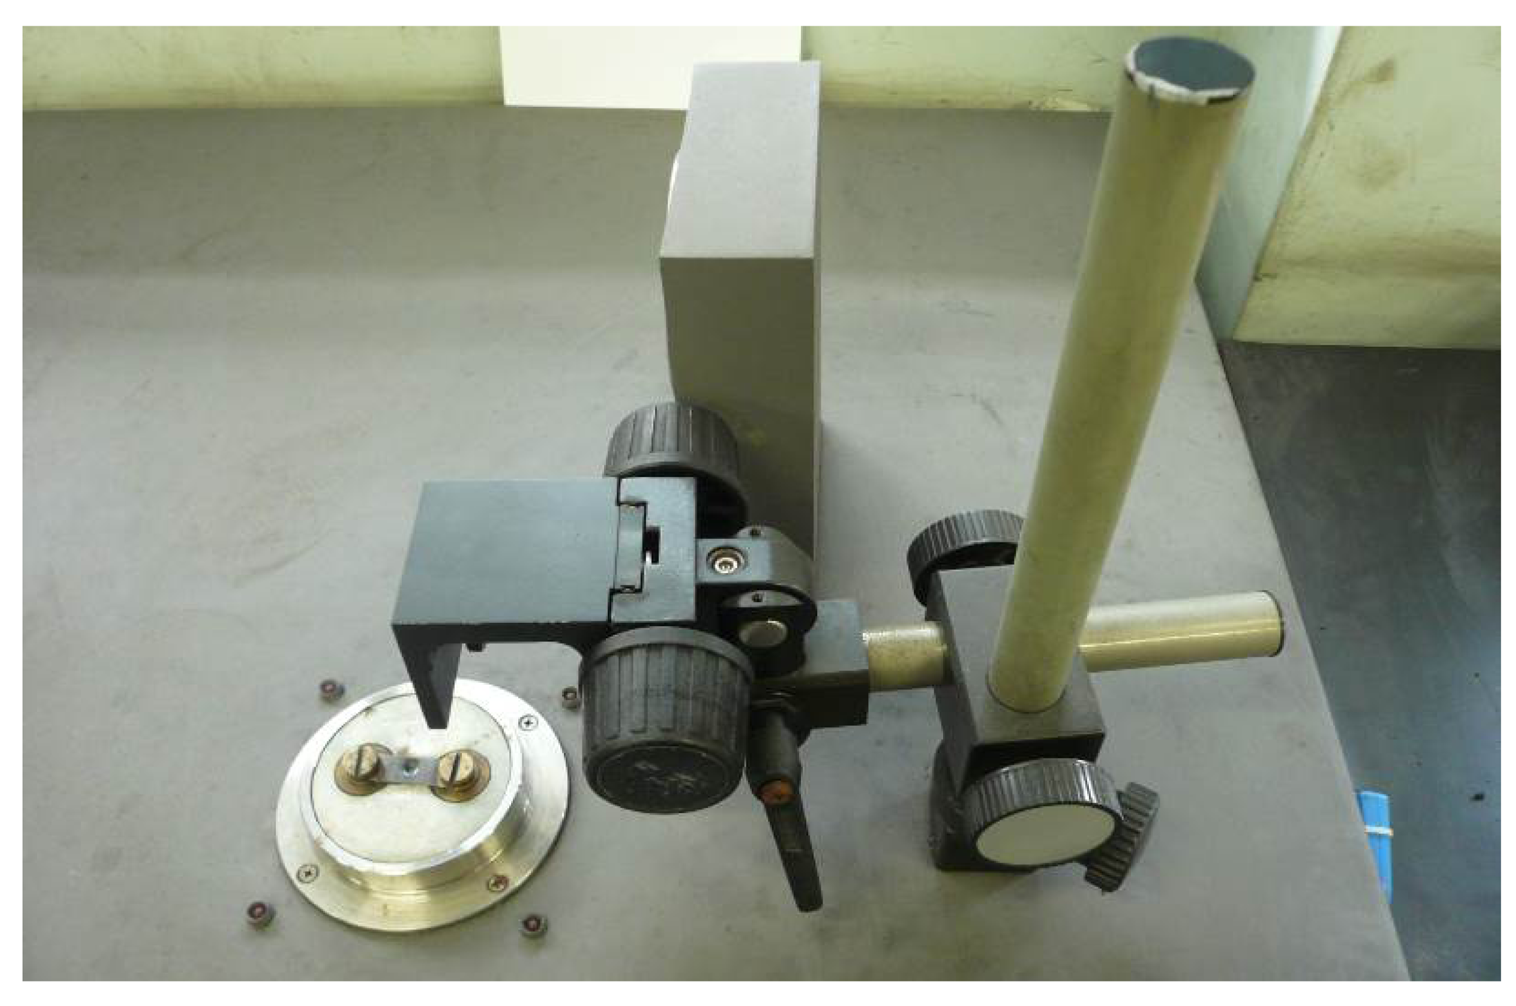
Sodium nitrous was used as the ignition-booster for the auto-ignition test and mixed with the biomass sample at a ratio of 0.75:1 to the total amount of 4 mg. The mixture was placed in an ignition analyzer, as shown in Figure 2, at a heating rate of around 96.6 °C min−1 under the open atmosphere. The temperature was recorded when the ignition was observed, and the average temperature of nine tests was defined as the ignition point of the sample.
3. Results and Discussion
The basic properties of raw corncob waste, such as fiber analysis, elemental analysis, proximate analysis, and calorific analysis, are shown in Table 1. Cellulose is the major constituent in the biomass at a percentage of 69.2 wt%, while hemicellulose and lignin are 22.8 wt% and 8.0 wt%, respectively. According to the proximate analysis, moisture, VM, fixed carbon (FC) and ash content in the raw corncob waste are 14.4 wt%, 68.5 wt%, 15.9 wt% and 1.5 wt%, respectively. The characteristics of torrefied corncob waste are revealed in the following.
3.1. Yield Distributions of Corncob Waste Torrefaction
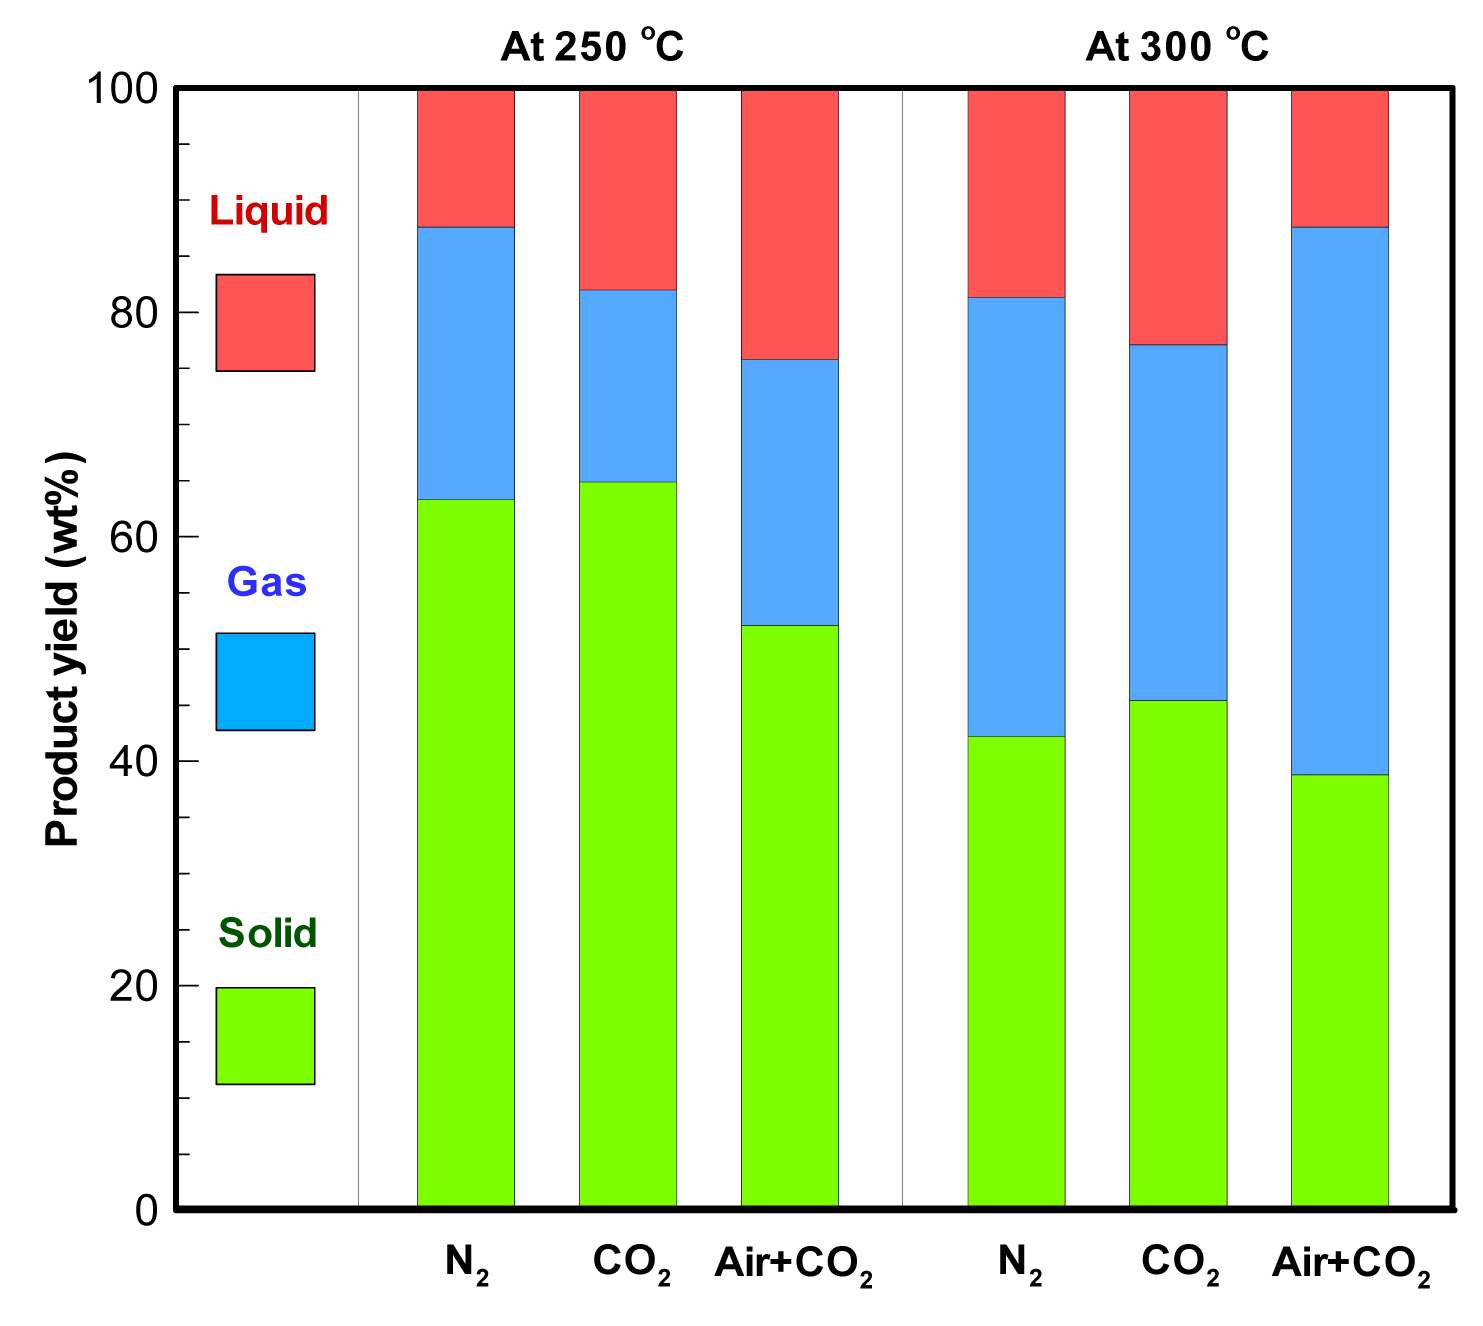
The yield distributions of solid, liquid, and gas products from corncob waste torrefaction in the three atmospheres are shown in Figure 3.
When the torrefaction temperature is 250 °C, the solid yield is higher than 50 wt%, regardless of what the carrier gases are. For example, when air + CO2 is used as the carrier gas and the torrefaction temperature is 250 °C, the solid yield is 38.8 wt%. Alternatively, the solid yield is lower than 46 wt% when the temperature is raised to 300 °C, and the solid yield is in the range of 38.8 wt% (by air + CO2) and 45.4 wt% (by CO2). These evidences indicate that the influence of the torrefaction temperature on the solid yield is greater than that of the carrier gas. The thermal decomposition temperatures of hemicellulose and cellulose are in the ranges of 220–315 °C and 315–400 °C [29–31], and they are 22.8 wt% and 69.2 wt% in raw corncob waste. Meanwhile, its VM is 68.5 wt%. A pronounced weight loss of the sample is thus observed at 300 °C. These results were confirmed by the studies of Rousset et al. [32] and Uemura et al. [19].
At a given torrefaction temperature, the solid yield for the biomass in N2 or CO2 is higher than in air + CO2. The maximum difference in solid yield is between CO2 and air + CO2 as the carrier gases and the values are around 12.8 wt% at 250 °C and 6.6 wt% at 300 °C. The torrefaction temperature of 250 °C is not yet above the thermal decomposition temperature of cellulose. The decomposition extent using N2 or CO2 as a carrier gas is thus not as complete as that using the gas mixture of air + CO2. Oxygen in the gas mixture of air + CO2 induces the oxidation reactions of the lignocelluloses in biomass, causing a larger weight loss of the sample. Lu et al. [18] demonstrated the results using N2 and air as the carrier gases for biomass torrefaction, and discovered that the solid yield from the former was higher than from the latter for all torrefaction temperatures. On the other hand, the torrefaction of corncob waste at 300 °C is close to the decomposition temperature of cellulose. This results in a more drastic decomposition of biomass, even in an inert atmosphere. The existence of oxygen makes only insignificant difference in solid yield between air + CO2 and N2 at 300 °C where the difference is 3.4 wt%, compared to 11.2 wt% at 250 °C.
At the torrefaction temperature of 250 °C, the liquid yield is sensitive to the carrier gas. Specifically, when N2, CO2, and air + CO2 are employed as the carrier gases, the liquid yields are 12.4 wt%, 18.0 wt%, and 24.2 wt%, respectively. It follows that the liquid yield from the torrefaction in the gas mixture (i.e., air + CO2) is larger than in N2 by approximately a factor of 2. Alternatively, the liquid yields at the reaction temperature of 300 °C in the three atmospheres of N2, CO2, and air + CO2 are 18.7 wt%, 22.9 wt%, and 12.4 wt%, respectively. The lower liquid yield in the atmosphere of air + CO2 at 300 °C than at 250 °C arises from the fact that a higher torrefaction temperature is conducive to the oxidation reactions which further shift liquid products toward gas products. In regard to the gas products, which are obtained by difference, account for 17.1 wt%–24.3 wt% of the raw samples.
3.2. Proximate, Ultimate, and Calorific Analyses
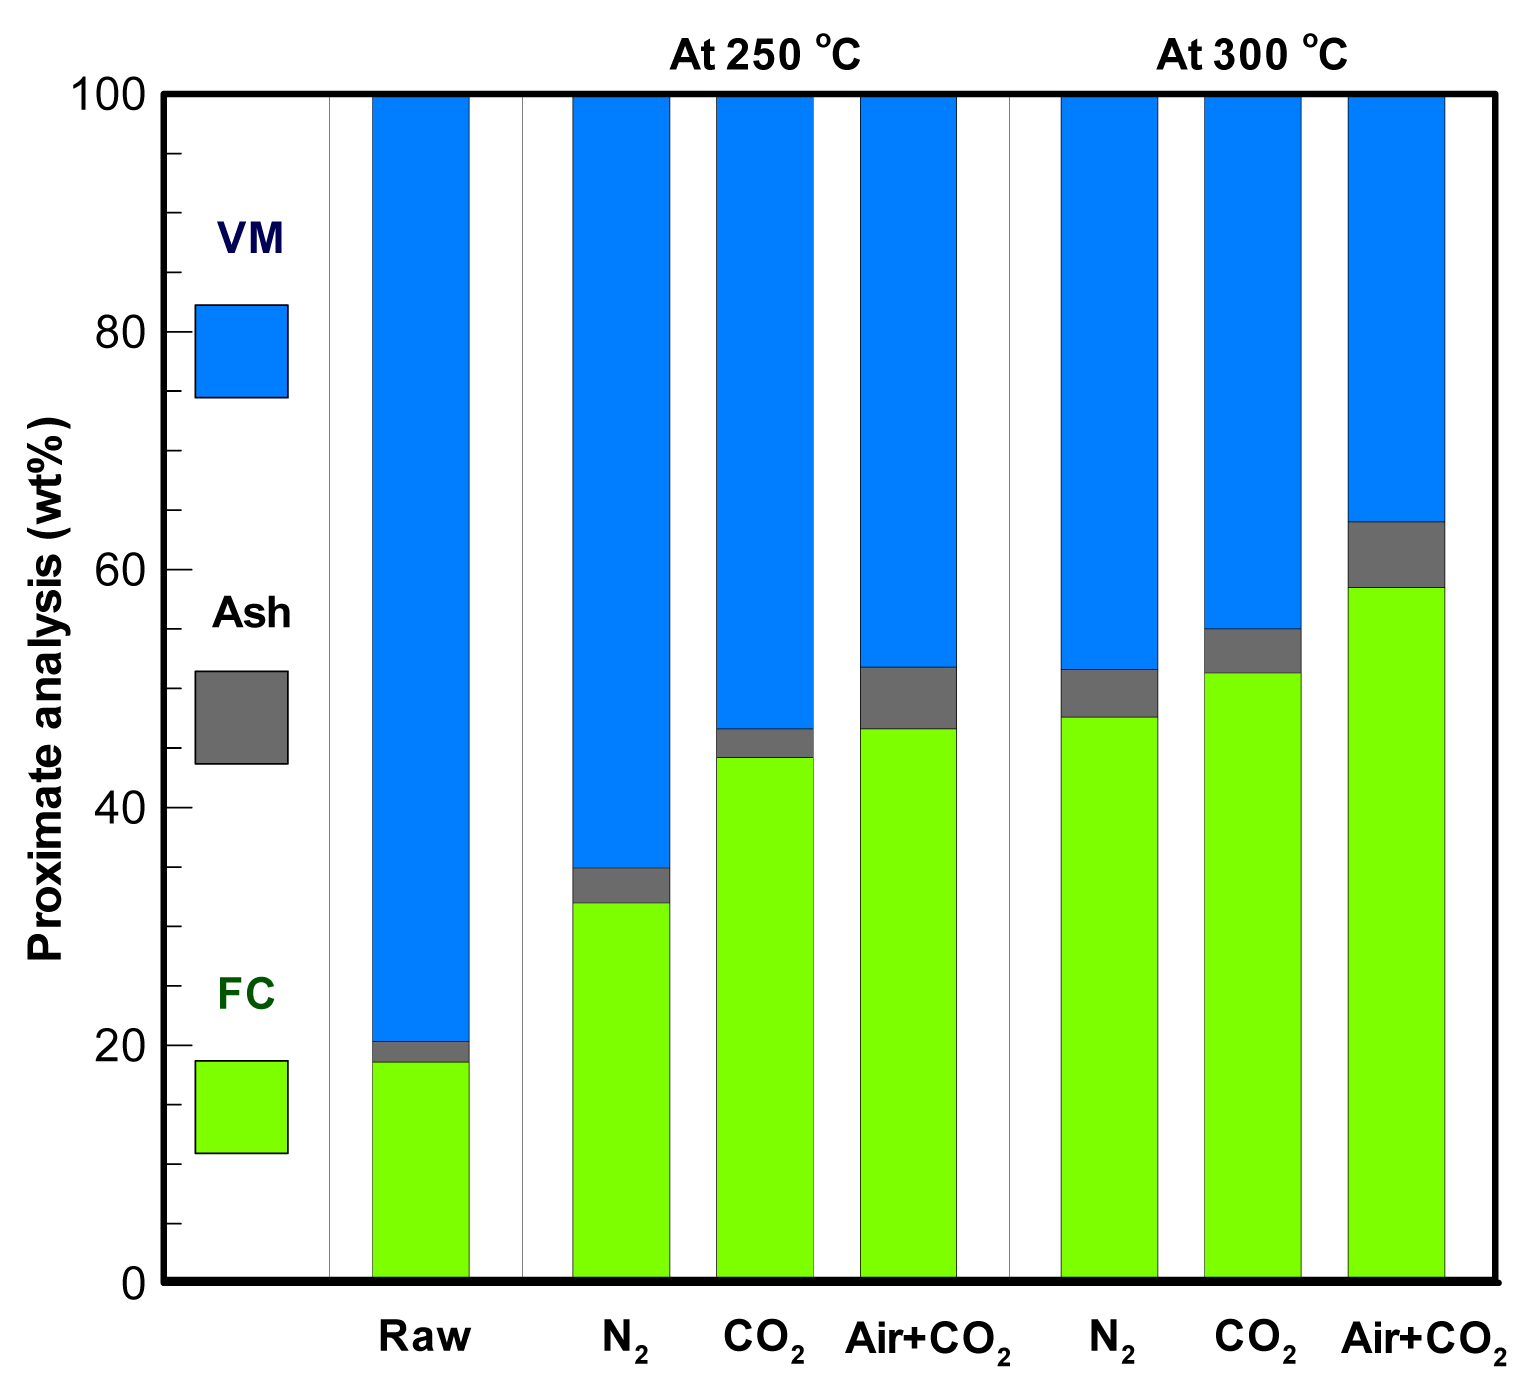
The proximate analyses of raw and torrefied corncob wastes are displayed in Figure 4. The percentages of VM in biomass are ranked as: 250 °C-N2 > 250 °C-CO2 > 250 °C-air + CO2 > 300 °C-N2 > 300 °C-CO2 > 300 °C-air + CO2, whereas an opposite behavior is exhibited for FC. Clearly, the gas mixture of air + CO2 plays a more efficient role as the carrier gas to remove VM and increase the percentage of FC in biomass at a given torrefaction temperature. This is also attributed to the oxidative reactions when air or oxygen is presented. When the corncob waste is torrefied at the conditions of 300 °C-air + CO2, the percentage of VM in biomass decreases from 79.7 wt% to 34.9 wt%, while FC increases from 18.6 wt% to 56.7 wt%. The FC in torrefied biomass by CO2 treatment is higher than by N2 treatment. This implies that the impact of CO2 on the carbonization of corncob waste is heavier than N2, whether the temperature is 250 °C or 300 °C. This reflects that CO2 can be utilized as a carrier gas to perform corncob waste torrefaction. The greenhouse gas can be obtained from CO2 capture processes in industries, thereby achieving CO2 reuse. The carbonization extents of corncob waste at the torrefaction temperature of 300 °C are higher than at 250 °C for the three carrier gases. However, the weight percentage of ash is also lifted, especially at the condition of using the gas mixture as a carrier gas. This is attributed to the thermal decomposition and oxidative reactions of corncob waste.
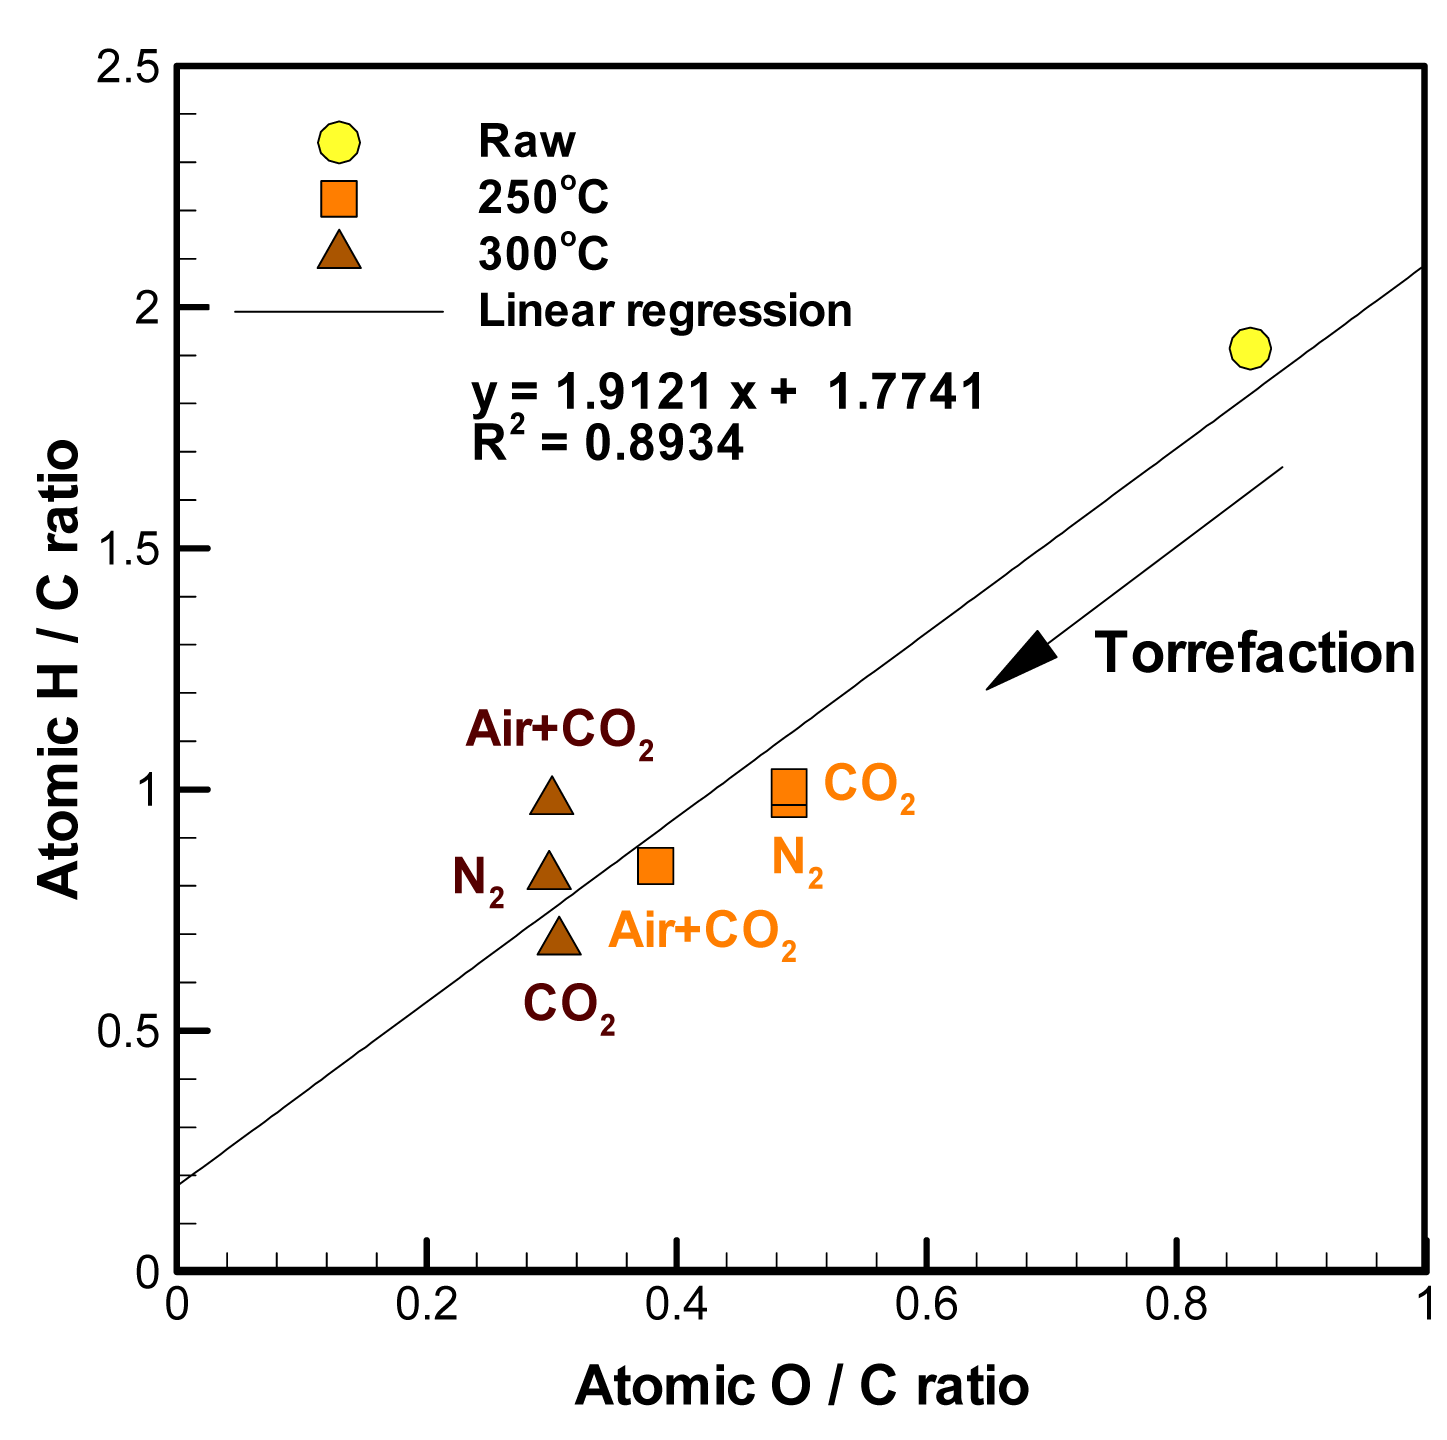
From the profiles of atomic H/C and O/C ratios (van Krevelen diagram) shown in Figure 5, the ratios obviously diminish when the biomass is torrefied. The H/C and O/C ratios of raw corncob waste are 1.91 and 0.86, respectively. When the biomass is pretreated by air + CO2 at 250 °C, its H/C and O/C ratios are reduced to 0.84 and 0.38, respectively. By virtue of biomass carbonization from torrefaction in the three carrier gases, the H/C and O/C ratios of torrefied biomass decrease. The temperature of 300 °C shows a higher capability in lowering the H/C and O/C ratios than 250 °C.
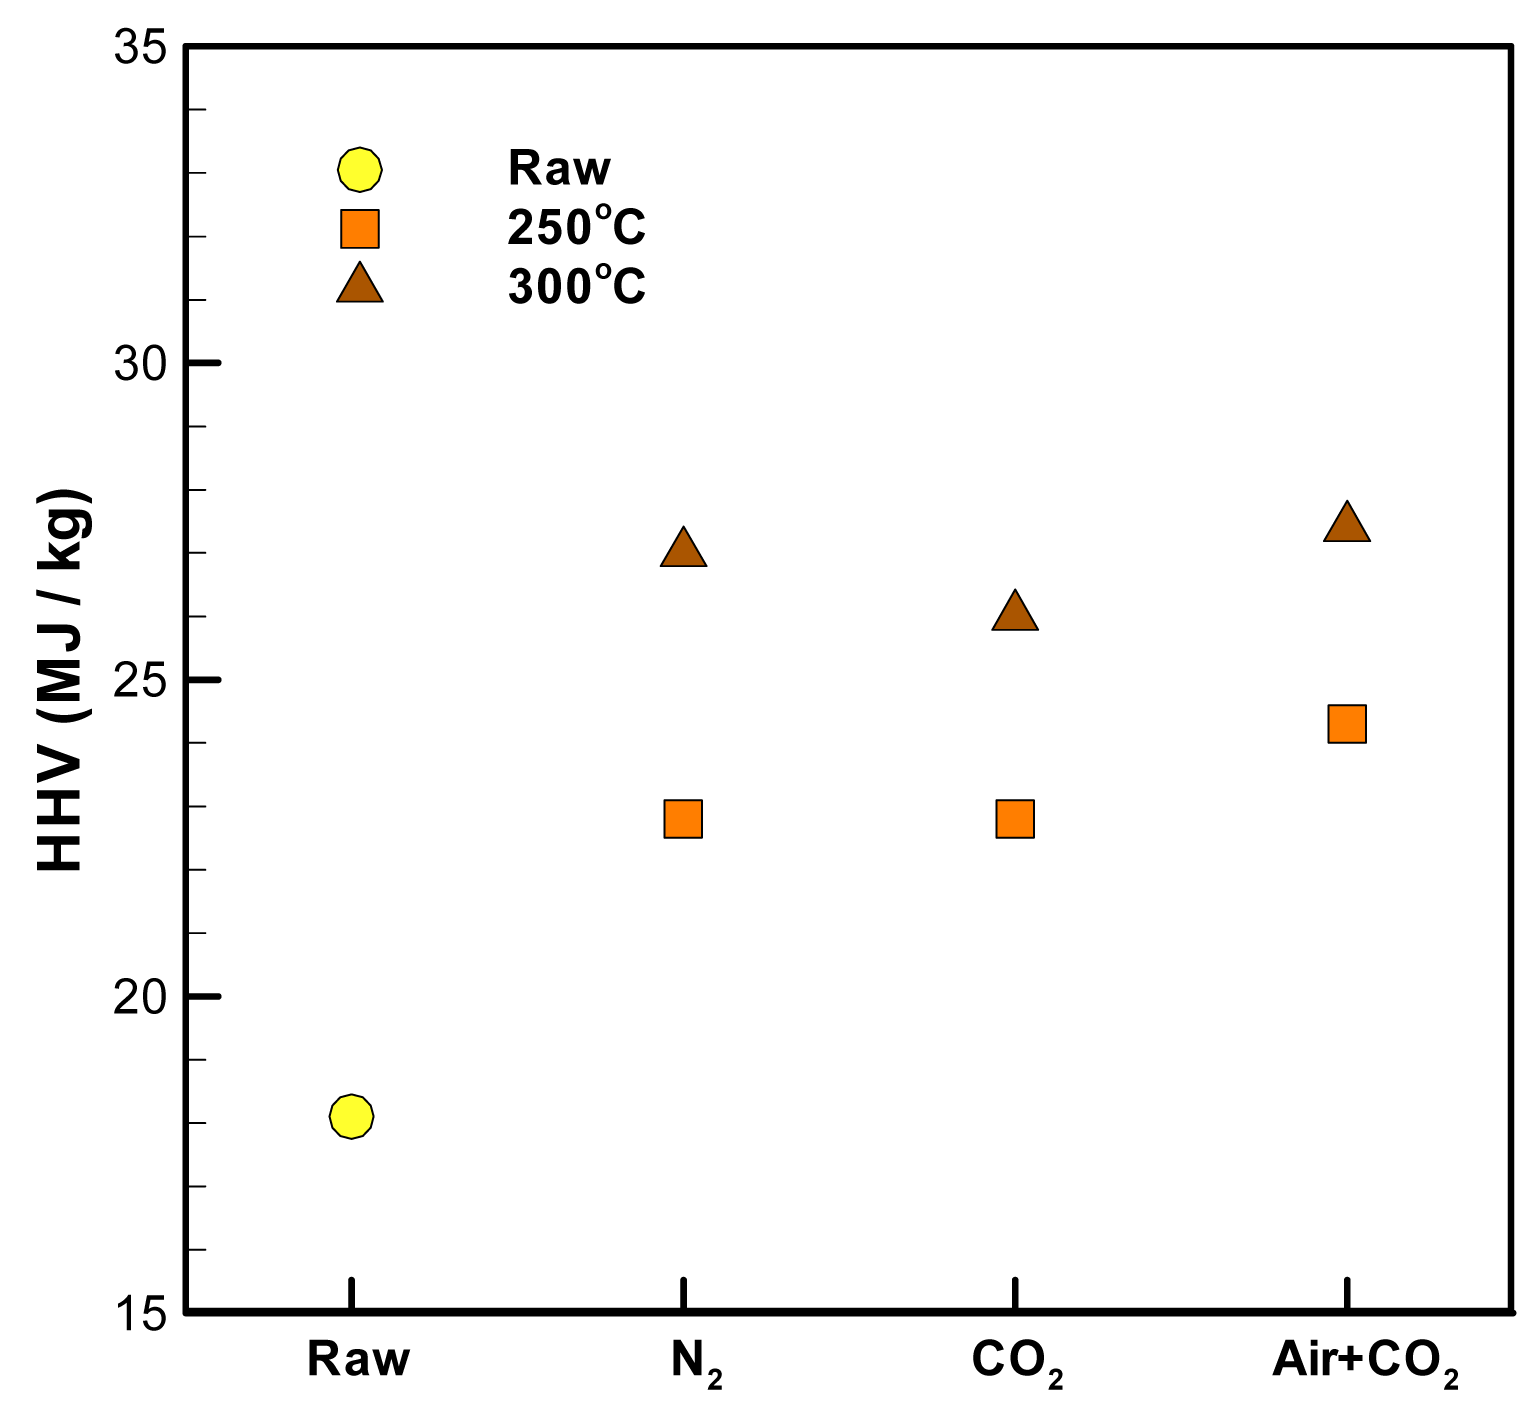
The HHV profiles of raw and torrefied corncob waste are shown in Figure 6. The torrefaction temperature shows a more obvious impact on the rise of HHV than the carrier gas. Regardless of the choice of carrier gas, after 1 h torrefaction at 250 °C and 300 °C, the average HHV of corncob waste increases from 18.1 MJ kg−1 to 23.3 MJ kg−1 and 26.8 MJ kg−1, respectively, rendering the improvements of 28.7% and 48.1%, respectively. These results reveal that using CO2 or air + CO2 as a carrier gas to pretreat corncob waste is appropriate. The maximum difference in HHV between the two torrefaction temperatures is 4.4 MJ kg−1 when N2 is used as the carrier gas. In the atmospheres of CO2 and air + CO2, the differences between 250 °C and 300 °C are 3.5 MJ kg−1 and 3.1 MJ kg−1, respectively. According to the results of solid yield and HHV, the biomass torrefaction by use of CO2 as the carrier gas at 250 °C is a better way to pretreat corncob waste.
The HHV of torrefied corncob waste will increase when the carbon content in the biomass increases and the oxygen content decreases (Table 2).
The HHV of raw biomass can be calculated by employing the following formula [33] which is established in terms of the elemental and proximate analyses (dry basis):
The experimental and predicted HHVs of raw and torrefied corncob wastes are given in Table 3. The comparison between the measurements and predictions suggests that the relative error of untorrefied sample is as low as 3.2% and the most accurate one. The error at the condition of 250 °C-air + CO2 is 9.4% and the highest one. As a whole, the results reveal that Equation (1) can also be applied to obtain the HHV or calorific value of torrefied biomass, as a consequence of relative error less than 9.5%.
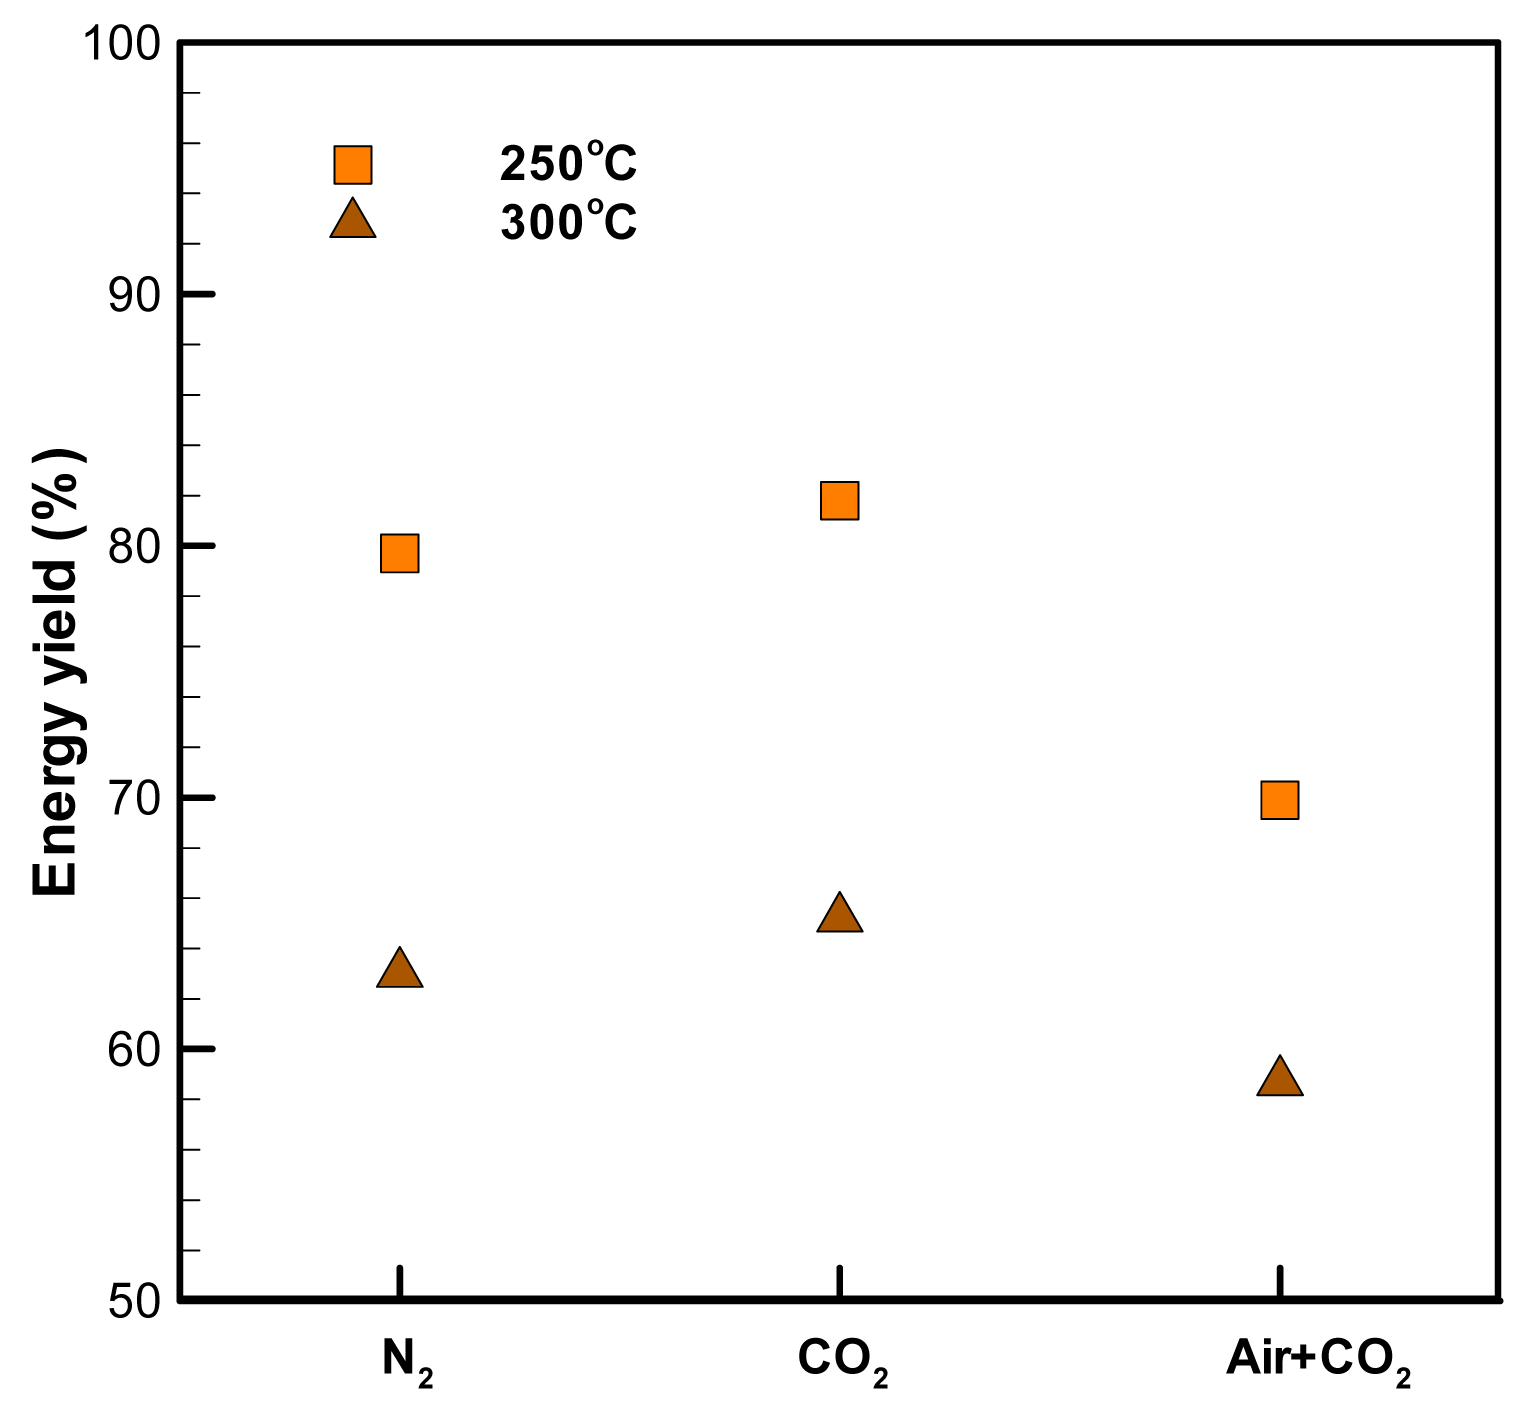
The energy yield, which stands for the total energy ratio between torrefied and raw biomass samples, is one of the most important indicators to evaluate the performance of torrefaction. A higher torrefaction temperature increases the energy density or HHV of biomass but diminishes its solid yield. Because volatiles are liberated and lignocelluloses are thermally decomposed to a great extent from the torrefaction at 300 °C, it is not surprising that the energy yield is lower at 300 °C than at 250 °C in the same atmosphere, as shown in Figure 7.
On account of the oxygen contained in the air + CO2 carrier gas, its energy yield is lower than those of the other two carrier gases, either at the torrefaction temperature of 250 °C or 300 °C. The most significant condition is 300 °C-air + CO2 because it retains 58.7% of the energy in the solid products. The energy yield difference between CO2 and N2 is as low as ±2.3%. CO2 can thus be considered as a potential carrier gas to replace N2 for biomass torrefaction, as described earlier.
3.3. Density, Grindability, Hygroscopicity, and Reactivity
In addition to HHV and energy density, volume density, grindability, hygroscopicity, and reactivity are also the important properties for fuel utilization and transportation. VM is the most important component in raw biomass or agricultural wastes, and thus results in their low densities. On the other hand, the lignocellulosic structure in biomass leads to the difficulties in cutting and grinding raw biomass, thereby consuming more energy [34,35].
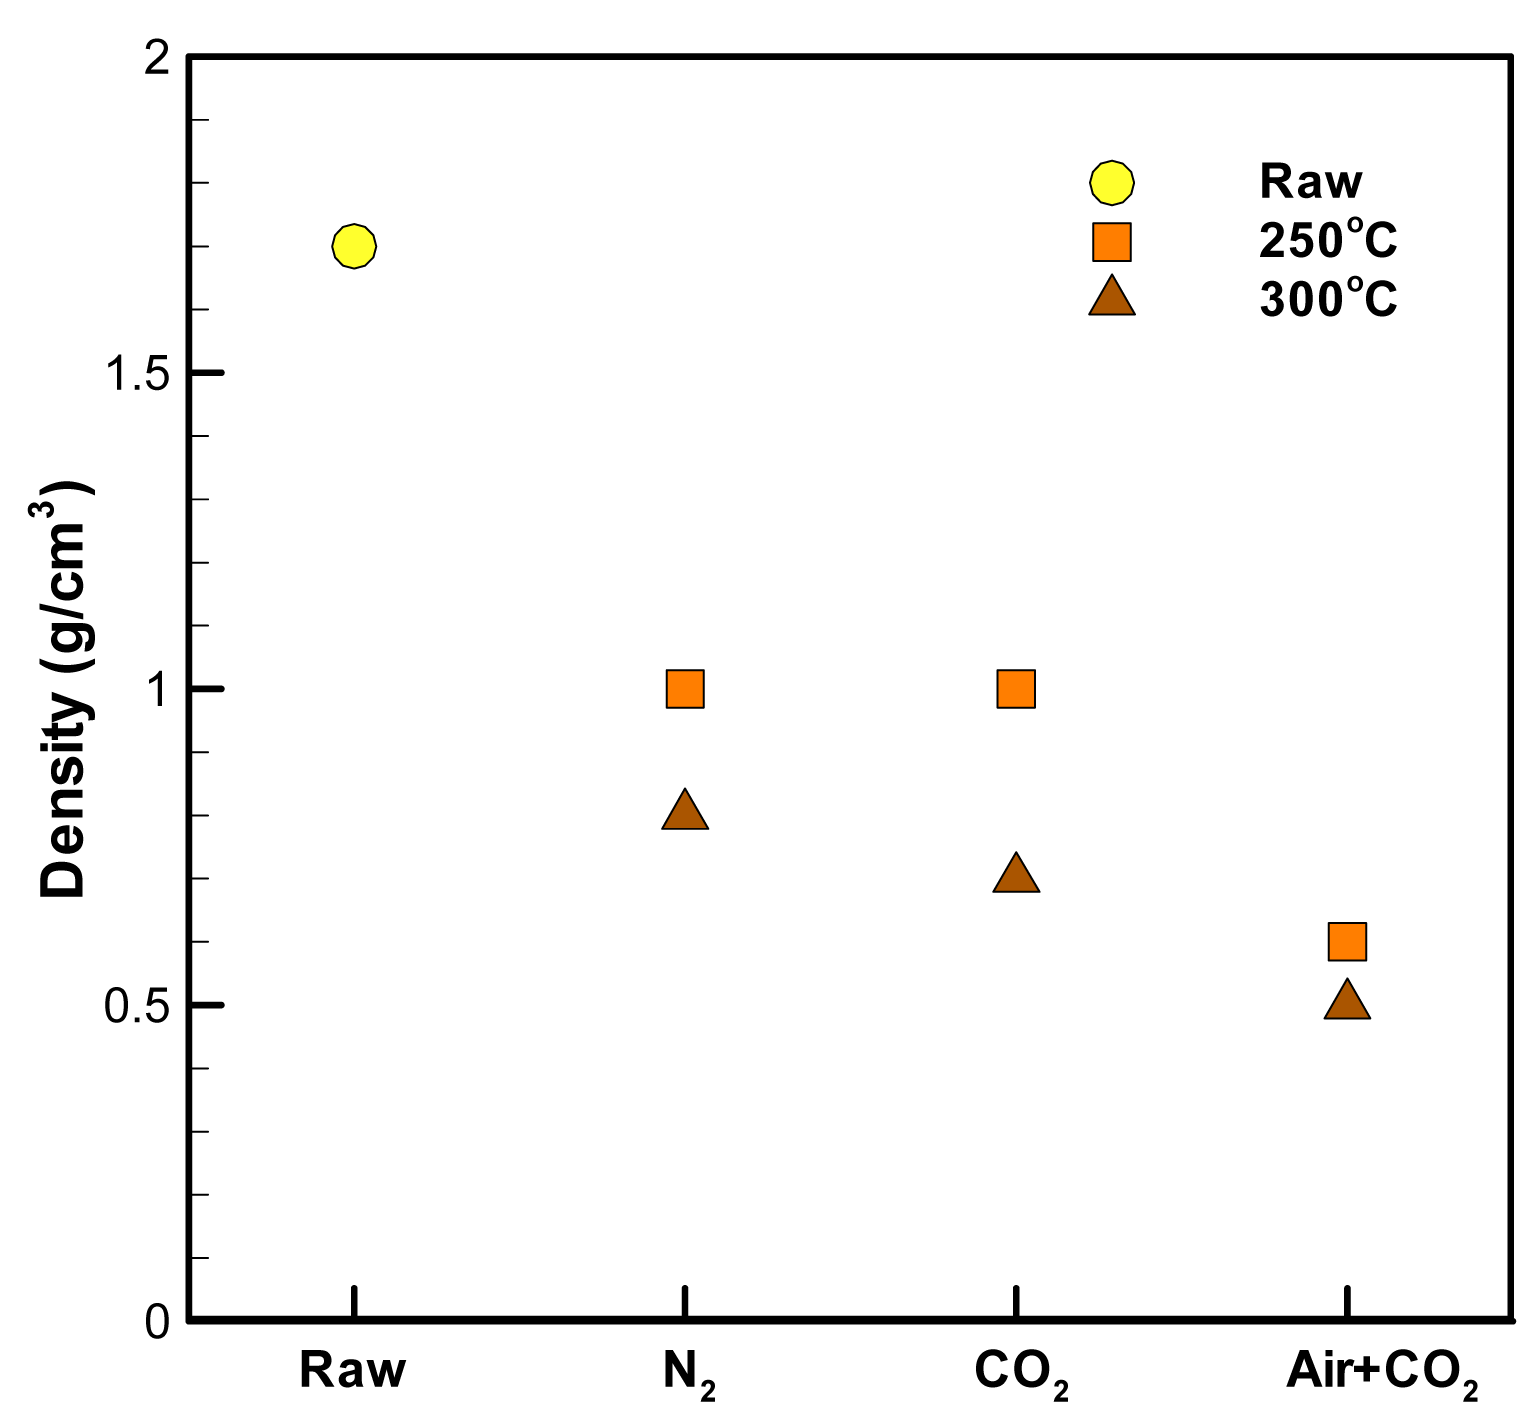
Figure 8 depicts that the densities of torrefied corncob wastes are much lower than that of untreated one, and the torrefaction temperature of 300 °C shows a more significant effect on the density than 250 °C. The effect of torrefaction temperature on density is not significant when air + CO2 is used as the carrier gas. However, the density change from 1.7 g cm−3 of raw biomass to 0.5 g cm−3 at the conditions of 300 °C-air + CO2 can be observed.
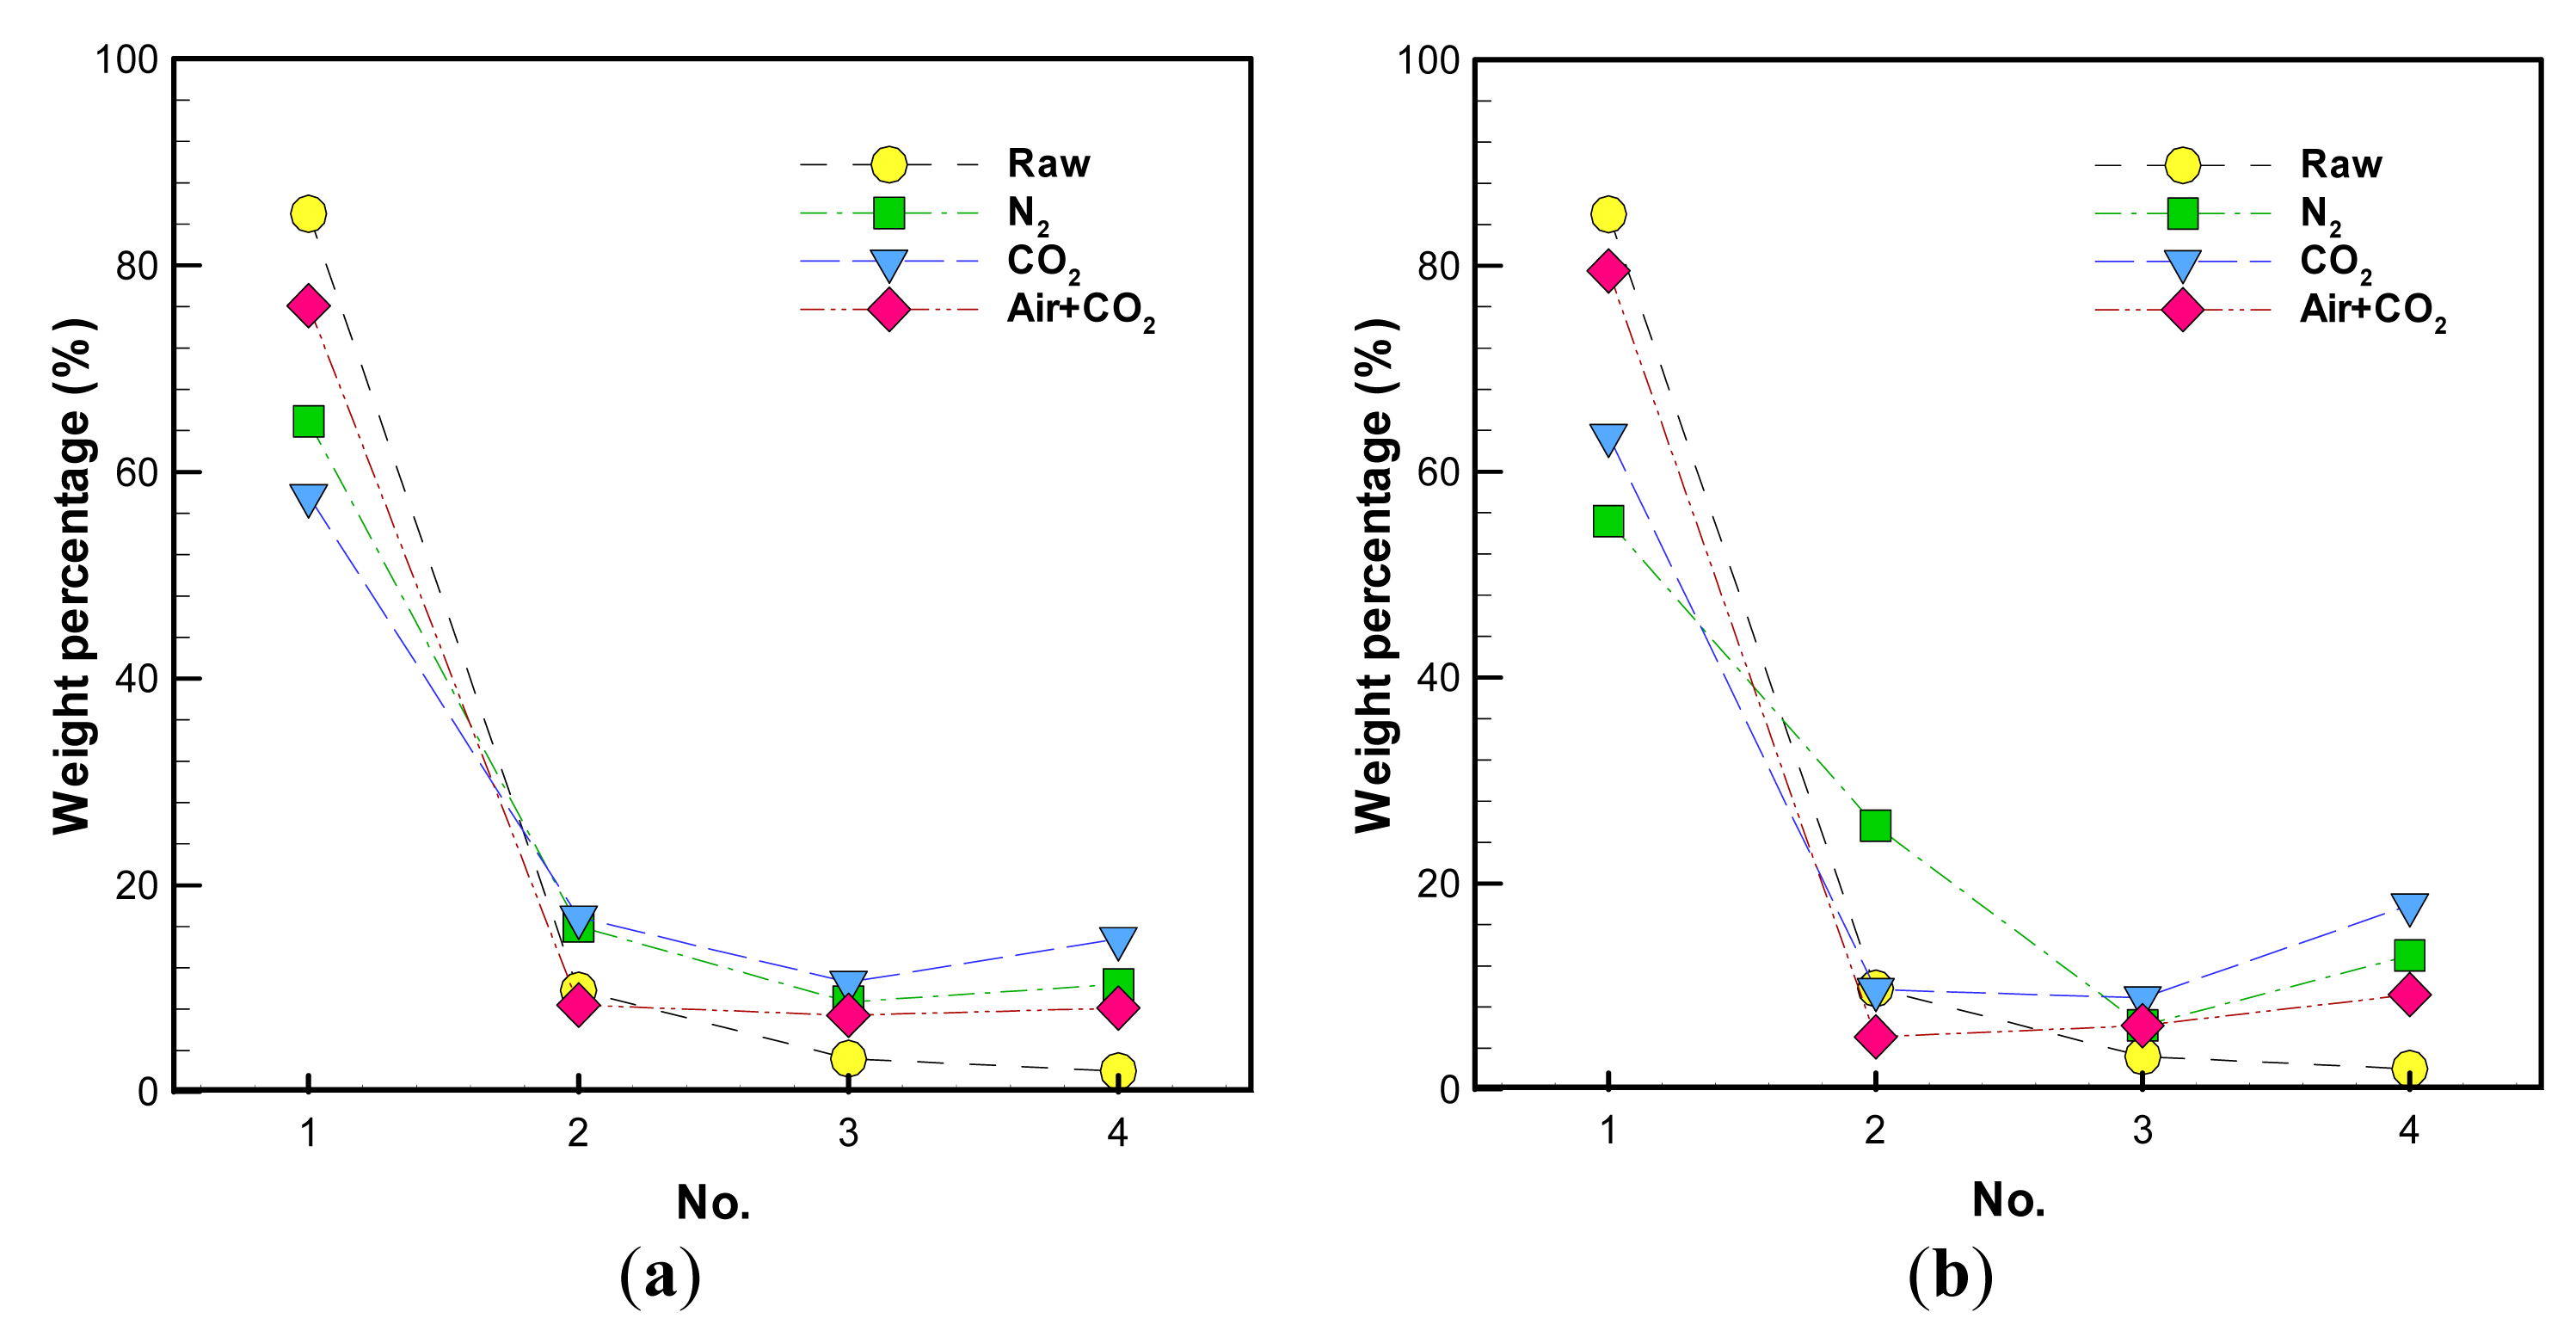
A pulverization test is also conducted for raw and torrefied corncob wastes under specified conditions. In Figure 9, the weight percentage of No. 2 for the corncob waste torrefied in the N2 atmosphere at 300 °C is higher than at 250 °C. However, it can be noted that the weight percentage of No. 1 at 300 °C is significantly lower than at 250 °C, whereas the weight percentages of No. 3 and No. 4 at 300 °C are close to those at 250 °C. Alternatively, when the biomass is torrefied in CO2, the weight percentage of No. 4 at 300 °C is higher than that at 250 °C. This reveals that the solid products obtained from the higher temperature torrefaction (300 °C) have better grindability than that from the lower temperature (250 °C). As a whole, after biomass is torrefied, its VM and volume density are decreased, whereas FC is increased and grindability is improved, making it easier for its pulverization and grinding. The increased energy density is conducive to the transportation of pretreated biomass and the ground biomass is easier to be combusted completely due to its higher total surface area.
Untreated biomass could undergo biological degradation in a high temperature and high humidity environment which is a disadvantage for storage. Consequently, a hygroscopicity test is conducted to evaluate torrefied biomass storage in a hot and humid environment. Figure 10 demonstrates the weight increments of raw and torrefied corncob wastes after hygroscopicity tests.
The profiles show no pronounced difference between untreated and torrefied corncob wastes after 1-h hygroscopicity tests. In 5-h hygroscopicity tests, the weight of the tested samples increases significantly. However, the weight increment of torrefied corncob wastes is substantially lower than that of untreated corncob waste, no matter what the carrier gases are adopted. The weight increment for the biomass torrefied in CO2 is close to that in N2 but lower than the biomass torrefied in the gas mixture. It is also noted that the weight increment at the torrefaction temperature of 250 °C is higher than at 300 °C. These results imply that all the carrier gases in this study can successfully decrease the hygroscopic nature of biomass.
The safety properties of biomass during storage and transportation should also be evaluated because it is combustible. Figure 11 illustrates the profiles of the ignition temperatures of raw and torrefied corncob wastes. The ignition temperature of raw biomass is 253 °C, while the ignition temperatures of torrefied materials at the conditions of 250 °C-N2 and 250 °C-CO2 are 277 and 282 °C, respectively. With the torrefaction temperature of 300 °C, the ignition temperatures are further raised to 291 °C and 304 °C, at an average of 36 °C increase. This indicates that a higher torrefaction temperature leads to a higher ignition temperature. On the other hand, the ignition temperatures of biomass torrefied in CO2 are higher than in N2. As a consequence, CO2 can be used to replace N2 for biomass torrefaction. Overall, from the profiles of ignition temperature, the storage and transportation safety of biomass can be enhanced in that the ignition temperature of torrefied biomass is higher than that of raw biomass.
4. Conclusions
The product yields and characteristics of corncob waste torrefied at the temperatures of 250 °C and 300 °C using N2, CO2, and the gas mixture of air and CO2 as the carrier gases have been investigated. The results suggest that the role played by temperature on the performance of torrefaction is more than that of the carrier gas, and a higher torrefaction temperature makes the properties of solid products approach those of coal. However, the solid yield and the energy yield decrease as the torrefaction temperature rises. A comparison among corncob wastes torrefied in N2, CO2, and air + CO2 indicates that CO2 is better than N2 and air + CO2 to intensify the energy yield of the biomass. All the carrier gases in this study can successfully diminish the hygroscopic nature and raise the ignition temperature of biomass. Compared to N2, CO2 is a better choice than conventional torrefaction to increase the ignition temperature of torrefied biomass, whereas the hygroscopic characteristics of torrefied materials in N2 and CO2 are close to each other. Accordingly, CO2 can replace N2 as a carrier gas for biomass torrefaction to improve the properties of the solid products and increase the safety of biomass storage and transportation. The results of this study are conducive to the design of practical biomass torrefaction processes.
Acknowledgments
The authors gratefully acknowledge the financial support of the National Science Council, Taiwan, under contract NSC 102-2221-E-006-288-MY3 for this study.
Conflicts of Interest
The authors declare no conflict of interest.
References
- Chen, W.H.; Lu, J.J. Microphysics of atmospheric carbon dioxide uptake by a cloud droplet containing a solid nucleus. J. Geophys. Res. Atmos. 2003, 108. [Google Scholar] [CrossRef]
- Fiaschi, D.; Carta, R. CO2 abatement by co-firing of natural gas and biomass-derived gas in a gas turbine. Energy 2007, 32, 549–567. [Google Scholar]
- Chen, W.H.; Wu, J.S. An evaluation on the rice husk and pulverized coal blends using a drop tube furnace and a thermogravimetric analyzer for application to a blast furnace. Energy 2009, 34, 1458–1466. [Google Scholar]
- Chen, W.H.; Kuo, P.C. Torrefaction and co-torrefaction characterization of hemicellulose, cellulose and lignin as well as torrefaction of some basic constituents in biomass. Energy 2011, 36, 803–811. [Google Scholar]
- Werther, J.; Saenger, M.; Hartge, E.U.; Ogada, T.; Siagi, Z. Combustion of agricultural residues. Prog. Energy Combust. 2000, 26, 1–27. [Google Scholar]
- Deng, J.; Wang, G.J.; Kuang, J.H.; Zhang, Y.L.; Luo, Y.H. Pretreatment of agricultural residues for co-gasification via torrefaction. J. Anal. Appl. Pyrolysis 2009, 86, 331–337. [Google Scholar]
- Uemura, Y.; Omar, W.N.; Tsutsui, T.; Yusup, S.B. Torrefaction of oil palm wastes. Fuel 2011, 90, 2585–2591. [Google Scholar]
- Phuong, L.X.; Shida, S.; Saito, Y. Effects of heat treatment on brittleness of Styrax tonkinensis wood. J. Wood Sci. 2007, 53, 181–186. [Google Scholar]
- Chew, J.J.; Doshi, V. Recent advances in biomass pretreatment—Torrefaction fundamentals and technology. Renew. Sustain. Energy Rev. 2011, 15, 4212–4222. [Google Scholar]
- Van der Stelt, M.J.C.; Gerhauser, H.; Kiel, J.H.A.; Ptasinski, K.J. Biomass upgrading by torrefaction for the production of biofuels: A review. Biomass Bioenergy 2011, 35, 3748–3762. [Google Scholar]
- Peng, J.; Bi, X.T.; Sokhansanj, S.; Lim, J. A study of particle size effect on biomass torrefaction and densification. Energy Fuels 2012, 26, 3826–3839. [Google Scholar]
- Wu, K.T.; Tsai, C.J.; Chen, C.S.; Chen, H.W. The characteristics of torrefied microalgae. Appl. Energy 2012, 100, 52–57. [Google Scholar]
- Bergman, P.; Boersma, A.; Kiel, J.; Prins, M.; Ptasinski, K.; Janssen, F. Torrefaction for Entrained Flow Gasification of Biomass; Energy Research Center of Netherlands: Petten, The Netherlands, 2005. [Google Scholar]
- Svoboda, K.; Pohorely, M.; Hartman, M.; Martinec, J. Pretreatment and feeding of biomass for pressurized entrained flow gasification. Fuel Process. Technol. 2009, 90, 629–635. [Google Scholar]
- Chen, W.H.; Lu, K.M.; Tsai, C.M. An experimental analysis on property and structure variations of agricultural wastes undergoing torrefaction. Appl. Energy 2012, 100, 318–325. [Google Scholar]
- Lu, K.M.; Lee, W.J.; Chen, W.H.; Lin, T.C. Thermogravimetric analysis and kinetics of co-pyrolysis of torrefied wood and coal blends. Appl. Energy 2013, 105, 57–65. [Google Scholar]
- Kakaras, E.; Doukelis, A.; Giannakopoulos, D.; Koumanakos, A. Economic implications of oxyfuel application in a lignite-fired power plant. Fuel 2007, 86, 2151–2158. [Google Scholar]
- Lu, K.M.; Lee, W.J.; Chen, W.H.; Liu, S.H.; Lin, T.C. Torrefaction and low temperature carbonization of oil palm fiber and eucalyptus in nitrogen and air temperatures. Bioresour. Technol. 2012, 123, 98–105. [Google Scholar]
- Uemura, Y.; Omar, W.; Othman, N.A.; Yusup, S.; Tsutsui, T. Torrefaction of oil palm EFB in the presence of oxygen. Fuel 2013, 103, 156–160. [Google Scholar]
- Chen, W.H.; Lu, K.M.; Lee, W.J.; Liu, S.H.; Lin, T.C. Non-oxidative and oxidative torrefaction characterization and SEM observations of fibrous and ligneous biomass. Appl. Energy 2014, 114, 104–113. [Google Scholar]
- Chen, W.H.; Lu, K.M.; Lee, W.J.; Liu, S.H.; Lin, T.C. Biomass torrefaction characteristics in inert and oxidative atmospheres at various superficial velocities. Bioresour. Technol. 2013, 146, 152–160. [Google Scholar]
- Eseltine, D.; Thanapal, S.S.; Annamalai, K.; Ranjan, D. Torrefaction of woody biomass (Juniper and Mesquite) using inert and non-inert gases. Fuel 2013, 113, 379–388. [Google Scholar]
- Sarvaramini, A.; Larachi, F. Integrated biomass torrefaction—Chemical looping combustion as a method to recover torrefaction volatiles energy. Fuel 2014, 116, 158–167. [Google Scholar]
- Chen, W.H.; Hsu, H.C.; Lu, K.M.; Lee, W.C.; Lin, D.C. Thermal pretreatment of wood (Lauan) block by torrefaction and its influence on the properties of the biomass. Energy 2011, 36, 3012–3021. [Google Scholar]
- Felfli, F.F.; Luengo, C.A.; Suarez, J.A.; Beaton, P.A. Wood briquette torrefaction. Energy Sustain. Dev. 2005, 9, 19–22. [Google Scholar]
- Pimchuai, A.; Dutta, A.; Basu, P. Torrefaction of agriculture residue to enhance combustible properties. Energy Fuels 2010, 24, 4638–4645. [Google Scholar]
- Acharjee, T.C.; Coronella, C.J.; Vasquez, V.R. Effect of thermal pretreatment on equilibrium moisture content of lignocellulosic biomass. Bioresour. Technol. 2011, 102, 4849–4854. [Google Scholar]
- Vasquez, V.R.; Coronella, C.J. A simple model for vapor-moisture equilibrium in biomass substrates. AIChE J. 2009, 55, 1595–1603. [Google Scholar]
- Antal, M.J., Jr. Biomass pyrolysis: A Review of the Literature Part I—Carbohydrate Pyrolysis. In Advances in Solar Energy; Springer: New York, NY, USA, 1983; pp. 61–111. [Google Scholar]
- Mansaray, K.G.; Ghaly, A.E. Thermal degradation of rice husks in nitrogen atmosphere. Bioresour. Technol. 1998, 65, 13–20. [Google Scholar]
- Yang, H.; Yan, R.; Chen, H.; Lee, D.H.; Zheng, C. Characteristics of hemicellulose, cellulose and ligin pyrolysis. Fuel 2007, 86, 1781–1788. [Google Scholar]
- Rousset, P.; Macedo, L.; Commandre, J.M.; Moreira, A. Biomass torrefaction under different oxygen concentrations and its effect on the composition of the solid by-product. J. Anal. Appl. Pyrolysis 2012, 96, 86–91. [Google Scholar]
- Channiwala, S.A.; Parikh, P.P. A unified correlation for estimating HHV of solid, liquid and gaseous fuels. Fuel 2002, 81, 1051–1063. [Google Scholar]
- Bridgeman, T.G.; Jones, J.M.; Williams, A.; Waldron, D.J. An investigation of the grindability of two torrefied energy crops. Fuel 2010, 89, 3911–3918. [Google Scholar]
- Chen, W.H.; Cheng, W.Y.; Lu, K.M.; Huang, Y.P. An evaluation on improvement of pulverized biomass property for solid fuel through torrefaction. Appl. Energy 2011, 88, 3636–3644. [Google Scholar]


| Analysis | Content | Value |
|---|---|---|
| Fiber analysis (wt%) | Hemicellulose | 22.8 |
| Cellulose | 69.2 | |
| Lignin | 8.0 | |
| Elemental analysis (wt%, dry basis) | C | 42.0 |
| H | 6.7 | |
| N | 1.5 | |
| O (by difference) | 48.1 | |
| Proximate analysis (wt%) | Moisture | 14.1 |
| Volatile matter (VM) | 68.5 | |
| Fixed carbon (FC) | 15.9 | |
| Ash | 1.5 | |
| HHV (MJ kg−1) | - | 18.1 |
| Conditions | Elemental analysis (wt%, dry basis) | Ash (wt%) | HHV (MJ kg−1) | Enhancement factor of HHV (%) | ||||
|---|---|---|---|---|---|---|---|---|
| C | H | N | O (by difference) | |||||
| Raw | 42.0 | 6.7 | 1.5 | 48.1 | 1.7 | 18.1 | - | |
| 250 °C | N2 | 55.1 | 4.5 | 1.5 | 36.0 | 2.9 | 22.8 | 1.26 |
| CO2 | 54.9 | 4.6 | 2.2 | 35.9 | 2.4 | 22.8 | 1.26 | |
| Air + CO2 | 58.5 | 4.1 | 2.3 | 29.9 | 5.2 | 24.3 | 1.34 | |
| 300 °C | N2 | 64.0 | 4.4 | 2.0 | 25.4 | 4.2 | 27.0 | 1.49 |
| CO2 | 63.9 | 3.6 | 2.5 | 26.1 | 3.9 | 26.0 | 1.44 | |
| Air + CO2 | 61.8 | 5.6 | 2.4 | 24.7 | 5.5 | 27.4 | 1.51 | |
| Conditions | Measurement (MJ kg−1) | Prediction (MJ kg−1) | Relative error (%) | |
|---|---|---|---|---|
| Raw | 18.1 | 17.5 | 3.2 | |
| 250 °C | N2 | 22.8 | 20.7 | 9.1 |
| CO2 | 22.8 | 20.8 | 8.8 | |
| Air + CO2 | 24.3 | 22.0 | 9.4 | |
| 300 °C | N2 | 27.0 | 24.8 | 8.2 |
| CO2 | 26.0 | 23.7 | 8.7 | |
| Air + CO2 | 27.4 | 25.4 | 7.0 | |
© 2014 by the authors; licensee MDPI, Basel, Switzerland This article is an open access article distributed under the terms and conditions of the Creative Commons Attribution license (http://creativecommons.org/licenses/by/3.0/).
Share and Cite
Lu, J.-J.; Chen, W.-H. Product Yields and Characteristics of Corncob Waste under Various Torrefaction Atmospheres. Energies 2014, 7, 13-27. https://doi.org/10.3390/en7010013
Lu J-J, Chen W-H. Product Yields and Characteristics of Corncob Waste under Various Torrefaction Atmospheres. Energies. 2014; 7(1):13-27. https://doi.org/10.3390/en7010013
Chicago/Turabian StyleLu, Jau-Jang, and Wei-Hsin Chen. 2014. "Product Yields and Characteristics of Corncob Waste under Various Torrefaction Atmospheres" Energies 7, no. 1: 13-27. https://doi.org/10.3390/en7010013