Analysis of Solid and Aqueous Phase Products from Hydrothermal Carbonization of Whole and Lipid-Extracted Algae

Abstract
: Microalgae have tremendous potential as a feedstock for production of liquid biofuels, particularly biodiesel fuel via transesterification of algal lipids. However, biodiesel production results in significant amounts of algal residues, or “lipid extracted algae” (LEA). Suitable utilization of the LEA residue will improve the economics of algal biodiesel. In the present study, we evaluate the hydrothermal carbonization (HTC) of whole and lipid extracted algal (Spirulina maxima) feedstocks in order to produce a solid biofuel (hydrochar) and value-added co-products in the aqueous phase. HTC experiments were performed using a 2-L Parr reactor (batch type) at 175–215 °C with a 30-min holding time. Solid, aqueous and gaseous products were analyzed using various laboratory methods to evaluate the mass and carbon balances, and investigate the existence of high value chemicals in the aqueous phase. The HTC method is effective in creating an energy dense, solid hydrochar from both whole algae and LEA at lower temperatures as compared to lignocellulosic feedstocks, and is effective at reducing the ash content in the resulting hydrochar. However, under the treatment temperatures investigated, less than 1% of the starting dry algae mass was recovered as an identified high-value chemical in the aqueous phase.1. Introduction
Over the past several decades, there has been significant interest in using algae as a feedstock for production of biofuels—particularly by converting algal lipids into biodiesel fuel via transesterification of triglycerides [1–4]. The benefits of algae as a biofuel feedstock include: rapid growth and high annualized productivity, high oil content, tolerance and adaptability to poor quality water including wastewater effluent, use of relatively limited land area including marginal or non-productive lands, potential mitigation of fossil CO2 emissions, and the production of valuable co-products. Recently, the National Renewable Energy Laboratory (NREL) and the U.S. Department of Energy (DOE) have resumed investigations of algal fuels and have issued a technical roadmap for establishment of a domestic, commercial-scale algae-based biofuels industry [5,6]. Renewed interest in algae is driven by high costs of petroleum and other energy sources, increased emphasis on U.S. energy security, concern about elevated CO2 and climate change, advances in biotechnology and photobioreactor designs, and petroleum refiners' interest in processing biolipids into fuels.
However, there are still many challenges to commercial production of biofuels from algae. DOE's recent National Algal Biofuels Technology Roadmap states: “… the greatest challenge in algal fuel conversion is not likely to be how to convert lipids or carbohydrates to fuels most efficiently, but rather how best to use the algal remnants after the lipids or other desirable fuel precursors have been extracted” [5]. Typically, high production algae contain only 20%–40% lipids, with the remainder consisting mostly of carbohydrates and proteins. To enable commercial development of an algal-based fuel industry, suitable markets must be identified to absorb the enormous amounts of algal residues that would be produced. For example, 1 billion gallons/year (bg/y) of algal-derived biodiesel would leave about 5 million tons of algal residues (based on 35% lipid content). In comparison, the U.S. produced approximately 1 billion gallons of biodiesel in 2012 [7], while the U.S. Energy Independence and Security Act (EISA) of 2007 requires 36 bg/y of renewable fuels by 2022, with 21 bg/y of this being advanced fuels, such as algal-based fuels [8].
The residual biomass, referred to here as “lipid extracted algae” or “LEA”, is rich in carbohydrate and proteins, and has significant value. LEA can become contaminated when a solvent is used for lipid extraction and hence, is not suitable for use as feed/food for consumption by animals/humans. Direct combustion of delipidized biomass is an inefficient process and also, leads to loss of valuable nutrients (N, P) in the form of unwanted emissions to the atmosphere. The utility of unspent LEA biomass is still not clear, although recently, researchers have suggested using it to produce gaseous fuel via anaerobic digestion [9]. The DOE has also envisioned using residual algal biomass for biogas production via anaerobic digestion [10]. However, digestion of residual algal feedstock is limited by several bottlenecks including low biodegradability, ammonia toxicity and sodium toxicity [9,11].
Recently, hydrothermal processes such as hydrothermal liquefaction (HTL) and hydrothermal carbonization (HTC) have been widely reported for conversion of algal biomass into energy-dense biocrude and hydrochar, respectively. For wet biomass such as algae, hydrothermal conversion is energetically more efficient than the dry conversion processes [12,13]. HTC is a promising technology for treating and upgrading diverse biomass feedstocks on a large scale. It has been widely applied to numerous woody and herbaceous feedstocks and to produce an energy-dense solid, called hydrochar [14–18]. Information on HTC of algae is more limited, although there are such reports [19–21]. HTC involves processing of biomass in a hot (typically 200–300 °C), pressurized, aqueous environment. The main product from HTC is a hydrophobic hydrochar having physical and chemical properties similar to coal, such that it can be easily handled, transported and utilized for combustion or co-firing by employing existing coal infrastructure [22,23]. The aqueous co-product from HTC of algae may have some value for nutrient recycling [21]. Additionally, the presence of sugars and other high-value chemicals in the aqueous co-products (ACP) could be used for further upgrading [24]. DOE recently evaluated potential high-value C1–C6 chemicals derived from biomass and prepared a list of the top candidates, as shown in Table 1 [25].
The focus of this work was to demonstrate the potential of producing a valuable, energy-dense solid hydrochar from algae through hydrothermal carbonization. HTC was applied to both whole algae and the lipid-extracted algae (LEA) using Spirulina maxima as the feedstock. The solid product was evaluated to determine its energy content as well as the fate of ash constituents. In addition, the aqueous co-products (ACP) were evaluated through multiple laboratory analyses to identify high-value chemicals as outlined by DOE and shown in Table 1. Although a recent study focused on identification of nutrients for recycling ACP from algae [21], detailed characterization to identify high value chemicals has not previously been done, to our knowledge.
2. Results and Discussion
HTC experiments were conducted at 175 °C using both whole and LEA Spirulina, and at 215 °C for whole Spirulina. Results of these experiments are shown in comparison with earlier results from treatment of lignocellulosic feedstocks, using examples of loblolly pine and sugarcane bagasse [17,23].
2.1. Mass Recovery
A mass balance of each HTC experiment was computed by determining the mass of each recovered product and comparing the sum of all products recovered to the total dry starting mass. The recovered products include the solid hydrochar, gases (mainly CO2 with small amounts of CO), aqueous co-products (ACP), and produced water. The amount of produced water is difficult to determine and has large error, so is not included here. However, based upon previous experience, very little water is produced under the low process temperature conditions used here [23].
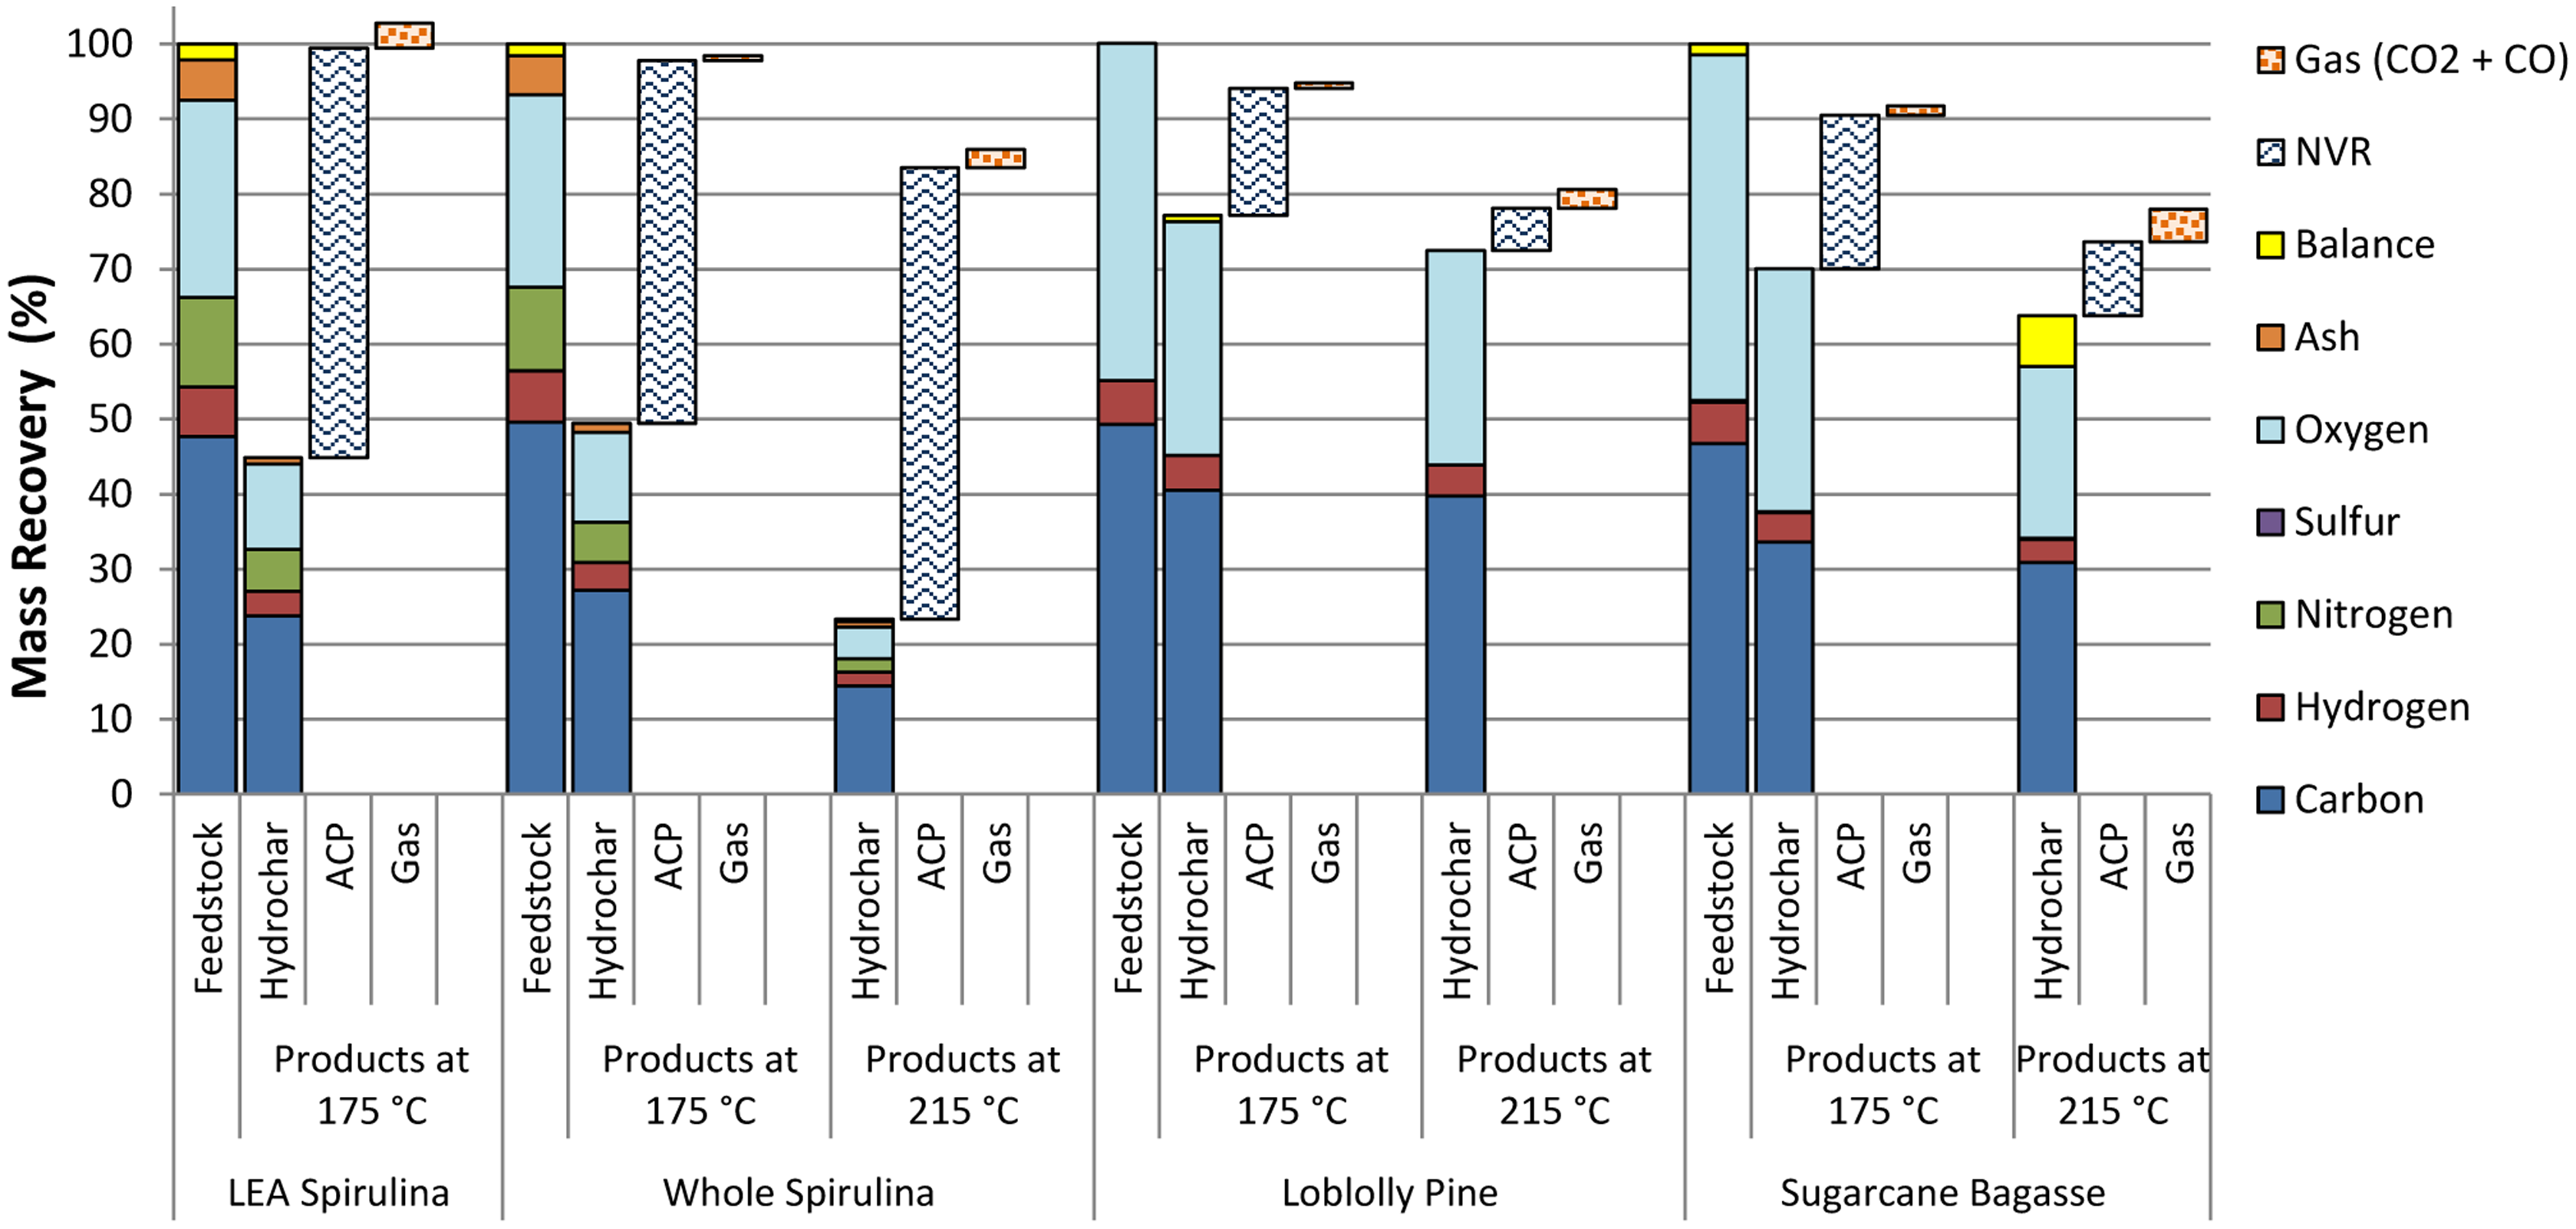
The mass recoveries from Spirulina experiments are shown in Figure 1, along with recoveries from loblolly pine and sugarcane bagasse feedstocks for comparison. The composition of the feedstock is normalized to 100%, and the three product bars (hydrochar, ACP and gas shown as the offset bars) show the percentage mass recovery of each so that the sum of the three show the total mass recovery of the starting dry feedstock. The relative composition in terms of C, H, N, S, O and ash are illustrated for both the starting dry feedstock and the recovered hydrochar by the colored, stacked bars. The balance of mass is shown when the composition DOEs not add up to 100% (Note that oxygen is measured directly). The total mass that is recovered in the aqueous co-product (ACP) and gaseous phases are represented by the offset bars.
Figure 1 illustrates that much lower mass fractions were recovered as hydrochar from the algae experiments as compared to the lignocellulosic feedstocks, and that much greater mass was recovered in the ACP. At 175 °C, less than 50% of the starting mass was recovered from both LEA and whole Spirulina, while hydrochar recoveries from lignocellulosic feedstocks were greater than 70%. Hydrochar recovery was further reduced with increasing temperatures, with a larger effect seen for algae compared to the lignocellulosic feedstocks. Figure 1 also shows that much less of the carbon (solid blue bar) in the starting feedstock was recovered in the algae hydrochar in comparison with the lignocellulosic hydrochars. About 50% of the carbon is retained in the solid hydrochar from algae at 175 °C, while 80%–90% is retained after HTC treatment of lignocellulosic feedstocks. Others have shown similar results for both solid and carbon recovery for algal feedstocks [19,21]. Note also that the oxygen contents of the algae hydrochar were reduced significantly, similar to the lignocellulosic hydrochar. In addition, much of the ash constituents in the algal feedstocks were solubilized in the water, and are significantly reduced in the resulting hydrochar. Taken together, these compositional changes result in an energy densified solid, as discussed in the next section
Much of the starting algal mass is recovered as non-volatile residue (NVR) after HTC treatment, which is measured through oven drying of the ACP (the blue hashed bar in Figure 1). The ash fraction of the solid feedstock that is washed into the aqueous phase contributes to this NVR, along with other nitrogen-containing Maillard-type heterocyclic compounds and piperazinediones [20]. In a similar trend to the lignocellulosic feedstocks, the mass recovered as NVR is reduced as treatment temperature increases. This is primarily due to increases in the production of volatile compounds such as formic acid, acetic acid and furfural. Note that the only portion of ACP included in Figure 1 is the NVR; other volatiles that may be lost through oven drying are not included. Similar to treatment of lignocellulosic feedstocks, only a small amount of gas (primarily CO2) is produced at low HTC treatment temperatures.
At an HTC treatment temperature of 175 °C, nearly all of the starting algal mass is accounted for by the three recovered products. However, as the treatment temperature is increased to 215 °C, only 85% of the starting mass is accounted for. This could be due to higher amounts of water being produced (note the reduction in hydrogen), or from greater production of volatiles that were not measured, such as ammonia.
2.2. Hydrochar Products
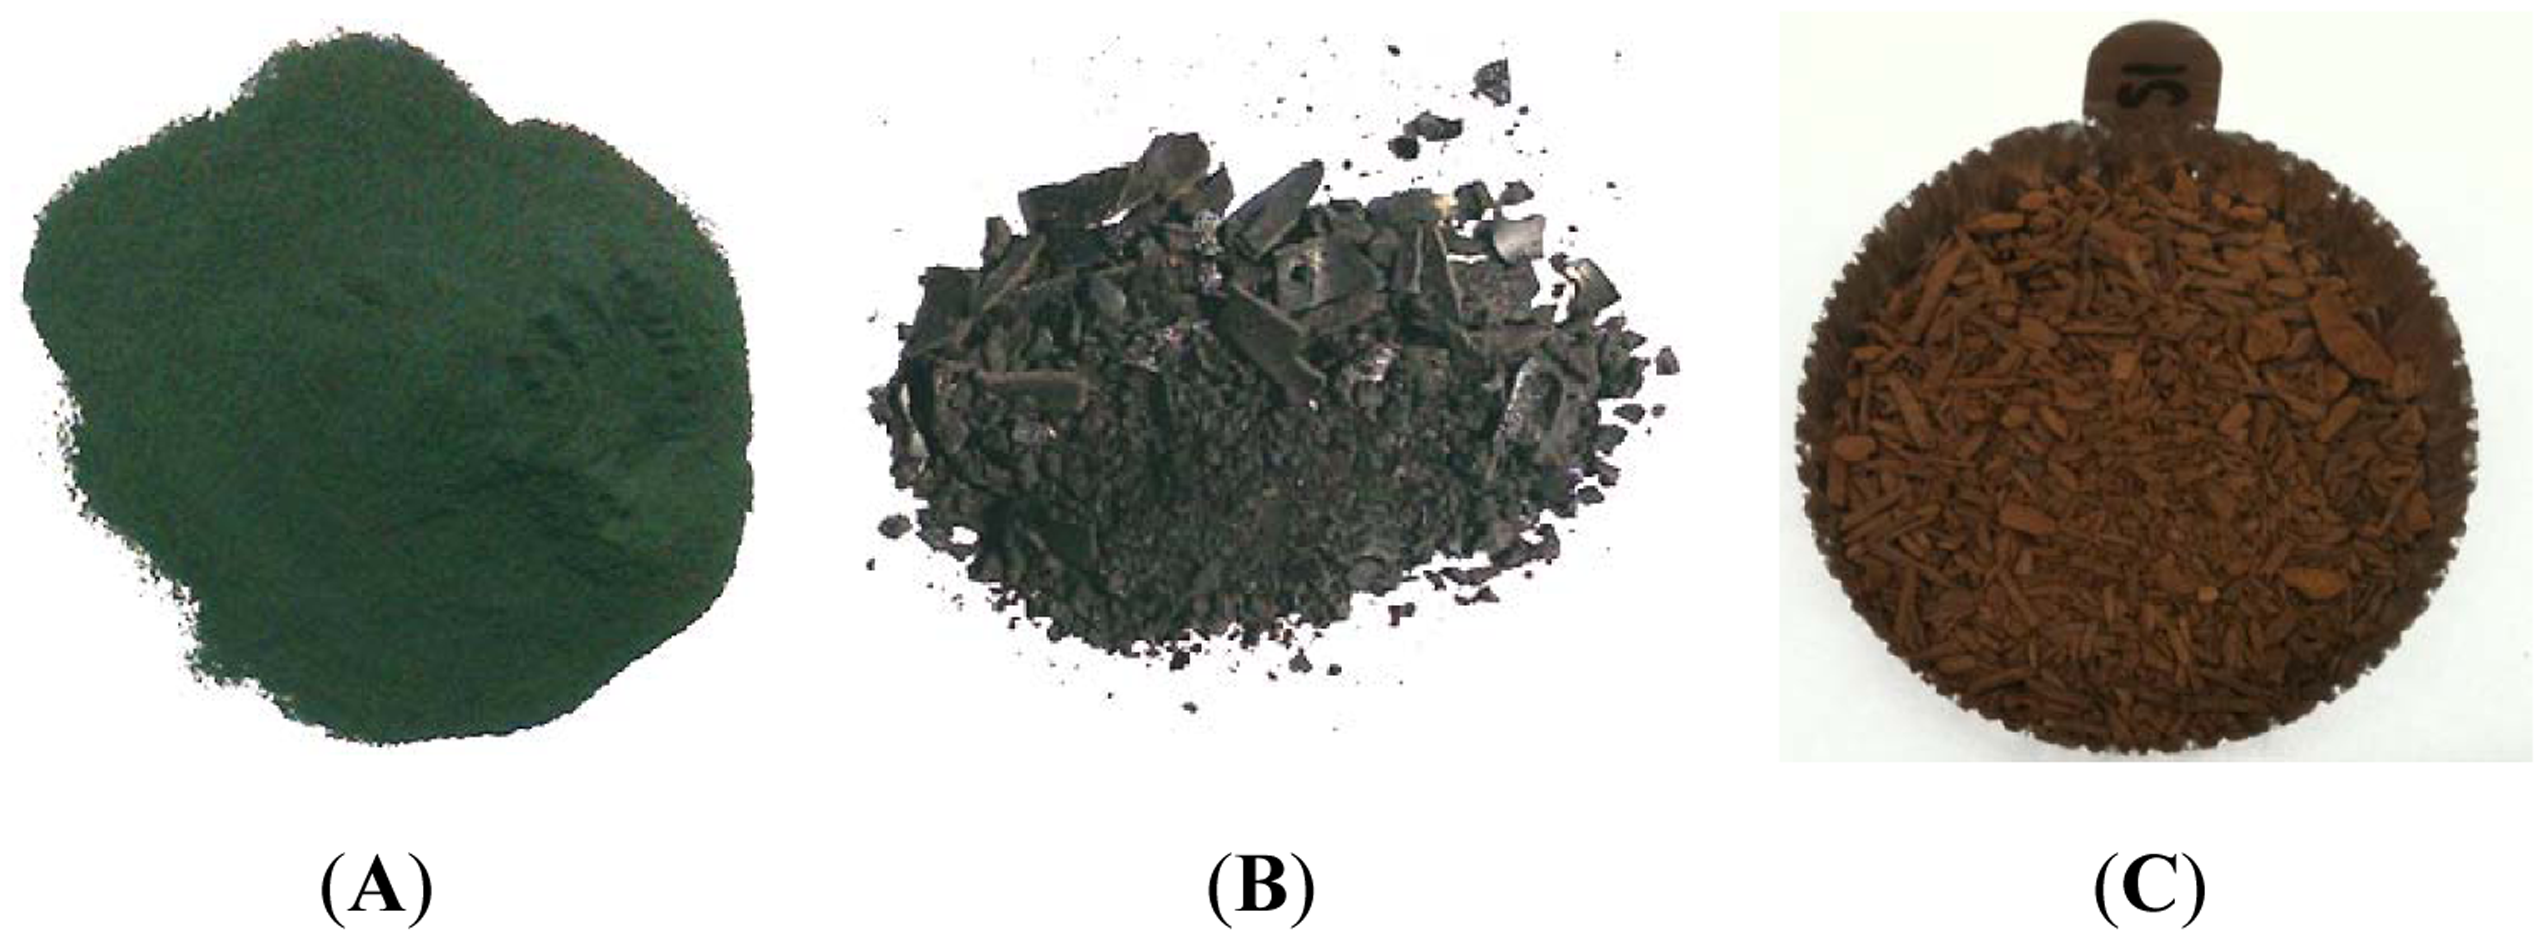
HTC of algal feedstocks produces a hydrophobic char that is easily dried and pelletized. Photographs of the Spirulina feedstock and resulting hydrochar products are shown in Figure 2, along with a photo of loblolly pine hydrochar. Results from characterization of the feedstocks and hydrochars are given in Table 2. Energy densification is defined as the energy content of the hydrochar divided by that of the starting feedstock (both on a dry basis). Energy yield is then the mass yield multiplied by the energy densification.
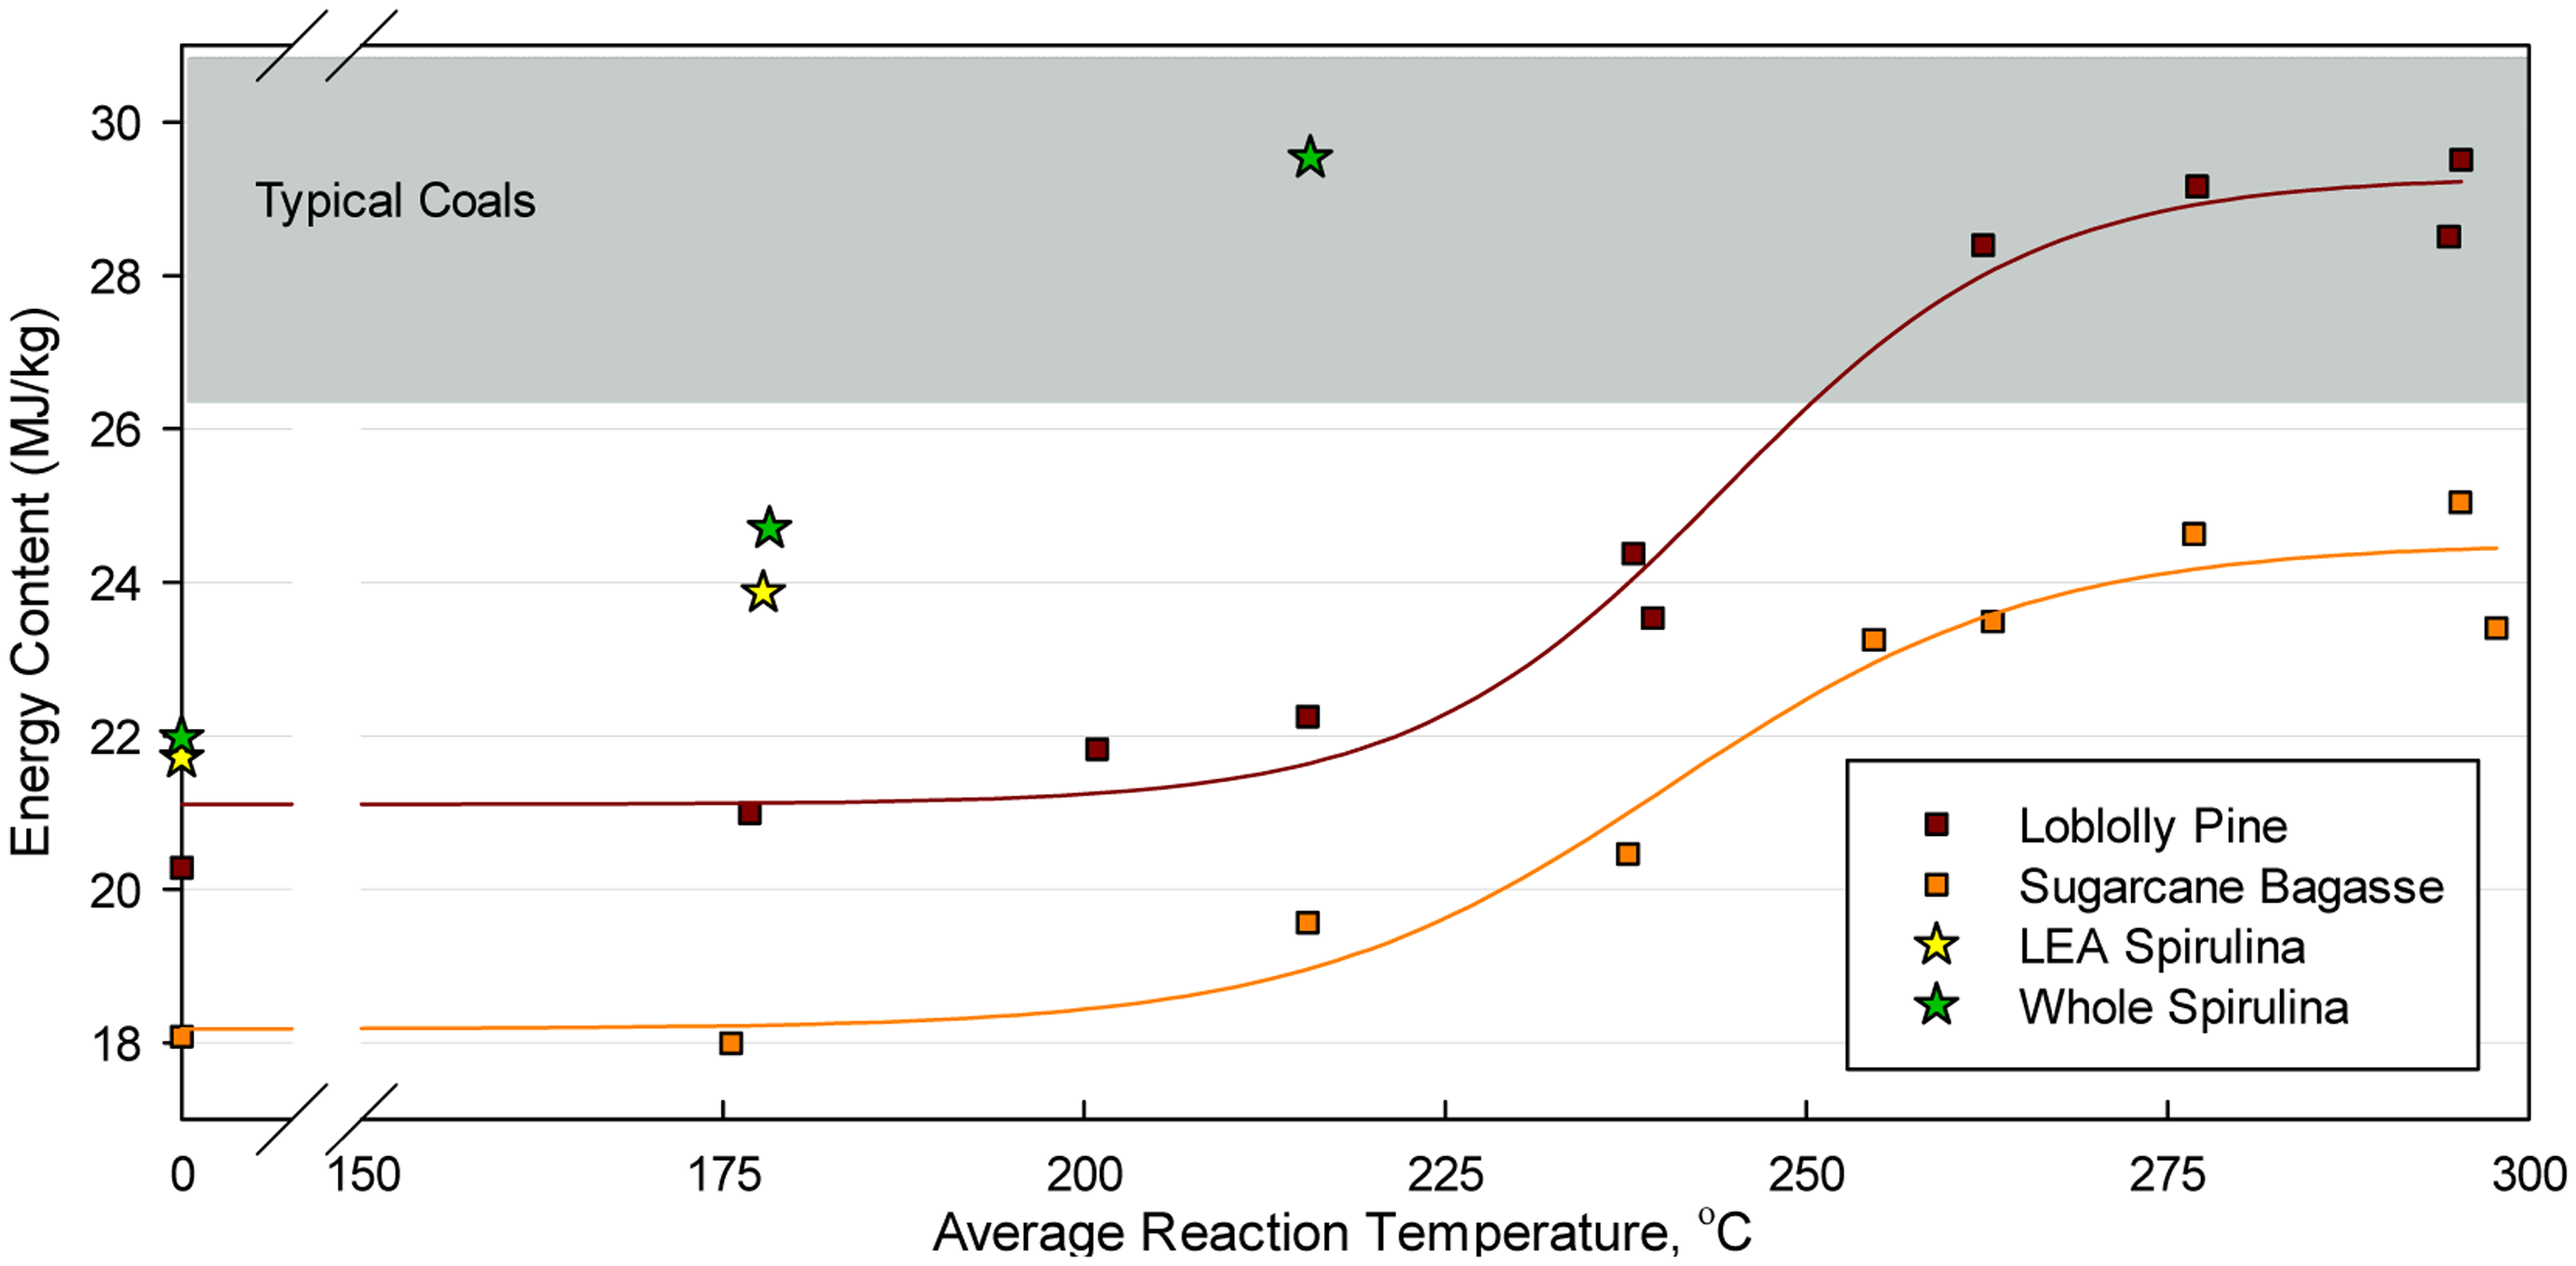
The energy content of the raw algae is similar or even higher than that of woody feedstocks we have treated previously (e.g., loblolly pine). In addition, the energy densification seen, even at these low temperatures, is much higher than for comparable treatment temperatures of lignocellulosic feedstocks. In earlier experimentation, very little energy densification of lignocellulosic hydrochar was seen at treatment temperatures less than 200 °C. For algal feedstocks, however, energy densification of around 1.1 occurred at 175 °C, while densification of 1.3 was observed at 215 °C. These results are similar to energy densification at low temperatures by Levine et al. [21]. The energy densification of Spirulina at 215 °C is equivalent to that observed from lignocellulosic feedstocks at temperatures of 255 °C or higher. Thus it appears that these algal materials can be converted to hydrochars under considerably milder HTC process conditions than required for treatment of lignocellulosic feedstocks. This is attributed in part to the lack of cellulose and lignin structures in algae (which are difficult to break down), and to the presence of high energy lipids. However, because of the low hydrochar mass recovery from algae, the overall energy yield in algal hydrochar is much lower than in lignocellulosic hydrochar.
The elemental compositions of the biomass feedstocks and hydrochar products are given in Table 2. The algal feedstocks have much lower oxygen contents than the lignocellulosic feedstocks. Consequently, the atomic O/C ratio for algae is approximately 0.4, as compared to 0.7 for lignocellulosic biomass. HTC treatment of whole Spirulina at 215 °C produced a hydrochar having an O/C ratio of 0.22, which approaches that typically associated with lignite or bituminous coal [26].
The energy contents of the biomass feedstocks and resulting hydrochars are shown in Figure 3 for treatment of both whole and LEA Spirulina, along with previous results obtained from HTC treatment of lignocellulosic biomass. The algal feedstocks treated here have slightly higher starting energy contents than the lignocellulosic feedstocks. However, substantial energy densification of the algal hydrochars was observed at much milder process conditions than required when treating lignocellulosic feedstocks.
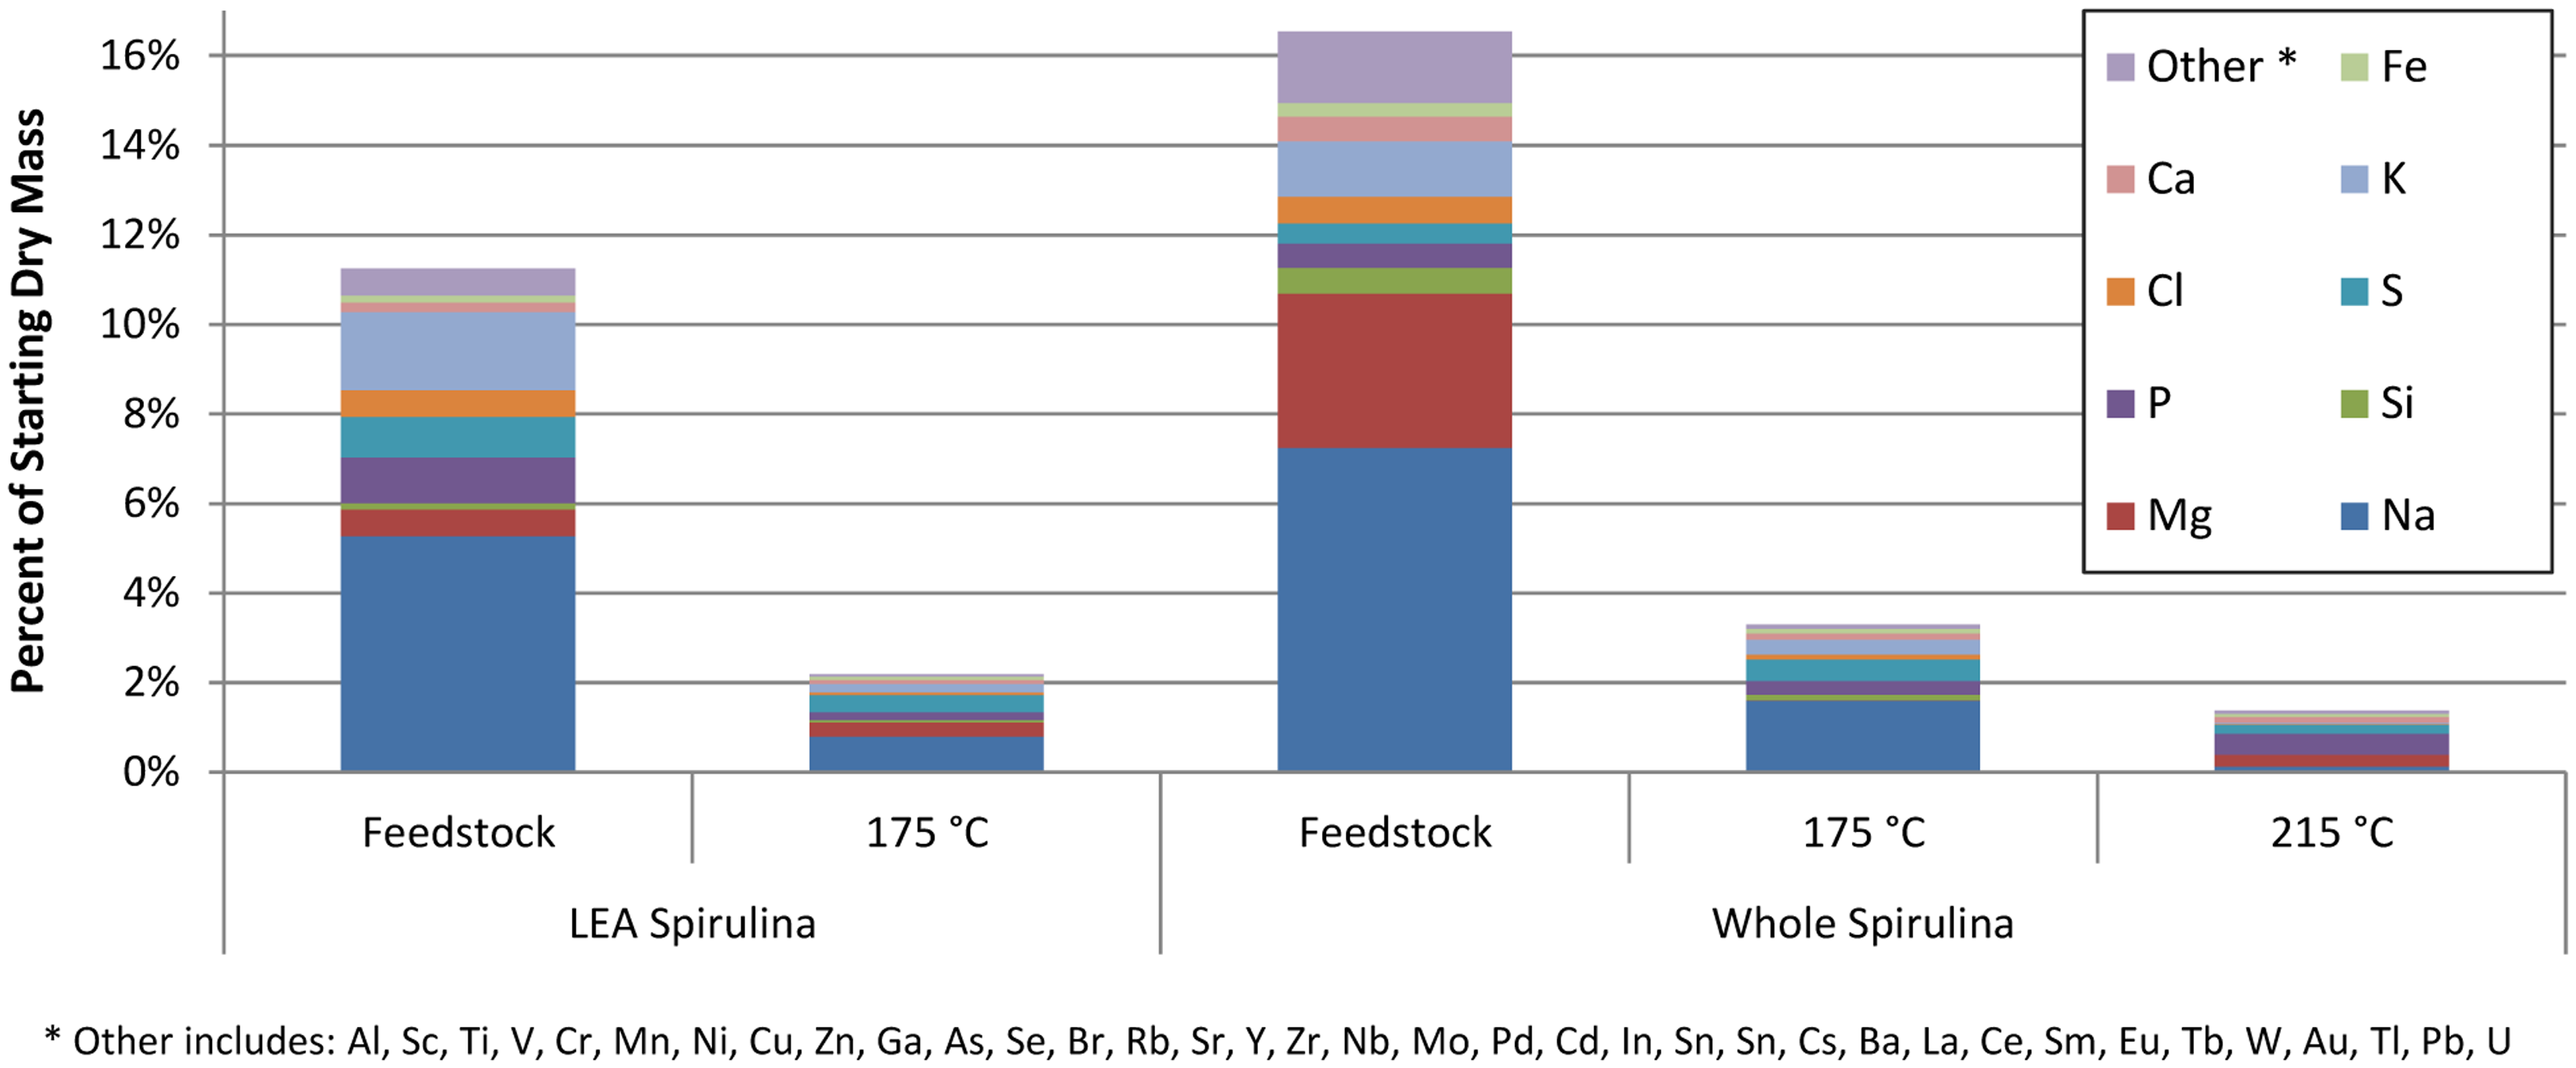
Elemental analysis was performed using X-ray fluorescence (XRF) (PANalytical, Westborough, MA, USA) on the feedstock and hydrochar from each HTC experiment to evaluate the fate of the inorganic fraction in the algal feedstock. The results are expressed as a percentage of starting dry mass and shown in Figure 4. Much of the ash constituents that are present in the starting feedstock are not seen in the solid product, indicating that the HTC process is effective in extracting some of them into the aqueous phase. At 175 °C, 80% of the inorganic fraction is removed from both whole and LEA Spirulina, while at 215 °C, 92% is removed.
This includes elements such as chlorine (10%–20%), magnesium (5%–50%) and calcium (25%–40% reduction), which have adverse effects during combustion. Reza et al. showed a reduction in inorganics by HTC of lignocellulosic feedstocks, ranging from 50% to 75% at temperatures of 200 °C [27]. Lower concentrations of silicon in Spirulina (about 0.3%) in comparison to the lignocellulosic feedstocks evaluated by Reza (1.1%–3.6%), which is largely not removed by HTC, contribute to a larger reduction in the inorganic fraction seen here. This reduction in inorganic fraction also contributes to the energy densification of the hydrochar. Figure 4 also suggests that some ash constituents were removed during the lipid extraction process. In particular, comparing the two feedstock bars in this Figure indicates that significant fractions of sodium and magnesium were removed by extraction. However, it should be noted that the XRF method of evaluation for inorganics applied here (discussed in Section 3.4) is qualitative for sodium and magnesium.
2.3. Aqueous Co-Products
To identify potential high-value chemicals in the ACP as shown in Table 1, a series of laboratory analyses were completed. These methods are further described in Section 3. A summary of these results is shown in Table 3 in comparison to similar results from HTC treatment of loblolly and sugarcane bagasse. Although much of the solid mass is recovered in the ACP as a non-volatile residue (NVR), only a small fraction of the mass is identified through multiple analyses applied. An analysis of the total organic carbon (TOC) shown in Table 3, taken with the carbon content of the solids (Table 2) and the total gases produced gives a carbon balance within 85%–90%. This is consistent with results from Levine et al., and suggests that the elemental analysis of the solids is useful to evaluate the nutrient content in the ACP [21]. The reduction in nitrogen content of the solid hydrochar therefore indicates that much of the mass in the NVR is a result of other nitrogen-containing Maillard-type heterocyclic compounds and piperazinediones [20].
The pH of the aqueous co-products (ACP) was measured after each experiment was found to be approximately 5.8, as shown in Table 3. This is considerably higher than the pH values of 3.0–3.5 that were seen from lignocellulosic feedstocks. Other volatiles, such as acetic and formic acid, were not measured in this study but are shown in Table 3 for comparison from lignocellosic feedstocks. Levine et al. [21] found that acetic acid was present in relatively high concentrations in ACP generated from HTC of algae at 200 °C. This indicates that although the exact chemical structures responsible for higher pH are unknown, it is undoubtedly related to the elevated N content of the algae feedstocks.
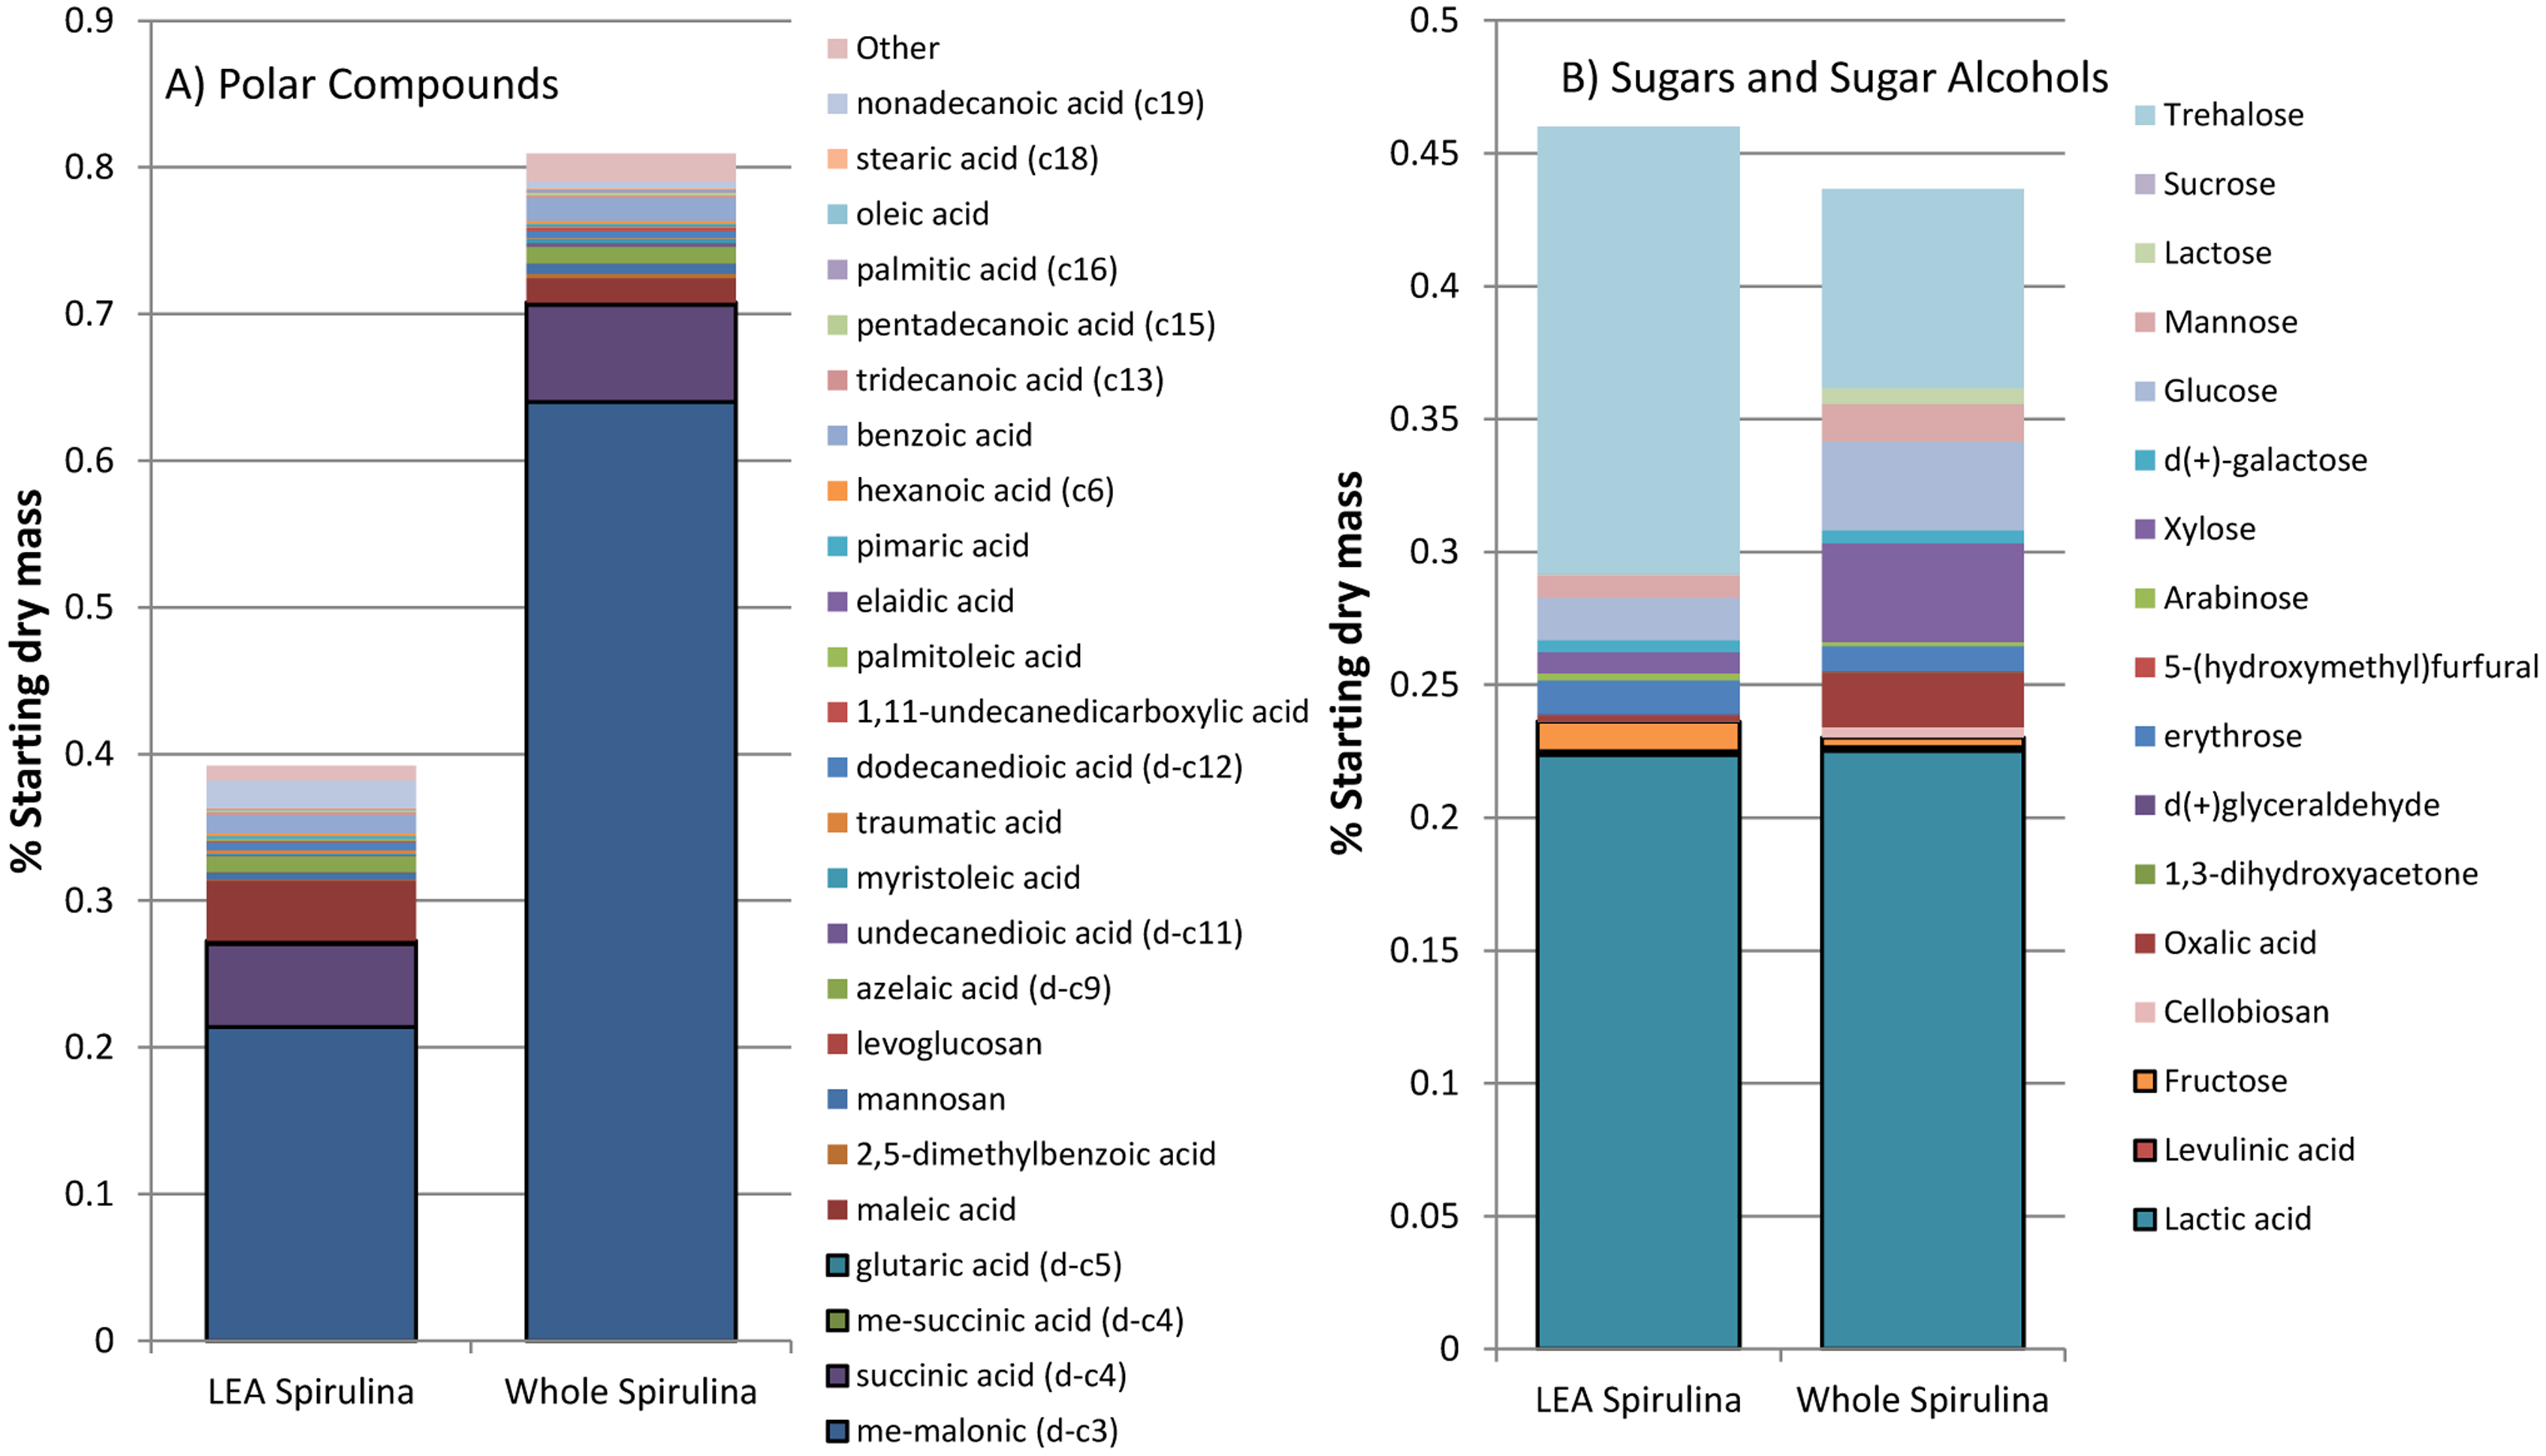
A gas chromatogram/mass sepectrometry (GC/MS) (Varian, Inc., Walnut Creek, CA, USA) analysis was performed on the aqueous product streams from whole and LEA Spirulina treated at 175 °C to identify polar compounds and sugars or sugar alcohols. The polars results are shown in Figure 5A; sugars/sugar alcohols are shown in Figure 5B. In both cases, the results are expressed as a percentage of starting dry algal mass.
Using the analysis of polar compounds, malonic, succinic and glutaric acids were detected in high concentrations relative to all species identified. However, less than 1% of the starting dry algal mass is converted into these identified species. From the sugars analysis, relatively large amounts of lactic acid were observed, with lesser amounts of trehalose and very small amounts of other sugar-related species. Although the high value sugars make up approximately 50% of the total sugars identified through this method, they are still a very small fraction of the starting dry feedstock. It is possible, however, that higher treatment temperatures would produce a greater amount of desirable chemicals. For example, maximum recovery of sugars from treatment of lignocellulosic feedstocks occurred around 230 °C, while increasing amounts of acids (such as acetic and formic acid) were produced with increasing temperatures up to 295 °C [23].
Interestingly, higher amounts of polar compounds were observed from HTC treatment of the whole algae, while approximately equivalent amounts of sugars were seen from HTC of whole and LEA Spirulina. This may be because the sugars are produced from degradation of carbohydrates (which are not removed by the extraction process used to obtain the LEA), while at least some of the polar compounds result from degradation of lipids (which are removed by extraction).
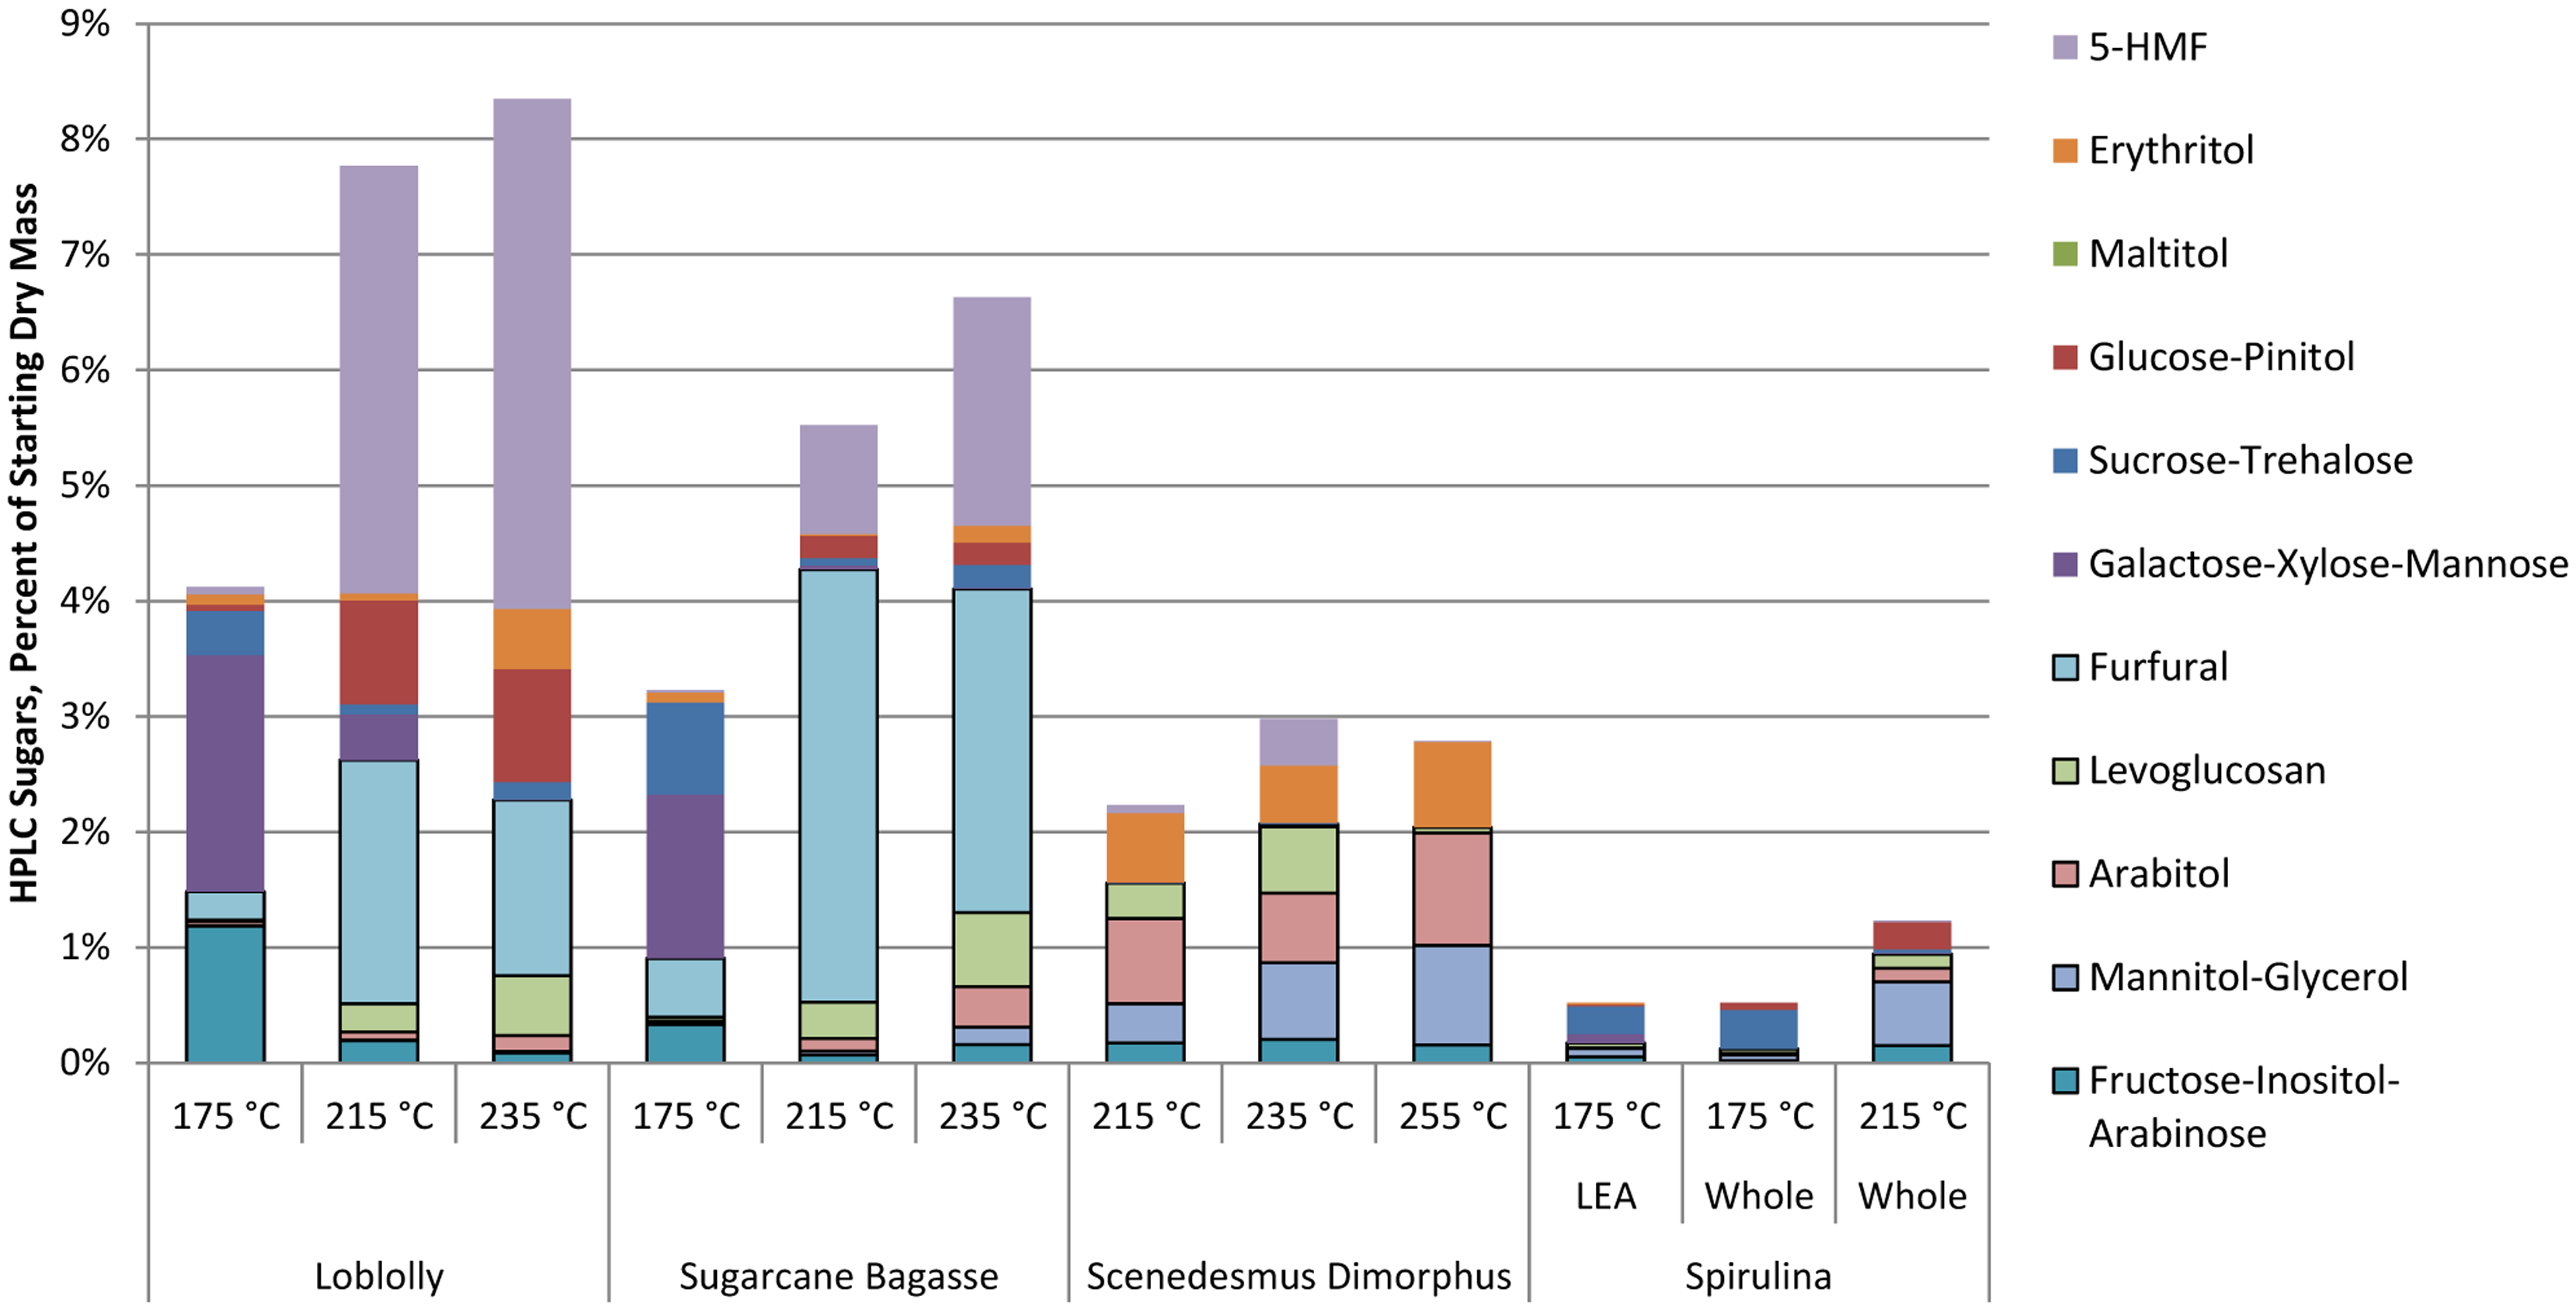
An HPLC-RI analysis [17] (Waters Corporation, Milford, MA, USA) was also applied to identify and quantify sugars in the aqueous products from HTC treatment of algae. The results are shown in Figure 6, where they are compared with results from HTC treatment of woody and herbaceous feedstocks. Sugars that are identified as high-value chemicals are outlined in this figure (note that some of these sugars co-elute using this HPLC method). For experiments using these lignocellulosic feedstocks, treatment temperatures were varied from 175 to 295 °C, although only temperatures of 235 °C and below are shown here, as they correspond more closely to the algal treatment temperatures. For the lignocellulosic feedstocks, produced sugars increased with treatment temperatures up to 235 °C, and declined at higher temperatures [23]. Sugars produced at low temperatures (175 °C) are primarily sucrose/trehalose, galactose/xylose/mannose, and fructose/inositol/arabinose. As temperatures increase, more glucose/pinitol, 5-HMF and furfural are produced. 5-HMF and furfural are by-products of cellulose degradation at these high temperatures. High value chemicals are produced in yields of 3%–4%, relative to the starting lignocellulosic feedstock mass. However, since several of the sugars co-elute, particularly those that dominate at low temperature conditions (e.g., fructose co-elutes with inositol and arabinose, and glycerol with mannitol), these yields of high-value chemicals may be slightly over-estimated.
Also shown in Figure 6 are results from earlier HTC experimentation with another algae, Scenedesmus Dimorphus. Although, not explored in detail, HPLC analyses of sugars from HTC treatment of Scenedesmus at three temperatures were performed. These results are shown in Figure 6 for comparison with the Spirulina results. Clearly, these two algae materials produced different concentrations and types of sugars, although it should be noted that most of the HTC treatments of Scenedesmus were conducted at higher temperatures than those used for Spirulina. HTC of Scenedesmus produced higher yields of high-value sugars, primarily levoglucosan, arabitol, glycerol (which co-elutes with mannitol) and fructose (which co-elutes with inositol and arabinose). Similar high-value chemicals were produced by treatment of Spirulina at 215 °C, although in lower yields. The low process temperature of 175 °C used in this work resulted in very low recovery of sugars from both whole and LEA Spirulina algae. The total mass of sugars recovered from both algae was much lower than that produced from the woody and herbaceous feedstocks. The products of cellulose degradation (furfural and 5-HMF) which dominate the total sugars from lignocellulosic feedstocks are largely absent from the algae products.
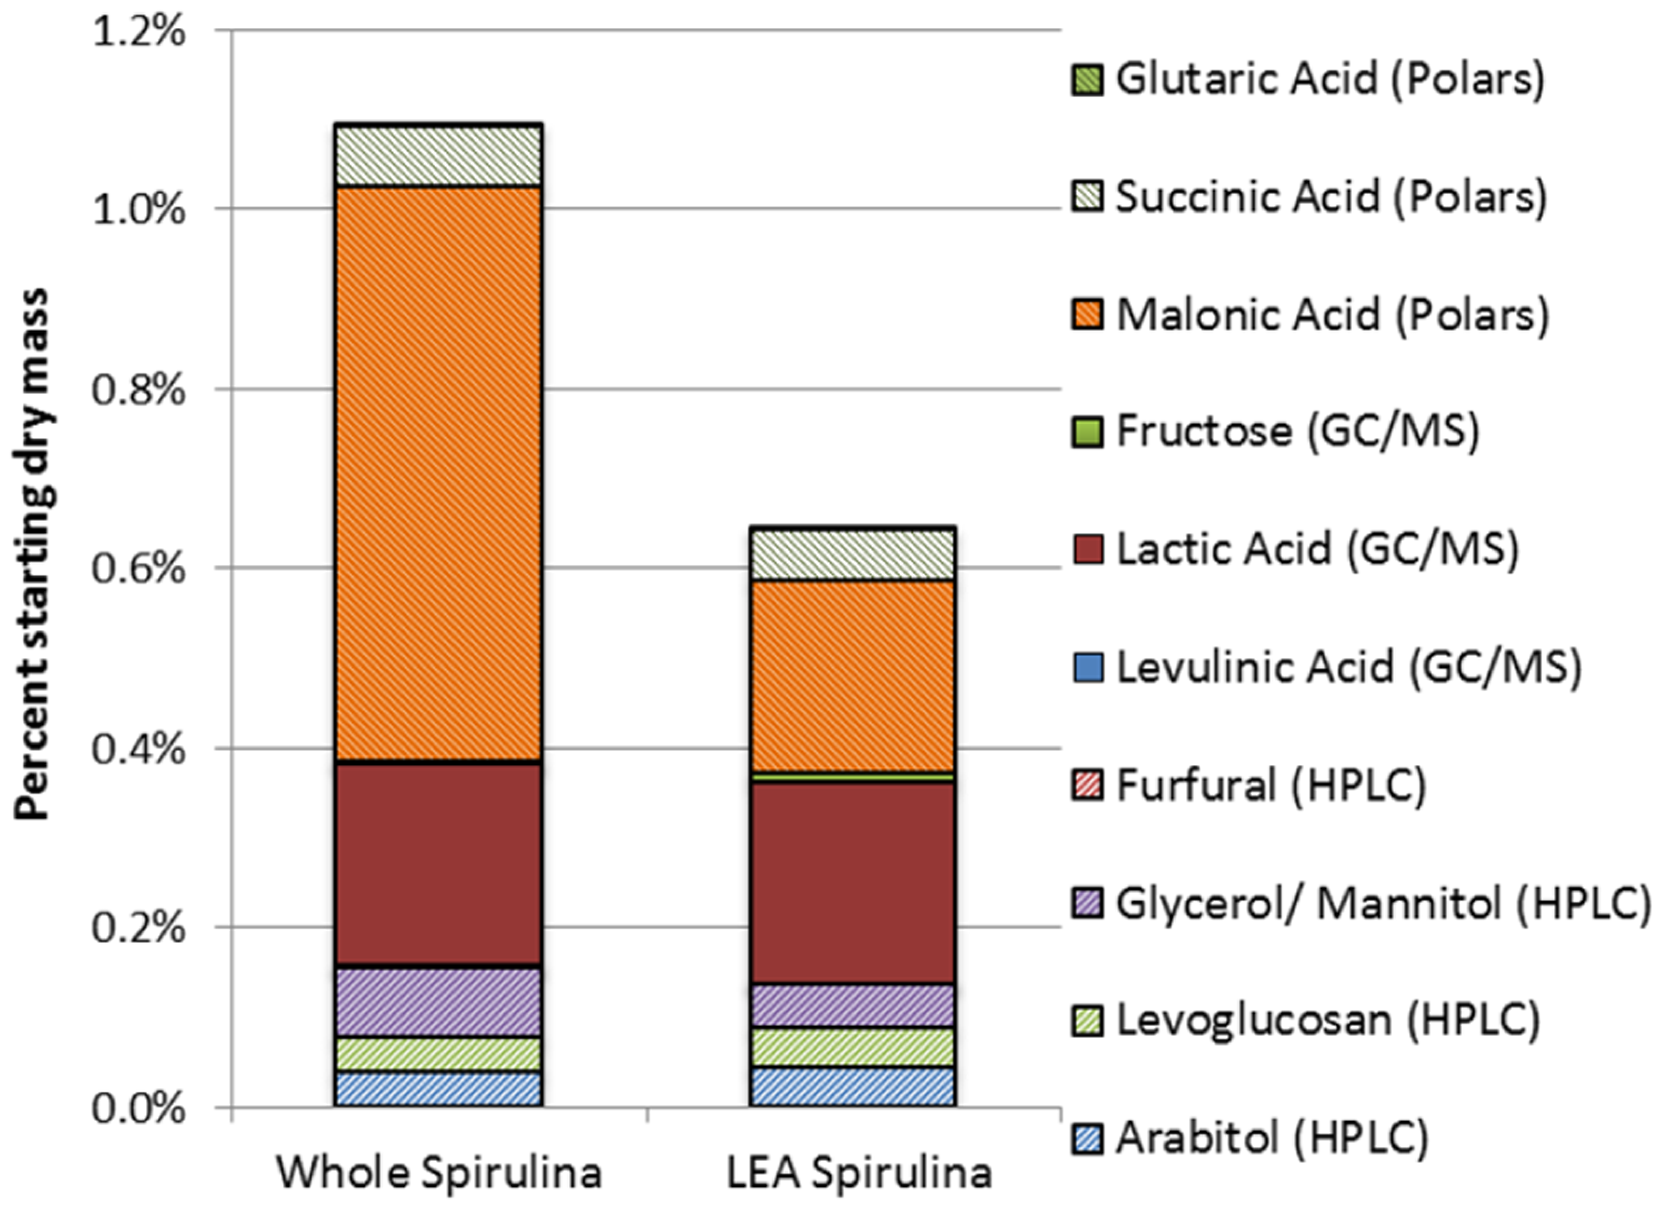
A compilation of results of identified high value chemicals from each of the methods described above is shown in Figure 7. This illustrates that only a small fraction of the starting dry algae mass is converted to high value chemicals at these low process temperatures. Due to higher concentrations of malonic acid, HTC treatment of whole Spirulina resulted in nearly twice the amount of total valuable products as did treatment of LEA Spirulina. The amounts of other high-value products identified are similar from both algal feedstocks. The primary valuable products are glycerol/mannitol, arabitol, levoglucosan, lactic acid, malonic acid and succinic acid.
3. Experimental Methodologies
3.1. Feedstock Preparation
Spirulina maxima was purchased in powdered form as a health supplement to evaluate for this study. Spirulina typically contains 6%–13% lipids, 64%–74% proteins, and 15%–20% carbohydrates [28]. To obtain the LEA fraction, samples of whole, oven-dried algae were extracted using dichloromethane and hexane in an accelerated solvent extraction (ASE) instrument, as described previously [29]. 10.0% of the dry mass of the Spirulina was extracted through this process. The residues after lipid extraction are referred to as LEA.
The Scenedesmus Dimorphus that was evaluated previously was grown in outdoor ponds in Reno, (NV, USA). After harvesting, it was dewatered and frozen. The frozen wet algae were thawed at room temperature before use in the HTC process. Due to their growing conditions, the algae accumulated high concentrations of ash resulting from fertilizer use and dust contamination.
3.2. Hydrothermal Carbonization Reactor
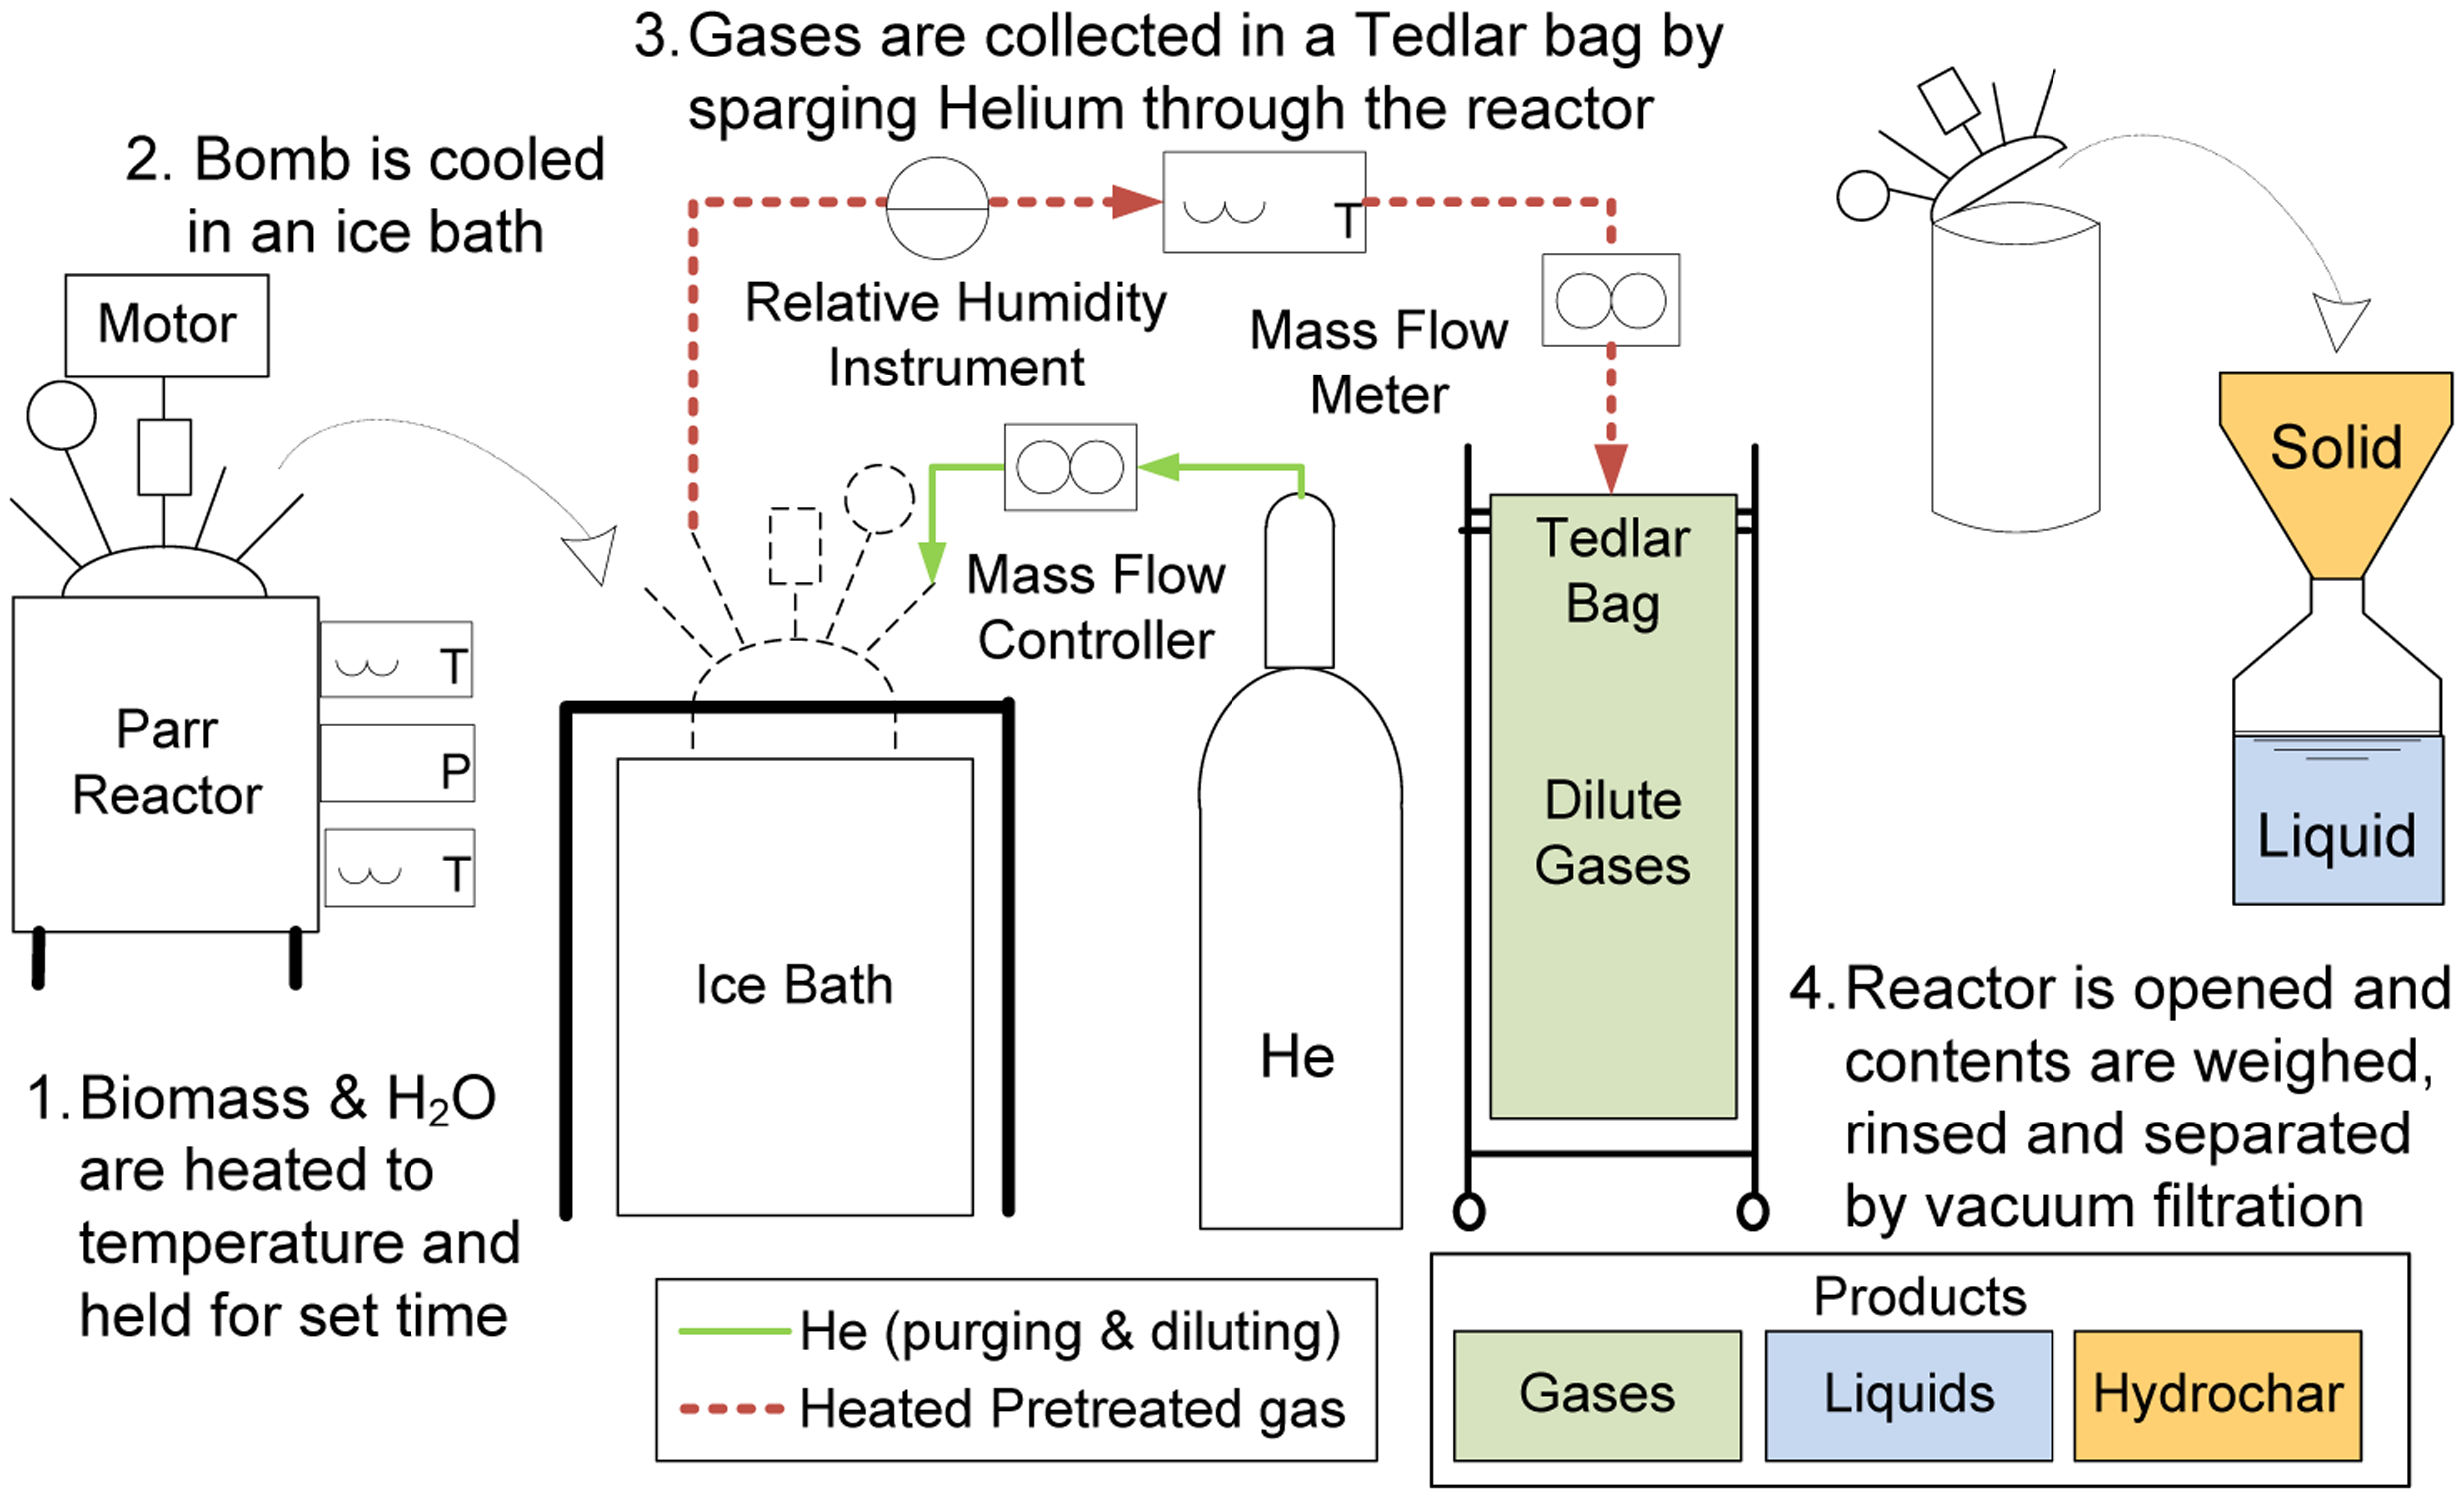
Reactions were conducted in a 2-L Parr stirred pressure reactor (Model 4522, Parr Instruments, Moline, IL, USA), as described in the literature and shown in Figure 8 [17,23]. The reactor was charged with 50–60 grams of air-dried algal feedstock material, and 500–600 grams of distilled water in a 10:1 water to biomass ratio to ensure that all algae was thoroughly mixed with water to create a thin paste.
The vessel was first sealed, de-oxygenated (by flushing with helium), and then heated to the desired temperature while stirring. The reactor temperature was controlled with a National Instruments (Austin, TX, USA) LabView data acquisition system. At the end of the reaction period, the reactor vessel was cooled by immersion in an ice bath, and the three product streams (gases, ACP, and solids) were isolated.
A vacuum filtration process is typically used to separate the solids from the ACP as illustrated in Figure 8. However, because of the algae product's very small particle size, the filter paper quickly plugged up and slowed the vacuum filtration process. Therefore, a centrifuge process was used in which the solids and ACP were first separated at 6000 rpm for 30 min. Subsequent vacuum filtration was performed on the aqueous product to separate the fine particles.
3.3. Experimental Conditions
Others have shown that effective carbonization of algae occurs at fairly mild temperatures [19,21], and that maximum recovery of sugars occurs at temperatures around 215–235 °C for a 30 min reaction time [17]. In an effort to maximize both high value chemicals and solid product recovery, a treatment temperature of 215 °C was initially selected with a 30 min hold time. An initial run of whole Spirulina at 215 °C resulted in very low hydrochar recovery. Therefore, additional experiments on whole and LEA Spirulina were completed with a target temperature of 175 °C to increase the recovery of the solid product. Replicate experiments were not performed due to limited quantities of the feedstock, therefore variability in results cannot be validated.
3.4. Product Characterization
A variety of laboratory analyses were conducted on the HTC products to compute mass balance, carbon balance, and energy densification, as well as identify high value chemicals and other product species.
3.4.1. Hydrochar and Feedstock
Similar analyses were performed on the solid hydrochar and the feedstocks. The energy content of oven-dried samples was measured using a Parr 6200 Calorimeter. Ultimate analysis (C, H, N, S, O) was performed using a Flash EA 1112 automatic elemental analyzer (ThermoElectron, Delft, The Netherlands). In order to directly measure the O content, two methods are used with two different injections, one to measure C, H, N and S, and the other to measure O [17].
To determine the amount of ash, proximate analysis was performed on the solid samples using a thermal gravimetric analyzer (Mettler Toledo TGA/DSC 1, Colombus, OH, USA). First, the samples were homogenized in an analytical mill (IKA ALL Basic, Wilmington, NC, USA) for two minutes per sample. The homogenized samples were stored in capped glass vials at room temperature until analysis. The proximate analysis was then carried out according to ASTM standard D7582-12 [30] with two differences; the volatile matter analysis was done at 700 °C instead of 950 °C, and the sample size was limited to milligram amounts because the TGA instrument was equipped with small (70 μL) alumina crucibles. Two crucible blanks were analyzed for equilibration and subtraction of buoyance effects. Succeeding crucibles containing homogenized biomass samples were half filled to reduce surface area effects on pyrolysis. Each sample was analyzed in triplicate with every nine runs having an intermittent performance working standard (Vanguard Solutions VS6-006, Ashland, KY, USA).
To perform the elemental analyses, solid particles were first re-suspended onto filters [31]. In the re-suspension process, materials are first homogenized and then sieved to <38 μm diameter (400 mesh screen), then re-suspended using a high velocity air stream, blown into a large chamber for mixing and dispersion, and collected onto filters using a modified Parallel Impactor Sampling Device (PISD, OMNI Environmental, Portland, OR, USA). The filter samples are then analyzed using a PANalytical Epsilon 5 energy dispersive X-ray fluorescence (ED-XRF) instrument (PANalytical, Westborough, MA, USA) [32]. The analyzer emits X-rays, which are focused on secondary targets and in turn emit polarized X-rays which excite a sample. Subsequent emissions of X-ray photons are integrated over time to give quantitative measurements of elements ranging from aluminum through uranium, and semi-quantitative measurements of sodium and magnesium.
3.4.2. Aqueous Co-Products
The pH and non-volatile residue (NVR) content of the ACP was measured immediately following completion of the experiments and separation of the products. The pH of the ACP was measured using a portable Hanna Instruments HI 8424 digital pH and temperature meter (Hanna Instruments, Smithfield, RI, USA). The NVR content was measured by weighing triplicate samples of the ACP into drying tins which were then placed in a convective oven at 105 °C overnight (approximately 18–20 h) to obtain an oven-dried weight. The remaining residue represents the NVR content of the ACP.
The total organic carbon (TOC) and other sugars and polars were measured on a batch of samples once all experiments were completed. The ACP solutions were stored in a laboratory refrigerator until all samples were collected. The TOC was measured using a Shimadzu TOC-VCSH instrument (Columbia, MD, USA) which catalytically oxidizes all organic compounds into CO2, which is then measured by nondispersive infrared detection (NDIR) [17]. Sugars were measured using a previously developed high-performance liquid chromatography (HPLC) method [23]. Using a Waters Alliance 2695 HPLC (Waters Corporation, Milford, MA, USA) equipped with a Waters 2414 Refractive Index Detector and Waters Sugar-Pak™ HPLC column, several sugars and sugar alcohols can be quantified, several of which are included in DOE's high value chemical list provided in Table 1. The high-value sugars identified through this method include furfural, levoglucosan and arabitol. Fructose and glycerol are also identified, although they co-elute with other sugars and are reported together.
Additional high-value chemicals were identified using GC/MS with two different analytical protocols: one called polars analysis and the other called sugars/sugar alcohols analysis [33,34]. In both cases, the compounds of interest are extracted from the whole algae, LEA, and NVR fraction of the aqueous products from HTC treatment using the ASE instrument with dichloromethane, followed by acetone. After drying, the extracted materials are derivatized using BSTFA [N,O-bis-(trimethylsilyl) trifluoroacetamide] with 1% TMCS (trimethylchlorosilane). The derivatized samples are analyzed by an electron impact GC/MS technique using a Varian 3400 GC with a model CP-8400 autosampler and interfaced to a Saturn 2000 ion trap spectrometer (Varian, Inc., Walnut Creek, CA, USA). A 30-m, DB-5 capillary column (0.25 mm ID; 0.25 μm thickness) was used for both analyses. For the sugars protocol, a set of calibration standards was used that consisted of numerous sugars, anhydrosugars, and sugar alcohols. For the polars protocol, a set of calibration standards was used that consisted of organic acids, lignin monomers, and other anhydrosugars.
3.4.3. Gases
The composition of produced gases was analyzed with an SRI 8610C gas chromatograph (GC, SRI Instruments, Torrance, CA, USA), equipped with a thermal conductivity detector using a method for measurement of H2, CO, CO2, and C1–C3 hydrocarbons as described previously [17,23]. The gases are comprised mainly of CO2, and are not discussed in detail.
4. Conclusions
Hydrothermal carbonization (HTC) was applied to algae and lipid-extracted algae (LEA) residue to produce an energy-dense solid hydrochar that is similar in energy content to low-grade coals. Algal feedstocks behave differently in HTC treatment as compared to lignocellulosic feedstocks, and require much milder conditions (treatment temperatures less than 200 °C) for acceptable levels of carbonization. These lower process temperature requirements result from the lack of lignin and cellulose structures in algae, which require higher process temperatures to break down in lignocellulosic feedstocks. However, much lower amounts of the starting algal feedstock is recovered as a solid hydrochar, while more of the mass is recovered in the aqueous phase products. In part, the reduction of solid mass recovery and increase in aqueous products is due the removal of ash constituents which are dissolved into the aqueous co-product. This ash reduction also contributes to increased energy content of the hydrochar, which results in higher energy densification of algal hydrochars relative to hydrochars produced from treatment of lignocellulosic feedstocks at comparable temperatures.
The aqueous co-products (ACP) from HTC of whole algae and LEA algae were also evaluated to identify high-value chemicals. Although there was a very large amount of non-volatile residue (NVR) in the aqueous phase from treatment of the algal materials as compared to treatment of lignocellulosic feedstocks, only a small fraction of the ACP was identified through the various methods used. Using three different methods to characterize ACP, approximately 1% of the starting dry mass was identified as high value chemicals from the treatment of Spirulina. The total organic carbon in the ACP accounts for less than half of the dissolved mass, but the elemental balance of the solids indicates that much of the unidentified dissolved solids are nitrogen-containing compounds. Results from earlier, more limited experimentation with Scenedesmus Dimorphus showed that different amounts and types of sugars are produced from HTC treatment of a different strain of algae. Overall, higher concentrations of high-value chemicals were identified in the ACP from Scenedesmus. However, it should be noted that the two algae treated by HTC came from two different sources: the Spirulina was purchased from a health food supplier while the Scenedesmus was grown in local ponds. The different processing and handling histories of the two algae could contribute to the observed differences in their behaviors.
Despite the lipid extraction, the sugar-related products from HTC treatment of LEA and whole algae were quite similar. Energy densification of the hydrochars was also similar. However, a lower fraction of high-value chemicals was observed in the ACP from LEA, as compared to whole algae. Overall, the results of this study indicate that HTC can produce both an energy-dense hydrochar at much milder conditions than those required for lignocellulosic feedstocks, as well as a valuable aqueous product stream from whole and lipid-extracted algae. Relatively mild treatment temperatures were applied, and it is possible that additional high value chemicals could be produced as treatment temperatures are increased.
Acknowledgments
We gratefully acknowledge Andrew Warren for his contribution to the laboratory work and funding from DRI's (Desert Research Institute) Institute Project Assignment (IPA) committee. We also acknowledge Barbara Zielinska of DRI for her GC/MS analysis of the HTC products. We would also like to thank John Cushman and Sage Hiibel at University of Nevada, Reno for growing and supplying Scenedesmus Dimorphus.
Conflicts of Interest
The authors declare no conflict of interest.
References
- Hu, Q.; Sommerfeld, M.; Jarvis, E.; Ghirardi, M.; Posewitz, M.; Seibert, M.; Darzins, A. Microalgal triacylglycerols as feedstocks for biofuel production: Perspectives and advances. Plant J. 2008, 54, 621–639. [Google Scholar]
- Pienkos, P.T.; Darzins, A. The promise and challenges of microalgal-derived biofuels. Biofuels Bioprod. Biorefining 2009, 3, 431–440. [Google Scholar]
- Brennan, L.; Owende, P. Biofuels from microalgae—A review of technologies for production, processing, and extractions of biofuels and co-products. Renew. Sustain. Energy Rev. 2010, 14, 557–577. [Google Scholar]
- Mata, T.M.; Martins, A.A.; Caetano, N. Microalgae for biodiesel production and other applications: A review. Renew. Sustain. Energy Rev. 2010, 14, 217–232. [Google Scholar]
- U.S. DOE Office of Energy Efficiency and Renewable Energy Biomass Program. National Algal Biofuels Technology Roadmap; U.S. DOE Office of Energy Efficiency and Renewable Energy Biomass Program: Washington, DC, USA, 2010; pp. 1–140. [Google Scholar]
- U.S. DOE Office of the Biomass Program. Biomass Multi-Year Program Plan; U.S. DOE Office of Energy Efficiency and Renewable Energy Biomass Program: Washington, DC, USA, 2009. [Google Scholar]
- Website of National Biodiesel Board. Available online: http://www.biodiesel.org (accessed on 25 February 2013).
- U.S. Congress. H.R.6:Energy Independence and Security Act of 2007; U.S. Congress: Washington, DC, USA, 2007; pp. 110–140. [Google Scholar]
- Ehimen, E.; Sun, Z.; Carrington, C.; Birch, E.; Eaton-Rye, J. Anaerobic digestion of microalgae residues resulting from the biodiesel production process. Appl. Energy 2011, 88, 3454–3463. [Google Scholar]
- Davis, R.; Fishman, D.; Frank, E.D.; Wigmosta, M.S.; Aden, A.; Coleman, A.M.; Pienkos, P.T.; Skaggs, R.J.; Venteris, E.R.; Wang, M.Q. Renewable Diesel from Algal Lipds: An Integrated Baseline for Cost, Emissions, and Resource Potential from a Harmonized Model; U.S. DOE Office of Energy Efficiency and Renewable Energy: Washington, DC, USA, 2012. [Google Scholar]
- Sialve, B.; Bernet, N.; Bernard, O. Anaerobic digestion of microalgae as a necessary step to make microalgal biodiesel sustainable. Biotechnol. Adv. 2009, 27, 409–416. [Google Scholar]
- Jena, U.; Das, K.C. Comparative evaluation of thermochemical liquefaction and pyrolysis for bio-oil production from microalgae. Energy Fuels 2011, 25, 5472–5482. [Google Scholar]
- Jena, U.; Das, K.C.; Kastner, J.R. Effect of operating conditions of thermochemical liquefaction on biocrude production from Spirulina platensis. Bioresour. Technol. 2011, 102, 6221–6229. [Google Scholar]
- Peterson, A.A.; Vogel, F.; Lachance, R.P.; Froling, M.; Antal, M.J.; Tester, J.W. Thermochemical biofuel production in hydrothermal media: A review of sub- and supercritical water technologies. Energy Environ. Sci. 2008, 1, 32–65. [Google Scholar]
- Funke, A.; Ziegler, F. Hydrothermal carbonization of biomass: A summary and discussion of chemical mechanisms for process engineering. Biofuels Bioprod. Biorefining 2010, 4, 160–177. [Google Scholar]
- Yan, W.; Hastings, J.T.; Acharjee, T.C.; Coronella, C.J.; Vasquez, V.R. Mass and energy balances of wet torrefaction of lignocellulosic biomass. Energy Fuels 2010, 24, 4738–4742. [Google Scholar]
- Hoekman, S.K.; Broch, A.; Robbins, C. Hydrothermal carbonization (HTC) of lignocellulosic biomass. Energy Fuels 2011, 25, 1802–1810. [Google Scholar]
- Gao, Y.; Wang, X.; Wang, J.; Li, X.; Cheng, J.; Yang, H.; Chen, H. Effect of residence time on chemical and structural properties of hydrochar obtained by hydrothermal carbonization of water hyacinth. Energy 2013, 58, 376–383. [Google Scholar]
- Heilmann, S.M.; Davis, H.T.; Jader, L.R.; Lefebvre, P.A.; Sadowsky, M.J.; Schendel, F.J.; von Keitz, M.G.; Valentas, K.J. Hydrothermal carbonization of microalgae. Biomass Bioenergy 2010, 34, 875–882. [Google Scholar]
- Heilmann, S.M.; Jader, L.R.; Harned, L.A.; Sadowsky, M.J.; Schendel, F.J.; Lefebvre, P.A.; von Keitz, M.G.; Valentas, K.J. Hydrothermal carbonization of microalgae II: Fatty acid, char, and algal nutrient products. Appl. Energy 2011, 88, 3286–3290. [Google Scholar]
- Levine, R.B.; Sierra, C.O.S.; Hockstad, R.; Obeid, W.; Hatcher, P.G.; Savage, P.E. The use of hydrothermal carbonization to recycle nutrients in algal biofuel production. Environ. Prog. Sustain. Energy 2013, 32, 962–975. [Google Scholar]
- Liu, Z.; Quek, A.; Hoekman, S.K.; Srinivasan, M.P.; Balasubramanian, R. Thermogravimetric investigation of hydrochar-lignite co-combustion. Bioresour. Technol. 2012, 123, 646–652. [Google Scholar]
- Hoekman, S.K.; Broch, A.; Robbins, C.; Zielinska, B.; Felix, L.G. Hydrothermal carbonization (HTC) of selected woody and herbaceous biomass feedstocks. Biomass Convers. Biorefin. 2013, 3, 113–126. [Google Scholar]
- Jena, U.; Vaidyanathan, N.; Chinnasamy, S.; Das, K.C. Evaluation of microalgae cultivation using recovered aqueous co-product from thermochemical liquefaction of algal biomass. Bioresour. Technol. 2011, 102, 3380–3387. [Google Scholar]
- U.S. Department of Energy. Top Value Added Chemicals from Biomass. Volume 1: Results of Screening for Potential Candidates from Sugars and Synthesis Gas; U.S. Department of Energy: Washington, DC, USA, 2004. [Google Scholar]
- Ruyter, H.P. Coalification model. Fuel 1982, 61, 1182–1187. [Google Scholar]
- Reza, M.T.; Lynam, J.G.; Uddin, M.H.; Coronella, C.J. Hydrothermal carbonization: Fate of inorganics. Biomass Bioenergy 2013, 49, 86–94. [Google Scholar]
- Cohen, Z. The Chemicals of Spirulina. In Spirulina Platensis (Arthrospira): Physiology, Cell-Biology and Biotechnology; Avigad, V., Ed.; Taylor and Francis: Bristol, PA, USA, 1997; pp. 175–204. [Google Scholar]
- Samburova, V.; Lemos, M.S.; Hiibel, S.; Hoekman, S.K.; Cushman, J.C.; Zielinska, B. Analysis of triacylglycerols and free fatty acids in algae using ultra-performance liquid chromatography mass spectrometry. J. Am. Oil Chem. Soc. 2013, 90, 53–64. [Google Scholar]
- American Society for Testing and Materials. Standard Test Methods for Proximate Analysis of Coal and Coke by Macro Thermogravimetric Analysis; ASTM D7582-12; ASTM International: West Conshohocken, PA, USA, 2012. [Google Scholar]
- Chow, J.C.; Watson, J.G.; Houck, J.E.; Pritchett, L.C.; Rogers, C.F.; Frazier, C.A.; Egami, R.T.; Ball, B.M. A laboratory resuspension chamber to measure fugitive dust size distributions and chemical compositions. Atmos. Environ. 1994, 28, 3463–3481. [Google Scholar]
- Watson, J.G.; Chow, J.C.; Frazier, C.A. Chapter 2: X-ray Fluorescence Analysis of Ambient Air Samples. In Elemental Analysis of Airborne Particles; Landsberger, S., Creatchman, M., Eds.; Gordon and Breach Science: Amsterdam, The Netherlands, 1999; Volume 1. [Google Scholar]
- Mazzoleni, L.R.; Zielinska, B.; Moosmüller, H. Emissions of levoglucosan, methoxy phenols, and organic acids from prescribed burns, laboratory combustion of wildland fuels, and residential wood combustion. Enivron. Sci. Technol. 2007, 41, 2115–2122. [Google Scholar]
- Zhang, Y.; Obrist, D.; Zielinska, B.; Gertler, A.W. Particulate emissions from different types of biomass burning. Atmos. Environ. 2013, 72, 27–35. [Google Scholar]


| Carbon number | Potential top 30 candidates | Others not in the top 30 |
|---|---|---|
| 1 | Carbon monoxide (+ hydrogen = syngas). | Formic acid, methanol, carbon dioxide |
| 2 | None | Acetaldehyde, acetic acid and anhydride, ethanol, glycine, oxalic acid, ethylene glycol, ethylene oxide |
| 3 | Glycerol, 3-hydroxypropionic acid, lactic acid, malonic acid, propionic acid, serine | Alanine, acetone |
| 4 | Acetoin, aspartic acid, fumaric acid, 3-hydroxybutyrolactone, malic acid, succinic acid, threonine | Butanol |
| 5 | Arabinitol (arabitol), furfural, glutamic acid, itaconic acid, levulinic acid, proline, xylitol, xylonic acid | Glutaric acid |
| 6 | Aconitic acid, citric acid, 2,5-furan dicarboxylic acid, glucaric acid, lysine, levoglucosan, sorbitol | Adipic acid, ascorbic acid, fructose, kojic and comeric acid |
| Set Temp. (°C) | Energy content (MJ/kg) | Mass yield (%) | Energy densification | Energy yield (%) | %C | %H | %N | %O | O/C Ratio | Ash% |
|---|---|---|---|---|---|---|---|---|---|---|
| Whole Spirulina | ||||||||||
| F/S | 21.98 | – | – | – | 49.6 | 6.9 | 11.2 | 25.7 | 0.39 | 5.2 |
| 175 | 24.70 | 49.3 | 1.12 | 55.4 | 55.3 | 7.4 | 10.9 | 24.4 | 0.33 | 2.4 |
| 215 | 29.53 | 23.3 | 1.34 | 31.3 | 61.9 | 7.9 | 7.8 | 17.8 | 0.22 | 3.2 |
| LEA Spirulina | ||||||||||
| F/S | 21.71 | – | – | – | 47.7 | 6.6 | 11.9 | 26.4 | 0.41 | 5.3 |
| 175 | 23.87 | 44.6 | 1.10 | 49.0 | 53.4 | 7.3 | 12.4 | 25.7 | 0.36 | 1.9 |
| Loblolly Pine | ||||||||||
| F/S | 20.28 | – | – | – | 49.3 | 5.8 | 0.03 | 44.9 | 0.68 | NM |
| 175 | 21.00 | 77.7 | 1.04 | 80.5 | 52.2 | 6.0 | 0.01 | 40.1 | 0.58 | NM |
| 215 | 22.25 | 72.4 | 1.10 | 79.5 | 54.8 | 7.1 | 0.00 | 39.5 | 0.54 | NM |
| Sugarcane Bagasse | ||||||||||
| F/S | 18.08 | – | – | – | 46.8 | 5.5 | 0.27 | 46.1 | 0.74 | NM |
| 175 | 17.99 | 69.6 | 0.98 | 67.9 | 48.3 | 5.7 | 0.13 | 46.5 | 0.72 | NM |
| 215 | 19.57 | 63.8 | 1.06 | 67.7 | 48.4 | 4.8 | 0.17 | 35.9 | 0.56 | NM |
Note: All results are expressed on a dry basis. Loblolly and Sugarcane bagasse results from [23]. Sulfur was below detection limits in all cases, so is not shown. F/S = feedstock; NM = not measured.
| Conditions (°C) | NVR (%) | TOC (%) | HPLC | GCMS | Other Volatiles 2 (%) | pH | ||
|---|---|---|---|---|---|---|---|---|
| Non-volatile sugars (%) | Volatile Sugars 1 (%) | Polars (%) | Sugars/Sugar Acids (%) | |||||
| Whole Spirulina | ||||||||
| 175 | 48.40 | 17.80 | 0.52 | 0.00 | 0.81 | 0.44 | NM | 5.8 |
| 215 | 60.20 | 27.60 | 1.23 | 0.02 | NM | NM | NM | 5.9 |
| LEA Spirulina | ||||||||
| 175 | 54.50 | 17.80 | 0.52 | 0.00 | 0.39 | 0.46 | NM | 5.8 |
| Loblolly Pine | ||||||||
| 175 | 16.90 | 16.90 | 3.82 | 0.31 | NM | NM | 0.6 | 3.7 |
| 215 | 5.59 | 5.60 | 1.96 | 5.81 | NM | NM | 2.7 | 3.1 |
| Sugarcane Bagasse | ||||||||
| 175 | 20.48 | 9.70 | 2.70 | 0.54 | NM | NM | 1.4 | 4.0 |
| 215 | 9.86 | 10.80 | 0.83 | 4.69 | NM | NM | 4.9 | 3.5 |
Note: Results are expressed as a percentage of starting dry mass. Loblolly and Sugarcane bagasse results from [23]. NM = not measured.1Volatiles measured by HPLC include furfural and 5-HMF;2Other volatiles include acetic and formic acids, measured by Ion Chromatography (not done in this study).
© 2014 by the authors; licensee MDPI, Basel, Switzerland. This article is an open access article distributed under the terms and conditions of the Creative Commons Attribution license ( http://creativecommons.org/licenses/by/3.0/).
Share and Cite
Broch, A.; Jena, U.; Hoekman, S.K.; Langford, J. Analysis of Solid and Aqueous Phase Products from Hydrothermal Carbonization of Whole and Lipid-Extracted Algae. Energies 2014, 7, 62-79. https://doi.org/10.3390/en7010062
Broch A, Jena U, Hoekman SK, Langford J. Analysis of Solid and Aqueous Phase Products from Hydrothermal Carbonization of Whole and Lipid-Extracted Algae. Energies. 2014; 7(1):62-79. https://doi.org/10.3390/en7010062
Chicago/Turabian StyleBroch, Amber, Umakanta Jena, S. Kent Hoekman, and Joel Langford. 2014. "Analysis of Solid and Aqueous Phase Products from Hydrothermal Carbonization of Whole and Lipid-Extracted Algae" Energies 7, no. 1: 62-79. https://doi.org/10.3390/en7010062