Article

Non-Destructive Analysis of Degradation Mechanisms in Cycle-Aged Graphite/LiCoO2 Batteries

School of Electrical Engineering and Automation, Harbin Institute of Technology, Harbin 150001, Heilongjiang, China
*
Author to whom correspondence should be addressed.
Energies 2014, 7(10), 6282-6305; https://doi.org/10.3390/en7106282
Submission received: 25 July 2014 / Revised: 13 September 2014 / Accepted: 23 September 2014 / Published: 29 September 2014
(This article belongs to the Special Issue Electrochemical Energy Storage—Battery and Capacitor)

Abstract

:
Non-destructive analysis of degradation mechanisms can be very beneficial for the prognostics and health management (PHM) study of lithium-ion batteries. In this paper, a type of graphite/LiCoO2 battery was cycle aged at high ambient temperature, then 25 parameters of the multi-physics model were identified. Nine key parameters degraded with the cycle life, and they were treated as indicators of battery degradation. Accordingly, the degradation mechanism was discussed by using the multi-physics model and key parameters, and the reasons for capacity fade and the internal resistance increase were analyzed in detail. All evidence indicates that the formation reaction of the solid electrolyte interface (SEI) film is the main cause of battery degradation at high ambient temperature.

1. Introduction

For the prognostics and health management (PHM) study of lithium-ion batteries, knowledge about the degradation mechanism under a certain operating condition is indispensable [1,2]. There are two types of methods existing for analyzing the degradation mechanism of lithium-ion batteries: one is the post-mortem method [3,4,5,6,7], and the other is based on battery performance analysis [8,9,10,11,12,13,14,15]. The first type of method can achieve the aging mechanism directly using some advanced instruments and test methods (such as scanning electron microscope (SEM), X-ray diffraction (XRD), transmission electron microscopy (TEM), X-ray photoelectron spectroscopy (XPS), etc.) after disassembling an aged battery [4,6]. It can address the detailed situation of the degraded active material and electrolyte, but the costs are high. In addition, the first method cannot be applied to in-use batteries due to the destructiveness. The second type of method is much easier and non-destructive, and a wealth of information can be achieved. In [8,9,10], the incremental capacity (IC or dQ/dV) and differential voltage (DV or dV/dQ) analysis are used to analyze the capacity fade and resistance increase. They can be also used to yield a quantitative assessment of different degradation modes via a diagnostic and prognostic model. In [11,12,13,14], the empirical calendar and cycle life model are developed using the degradation data of capacity and internal resistance; the degradation mechanism is also deduced based on the experimental data. Those literature works provide a rich background of the non-destructive analysis of degradation mechanisms for lithium-ion batteries, and the quantitative methods are also instructive and meaningful to our research.
Another non-destructive method is to analyze the electrochemical mechanisms using identified model parameters. There are two types of battery models, one is the equivalent circuit model (ECM), and the other is the electrochemical model. The ECMs have been successfully used for state of charge (SOC) estimation [16,17], but the model parameters are lumped circuit parameters and are hardly used for mechanism analysis. Electrochemical modeling can address the complex mechanisms of physical and chemical processes, such as diffusion, transport of ions, ohmic phenomena, electrochemical reaction and thermal behaviors [18,19,20,21]. They have a large set of parameters with corresponding physical meaning, which makes them very suitable for the study of degradation mechanisms.
In recent years, non-destructive degradation mechanism analysis based on electrochemical model parameters has attracted many researchers. In [22,23,24], the stoichiometric number of the electrode material is used to indicate the stages of capacity fade. Schmidt et al. [25] investigated the relationship between the volume fraction of active material in the electrode (εs), the ionic conductivity of the electrolyte (κe) and the cycle number during aging, and they used them as the characteristics to evaluate the state of health (SOH) of batteries. Ramadesigan et al. [26] found that both the electrochemical reaction rate (ks,a) and the Li+ diffusion coefficient (Ds,a) in the anode degrade with cycle number following a power-law. Fu et al. [27] treated some parameters of an electrochemical thermal model as degradation parameters to analyze the degradation effects considering side reactions, including the volume fraction of active material in the electrode, the solid electrolyte interface (SEI) resistance (Rfilm) and the diffusion coefficient of the electrolyte (De). These papers identified some isolated relationships between a limited number of parameters and battery health. Our research program, by contrast, is focused on the investigation of a much larger set of model parameters in different stages of aging and tries to find out the key parameters that determine the degradation of lithium-ion batteries, and then, the mechanism of capacity fade and internal resistance increase can be quantitatively analyzed via the key parameters’ degradation.
In this article, the degradations of some key parameters are obtained from graphite/LiCoO2 batteries in different cycle numbers, and the mechanisms of capacity fade and internal resistance increase are analyzed accordingly. The remainder of this paper is organized as follows: Section 2 summarizes the experimental setup; Section 3 provides the multi-physics modeling and the multi-objective parameter identification; Section 4 presents the degradation relationship between the key parameters and the battery performance and then summarizes the degradation mechanisms. Conclusions of this article are presented in the final section.

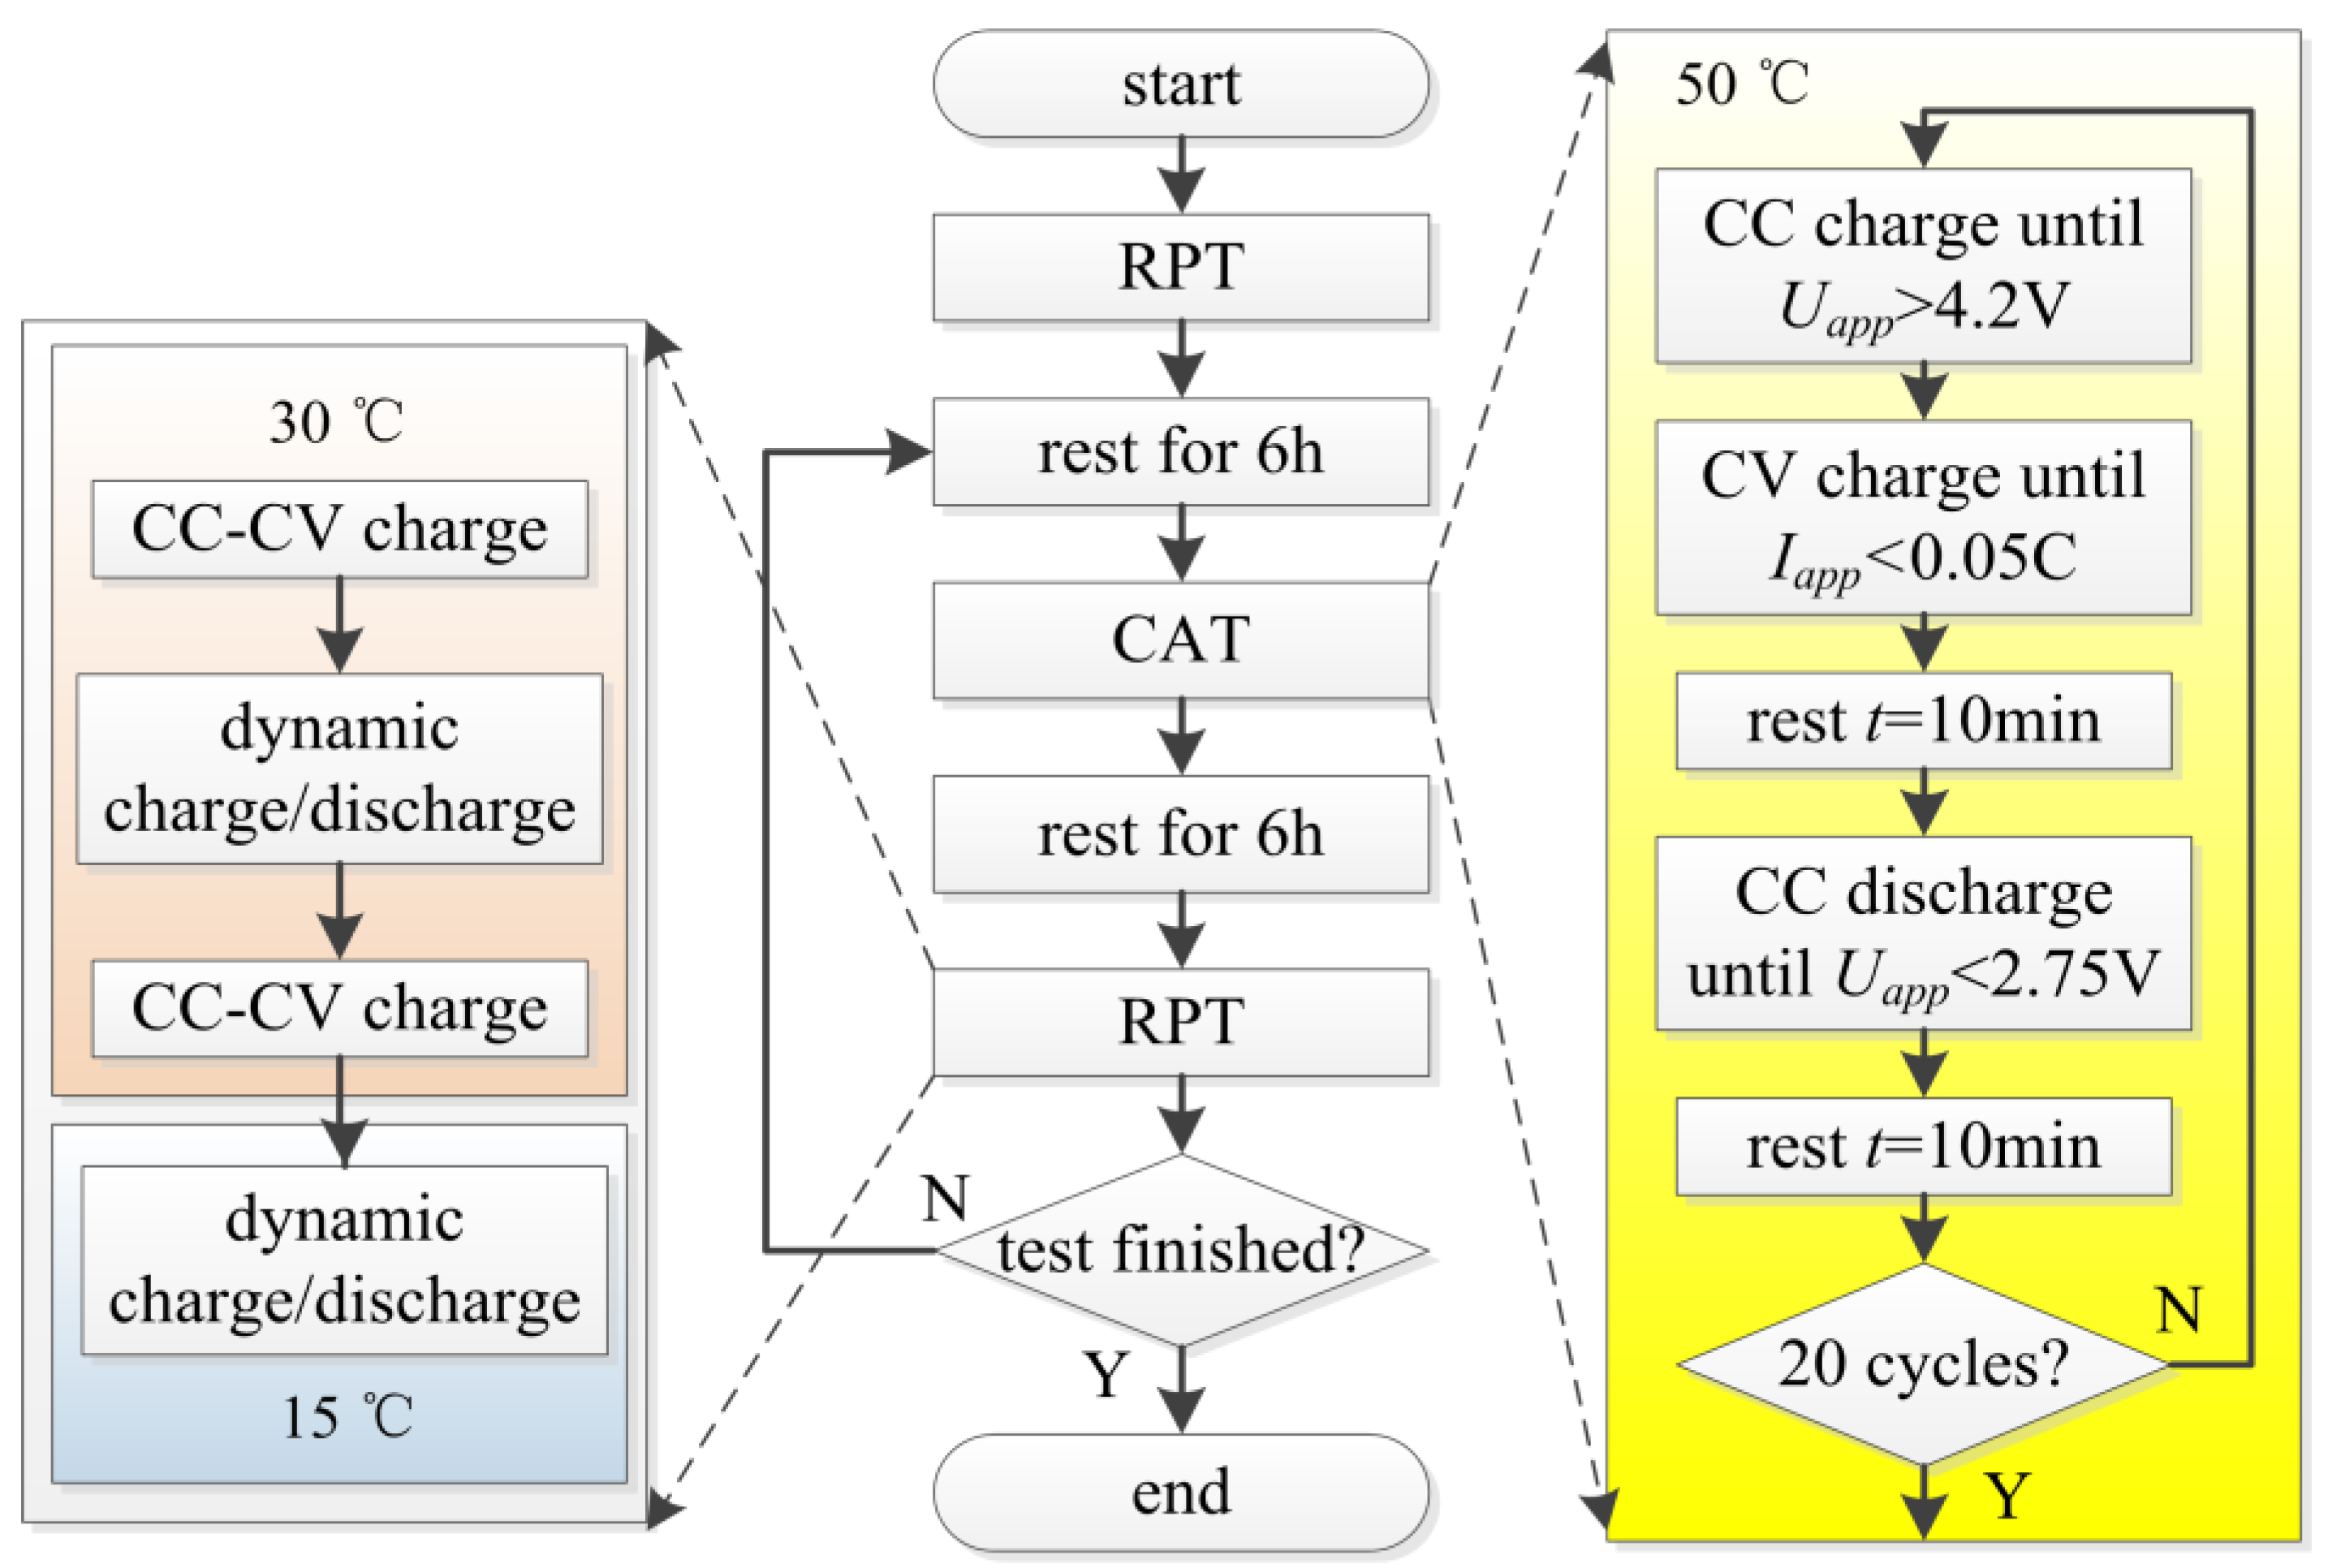
2. Experimental Section

For aging investigation, cylindrical batteries manufactured by DLG Power Battery (Shanghai, China), labeled ICR14500E-075, have been used. The batteries are designed for mobile devices and have a nominal capacity of 750 mA·h. The battery specifications are summarized in Table 1.
Table 1. Battery specifications provided by the manufacturer.
SpecificationDescriptionValue
CapnomNominal capacity750 mA·h
Umax-chMaximum charge voltage4.2 V
Imax-ccMaximum continuous current2C (1500 mA)
Ucut-disDischarge cut-off voltage2.75 V
TrangeTemperature rangeFrom −20 °C to 60 °C
DcellDiameter14.1 ± 0.2 mm
HcellHeight48.5 ± 0.5 mm
mcellMass21 g
A cycle aging test (CAT) and a reference performance test (RPT) were conducted alternately, and the test schedule is shown in Figure 1, where CC stands for constant current and CV stands for constant voltage mode. Experimental Uapp data were acquired by a battery testing system (Neware BTS-5V-6A, Shenzhen, Guangdong, China) every 10 s. The ambient temperature was controlled at 50 °C using an oven (Hongnuo HN-36, Tianjin, China) in the CAT; and the ambient temperature was controlled by another high-precision thermal chamber (Partner PTC14003-M, Wuxi, Jiangsu, China) in the RPT.
Figure 1. Flow chart of the cycle aging test (CAT) and reference performance test (RPT) schedule. CC: constant current; and CV: constant voltage.
Energies 07 06282 g001
A CAT contains 20 cycles, and there are five steps in each cycle. The constant current was set to 1C (750 mA), both in the CC charge and CC discharge step. The current and the terminal voltage of the first cycle in CAT are shown in Figure 2. The discharge capacity in each cycle was recorded as the battery capacity, and the internal resistance was determined as follows:
R int = Δ U 1 Δ I app
where ΔU1 is the voltage change discharge current appearing after a 10-min rest, shown in Figure 2b. Because the Li+ concentration gradient in the active material and electrolyte is very small after the rest, the concentration overpotential is almost zero, so the internal resistance calculated in Equation (1) is actually the ohmic resistance, including the ohmic resistance in the active material and electrolyte, the SEI film resistance, the connecting resistance and the equivalent resistance caused by the electrochemical reaction overpotential, and the details will be discussed in Section 4.3.2.
Figure 2. (a) Current and (b) terminal voltage profiles of a fresh battery in CAT.
Energies 07 06282 g002
The batteries were cycled for 360 cycles. The capacity and internal resistance of each cycle was recorded, and these data were used for analyzing the performance degradation of the battery.
The RPT was conducted at the very beginning and after every CAT. It contains two dynamic charge/discharge tests in ambient temperatures of 30 °C and 15 °C. Each dynamic test contains 17 steps, including five discharge rates (0.25C, 0.5C, 0.75C, 1C and 1.25C) and four charge rates (0.25C, 0.5C, 0.75C and 1C). The current and the terminal voltage of a fresh battery in RPT are shown in Figure 3.
Figure 3. (a) Current and (b) terminal voltage profiles of a fresh battery in RPT.
Energies 07 06282 g003
After the 13th RPT, some batteries could not finish the whole test, due to the capacity fade and resistance rise. Specifically, in Step 10 (1.25C discharge for 10 min), the terminal voltage reached the cutoff voltage, and the RPT ends too early. The discharge time of Steps 5, 6, 9, 10, 13 and 14 were cut in half to avoid this, so all RPTs could be conducted successfully.
There were 19 sets of RPT data, and they were used for parameter identification of the multi-physics model in different degradation stages. According to our previous study [28,29], the parameters of the multi-physics model can be identified more correctly using the dynamic charge/discharge data at two different ambient temperatures than those using a simple operating condition at only one ambient temperature.

3. Modeling and Parameterization

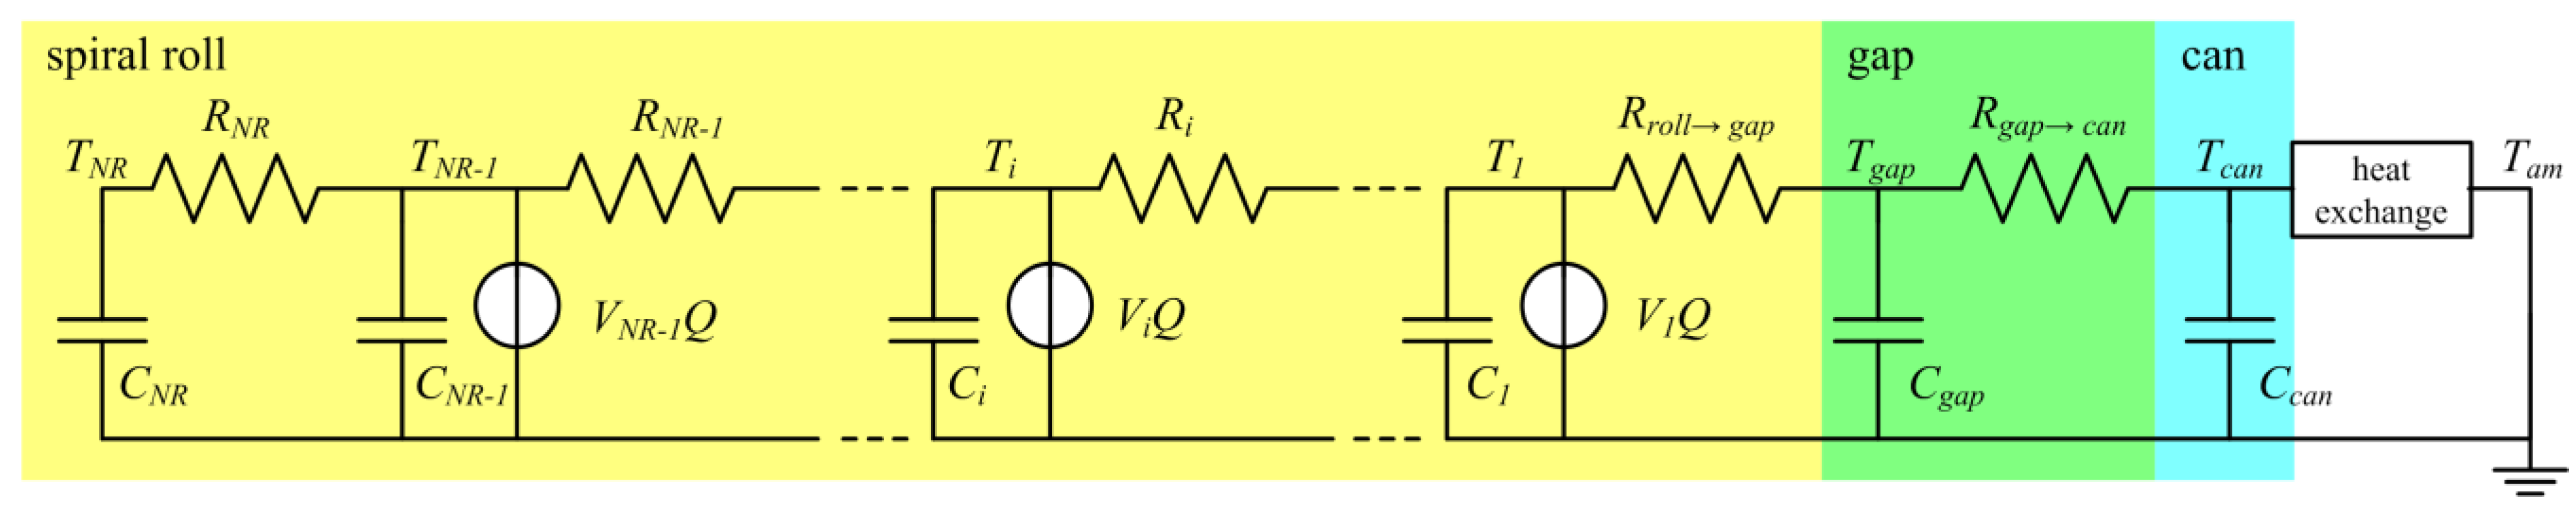
3.1. Multi-Physics Model of Cylindrical Batteries

The multi-physics model consists of three parts: the electrochemical model, the thermal model and the radial heat distribution model.
The electrochemical part is described by the pseudo two-dimensional (P2D) model [18,19]. Section B-B in Figure 4 shows the schematic of the P2D model for a lithium-ion battery. It consists of two current collectors, a negative electrode (anode), a separator and a positive electrode (cathode). Both electrodes and the separator have porous structures. Two inner boundaries (Anode/Separator Interface 2 and Separator/Cathode Interface 3) and two external boundaries (Cu/anode Interface 1 and Cathode/Al Interface 4) are also shown.
Figure 4. Schematic of the multi-physics model.
Energies 07 06282 g004
The physical and chemical processes, such as ion diffusion, migration, transportation and electrochemical kinetics, are described by several partial differential equations and algebraic equations in Table 2. The meanings of the symbols are explained in detail at the end of this article.
Table 2. Governing equations and boundary conditions of the pseudo two-dimensional (P2D) model.
MechanismsEquationsNumberBoundary conditions
Solid phase diffusion C s t = 1 r 2 ( D s r 2 C s ) (2) C s r | r = R s = j Li D s , C s r | r = 0 = 0
Electrolyte phase diffusion ε e C e t = ( D e eff C e ) + a s F ( 1 t + 0 ) i s (3) C e x | 1 = C e x | 4 = 0 , D e,a e f f C e x | 2 = D e,s e f f C e x | 2 + , D e,s e f f C e x | 3 = D e,c e f f C e x | 3 +
Solid phase charge balance i 1 = σ s eff ϕ s (4) ϕ s x | 2 = ϕ s x | 3 + = 0 , ϕ s | 1 = 0 , ϕ s x | 4 = i σ s,a e f f
Electrolyte phase charge balance i 2 = κ e eff f e + 2 κ e eff R T F ( 1 + ln f ± ln C e ) ( 1 t + 0 ) ln C e (5) ϕ e x | 1 = ϕ e x | 4 = 0 , ϕ e | 2 = ϕ e | 2 + , ϕ e | 3 = ϕ e | 3 +
Electrochemical kinetics (Butler–Volmer equation) i s = n F j Li = i 0 [ exp ( α a F R T η ) exp ( α c F R T η ) ] (6)-
Reaction overpotential η = ϕ s ϕ e E ocv i s R film (7)-
Exchange current density i 0 = k s C e α a ( C s,MAX C e/s ) α a C e/s α c (8)-
Terminal voltage U app = ϕ s | 4 ϕ s | 1 i R ext (9)-
In Equation (7), Eocv is the open circuit potential, which is a function of the solid phase Li+ concentration at the particle surface. The Eocv of LixC6 anode is obtained from [30,31].
A coin cell is assembled by using the cathode from an experimental battery, and the Eocv of LiyCoO2 is obtained by fitting the 1/100C discharge curve. The fitting result is shown by Equation (10) and Table 3:
E ocv,p = i = 1 6 a i exp [ ( y b i c i ) 2 ]
Table 3. Coefficients in Equation (10).
Coefficientsi = 1i = 2i = 3i = 4i = 5i = 6
ai4.7283.1950.51120.08850.49890.1562
bi0.065370.73970.93040.91240.86380.9839
ci0.44620.40660.087740.019290.13970.02694
Thermal phenomena, such as energy conservation, heat generation and exchange, also occur during the charge/discharge process, and they can be simulated by the P2D model, as presented in Table 4. The heat generates in a spiral roll, including the heat of electrochemical reactions, entropic heat and ohmic heating. Heat exchange only occurs at the surface of the cylindrical battery.
Table 4. Equations of the thermal model.
MechanismsEquationsNumber
Energy balance ρ C p T t = ( λ T ) + Q ˙ (11)
Electrochemical reaction heat Q ˙ rea = a s i s ( ϕ s ϕ e E ocv ) (12)
Entropic heat Q ˙ ent = a s i s T d E ocv d T (13)
Ohmic heat { Q ˙ ohm,s = σ s eff ϕ s ϕ s Q ˙ ohm,e = κ e eff ϕ e ϕ e + κ e D , eff ln C e ϕ e Q ˙ ext = i app 2 R ext / L (14)
Heat exchange (convection) q ˙ c = h ( T sh T am ) (15)
Heat exchange (radiation) q ˙ r = εσ ( T sh 4 T am 4 ) (16)
Arrhenius’ law X i = X i , ref exp [ E ¯ i R ( 1 T ref 1 T ) ] (17)
Nernst equation E ocv = E ocv ref + ( T T ref ) d E ocv d T (18)
Some parameters in the P2D model—such as solid phase diffusion coefficients Ds,a and Ds,c, solution phase conductivity κe, solution phase diffusion coefficient De and electrochemical reaction rates ks,a and ks,c—are coupled with the battery temperature. These parameters can be updated by the Arrhenius’ law. In Equation (17), Xi represents the parameters mentioned above; Xi,ref is the parameter value at reference temperature Tref; and Ei denotes the corresponding activation energy of parameter Xi, respectively. In addition, the open circuit potential depends on battery temperature according to the Nernst equation. An electrochemical-thermal coupled model is presented by feeding back the relationship between temperature-dependent parameters and thermal effects to the P2D model. There are many existing literature works on the P2D model and the electrochemical-thermal model; the reader is referred to [20,21] for details.
In Equations (13) and (18), d E ocv d T is the entropy coefficient and is obtained from [32].
A typical cylindrical battery is spiral roll cell, as shown in Figure 4. Thin layers of anode, cathode, separator and current collector are stacked up as Section B-B, rolled up on the central mandrel as Section A-A and then inserted into a can. The gaps are filled with liquid electrolyte.
The temperature distribution in the radial direction of a cylindrical battery is more obvious than that in the axial direction, due to the small thermal conductivity [33]. Therefore, the heat conduction term in Equation (11) can be expressed in one-dimension by Fourier’s Law:
( λ r T ) = λ r ( 2 T R 2 + 1 R T R )
The temperature gradient at the center of the battery is zero, while at the battery surface, it is given by the heat exchange rate at the surface:
{ T R | R = 0 = 0 λ r T R | R = R cell = q ˙
where Rcell is the radius of cylindrical battery, and the heat exchange rate is q ˙ = q ˙ c + q ˙ r . The temperature shows continuity at the interfaces of the spiral roll, gap and can.
A thermal impedance model is developed to simulate the thermal distribution in the radial direction of the cylindrical lithium-ion battery, as shown in Figure 5.
Figure 5. 1D thermal impedance model in the radial direction of a cylindrical battery.
Energies 07 06282 g005
In Figure 5, the spiral roll is divided into NR grids in the radial direction using the finite volume method (FVM). Each finite element is a cylindrical shell, and the innermost one is a cylinder. The volume Vi and centroid radius ri of each element could be obtained from the geometric parameters, and Ti is the temperature of the i-th element. The thermal resistance between two adjacent elements is:
R i = 1 λ 2 π H ln r i 1 r i
where H stands for the effective height of the spiral roll. Additionally, the thermal capacity is determined by:
C i = V i ρ C p
where the density ρ and the heat transfer coefficient λ are the volume-averaged values of all materials in the spiral roll.
The details of the thermal impedance model can be seen in our previous work [28]. The volume averaged value of T1 to TNR is used as T in Arrhenius’ law.
The multi-physics model was implemented using the improved DUALFOIL 5.1 Program, which is a universal battery simulation program developed by Newman’s research group [34]. The BAND(j) subroutine is used to solve the PDEs in the P2D model, and I have added some subroutines for local heat generation, heat exchange, temperature distribution and parameters updates by using the mentioned equations. The step size of time can be self-adjusted according to the degree of convergence, and the maximum time step size is 20 s. The number of nodes in the negative and positive electrode is 80; the number of nodes in the separator is 40, and the number of nodes in the solid particle is 50. It takes about 12 s to simulate the dynamic charge/discharge process in RPT on a PC with INTEL Core i3-530 CPU (2.93 GHz) with 4 G RAM.

3.2. Parameter Identification

There are 30 main parameters in multi-physics model, which are related to Li+ diffusion, transport of ions, ohmic phenomena, electrochemical reaction and thermal behavior. They were examined using the parameter sensitivity analysis method [28,35], and the results show that 25 of them need to be identified. Some of these parameters (such as De, Rfilm, etc.) may change their values during the ageing process. The identification result can be used for researching the SOH of a battery, and others (such as ks, Ē, etc.) must be identified, because their values are hard to measure in other ways. The searching ranges of these parameters are shown in Table 5, considering both the available values from references and the probable variation trend during the aging process. Besides, some geometric parameters (e.g., the thickness of electrode layer) and some material properties (e.g., density, specific capacity) are also needed to complete the model simulation. These parameters have been obtained from battery specifications, literature or measured directly after disassembling real batteries.
In this article, the parallelized multi-objective genetic algorithm (MOGA) [29,36] was used to identify those model parameters. The effectiveness of the proposed identification method was proven in [28,36] by using the RPT and the “synthetic experiment”, which is acquired from model simulation with known parameters instead of a real experiment, and the averaged relative error is less than 10%. The two objective functions are defined as the sum of squared error (SSE) between the model outputs and the experimental data of RPT at 15 °C and 30 °C:
minimize { Obj F 1 = i = 1 N ( U app, i ,15 U ^ app, i ,15 ) 2 Obj F 2 = i = 1 N ( U app, i ,30 U ^ app, i ,30 ) 2
where Uapp,i is the model output terminal voltage data, U ^ app , i is the experimental data, and N is the number of data points. The optimal solution of the identification problem is a set of parameters, with which the model simulated data should fit the experimental data best.
Finally, nineteen sets of parameters were identified. The simulated data with four sets of parameters are compared with experimental data in Figure 6. All simulated data fit the experimental data very well, and the average errors never exceed 30 mV. So, the identified values are accurate enough, and they can be treated as the internal characteristics of the batteries in different degradation stages.
The identified results using MOGA have uncertainty, and they may not very the same in different identification processes. However, we found that the degradation trends of the parameters are very similar. Therefore, in this work, we just use of the degradation trends to analyze the failure mechanisms, not a set of identified parameters themselves. The accurately identified values of the parameters are not so important, and actually, the method proposed below cannot use a certain set of accurate parameters to provide the degradation mechanisms of an aged battery directly.
Considering the previous literatures [26,27], the results of parameter sensitivity analysis and the identified results, we determined nine “key parameters” that change their values with the cycle number, and their identified results are discussed in Section 4.2 in detail. Other parameters are considered to maintain constants or have no obvious relationship with the cycle number, and their averaged values are shown in Table 5.
Figure 6. Comparisons of the simulated data using identified parameters with the experimental RPT data for: (a) a fresh battery; (b) after 120 cycles; (c) after 240 cycles; and (d) after 360 cycles.
Energies 07 06282 g006
Table 5. Searching range and identification results of the model parameters.
ParameterUnitLower boundaryUpper boundaryResult
Cemol·m−37501100868.06
x0-0.500.82Variable
y0-0.360.460.4058
Ds,am2·s−10.1 × 10−1410 × 10−14Variable
Ds,cm2·s−10.1 × 10−1410 × 10−14Variable
Rs,aμm5.01511.41
Rs,cμm2.0124.85
εe,a-0.300.450.3245
εs,a-0.300.60Variable
εe,c-0.20.350.2418
εs,c-0.30.70Variable
ks,am2.5·mol−0.5·s−10.1 × 10−1110 × 10−11Variable
ks,cm2.5·mol−0.5·s−10.1 × 10−1110 × 10−11Variable
Rfilm,aΩ·m200.010Variable
ĒDs,akJ·mol−1106027.47
ĒDs,ckJ·mol−1106044.23
ĒκekJ·mol−155024.43
ĒDekJ·mol−155019.62
Ēks,akJ·mol−1106045.04
Ēks,ckJ·mol−1106038.58
κeS·m−10.102.50.61
Dem2 s−10.1 × 10−1110 × 10−10Variable
RextΩ m200.0100.0016
λrW·m−1 K−10.1021.01
hW·m−2·K−1203025.26

4. Results and Discussion

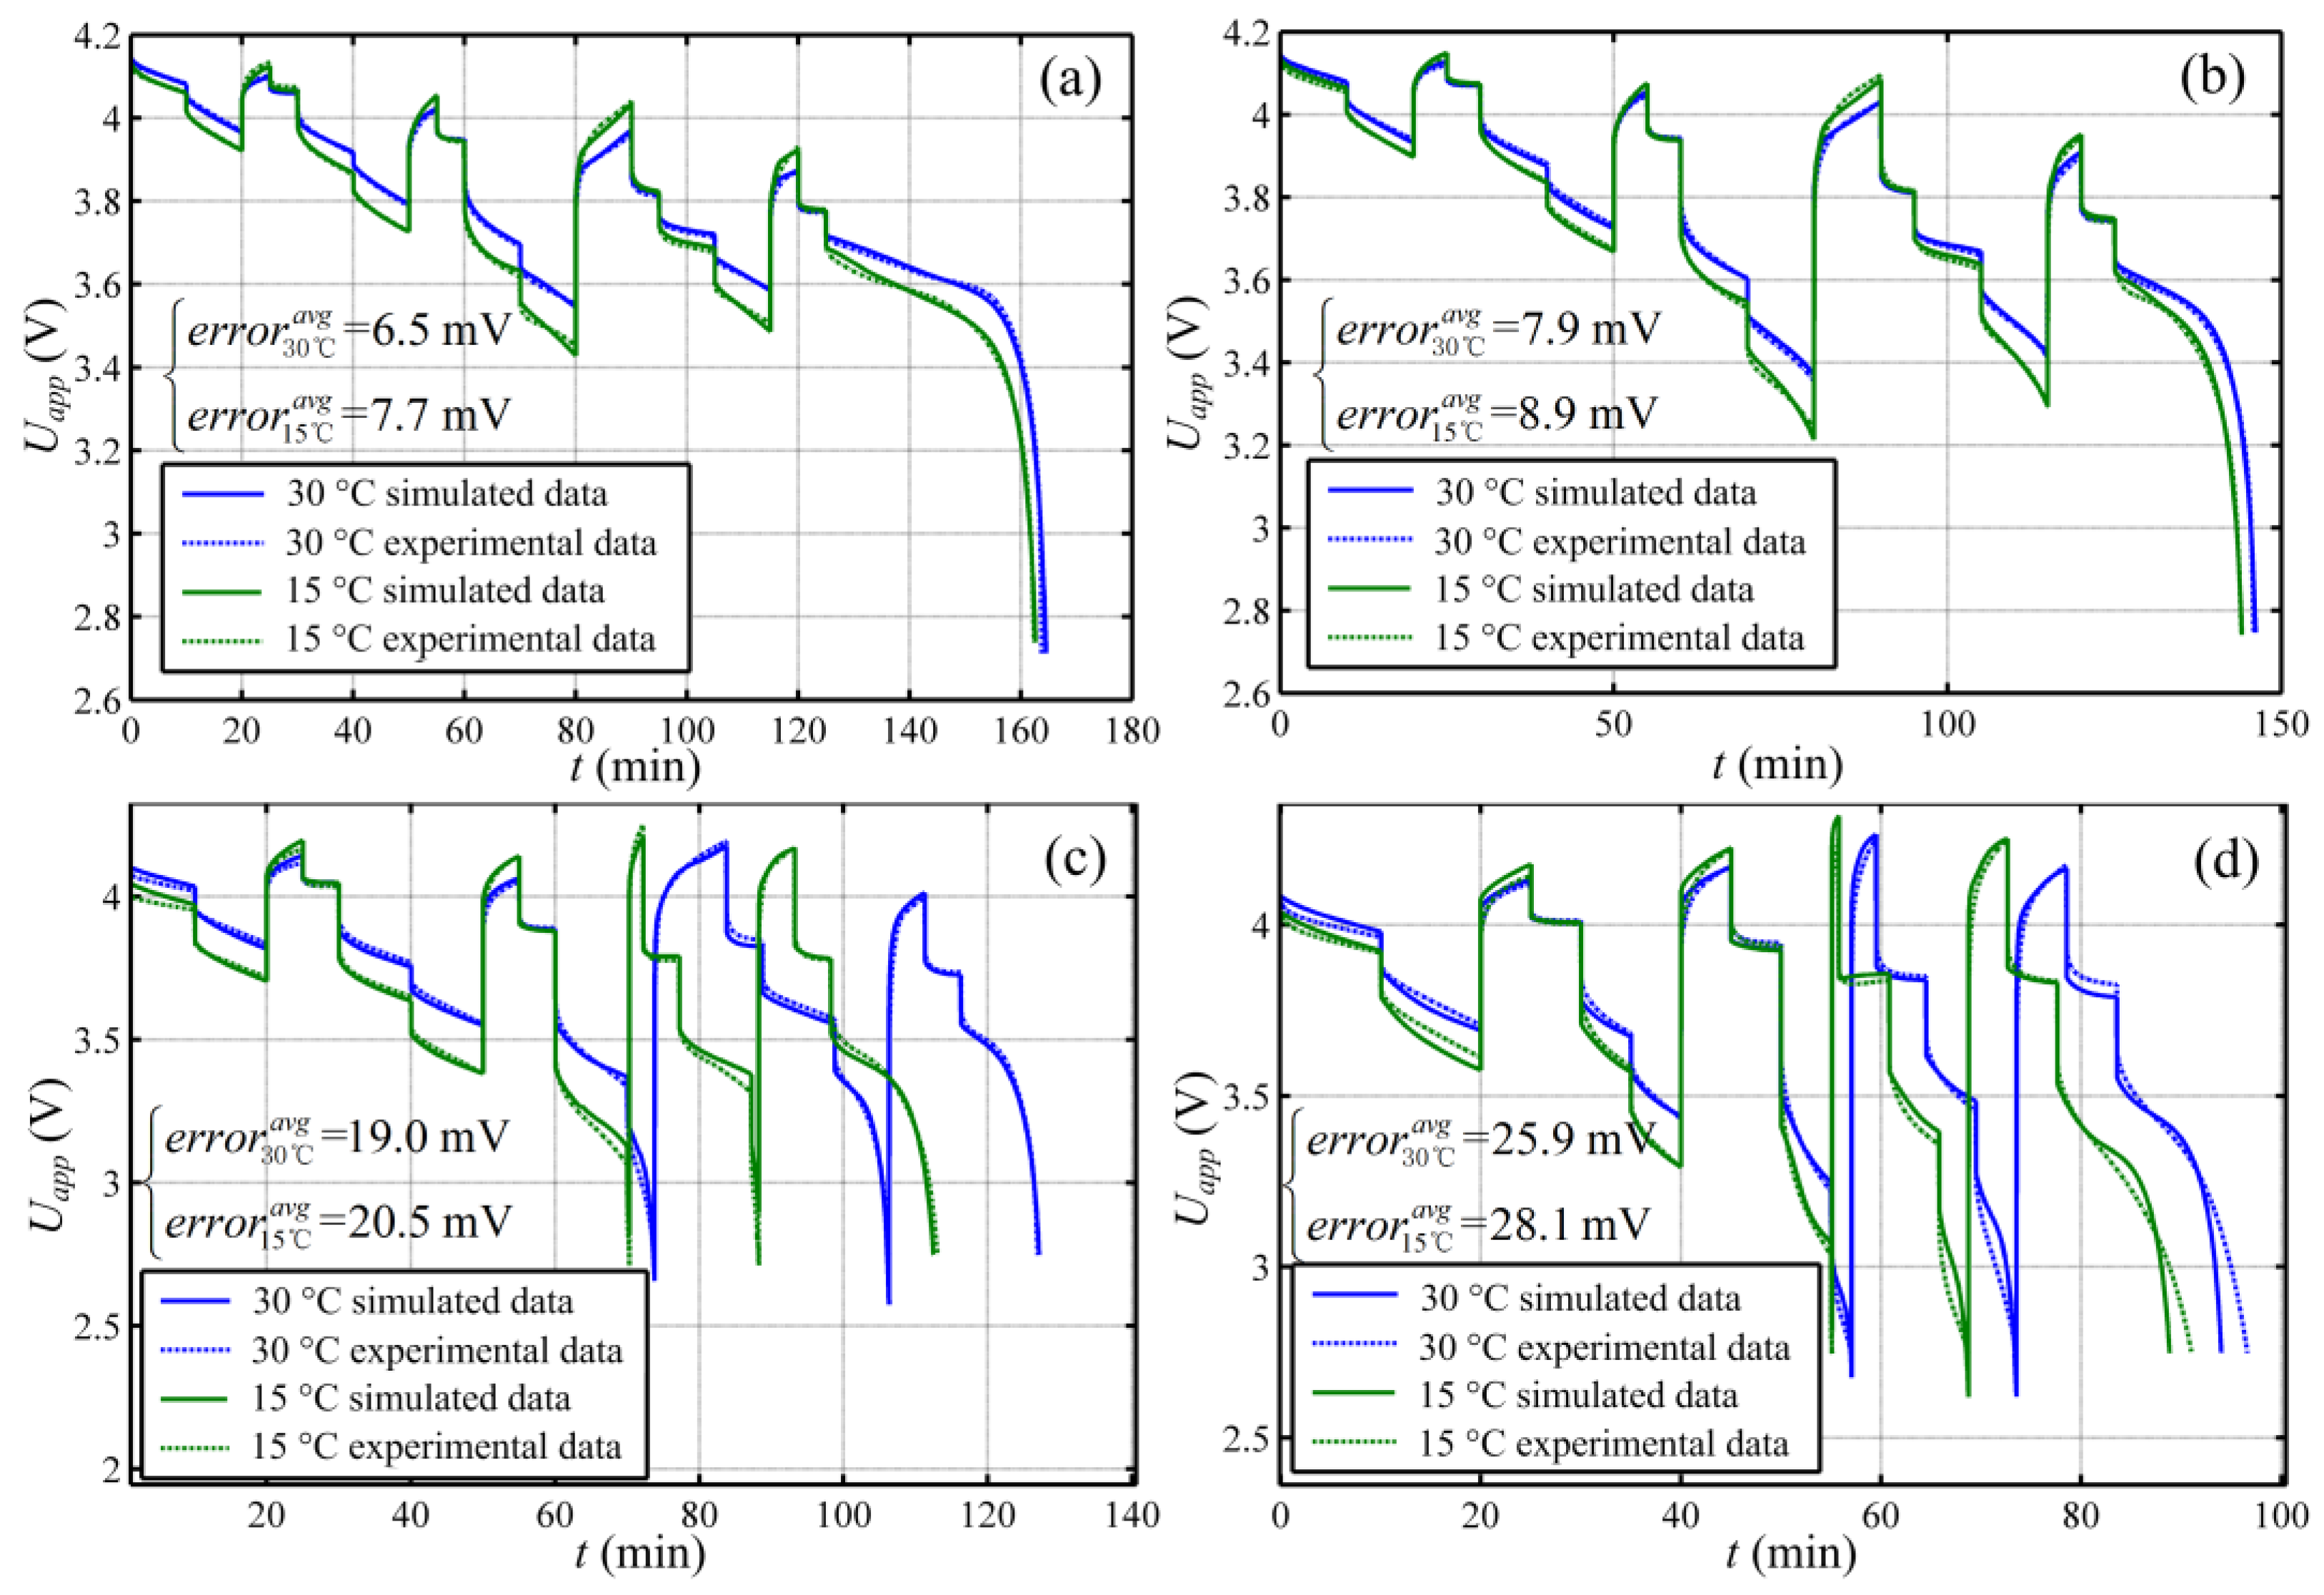
4.1. Degradation of Battery Performance

Figure 7a presents the capacity fade with cycle number in CAT and the relationship between the loss rate of capacity Qloss and the total throughput capacity Capth is also shown in Figure 7b. Qloss is determined as follows:
Q loss ( c y c l e ) = 1 C a p a c i t y dis ( c y c l e ) C a p a c i t y 0
where Capacity0 = 774 mA·h is the measured capacity of a fresh battery, not the nominal capacity in the specifications. The Capth is calculated by accumulating the throughput capacity:
C a p th ( c y c l e ) = i = 1 c y c l e [ C a p a c i t y dis ( i ) + C a p a c i t y chr ( i ) ]
where Capacitydis(i) and Capacitychr(i) are the discharge capacity and the charge capacity in the i-th cycle, respectively.
Figure 7. (a) Capacity fade of the cycled battery; and (b) normalized capacity loss and the fitting result.
Energies 07 06282 g007
The relationship between the Qloss and the Capth or time are described by a power-law in [11,14,37,38], and the power law exponent is equal to 0.5 when the degradation is only caused by the SEI layer formation in the calendar life. The fitting result in this article shows that the power law exponent equals 1.8204, which means that the capacity fade in our CAT is caused by many factors beside the SEI layer formation itself, and the degradation mechanisms may be more complex.
In Figure 7a, the capacity fade is obviously divided into two stages: the first stage is 0–160 cycles, and the second stages is 160–360 cycles. The degradation rate of the first stage is lower than the second one; the reason will be discussed by key parameter degradation, and details will be seen in Section 4.3.1 and Section 4.4.
Figure 8 shows the internal resistance increase in CAT and the linear relevant fitting result. The experimental data of each CAT are not continuous, but the slope is almost the same. We speculate that this phenomenon is caused by the change of connecting resistance, because we re-connect the battery board between the CAT and RPT.
Figure 8. Normalized internal resistance.
Energies 07 06282 g008

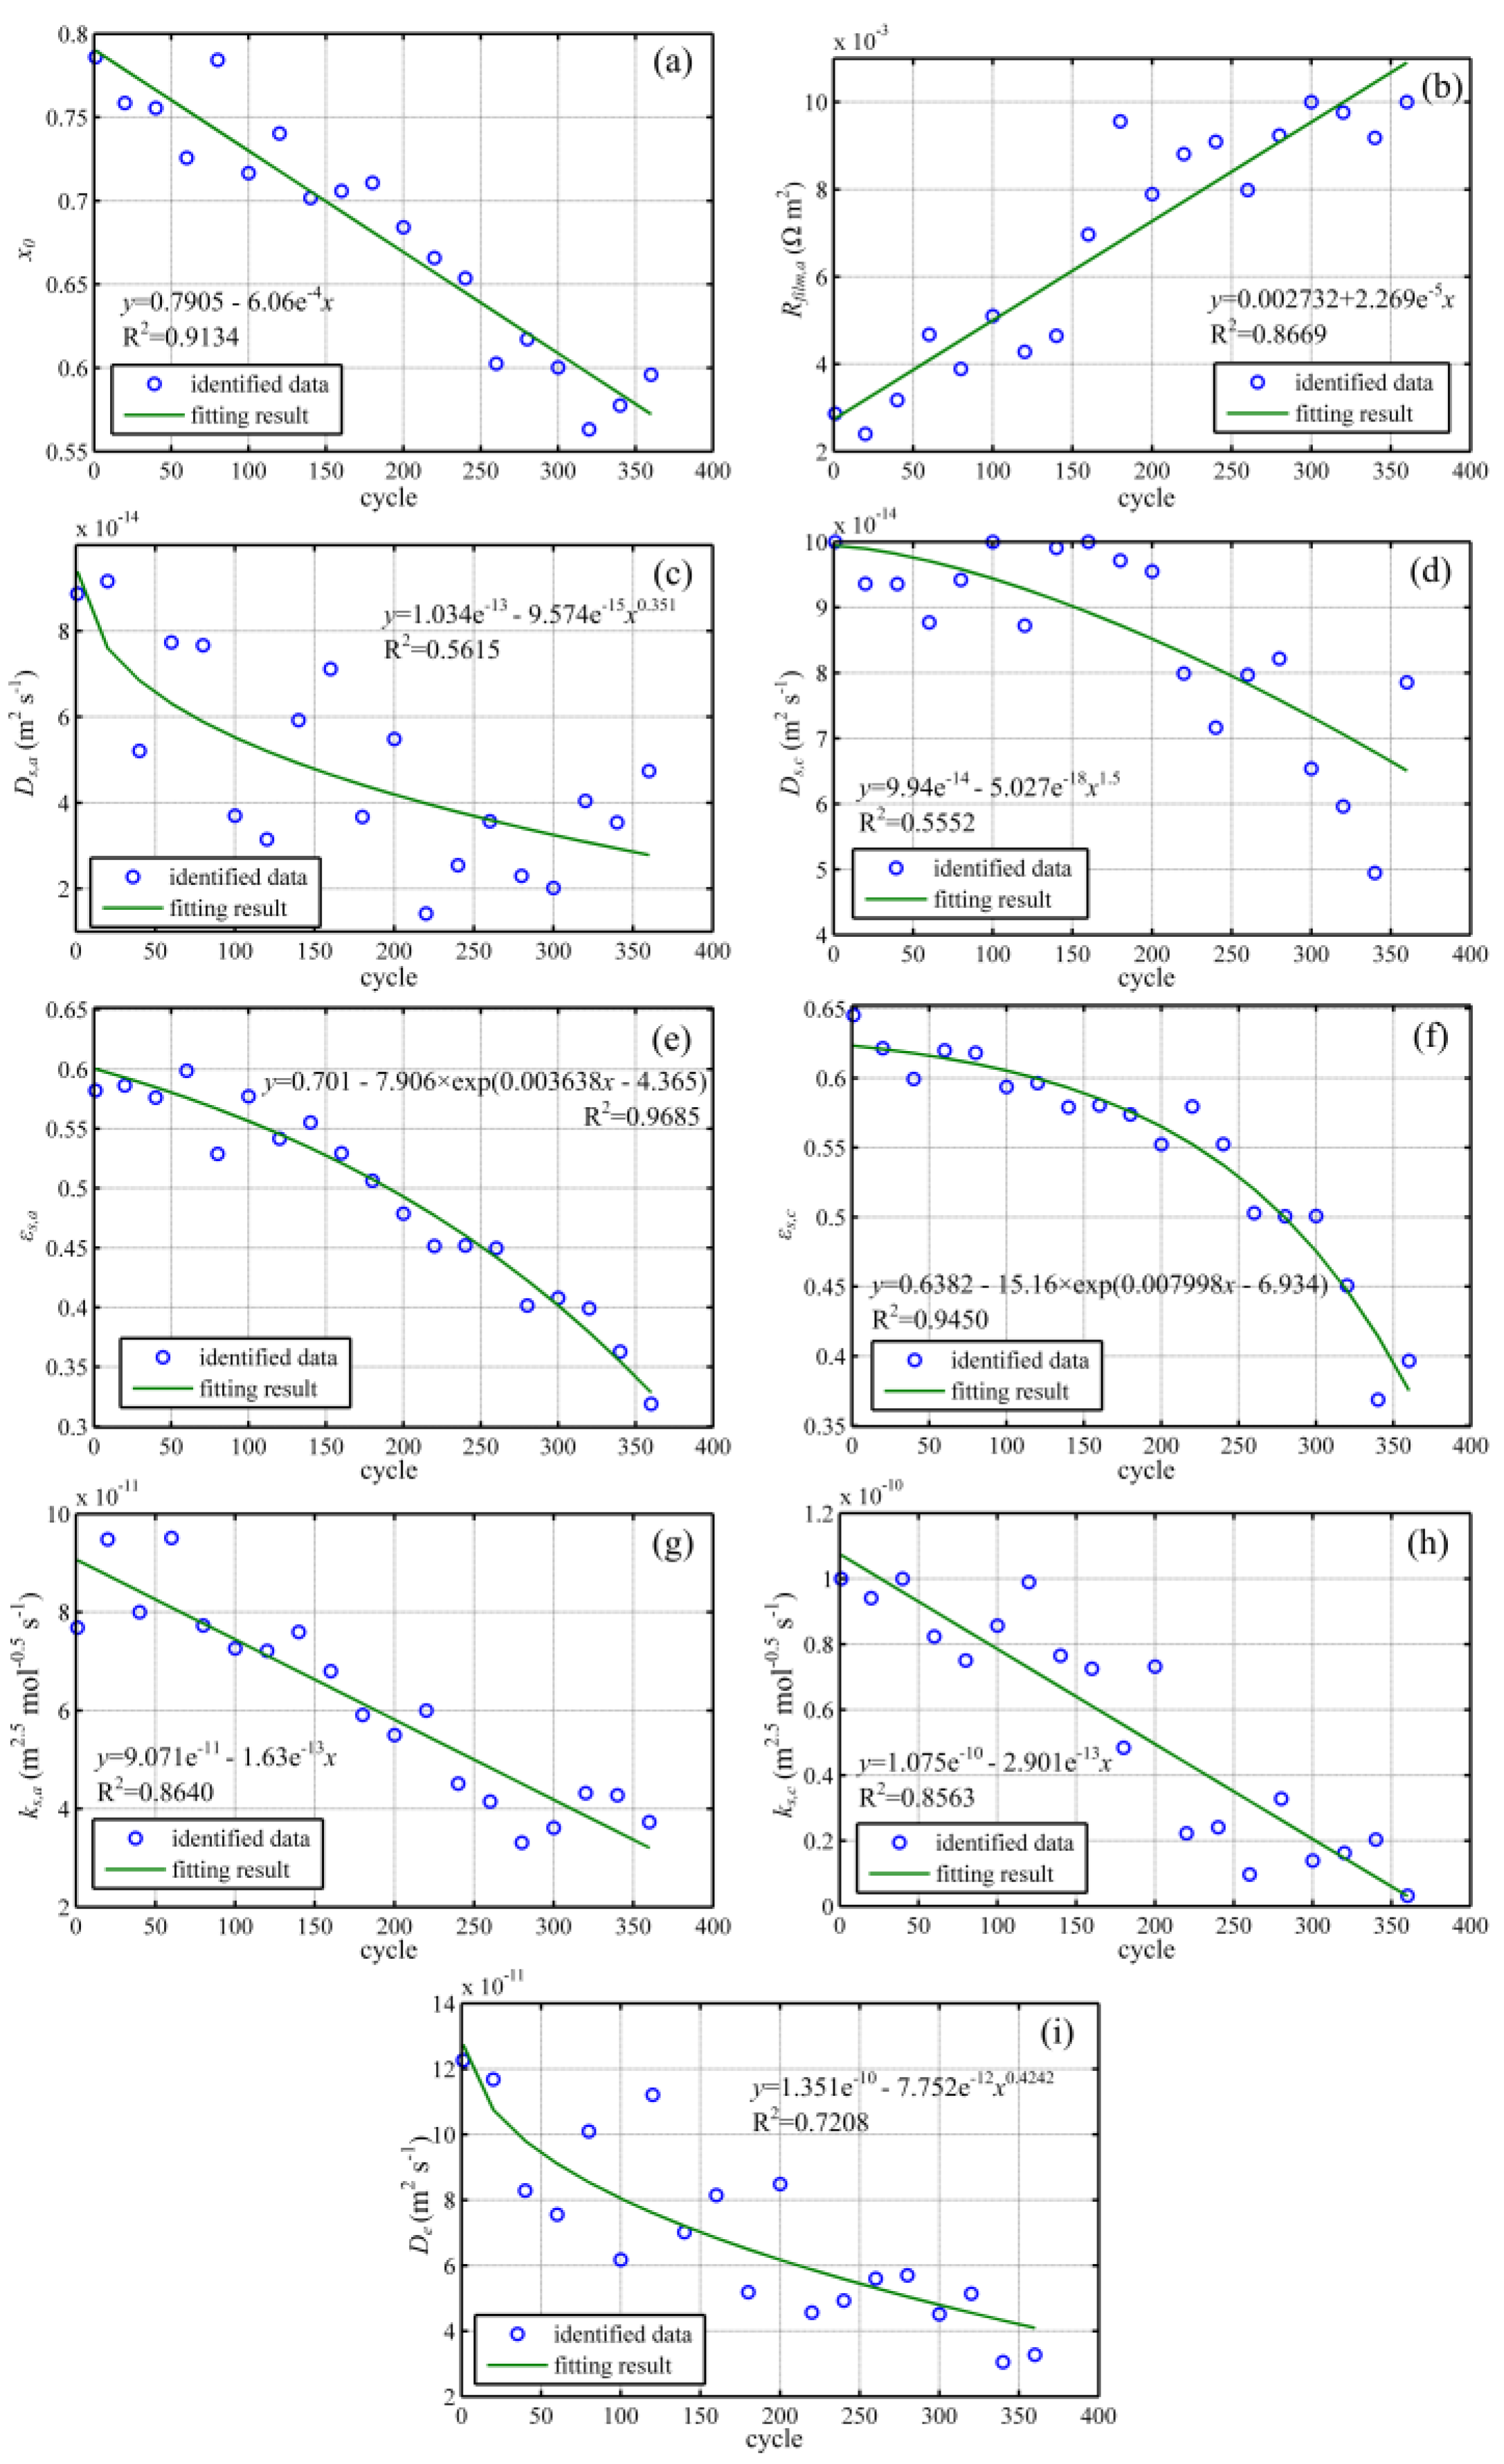
4.2. Degradation of Key Parameters

The degradation of nine key parameters is shown in Figure 9. Each parameter was fitted with three commonly-used equations: the linear form, the power form and the exponential form. The best fitting result that has the highest R-square is also shown in each subgraph.
Figure 9. Identified data and fitting results of the key parameters: (a) x0; (b) Rfilm,a; (c) Ds,a; (d) Ds,c; (e) εs,a; (f) εs,c; (g) ks,a; (h) ks,c and (i) De.
Energies 07 06282 g009
It is seen that the fitting results of six key parameters (x0, Rfilm,a, εs,a, εs,c, ks,a, ks,c) are very good; their R-squares are greater than 0.85; the other three key parameters (Ds,a, Ds,c, De) fit the identified values slightly worse. We noted that the six good fitting parameters are all “highly sensitive” in the parameter sensitivity analysis, meaning that when the values of those parameters change a little, the terminal voltage changes noticeably, so that they can be identified more easily and correctly. However, though the diffusion coefficients of electrodes are “sensitive” parameters, the diffusion coefficient of the electrolyte is a “low sensitivity” parameter, and even though these parameters change a lot, this has little effect on the terminal voltage. Therefore, the identified results of these three parameters look scattered, but the degradation trends are clear. The parameter Ds,a and Ds,c follow the power-law, the same as [26]; and the degradation trend of De is similar to [27].

4.3. Degradation Analysis

In this section, the mechanism of capacity fade is analyzed using the multi-physics model and some key parameters; and the relationship between the internal resistance increase and the key parameters is also discussed via decomposing the equation of total overpotential.

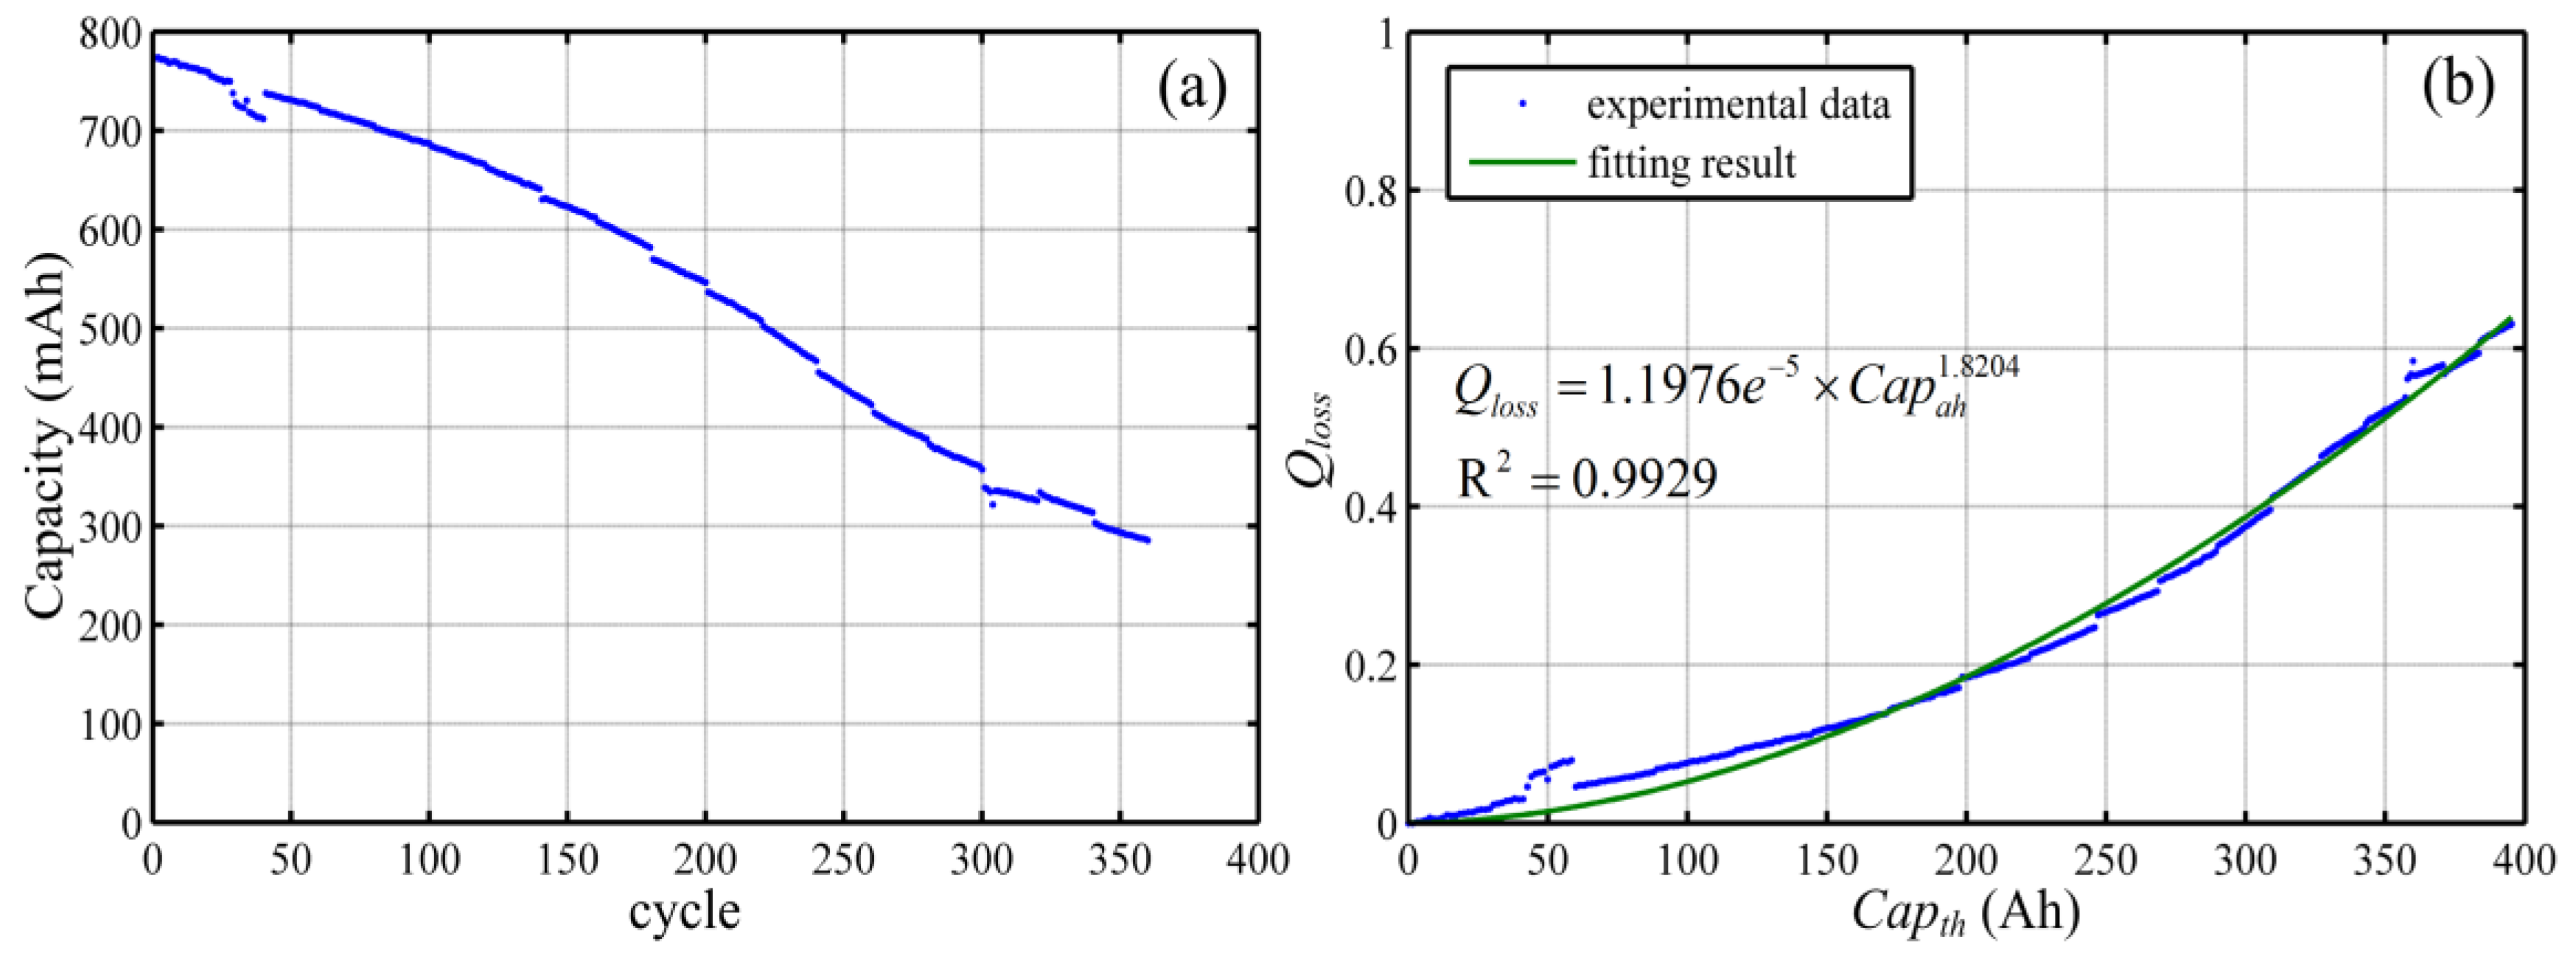
4.3.1. Analysis of Capacity Fade

Theoretically, the total capacity of the active material is determined by:
{ C a p a total = A cell L a ε s,a M a ρ a C a p c total = A cell L c ε s,c M c ρ c
where Captotal is the total capacity an electrode contains when the lithium-ions fully insert/de-insert into/from the active materials. Here, we arbitrarily treated the area of the electrode Acell as a constant, because it is very difficult to obtain its exact value during the degradation with our present methods, so the initial measured value is used. Actually, the parameter Acell may slightly decrease with battery degradation, because of the clogging of the separator or complete ionic insulation of the surface of the electrode by means of electrolyte decomposition and residue deposition.
Other constants in Equation (26) are listed in Table 6. As a result, the total capacity evolution is primarily dictated by variations of the volume fraction of active material in both electrodes.
Table 6. Geometrical and material parameters in Equation (26).
ParameterDescriptionAnodeCathode
Acell (m2)Area of the electrode0.02840.0284
L (m)Thickness of the electrode7.2 × 10−56.1 × 10⁻⁵
M (mA·h·g1)Specific capacity372274
ρ (kg·m−3)Density22605010
In fact, the lithium ions do not fully insert/de-insert into/from the active materials, and the stoichiometric number changes in a certain range, which is defined as the stoichiometric windows and is expressed by:
{ Δ x = C a p C a p n total = x 0 x end Δ y = C a p C a p p total = y end y 0
where x0 and y0 are the stoichiometric numbers of the anode and cathode when the battery is fully charged, respectively, while xend and yend are the stoichiometric numbers when the battery is fully discharged. From Equations (26) and (27), the actual cycle capacity of the battery is determined by two factors: the volume fraction of active material (εs) and the stoichiometric windows (Δx and Δy).
Figure 9e,f presents the degradation of the volume fraction for the anode and cathode, and it shows that the amount of active material decreased following the exponent law, indicating that the loss of active material (LAM) occurred faster and faster during the whole cycle life. Figure 10 presents the degradation of stoichiometric windows; they decreased linearly, indicating that the loss of Li inventory (LLI) occurred continuously during the cycle life.
Figure 10. Degradation of the stoichiometric windows: (a) Δx; and (b) Δy.
Energies 07 06282 g010
Besides, xend and yend can be calculated using the obtained values of Capacity, x0, y0, εs, by using Equations (26) and (27). Figure 11 presents four sets of stoichiometric numbers at different stages.
Figure 11. Degradation of the stoichiometric numbers: (a) x0 and xend; and (b) y0 and yend.
Energies 07 06282 g011
Some conclusions can be drawn from Figure 11:
(1)
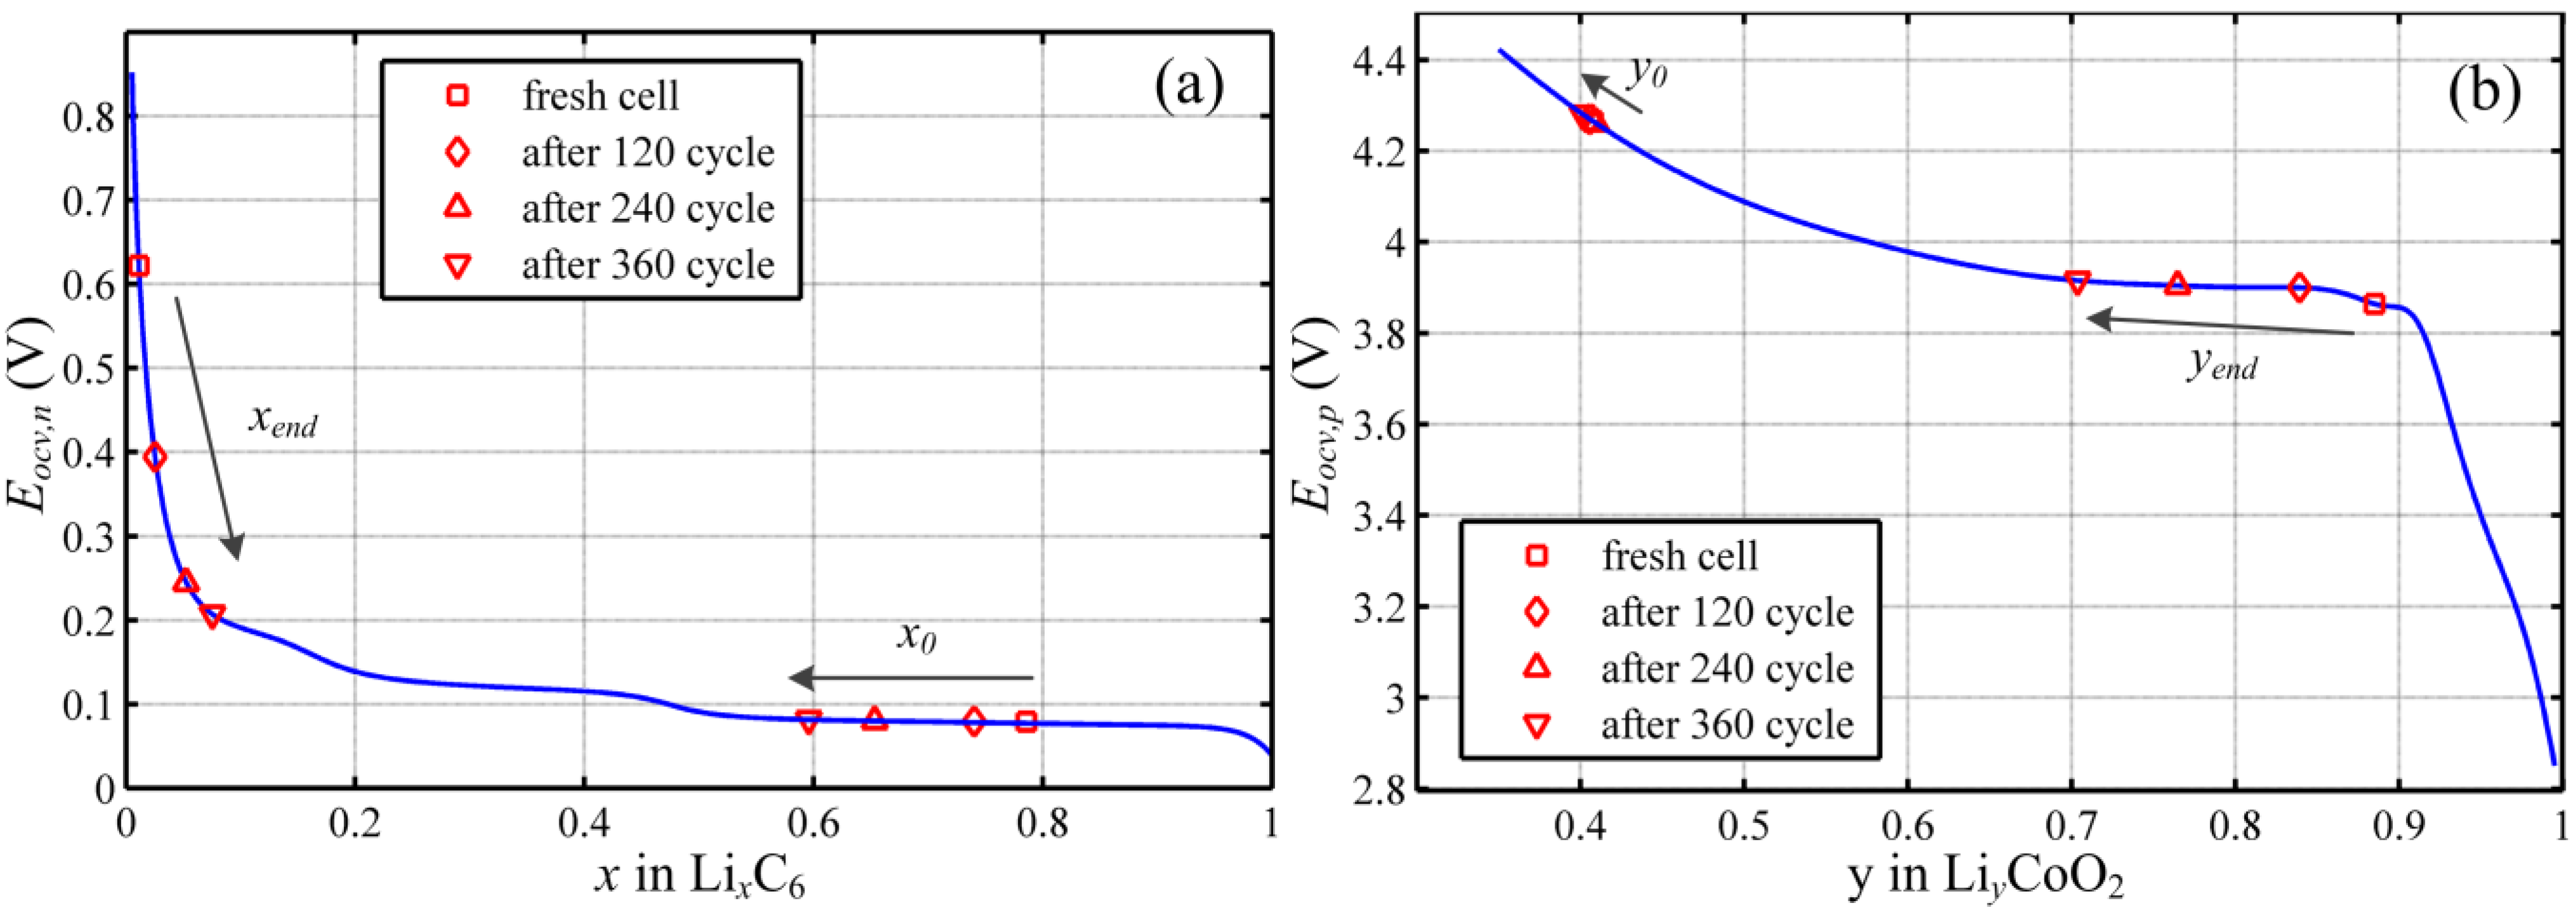
The anode is always the control electrode during the whole cycle life, because the position of yend is always on the voltage plateau and the terminal voltage of the battery at the end of discharging is always determined by the anode.
(2)
The terminal voltage of the battery at the beginning of discharging stays at 4.2 V. The battery is fully charged in every cycle, so there is no capacity fade caused by under-charge (UC).
(3)
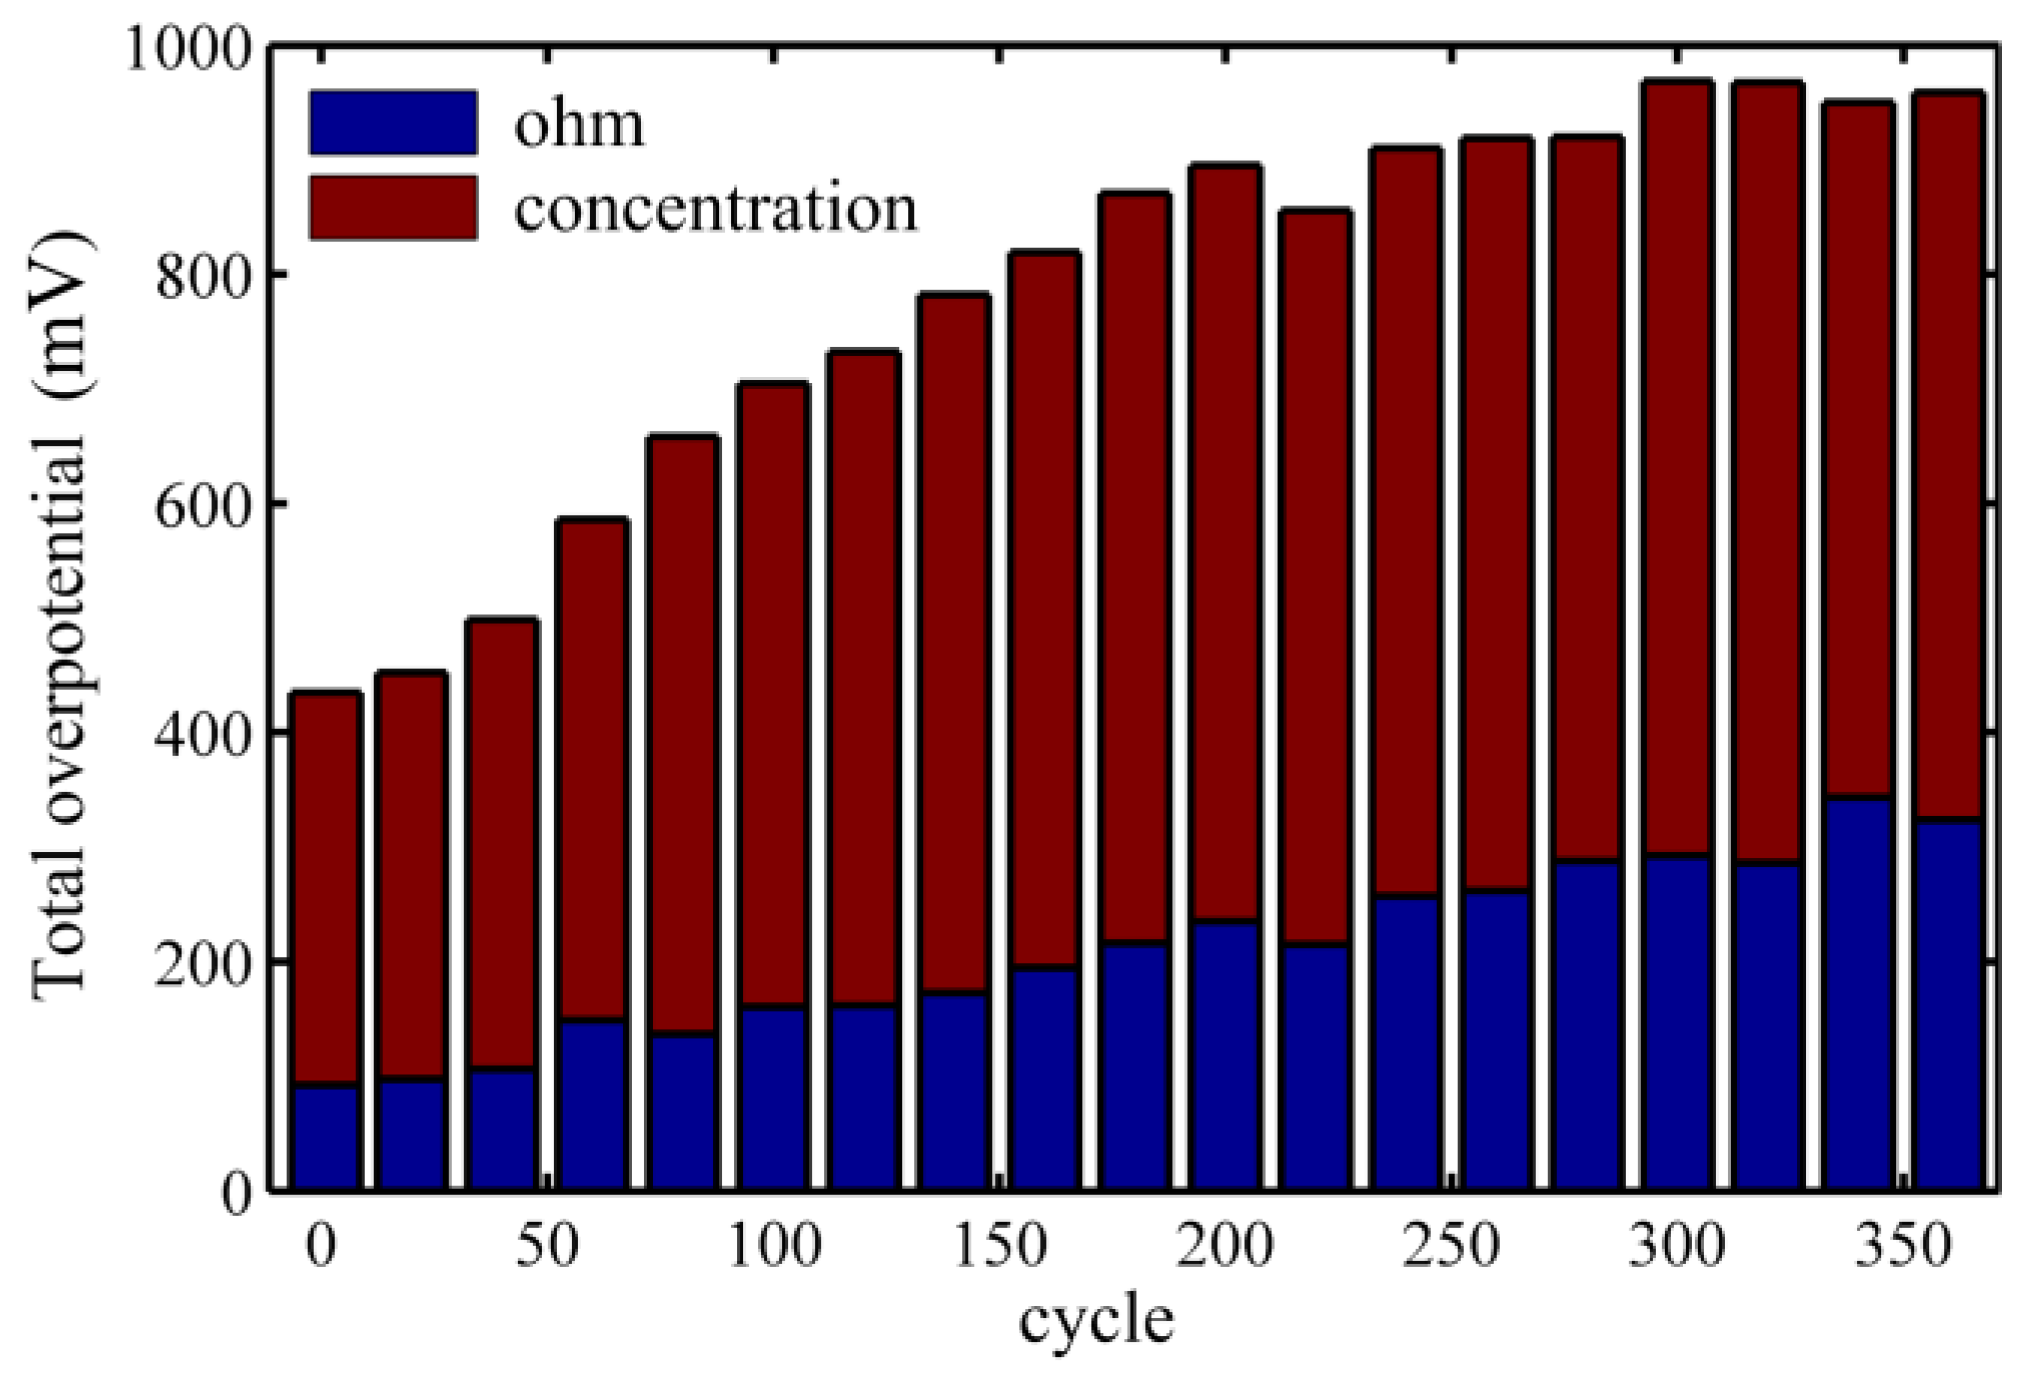
Observing the equilibrium potential of the battery at the end of discharging, the value of a fresh one is E ocv end ( fresh ) = E ocv,p end ( fresh ) E ocv,n end ( fresh ) = 3.18 V, while the value of a cycled battery after 360 cycles is E ocv end ( 360 ) = E ocv,p end ( 360 ) E ocv,n end ( 360 ) = 3.71 V; considering that the discharge cutoff voltage is 2.75 V, the total overpotential increases from 430 mV to 960 mV during the cycle life.
(4)
After 200 cycles, when the terminal voltage reaches the discharge cutoff voltage, the anode has not been fully discharged, and the stoichiometric number is still 0.05–0.1, meaning there are some lithium ions that are underutilized. Therefore, in this stage, the under-discharge (UD) becomes another factor of capacity fade.

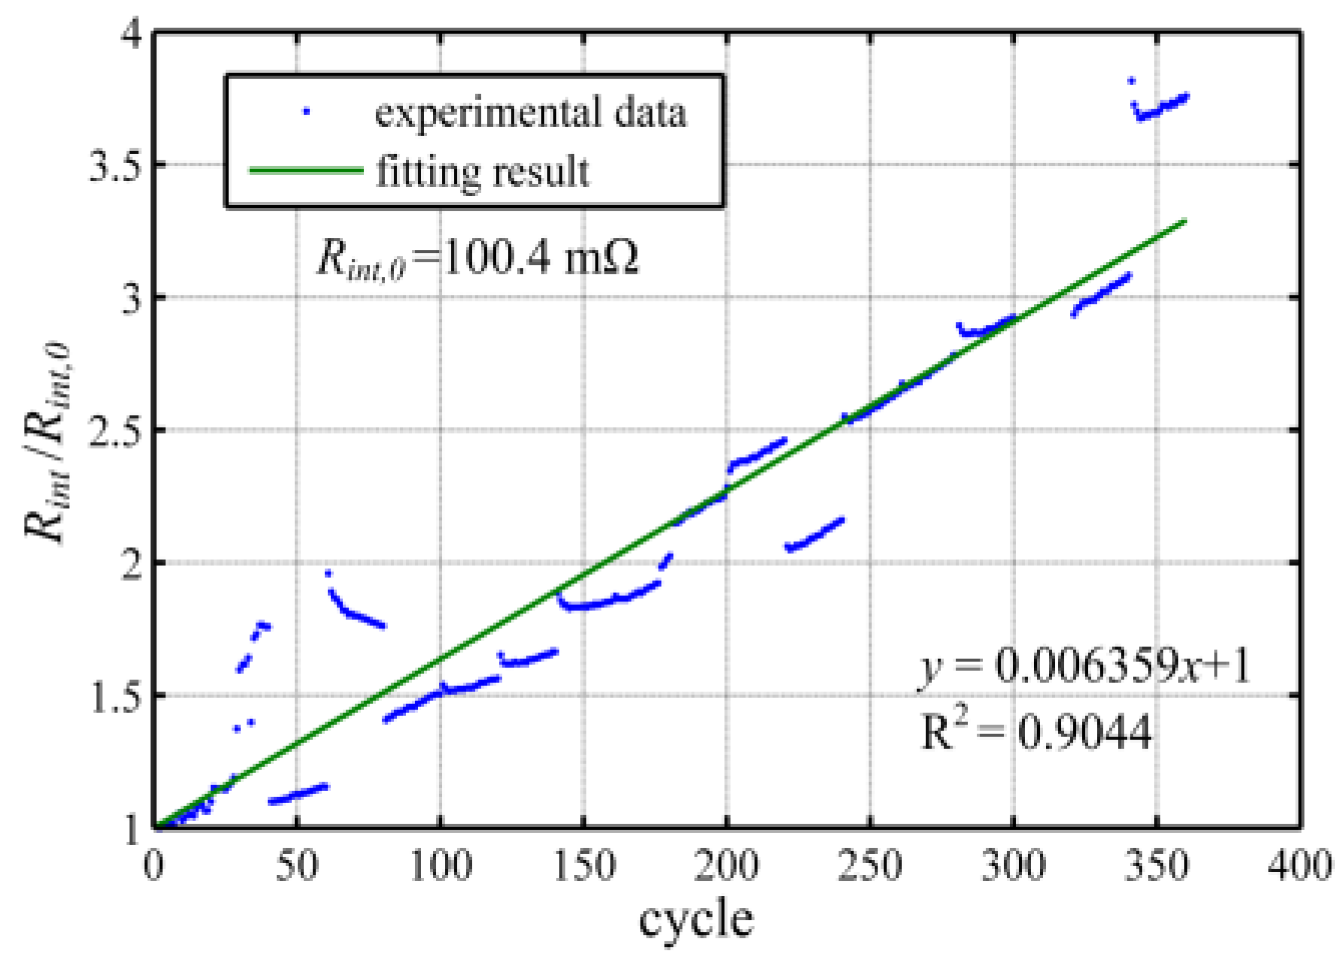
4.3.2. Analysis of Overpotential Increase

According to Equations (7) and (9), the terminal voltage of the battery can be given by:
U app = ϕ s | 4 ϕ s | 1 i R ext = ( E ocv + η + ϕ e + i s R film ) | 4 ( E ocv + η + ϕ e + i s R film ) | 1 i R ext
where the SEI film resistance of the cathode is ignored, so that the total overpotential is given by the following equation and divided into five parts:
Energies 07 06282 i001
where E ocv,p eq and E ocv,n eq are the equilibrium potentials of the cathode and anode, respectively; i = i1 + i2 is the total current density in the battery.
The composition of ③ overpotential in the electrolyte is complicated; it should be decomposed in detail:
The following relation is always satisfied according to the solid and electrolyte phase charge balance:
{ i = σ s eff ϕ s κ e eff ϕ e + κ e eff K junc ln C e ( in electrodes ) i = κ e eff ϕ e + κ e e f f K junc ln C e ( in separator )
where the total current density i is equal to the sum of i1 and i2, and it is a constant only determined by the applied current.
Then, decomposing Equation (30), respectively, into negative electrode, separator and positive electrode, the following equations are obtained:
{ ϕ e | 2 ϕ e | 1 L a = i κ e e f f σ s eff κ e eff ϕ s | 2 ϕ s | 1 L a + K junc ln C e | 2 ln C e | 1 L a ( in negative electrode ) ϕ e | 3 ϕ e | 2 L s = i κ e eff + K junc ln C e | 3 ln C e | 2 L s ( in separator ) ϕ e | 4 ϕ e | 3 L c = i κ e e f f σ s e ff κ e e f f ϕ s | 4 ϕ s | 3 L c + K junc ln C e | 4 ln C e | 3 L c ( in positive electrode )
Finally, the ③ overpotential in the electrolyte is divided into three parts by adding each side of the three equations in Equation (31) together after reducing their fractions with Li respectively:
ϕ e | 4 ϕ e | 1 = [ i κ e,c eff L c i κ e,s eff L s i κ e,a ef f L a ] -1 ohmic overpotenial in electrolyte + [ σ s,c eff κ e,c eff ( ϕ s | 4 ϕ s | 3 ) σ s,a eff κ e,a e f f ( ϕ s | 2 ϕ s | 1 ) ] -2 ohmic overpotenial in electrodes + [ K junc ( ln C e | 4 ln C e | 1 ) ] -3 concentration overpotential in electrolyte
where κ e eff = κ e ε e 1.5 , σ s eff = σ s ε s 1.5 , and K junc = 2 R T F ( 1 + ln f ± ln C e ) ( 1 t + 0 ) .
Therefore, the total overpotential is divided into seven parts, and this can be summarized by two types: the ohmic overpotential and the concentration overpotential.
The first type is composed of five parts: ② reaction overpotential, ③-1 ohmic overpotential in electrolyte, ③-2 ohmic overpotential in electrodes, ④ overpotential of SEI film resistance, and ⑤ overpotential of connecting resistance. The ohmic overpotential is only related to applied current, and it appears when a current passes through the battery and disappears when the current disappears. The reaction overpotential (η) is determined by the electrochemical reaction current density (is) and the exchange current density (i0) according to the Butler–Volmer equation; it has the same nature of ohmic overpotential, and thus, we grouped it into the first type. The ΔU1 in Figure 2 is actually the ohmic overpotential, including all five parts mentioned above.
The contributions of each part to overpotential degradation are discussed in detail as follows:
(1)
Parts ③-1 and ⑤ have no contributions to the overpotential degradation, because the related key parameters κe, εe and Rext do not vary with cycles, so that the values of these two parts are almost constants.
(2)
When substituting the solid phase charge balance Equation (4) into Part ③-2 of Equation (32), the following equation is obtained:
σ s,c eff κ e,c eff ( ϕ s | 4 ϕ s | 3 ) σ s,a eff κ e,a eff ( ϕ s | 2 ϕ s | 1 ) = 3 4 i 1 ( x ) d x κ e,c eff + 1 2 i 1 ( x ) d x κ e,c ef f
where 3 4 i 1 ( x ) d x and 1 2 i 1 ( x ) d x represent the total current density of electrons in the cathode and anode, respectively, and they are determined by the applied current only. Therefore, this part is mostly related to the key parameters κe, εe, and, thus, is almost a constant.
(3)
Part ④ is determined by the key parameter Rfilm directly, and the electrochemical reaction current density of the anode (is,a) changes very little. Therefore, this part increases linearly with the cycle number, the same as the degradation trend of Rfilm.
(4)
Part ② is mostly related to the key parameters ks as in Equation (6) and (8), while other parameters change little during the cycle life. Therefore, this part also increases linearly with the cycle number.
Therefore, the degradation of the ohmic overpotential presents the linear rule of the cycle number. Accordingly, the ohmic resistance, which was calculated by Equation (1), also increases following the linear rule. This could explain the results of Figure 8.
The second type is composed of two parts, one is ① the concentration overpotential in electrodes and the other is ③-3 the concentration overpotential in the electrolyte. The concentration overpotential is determined by the Li+ concentration difference, and it does not change at the moment the applied current appears or disappears.
There are two contributing factors of concentration difference in electrodes: one is the inhomogeneous distribution of reaction current density, and the other is the Li+ diffusion in active material particles. These two factors cause the utilization of Li+ near the current collector to be different from the average value of the whole electrode; and the Li+ concentration at the surface of the active material particle is different from the average value of the whole particle. Thus, the true open circuit potential, which is calculated by using the true Li+ concentration at the surface of the active material particle near the current collector, is not equal to the equilibrium potential, which is calculated by the average Li+ concentration of the electrode, and this difference is presented in Part ① of Equation (29).
In Figure 9c,d, the Li+ diffusion coefficient of both the anode and cathode (Ds,a and Ds,c) decreases following power laws with the cycle number. This means that the Li+ diffusion in the active material particles become more and more difficult with battery ageing. When the electrochemical reaction occurs at the surface of active material particles in an aged battery, the Li+ concentration gradient will be greater than that in a fresh one. Therefore, the difference between the open circuit potential and the equilibrium potential becomes greater during the cycle life, and thus, the value of Part ① increases with the cycle number.
In Figure 9i, the electrolyte diffusion coefficient (De) also decreases following a power law with the cycle number. Therefore, in an aged battery, the concentration difference between the two current collectors is greater, because the Li+ movement in the electrolyte becomes more difficult. Thus, Part ③-3 also increases with the cycle number. These two factors can explain the degradation trend of the concentration overpotential.
During the rest period after the discharge step, the Li+ concentration difference in both the active material particle and electrolyte restore balance gradually. Therefore, the concentration overpotential reduces to zero, and we can observe that the terminal voltage rises and finally equals the equilibrium potential. In this phenomenon, the diffusion coefficients plays a leading role, and some literature works [19,39] have reported that the time constant of Li+ diffusion is inversely proportional to the diffusion coefficients. Because the calculation of the concentration difference involves many complex physical and electrochemical processes (e.g., Li+ diffusion and contribution of reaction current density), it is very difficult to give the algebraic relation between the degradation trends of key parameters and the increase of concentration overpotential.
The contribution of the ohmic and concentration overpotential is presented in Figure 12. It is observed that the concentration overpotential dominates the main part, and it increases fast before 160 cycles, almost keeping constant in the last period, which has a similar degradation trend with key parameters Ds,a and De. Ohmic overpotential exhibits a linear increase, and its proportion also increases from about 1/4 to 1/3.
Figure 12. Composition of the total overpotential at the end of the discharge step.
Energies 07 06282 g012
By the way, some key parameters that are related to the overpotential are determined by battery temperature, such as the Li+ diffusion coefficient and electrochemical reaction rate. According to Arrhenius’ law, the values of those parameters will become smaller when the temperature falls, and the total overpotential becomes larger based on the discussion above. Therefore, in a certain RPT, the total overpotential at 15 °C is larger than that at 30 °C, as shown in Figure 3b.

4.4. Summary of Degradation Mechanisms

In [8,23], four modes of capacity degradation are proposed, including the LAM and LLI, due to parasitic side reactions, UD and UC. According to the previous results and discussion in this paper, the former three modes occurred asynchronously in a cycle aged battery under high ambient temperature, resulting in a two-stage capacity fade process.
The first stage is the first 160 cycles, approximately. In this stage, the volume fractions of active material decrease very slowly, indicating that there is very little active material loss. At the same time, the stoichiometric windows linearly decrease and the SEI film resistance linearly increases with the cycle number, indicating that the Li inventory experiences continually loss. The main reason can be attributed to the SEI film formation, and the reaction formulas are given in [40]:
{ 2 EC + 2 e + 2 Li + ( CH 2 OCO 2 Li ) 2 + CH 2 = CH 2 EC + 2 e + 2 Li + LiCH 2 CH 2 OCO 2 Li DMC + e + Li + CH 3 + CH 3 OCO 2 Li + CH 3 OLi + CH 3 OCO H 2 O + e + Li + LiOH + 1 / 2 H 2 LiOH + e + Li + Li 2 O + 1 / 2 H 2 H 2 O + ( CH 2 OCO 2 Li ) 2 Li 2 CO 3 + CO 2CO 2 + 2 e + 2 Li + Li 2 CO 3 + CO
The SEI formation reaction consumes much of the Li+ inventory. Some organic materials, such as (CH2OCO2Li)2, and inorganic materials, such as Li2CO3, are produced, and these deposits adhere to the surface of the anode particles, then form a thin extra film as the SEI layer [27]. Due to the electronic insulation of the SEI layer, the film resistance becomes larger with additional SEI formation, and the Li+ insertion/de-insertion reaction becomes more and more difficult.
The second stage begins after 160 cycles. The degradation of stoichiometric windows and SEI film resistance show very similar trends to the first stage, indicating that the SEI formation occurs and the Li+ inventory is consumed continuously. It is noticed that in this stage, the volume fractions of active material decrease rapidly, which means much of the active material is no longer available for electrochemical reaction; it cannot provide Li+ and leads to capacity fade. The main reason is also attributed to the SEI formation. The accumulation of the deposits increases the thickness of the SEI layer, and the coverage area becomes larger and larger during the cycle life. When an active material particle is completely covered by SEI, it will be isolated from the electrochemical reaction, leading to LAM. In addition, the UD caused by a larger overpotential also occurs in the last 100 cycles of this stage, resulting in additional capacity loss.
The total overpotential increases with the cycle number, including two main types: the ohmic overpotential increases due to the increase of SEI film resistance and the decrease of the electrochemical reaction rate; those key parameters degrade following a linear form; and the increase of the concentration overpotential is determined by the degradation of active material and electrolyte. Equation (34) shows that in SEI formation reactions, some solvent of the electrolyte (e.g., ethylene carbonate (EC) and dimethyl carbonate (DMC)) is consumed; thus, the electrolyte becomes dry, and the diffusion of Li+ becomes more difficult.

5. Conclusions

In this work, the degradation trends of a multi-physics model were obtained by cycle life experimentation and the MOGA. There were nine key parameters varied with the cycle number, and they were treated as indicators of battery degradation. Then, the degradation mechanisms were analyzed accordingly, and some conclusions could be drawn: In the first stage, the LLI is the main cause of the capacity fading, and the LAM occurs, but contributes very little. We also concluded that there is no evidence of UD at this stage. In contrast, the three modes (LAM, LLI and UD) all have contributions to capacity fading in the second stage, and the LAM is the main cause, which determines the degradation trend of the capacity fade. The overpotential increase is closely related to the SEI formation reaction: on the one hand, the SEI layer increases the ohmic resistance, and on the other hand, the SEI formation reaction consumes some solvent of the electrolyte; thus, the diffusion of Li+ becomes more difficult. In summary, the formation of an SEI layer occurs throughout the entire process of cycling under high ambient temperature. This results in the LLI directly and then leads to the LAM and the increase of the overpotential.
Although this non-destructive approach could not provide direct and definitive physical evidence on the degradation mechanism compared to the post-mortem analysis, it could, however, provide the key parameters that indicate the degradation mechanism from a limited set of experimental data easily acquired in RPT during cycling. The details revealed by this approach provide a more detailed understanding of the degradation than that achieved by only monitoring the capacity and internal resistance data of batteries. Both of the method and the results of this work can be very beneficial for the PHM study of lithium-ion batteries and help improve battery (pack) management, reliability and safety further.

List of Symbols

Ce
Electrolyte concentration (mol·m−3)
Cs
Concentration of Li+ in the intercalation particle (mol·m−3)
Ce/s
Concentration of Li+ at the surface of intercalation particle (mol·m−3)
De
Electrolyte diffusion coefficient (m2·s−1)
Ds
Li+ diffusion coefficient in active material (m2·s−1)
Ē
Activation energy (kJ·mol−1)
Eocv
Open circuit potential of electrode (V)
F
Faraday’s constant (=96,487 C·mol−1)
h
Heat transfer coefficient (W·m−2·K−1)
iapp
Applied current (A)
i0
Exchange current density (A·m−2)
i1
Solid phase current density (A·m−2)
i2
Solution phase current density (A·m−2)
is
Electrochemical reaction current density (A·m−2)
jLi
Wall flux of Li+ on the intercalation particle of electrode (mol·m−2·s−1)
ks
Electrochemical reaction rate (m2.5·mol−0.5·s−1)
L
Thickness of the electrode or separator (m)
q ˙
Heat exchange rate (W·m−2)
Q ˙
Heat generation rate (W·m−3)
R
Ideal gas constant (=8.314·J mol−1·K−1)
Rext
Contact resistance (Ω·m2)
Rfilm
Solid electrolyte interface (SEI) film resistance (Ω·m2)
Rs
Intercalation particle radius of electrode (m)
t 0 +
Li+ transference number in the electrolyte
T
Battery temperature (K)
Tam
Ambient temperature (K)
Tsh
Surface temperature of the battery (K)
Uapp
Applied potential (V)

Greek Symbols

α
Transfer coefficient of the electrochemical reactions
ε
Emissivity
εe
Volume fraction of electrolyte in electrode or separator
εs
Volume fraction of active material in electrode
η
Reaction overpotential (V)
κe
Ionic conductivity of the electrolyte (S m−1)
λr
Thermal conductivity in the radial direction (W m−1 K−1)
σ
Stefan-Boltzmann constant (=5.6704 × 10⁻⁸ W m−2 K−4)
σs
Solid phase conductivity (S m−1)
ϕs
Solid phase potential (V)
ϕe
Solution phase potential (V)

Subscript

a
Anode
c
Cathode
s
Separator
0
Initial value
ref
Reference value

Acknowledgments

This research was financially supported by the National Natural Science Foundation of China (Nos. 51107021 and 51477037) and the Fundamental Research Funds for the Central Universities (Grant No. HIT. NSRIF. 2014021). We are also grateful to all of the anonymous reviewers for providing useful comments and suggestions that resulted in the improved quality of this paper.

Author Contributions

Liqiang Zhang designed the algorithms including the multi-physics and the parameter identification, and he wrote the main parts of the manuscript. Lixin Wang provided some ideas on the discussion, and he checked the results and the entire manuscript. Chao Lyu designed the experiments, and the experiments were conducted by Junfu Li and Jun Zheng.

Conflicts of Interest

The authors declare no conflict of interest.

References

  1. He, W.; Williard, N.; Osterman, M.; Pecht, M. Prognostics of lithium-ion batteries based on Dempster–Shafer theory and the Bayesian Monte Carlo method. J. Power Sources 2011, 196, 10314–10321. [Google Scholar]
  2. Saha, B.; Goebel, K.; Poll, S.; Christophersen, J. Prognostics methods for battery health monitoring using a Bayesian framework. IEEE Trans. Instrum. Meas. 2009, 58, 291–296. [Google Scholar]
  3. Stiaszny, B.; Ziegler, J.C.; Krauß, E.E.; Schmidt, J.P.; Ivers-Tiffée, E. Electrochemical characterization and post-mortem analysis of aged LiMn2O4-Li(Ni0.5Mn0.3Co0.2)O2/graphite lithium ion batteries. Part I: Cycle aging. J. Power Sources 2014, 251, 439–450. [Google Scholar]
  4. Stiaszny, B.; Ziegler, J.C.; Krauß, E.E.; Zhang, M.; Schmidt, J.P.; Ivers-Tiffée, E. Electrochemical characterization and post-mortem analysis of aged LiMn2O4-Li(Ni0.5Mn0.3Co0.2)O2/graphite lithium ion batteries. Part II: Calendar aging. J. Power Sources 2014, 258, 61–75. [Google Scholar]
  5. Waldmann, T.; Wilka, M.; Kasper, M.; Fleischhammer, M.; Wohlfahrt-Mehrens, M. Temperature dependent ageing mechanisms in Lithium-ion batteries—A Post-Mortem study. J. Power Sources 2014, 262, 129–135. [Google Scholar]
  6. Bodenes, L.; Naturel, R.; Martinez, H.; Dedryvère, R.; Menetrier, M.; Croguennec, L.; Pérès, J.P.; Tessier, C.; Fischer, F. Lithium secondary batteries working at very high temperature: Capacity fade and understanding of aging mechanisms. J. Power Sources 2013, 236, 265–275. [Google Scholar]
  7. Williard, N.; He, W.; Osterman, M.; Pecht, M. Comparative analysis of features for determining state of health in lithium-ion batteries. Int. J. Progn. Health Manag. 2013, 4, 1–7. [Google Scholar]
  8. Dubarry, M.; Liaw, B.Y. Identify capacity fading mechanism in a commercial LiFePO4 cell. J. Power Sources 2009, 194, 541–549. [Google Scholar]
  9. Dubarry, M.; Truchot, C.; Liaw, B.Y. Synthesize battery degradation modes via a diagnostic and prognostic model. J. Power Sources 2012, 219, 204–216. [Google Scholar]
  10. Dubarry, M.; Truchot, C.; Liaw, B.Y. Cell degradation in commercial LiFePO4 cells with high-power and high-energy designs. J. Power Sources 2014, 258, 408–419. [Google Scholar]
  11. Ecker, M.; Gerschler, J.B.; Vogel, J.; Käbitz, S.; Hust, F.; Dechent, P.; Sauer, D.U. Development of a lifetime prediction model for lithium-ion batteries based on extended accelerated aging test data. J. Power Sources 2012, 215, 248–257. [Google Scholar]
  12. Käbitz, S.; Gerschler, J.B.; Ecker, M.; Yurdagel, Y.; Emmermacher, B.; André, D.; Mitsch, T.; Sauer, D.U. Cycle and calendar life study of a graphite| LiNi1/3Mn1/3Co1/3O2 Li-ion high energy system. Part A: Full cell characterization. J. Power Sources 2013, 239, 572–583. [Google Scholar]
  13. Ecker, M.; Nieto, N.; Käbitz, S.; Schmalstieg, J.; Blanke, H.; Warnecke, A.; Sauer, D.U. Calendar and cycle life study of Li(NiMnCo)O2-based 18650 lithiumion batteries. J. Power Sources 2014, 248, 839–851. [Google Scholar]
  14. Schmalstieg, J.; Käbitz, S.; Ecker, M.; Sauer, D.U. A holistic aging model for Li(NiMnCo)O2 based 18650 lithium-ion batteries. J. Power Sources 2014, 257, 325–334. [Google Scholar]
  15. Honkura, K.; Horiba, T. Study of the deterioration mechanism of LiCoO2/graphite cells in charge/discharge cycles using the discharge curve analysis. J. Power Sources 2014, 264, 140–146. [Google Scholar]
  16. He, H.; Qin, H.; Sun, X.; Shui, Y. Comparison study on the battery SoC estimation with EKF and UKF algorithms. Energies 2013, 6, 5088–5100. [Google Scholar]
  17. Feng, F.; Lu, R.; Zhu, C. A combined state of charge estimation method for lithium-ion batteries used in a wide ambient temperature range. Energies 2014, 7, 3004–3032. [Google Scholar]
  18. Doyle, M.; Fuller, T.F.; Newman, J. Modeling of galvanostatic charge and discharge of the lithium/polymer/insertion cell. J. Electrochem. Soc. 1993, 140, 1526–1533. [Google Scholar]
  19. Doyle, M.; Newman, J.; Gozdz, A.S.; Schmutz, C.N.; Tarascon, J.M. Comparison of modeling predictions with experimental data from plastic lithium ion cells. J. Electrochem. Soc. 1996, 143, 1890–1903. [Google Scholar]
  20. Safari, M.; Delacourt, C. Modeling of a commercial graphite/LiFePO4 cell. J. Electrochem. Soc. 2011, 158, A562–A571. [Google Scholar]
  21. Ye, Y.; Shi, Y.; Tay, A.O. Electro-thermal cycle life model for lithium iron phosphate battery. J. Power Sources 2012, 217, 509–518. [Google Scholar]
  22. Zhang, Q.; White, R.E. Calendar life study of Li-ion pouch cells: Part 2: Simulation. J. Power Sources 2008, 179, 785–792. [Google Scholar]
  23. Zhang, Q.; White, R.E. Capacity fade analysis of a lithium ion cell. J. Power Sources 2008, 179, 793–798. [Google Scholar]
  24. Delacourt, C.; Safari, M. Life simulation of a graphite/LiFePO4 cell under cycling and storage. J. Electrochem. Soc. 2012, 159, A1283–A1291. [Google Scholar]
  25. Schmidt, A.P.; Bitzer, M.; Imre, Á.W.; Guzzella, L. Model-based distinction and quantification of capacity loss and rate capability fade in Li-ion batteries. J. Power Sources 2010, 195, 7634–7638. [Google Scholar]
  26. Ramadesigan, V.; Chen, K.; Burns, N.A.; Boovaragavan, V.; Braatz, R.D.; Subramanian, V.R. Parameter estimation and capacity fade analysis of lithium-ion batteries using reformulated models. J. Electrochem. Soc. 2011, 158, A1048–A1054. [Google Scholar]
  27. Fu, R.; Choe, S.Y.; Agubra, V.; Fergus, J. Modeling of degradation effects considering side reactions for a pouch type Li-ion polymer battery with carbon anode. J. Power Sources 2014, 261, 120–135. [Google Scholar]
  28. Zhang, L.; Lyu, C.; Hinds, G.; Wang, L.; Luo, W.; Zheng, J.; Ma, K. Paremeter sensitivity analysis of cylindrical LiFePO4 battery performance using multi-physics modeling. J. Electrochem. Soc. 2014, 161, A762–A776. [Google Scholar]
  29. Zhang, L.; Wang, L.; Hinds, G.; Lyu, C.; Zheng, J.; Li, J. Multi-objective optimization of lithium-ion battery model using genetic algorithm approach. J. Power Sources 2014, 270, 367–378. [Google Scholar]
  30. Yang, H.; Prakash, J. Determination of the reversible and irreversible heats of a LiNi0.8Co0.15Al0.05O2/natural graphite cell using electrochemical-calorimetric technique. J. Electrochem. Soc. 2004, 151, A1222–A1229. [Google Scholar]
  31. Ohzuku, T.; Iwakoshi, Y.; Sawai, K. Formation of lithium-graphite intercalation compounds in nonaqueous electrolytes and their application as a negative electrode for a lithium ion (shuttlecock) cell. J. Electrochem. Soc. 1993, 140, 2490–2498. [Google Scholar]
  32. Guo, M.; Sikha, G.; White, R.E. Single-particle model for a lithium-ion cell: Thermal behavior. J. Electrochem. Soc. 2011, 158, A122–A132. [Google Scholar]
  33. Drake, S.J.; Wetz, D.A.; Ostanek, J.K.; Miller, S.P.; Heinzel, J.M.; Jain, A. Measurement of anisotropic thermophysical properties of cylindrical Li-ion cells. J. Power Sources 2014, 252, 298–304. [Google Scholar]
  34. Newman, J. FORTRAN Programs for the Simulation of Electrochemical Systems. Available online: http://www.cchem.berkeley.edu/jsngrp/ (accessed on 10 September 2014).
  35. Zhang, L.; Lyu, C.; Wang, L.; Luo, W.; Ma, K. Thermal-electrochemical modeling and parameter sensitivity analysis of lithium-ion battery. Chem. Eng. Trans. 2013, 33, 943–948. [Google Scholar]
  36. Zhang, L.; Lyu, C.; Wang, L.; Zheng, J.; Luo, W.; Ma, K. Parallelized genetic identification of the thermal-electrochemical model for lithium-ion battery. Adv. Mech. Eng. 2013, 2013. [Google Scholar] [CrossRef]
  37. Wang, J.; Liu, P.; Hicks-Garner, J.; Sherman, E.; Soukiazian, S.; Verbrugge, M.; Tataria, H.; Musser, J.; Finamore, P. Cycle-life model of graphite-LiFePO4 cells. J. Power Sources 2011, 196, 3942–3948. [Google Scholar]
  38. Stevens, D.A.; Ying, R.Y.; Fathi, R.; Reimers, J.N.; Harlow, J.E.; Dahn, J.R. Using high precision coulometry measurements to compare the degradation mechanisms of NMC/LMO and NMC-only automotive scale pouch cells. J. Electrochem. Soc. 2014, 161, A1364–A1370. [Google Scholar]
  39. Fuller, T.F.; Doyle, M.; Newman, J. Relaxation phenomena in lithium-ion-insertion cells. J. Electrochem. Soc. 1994, 141, 982–990. [Google Scholar]
  40. Chiu, K.C.; Lin, C.H.; Yeh, S.F.; Lin, Y.H.; Huang, C.S.; Chen, K.C. Cycle life analysis of series connected lithium-ion batteries with temperature difference. J. Power Sources 2014, 263, 75–84. [Google Scholar]

