1. Introduction
Nowadays, energy consumption is rising every year in every country. This permanent increase will not be sustainable in the long run, and energy saving has become an important environmental concern. Spain is not different in this trend as it can be seen in
Table 1. Industry is the only case of decrease in final energy consumption, while the residential sector had one of the biggest rises, of about 28%.
Table 1.
Final energy consumption by sector in Spain (Mtoe) [
1].
Table 1.
Final energy consumption by sector in Spain (Mtoe) [1].
| Country | Total | Industry | Transport | Residential | Services |
|---|
| Period | 2001 | 2011 | 2001 | 2011 | 2001 | 2011 | 2001 | 2011 | 2001 | 2011 |
| Spain | 83.50 | 86.53 | 27.13 | 21.18 | 34.32 | 36.04 | 12.61 | 16.22 | 7.05 | 9.54 |
In the case of Spanish residential buildings, energy consumption is divided as follows: space heating 46%, domestic hot water 20%, appliances 16%, cooking 10% and lighting 7% [
2]. Research results shown in this paper are focused on Domestic Hot Water (DHW), which is the second most important energy consumption, justifying efforts made to reduce it.
The average energy consumption of Spanish households is 10521 kWh per year [
3]; which means that energy consumption in DHW is 2104.2 kWh per year. However, not every single home consumes the same amount of energy. If we compare consumption in houses with different weather conditions like houses in the North Atlantic Area, with lower temperatures, and houses in the Mediterranean Area, with higher, we can notice a huge difference in consumption. Data from the three main areas to consider can be seen in
Table 2.
Table 2.
Annual average domestic hot water (DHW) energy consumption per house in different regions from Spain [
3].
Table 2.
Annual average domestic hot water (DHW) energy consumption per house in different regions from Spain [3].
| Region | Number of Provinces | Annual Average Energy Consumption (kWh) |
|---|
| North Atlantic Area | 6 | 2262.40 |
| Mediterranean Area | 18 | 1755.90 |
| Continental Area | 28 | 2286.50 |
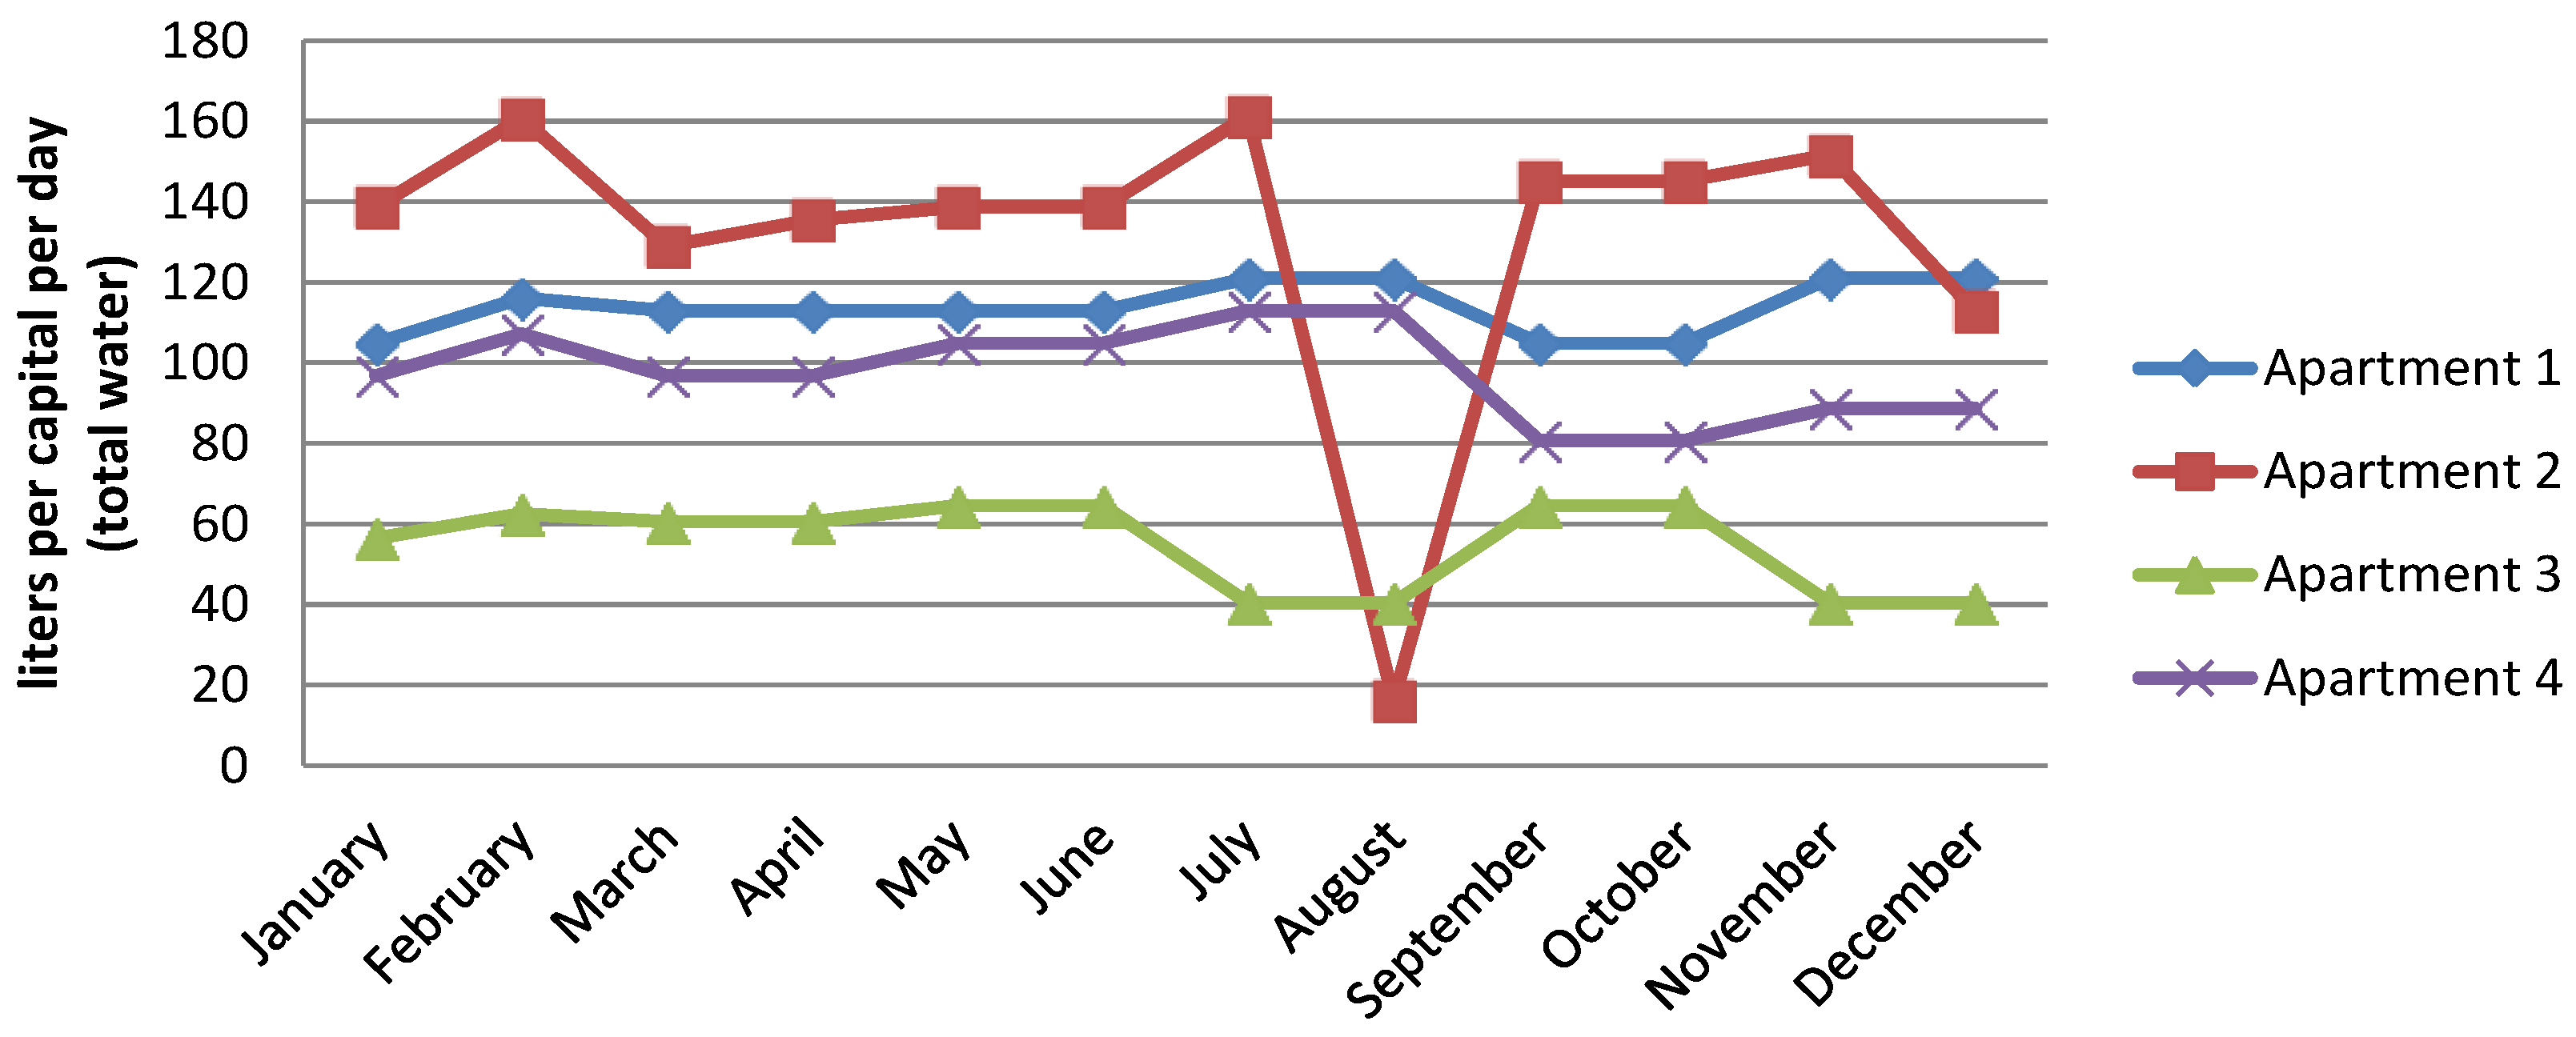
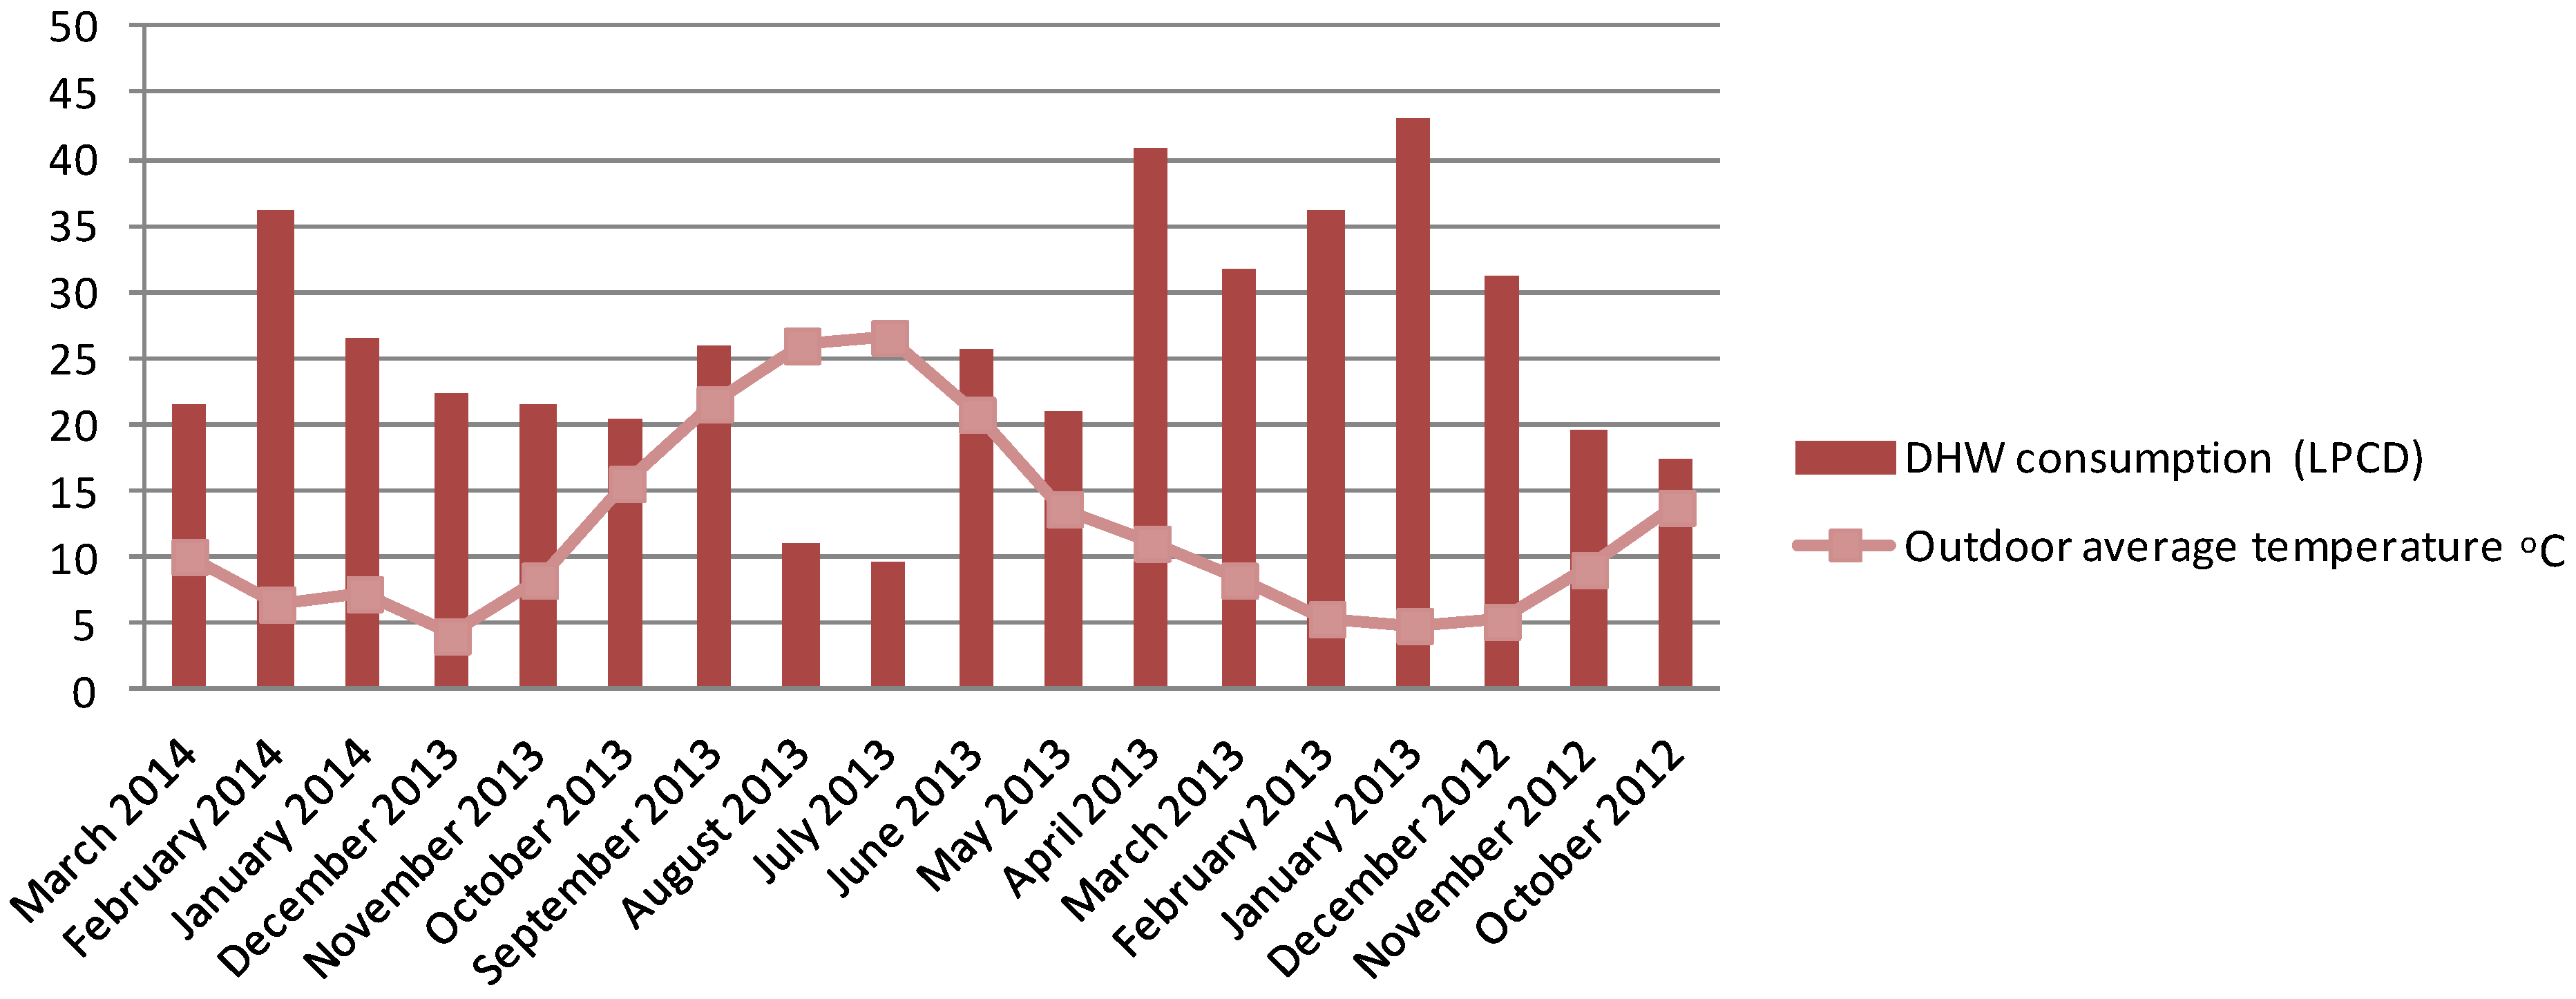
Recent research made by Rodriguez-Hidalgo [
4] shows that DHW consumption depends not only on the geographical situation, but also on people’s habits, the time of year, and the purpose of the building. Differences shown in
Table 2 could be caused by inlet temperature of cold water or other parameters. We made a review of variables affecting the amount of energy used to heat water in order to find the reason for differences.
The first step is to try to understand factors influencing energy consumption and to observe existing models. However, although several DHW consumption models exist, they are often outdated and most fail to identify the influence of the number of occupants in the dwellings [
5]. A good example of that is the model developed by Gilbert [
6] for Electric Power Research (EPRI). This model was based on data collected before 1980 but buildings and their uses have evolved since this date. In addition, this model has another huge drawback in the sample chosen, which was based only on data from single-family houses. Another example is the ERÅD model (EnergiRÅDgivning) [
7], which decomposes household electricity consumption into different end uses (hot water, lighting, electric appliances and space heating). In this case, data used to create the model was collected in 1990 and could be outdated.
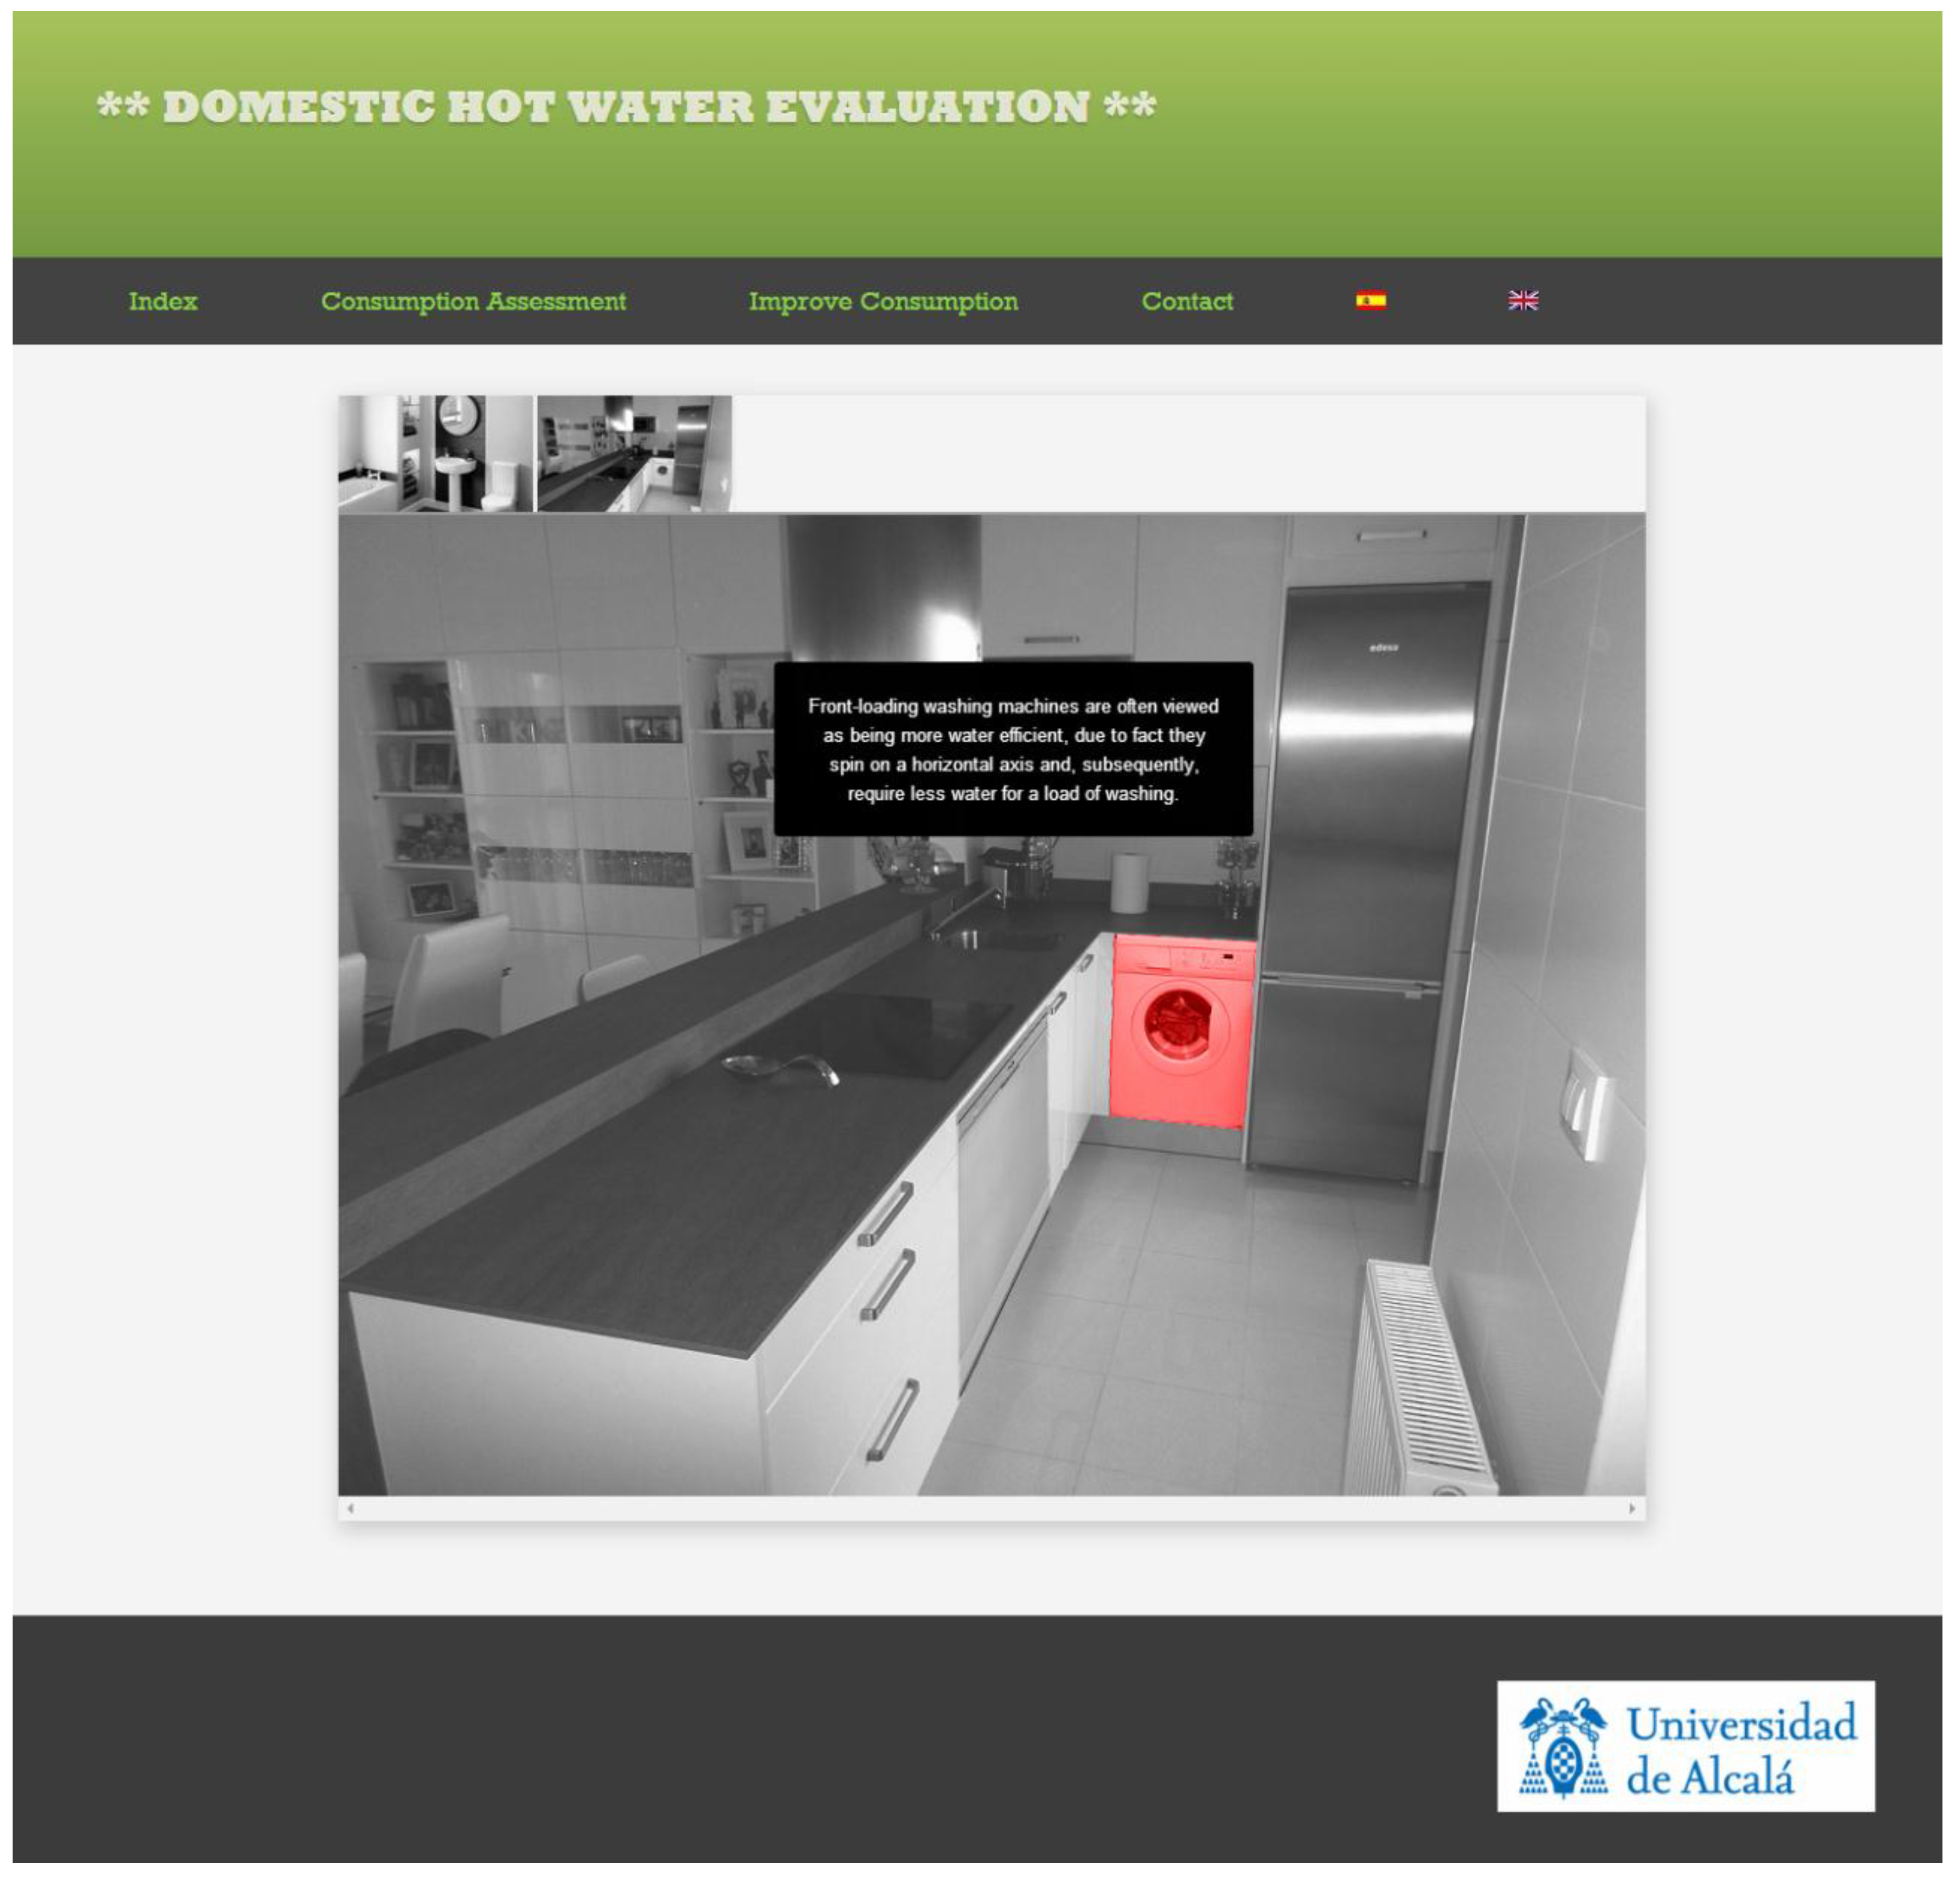
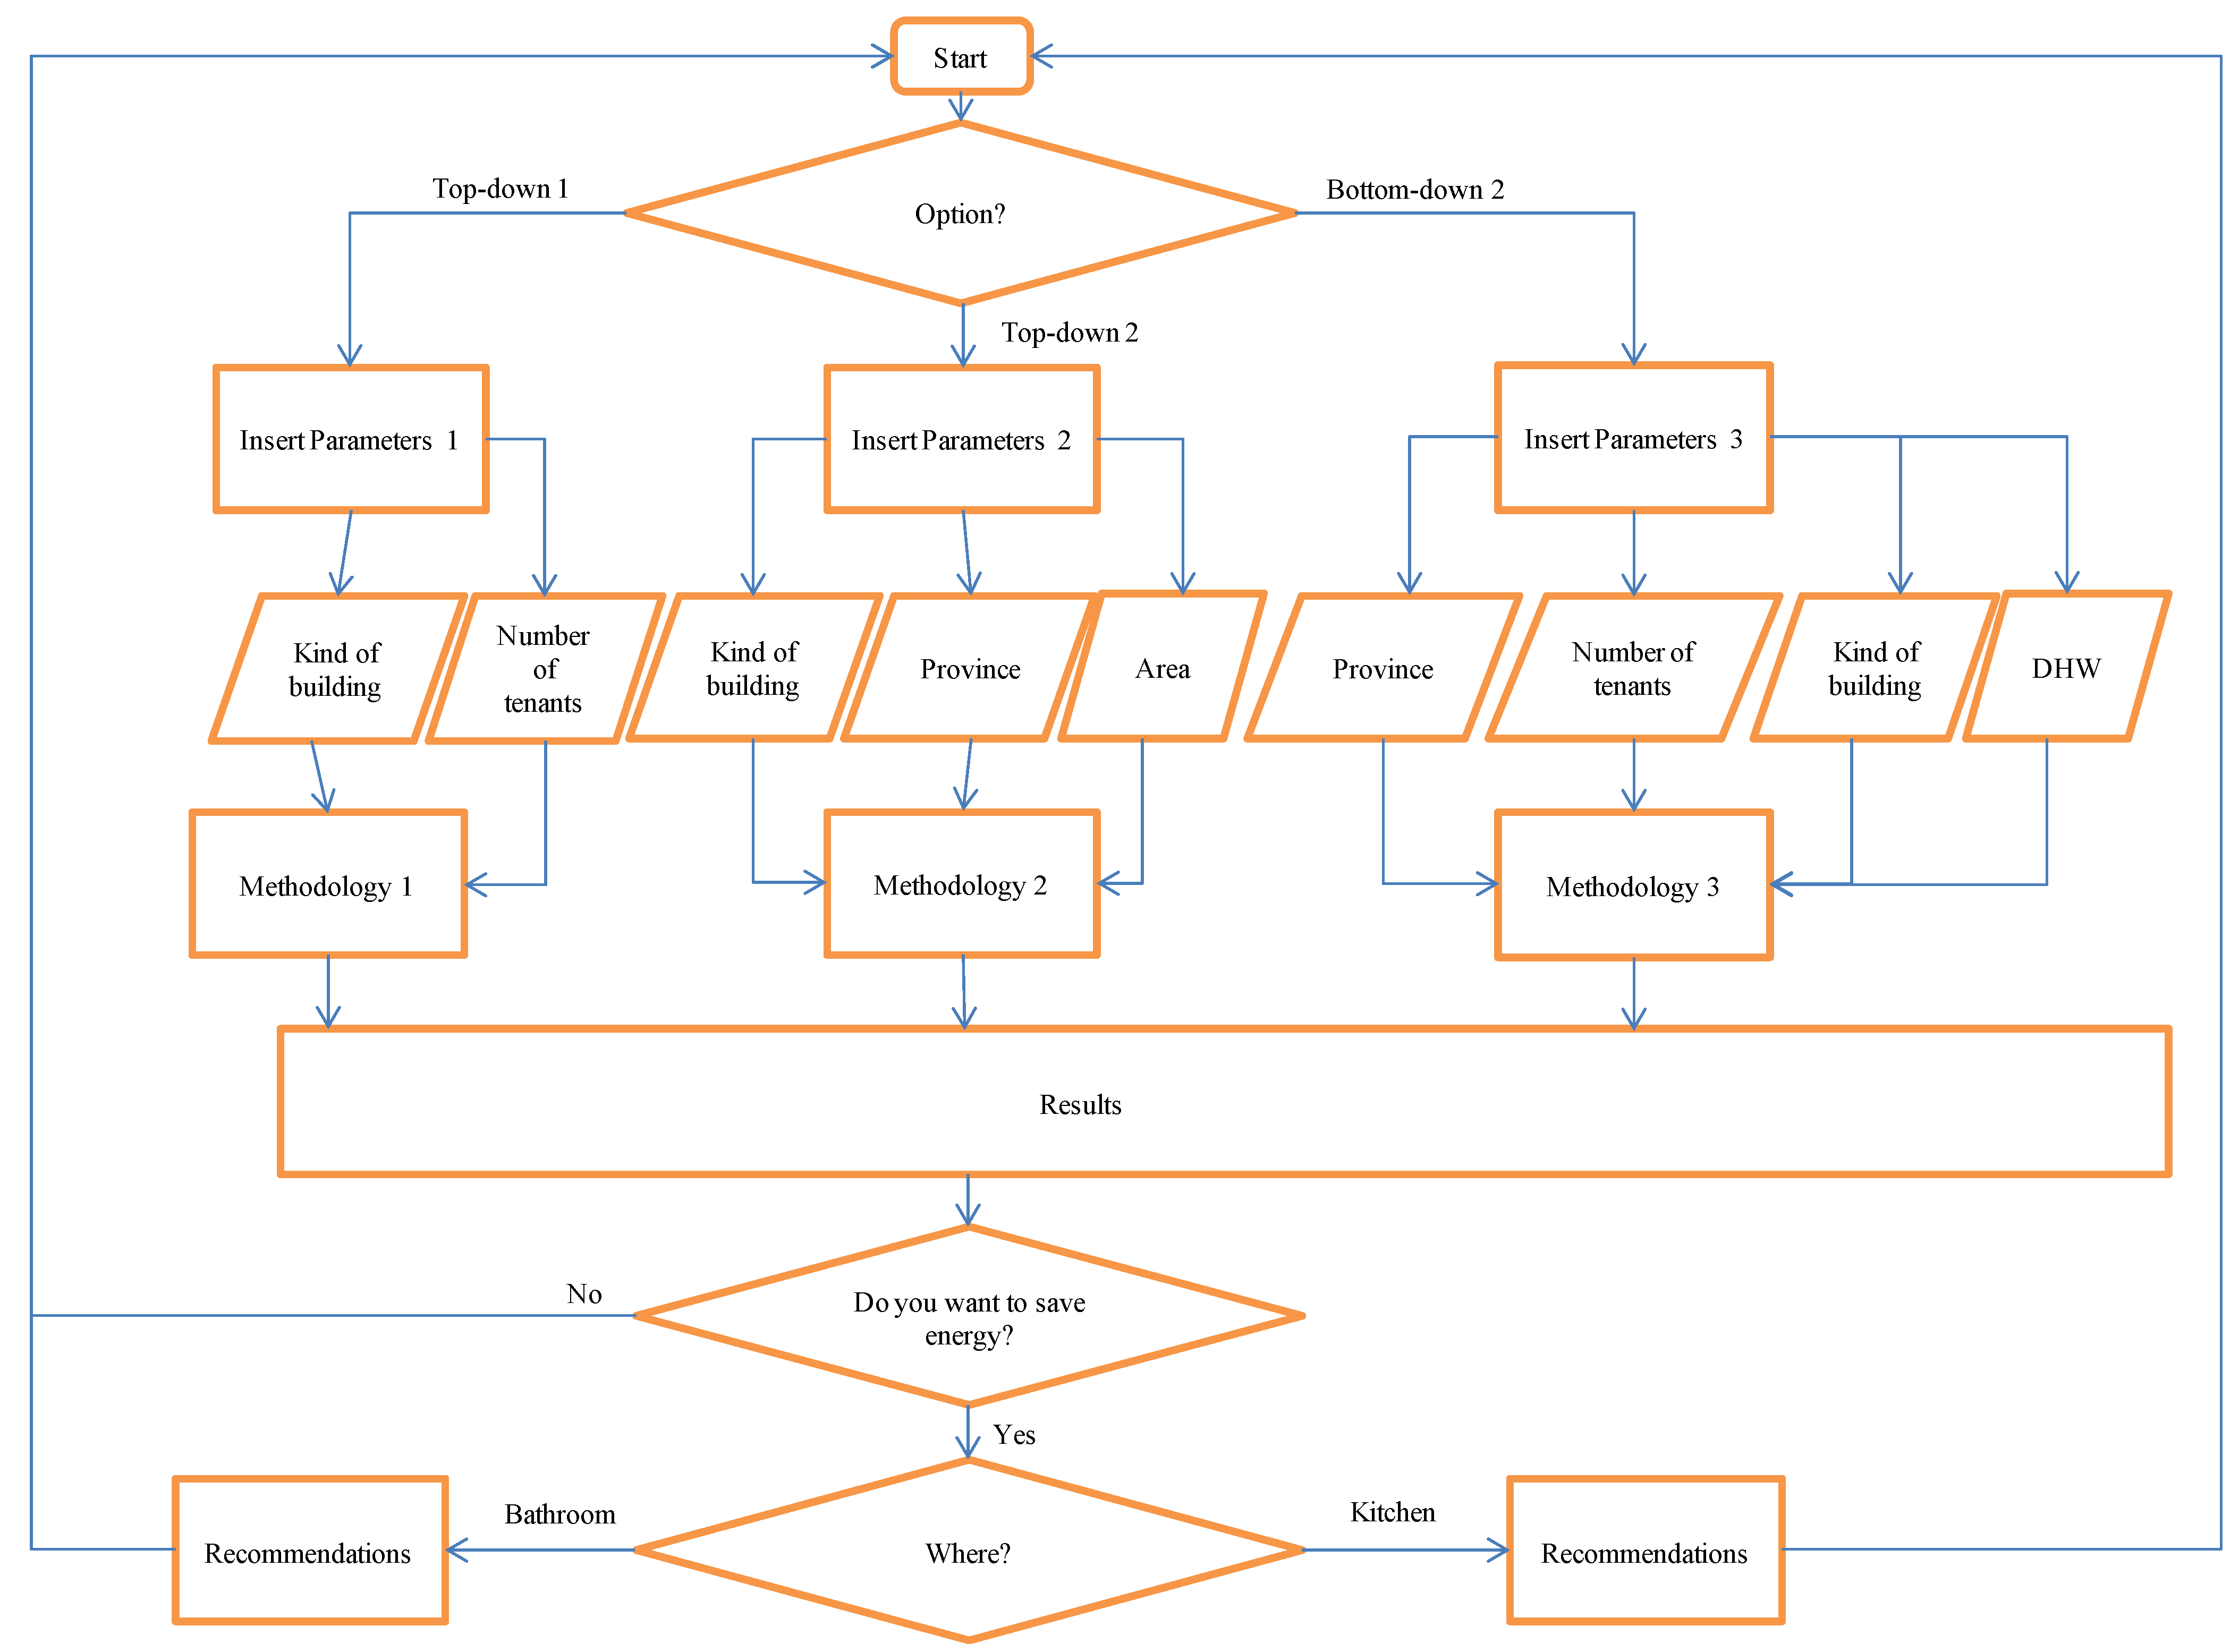
The main goal of this work was to update data of existing methodologies through an analysis of DHW consumption. The secondary goal was to create a website to allow households to estimate their DHW energy consumption. This secondary goal was introduced taking into account that one of the challenges to improve the efficiency of DHW use is that most of people are not aware of how DHW is consumed and managed in their homes [
8]. The site allows estimation using three different models depending on the available information, giving citizens an evaluation of their consumption and providing them with knowledge of how to reduce it.
The remainder of this paper is organized as follows. The following section contains the analysis of parameters used in methodologies, then methodologies are analyzed and updated in the next section. The website and its contributions are described in the fourth section and, finally, results and conclusions are shown.
3. Methodologies
There are a few methodologies commonly used for the estimation of the DHW demand [
30]. The system developed allows users to obtain the estimation of electrical energy by applying three methodologies.
For the first methodology it was considered appropriated to use the estimation of the electrical energy consumption following the procedure collected in the document made by the Spanish Institute for Diversification and Energy Saving (IDAE, Instituto para la Diversificación y Ahorro de la Energía) [
31] which tries to obtain the energy demand based on the number of tenants. This method establishes 573 kWh per capita for detached houses and 420 kWh per capita for apartments. To obtain the previous data, it was estimated the water consumption per user following the standard UNE (Una Norma Española) 94002:2005 [
14]. Other variables considered were cold inlet temperature (15 °C) and delivered temperature (60 °C).
For the second methodology, the system needs the specification of the kind of residential building (apartment or detached), the province and the household area. The data used in this option is based on two studies [
32,
33] made by the University of Seville. This option takes into account more specific parameters than the previous one. However, it is not able to estimate the consumption per month only annual consumption is offered.
Table 8 shows the coefficients to estimate it in some provinces.
Table 8.
Coefficients to estimate electrical energy consumption (kWh/m2 per year).
Table 8.
Coefficients to estimate electrical energy consumption (kWh/m2 per year).
| Province | Residential Building |
|---|
| Apartment | Detached |
|---|
| Albacete | 13.1 | 17.9 |
| Alicante | 12.3 | 16.8 |
| Almeria | 12.1 | 16.6 |
| Avila | 13.7 | 18.7 |
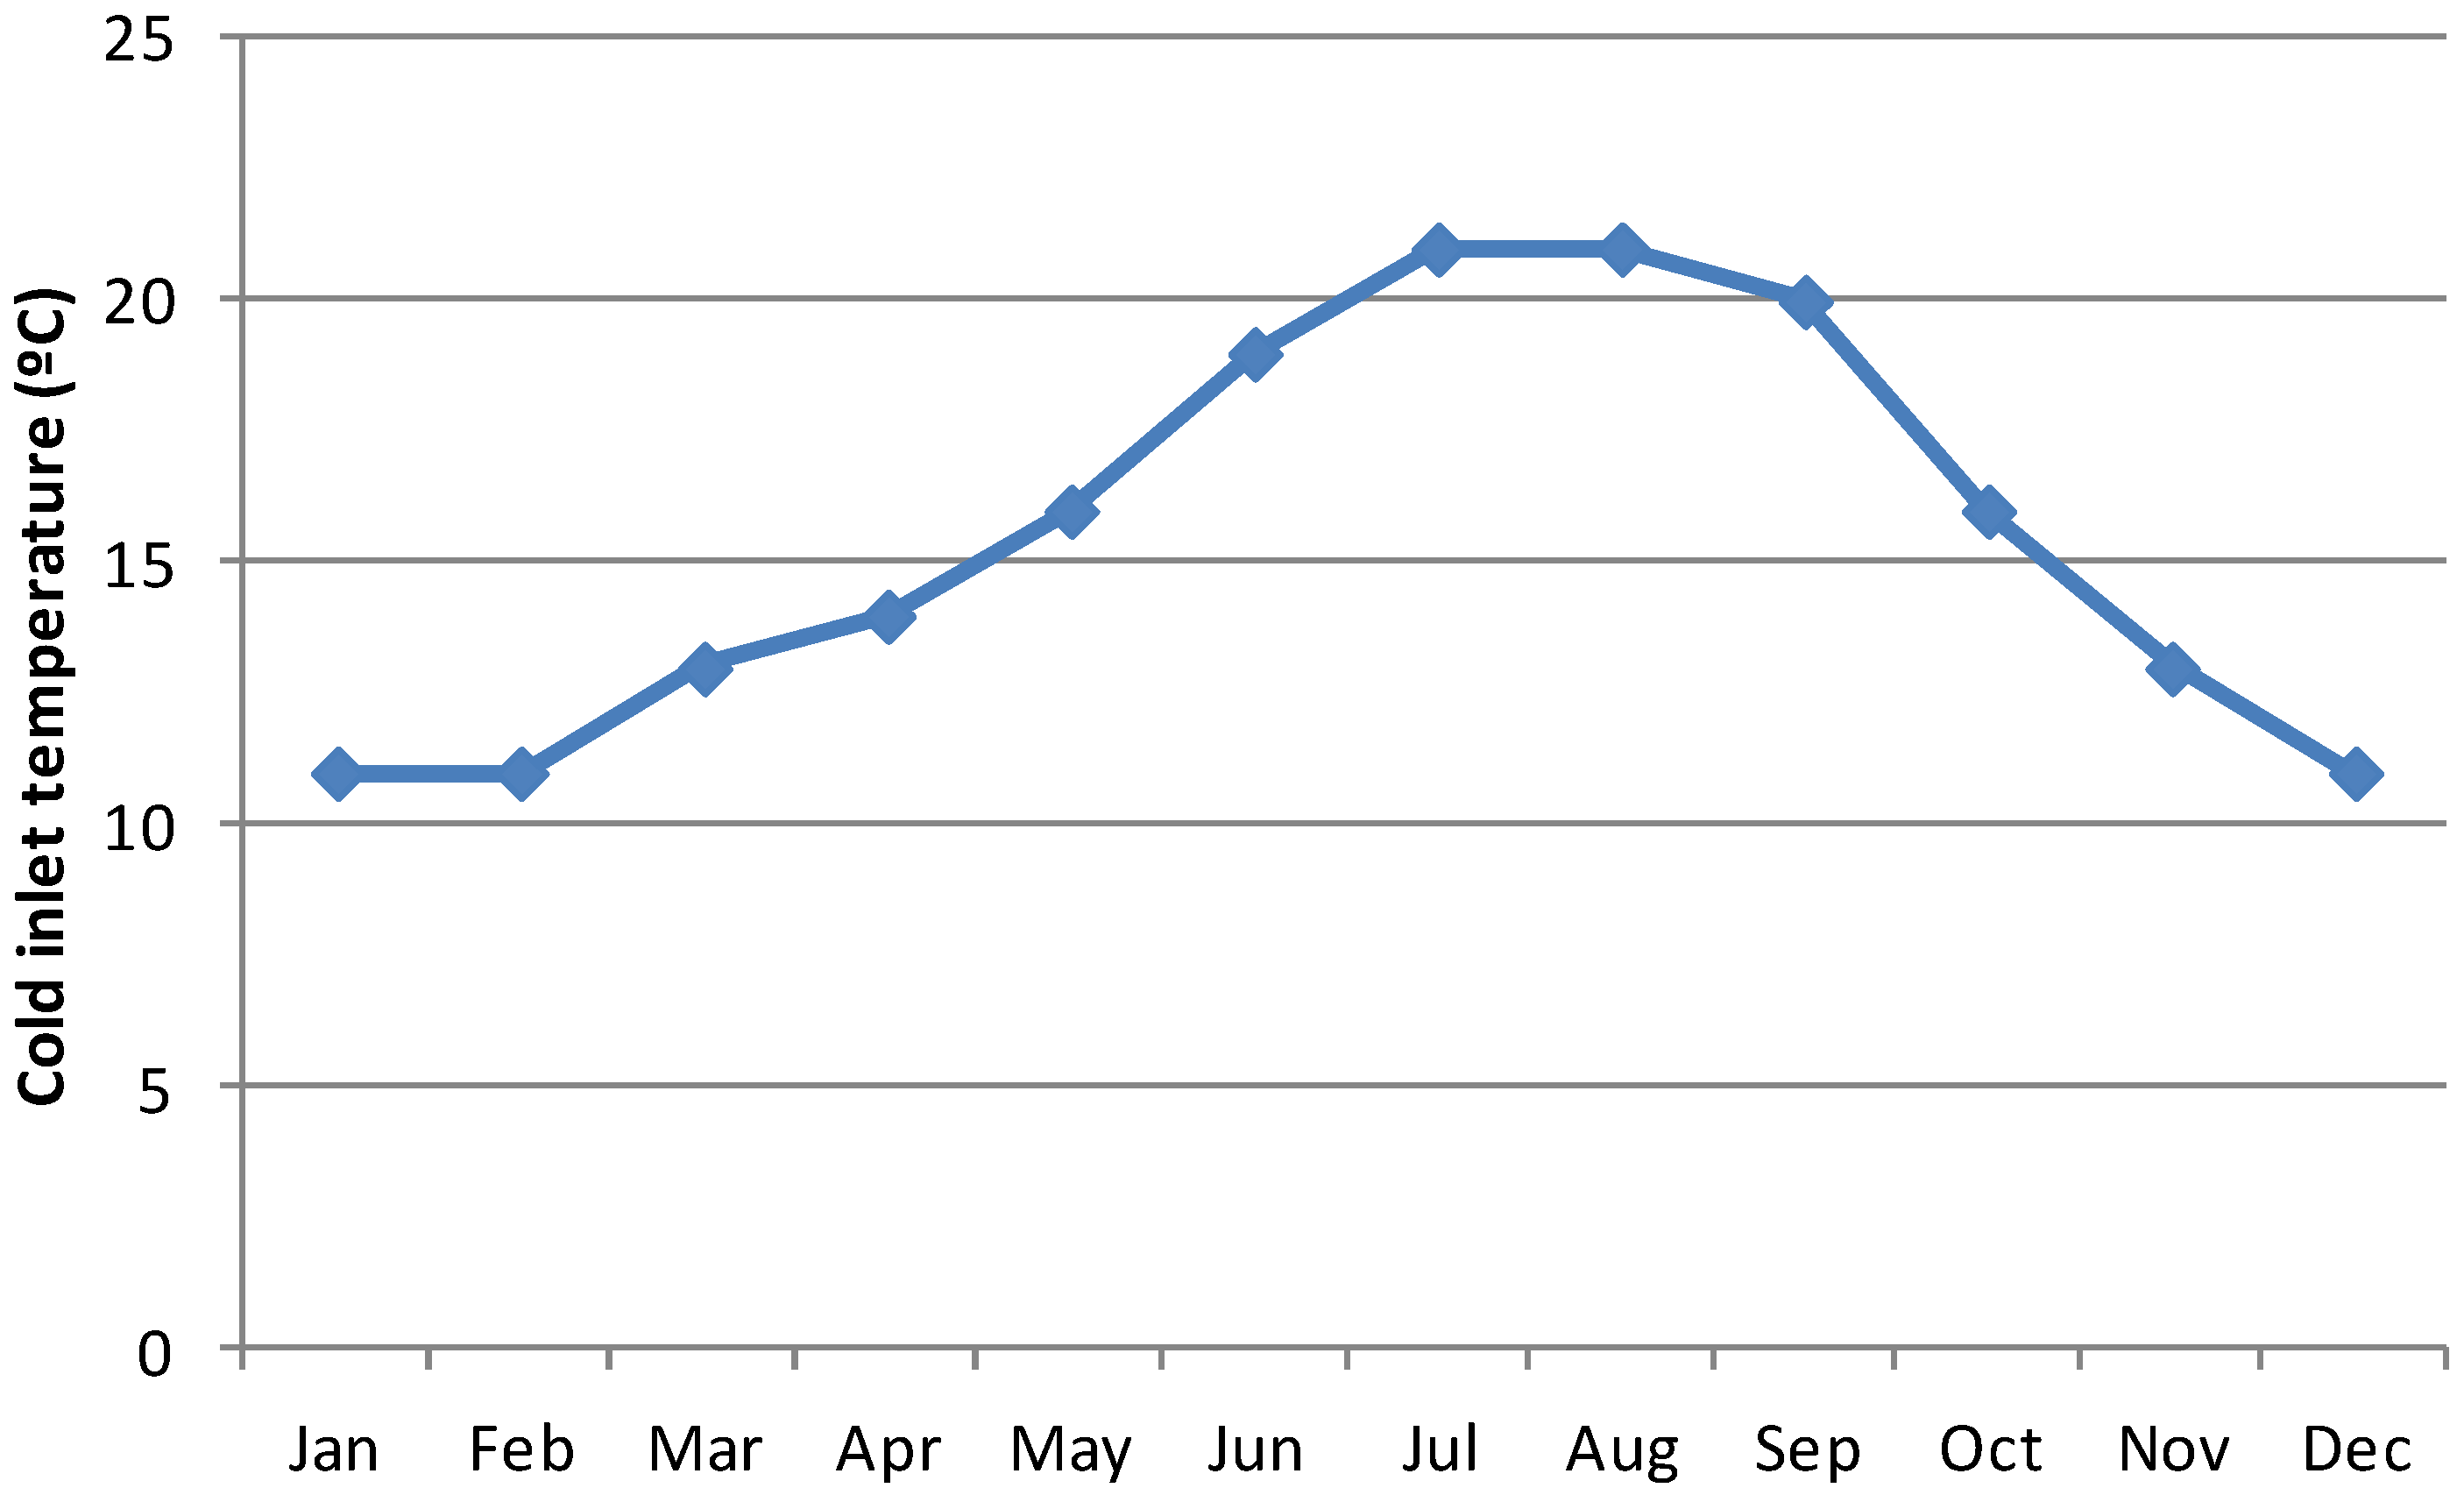
In the last methodology, more parameters are needed as, for example, the cold inlet temperature. It was taken into account the equation included in the normative UNE 94002:2005 [
14]. This option allows obtaining the electrical energy consumption per month using the following Formula:
where:
Dmonth: number of days in the month;
ρ: density of water (kg/L);
Cp: specific heat of water (kWh/kg °C);
Tref: reference temperature (°C);
Tcw: cold inlet temperature (°C);
QDHW: DHW at reference temperature (LPCD).
Once equations are defined, values used in the system must be defined. If users do not know some parameters, the application has to assume them like amount of DHW.
Table 9 shows the amount of DHW per person per day considered.
Table 9.
Amount of DHW considered in the third option.
Table 9.
Amount of DHW considered in the third option.
| Season | Domestic Hot Water (LPCD) |
|---|
| Apartment Houses | Detached Houses |
|---|
| Autumn | 21 | 30 |
| Winter | 22 | 32 |
| Spring | 23 | 33 |
| Summer | 19 | 29 |
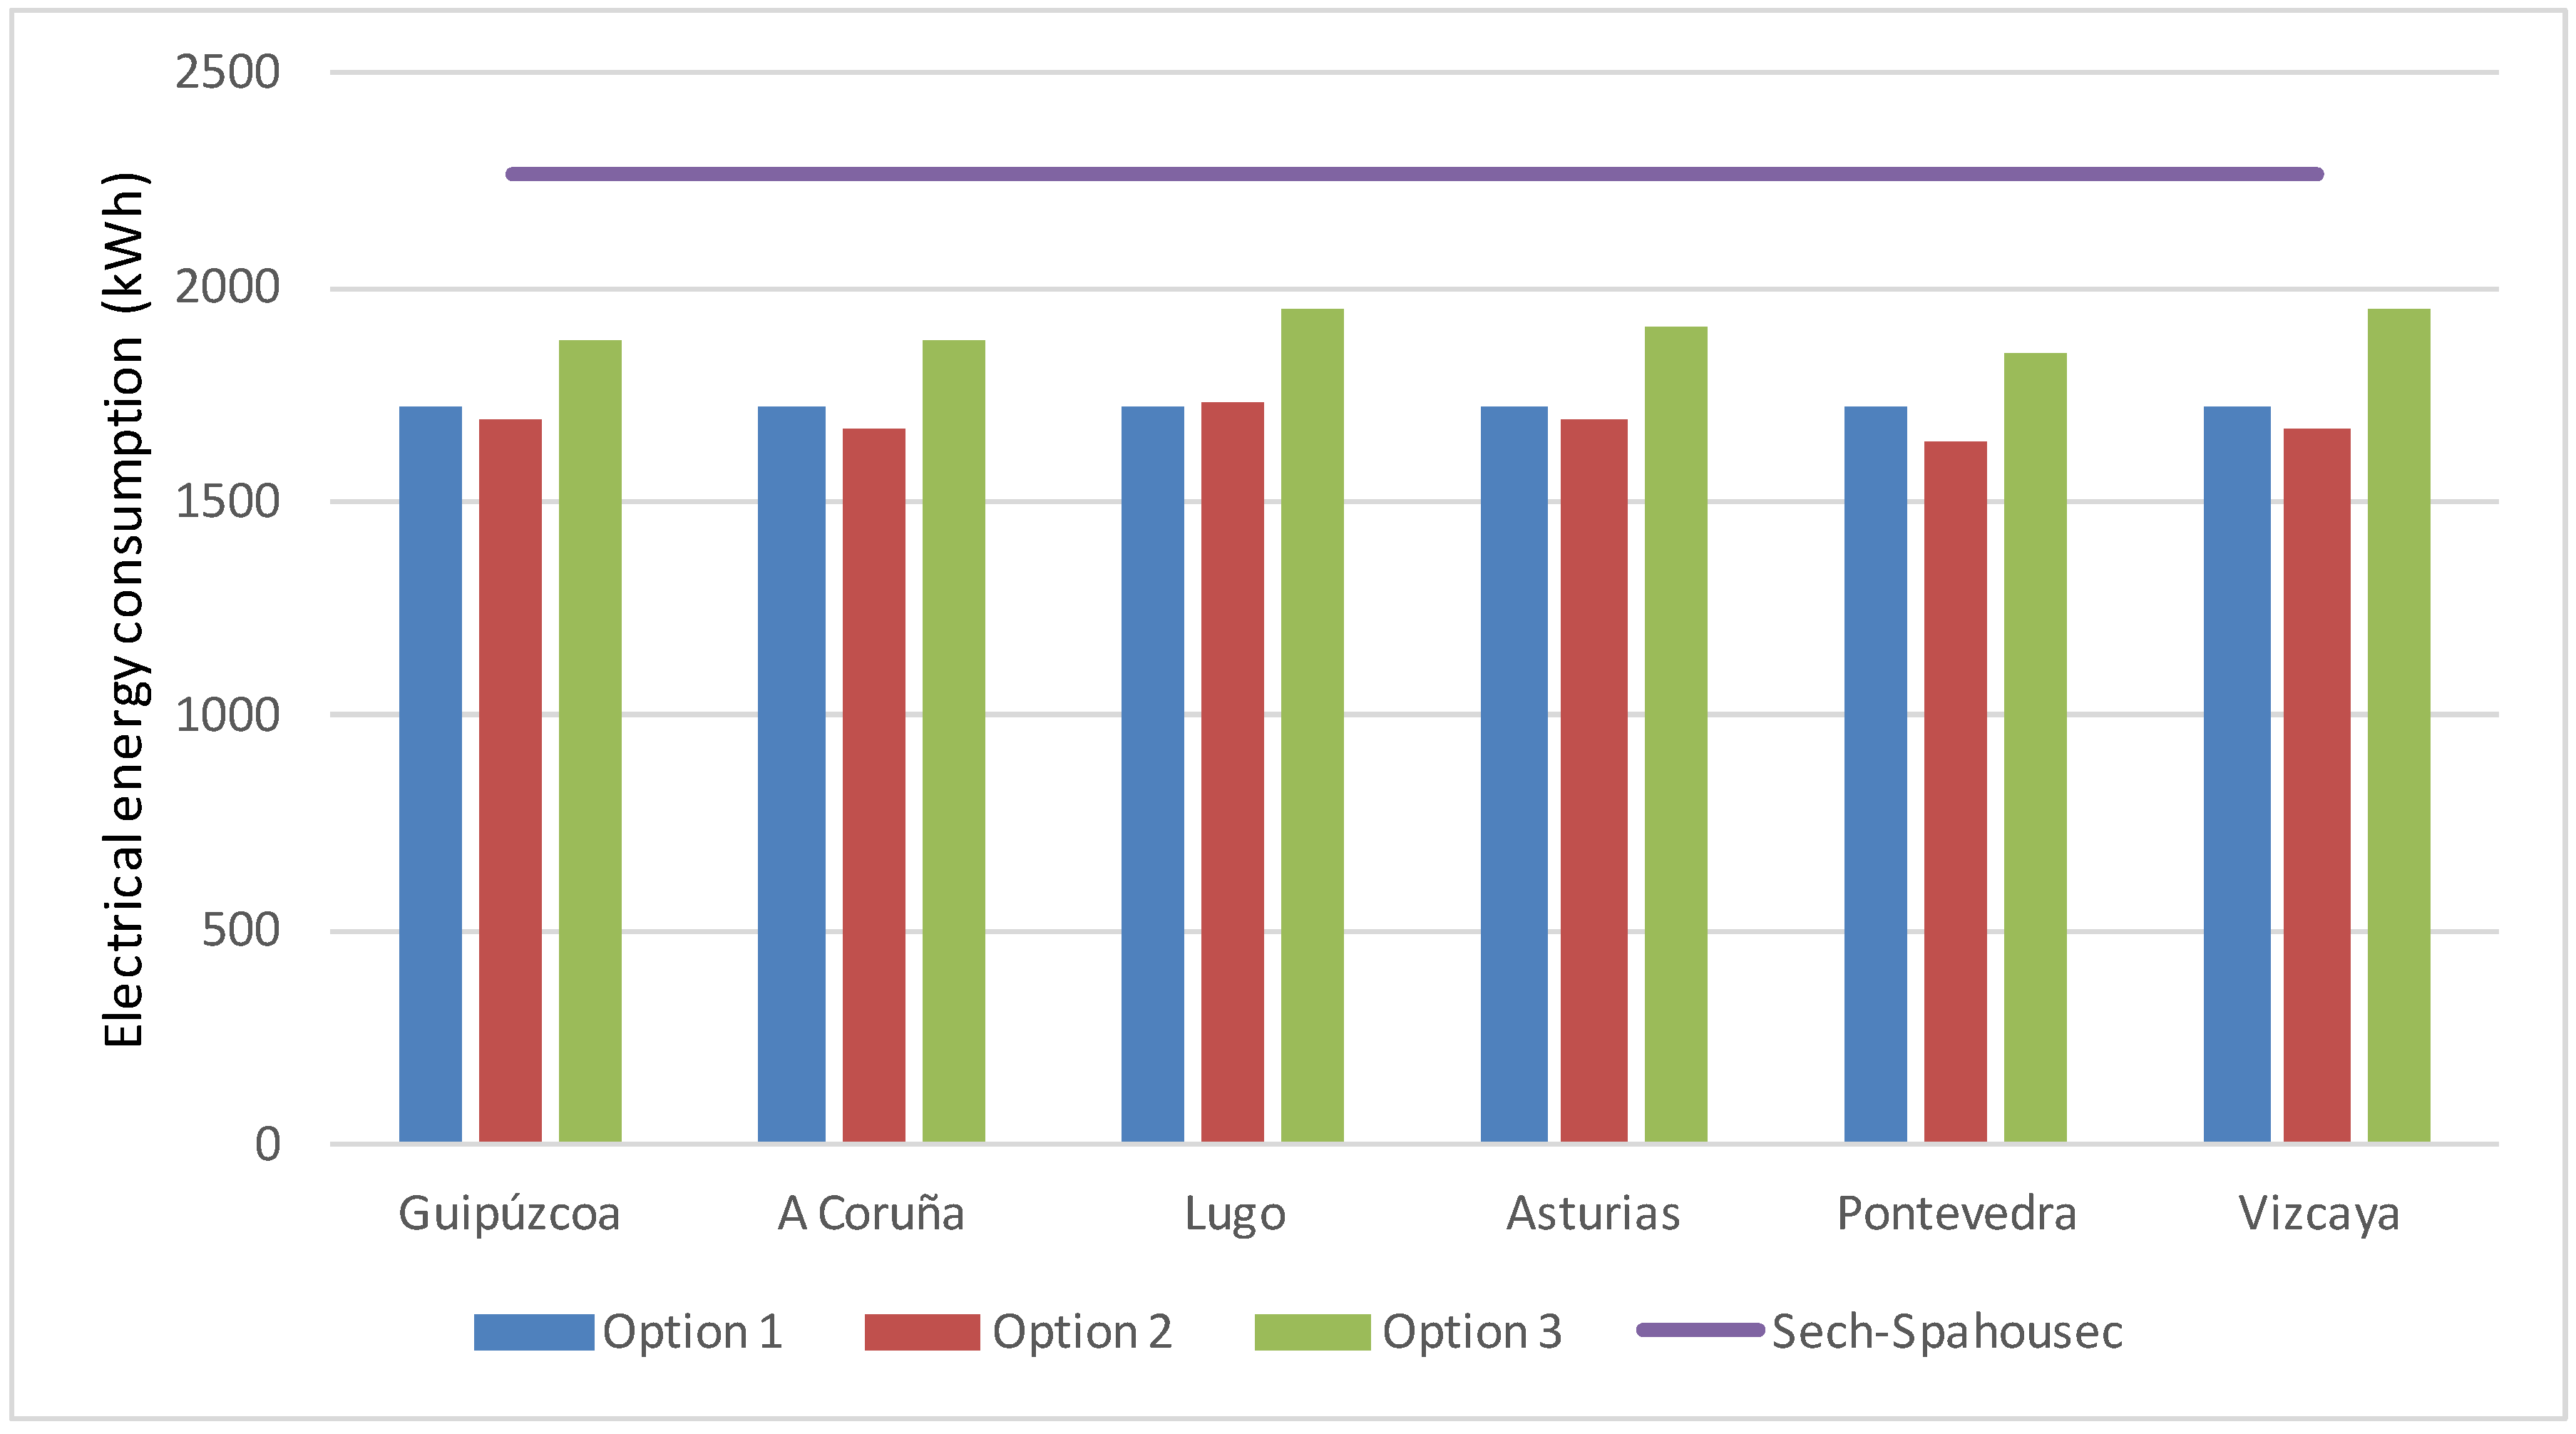
The best way to check the correctness of these methodologies of calculation is by confronting it with the information of SECH-SPAHOUSEC project [
3] which is the result of a survey on one hundred properties, thirty three per each climate zone. In this project, Spain was divided into three areas: North Atlantic, Continental and Mediterranean.
The main benefit of our methodologies is that they are able to estimate this consumption in each province, while the previous projects gave only the average consumption in each climatic zone. To be coherent with the confrontation, the assumptions considered in the different methodologies are: the number of tenants is three [
34] and the average area of residential buildings in the case in North Atlantic is 93.7 m
2, in Continental zone is 103.5 m
2 and in Mediterranean zone is 103.8 m
2 [
3].
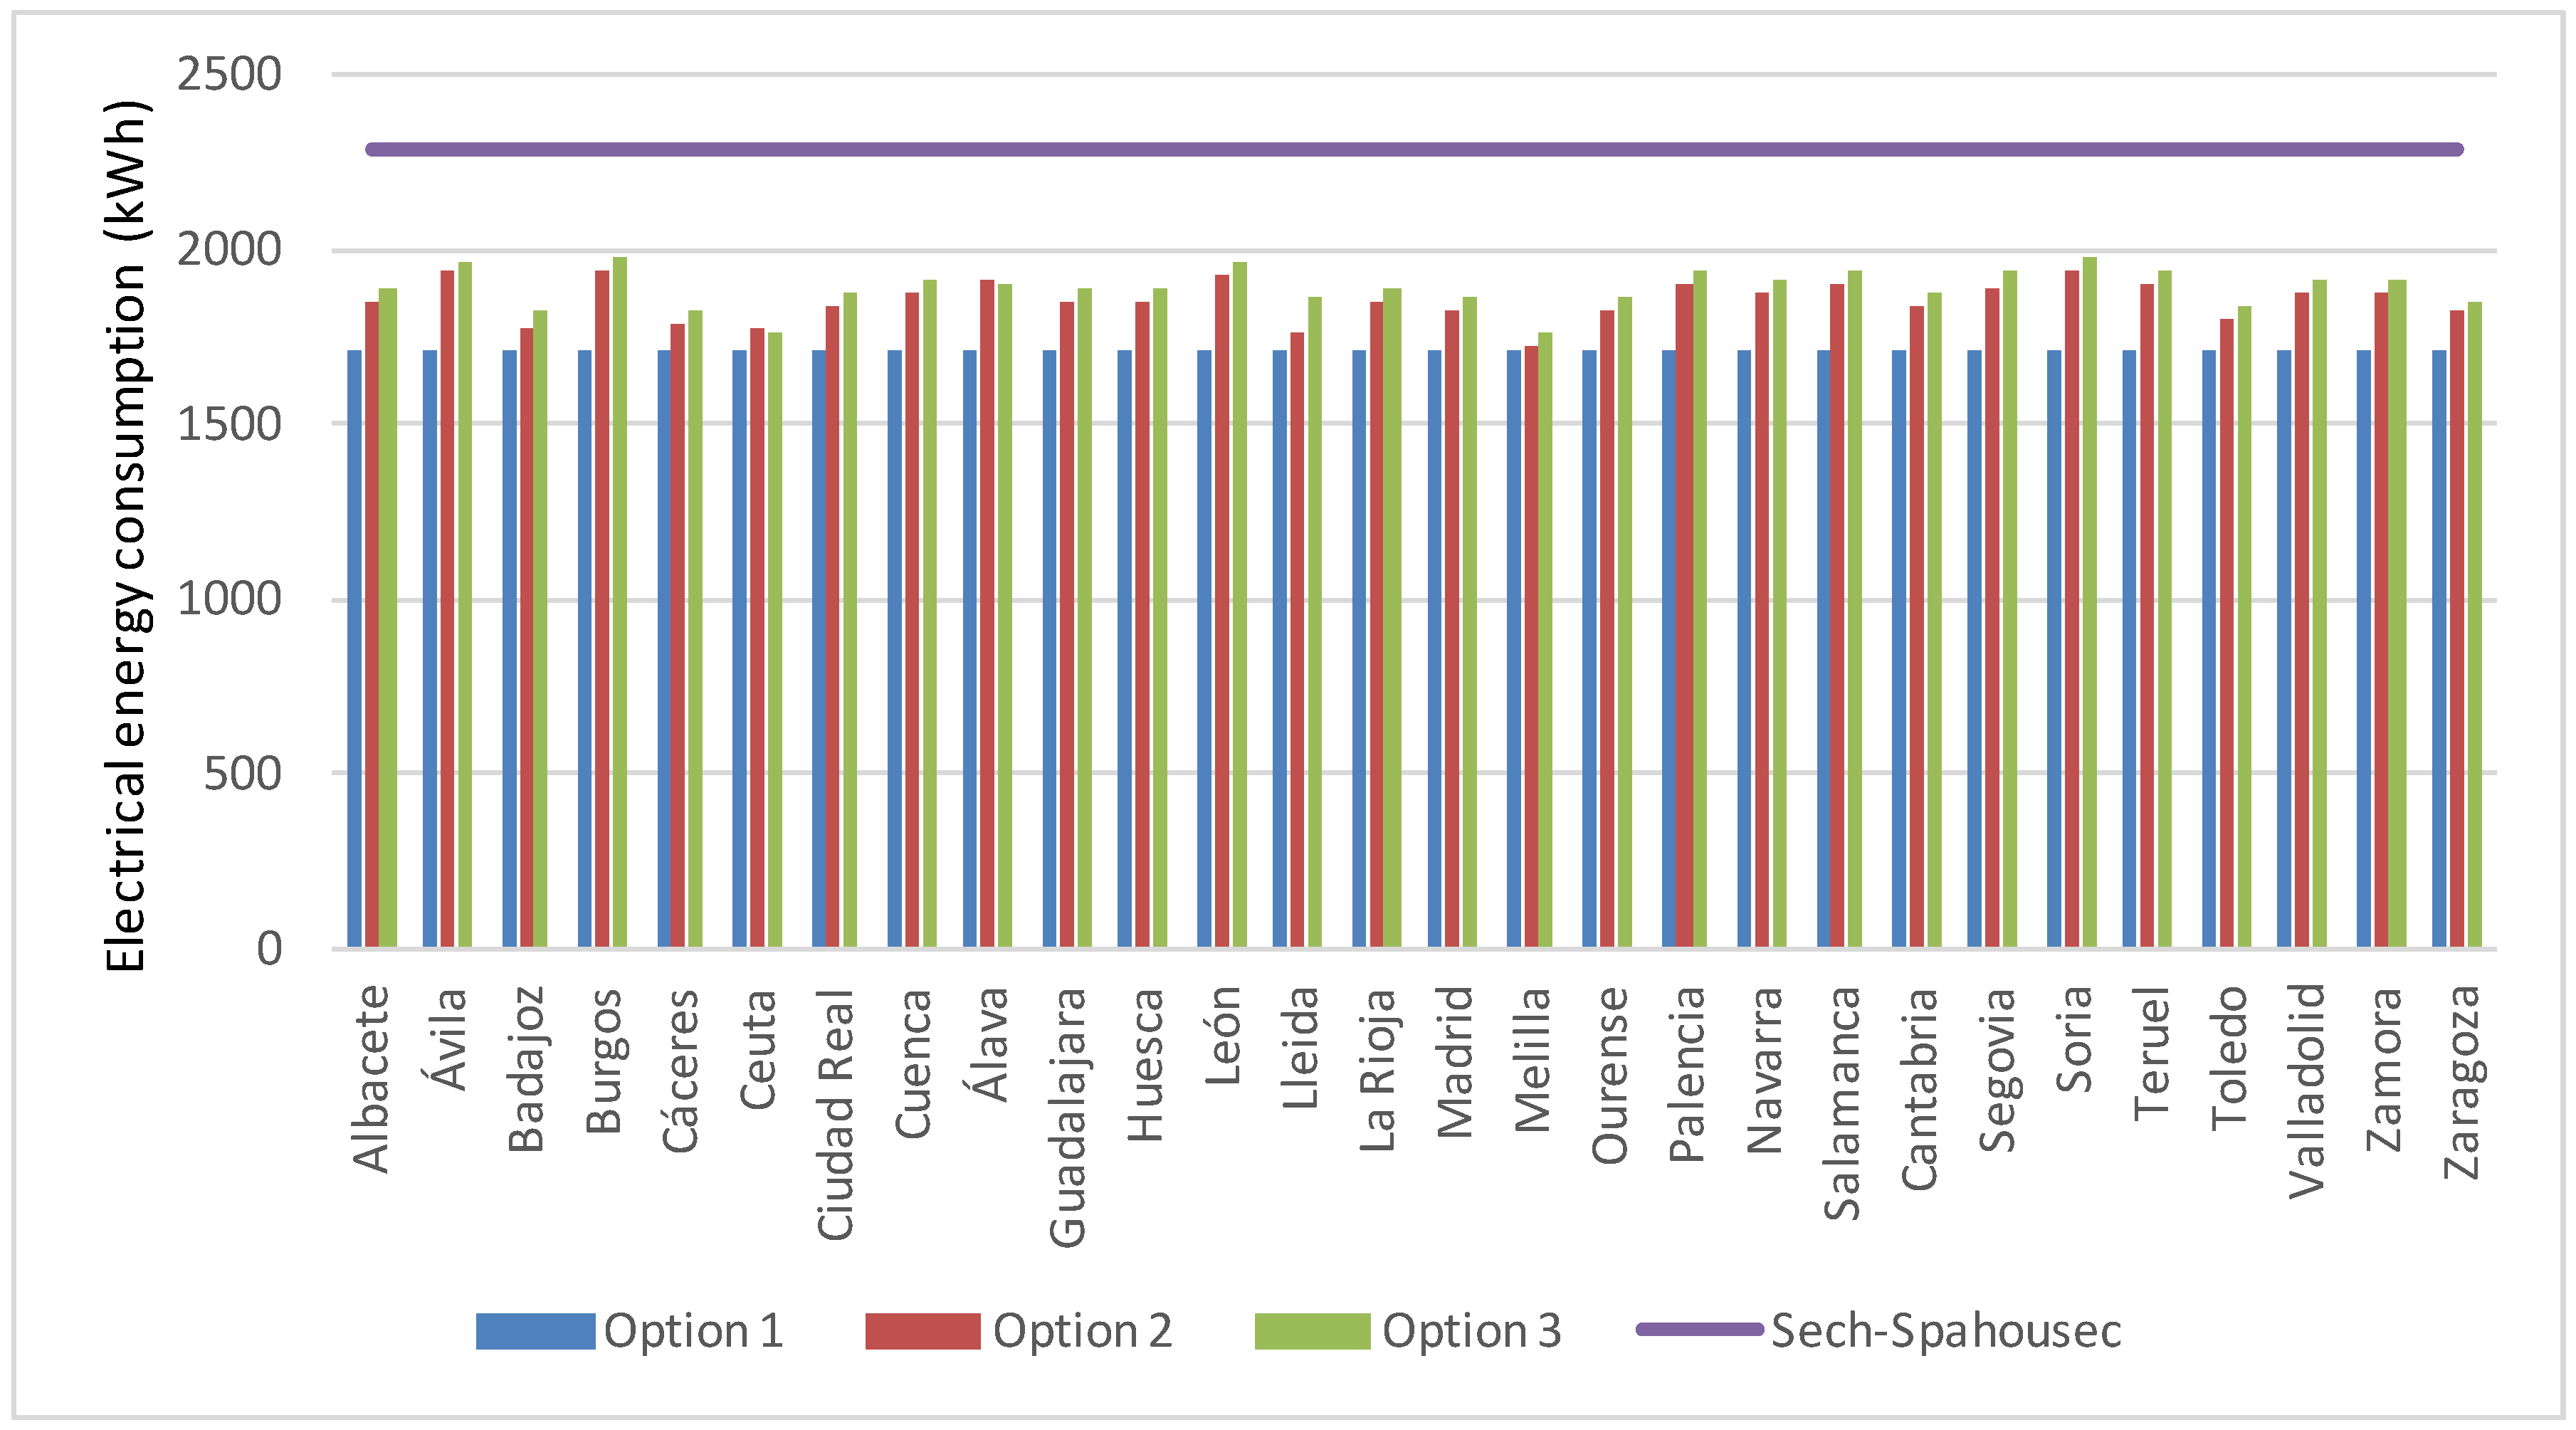
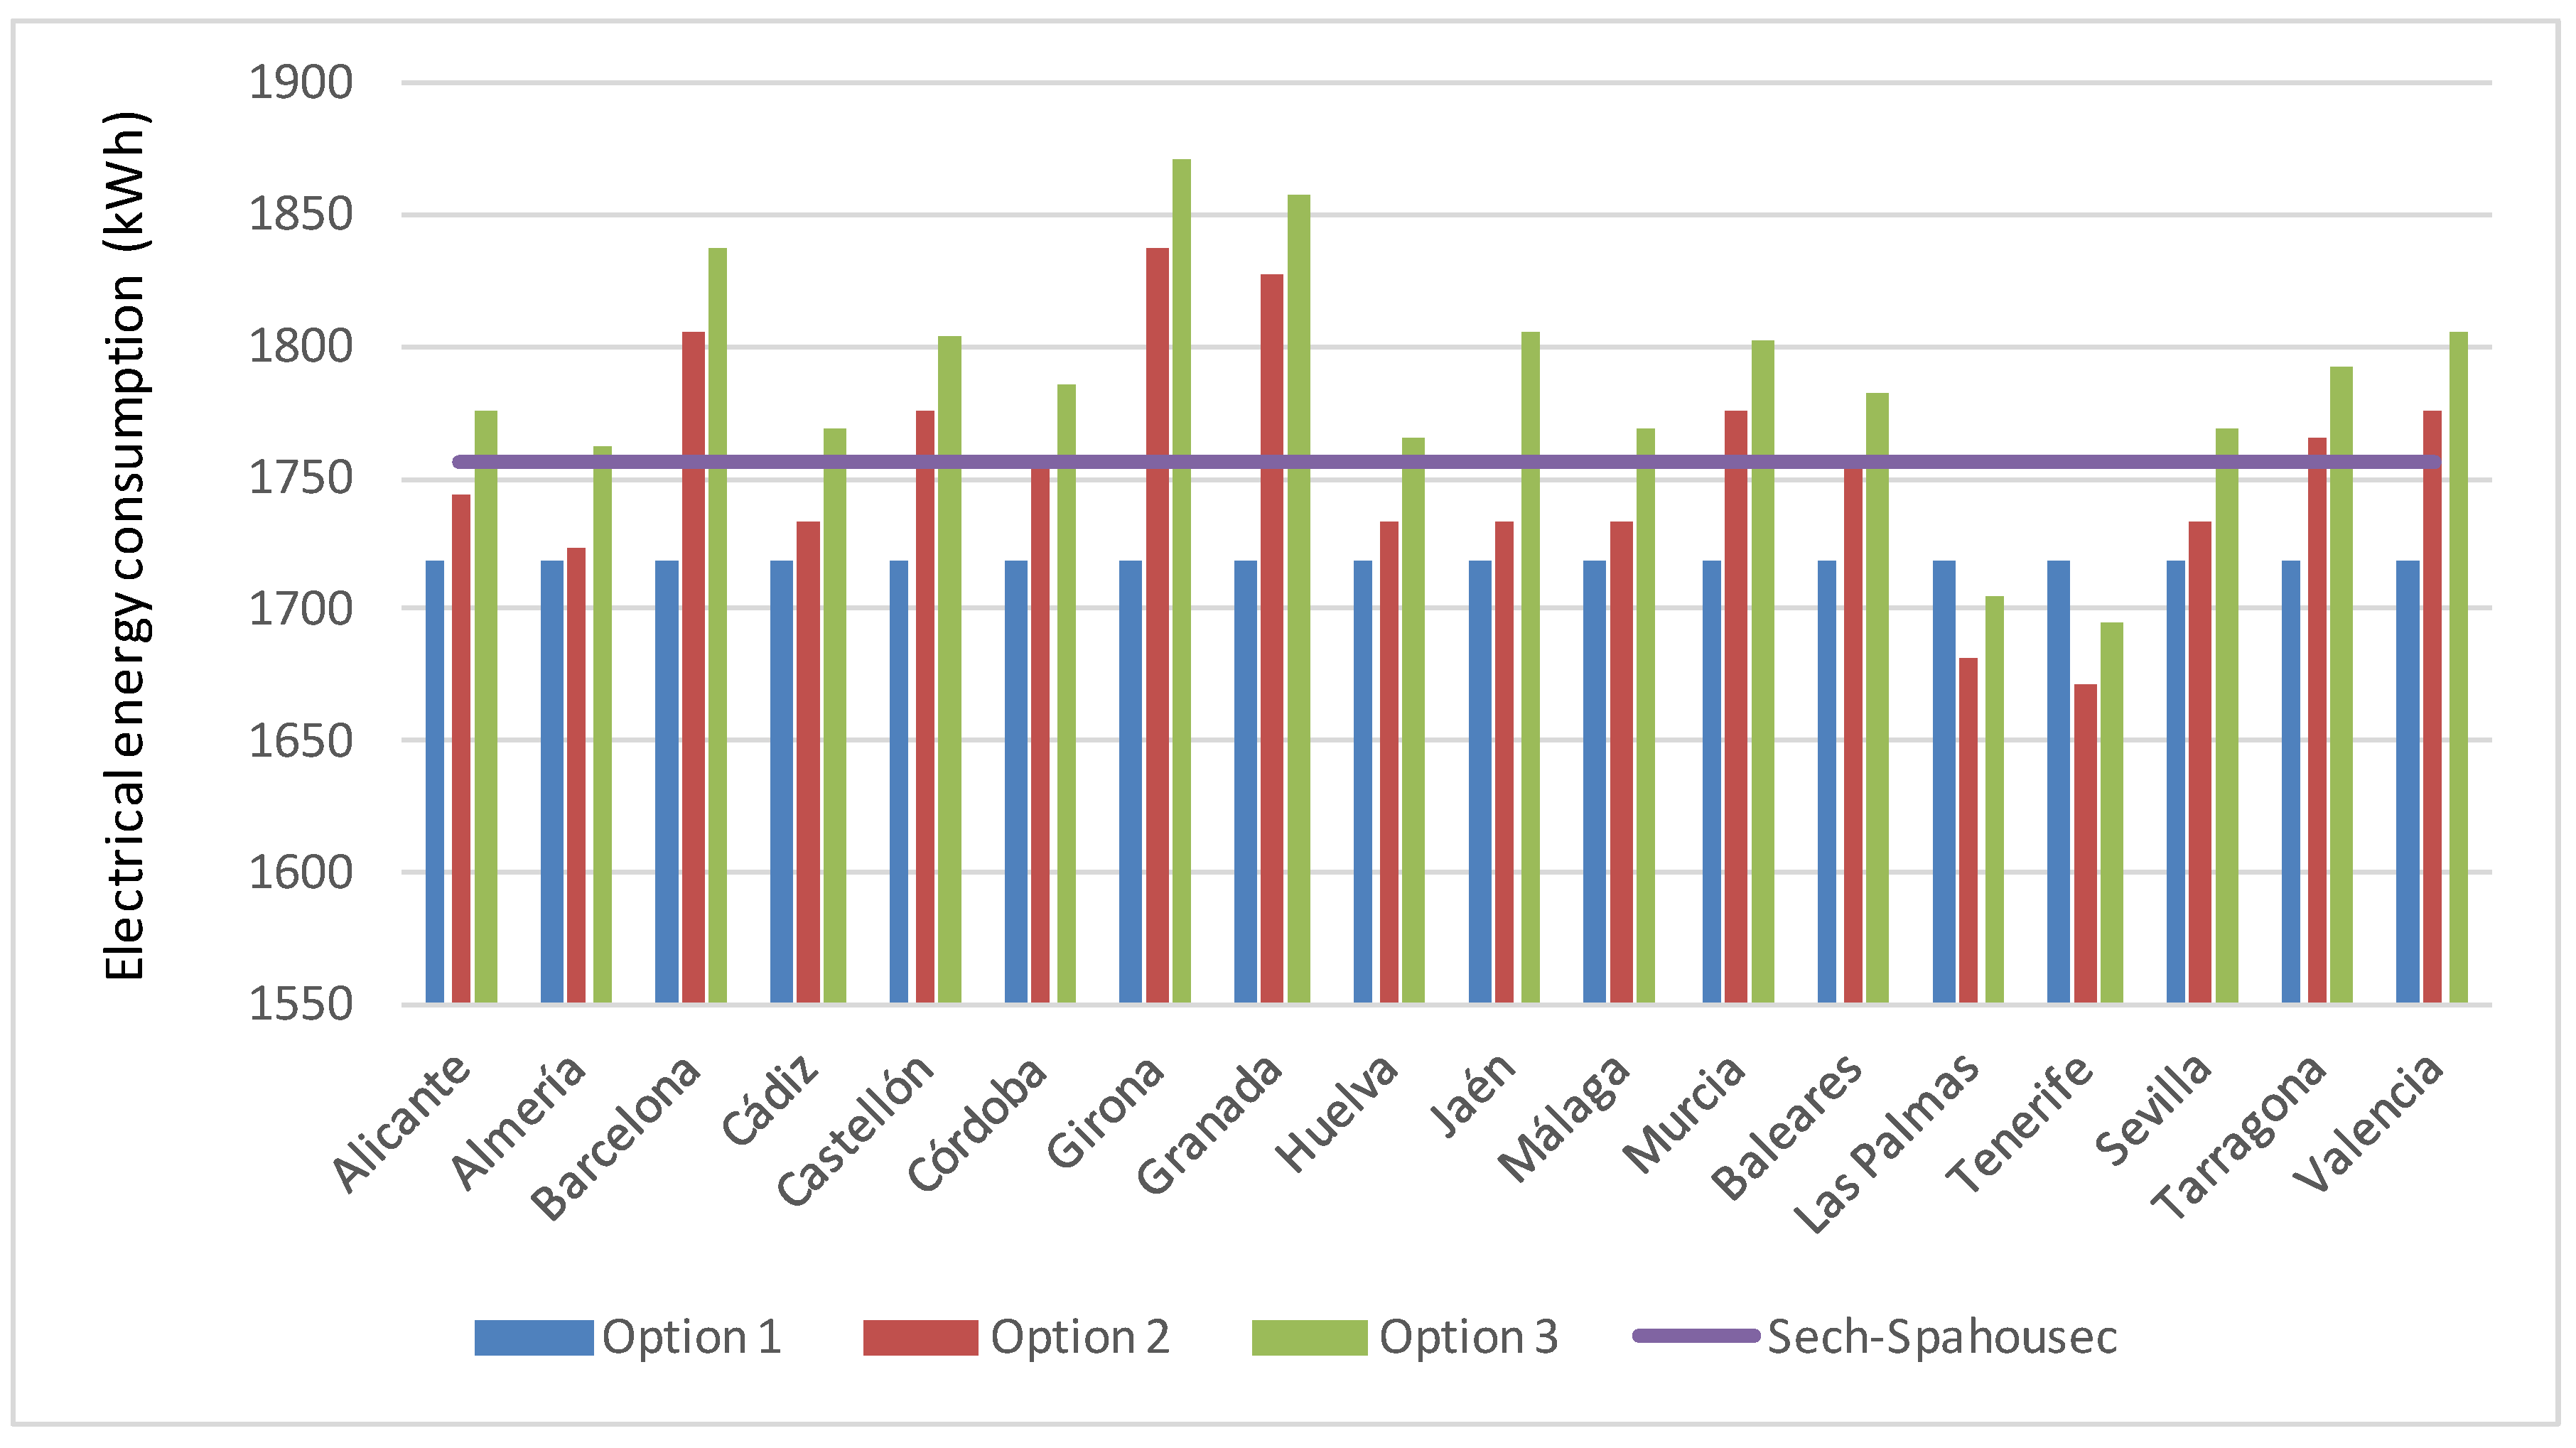
Figure 5,
Figure 6 and
Figure 7 show the output of the three options for each province comparing them with the average of each these climate zones in SECH–SPAHOUSEC study.
Figure 5.
Average energy consumption in kWh per house in a year (North Atlantic).
Figure 5.
Average energy consumption in kWh per house in a year (North Atlantic).
Figure 6.
Average energy consumption kWh per house in a year (Continental).
Figure 6.
Average energy consumption kWh per house in a year (Continental).
Figure 7.
Average energy consumption per house in a year (Mediterranean).
Figure 7.
Average energy consumption per house in a year (Mediterranean).
Analyzing the data of these Figures, we can notice that Santa Cruz de Tenerife and Las Palmas de Gran Canarias are the provinces with the lowest consumption while Burgos and Soria are the provinces with the highest consumption. Therefore, geographical situation influence is an important factor because it bears upon the cold inlet temperature.
If the results of the confrontation are analyzed deeply it is possible to observe differences on the accuracy of the predicted electrical energy consumption.
Table 10 shows the deviation of each methodology divided by climatic zone.
Table 10.
Deviation between the different options and Sech-Spahousec.
Table 10.
Deviation between the different options and Sech-Spahousec.
| Climatic Zone | Option 1 | Option 2 | Option3 |
|---|
| North Atlantic | −25% | −26% | −16% |
| Continental | −25% | −19% | −18% |
| Mediterranean | −3% | −1% | +2% |
| Average | −18% | −14% | −11% |
As it can be seen, the first option is the most inaccurate among the three options. The main problem with this option is that it keeps constant the cold inlet temperature and therefore it does not take into account the differences on temperature caused by weather conditions nor the season of the year. As a result, the output is the same for all Spanish cities. The second option estimates the consumption better, because the number of factors considered is higher than the first option. The most accurate methodology is the third option. Therefore, the higher the number of factors considered in the methodology, the less deviation in the output.
5. Conclusions
The main result of the presented work is the confirmation of feasibility for methodologies used to predict the amount of electrical energy used in DHW. Through the analysis of factors, and the evaluation of methodologies, it was possible to update one methodology with new considerations as the tendency.
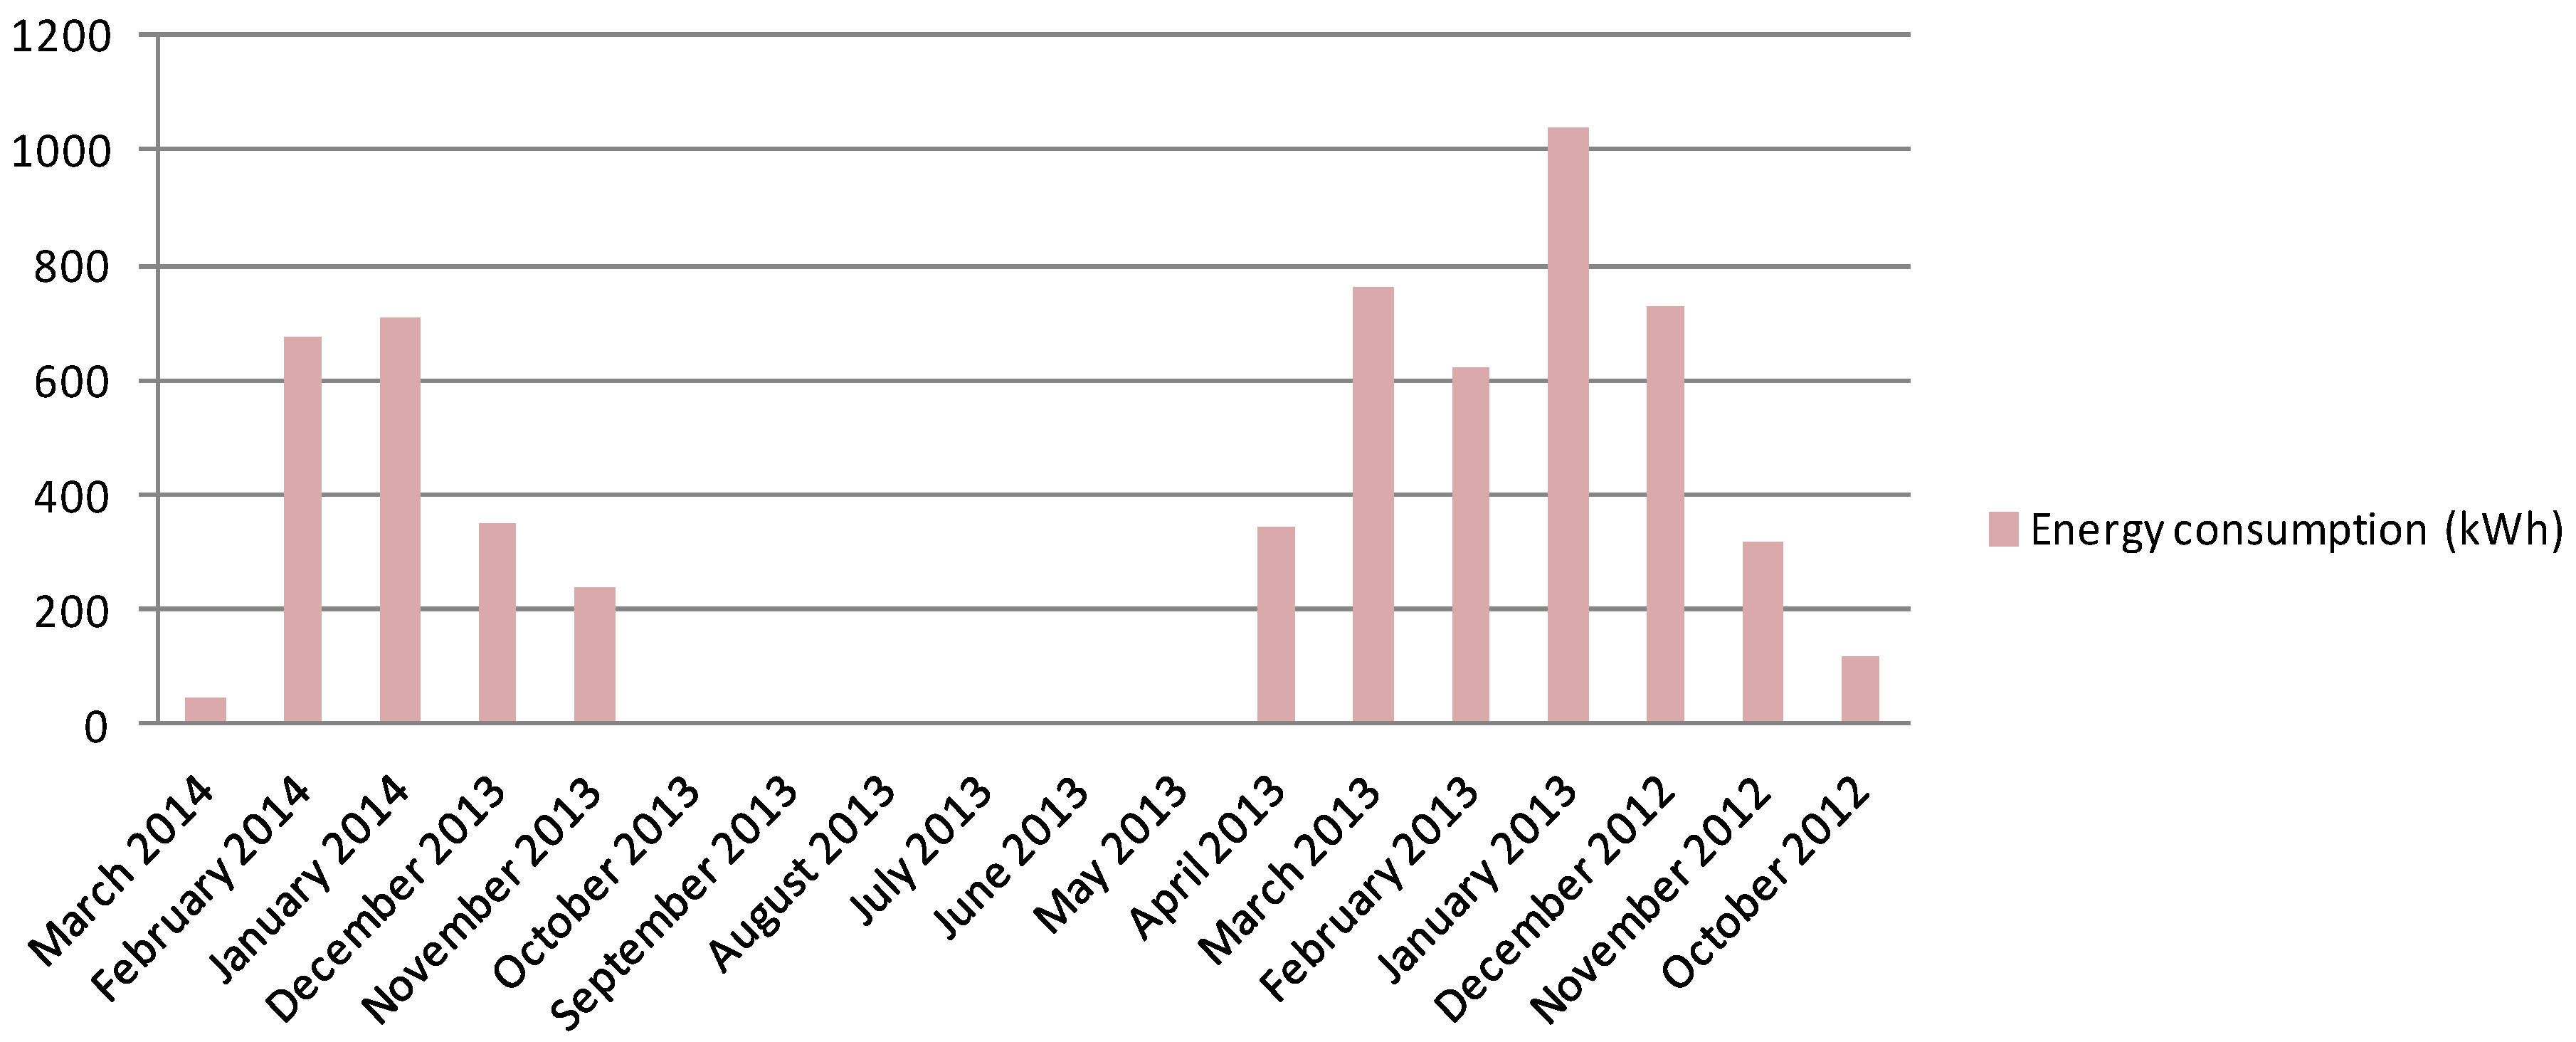
In addition, some conclusions about factors arose in the study that offer results more detailed than previous studies. One of the most relevant indicates that in residential buildings with renewable energy, the electrical energy does not depend linearly of DHW consumption.
In addition, after analyzing the different options obtained to estimate the electrical energy consumption, the methodology used by current normative UNE 94002:2005 [
14] should resolve two important aspects: first, it does not take into account the effects of the tendency because the amount of DHW consumption is considered constant along the year and second, it should incorporate the electrical energy saving of thermal solar power.
In addition, we would like to remark that autonomies with a high rate of rain do not take advantages of reusing water. From our point of view, it would be a good idea and an improvement if the Spanish Government incorporates a full awareness program on water sensitive urban design.
Finally, the application development within the website shows the feasibility of offering these complex methodologies with an easy to use interface making their result more widely spread.

 ,
, 


