How Technology Can Improve the Efficiency of Excavator-Based Cable Harvesting for Potential Biomass Extraction—A Woody Productivity Resource and Cost Analysis for Ireland


Abstract
:
1. Introduction—Background to the Irish Forest and Biomass Sector
1.1. Forest Sector
- Pulpwood—3.0 m length and 7–13 cm top diameter.
- Stakewood (fencing)—1.5–1.8 m length and 7–13 cm top diameter (very straight).
- Palletwood—2.5–3.1 m length and 14–19 cm top diameter.
- Sawlog—3.7–6.9 m length and >20 cm top diameter.

1.2. Cable Logging Studies
1.3. Biomass Sector in Ireland and Europe
2. Materials and Methods
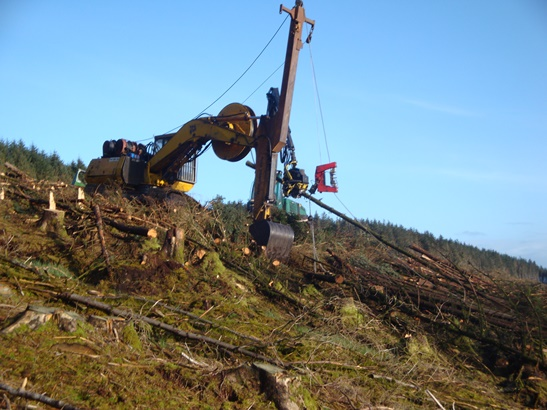
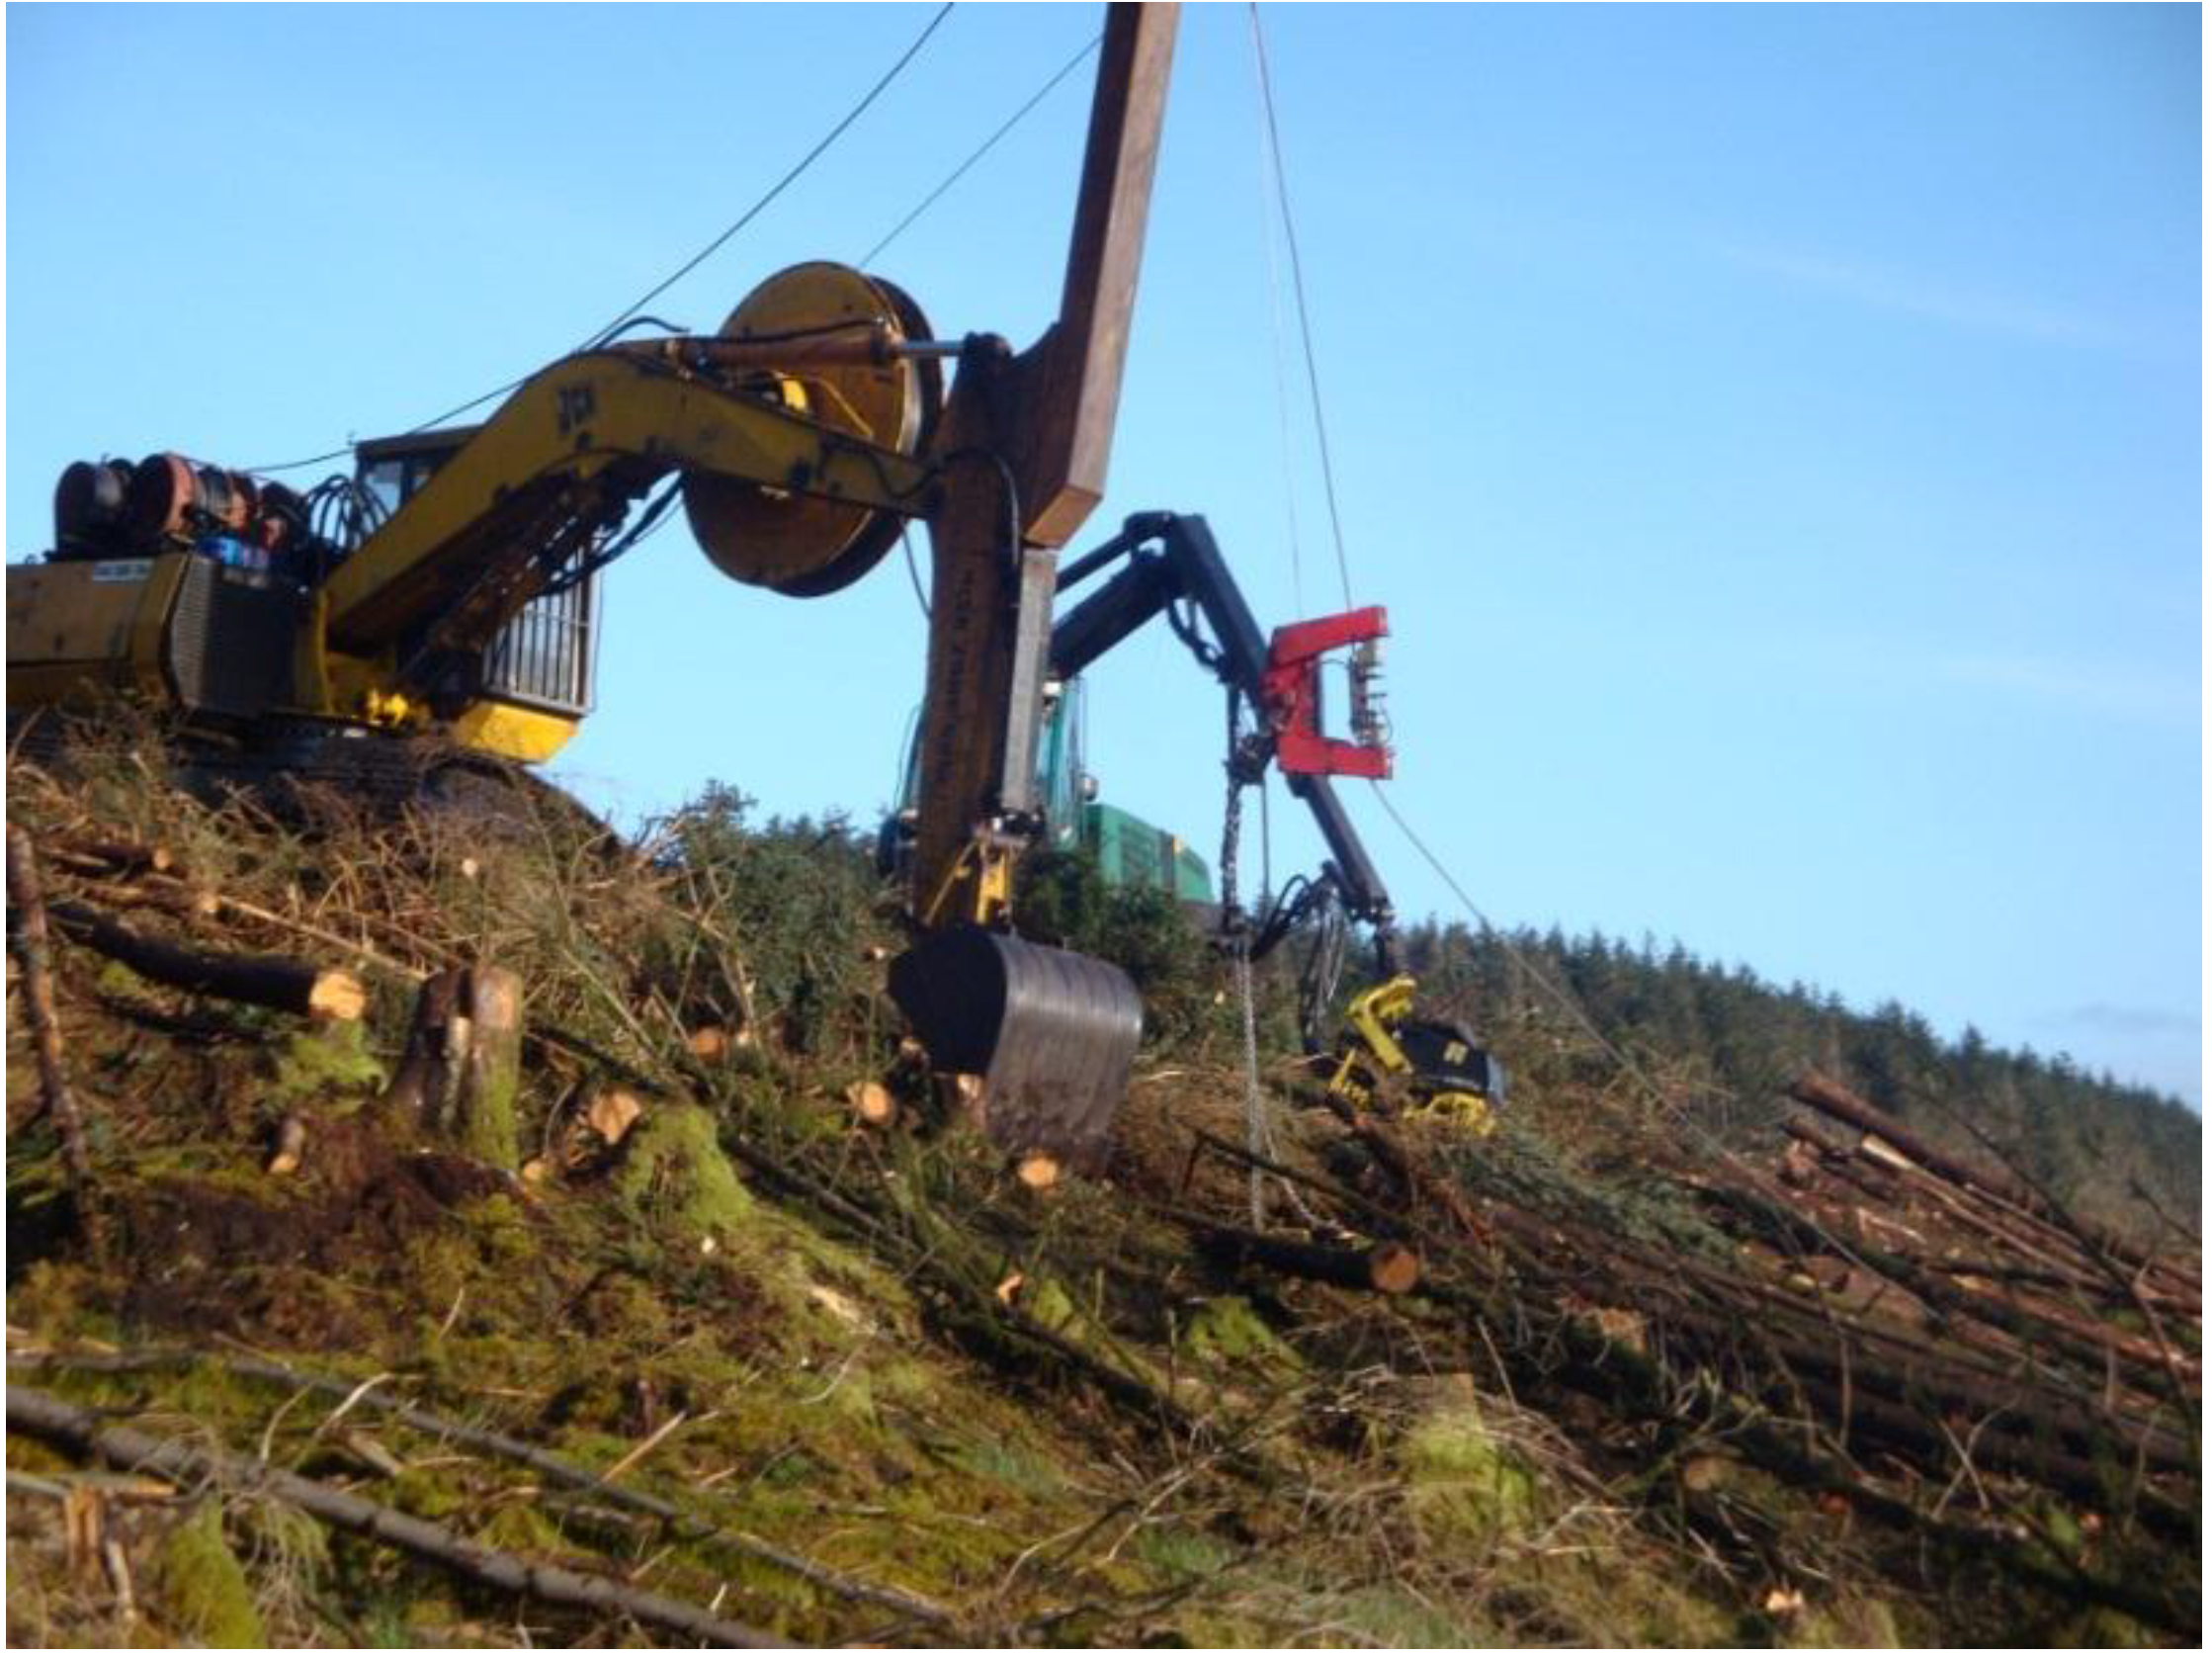
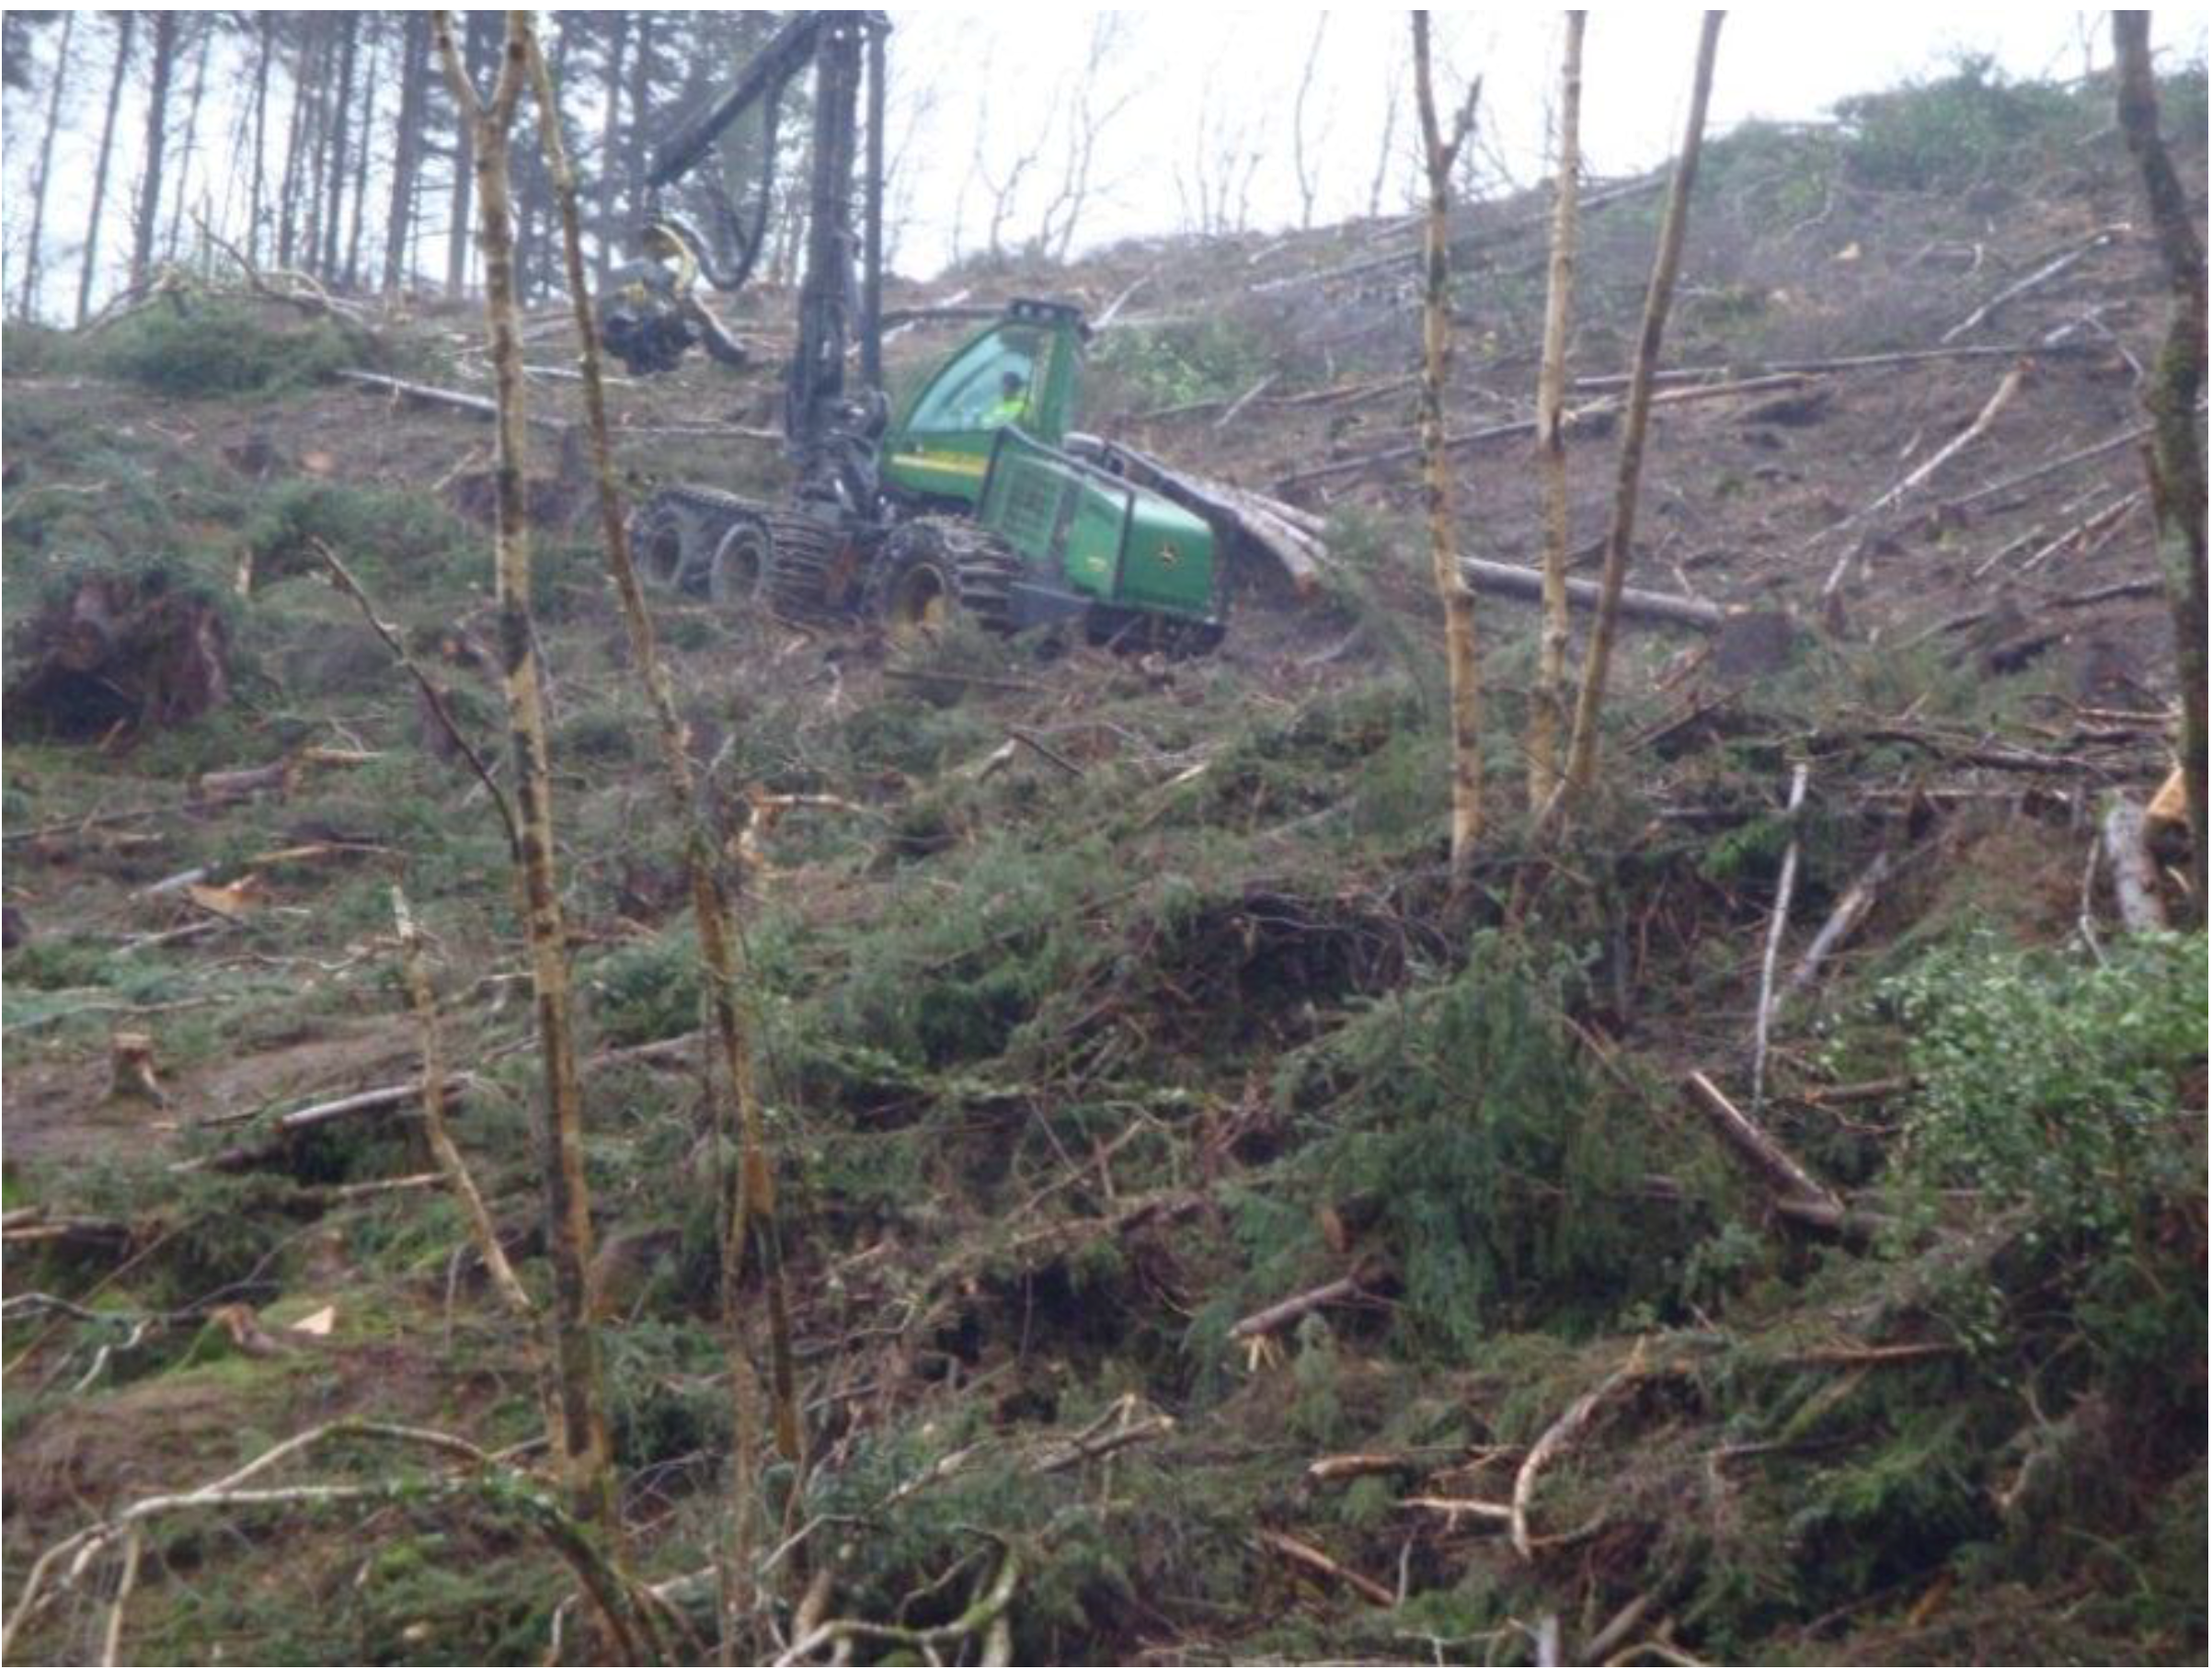
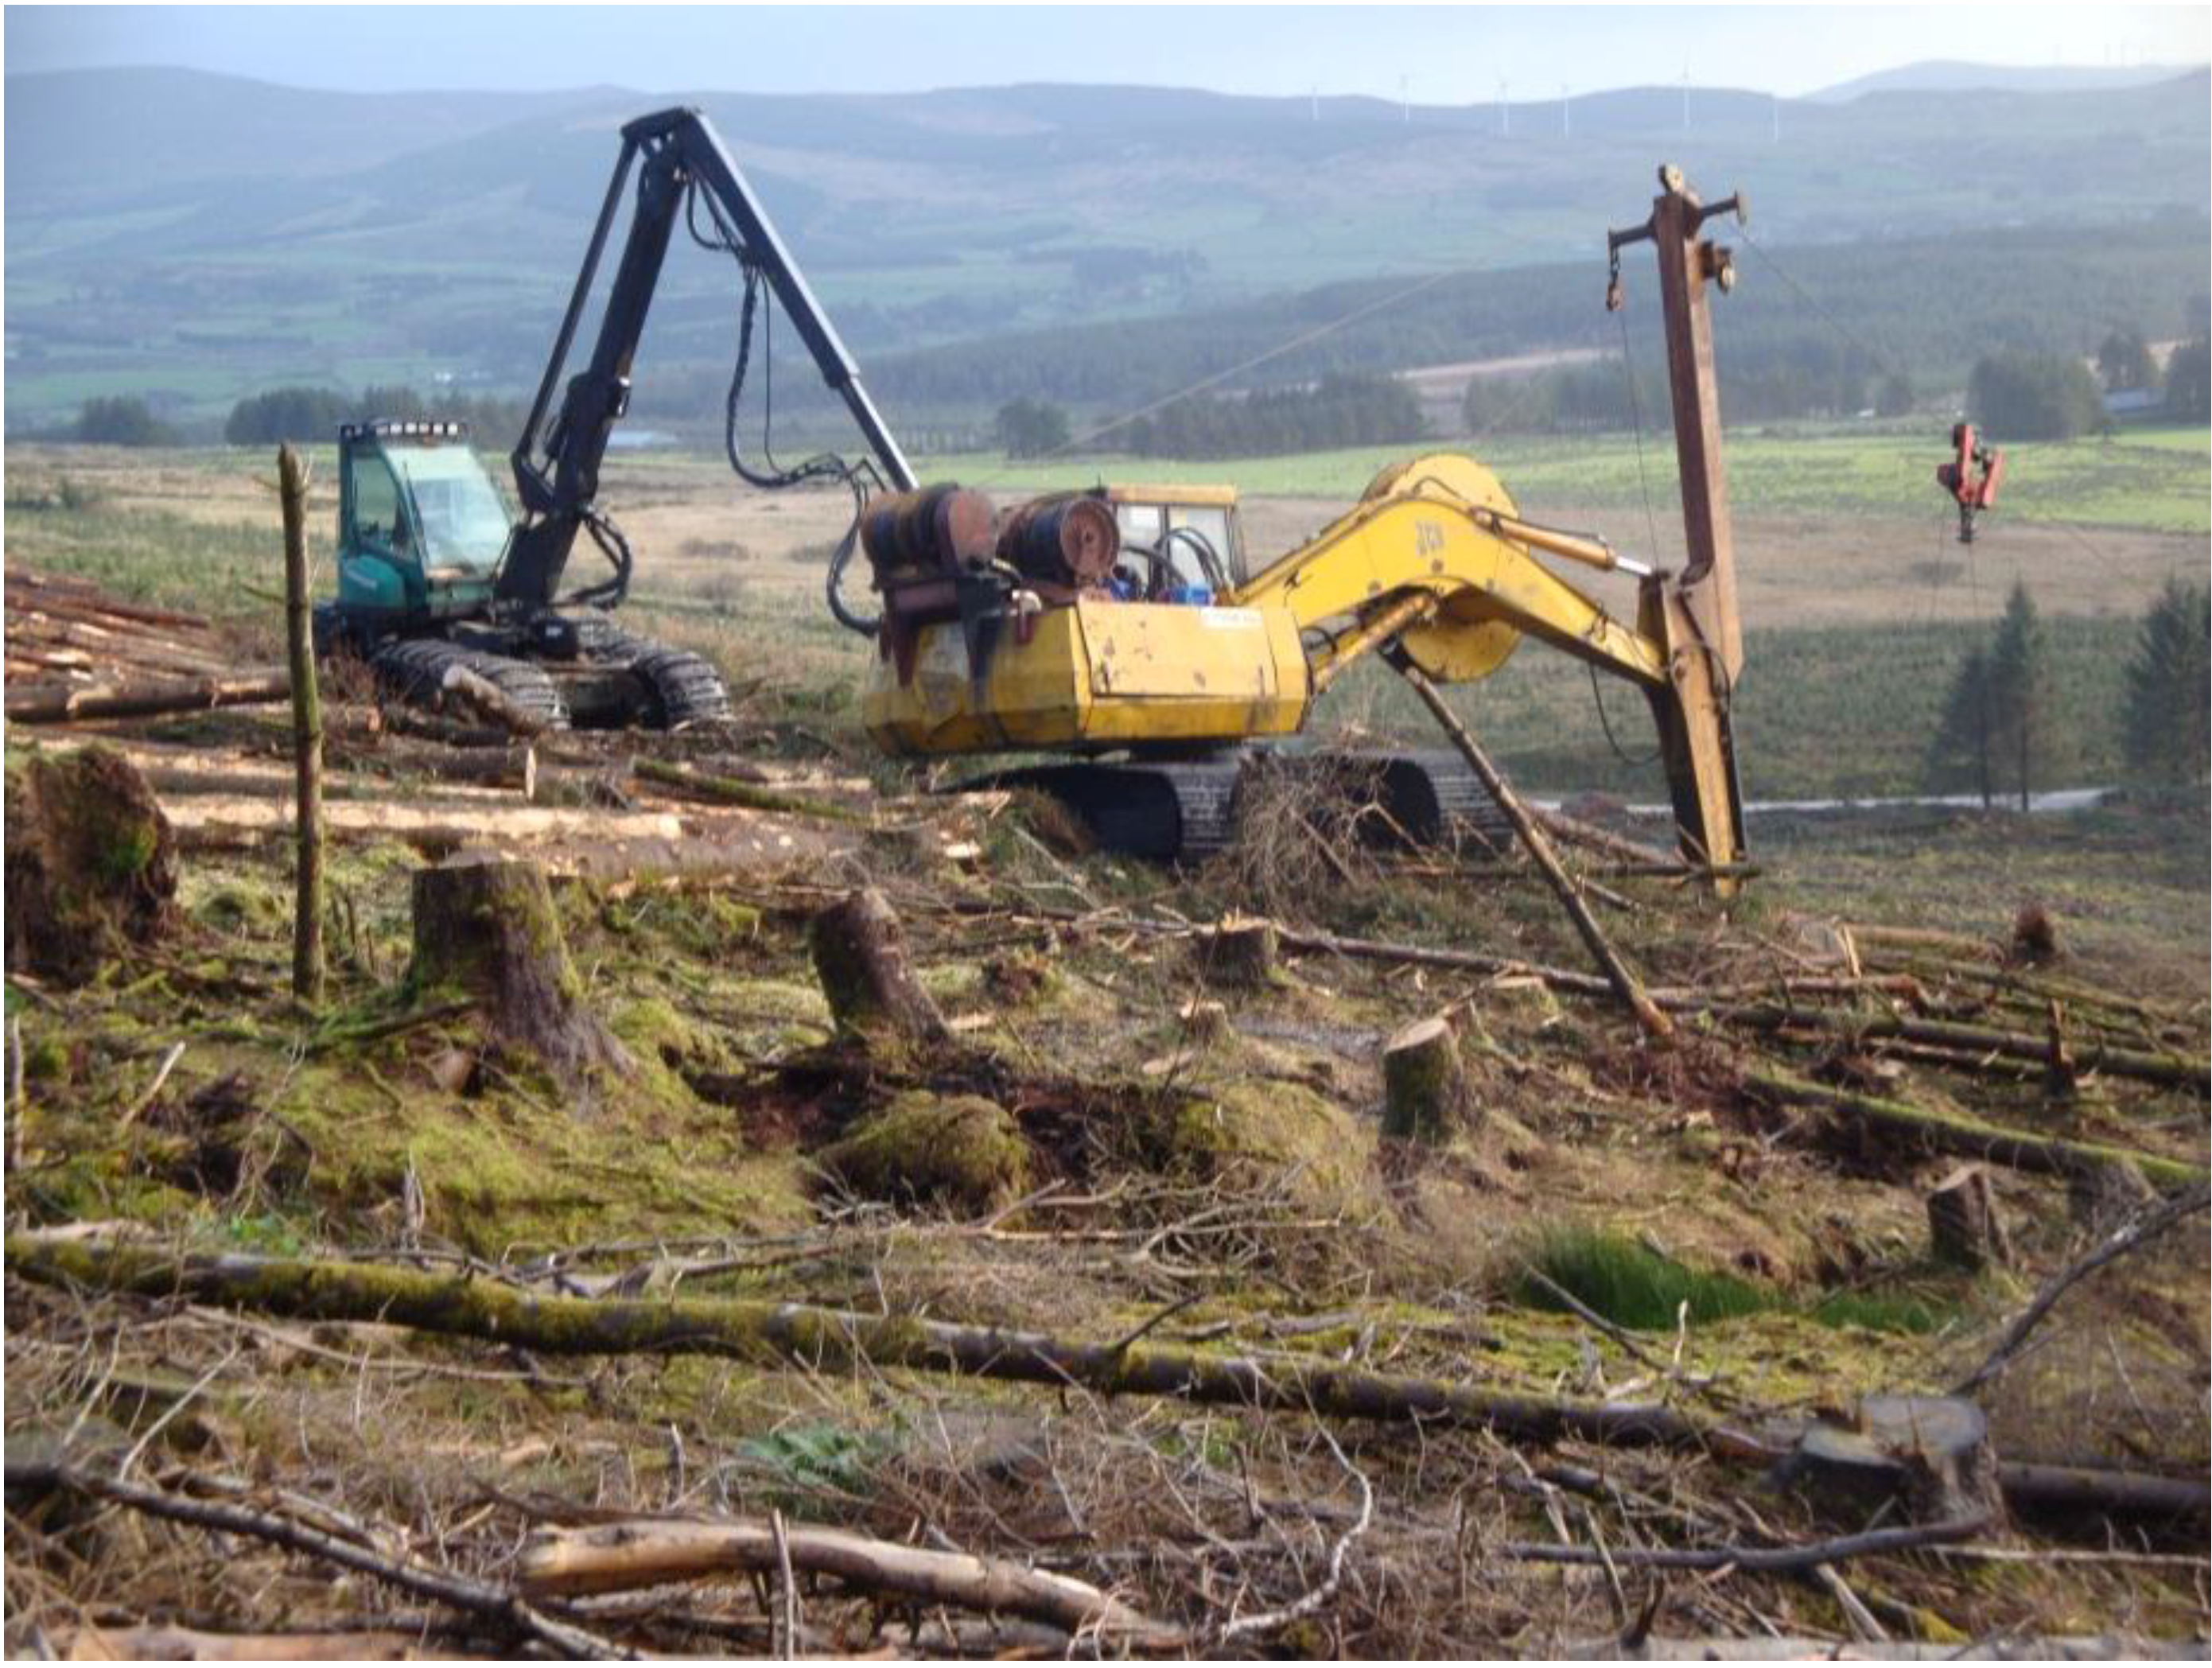
2.1. SC I & II Description


| SC | Location | Corridor Length (m) | Corridor Width (m) | Harvest Type | Tree Specie | Age (yrs) | Average Vol (m3) |
|---|---|---|---|---|---|---|---|
| SC I | MC1 | 130 | 300 | Clearfell (Full Tree) | Sitka Spruce | 40-45 | 0.35 |
| SC II | MC1 | 130 | 300 | Clearfell (Full Tree) | Sitka Spruce | 40-45 | 0.35 |
| SC III | CL1 | 150 | 200 | Clearfell (Full Tree) | Sitka Spruce | 40-45 | 0.45 |
| SC | Crew | Choker Type | Carriage | Payload (t) | Excavator | Harvester | |
| SC I | 2 Man Crew | None | Sherpa | 1.5 | JCB | Timberjack 1070 E | |
| SC II | 3 Man Crew | None | Sherpa | 1.5 | JCB | Timberjack 1070 E | |
| SC III | 2 Man Crew | Ludwig Remote | Konrad | 1.5 | Daewoo | John Deere 1410 D |

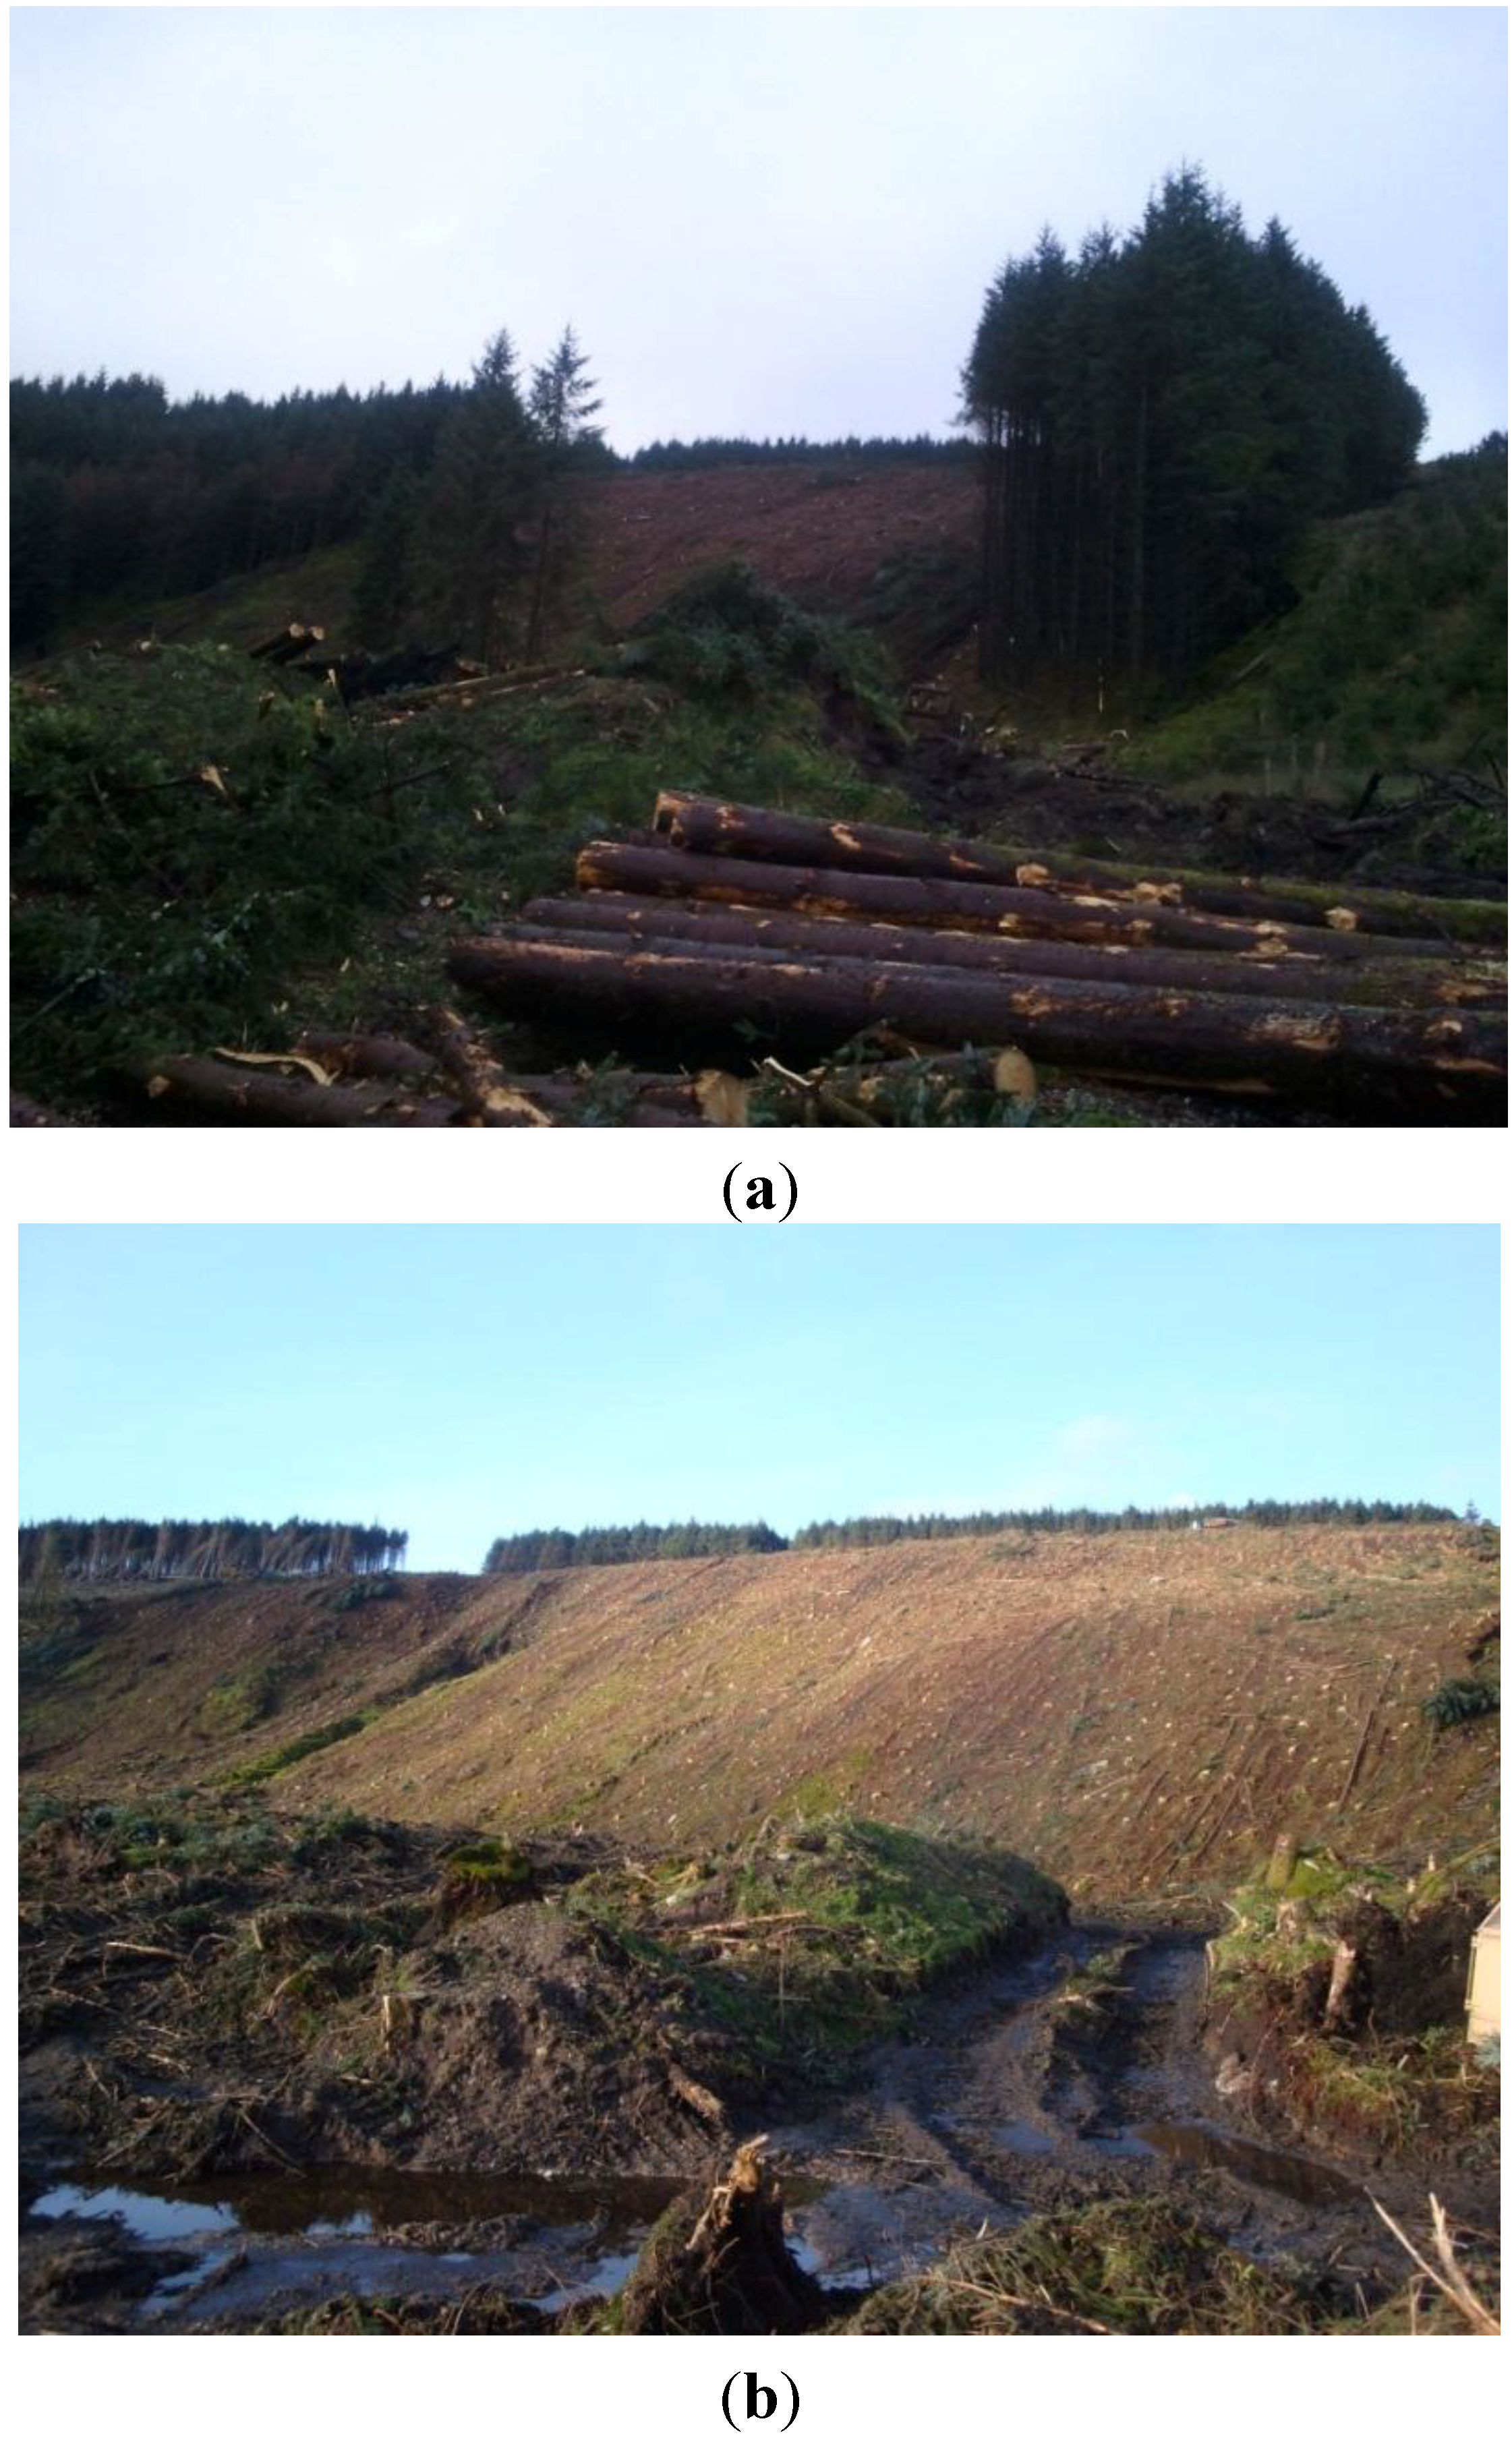
Site Conditions
2.2. SC III Description

Site Conditions

3. Definition of Work Elements
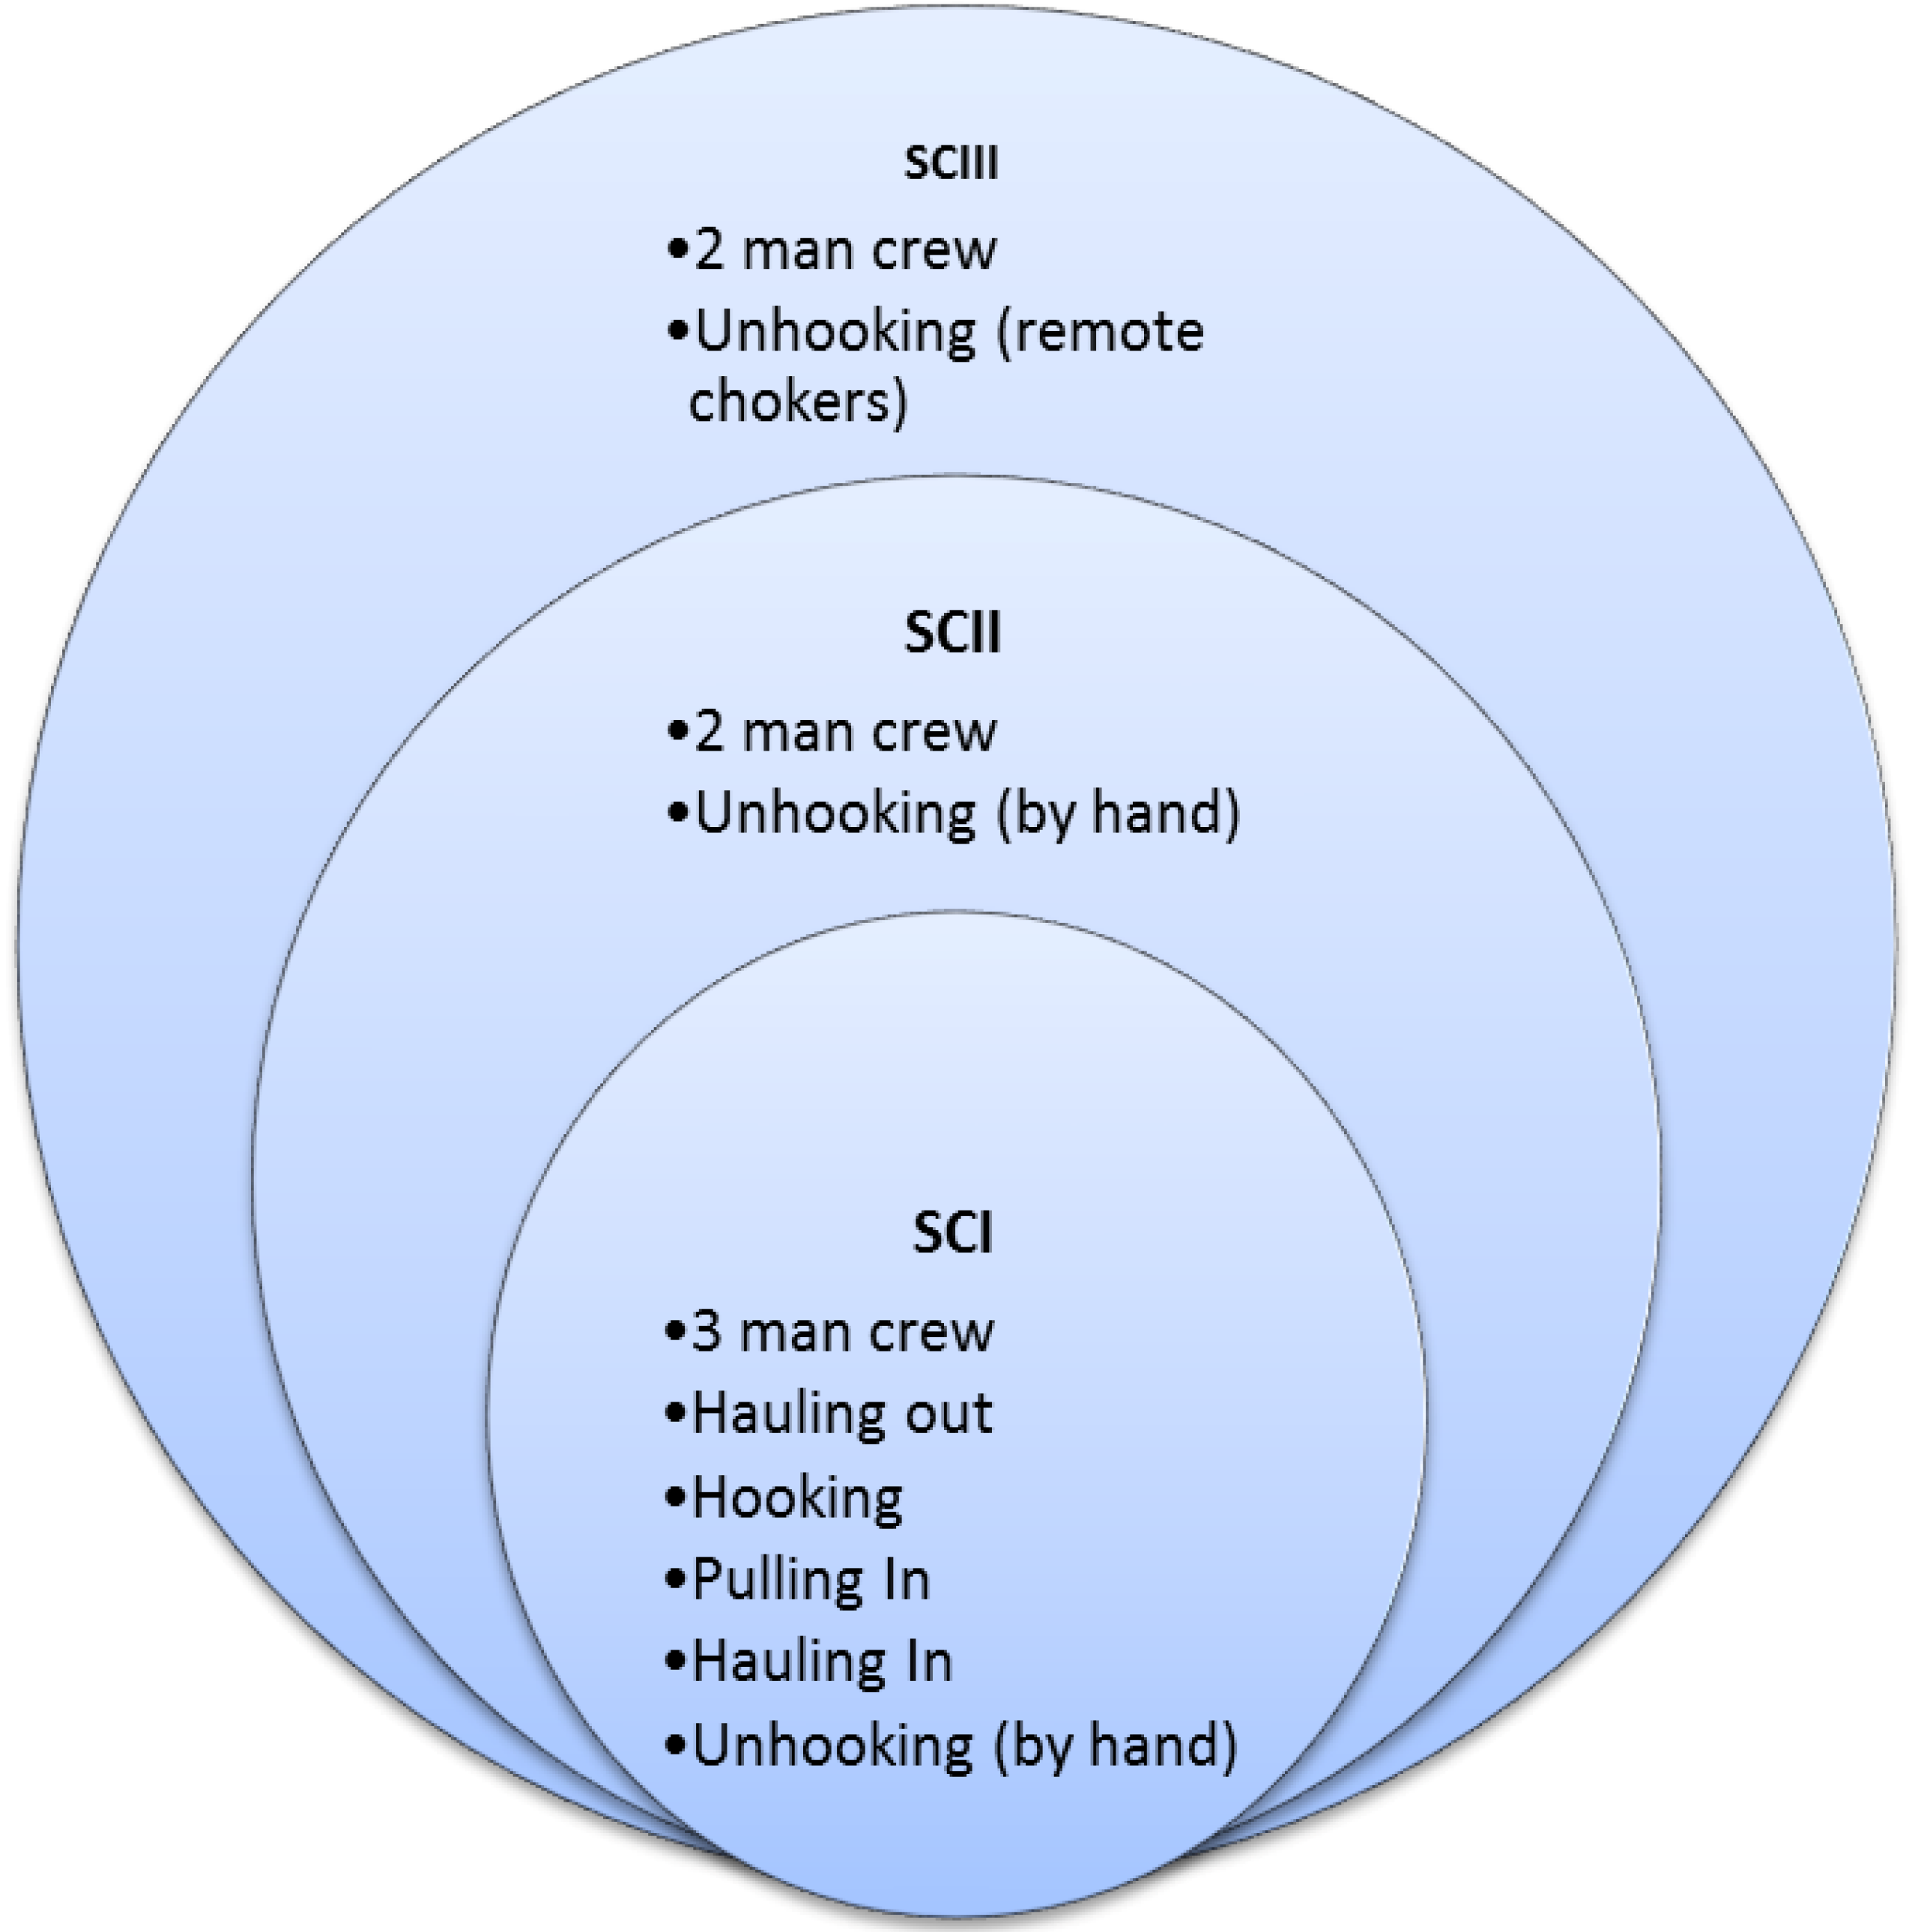
- SC I—Three-man crew at Macroom (one man choking logs, one man unhooking chokers and one man operating the carriage).
- SC II—Two-man crew at Macroom (carriage operator exits machine to unhook the choker at landing with one man choking logs below).
- SC III—Two-man crew at Clonmel. For this system, one scenario could only be observed—a two man crew operating with radio controlled chokers (one man hooking and carriage operator).
- Hauling out—brake opened, the carriage moves towards the site, reaching the point defined by operator and the brake is locked.
- Pulling out—the main line is released from the carriage and the choker setter is holding the end of rope including log chokers to the first place of hooking.
- Hooking—the choker setter starts the hooking of the first tree (including re-arrangement of log-chokes) and ends when the rope starts to be winched.
- Pulling in—starts with winching the trees, bringing them under the carriage and ends when rope is secured and carriage brake is opened.
- Hauling in—brake opened and the carriage is pulled back towards the excavator. The activity ends when carriage brakes are closed and main line is released.
- Unhooking—rope released and operator unhooks the log chokes. Ends when rope is pulled in the carriage, is fixed and carriage brake are opened.
- Moving—This activity does not necessarily occur in each cycle but consisted of.
- ○
- Releasing the skyline, the excavator is ordering/cleaning the landing or moving to another position. Ends when the skyline is tensioned and the carriage brake is released enabling the carriage to move.
- Extraction distance (distance between the yarder and carriage positioned for side pulling).
- Side distance (walking distance of choker setter between skyline and trees for pulling).
- Number of trees extracted.
4. Results—Costing Analysis
| Costs | SC I | SC II | SC III |
|---|---|---|---|
| Purchase Price (P) Euro (€) | 150,000 | 150,000 | 150,000 |
| Machine life (n), Years | 5 | 5 | 5 |
| Salvage value (sv), % purchase price | 10 | 10 | 10 |
| Machine utilization rate (u), % SMH | 75 | 75 | 75 |
| Repair and maintenance cost (rm), % capital over life | 56 | 56 | 60 |
| Interest rate (in), % of average yearly investment (Y) | 8 | 8 | 8 |
| Insurance and tax rate (it), % of average yearly investment (Y) | 7 | 7 | 7 |
| Fuel consumption rate (fcr), L/h | 23.6 | 23.6 | 21 |
| Fuel cost (fc), €/L | 0.9 | 0.9 | 0.9 |
| Oil and lubrication consumption rate (ocr), L/h | 0.7 | 0.7 | 0.7 |
| Oil and lubrication cost (lo), €/L | 1.4 | 1.4 | 1.4 |
| Operators wage (w), €/SMH | 39 | 26 | 26 |
| Scheduled machine hours (SMH), hours/year | 2,000 | 2,000 | 2,000 |
| Salvage value (S), € | 15,000 | 15,000 | 15,000 |
| Annual depreciation (D) in €/year, D = [(P-S)/n] | 27,000 | 27,000 | 27,000 |
| Average yearly investment (Y) in €/year, Y = [(((P-S)*(n + 1))/2n) + S] | 96,000 | 96,000 | 96,000 |
| Productive Machine Hours (PMH) in hours/year, PMH = (SMH × u) | 1,500 | 1,500 | 1,500 |
| Ownership costs | |||
| Interest on capital (I) in €/year, I = (in × Y) | 7,680 | 7,680 | 7,680 |
| Insurance and tax cost (IT) in €/year , IT = (it × Y) | 6,720 | 6,720 | 6,720 |
| Annual ownership cost (F) in €/year), F = (D + I + IT) | 41,400 | 41,400 | 41,400 |
| Ownership cost per SMH (Os) in €, Os = (F/SMH) | 20.7 | 20.7 | 20.7 |
| Ownership cost per PMH (Op) in €, Op = (F/PMH) | 27.60 | 27.60 | 27.60 |
| Operating costs | |||
| Fuel cost (Fu) in €/ph, Fu = (fcr × fc) | 21.24 | 21.24 | 18.90 |
| Lube cost (L) in €/ph, L = (ocr × lo) | 0.98 | 0.98 | 0.98 |
| Repair and maintenance cost (RM) in €/ph), RM = (rm*P/(PMH*n)) | 11.20 | 11.20 | 12.00 |
| Operator cost per PMH (Opc) in €/ph, Opc = (W/u) | 52.00 | 34.67 | 34.67 |
| Machine operating cost per PMH (Vp) in €/ph, V = (Fu + L + RM + Opc) | 85.42 | 68.09 | 66.55 |
| Machine operating cost per SMH (Vs) in €/sh, Vs = (Vp × ut) | 64.07 | 51.07 | 49.91 |
| Total Costs | |||
| Total machine cost per SMH in €/SMH = (Os + Vs) | 84.77 | 71.77 | 70.61 |
| Total machine cost per PMH in €/PMH = (Op + Vp) | 113.02 | 95.69 | 94.15 |
| Volume/SMH | 13.5 | 11.3 | 15.4 |
| Volume/PMH | 17.97 | 15.09 | 20.58 |
| Unit cost (€/m3) | 6.29 | 6.34 | 4.57 |
- 80% (Load factor) = very heavy work in hardest operational conditions.
- 60% = Heavy work in hard jobs.
- 40% = Above average hard work (used as basis for contract agreements generally).
- 29%–30% = Average work load of the engine.
5. Results—Productivity Analysis
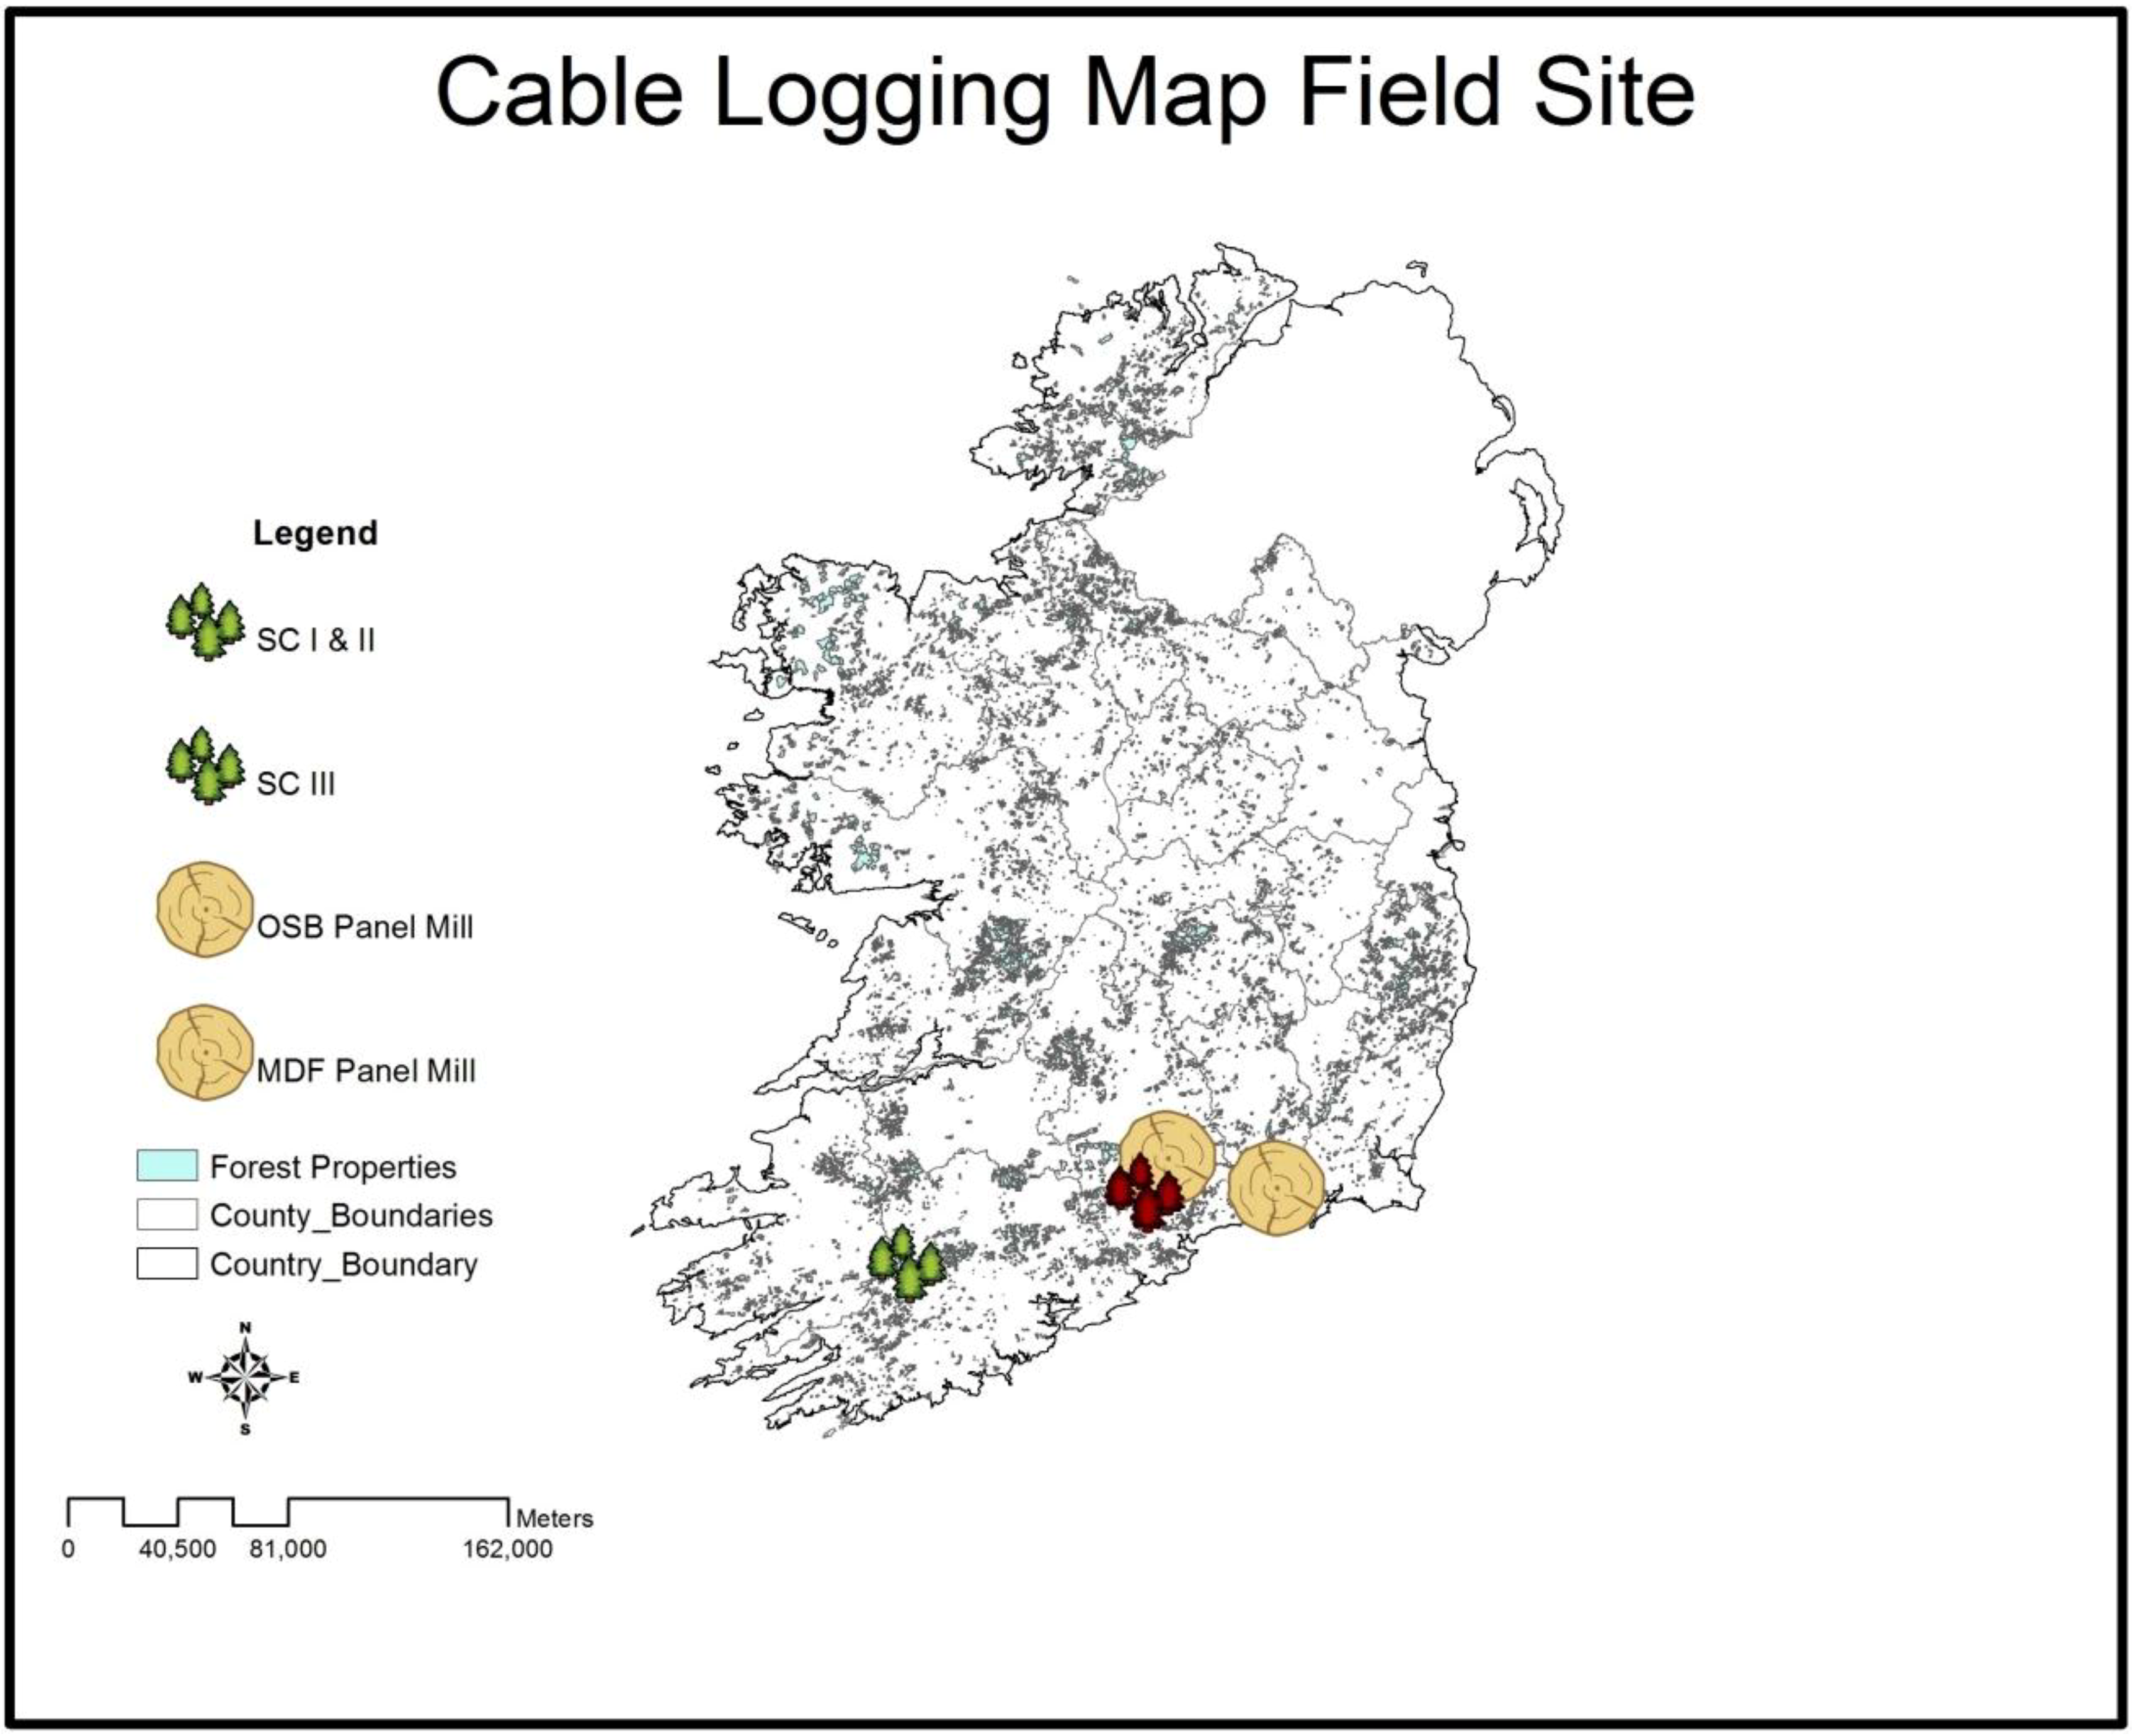
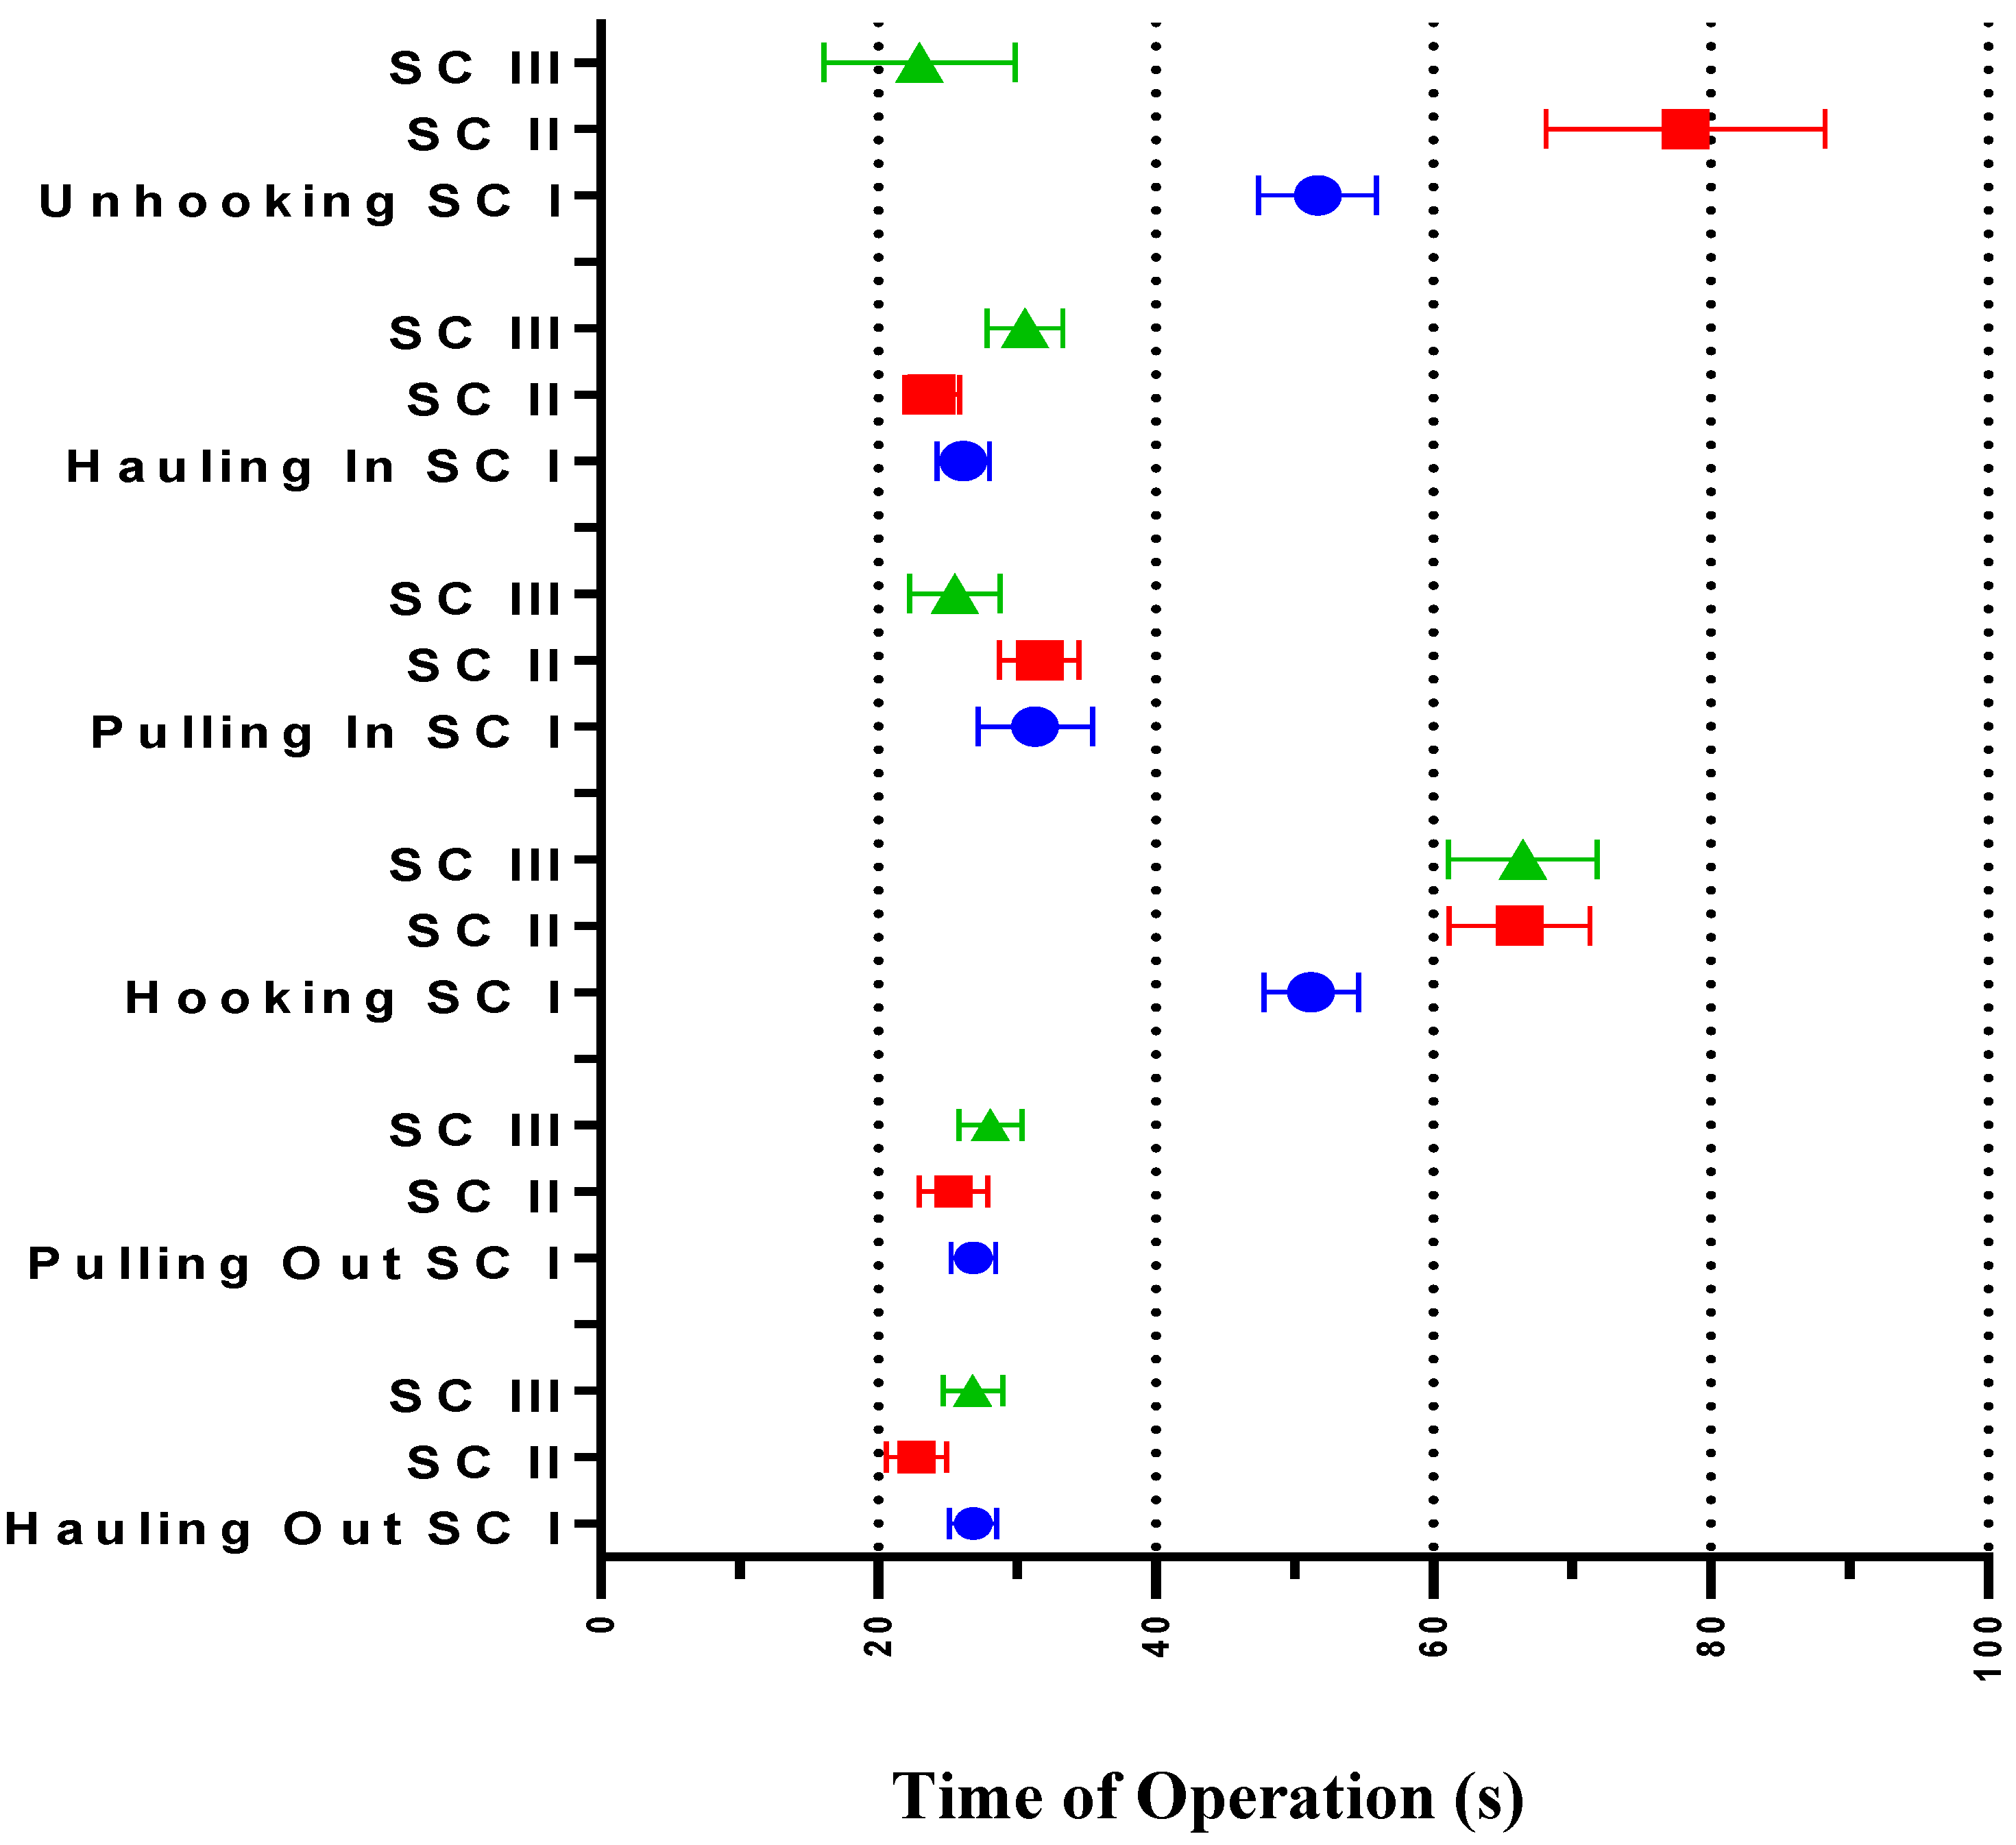
- SC III—two man crew with remote controlled chokers (Figure 9 marked by triangle).
| SC | Observed Cycles | Side Distance (m) | Extraction Distance (m) | Number of Logs | Repositioning Count |
|---|---|---|---|---|---|
| SC I | 66 | 0–25 | 0–80 | 1–4 | 8 |
| SC II | 24 | 8–18 | 0–65 | 1–3 | 7 |
| SC III | 30 | 0–10 | 15–105 | 1–6 | 2 |

| Activity | SC I | SC II | SC III | |||
|---|---|---|---|---|---|---|
| Time (s) | Std. deviation | Time (s) | Std. deviation | Time (s) | Std. deviation | |
| Hauling out | 26.8 | 13.87 | 22.7 | 10.6 | 26.8 | 11.79 |
| Pulling out | 26.8 | 13.06 | 25.4 | 12.7 | 28.1 | 12.57 |
| Hooking | 51.2 | 27.71 | 66.2 | 24.83 | 66.5 | 29.35 |
| Pulling in | 31.3 | 33.6 | 31.6 | 14.01 | 25.5 | 17.93 |
| Hauling in | 26.1 | 15.23 | 23.9 | 9.66 | 30.6 | 14.92 |
| Unhooking | 51.7 | 34.51 | 78.2 | 49.3 | 23.0 | 37.74 |
| Moving | 26.4 | N/A | 38.3 | N/A | 9.4 | N/A |
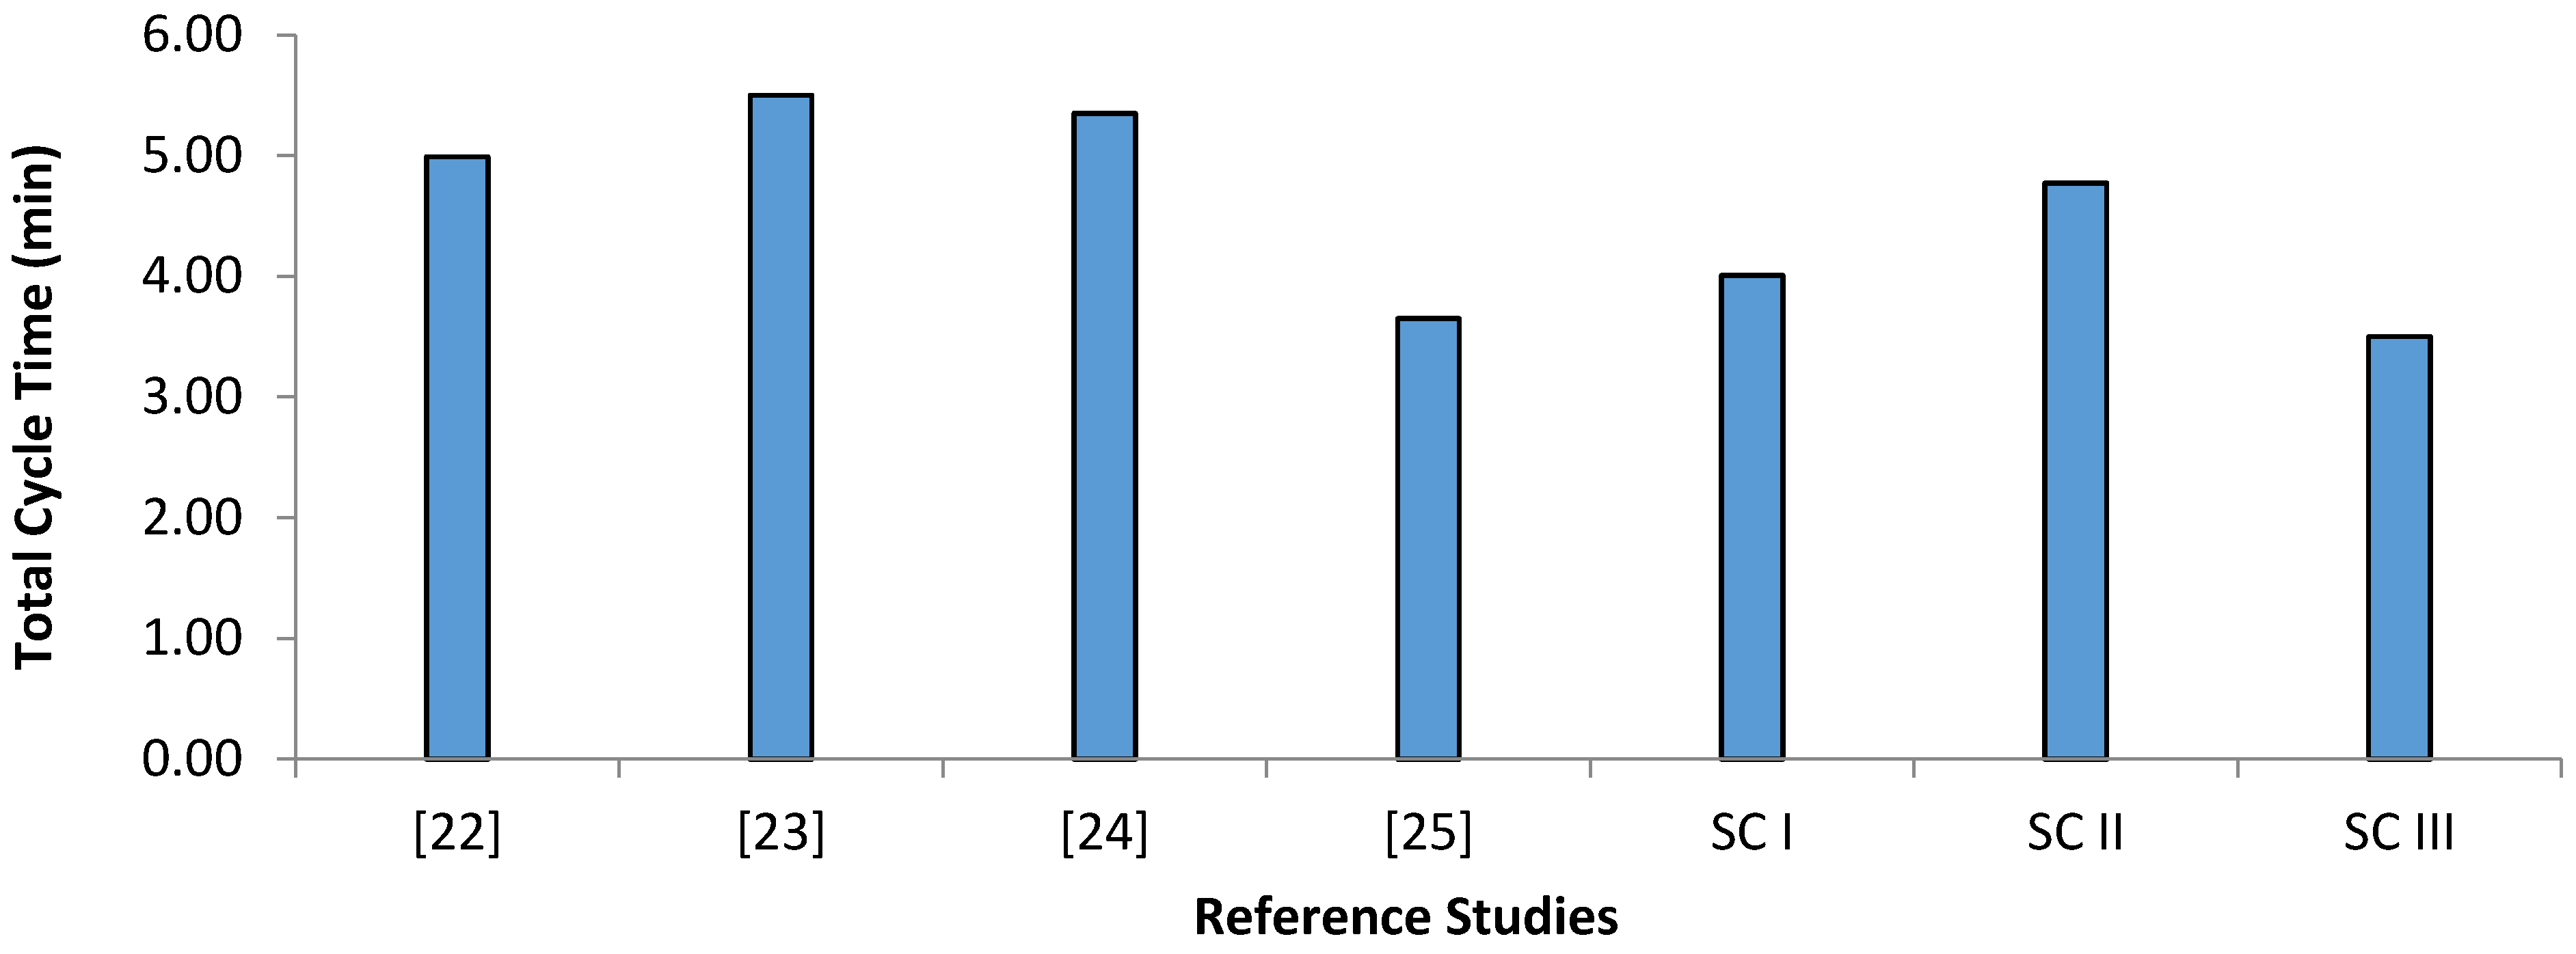
| Cycle without delays | 240.4 | - | 286.4 | - | 209.9 | - |


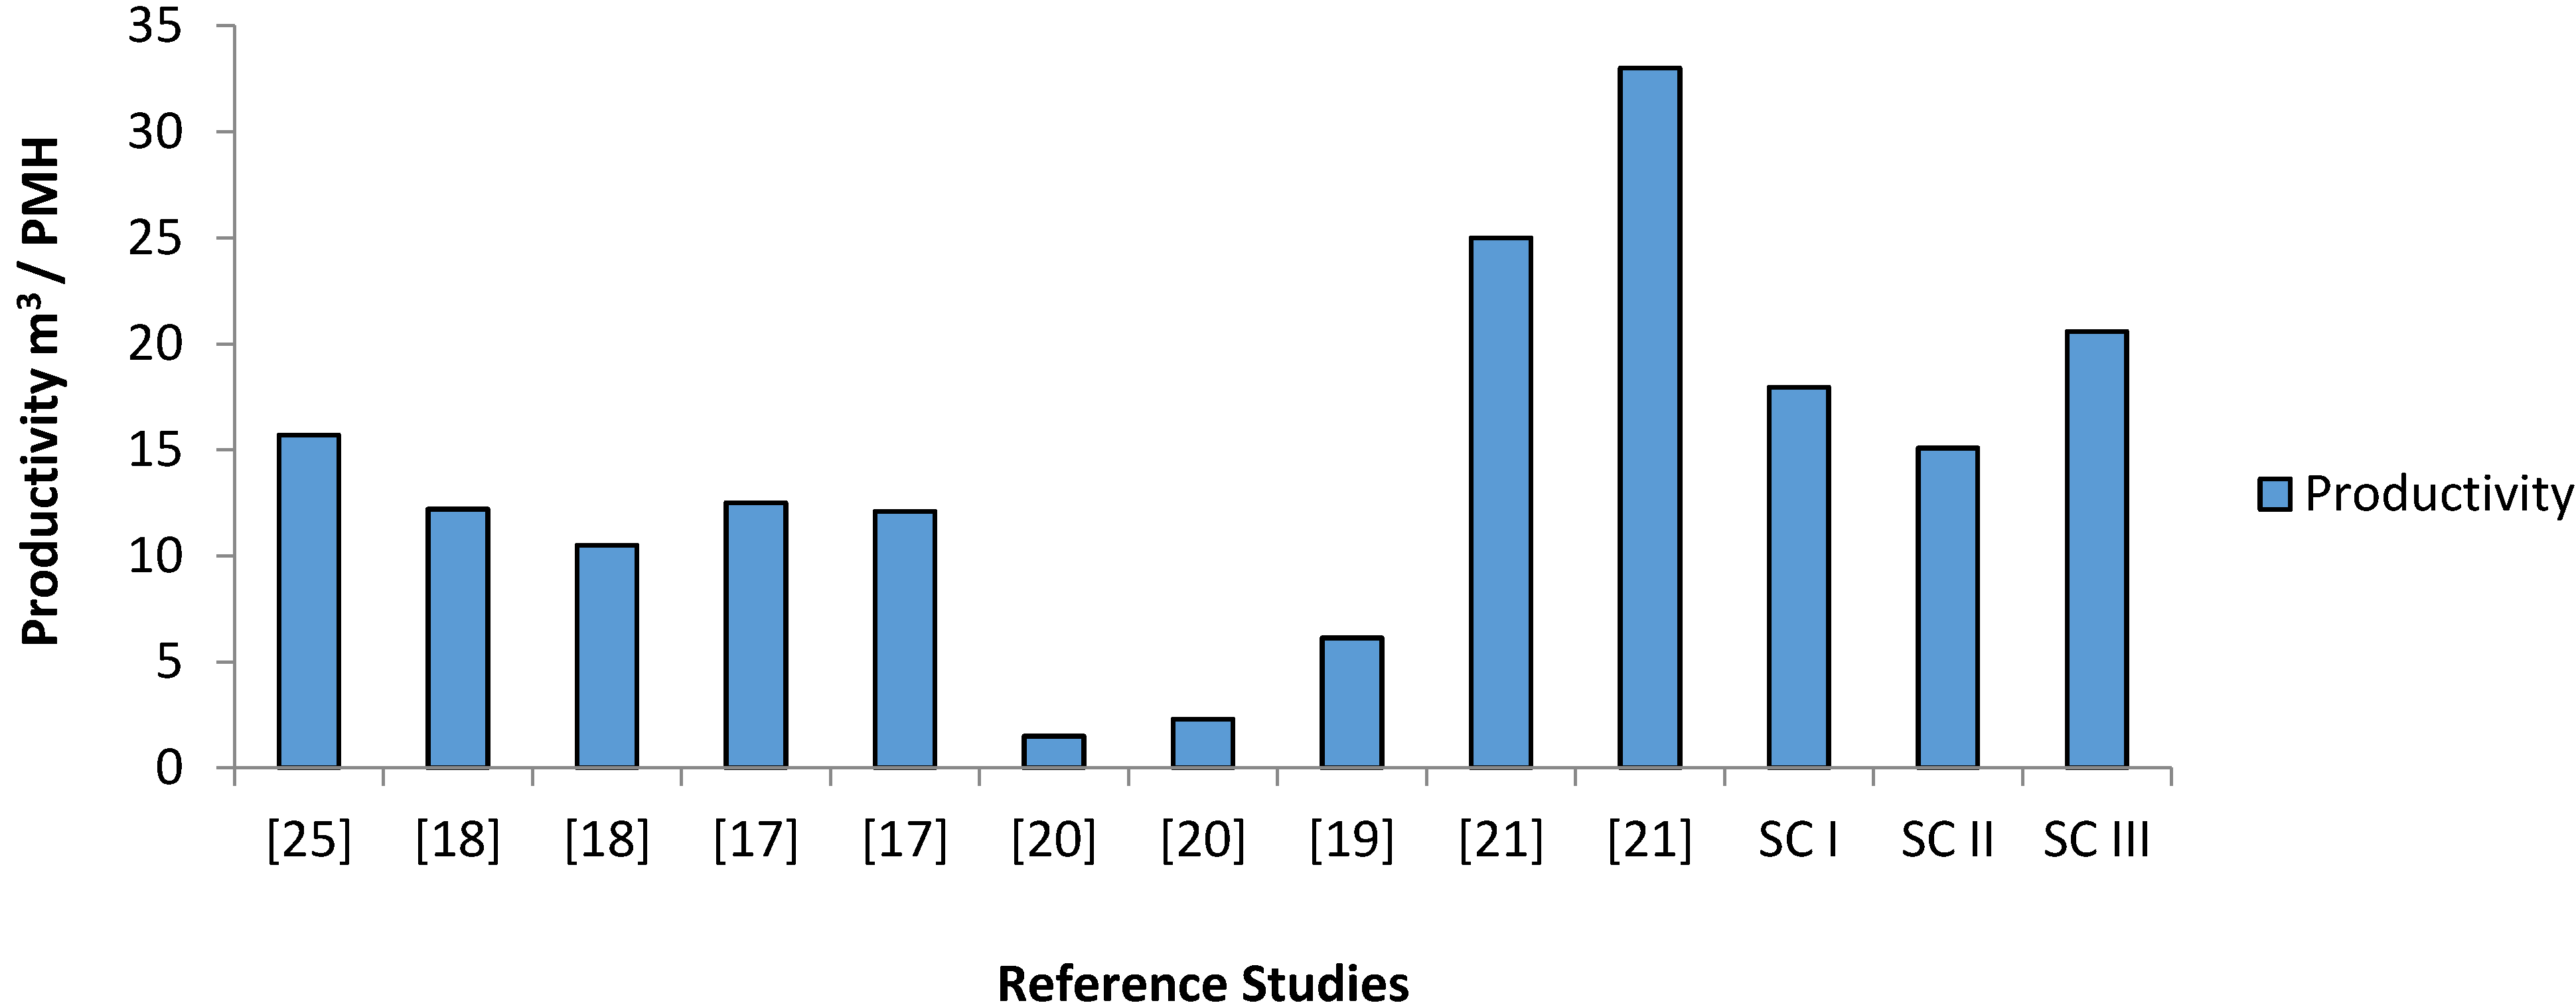
6. Results—In Context
| Productivity Parameters | SC I | SC II | SC III |
|---|---|---|---|
| No. Of cycles per shift (8 SMH or 6 PMH) | 90 | 75 | 103 |
| Av. Tree volume | 0.40 | 0.40 | 0.40 |
| Trees per cycle | 3.0 | 3.0 | 3.0 |
| Volume extracted per shift (utilization 75% *) | 107.80 | 90.52 | 123.49 |
| Volume per PMH | 17.97 | 15.09 | 20.58 |


7. Discussion and Conclusion—Sawn Products or Wood Energy?
Acknowledgments
Author Contributions
Conflicts of Interest
References
- IFFPA. An Overview of the Irish Forestry and Forest Products Sector. 2012. Available online: http://www.iffpa.ie/Sectors/IFFPA/IFFPA.nsf/vPages/Press_and_Publications~an-overview-of-the-irish-foresty-and-forest-products-sector-2012-29-08-2012?OpenDocument (accessed on 14 August 2013).
- Phillips, H.; Redmond, J.; Siurtain, M.M.; Nemesova, A. Roundwood Production Forecast from Private Forests 2009–2028, A Geospatial Forecast; National Council for Forest Research and Development: Dublin, Ireland, 2009. [Google Scholar]
- O’Driscoll, E. Overview of wood fibre use in Ireland. Forestry and Timber Yearbook. 2012. Available online: http://www.forestry.ie/images/MiscDocs/2014YearbookArticles/YB2014_AnOverviewOfWoodFibreUse_2012.pdf (accessed on 15 August 2013).
- Knaggs, G.; Driscoll, E.O. Woodflow and forest-based biomass energy use on the island of Ireland. 2012. Available online: http://www.coford.ie/media/coford/content/publications/projectreports/cofordconnects/Woodflow%20and%20forestbased%20biomass%20energy%20use%20on%20the%20island%20of%20Ireland%20%282012%29.pdf (accessed on 15 August 2013).
- O’Carroll, J. Uses of homegrown Irish timber. Coford Connect Note. Processing/Products No 4. 2003. Available online: http://www.coford.ie/media/coford/content/publications/projectreports/cofordconnects/Uses-timber.pdf (accessed 14 August 2013).
- Coillte. Available online: http://www.coillte.ie (accessed on 6 August 2013).
- Senturk, N.; Ozturk, T.; Demir, M. Productivity and costs in the course of timber transportation with the Koller K300 cable system in Turkey. Build. Environ. 2007, 42, 2107–2113. [Google Scholar] [CrossRef]
- Acar, H.H.; Yoshimura, T. A study on the productivity and cost of cable logging in Turkey 1. J. For. Res. 1997, 2, 199–202. [Google Scholar] [CrossRef]
- Baker, S.; Sloan, H.; Visser, R. Cable logging in Appalachia and opportunities for automated yarder equipment. In Proceedings of the 24th Annual Meeting of the Council Forest Engineering, Appalachian Hardwoods: Managing Change, Corvallis, OR, USA, 15–19 July 2001.
- Visser, R.J.M.; Stampfer, K. Cable extraction of harvester-felled thinnings: An Austrian case study. J. For. Eng. 1998, 9, 39–46. [Google Scholar]
- Spinelli, R.; Magagnotti, N.; Lombardini, C. Performance, capability and costs of small-scale cable yarding technology. Small-Scale For. 2010, 9, 123–135. [Google Scholar] [CrossRef]
- Spinelli, R.; Magagnotti, N. Wood extraction with farm tractor and sulky: Estimating productivity, cost and energy consumption. Small Scale For. 2012, 11, 73–85. [Google Scholar] [CrossRef]
- Torgersen, H.; Lisland, T. Excavator-based cable logging and processing system: A Norwegian case study. Int. J. For. Eng. 2002, 13, 11–16. [Google Scholar]
- Zimbalatti, G.; Proto, A.R. Cable logging opportunities for firewood in Calabrian forests. Biosyst. Eng. 2009, 102, 63–68. [Google Scholar] [CrossRef]
- Stampfer, K.; Leitner, T.; Visser, R. Efficiency and ergonomic benefits of using radio controlled chokers in cable yarding. Croat. J. For. Eng. 2010, 31, 1–9. [Google Scholar]
- Kirk, P.M.; Sullman, M.J. Heart rate strain in cable hauler choker setters in New Zealand logging operations. Appl. Ergon. 2001, 32, 389–398. [Google Scholar] [CrossRef] [PubMed]
- Spinelli, R.; Magagnotti, N. The effects of introducing modern technology on the financial, labour and energy performance of forest operations in the Italian Alps. For. Policy Econ. 2011, 13, 520–524. [Google Scholar] [CrossRef]
- Marchi, E.; Picchio, R.; Spinelli, R.; Verani, S.; Venanzi, R.; Certini, G. Environmental impact assessment of different logging methods in pine forests thinning. Ecol. Eng. 2014, 70, 429–436. [Google Scholar] [CrossRef]
- Tiernan, D.; Owende, P.M.; Kanali, C.L.; Spinelli, R.; Lyons, J.; Ward, S.M. Development of a protocol for ecoefficient wood harvesting on sensitive sites (Ecowood). In European Commission Fifth Framework Programme 9FP5) on Quality of Life and Managment of Living Resources; European Commission: Brussels, Belgium, 2002. [Google Scholar]
- Heinimann, H.R.; Stampfer, K.; Loschek, J.; Caminada, L. Perspectives on central European cable yarding systems. In Proceedings of the International Mountain Logging and 11th Pacific Northwest Skyline Symposium, Seattle, WA, USA, 10–12 December 2001; pp. 268–279.
- Valente, C.; Spinelli, R.; Hillring, B.G.; Solberg, B. Mountain forest wood fuel supply chains: Comparative studies between Norway and Italy. Biomass Bioenergy 2014, 71, 370–380. [Google Scholar] [CrossRef] [Green Version]
- Verkerk, P.J.; Anttila, P.; Eggers, J.; Lindner, M.; Asikainen, A. The realisable potential supply of woody biomass from forests in the European Union. For. Ecol. Manag. 2011, 261, 2007–2015. [Google Scholar] [CrossRef]
- Aebiom; European Biomass Association. European Bioenergy Outlook. 2013. Available online: http://www.aebiom.org/blog/aebiom-annual-report-2013/#more-8447 (accessed on 15 August 2013).
- Díaz-Yáñez, O.; Mola-Yudego, B.; Anttila, P.; Röser, D.; Asikainen, A. Forest chips for energy in Europe: Current procurement methods and potentials. Renew. Sustain. Energy Rev. 2013, 21, 562–571. [Google Scholar] [CrossRef]
- O’Halloran, J.; Biomass Manager for Bord Na Mona and Edenderry Power, Edenderry, Co., Offaly, Ireland. Personal Communication, 2011.
- European Commission. Directive 2009/28/EC of the European Parliament and of the Council of 23 April 2009 on the promotion of the use of energy from renewable sources and amending and subsequently repealing Directives 2001/77/EC and 2003/30/EC; European Commission: Brussels, Belgium, 2009. [Google Scholar]
- Department of Communications Energy and Natural Resources. Strategy for Renewable Energy: 2012–2020; Department of Communications Energy and Natural Resources: Dublin, Ireland, 2012; pp. 1–26. [Google Scholar]
- Roche, P. Coillte South Munster BAU Strategic Plan 2011–2015. pp. 1–70. Available online: http://www.coillte.ie/coillteforest/plans/business_area_unit_bau_strategic_plans/business_area_unit_bau_strategic_plans_2011_2015/ (accessed on 11 December 2014).
- Power, M. Coillte South Central BAU Strategic Plan 2011–2015. pp. 1–67. Available online: http://www.coillte.ie/fileadmin/user_upload/pdfs/BAU_changes_2013/South_Central_BAU_Strategic_Plan.pdf (accessed on 11 December 2014).
- Kofman, P. Siwork 3: User Guide; Forest and Landscape Research Institute, University of Copenhagen: Copenhagen, Denmark, 1995; p. 37. [Google Scholar]
- Miyata, E.S. Determining Fixed and Operating Costs of Logging Equipment; U.S. Department of Agriculture, Forest Service, General Technical Report; U.S. Department of Agriculture: Washington, DC, USA, 1980. [Google Scholar]
- Hudson, R.; Hudson, J. Reliability and harvesting productivity when using excavators and backhoe loaders as base machines in forest operations. In Excavators and Backhoe Loaders as Base Machines in Forest Operations: Proceedings from the First Meeting of a Concerted Action FAIR-CT98-3381; Johansson, J., Ed.; Swedish University of Agricultural Sciences, Department of Forest Management and Products: Uppsala, Sweden, 2004. Research Note 1. pp. 91–108. [Google Scholar]
- De Laborde, R.M. Development of improved cable yarding productivity in Southern Africa for small-sized trees. Int. J. For. Eng. 1993, 5, 17–22. [Google Scholar]
- Sherar, J.R.; Curtin, D.T.; Koger, J.L. Analysis of the Berger 25Y swing yarder in western North Carolina. South. J. Appl. For. 1986, 10, 197–202. [Google Scholar]
- Biller, C.J.; Fisher, E.L. Whole-tree harvesting with a medium capacity cable Yarder. Trans. ASAE 1984, 27, 2–4. [Google Scholar] [CrossRef]
- Huyler, N.K.; LeDoux, C.B. Yarding cost for the Koller K300 cable yarder:results from field trials and simulations. North. J. Appl. For. 1997, 14, 5–9. [Google Scholar]
- Kent, T.; Kofman, P.D.; Coates, E. Harvesting Wood for Energy Cost-Effective Woodfuel Supply Chains in Irish Forestry. Available online: http://www.coford.ie/media/coford/content/publications/projectreports/Harvesting_Wood_low_res_for_web.pdf (accessed on 11 December 2014).
- Coillte. Coillte average standing timber prices by volume 1998–2013. In Irish Timber Growers Association; Coillte: Newtownmountkennedy, Ireland, 2014. [Google Scholar]
© 2014 by the authors; licensee MDPI, Basel, Switzerland. This article is an open access article distributed under the terms and conditions of the Creative Commons Attribution license (http://creativecommons.org/licenses/by/4.0/).
Share and Cite
Devlin, G.; Klvač, R. How Technology Can Improve the Efficiency of Excavator-Based Cable Harvesting for Potential Biomass Extraction—A Woody Productivity Resource and Cost Analysis for Ireland. Energies 2014, 7, 8374-8395. https://doi.org/10.3390/en7128374
Devlin G, Klvač R. How Technology Can Improve the Efficiency of Excavator-Based Cable Harvesting for Potential Biomass Extraction—A Woody Productivity Resource and Cost Analysis for Ireland. Energies. 2014; 7(12):8374-8395. https://doi.org/10.3390/en7128374
Chicago/Turabian StyleDevlin, Ger, and Radomír Klvač. 2014. "How Technology Can Improve the Efficiency of Excavator-Based Cable Harvesting for Potential Biomass Extraction—A Woody Productivity Resource and Cost Analysis for Ireland" Energies 7, no. 12: 8374-8395. https://doi.org/10.3390/en7128374