Factors Affecting Alkaline Sodium Silicate Gelation for In-Depth Reservoir Profile Modification

Abstract
: Alkaline sodium silicate (Na-silicate) is environment-friendly and possesses water-like viscosity during the injection stage for in-depth reservoir treatment to enhance sweep efficiency. Gel setting time (tg) and gel strength are interrelated. Factors that accelerate tg are Na-silicate content (wt%), low pH, presence of divalent ions and temperature. Pressure drop across the gel accelerates syneresis; however, the gel appeared to remain intact. Presence of Ca2+ and Mg2+ ions is shown to increase gel strength. With a Na-silicate content of 4.5 wt%, for example, at a pH of 10.3 and a temperature of 20 °C, gel strength almost tripled and was reached about eight times faster at the combined tested concentration of 0.009 M, based on the average effect from the coexistence of both ions. Low-salinity water (LSW) has an ion composition of 25-fold diluted seawater, did not show precipitation, and could accordingly be a candidate for a pre-flush before the injection of a Na-silicate solution in the event of a field application. This is important since LSW for enhancing oil recovery is a popular method in oil industry. A suggested predictive tool (simple graphical method) to estimate the effect of different factors on gelation time and gel strength is presented.1. Introduction
Water conformance control represents one of the major challenges in water-flooded reservoirs. Heterogeneities such as high permeable (thief) zones cause early water breakthrough and thereby low sweep efficiency. Total or partial blocking of thief zones is a well-known conformance control technique for diverting injected water to less permeable regions [1]. The main challenge associated with in-depth reservoir treatments is delaying the gelation time to allow placement at the targeted distance in the reservoir.
Sodium silicate (Na-silicate) is studied here for use as the in-depth reservoir treatment, since it is environmentally benign and has initial water-like viscosity—and hence good injectivity—that favors deep placement. Na-silicate is thermally stable and more cost-effective than many other types of gel systems [1–3]. The gelation of Na-silicate could be controlled by numerous inorganic and organic compounds [4]. This makes Na-silicate suitable for reservoir permeability modification, which was first proposed by Mills about a century ago [5]. However, Na-silicate has been mostly applied to the near-wellbore water shut-off processes [2,6–8]. The complicated chemistry of Na-silicate has resulted in poor understanding of its gelation mechanism by Vinot et al. [1]. It is widely acknowledged that Na-silicate's viscosity, gelation time and gel strength depend on various factors such as pH, temperature, salinity and mechanical shear rate [4].
As with other types of polymer treatments, injecting Na-silicate solution into reservoirs is subject to different shear rates, which vary from near the wellbore to a greater distance from the injector owing to flow characteristics and the pressure gradient as it propagates in the porous media. The effect of shear rates on the performance of Na-silicate has not attracted much attention.
The concentration and pH of the Na-silicate solution change as the solution is injected into the reservoir, which greatly affects gelation kinetics. The pH change depends on the buffer capacity of the mixed formation and Na-silicate solution, and the pH of formation water depends on the rock mineralogy [9]. High salinity of the formation water affects the gelation kinetics of Na-silicate as well as the possibility of precipitation. Precipitation occurs mostly in the presence of divalent ions, such as Ca2+ and Mg2+. In cases where precipitation is anticipated, the usual practice is to pre-flush the formation with fresh/low-salinity water (LSW). Reservoir temperature plays an influential role in gelation kinetics and precipitation.
Challenges to be overcome for Na-silicate in-depth reservoir treatments may be divided into three parts. The first involves placing the injected chemical. This requires control of viscosity and the gelation kinetics of the injected chemical. The second is to ensure that the strength of the formed gel can withstand the force imposed by the injected water. Generally speaking, gel strength is affected by gelation kinetics. As far as we are aware, less attention has been paid to gel strength, with only qualitative observations recorded in literature. The third challenge is to maintain gel strength for as long as possible. This is influenced by gel shrinkage owing to the amount of fluid expelled from the gel—a process known as syneresis [10]. Syneresis may cause the blocked reservoir zone to recover a fraction of its original permeability [1].
2. Theory
Na-silicate is a generic name for a family of inorganic compounds composed of silica (silicon dioxide) and sodium oxide in various proportions [(SiO2)n:Na2O, n < 4]. The molar ratio between silica and sodium oxide (n) plays an important role in the chemical behavior of Na-silicate [11]. It is delivered commercially as a solution with a pH in the range of 11–13 and with a decrease in alkalinity of n.
Monomer silicate in the solution is made up of tetrahedral structures of silicon and oxygen atoms. In each tetrahedron, a silicon atom is located at the center of an oxygen-cornered, four-sided pyramid. In Na-silicate, each oxygen atom is typically linked to a sodium or hydrogen atom, or associated with another silica tetrahedron in the case of dimer. The detailed mechanism of silicate gelation is not fully understood. Iler [11] summarized the available literature and described the chemistry of silicate polymerization in detail.
Silica particles carry negative charges in alkaline, neutral or weakly acidic solutions, which retard the association by electrostatic repulsion [1,10]. Based on classic Derjaguin, Landau, Verway, Overbeek (DLVO) theory [12], particles repel each other at a pH above 11. As the pH is reduced or through charge screening and reducing the dielectric constant of the aqueous phase (by adding inorganic salts or alcohol) [11,13], silicate species aggregate to form higher-order oligomers. The silanol groups within the polymers condense to build larger particles. Polymer chains and eventually gel are formed by the aggregation of these particles. Gelation occurs when particle aggregation ultimately forms a uniform, three-dimensional network of silicate particles. When gelation begins, the initially transparent solution of Na-silicate starts to become cloudier. That cloudiness thickens as the gel develops, and the gel's appearance is sometimes used as a qualitative measure of gelation time.
The polymerization rate of Na-silicate is affected by the pH, silicate concentration, temperature and concentration of the divalent cations. An-Peng [14] and later Krumrine and Boyce [4] explained how these variables affect the reactions of silicic acids in the solution.
2.1. Effect of pH and Silicate Content
An-Peng [14] suggested the following reactions as the pH is reduced, where silicic acid is formed:
At high pH, H2SiO42− and H3SiO4− are the dominant ions. The dominant species at a lower pH (slightly alkaline or neutral) are H3SiO4− and H4SiO4; therefore, the condensation process starts and may be expressed by the following reaction:
Two silanol groups form a new bond in which an oxygen atom bridges the silicon atoms to produce siloxane (Si–O–Si) [11]. According to Equation (2), a hydroxyl ion is liberated as a result of the condensation reaction. Therefore, the pH of a Na-silicate solution gradually increases with time, after adjustment of the pH. The resultant dimers polymerize by reacting with H3SiO4− to form trimers in alkaline solutions. The polymerization process continues and finally forms a gel network.
When the pH of the silicate solution enters in the highly acidic ranges, H4SiO4 and H5SiO4+ reacts to form a different type of dimer, which finally results in acidic silica gel. Acidic gels are considerably stronger than alkaline gels. Since their gelation time is normally short and difficult to control, they are not suitable for deep placements [4].
2.2. Effect of Temperature
Jurinak and Summers [13] found that the gelation time of silicate as a function of temperature and at fixed pH and salinity follows the Arrhenius equation:
2.3. Effect of Salinity
Addition of salt to an alkaline solution results in charge screening, which decreases gelation time. Divalent metal ions such as Ca2+ and Mg2+ are more effective in screening the silica particles, and consequently accelerate the gelling kinetics more than monovalent cations [13]. They also form metal silicate precipitations via ion exchange, which are relatively insoluble over a wide range of pH values. In the case of magnesium chloride, for example, the reaction is as follows [4]:
2.4. Syneresis
After gelation time, the gel network continues to reform, causing the gel strength to increase gradually. As the system approaches equilibrium, the gel shrinks and expels the liquid it contains [3]. The first systematic investigation of such syneresis in silicic acid gels was done by Holmes et al. [15]. Brinker and Scherer [16] discussed syneresis and the factors affecting it in detail from the literature. They found that syneresis is generally attributed to the formation of new bonds (siloxane bonds) during gel development by condensation of two silanol groups (–Si–OH) [16]. Gel shrinkage occurs because the siloxane bond formed [see Equation (2)] takes less space than the two individual silanol groups from which it derived. Ferguson and Applebey [17], who studied the kinetics of silicic acid gels, found that the more rapidly the gel sets, the larger are the initial syneresis rate and the volume of expelled liquid.
3. Experimental Section
3.1. Materials
Silicate solution (Na-silicate) was supplied by BIM Kemi AB, Drammen, Norway. The Na-silicate content in the solution was 35.7 wt%. The molar ratio (n) of the sample was 3.35. The content of silicate and sodium oxide was 27.3 wt% and 8.4 wt%, respectively, as specified by the supplier. This solution had a density of 1.368 g/cm3 and a pH of about 11.4 at 20 °C. The Na-silicate samples were stored in plastic containers. To clean the gel from equipment and containers, diluted NaOH solutions were used to dissolve Na-silicate by increasing its pH.
Solutions with Na-silicate content between 3 wt% and 6 wt% were prepared by diluting the supplied sample with distilled water (DW). Other liquids, such as synthetic seawater (SSW), LSW (volumetric dilution ratio SSW/DW is 1:25) and water containing single cations (Ca2+ or Mg2+), were also used. The composition of SSW is given in Table 1.
Hydrochloric acid (HCl) with a concentration of 7.4 wt% (2.02 M) was used to adjust the pH. When adding acid to the Na-silicate solutions, the latter were agitated to prevent localized coagulation. After adjusting the pH, the solution was stirred for about 30 s to assure a uniform pH in the solution. The Na-silicate content was adjusted to compensate for dilution from the added acid. In order to adjust the pH of 6 wt% Na-silicate solution to 10.6, for example, approximately 10 wt% HCl is added. If the Na-silicate content was not properly compensated for, the resulted solution would be less than 5.4 wt% (i.e., 10% error in this example).
3.2. Methods
The S20 Seven Easy™ pH meter (Mettler-Toledo, Columbus, OH, USA) was used for pH measurements. The pH of a Na-silicate solution increases gradually with time, after adjustment of the pH as predicted by Equation (2). In order to maintain the consistency of the reported data, all the pH measurements were carried out no more than 3 min after preparation of the samples.
Viscosity and gelling time were measured using a Paar Physica UDS 200 Universal Dynamic Spectrometer (Anton-Paar GmbH, Graz, Austria). Most of the measurements were performed at a shear rate of 10 s−1, which is close to the average shear rate in the reservoir. The effect of high shear rates of up to 1000 s−1 on gelation time was also examined.
Figure 1 shows the apparatus we designed for measuring gel strength. This enabled us to deviate from qualitative assessment of gel strength based on the common practice of personal observations (e.g., ringing gel test). The apparatus consisted of three main parts: the sample container as well as measurement and monitoring devices. Constructing the sample container from two concentric cylinders made of polypropylene avoided the use of glass that could react with Na-silicate. The inner radius of the outer cylinder was 16.5 mm and the outer radius of the inner cylinder was 14 mm. Therefore, the thickness of the gap between the cylinders was 2.5 mm. This gap was filled with 20 g of liquid Na-silicate solution and left for the gel to set. To prevent water evaporation, especially at higher temperatures, the gap was completely sealed with NBR 70 O-rings measuring 26.64 mm × 2.62 mm [Arne Bø-Pedersen (ABP) AS, Sandnes, Norway]. The samples and sample container were used only once.
The sample container was fixed in the measurement device, which comprised two small pulleys with a rope placed in their channels, to assess its strength after a specified time. The rope was connected to the inner cylinder of the sample container. In each measurement, the inner cylinder was pulled out vertically at a constant velocity of 0.5 mm/s. The pulley system transferred the rope movement to an upward force (2F). This force was twice the force needed to pull the inner cylinder (F). The weighing balance was connected to a monitoring system. The force (F) was estimated from the weight necessary to lift the inner cylinder and was proportional to gel strength. To find gel strength at various times during gel formation, several samples with identical properties were prepared and their strength measured at different times during the gelation process.
To quantify the gel shrinkage, Na-silicate samples with different initial conditions were kept in completely sealed polypropylene containers for several days. As shrinkage began, the expelled liquid appeared on the surface. The liquid was then removed and weighed as a function of time. Assuming that the initial solution and the expelled liquid had approximately equal densities, the ratio between the weight of the expelled solution and the initial sample (wt% of expelled liquid) provided a measure of the shrinkage rate.
4. Results and Discussion
The pH of different Na-silicate solutions was obtained by diluting the initial Na-silicate from 35 wt% to 0.02 wt% with DW. As shown in Figure 2, a marginal change in pH is demonstrated until the Na-silicate content reaches about 6 wt% of the diluted initial Na-silicate (hereafter only the wt% of the Na-silicate will be used). This may indicate a high buffer capacity of Na-silicate above 6 wt%. A considerable difference in the pH is observed for diluted Na-silicate below 3 wt%. A Na-silicate content ranging between 3 wt% and 6 wt% is used as practical for the purpose of this work and for field application.
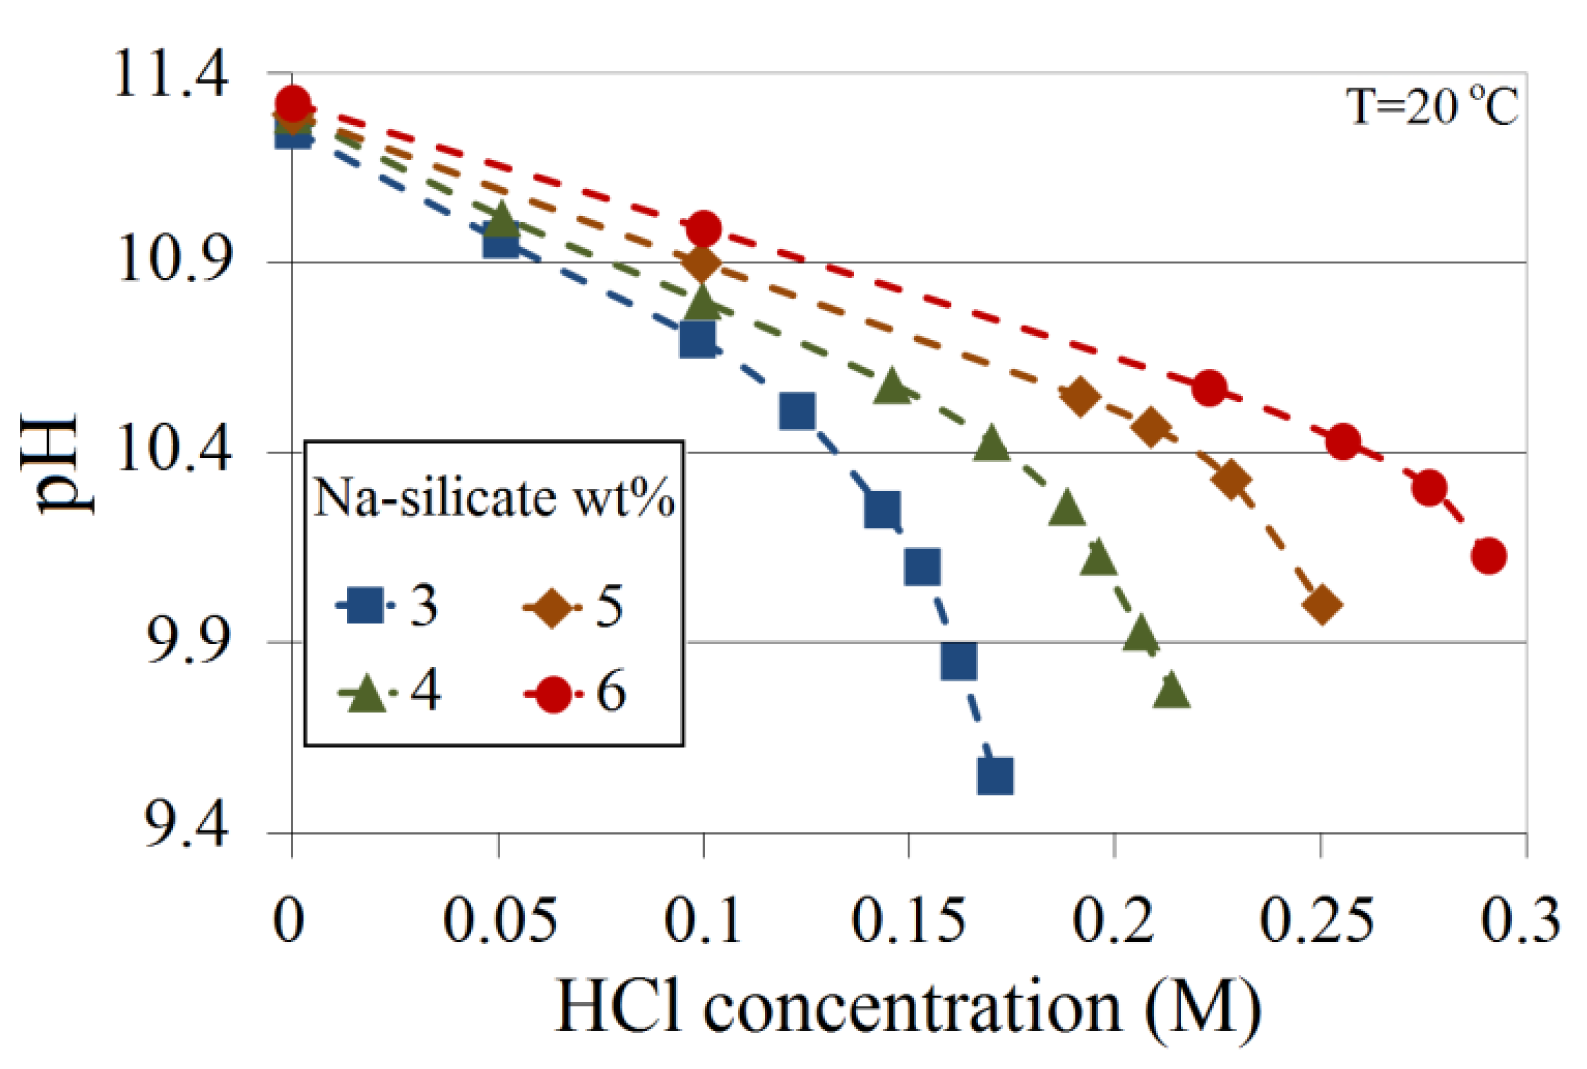
The added HCl to solutions with different Na-silicate contents (wt%) is plotted with the corresponding pH in Figure 3. All Na-silicate contents show similar trends, i.e., pH decreases linearly up to a certain point (here called the deviation point), after which the rate of pH reduction increases with the added acid. The gradients of pH as a function of the increased HCl concentration depend on the Na-silicate content, i.e., the higher the Na-silicate wt%, the lower the gradient owing to the increase in buffer capacity. The figure also shows that, as expected, the deviation points are not the same for all the Na-silicate contents (wt%). For 3 wt% Na-silicate solution, the deviation occurs at about pH 10.7, corresponding to the addition of about 0.12 M HCl, whereas the deviation point for 6 wt% Na-silicate solution occurs at about pH 10.5, which corresponds to an acid concentration of approximately 0.25 M, which is almost twice that of 3 wt%.
4.1. Gelation Time
Factors affecting gelation time are the silicate content, the pH, the concentration of divalent ions (namely Ca2+ and Mg2+), temperature and the shear rate [4]. This section addresses the influence of each factor on gelation time, and then the combined effect, in an attempt to predict gelation time.
Gelation time (tg) is measured as a function of viscosity. It is defined as the time after which viscosity deviates from linearity. Typical viscosity profiles and gelation times, at 10 s−1 and room temperature (20 °C), for 4.5 wt% Na-silicate with pH values of 10.30 and 10.40 are presented in Figure 4. As it can be seen, the onset of gelation is followed by fluctuations in viscosity. Lakatos et al. [2] referred to this as an induction period. For both pH values, Figure 4 shows a slight reduction in viscosity followed by a continued increase in viscosity. This may suggest the occurrence of a localized increase in pH caused by the OH− ions produced from the condensation reaction presented by Equation (2).
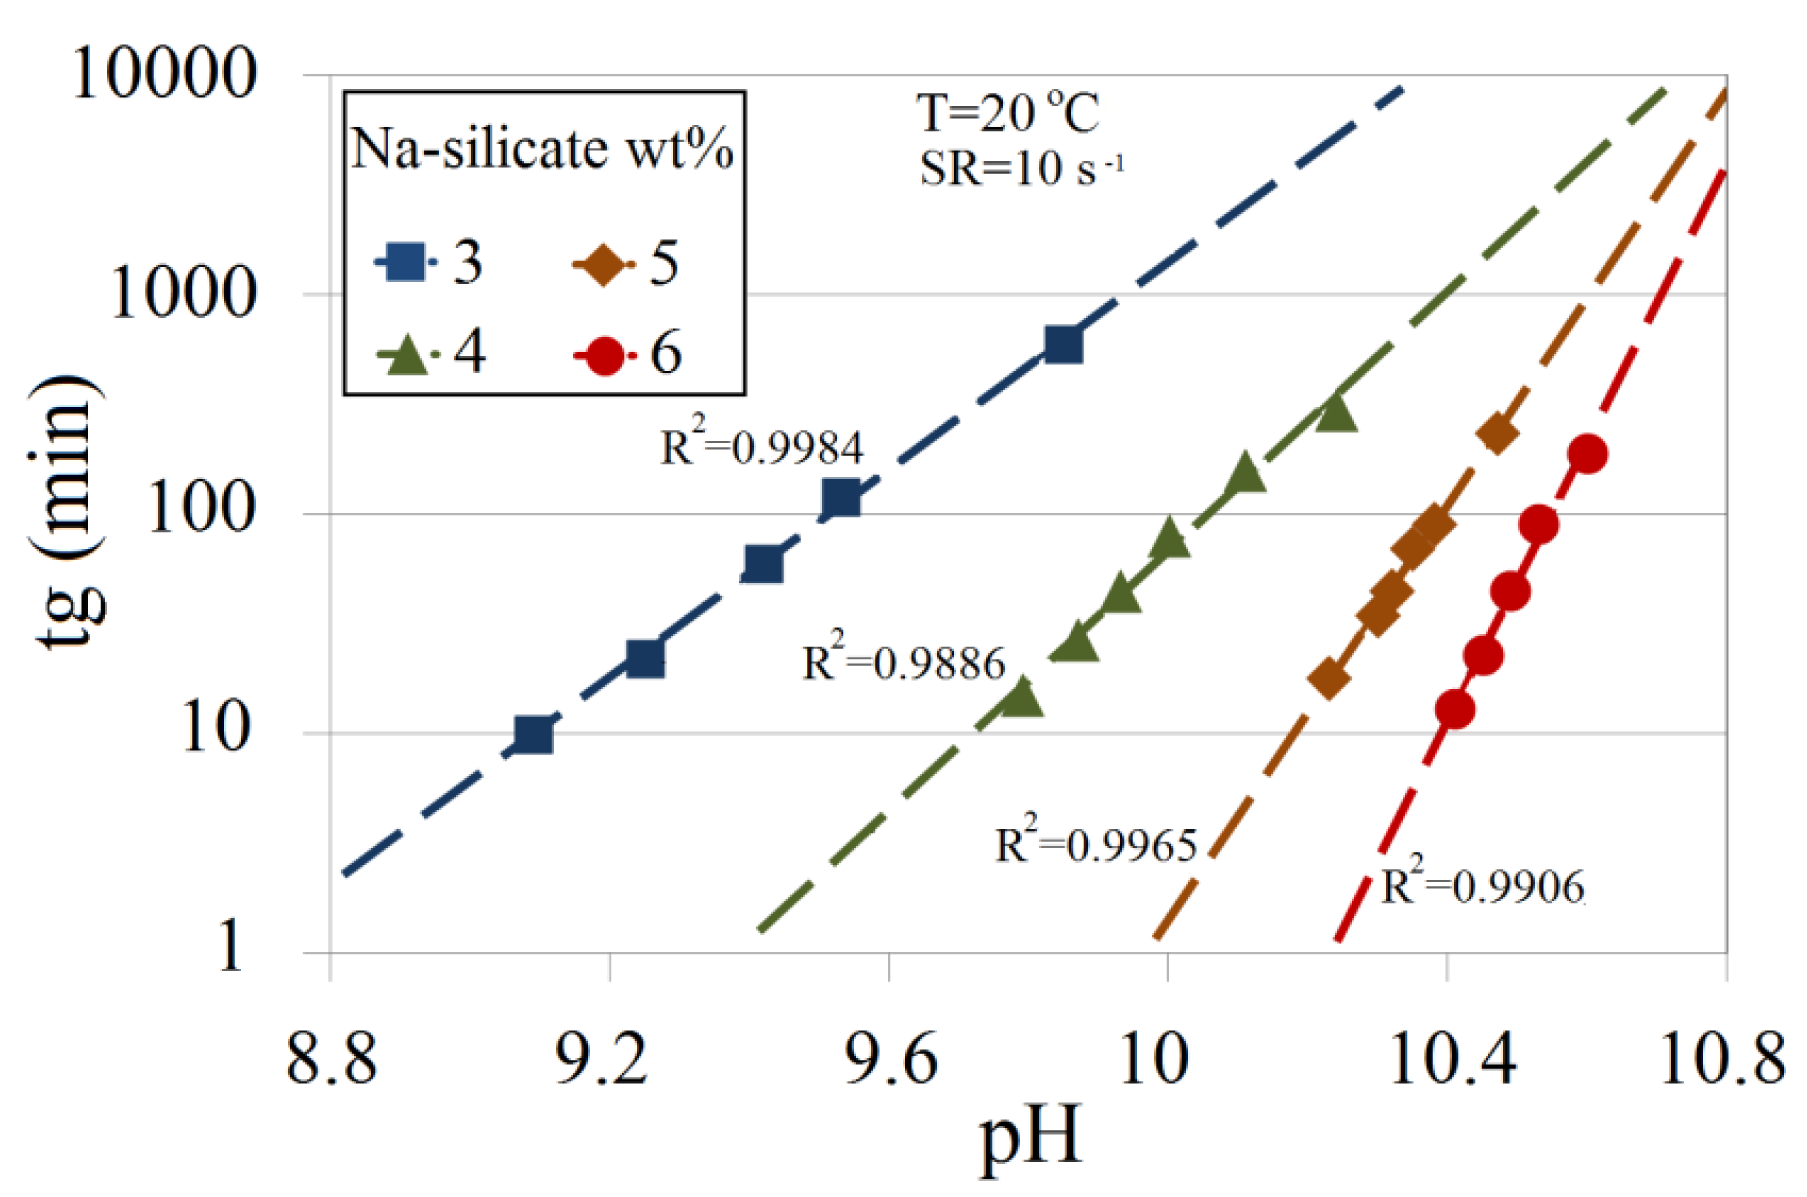
Gelation time is dependent on the Na-silicate content and the pH. Figure 5 illustrates these relationships. A linear dependence between tg in logarithmic scale and pH for 3 wt%, 4 wt%, 5 wt% and 6 wt% Na-silicate in DW is demonstrated at 20 °C and a shear rate of 10 s−1. For a specific pH, the condensation rate of silicic acid increases with silicate content. Lowering the pH for a certain silicate content also increases silicic acid condensation, and hence reduces gelation time.
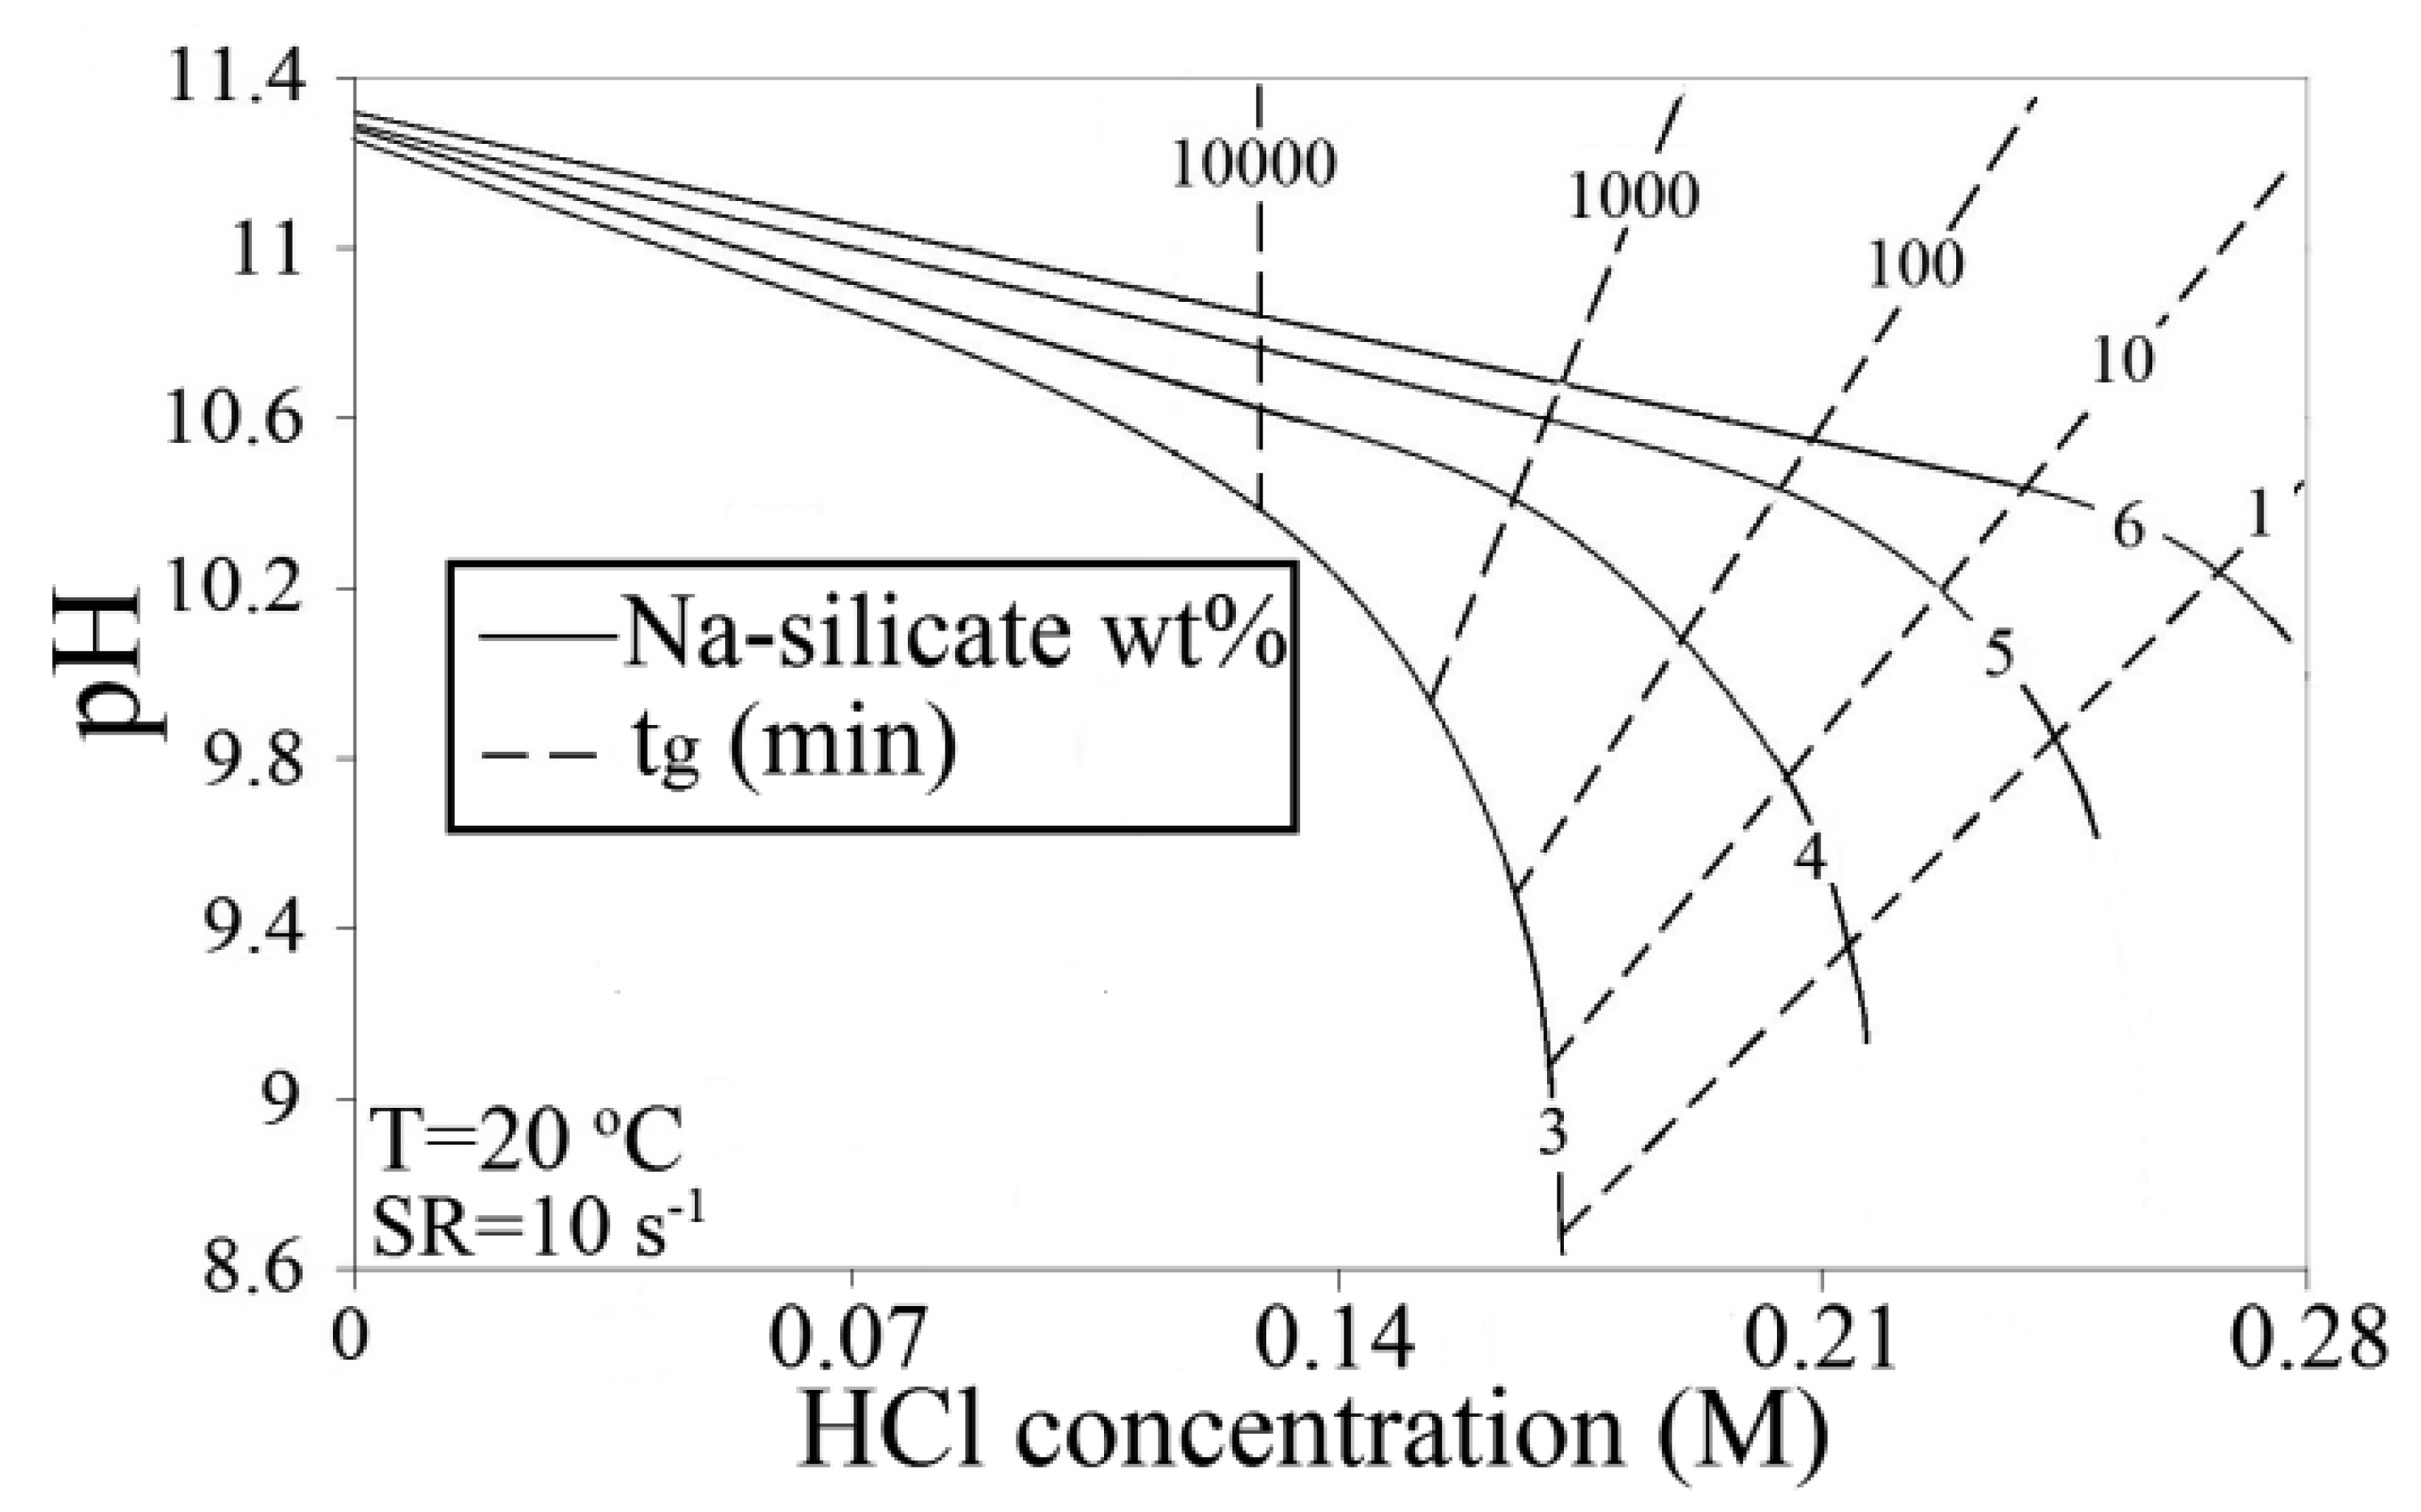
Figure 6 is obtained by combining Figures 3 and 5, and can be used to predict the amount of acid that has to be added to silicate solutions in DW to reach the corresponding pH for a certain gelation time. In this plot, gelling times are presented as iso-gelation time contour lines. As an example, reducing pH of 6 wt% from 11.35 to about 10.55 brings gelation time to roughly 100 min, while it exceeds 10,000 min at a pH of 10.55 for 3 wt%.
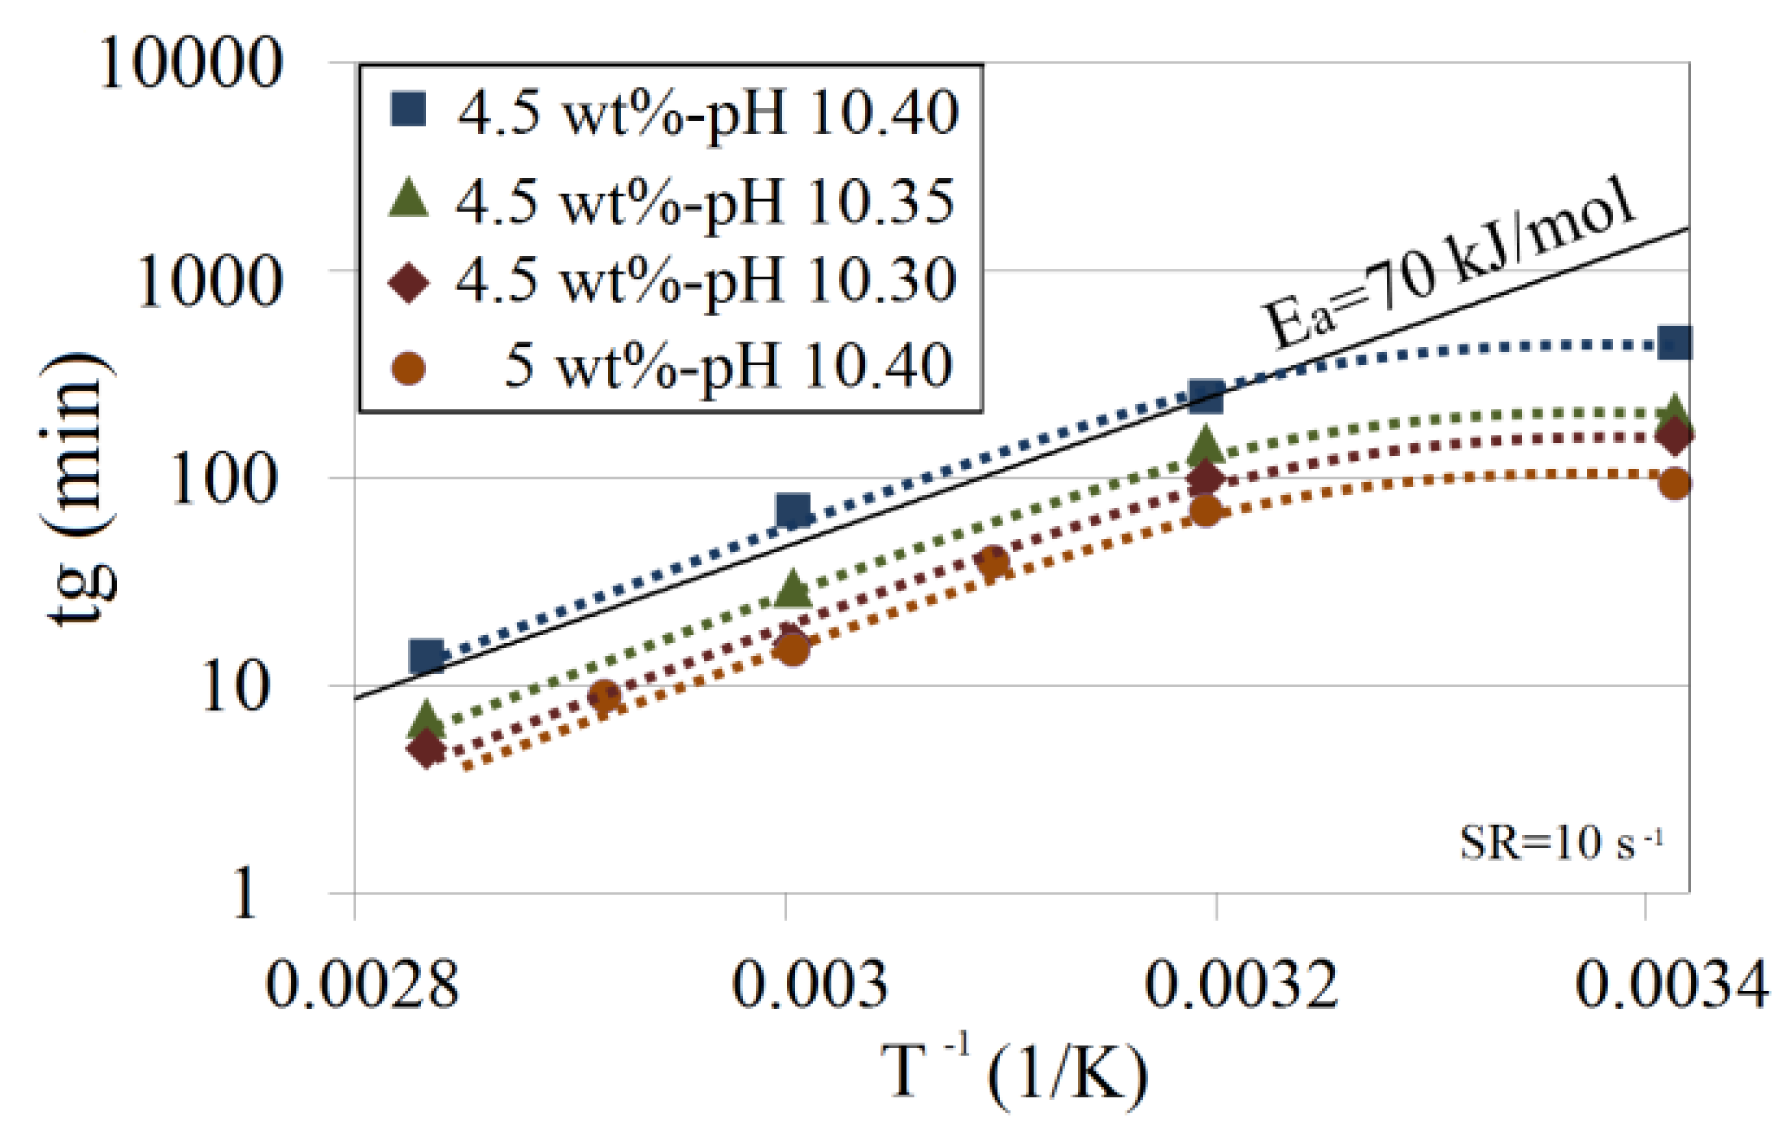
The effect of temperature on the gelation time is shown in Figure 7. The logarithmic plot of tg as a function of the reciprocal absolute temperature for the Na-silicate contents of 4.5 wt% and 5 wt% at different pH values shows that the effect of temperature on gelation time below 40 °C (313 K) for the tested pH is smaller than at the higher temperatures. A similar observation has previously been reported [9,11,18]. According to Iler [11], the drop in activation energy in this range implies that there is a pre-equilibrium step in the polymerization. First, some small polymeric species are formed with which the monomer reacts preferentially. This is a kind of induction period. Activation energy for temperatures above 40 °C is estimated to be about 70 kJ/mol. This is in good agreement with the average activation energy (ranges between 60 kJ/mol and 80 kJ/mol) reported in the literature [1,11,13,18].
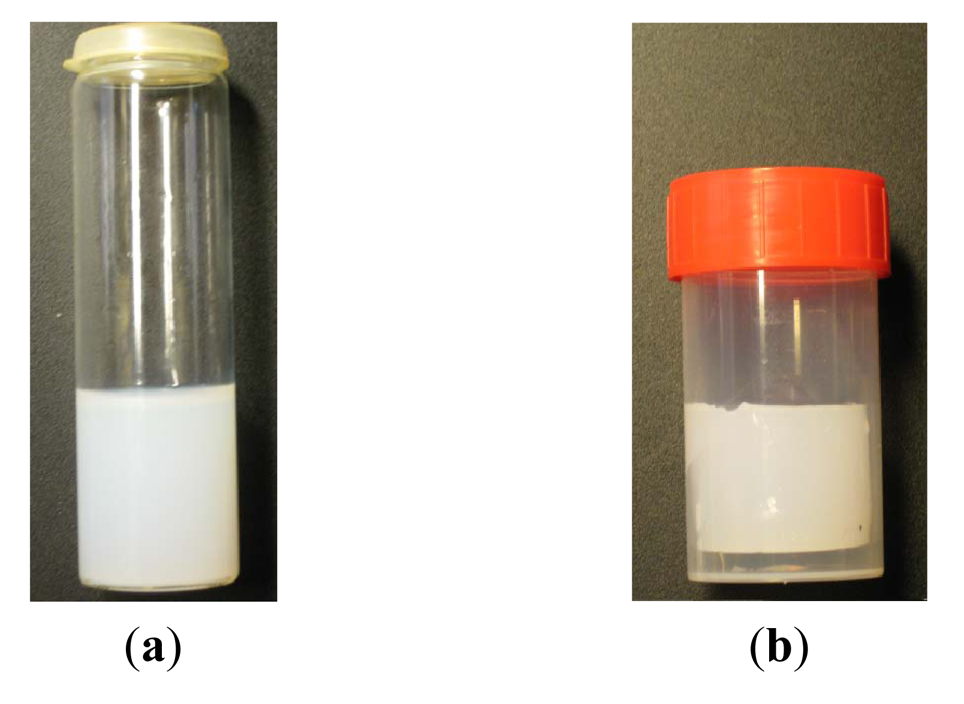
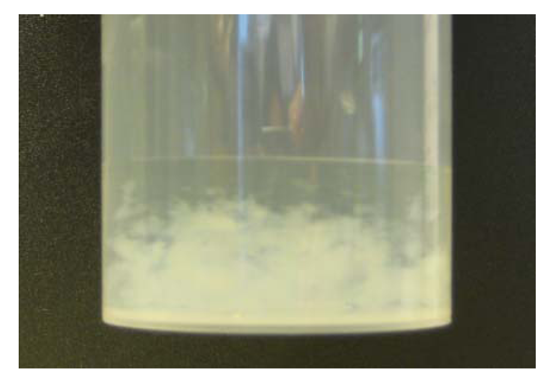
Adding SSW (Table 1) to Na-silicate solutions results in immediate white precipitation, which is believed to be caused by the formation of calcium and magnesium silicate [4]. Figure 8 shows the white precipitation caused by adding 25 wt% of SSW to 4.5 wt% Na-silicate solution. Adding SSW causes viscosity to increase to about 0.1 Pa·s at 20 °C and a shear rate of 10 s−1 prior to gel onset. A slight reduction in pH to 10.90 (by adding less than 0.1 M HCl) results in an immediate gelation in addition to precipitation.
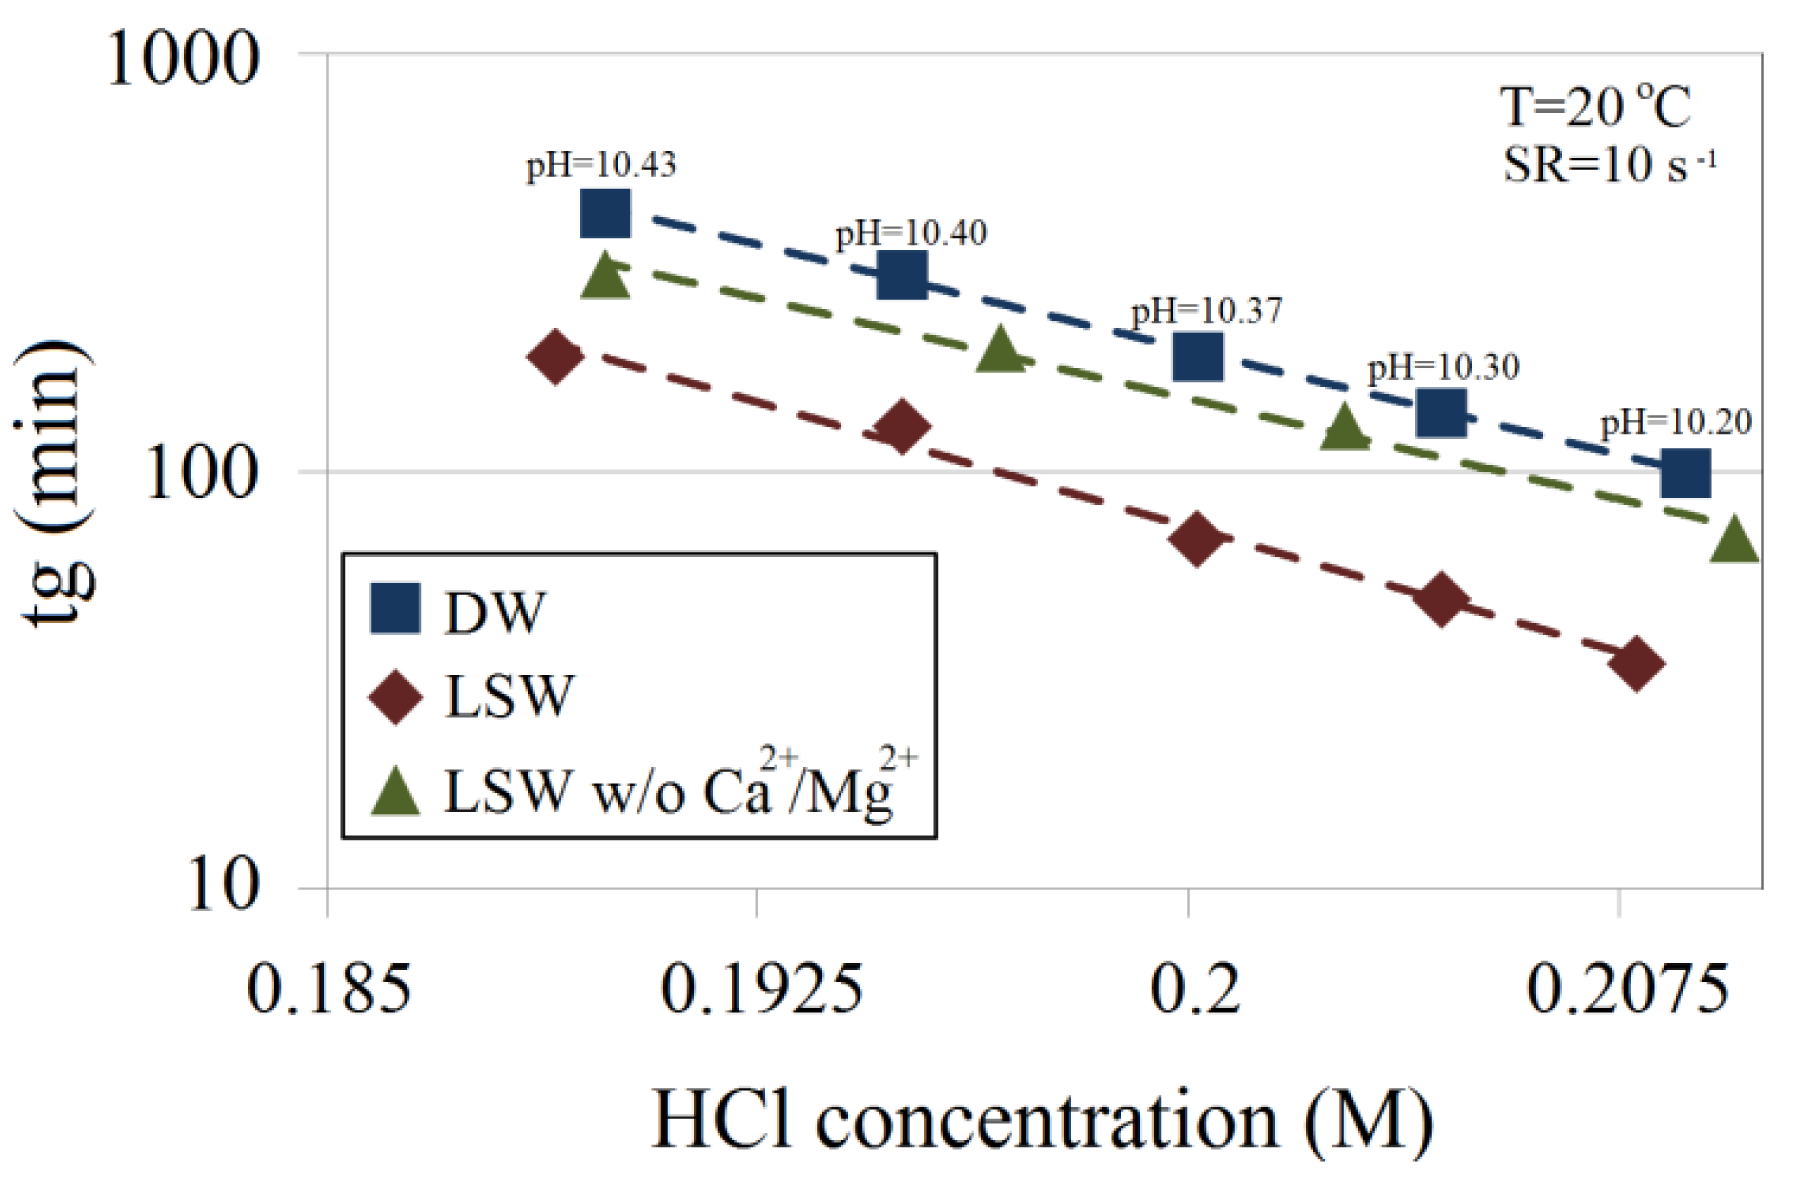
No precipitation was observed for LSW. A comparison of gelation times for 4.5 wt% with DW, LSW and composed LSW without the divalent cations (Ca2+ and Mg2+) shows that the ratio between gelation times of LSW and DW is approximately 0.4, and this ratio for divalent ion-free LSW is about 0.7, as shown in Figure 9. This confirms the influence of the divalent ions on gelation time.
Various explanations have been suggested in the literature for the effect of inorganic salts on gelation time. Krumrine and Boyce [4] attributed the effect to the reaction of salt with surface silanol groups. Jurinak and Summers [13] suggested charge screening as the governing effect when adding salts. According to Iler [11], inorganic metal salts reduce the electrostatic forces between silicate particles by reducing the dielectric constant of the aqueous medium.
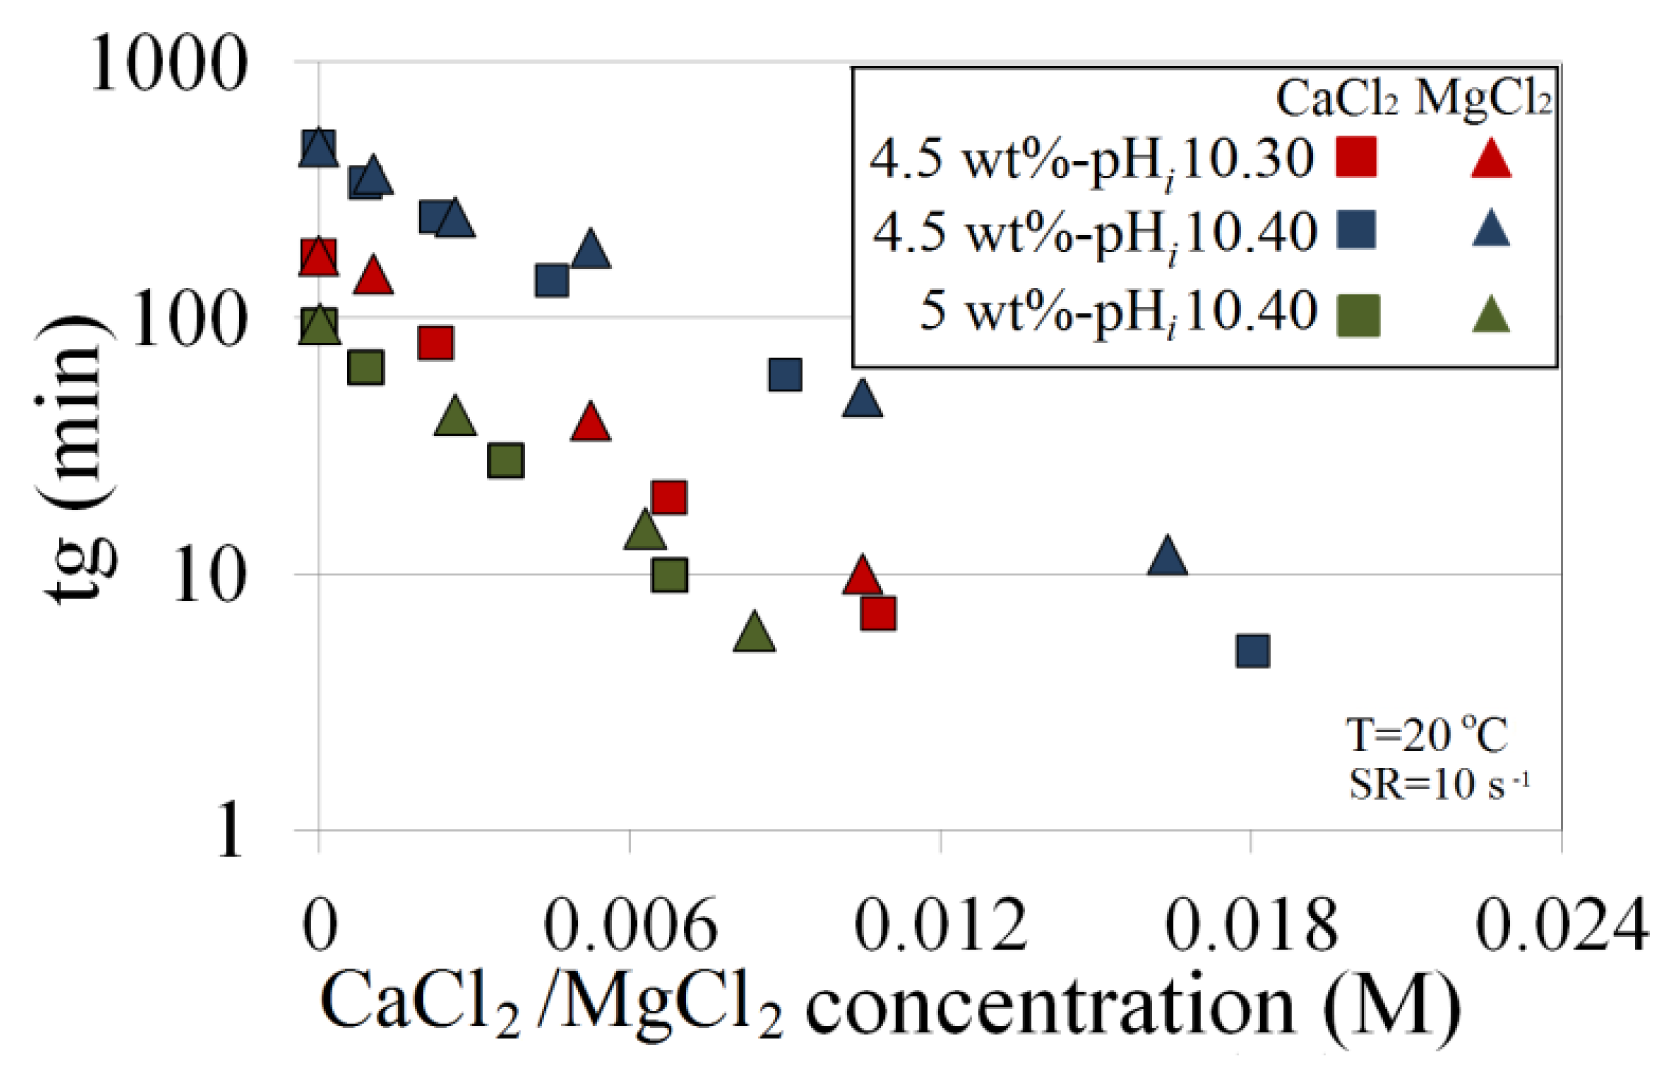
The effects of various Ca2+ and Mg2+ concentrations, individually and combined, are investigated when mixed with Na-silicate contents of 4.5 wt% and 5 wt% at a temperature of 20 °C and a shear rate of 10 s−1. Figure 10 shows the various solutions with pHis (pHis of ion-free solutions) of 10.30 and 10.40. As shown in Figure 10, both ion concentrations have inverse and near-linear functions with tg. However, Mg2+ is relatively less effective in accelerating gelation time. This difference is more evident when the solution pH and the concentrations of divalent ions are high. An experiment is done for 5 wt% Na-silicate with a high pHi of 10.7 at a temperature of 20 °C and a shear rate of 10 s−1. The ion-free solution gels after about 50 h.
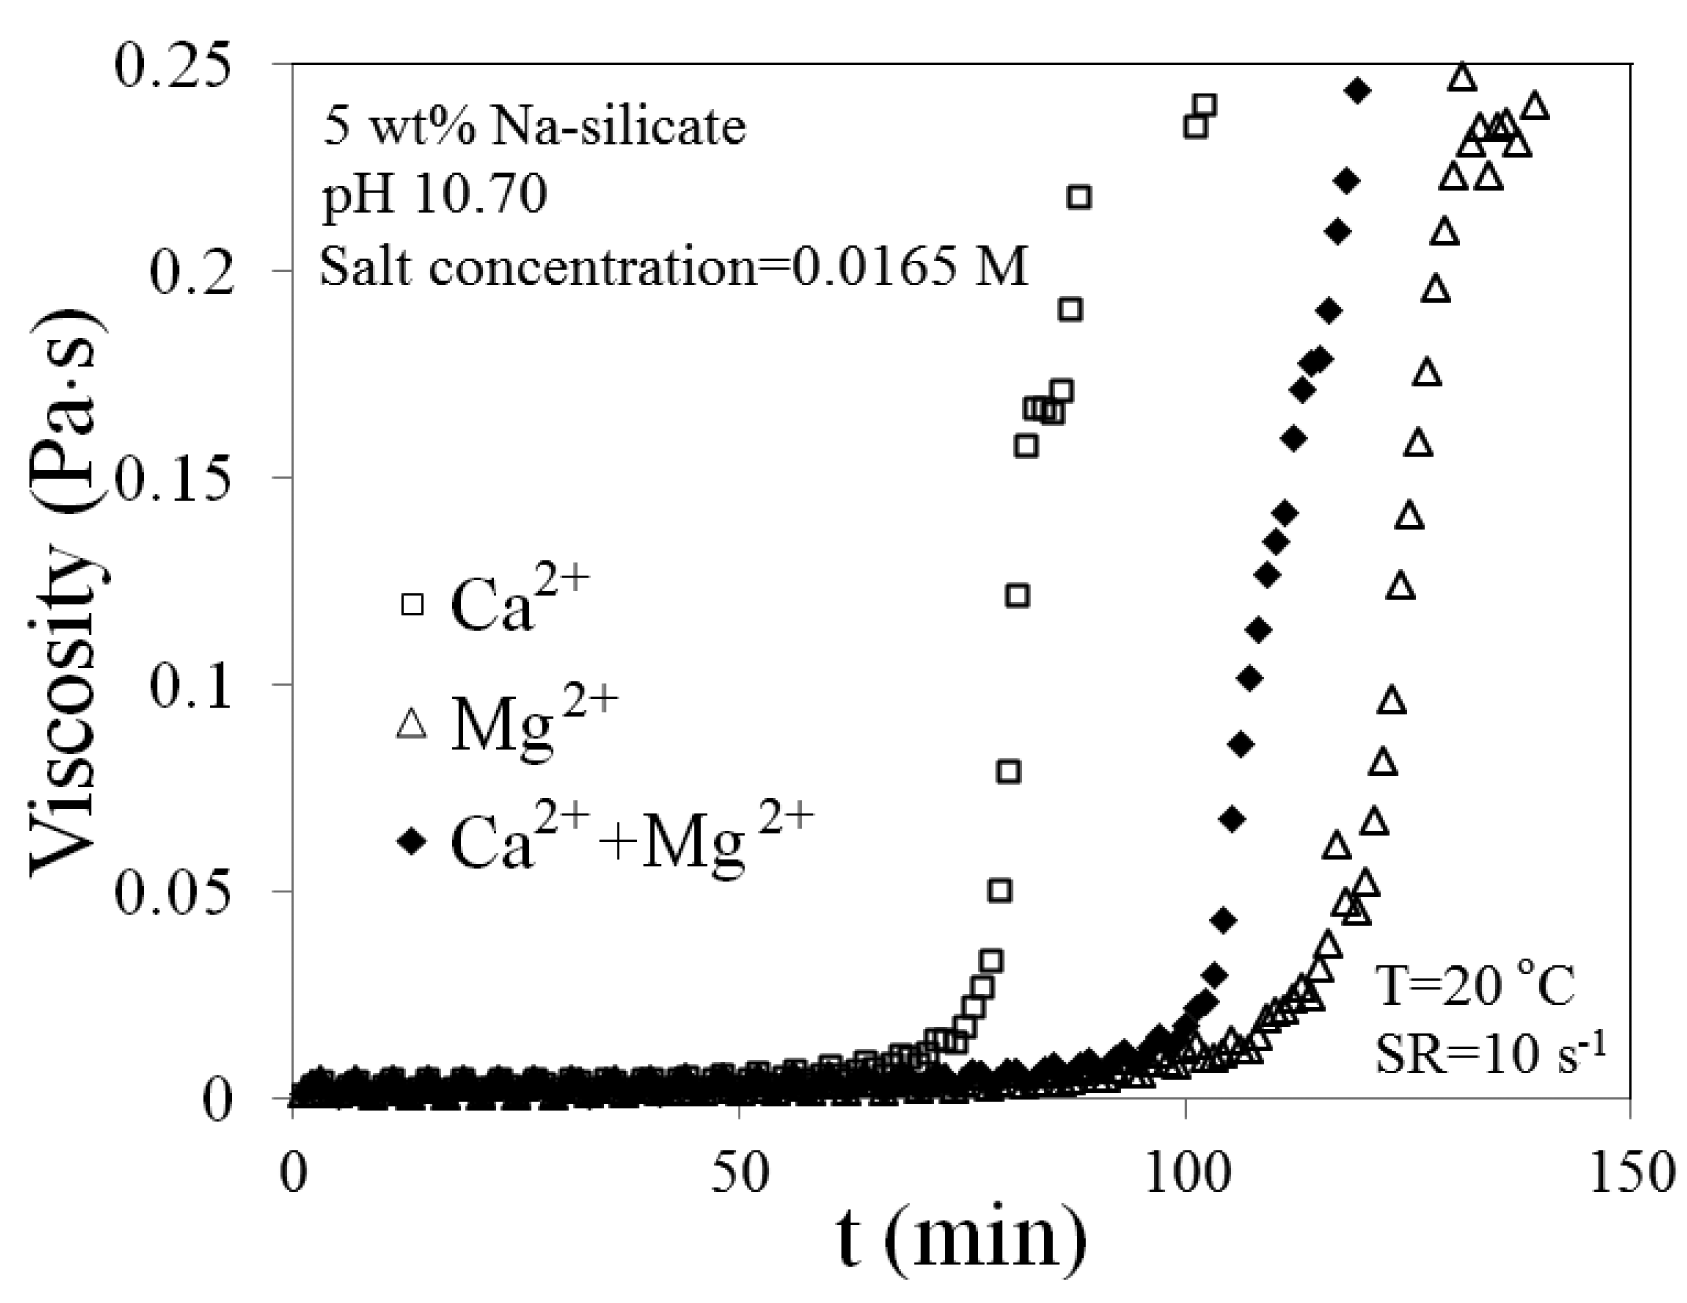
Viscosity versus time is compared and presented in Figure 11 for three different cases: 0.0165 M Ca2+, 0.0165 M Mg2+ and 0.00825 M Ca2+ + 0.00825 M Mg2+. The solution which contains just Ca2+ has the shortest tg = 1 h, while the one with Mg2+ gels after about 1.5 h. Gelation time for the combined ions lies between the times for the two individual ions. The larger effect of Ca2+ compared with Mg2+ may be caused by the greater effect of calcium ions on the dielectric constant. For practical purposes in predicting gelation time, however, the effect of both ions is considered to be equal.
For the 4.5 wt% Na-silicate solution, precipitation appears at CaCl2/MgCl2 concentrations >1500 ppm.
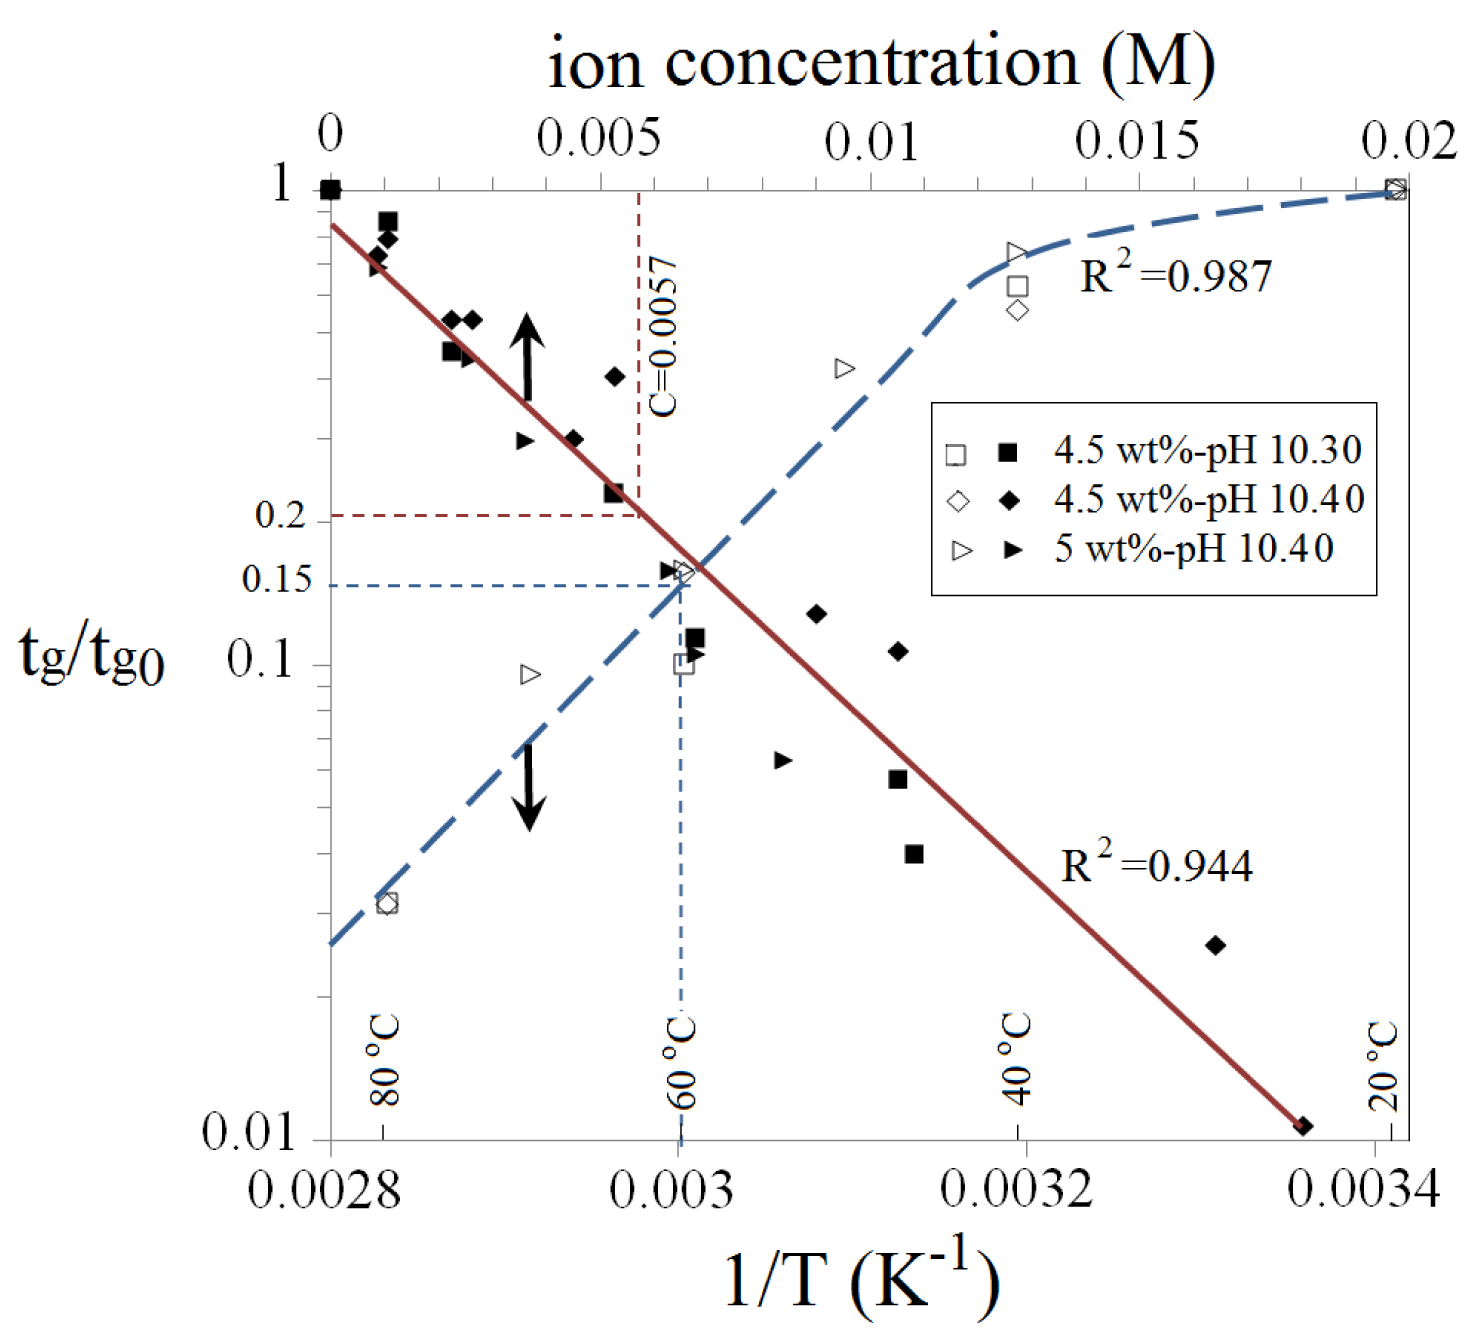
Gelation time could be roughly predicted for a given Na-silicate solution, taking account of the combined effects of silicate content, pH, temperature and divalent ions from Figures 5 and 12. tg0 is regarded as the gelation time of a certain Na-silicate sample at T = 20 °C and zero salinity. tg0 is obtained from Figure 5 for Na-silicate contents in the range of 3 wt% to 6 wt% and with different pH values. The interpolated normalized gelation time (tg/tg0) as a function of the reciprocal of absolute temperature, as well as of concentrations of Ca2+ or Mg2+, is presented in Figure 12. This figure is obtained by combining Figures 7 and 10. tg0 is first approximated, the individual effects of temperature and cations are then found, and these effects are finally combined by simple multiplication. Table 2 clearly summarizes this prediction method in estimating gelation times for four different Na-silicate samples. The method is described here with an example (the first sample in Table 2). Gelation time is predicted for 4 wt% Na-silicate at a pH of 10.40, which contains 400 ppm CaCl2 and 200 ppm MgCl2 and is heated to 60 °C. The gelation time of 4 wt% Na-silicate with a pH of 10.40 at T = 20 °C and zero salinity is first found from Figure 5 to be tg0 = 1000 min. This gelation time is corrected for the effect of temperature.
As indicated in Figure 12 with a blue dashed line, tg/tg0 = 0.15 when T = 60 °C. The effects of CaCl2 and MgCl2 are included by first converting their concentrations to the molar concentration (M) and then summing the concentrations, giving Ctotal = 0.0057 M. As indicated in Figure 12 with a red dashed line, tg/tg0 = 0.21 when Ctotal = 0.0057 M. So the estimated gelation time of this sample is obtained by multiplication: tg = 1000 × 0.15 × 0.21 = 31. The experimental gelation time for this sample was tg = 33 min. Reasonable precision is obtained with this method, which could be regarded as a first-hand prediction of gelation time for practical applications.
Na-silicate injected into reservoirs would be exposed to different shear rates. Different correlations have been suggested for relating the shear rate to flow rate, reservoir thickness, porosity and permeability [19]. Based on estimated typical shear rates for the reservoir, an average value of 10 s−1 was used for the shear rate in this work, as indicated in the previous sections. This section addresses the influence of the shear rate on gelation time.
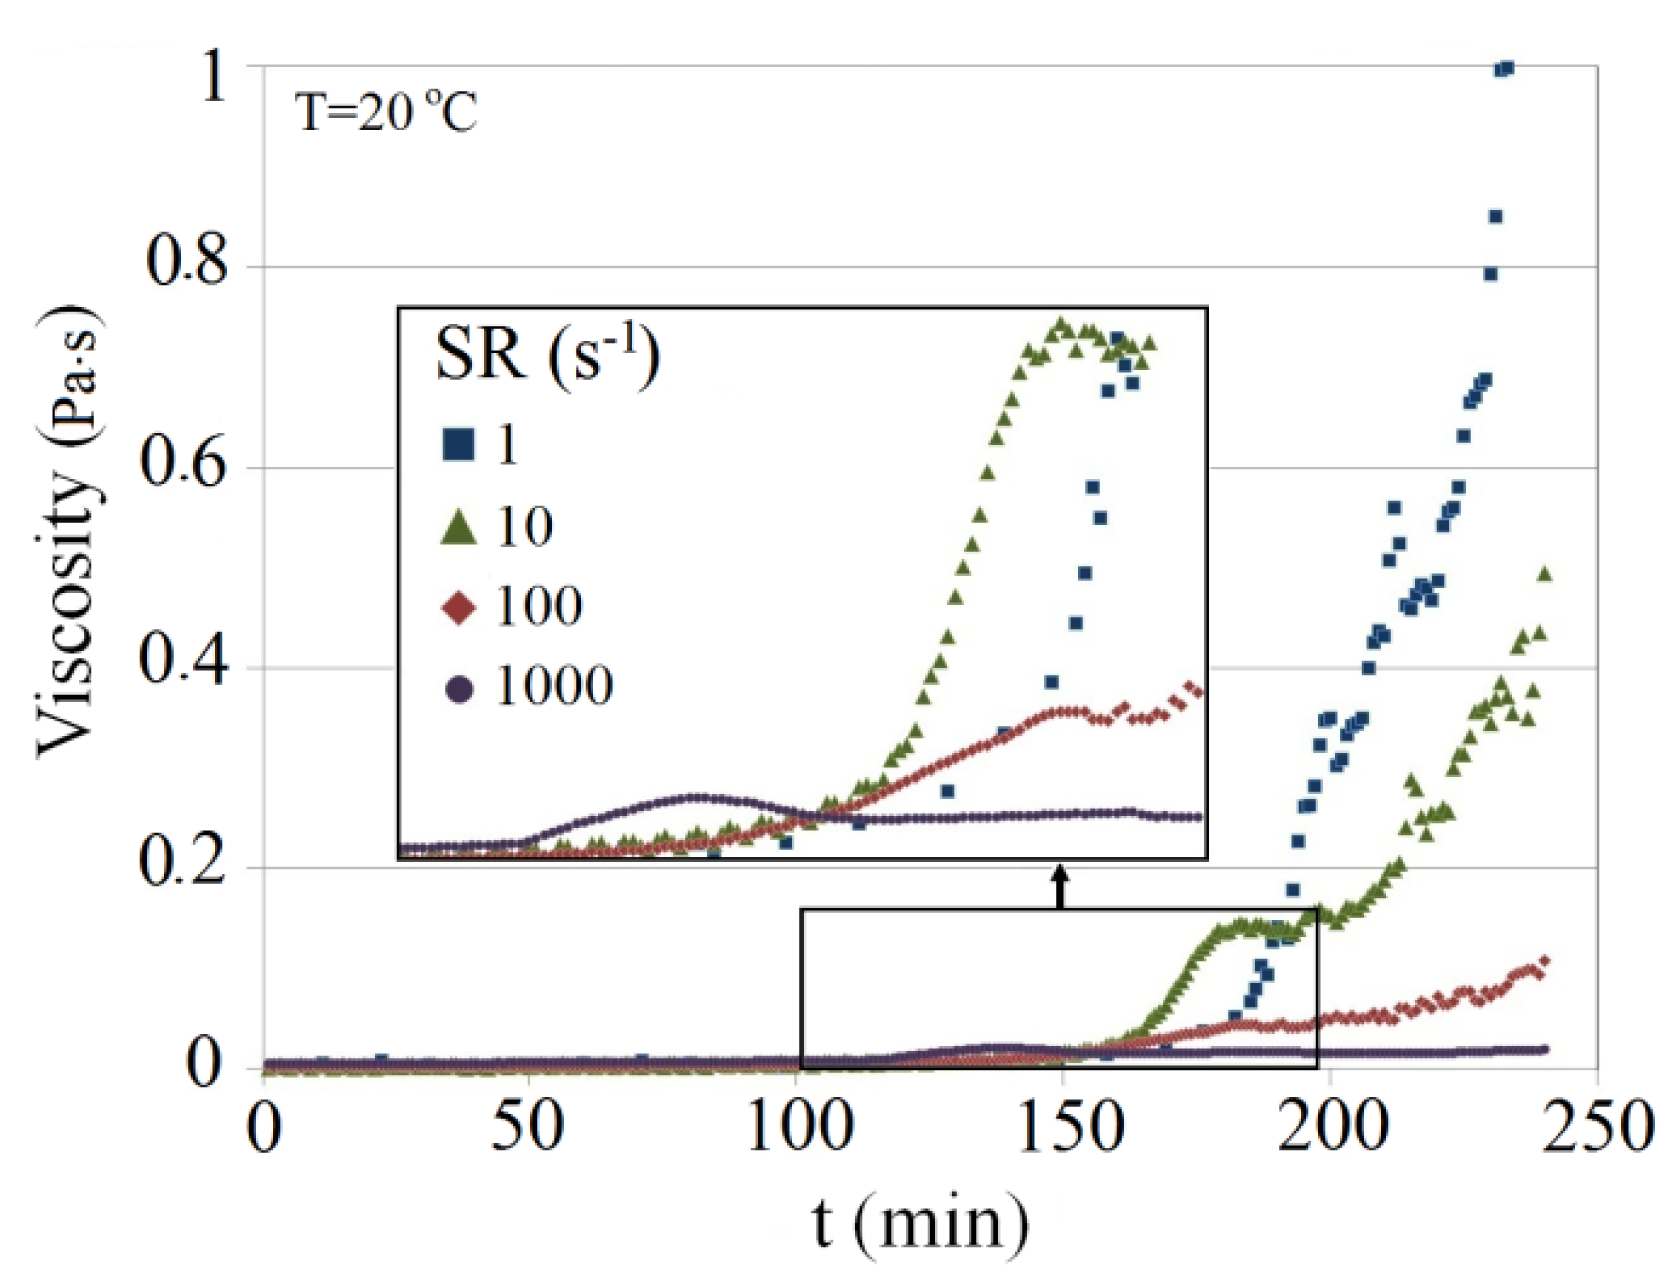
In practice, Na-silicate solutions are exposed to different shear rates both during injection and during flow through the porous media in the reservoir. Figure 13 presents the viscosity of a 4.5 wt% Na-silicate solution at a pH of 10.30 after being subjected to shear rates of 1, 10, 100 and 1000 s−1. In general, gelling time is accelerated as the shear rate increases for that range. The Na-silicate sample gels, for example, at about 160 min and 110 min when exposed to shear rates of 1 s−1 and 1000 s−1, respectively. The viscosity gradient after the gelation time is observed to be lower at higher shear rates. This may be explained by the effect of the shear rates in disturbing the gel network. At a shear rate of 1000 s−1 after gelation time, for example, the viscosity of the gel does not exceed 0.025 Pa·s.
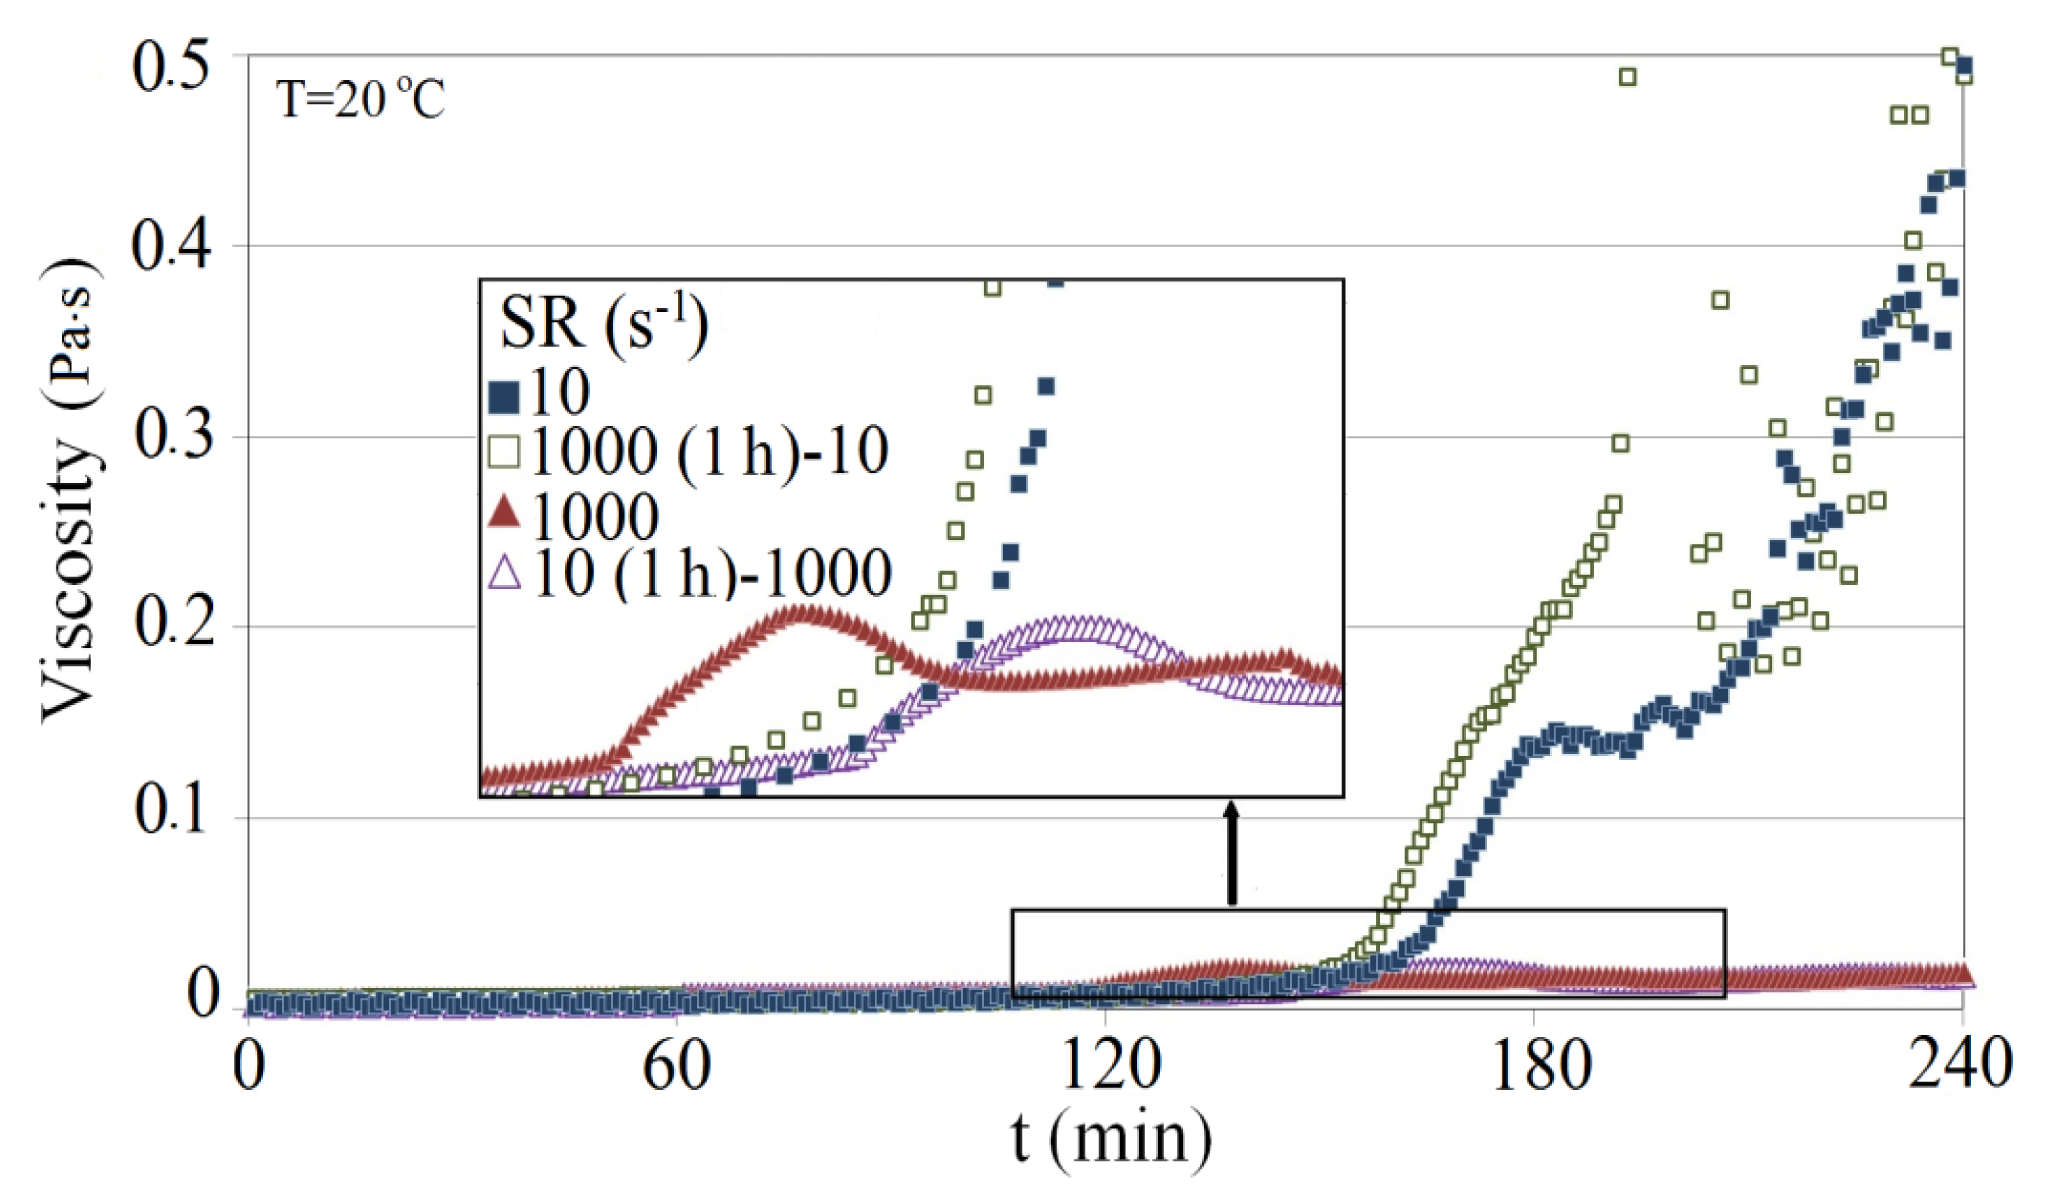
We also examined the effect on the gelling time, when Na-silicate is exposed to high shear rate in the wellbore during injection followed by low shear rate as it flows in the porous media. Figure 14 shows a comparison of viscosity profiles for 4.5 wt% Na-silicate with pH 10.30 for different shear rates (10 s−1 and 1000 s−1) and combinations of shear rates (10 s−1 for 1 h, then 1000 s−1 and 1000 s−1 for 1 h, then 10 s−1). As demonstrated high shear rate for a period of time (in this work 1 h) just before gelation time accelerates the gel formation. While applying low shear rate for a period of time (in this work 1 h) just before gelation time, delayed the gel formation. These results show that estimation of the gelation time must be corrected for the effect of the shear rates. We also examined the effect on gelling time when Na-silicate is exposed to a high shear rate in the wellbore during injection, followed by a low shear rate as it flows through the porous media. Figure 14 shows a comparison of viscosity profiles for 4.5 wt% Na-silicate with a pH of 10.30 for different shear rates (10 s−1 and 1000 s−1) and combinations of shear rates (10 s−1 for 1 h, then 1000 s−1 and 1000 s−1 for 1 h, then 10 s−1). As demonstrated, a high shear rate for a period of time (in this case 1 h) just before gelation time accelerates gel formation. In contrast, applying a low shear rate for a period of time (in this case 1 h) just before gelation time, delays gel formation. These results show that the estimate of gelation time must be corrected for the effect of shear rates.
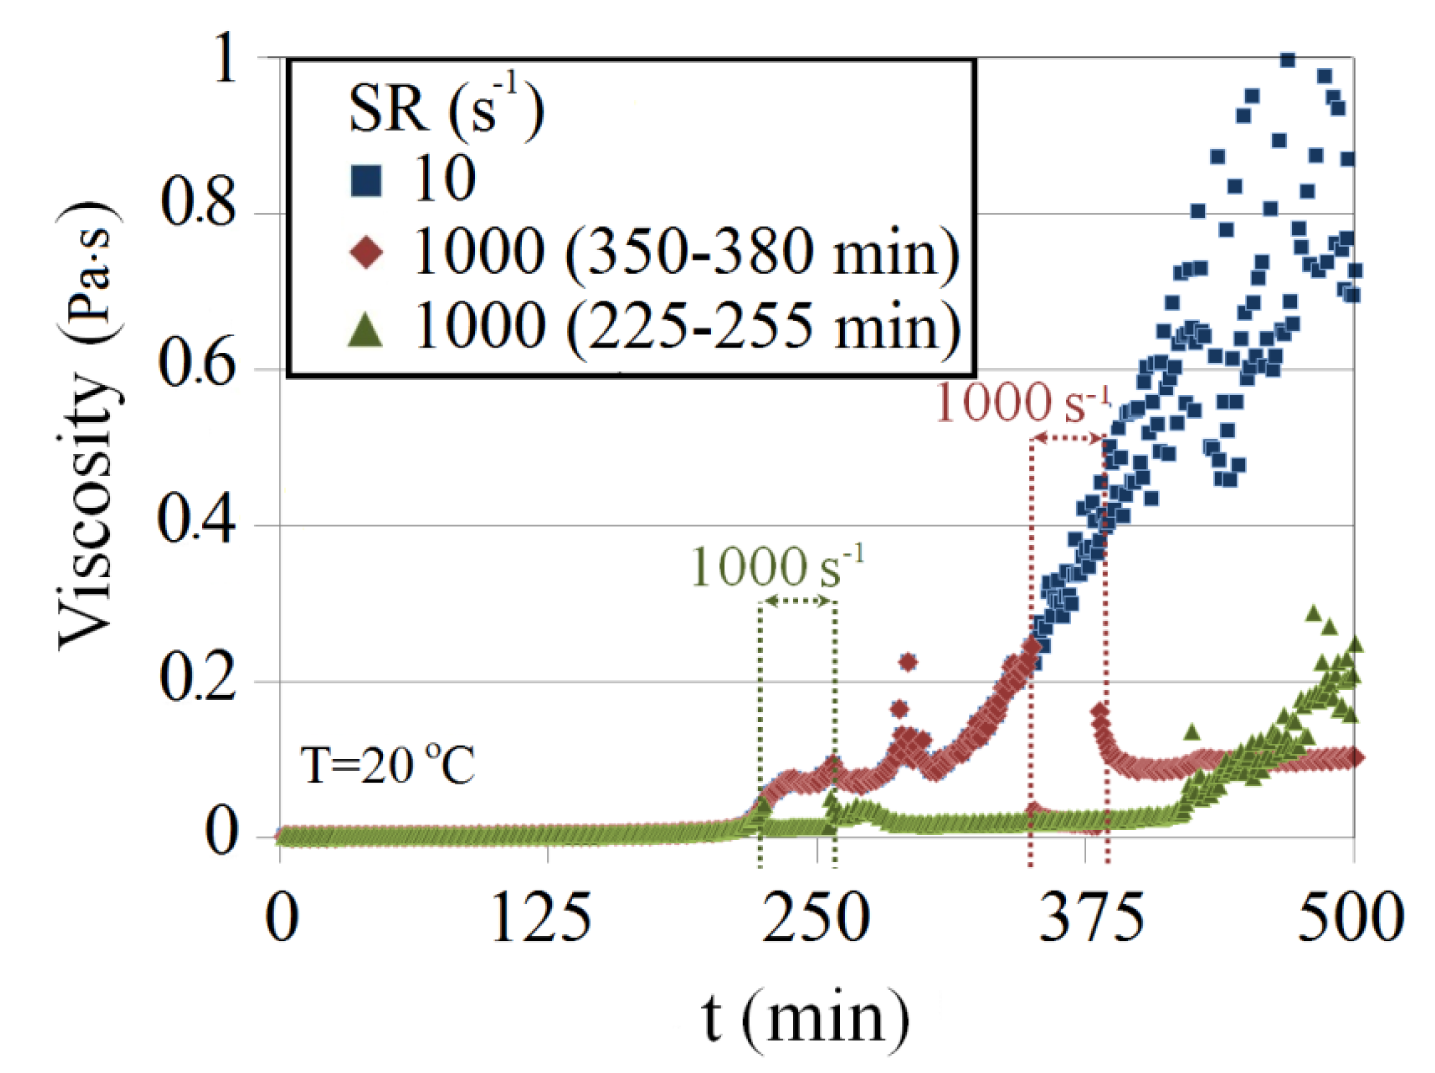
The effect of a high shear rate on the viscosity profile of Na-silicate after gelation time is investigated. Three different cases for 4.5 wt% Na-silicate with a pH of 10.35 are compared in Figure 15. In the first case, a low shear rate of 10 s−1 was applied. In the second case, the initial shear rate was 10 s−1, as in the first case. However, at 15 min after gelation time (t = 225 min), high shear rate (1000 s−1) was imposed suddenly for 30 min and then decreased again to 10 s−1. The viscosity of the gel was stabilized at a low value after removing the high shear rate. However, after some time (about 1 h), viscosity started to increase at the same rate as in the first case. The third case was similar to the second, but the high shear rate (1000 s−1) was imposed 140 min after gelation time (t = 355 min) for 30 min. As with the second case, viscosity was stabilized after removing the high shear rate, but at a higher value. These observations demonstrate that a high shear rate after gelation breaks the formed bonds at a certain viscosity, which is dependent on the imposed exposure time of the high shear rate. The continuation of the increased viscosity may imply a start of a secondary gelation process at almost the same trend.
4.2. Gel Strength
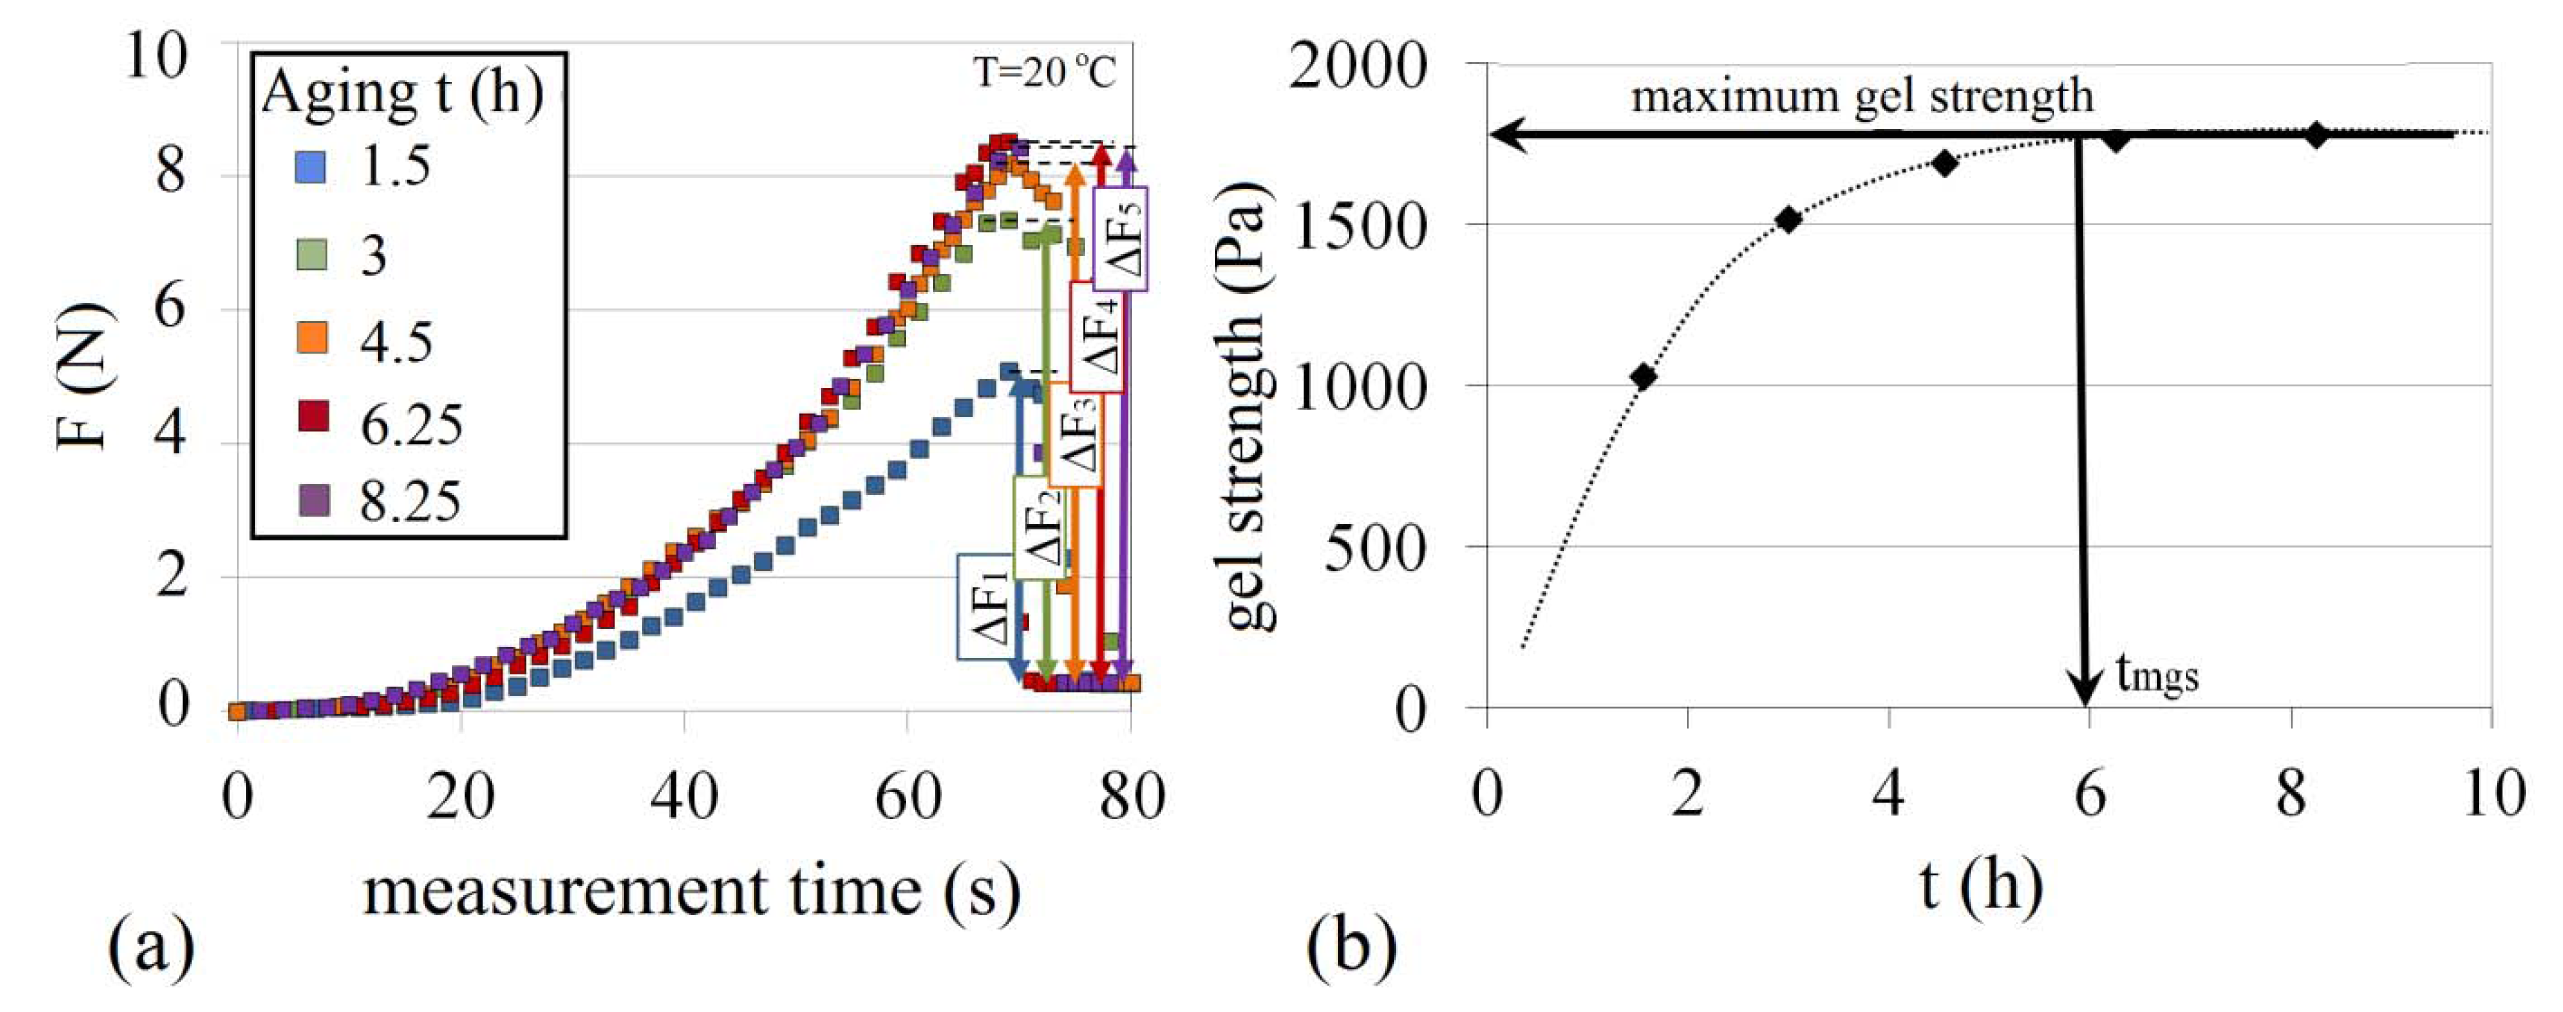
The calculated force data of the gelation process for 6 wt% Na-silicate at pH 10.40 at different times, obtained from weight measurement data, are presented in Figure 16a. Typically, F increases to a peak value before the gel breaks. Once the gel breaks the inner cylinder is lifted and F decreases to a stable level that is equal to the weight of inner cylinder and friction in the system. Gel strength was measured during the gelling process. This was obtained from the force difference between the peak value and the stabilized force level (ΔF1 to ΔF5 in Figure 16a), divided by the surface area of the inner cylinder in contact with Na-silicate gel (approximately 0.0045 m2). Gel strength (Pa) of 6 wt% silicate at pH 10.40 is shown for the different time of the gelation process in Figure 16b. Typically, the gel strength of a Na-silicate solution reaches a maximum point after which the gel breaks. This point is referred to as the maximum gel strength.
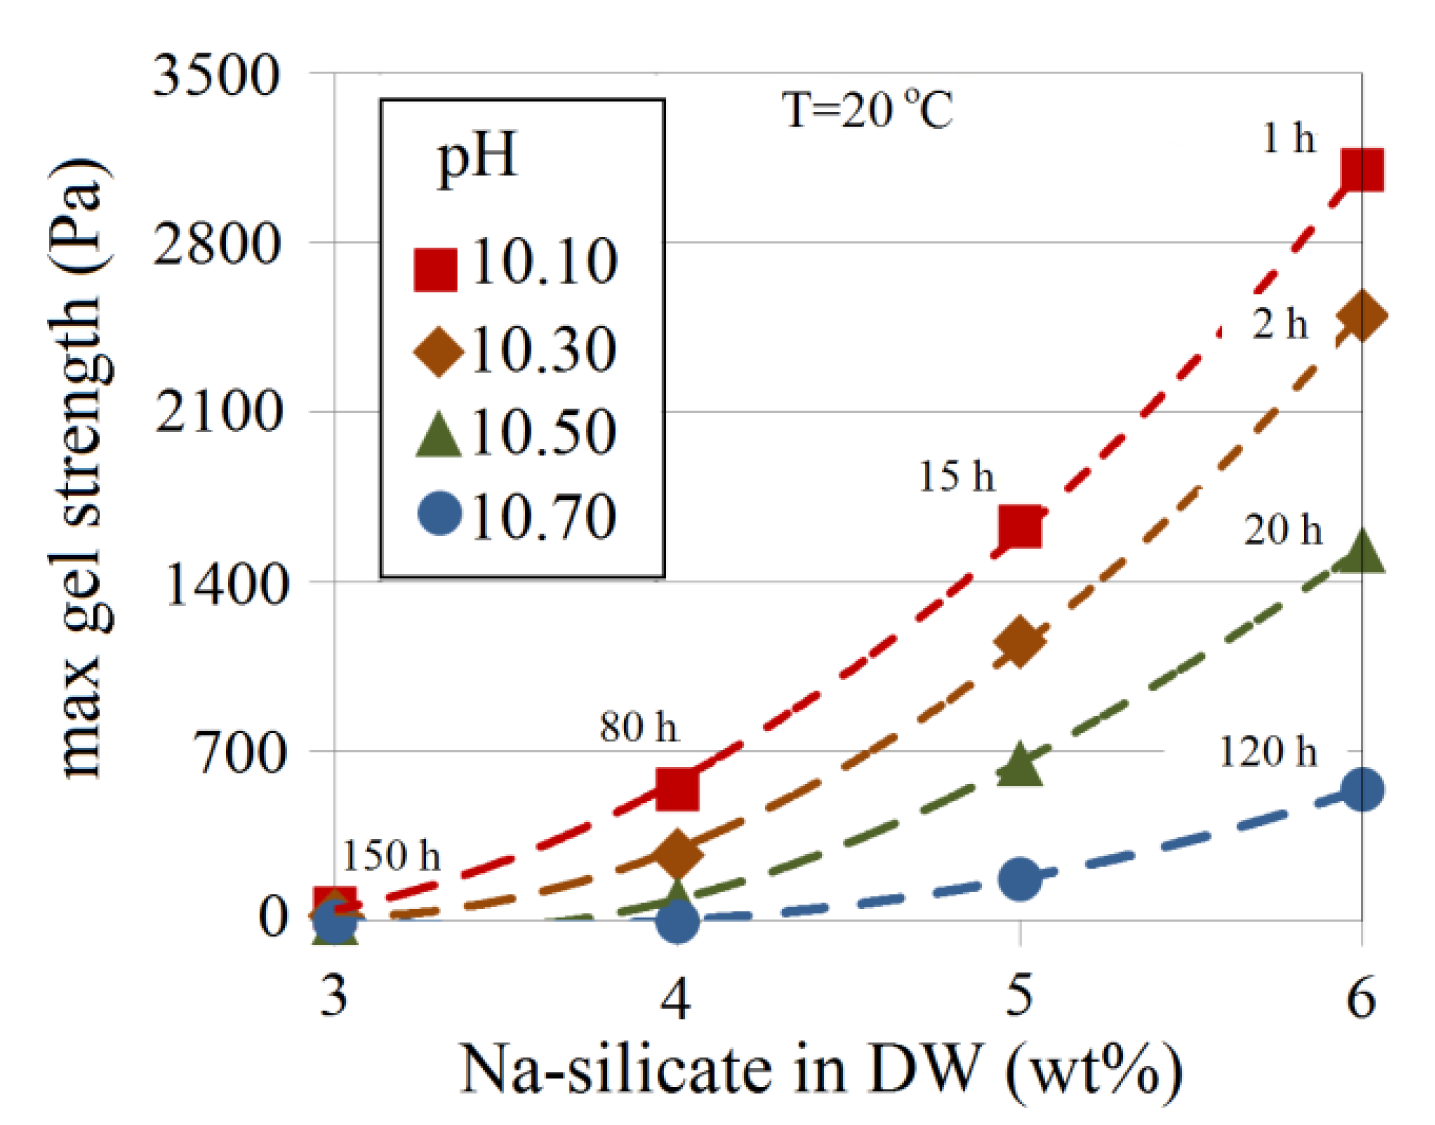
The effect of pH and Na-silicate content on gel strength is shown in Figure 17. The approximate time required for the gel to reach its maximum strength (tmgs) is indicated for some of the data points in Figure 17. For a certain silicate content, the gel becomes stronger as the pH decreases and tmgs is shorter. At a pH of 10.10 for 3 wt% Na-silicate solution, for example, a loose gel is obtained (maximum strength <100 Pa) after more than six days, whereas 6 wt% produces a gel 30-times stronger (>3000 Pa) after just 1 h.
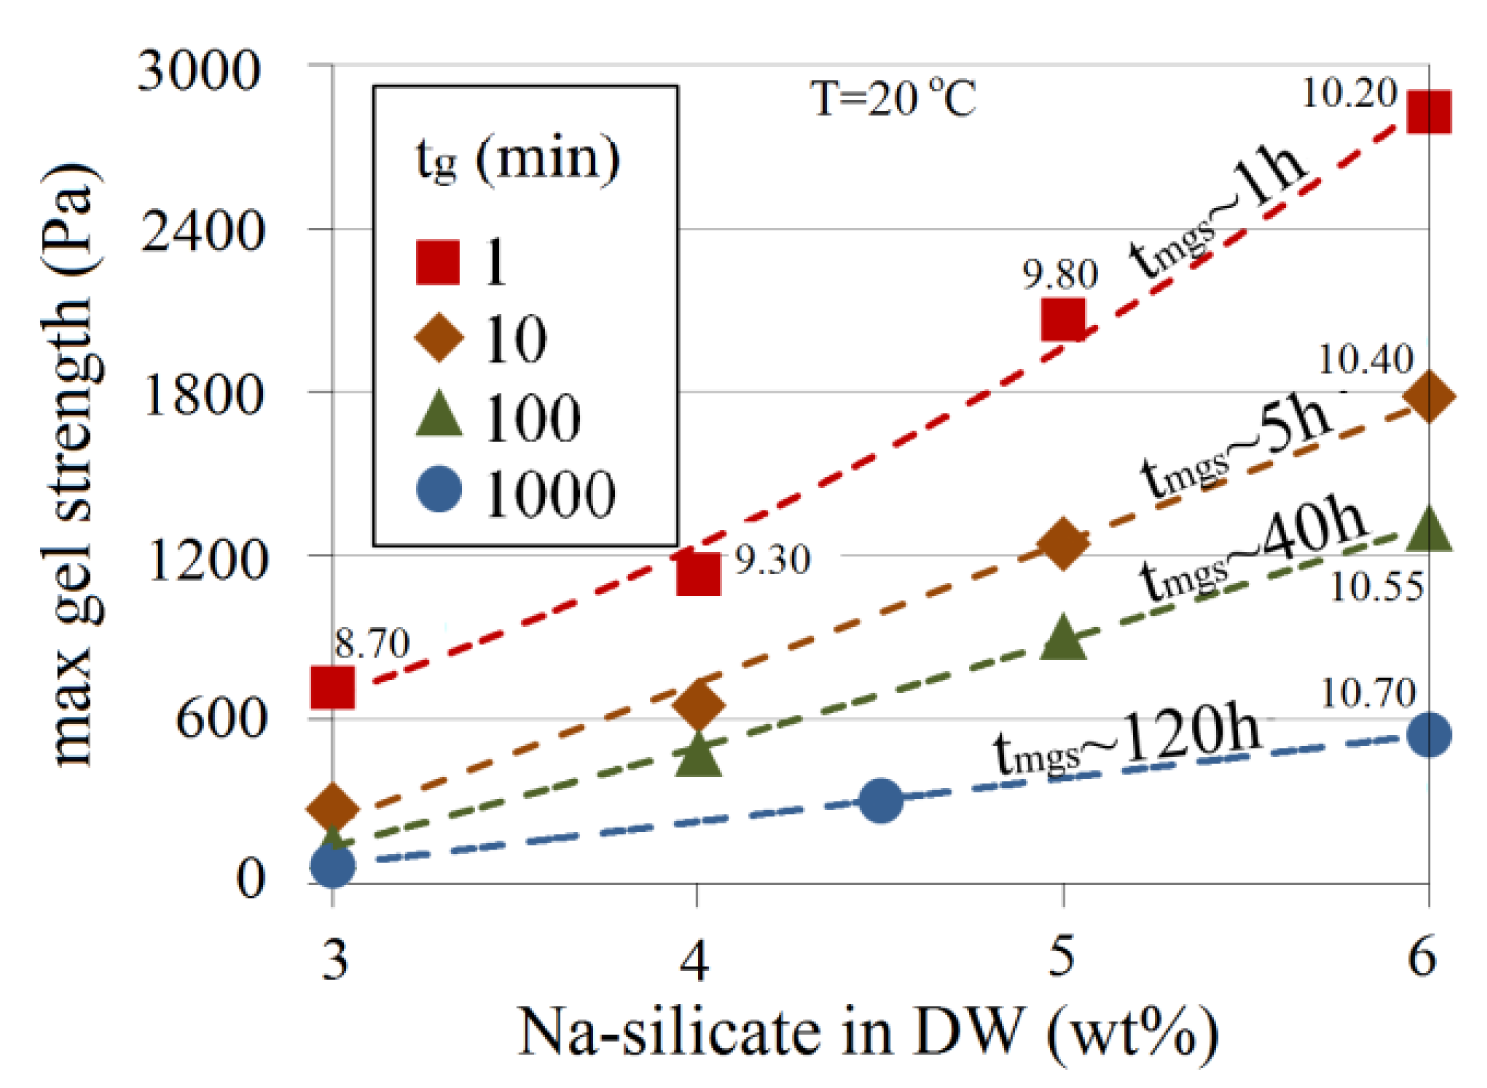
Figure 18 presents gel strength as a function of Na-silicate content on the iso-gelation time contour lines of Figure 6. Corresponding values of tmgs for different gelation times are shown in Figure 18. To make reading the figure easier, pH values of some data points are included. At a given Na-silicate content, a longer gelation time leads to a weaker gel. At a certain gelation time, higher silicate content produces a stronger gel. Although both 6 wt% Na-silicate at a pH of 10.20 and 3 wt% Na-silicate at a pH of 8.70 gel after 1 min, for instance, the maximum gel strength of 6 wt% is 2800 Pa, which is almost four times of the strength of 3 wt% (700 Pa).
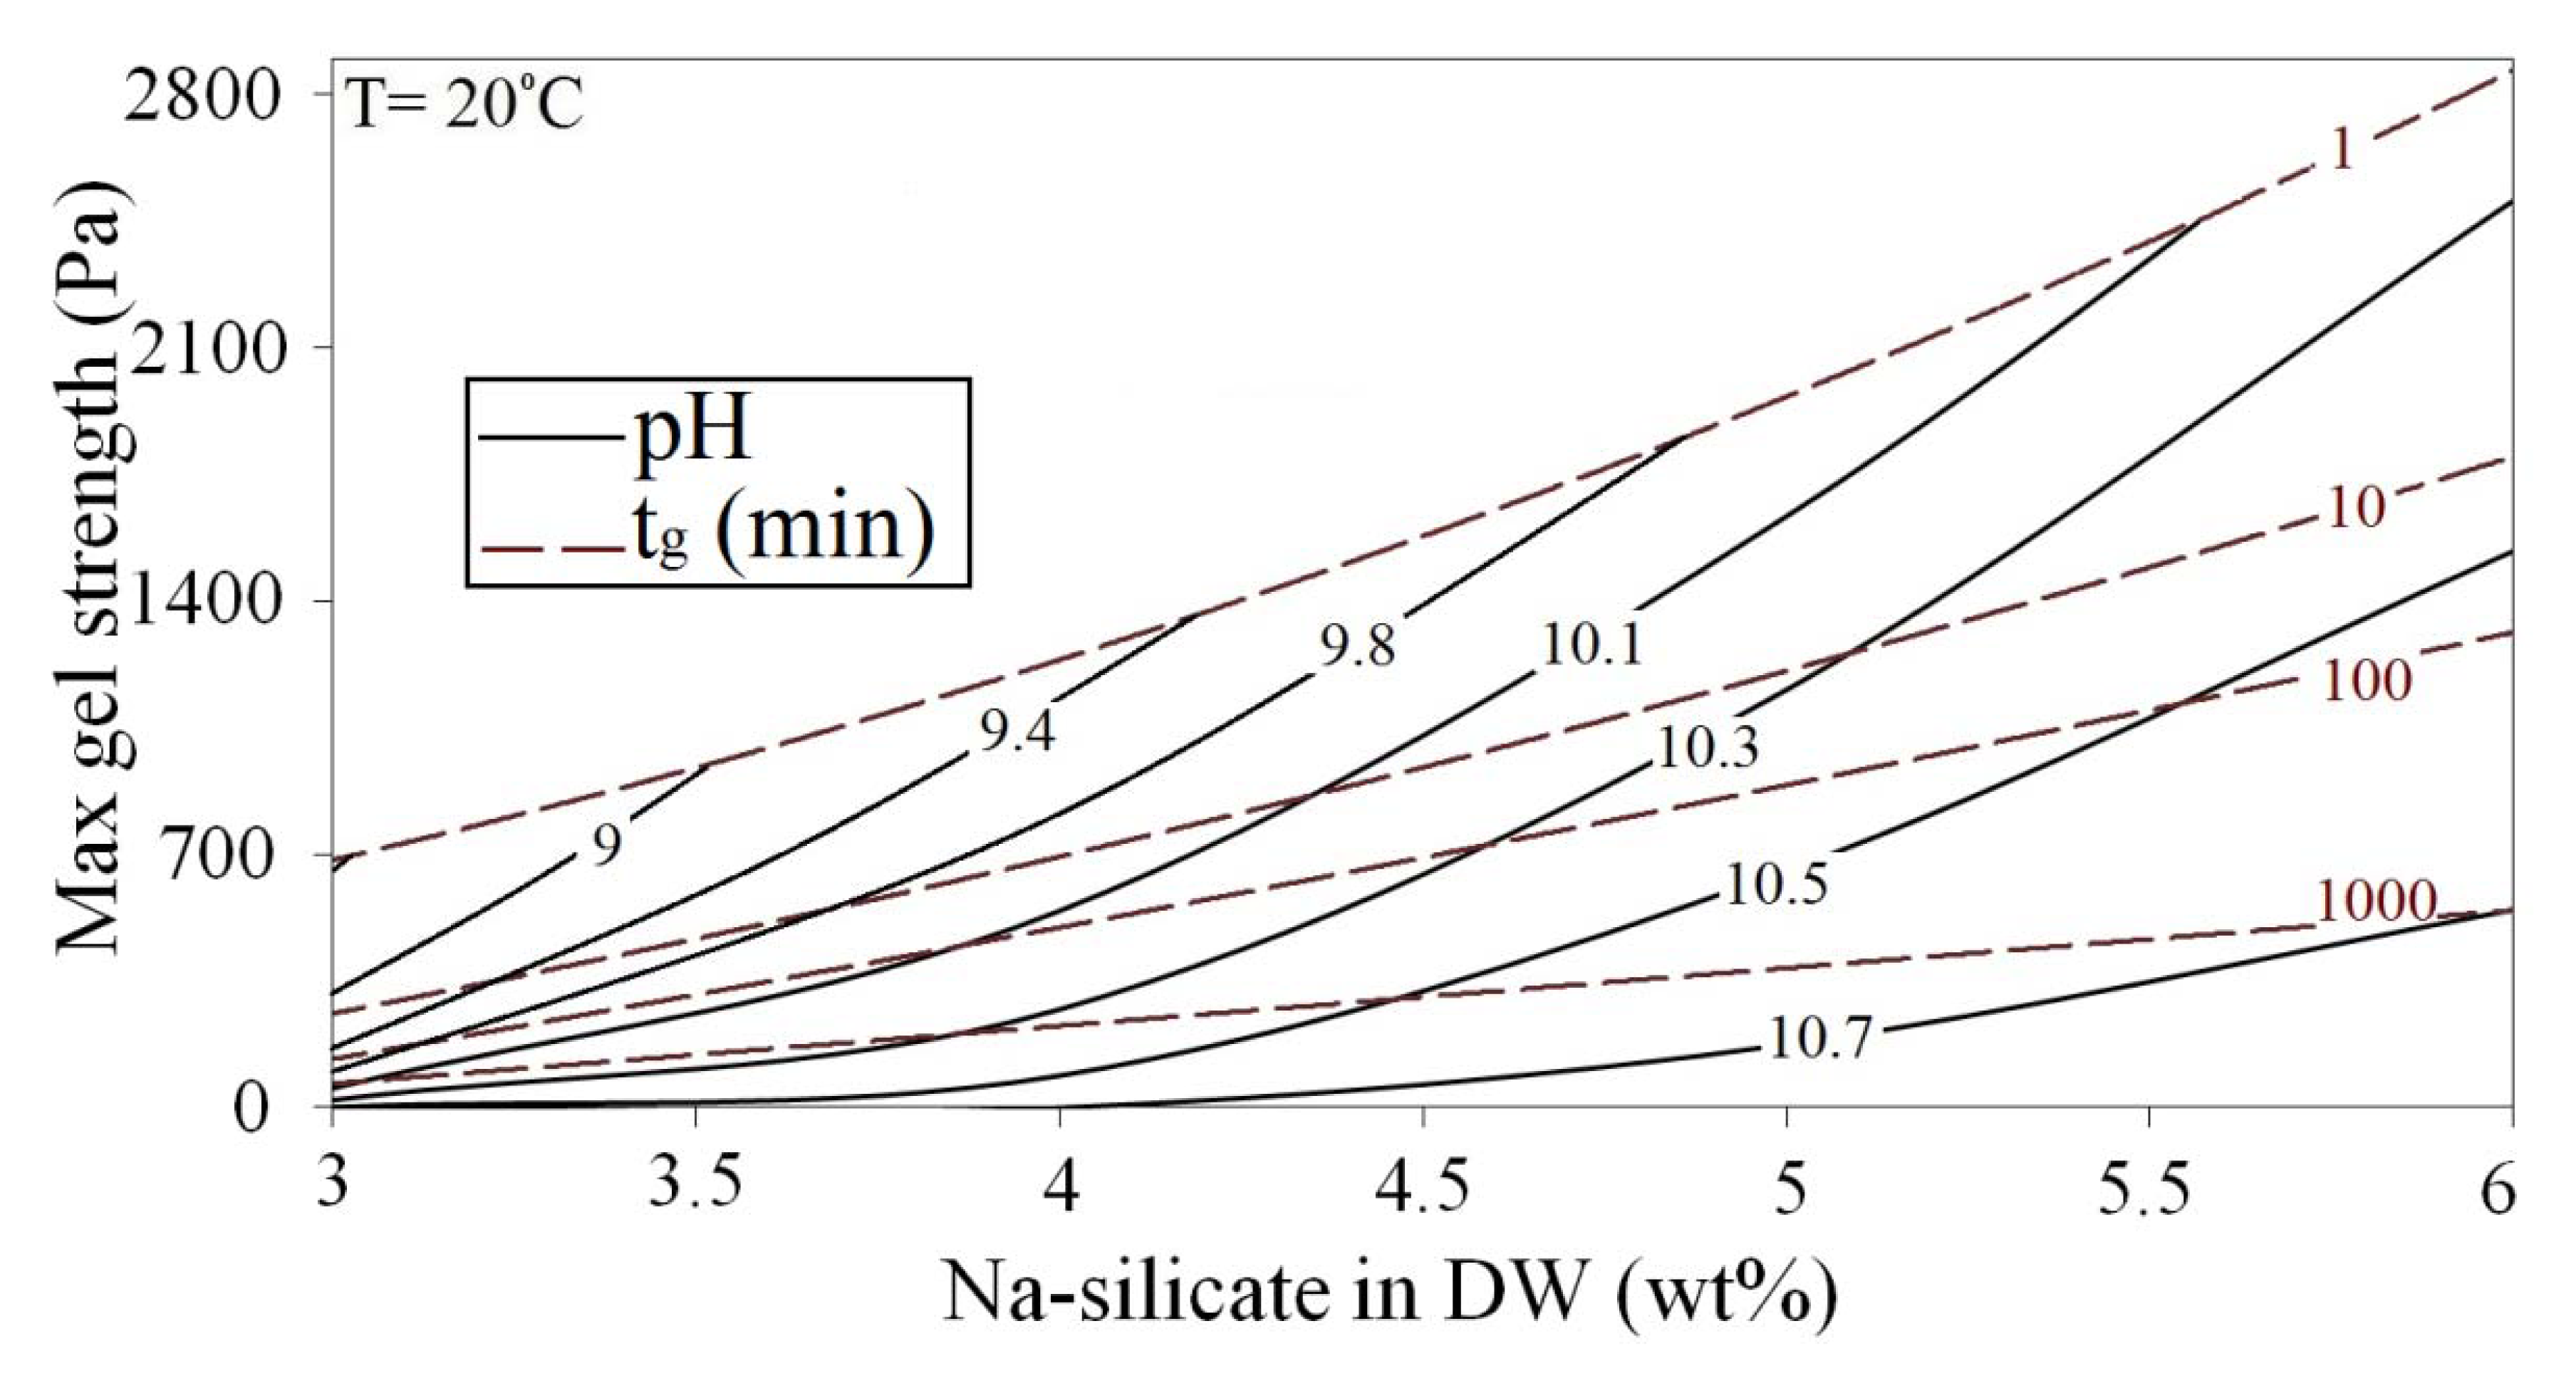
Maximum gel strength and gelation time as functions of Na-silicate content and pH are obtained by combining Figures 17 and 18, yielding Figure 19. The gelation time and the maximum gel strength may be approximated for solutions containing 3 wt% to 6 wt% Na-silicate with pH values of 8.6 to 10.7 at T = 20 °C using Figure 18.
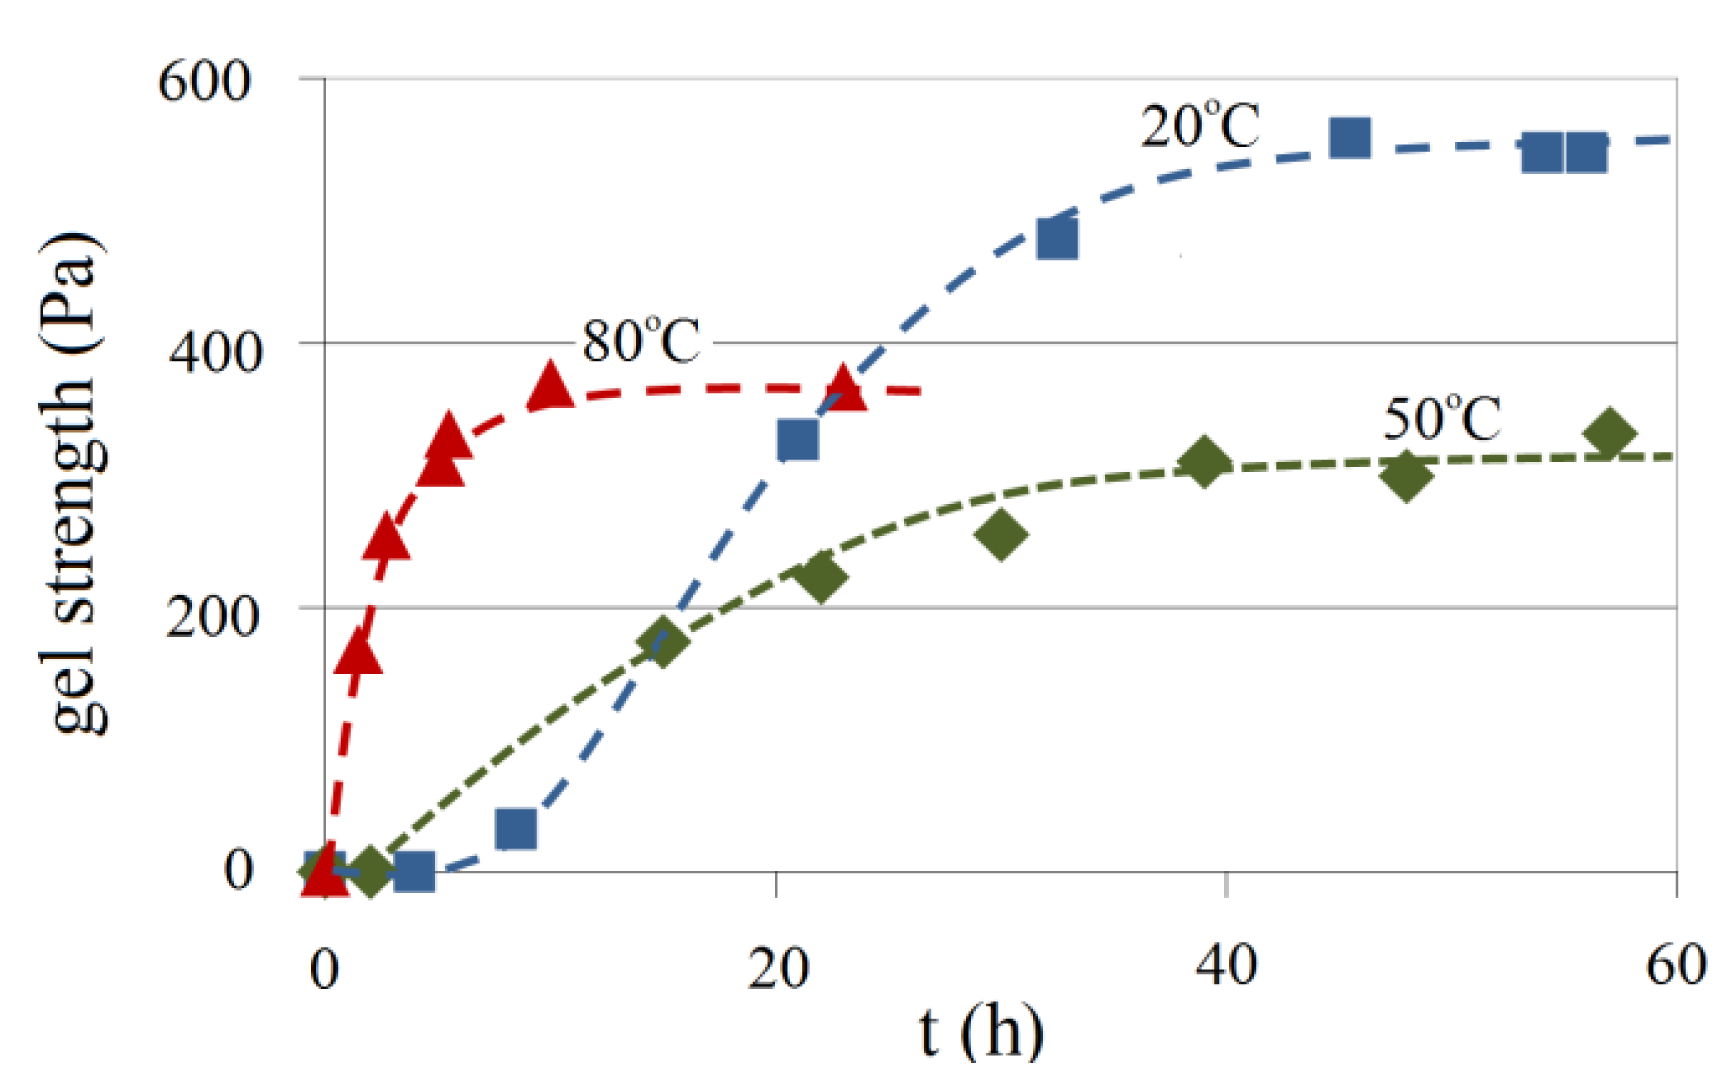
The effect of temperature on the gel strength for 4.5 wt% Na-silicate with a pH of 10.30 is illustrated in Figure 20 for temperatures of 20, 50 and 80 °C. Gel samples prepared at elevated temperatures have lower maximum gel strength than those prepared at 20 °C. Trapped bubbles were observed in the elevated temperature experiment, which may have disturbed the continuity of the gel's network, and hence reduced gel strength. However, this does not adequately explain the increase of gel strength at 80 °C compared with 50 °C. This phenomenon is perhaps better explained by the fact that increasing the temperature to 80 °C increases silicate solubility. This in turn causes a reduction in the pH, hence accelerating gel formation and consequently increasing gel strength compared with the level at 50 °C. This is consistent with the syneresis experimental results for the temperature effect, which are presented below.
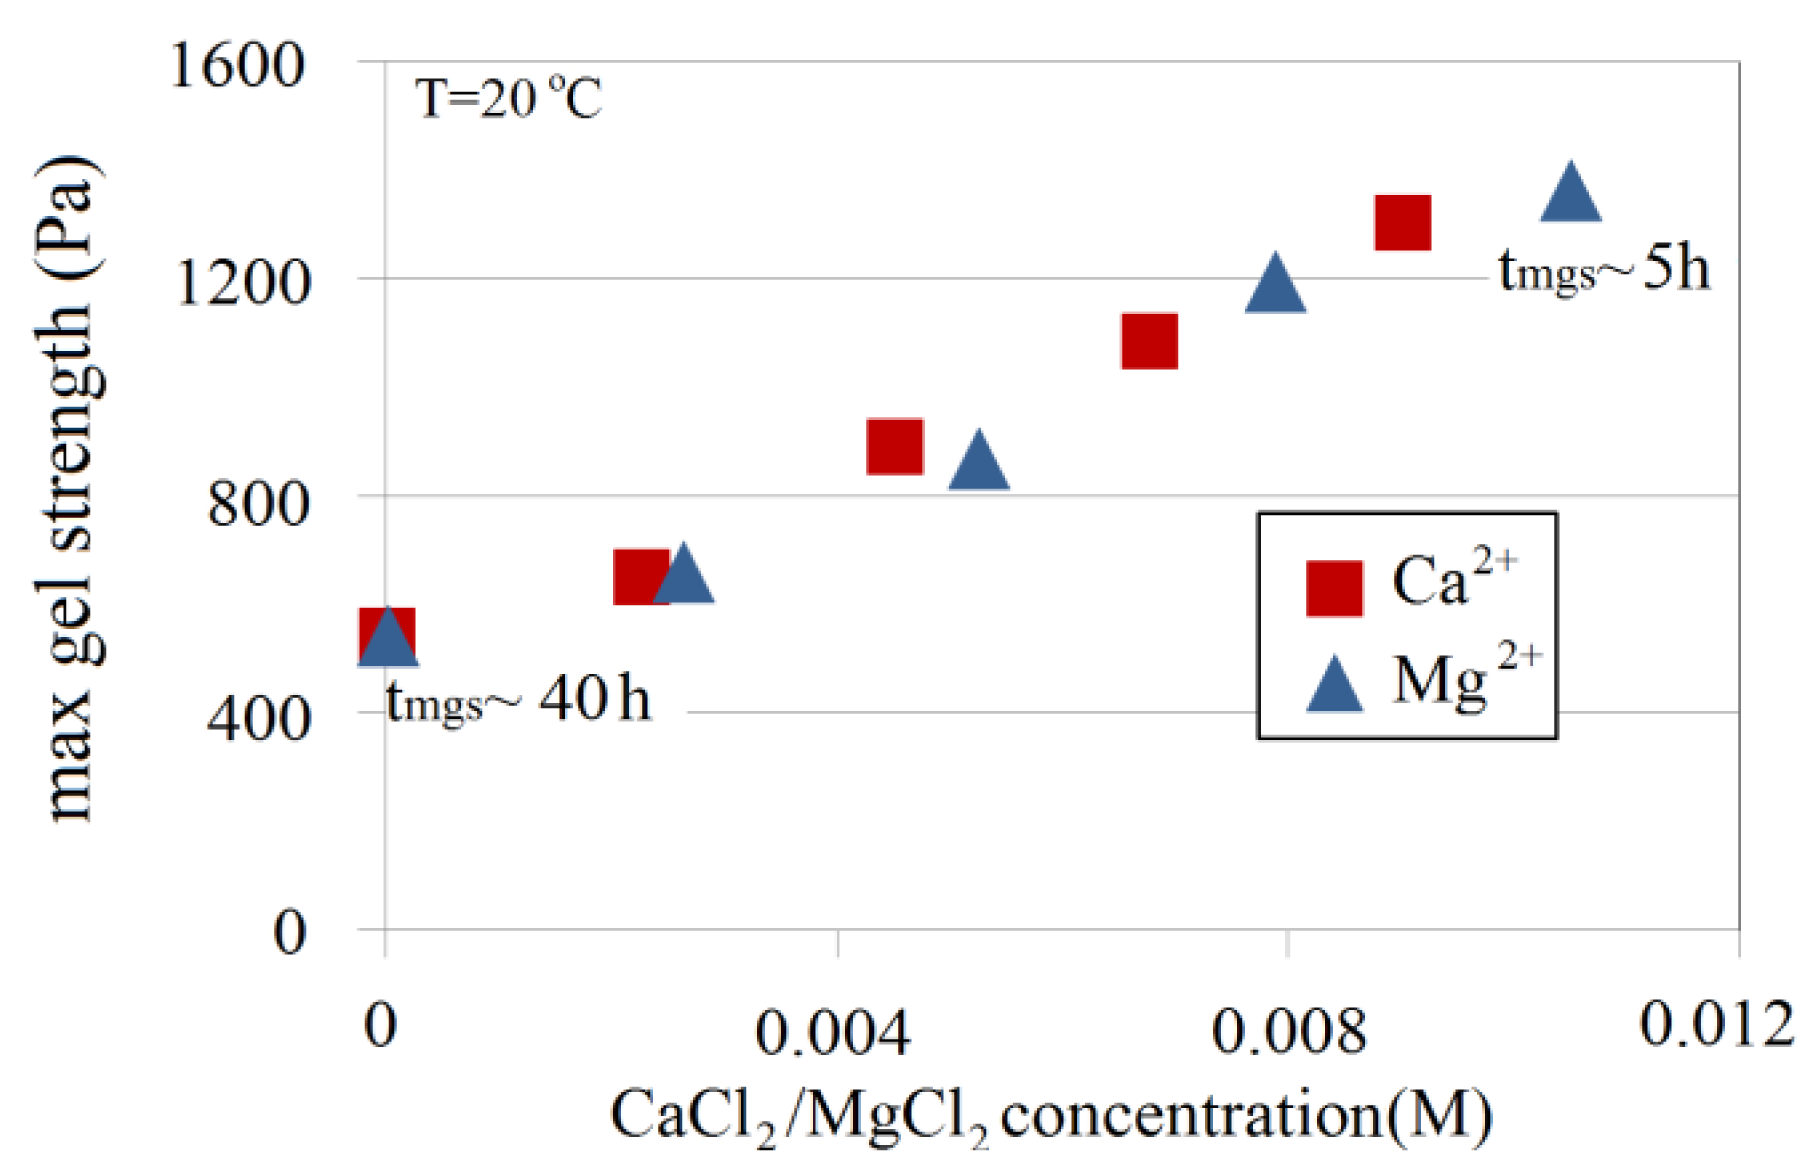
The effect of Ca2+ and Mg2+ on maximum gel strength indicates that both ions enhance gel strength in the same way. Figure 21 depicts maximum gel strength of a 4.5 wt% Na-silicate solution with a pHi of 10.30 as a function of the CaCl2/MgCl2 salt concentration. In the absence of Ca2+ and Mg2+, Na-silicate gel reaches its maximum strength of 500 Pa after about 40 h, whereas maximum gel strength reached 1500 Pa and tmgs decreased to 5 h when the Na-silicate solution was prepared in the presence of 0.01 M MgCl2. The relationship between maximum gel strength and the concentration of divalent ions shows a similar trend for both ions in this range of salt concentration. However, at the same concentrations, Mg2+ can be seen to be relatively less effective than Ca2+ in enhancing gel strength. That agrees with the observation made for gelation time.
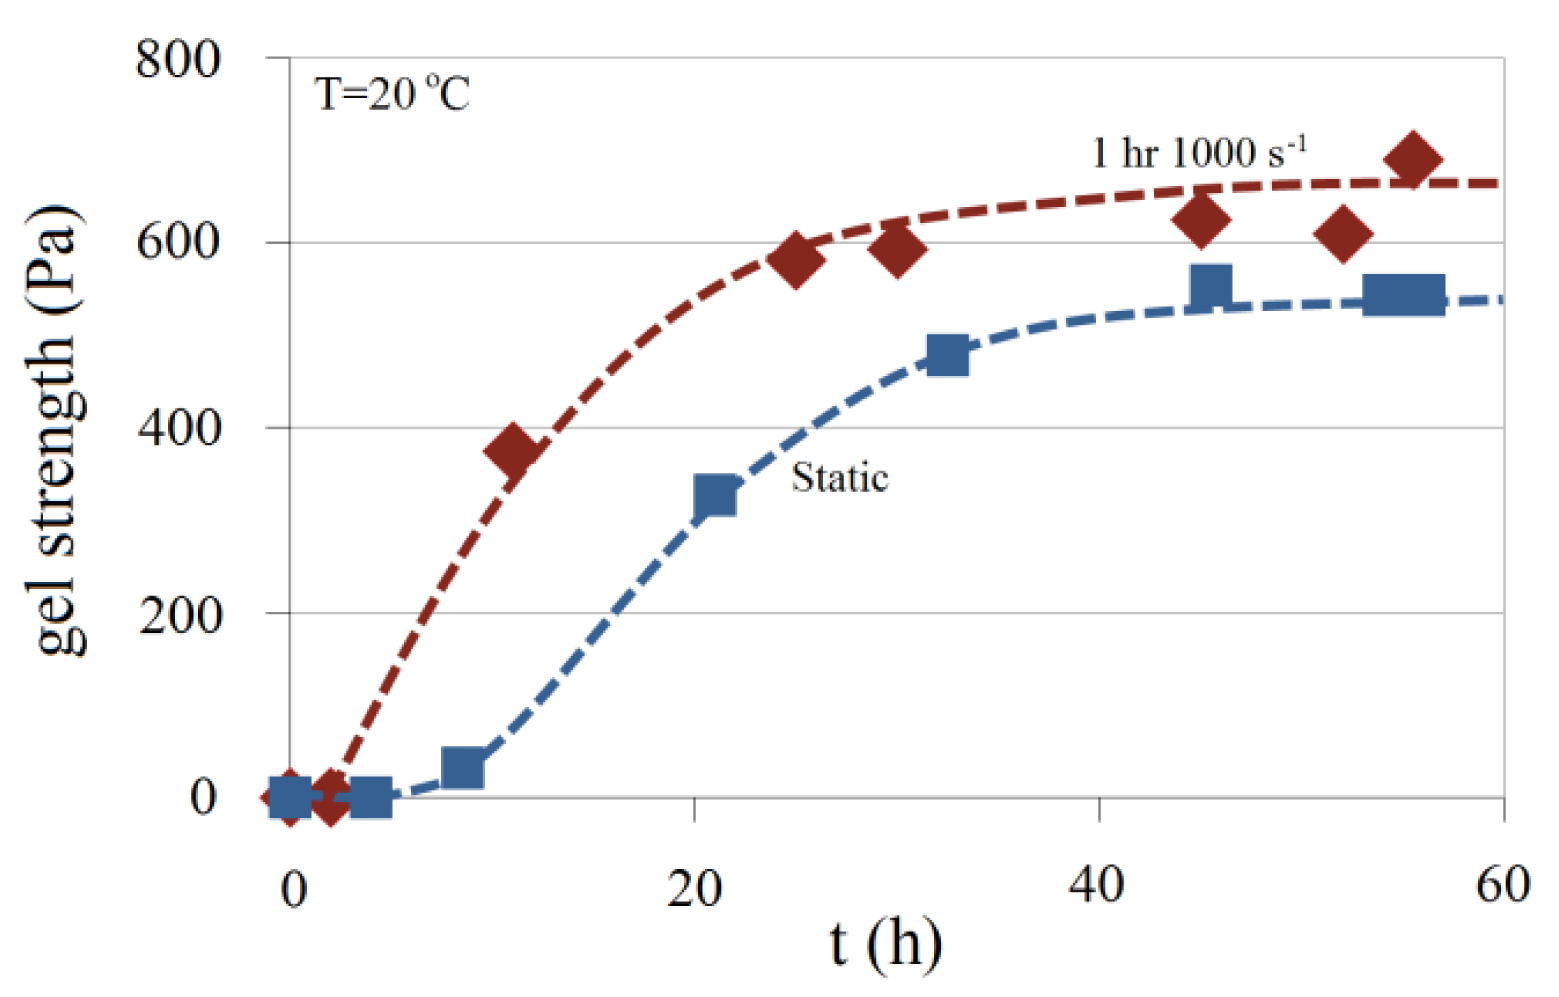
The effect of shear rate on gel strength is shown in Figure 22. A comparison is made between the gel strength profiles of two samples of 4.5 wt% Na-silicate with a pH of 10.30 at T = 20 °C with different shear histories. One of the samples has been kept static during gel development, while the other is exposed for 1 h to a shear rate of 1000 s−1 just after sample preparation and then kept static during gelation. Gelation time for the second sample is shown to be accelerated by the shear rate applied, compared with the sample kept static. That agrees with Figure 14. In addition, as illustrated in Figure 22, the maximum gel strength is higher for the sample subjected for 1 h to a shear rate of 1000 s−1.
4.3. Syneresis
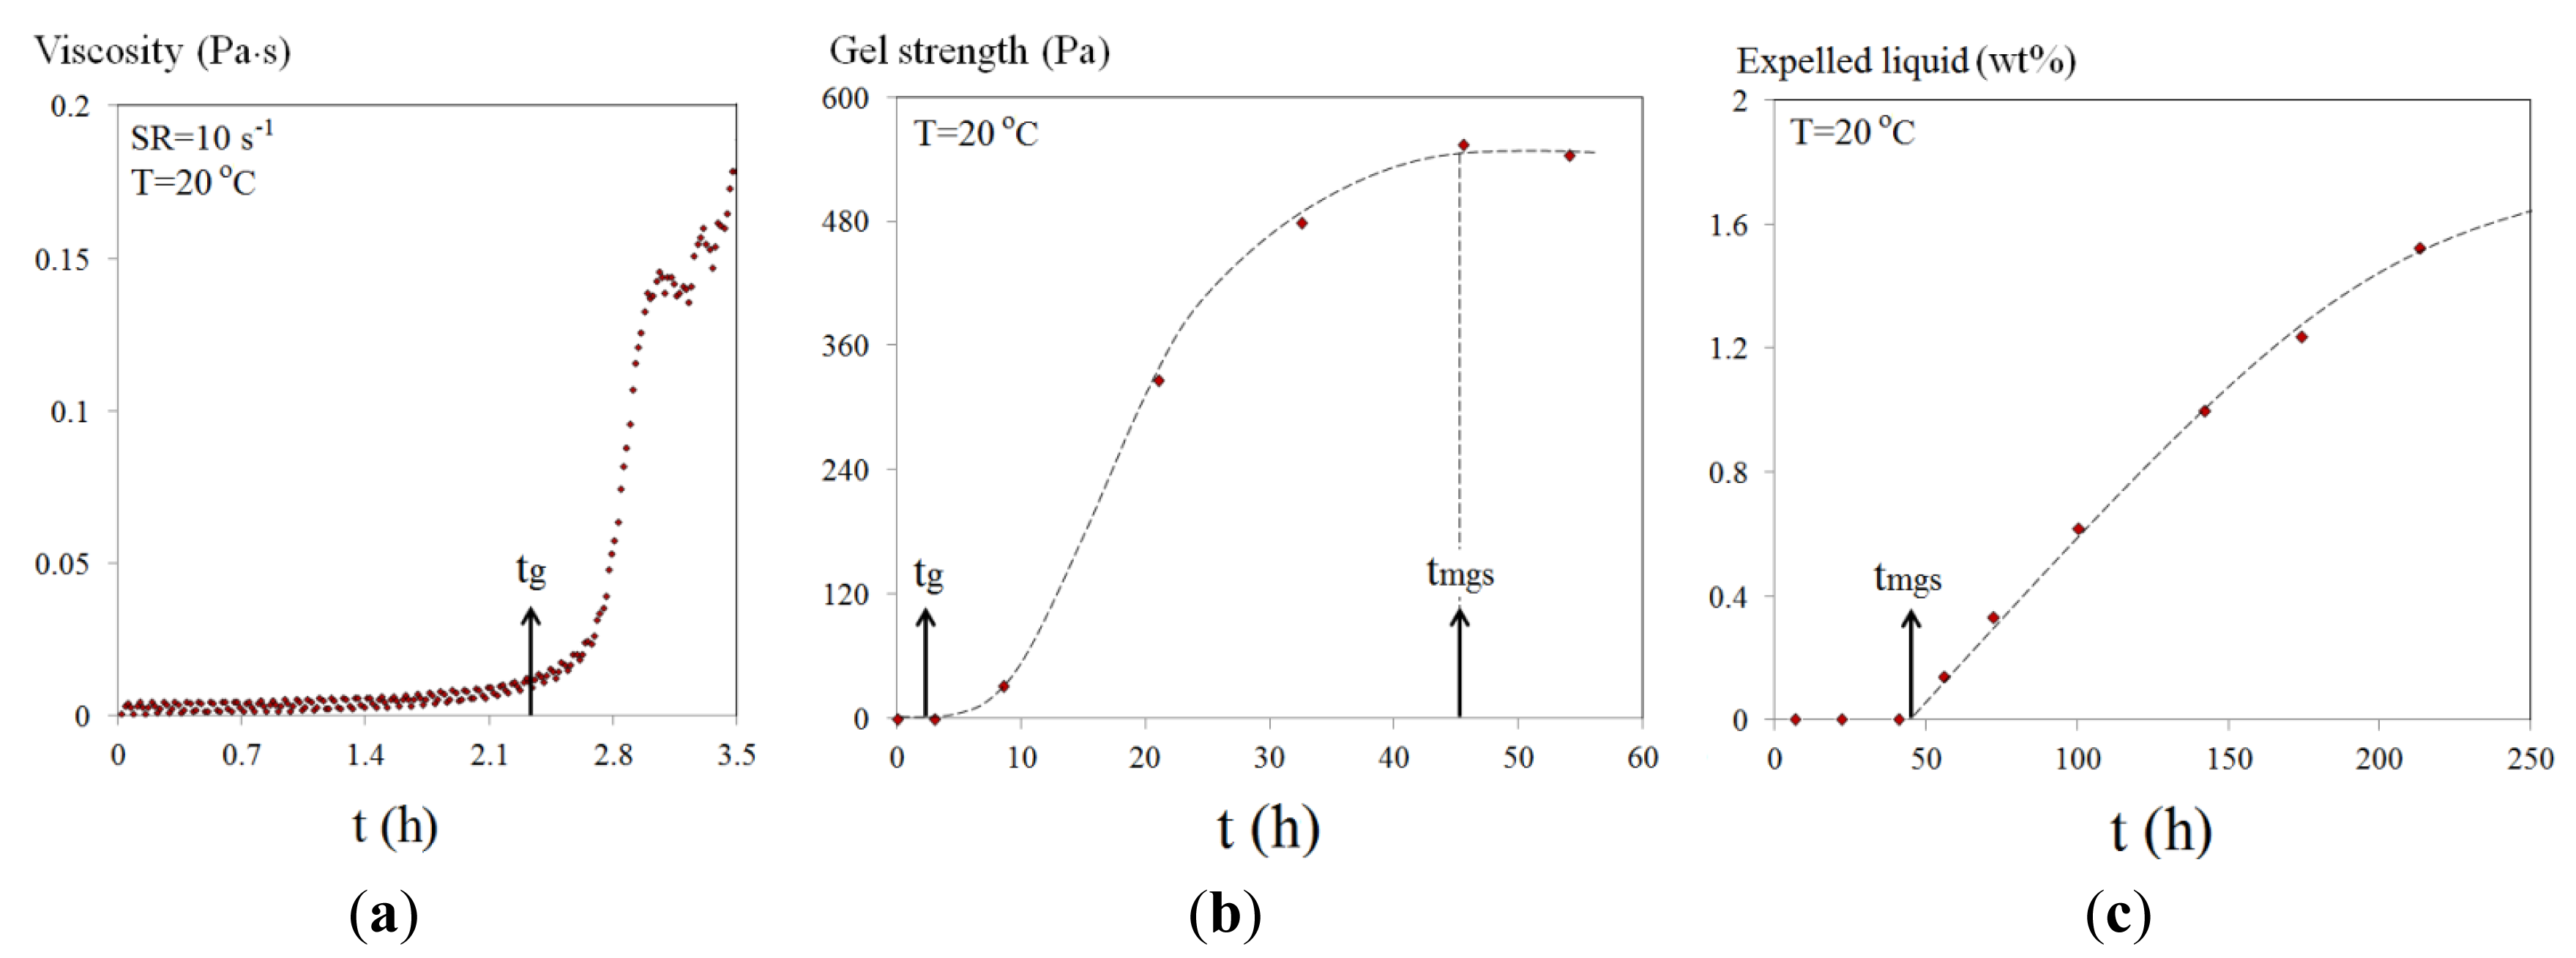
Figure 23 summarizes the stages from starting to increase viscosity (tg) to gel network formation reaching a maximum strength (tmgs). This is then followed by the gel syneresis process, where liquid is expelled from the network to cause gel shrinkage. 4.5 wt% Na-silicate at a pH of 10.3 is taken as an example to demonstrate all the stages (Figure 23).
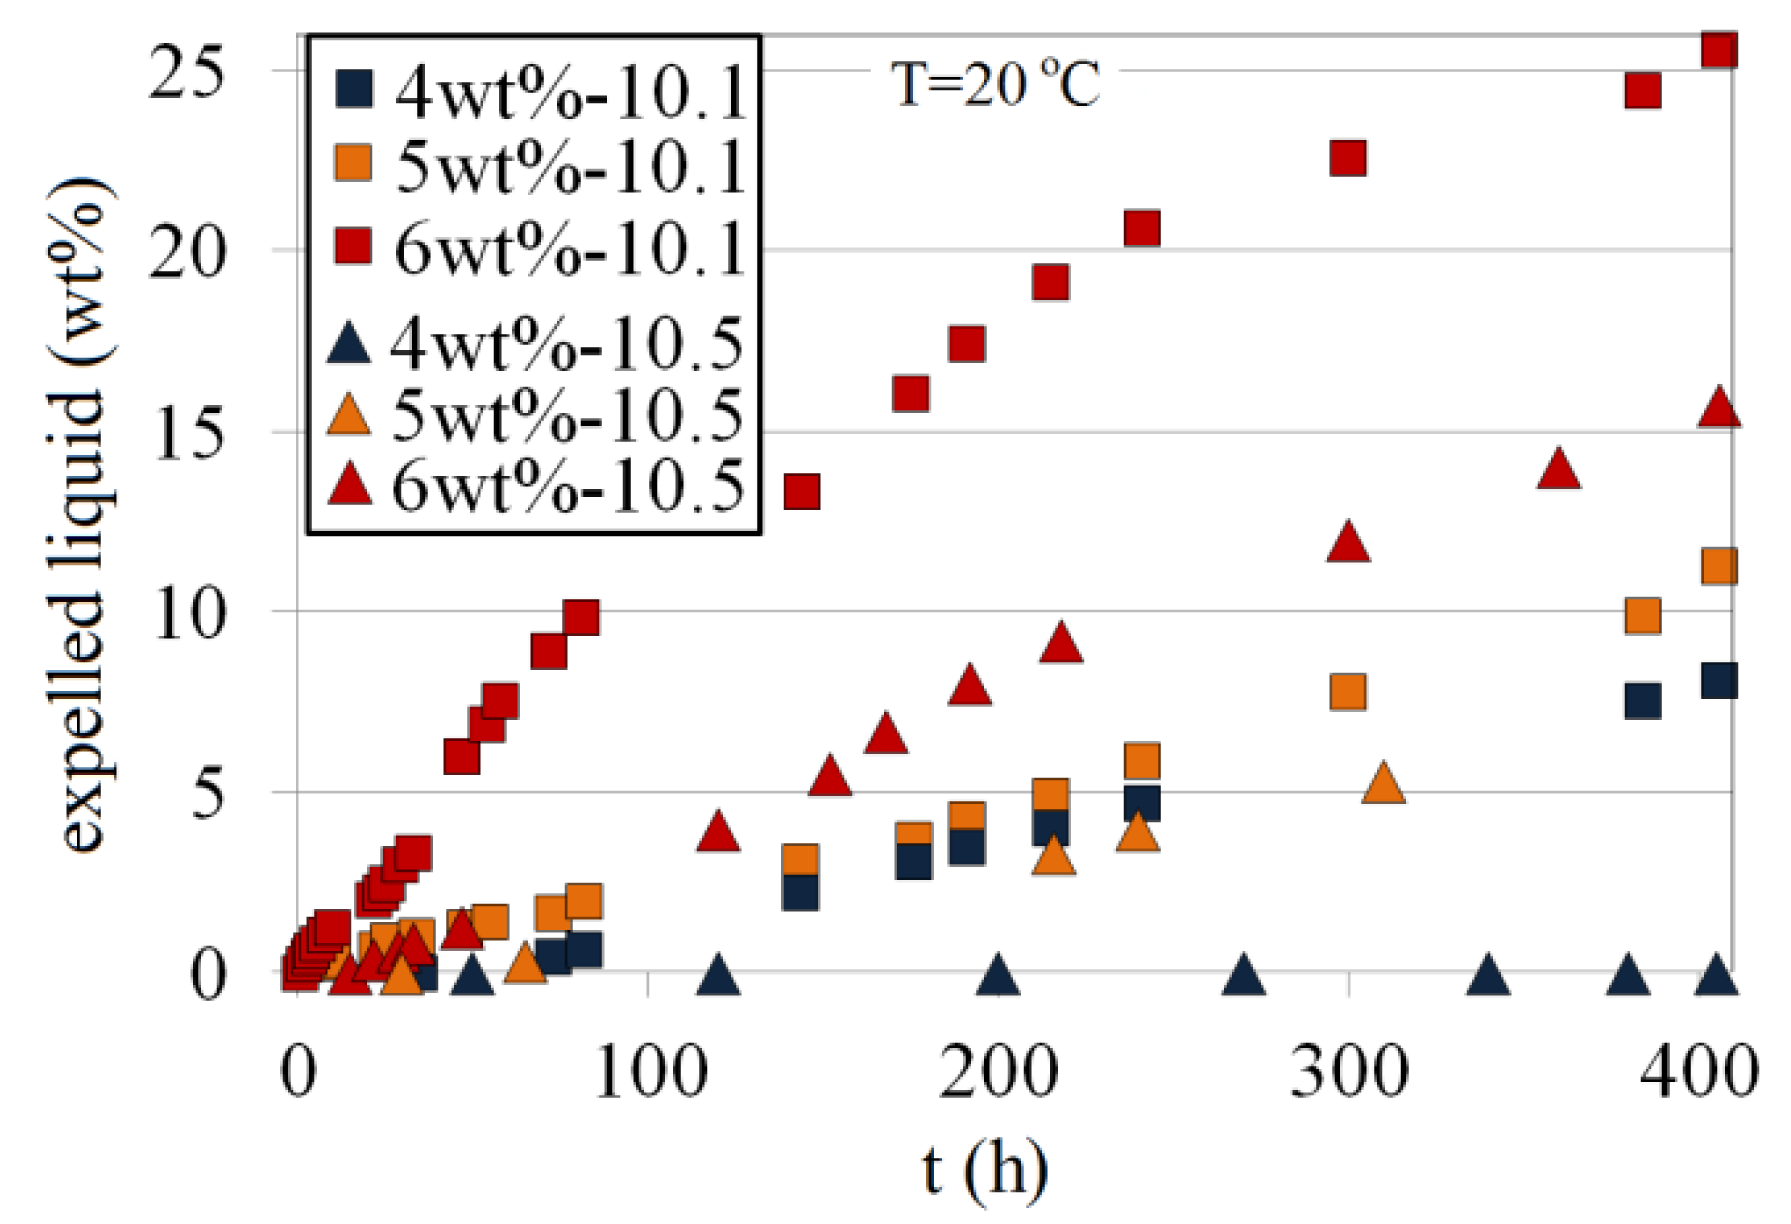
The expelled liquid (wt%) as a function of time for 4 wt%, 5 wt% and 6 wt% Na-silicate at pH values of 10.10 and 10.50 is compared in Figure 24. Typically, there is a period after gelation time, where no shrinkage takes place until the formed gel approaches maximum strength. This has also been reported by Brinker and Scherer [16]. In practical terms, the onset of shrinkage for a given silicate content, pH and temperature is almost equal to its tmgs. For a given pH, increasing silicate content (wt%) accelerates the starting of shrinkage. For example, 4 wt% and 6 wt% at a pH of 10.10 approach their maximum gel strength after about 80 h and 1 h, respectively (Figure 17), which is same as the start time for their shrinkage (Figure 24). At a given pH, the higher the silicate content, the higher the shrinkage rate and total shrinkage. This is in agreement with the reported observations [15–17]. For a 6 wt% Na-silicate solution at a pH of 10.10, for instance, the initial rate of shrinkage and the total shrinkage at t = 400 h are 0.1 wt% per hour and 25 wt%, respectively. For 4 wt% Na-silicate at the same pH, the initial rate of gel shrinkage and the total shrinkage at t = 400 h are approximately 0.025 wt% per hour and 8 wt%, respectively. At a certain Na-silicate content, lower pH results in earlier shrinkage owing to a lower tmgs (see Figure 17) and a higher shrinkage rate.
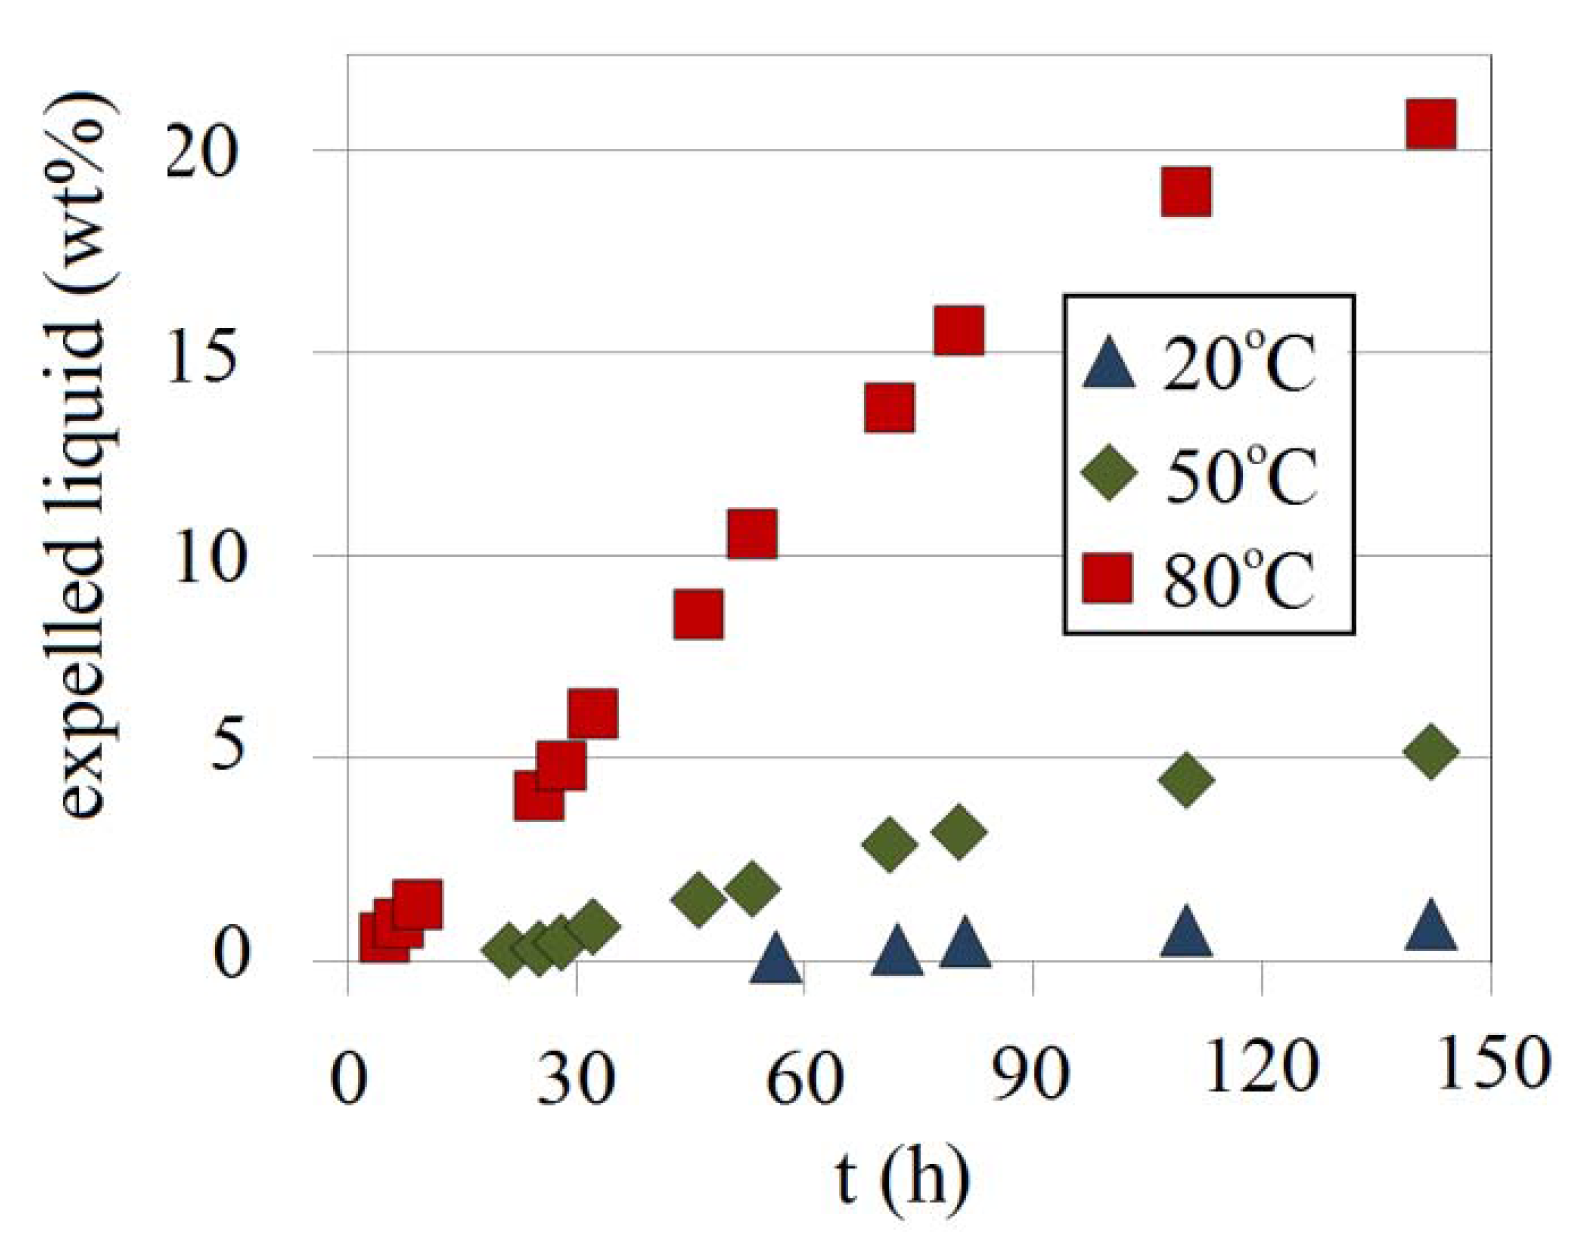
To address the effect of temperature on syneresis, a gel prepared at three temperatures 20, 50 and 80 °C was tested with a Na-silicate content of 4.5 wt% at a pH of 10.30. As shown in Figure 25, higher temperature accelerates the start of shrinkage, i.e., at high temperature shrinkage starts sooner than the corresponding tmgs. tmgs for 4.5 wt% Na-silicate at a pH of 10.30 is about 10 h; for instance (Figure 20), while shrinkage at 80 °C starts earlier than 5 h (about half its tmgs). Shrinkage rates at 20, 50 and 80 °C are approximately 0.013 wt%, 0.054 wt% and 0.21 wt% per hour, respectively.
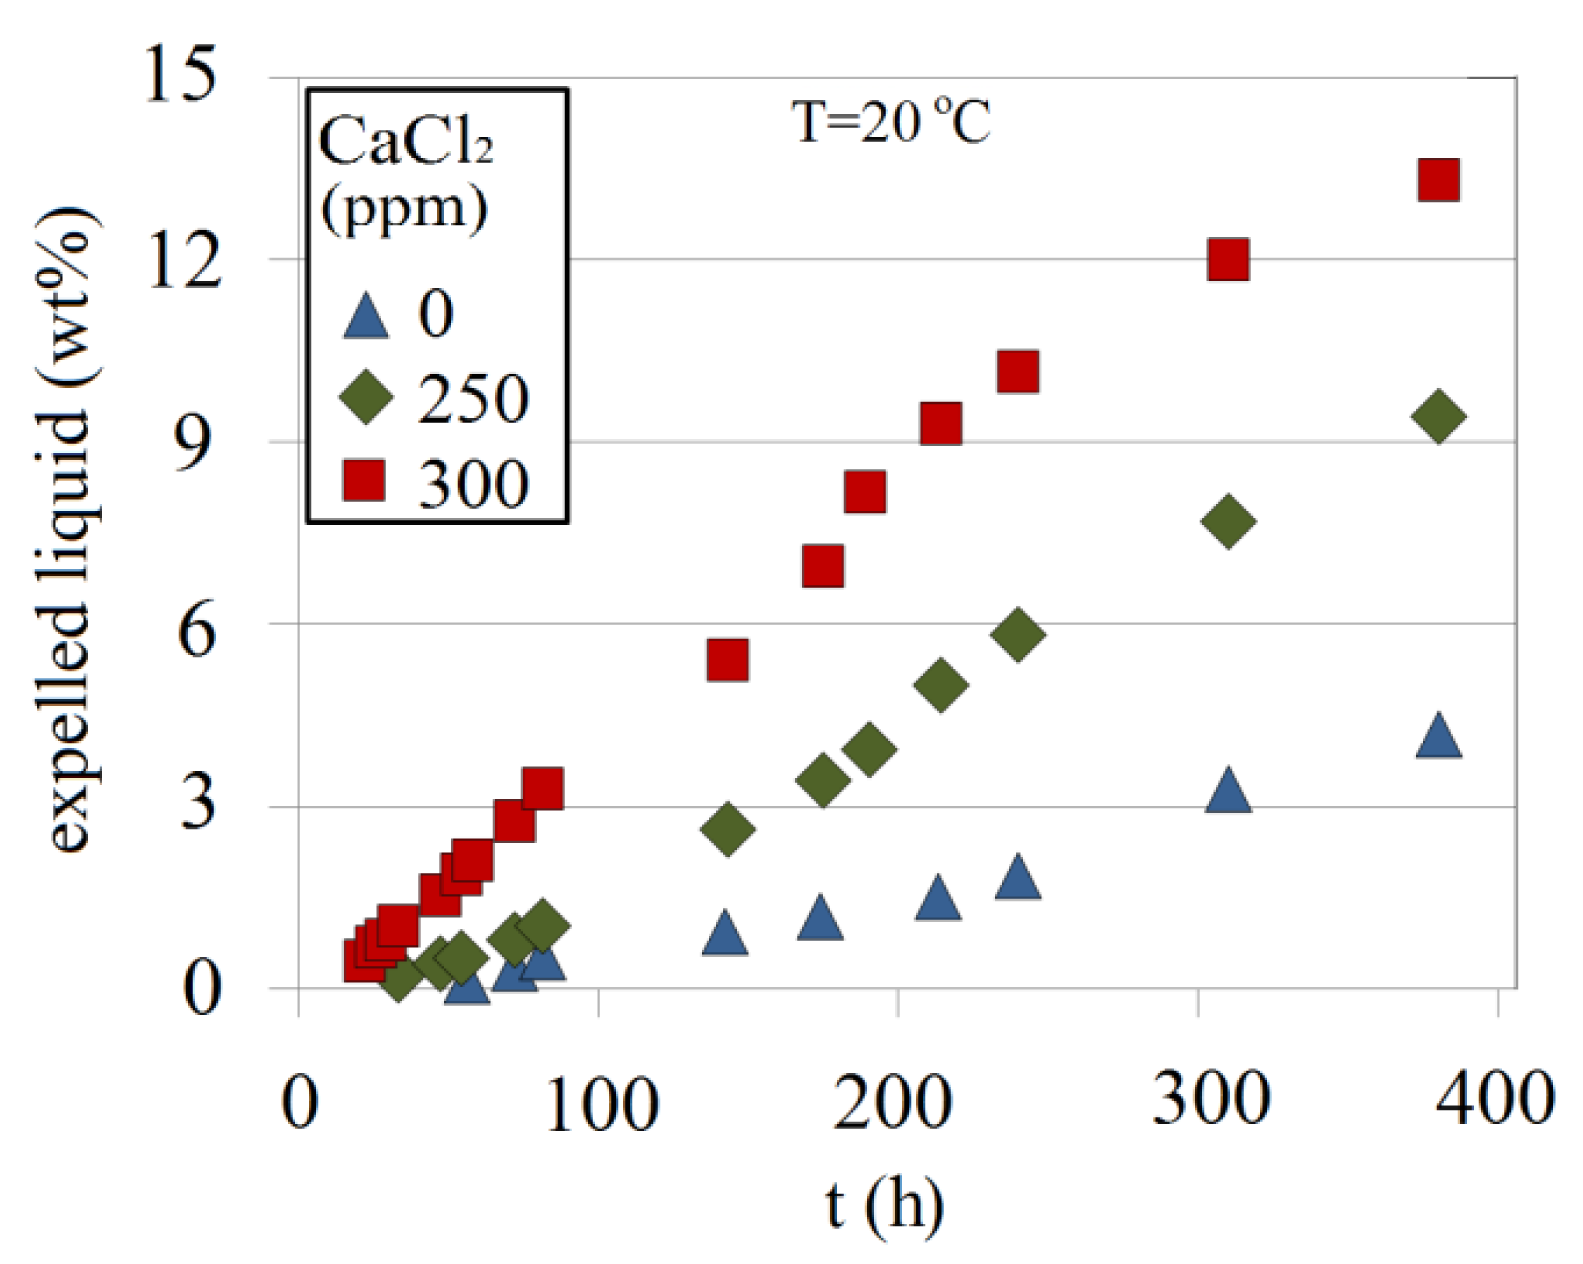
As shown in Figure 26 for 4.5 wt% at a pH of 10.30, the addition of a divalent ion (Ca2+) accelerates syneresis. Adding 500 ppm CaCl2, for example, increases the shrinkage by about three times compared with a solution without CaCl2.
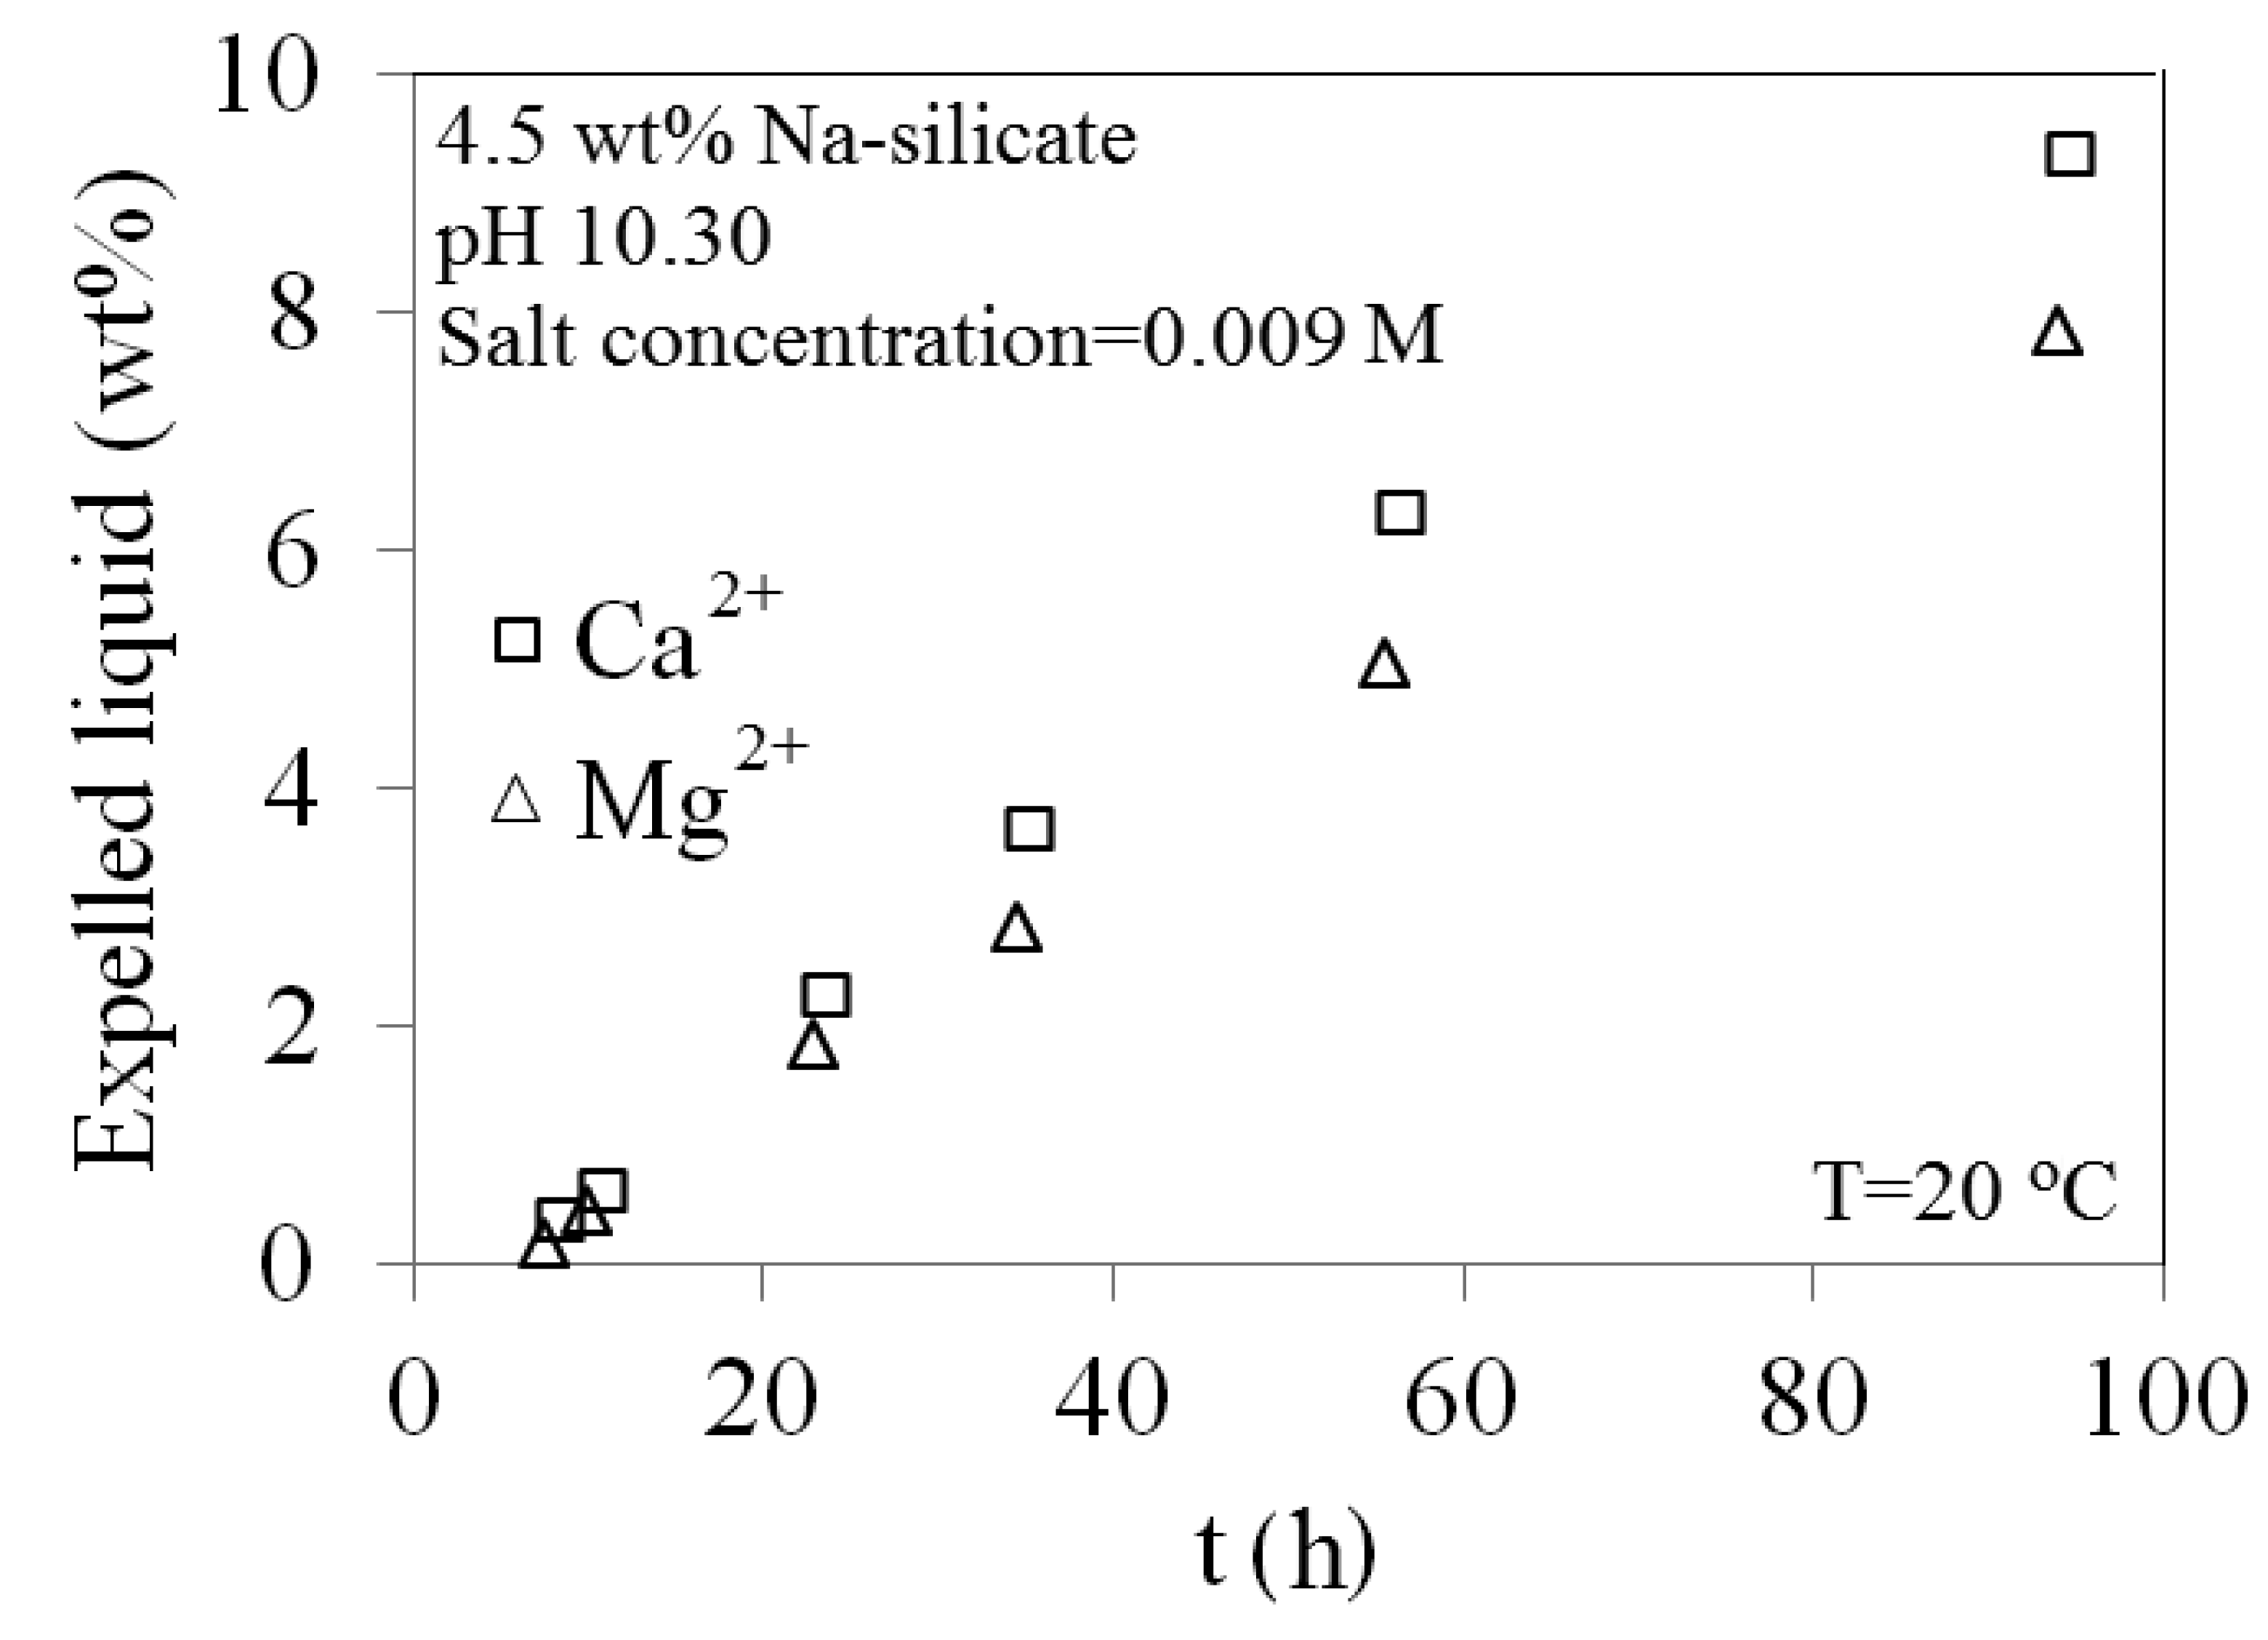
A comparison of 0.009 M solutions of Ca2+ and Mg2+ is made in Figure 27. Presence of Mg2+ results in less gel shrinkage when added to the Na-silicate solution, compared with Ca2+. This is in agreement with the observation made for gelation time and gel strength.
The effect of pressure on syneresis was tested using a transparent polypropylene piston cylinder. 6 wt% Na-silicate with a pH of 10.4 was pressurized up to 80 bar after gelation. The outlet of the cylinder was kept open to collect the expelled liquid. The liquid from the gel was released in a shorter time than tmgs. For a pressure of 50 bar, for example, the rate of shrinkage at a time longer than tmgs (=10 h) was greater than 1 wt% per hour, which is a considerably higher shrinkage rate in ambient conditions (<0.1 wt% per hour). Although the shrinkage rate was accelerated and increased as a function of the imposed pressure, the gel remained unbroken at the tested pressure range.
Figure 28 shows the syneresis when the contact is between the gel and a polypropylene container wall, compared with a glass container. The gel separates from the wall and shrinks to a compact mass in the center of the container. This may be explained by weak adhesion to the wall, which results in a lower energy level in the gel periphery [20]. When glass vials were used for 6 wt% at a pH of 10.10 (see Figure 28), the gel remains in contact with the vial wall and shrinkage is limited to the gel-air interface at the top of the vial. In this case, a considerably lower shrinkage was observed—about 2.3 wt% shrinkage in a week compared with about 12 wt% after one week when a polypropylene container is used. This may be explained by possible chemisorption of silicate solution on the glass silicate. Lower shrinkage rates have been reported in silicate porous media [20], which is qualitatively in agreement with our observation and may support the explanation given above.
5. Conclusions
Gelation time and gel strength are the major parameters affecting the application of gel for in-depth reservoir treatment to increase flow resistance in high permeable zones, and thereby enhance sweep efficiency by diverting the flooding fluids to low permeable zones.
Factors affecting these parameters in the alkaline silicate systems are the Na-silicate content (wt%), the pH, the presence of divalent ions and temperature. Temperature accelerates gelation time. However, gel strength was shown to be reduced by about 39% when temperature increased from 20 °C to 50 °C. Further increase in the temperature to 80 °C showed an increase of gel strength by about 10%. As the temperature increases, SiO2 solubility increases which may cause a reduction in the pH. This in turn reduces gelation time and thereby increases gel strength compared with its level at 50 °C, and causes an early start to syneresis and greater shrinkage as illustrated in Figure 26.
Divalent ions, such as Ca2+ and Mg2+ at the combined tested concentration of 0.009 M, increased gel strength. In the case of an Na-silicate content of 4.5 wt%, a pH of 10.3 and a temperature of 20 °C, for example, gel strength was increased by a factor of about 3 and the maximum gel strength was reached roughly eight times faster (based on the average effect of both ions) than solutions free of divalent ions. No precipitation formed in the case of LSW (seawater ions diluted 25 times), which makes this a possible option for a pre-flushing fluid in field application.
High shear rates, even for a short interval before gelation, accelerate gelling time and enhance gel strength. This resembles the wellbore case, and must therefore be considered in field application.
Using glass vials to investigate shrinkage showed that the latter was lower than with the use of plastic vials. This may be caused by strong adsorption to the silicate wall of the glass vial. That could reflect the shrinkage of formed gel in silicate (sandstone) reservoirs.
Acknowledgments
This work was supported by Dong Energy Company, Norway. The authors acknowledge the technical follow up and interest shown by Kelly Tyler, Lars G. Gammelgaard and Oddbjørn Melberg of Dong Energy Company, Norway. We also acknowledge Inger Johanne Munthe-Kaas Olsen and Kim Andre Nesse Vorland for their help in acquiring the needed materials and support.
Conflicts of Interest
The authors declare no conflict of interest.
References
- Vinot, B.; Schechter, R.S.; Lake, L.W.J. Formation of water soluble silicate gels by the hydrolysis of a diester. SPE Res. Eng. 1989, 8, 391–397. [Google Scholar]
- Lakatos, I.; Medic, B.; Basic, I.; Lakatos-Szabo, J. Prevention of Vertical Gas Flow in a Collapsed Well Using Silicate Polymer Urea. Proceedings of the Society of Petroleum Engineering (SPE) International Symposium on Oilfield Chemistry, The Woodlands, TX, USA, April 2009; pp. 20–22.
- Al-Dhafeeri, A.M.; Nasr-El-Din, H.A.; Al-Harith, A.M. Evaluation of Rigless Water Shutoff Treatments to be used in Arab-C Carbonate Reservoir in Saudi Arabia. Proceedings of the CIPC/SPE Gas Technology Symposium Joint Conference, Calgary, AB, Canada, June 2008; pp. 16–19.
- Krumrine, P.H.; Boyce, S.D. Profile Modification and Water Control with Silica Gels. Proceedings of the Society of Petroleum Engineering (SPE) International Symposium on Oilfield and Geothermal Chemistry, Phoenix, AZ, USA, April 1985; pp. 9–11.
- Mills, R.V.A. Process of Excluding Water from Oil & Gas Wells. U.S. Patent 1,421,706, 4 July 1922. [Google Scholar]
- Herring, G.D.; Milloway, J.T.; Wilson, W.A. Selective Gas Shut-Off Using Sodium Silicate in the Prudhoe Bay Field, AK. Proceedings of the SPE Formation Damage Control Symposium, Bakersfield, CA, USA, February 1984; pp. 13–14.
- Boreng, R.; Svendsen, O.B. A Successful Water Shutoff. A Case Study from the Statfjord Field. Proceedings of the Society of Petroleum Engineering (SPE) Production Operation Symposium, Oklahoma City, OK, USA, March 1997; pp. 9–11.
- Rolfsvåg, T.A.; Jakobsen, S.R.; Lund, T.A.T.; Strømsvik, G. Thin Gel Treatment of an Oil Producer at the Gulfaks Field. Proceedings of the Society of Petroleum Engineering (SPE) European Production Operations Conference & Exhibition, Stavanger, Norway, April 1996; pp. 16–17.
- Kristensen, R.; Lund, T.; Titove, V.I.; Akimov, N.I. Laboratory Evaluation and Field Tests of a Silicate Gel System Aimed to be used Under North Sea Conditions. Proceedings of the 7th European IOR Symposium, Moscow, Russia, October 1993; pp. 26–29.
- Hurd, C.B. Theories for the mechanism of the setting of silicic acid gels. Chem. Rev. 1938, 22, 403–422. [Google Scholar]
- Iler, R.K. The Chemistry of Silica, Solubility, Polymerization, Colloid and Surface Properties and Biochemistry; John Wiley-InterScience Publisher: New York, NY, USA, 1979. [Google Scholar]
- Hiemenz, P.C. Principles of Colloid and Surface Chemistry; Marcel Dekker Inc.: New York, NY, USA, 1977. [Google Scholar]
- Jurinak, J.J.; Summers, L.E. Laboratory testing of colloidal silica gel for oilfield applications. J. SPE Prod. Eng. 1991, 6, 406–412. [Google Scholar]
- An-Peng, T. A theory for polymerization of silica acid. Sci. Sin. 1963, 9, 1311–1320. [Google Scholar]
- Holmes, H.N.; Kaufmann, W.K.; Nicholas, H.O.J. The vibration and syneresis of silicic acid gels. J. Am. Chem. Soc. 1919, 41, 1329–1336. [Google Scholar]
- Brinker, C.J.; Scherer, G.W. Sol-Gel Science: The Physics and Chemistry of Sol-Gel Processing; Academic Press Inc.: San Diego, CA, USA, 1990. [Google Scholar]
- Ferguson, J.; Applebey, M.P. The syneresis of silica gel. Trans. Faraday Soc. 1930, 26, 642–655. [Google Scholar]
- Stavland, A.; Jonsbråten, H.; Vikane, O.; Skrettingland, K.; Fischer, H. In-Depth Water Diversion Using Sodium Silicate. Proceedings of the 16th European Symposium on Improved Oil Recovery, Cambridge, UK, April 2011; pp. 12–14.
- Sorbie, K. Polymer-Improved Oil Recovery; CRC Press: Boca Raton, FL, USA, 1991. [Google Scholar]
- Bryant, S.L.; Rabaioli, M.R.; Lockhart, T.P. Influence of syneresis on permeability reduction by polymer gels. J. SPE Prod. Facil. 1996, 11, 209–215. [Google Scholar]


| Component | Concentration (g/L) | Concentration (M) |
|---|---|---|
| NaCl | 23.38 | 0.4 |
| Na2SO4 | 3.41 | 0.024 |
| NaHCO3 | 0.17 | 0.002 |
| KCl | 0.75 | 0.01 |
| MgCl2 | 4.24 | 0.044 |
| CaCl2 | 1.44 | 0.013 |
| Total | 33.39 | 0.495 |
| Na-silicate (wt%) | 4 | 5 | 5 | 6 |
| pH | 10.40 | 10.55 | 10.70 | 10.80 |
| T (°C) | 60 | 50 | 45 | 70 |
| CaCl2 (ppm) | 400 | 250 | 200 | 800 |
| MgCl2 (ppm) | 200 | 250 | 350 | 0 |
| tg0 (min),Figure 5 | 1000 | 520 | 2400 | 3800 |
| tg/tg0 due to T, Figure 12 | 0.15 | 0.32 | 0.47 | 0.065 |
| tg/tg0 due to salt, Figure 12 | 0.21 | 0.25 | 0.22 | 0.13 |
| Estimated tg (min) | 1000 × 0.15 × 0.21 = 31 | 520 × 0.32 × 0.25 = 42 | 2400 × 0.47 × 0.22 = 248 | 3800 × 0.065 × 0.13 = 32 |
| Experimental tg (min) | 33 | 45 | 215 | 26 |
© 2014 by the authors; licensee MDPI, Basel, Switzerland This article is an open access article distributed under the terms and conditions of the Creative Commons Attribution license ( http://creativecommons.org/licenses/by/3.0/).
Share and Cite
Hamouda, A.A.; Amiri, H.A.A. Factors Affecting Alkaline Sodium Silicate Gelation for In-Depth Reservoir Profile Modification. Energies 2014, 7, 568-590. https://doi.org/10.3390/en7020568
Hamouda AA, Amiri HAA. Factors Affecting Alkaline Sodium Silicate Gelation for In-Depth Reservoir Profile Modification. Energies. 2014; 7(2):568-590. https://doi.org/10.3390/en7020568
Chicago/Turabian StyleHamouda, Aly A., and Hossien A. Akhlaghi Amiri. 2014. "Factors Affecting Alkaline Sodium Silicate Gelation for In-Depth Reservoir Profile Modification" Energies 7, no. 2: 568-590. https://doi.org/10.3390/en7020568