Wave Basin Experiments with Large Wave Energy Converter Arrays to Study Interactions between the Converters and Effects on Other Users in the Sea and the Coastal Area

 , , ,
, , ,
Abstract
: Experiments have been performed in the Shallow Water Wave Basin of DHI (Hørsholm, Denmark), on large arrays of up to 25 heaving point absorber type Wave Energy Converters (WECs), for a range of geometric layout configurations and wave conditions. WEC response and modifications of the wave field are measured to provide data for understanding WEC array interactions and to evaluate array interaction numerical models. Each WEC consists of a buoy with a diameter of 0.315 m and power take-off (PTO) is modeled by realizing friction based energy dissipation through damping of the WEC's motion. Wave gauges are located within and around the WEC array. Wave conditions studied include regular, polychromatic, long- and short-crested irregular waves. A rectilinear arrangement of WEC support structures is employed such that several array configurations can be studied. In this paper, the experimental arrangement and the obtained database are presented. Also, results for wave height attenuation downwave a rectilinear array of 25 heaving WECs are presented, for the case of irregular waves. Up to 16.3% and 18.1% (long-crested) and 11.2% and 18.1% (short-crested waves) reduction in significant wave height is observed downwave the WEC array, for the radiated wave field only and for the combination of incident-diffracted-radiated (perturbed) wave field, respectively. Using spectra at different locations within and around the array, the wave field modifications are presented and discussed.
1. Introduction
1.1. WEC Array Effects
Commercial exploitation of wave energy will require installation of large numbers of Wave Energy Converters (WECs), arranged in an array (or a “farm” or “park”). The power production of the array may be smaller or larger than the sum of the power produced by the equivalent number of individual WECs, caused by hydrodynamic interactions that take place between the WECs within an array (so-called intra-array interactions). As a result, e.g., traditionally wave height attenuation has been observed numerically and in scale model tests between the WEC array installation site and the shoreline. These wave field changes (so-called extra-array effects) can influence neighbouring activities in the sea, coastal eco-systems and even the coastline and the coastal defence conditions and parameters. Both the intra-array interactions and the extra-array effects will be referred to as “WEC array effects” in this paper.
Therefore, an accurate understanding is required of both the intra-array interactions between WECs in a wave farm and the extra array effects on the environment. With this understanding, optimal WEC array geometric layout can be determined, changes to wave conditions can be quantified and ultimately the cost of energy will be reduced significantly, as shown in [1]. Numerical studies on both small and large WEC arrays have already been performed, and have provided insight into the magnitude and extent of WEC array effects for idealized conditions and configurations.
1.2. Numerical Modelling of WEC Arrays
Several numerical methods have been employed to analyse the response of arrays of wave energy converters to the incident wave climate and the resulting modification of wave conditions, particularly down-wave of such arrays [2–5]. Reviews of available modelling approaches and their applications are discussed in [6,7].
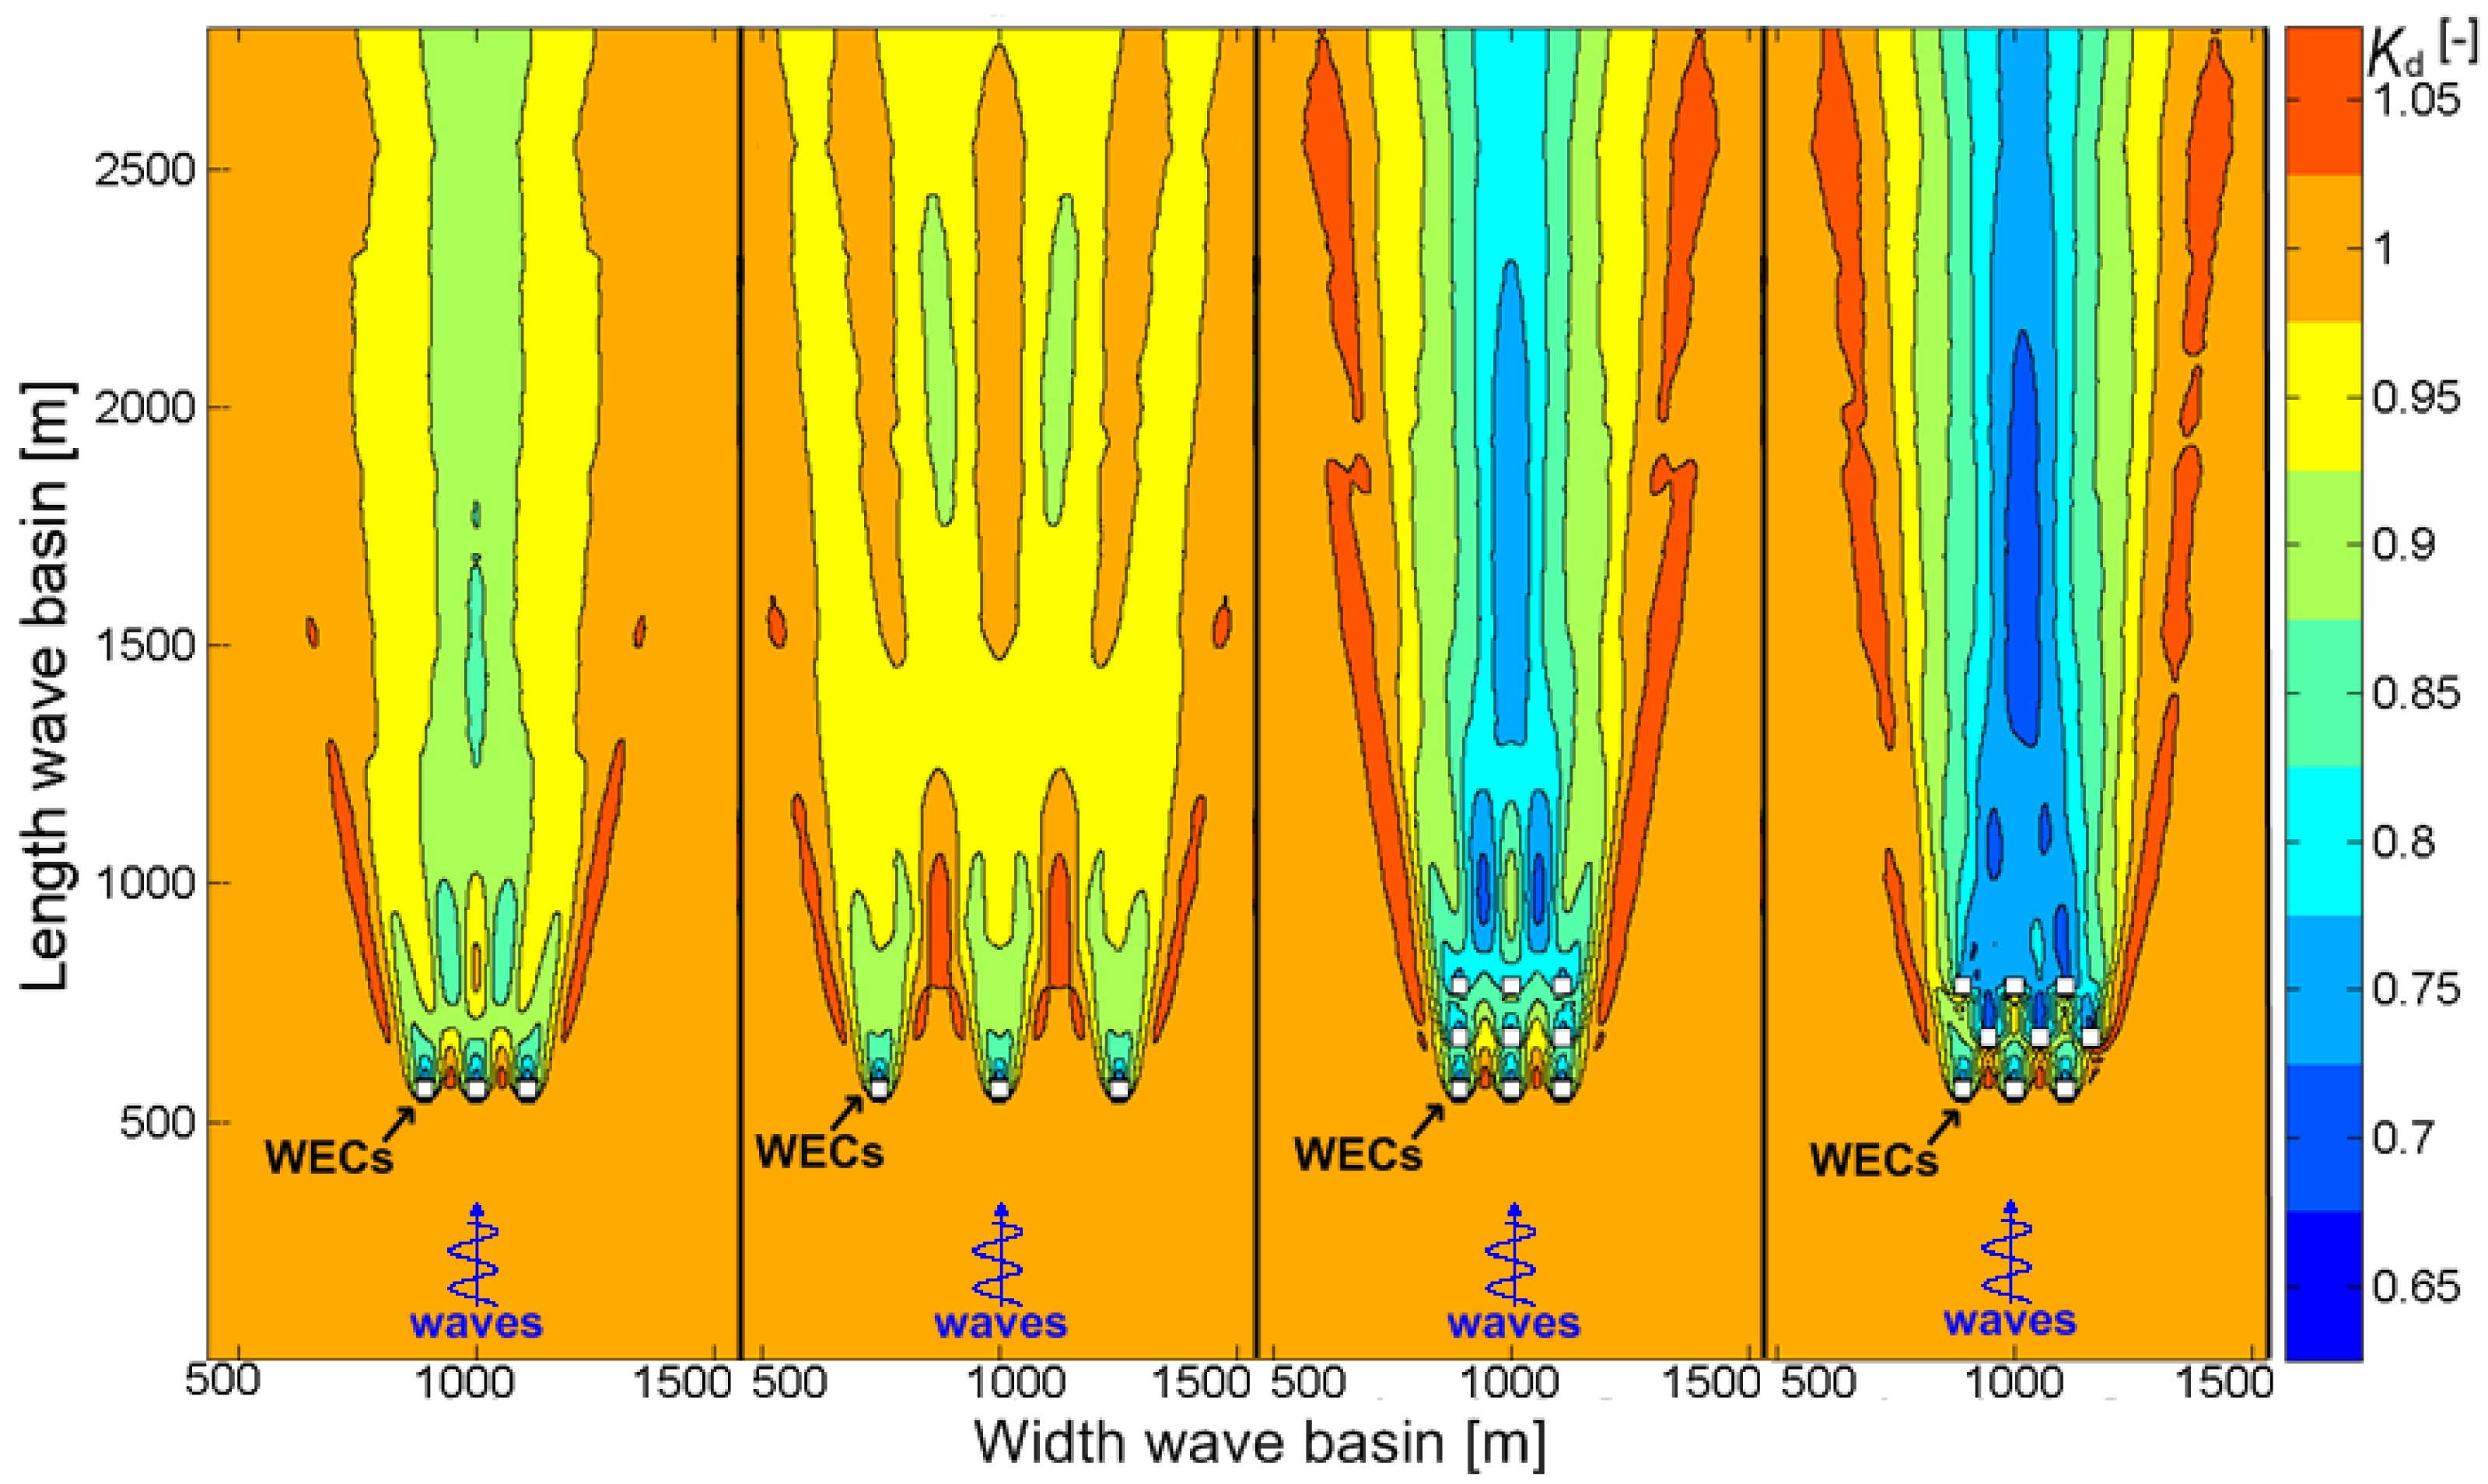
The importance of WEC array effects and of the geometric lay-out of a WEC array is illustrated here using the example of Figure 1. Using the wave propagation model MILDwave [8], extra-array effects have been modelled downwave the WECs. Results are presented in terms of the disturbance coefficient Kd (=Hm0/Hm0,GB, with Hm0 the local significant wave height based on the spectral density and Hm0,GB the wave height at the wave generation boundary). Waves are propagating from the bottom to the top of Figure 1, while the “white squares” simulate generic wave energy converters of the overtopping type with a specific power absorption. The extra-array effects in the lee of the WEC array are clearly visible, indicated by areas of reduced Kd values, with contour lines of Kd values ranging between 0.65 and 1.05. When the geometric layout and the number of WECs of the WEC array change (Figure 1a–d), the wave field downwave the WEC array changes as well.
Figure 1a,b, where a row of three WECs is simulated, reveal the importance of the spacing between the WECs of an array. The resulting extra-array effects, e.g., when the lateral spacing, w, between the WECs is smaller (Figure 1a) are much different compared to the extra-array effects (here, wave field modification) downwave an array with the same number of WECs but much larger w between the WECs (Figure 1b). Figure 1c,d, where an array of nine WECs is simulated, reveal the importance of the geometric lay-out of the WECs within an array. The resulting extra-array effects, e.g., downwave a 9-WEC rectilinear array (Figure 1c) differ compared to the extra-array effects downwave a 9-WEC staggered array (Figure 1d). However, to date, there has been very limited validation of these numerical models using physical scale models of WEC arrays.
1.3. Physical Modelling with Small WEC Arrays
In contrast to the large quantity of numerical simulations of WEC arrays and the large body of experimental work concerning individual WECs (e.g., [9–11]) or pairs of WECs (e.g., [12,13]), there is limited published data concerning either the response of such WECs located in arrays or the corresponding wave field changes.
In the last decade, experimental measurements of the response of the Wave star WEC—composed of a large number of floating bodies at close proximity and supported by a single structure—have been conducted and have led to construction and testing of a prototype at the DanWEC site near the Port of Hanstholm, in Denmark [14]. Experimental studies of arrays of five and 12 closely spaced heaving floats have also been conducted including response to regular waves [15], power output and response in irregular waves [16] and wave spectra changes across the array [17]. Within the UK Supergen Marine and the EU Hydralab III programmes, tests have been conducted of a WEC array of five oscillating water columns interconnected by mooring lines [18]. As part of the PerAWaT project several studies of wave energy converter arrays have been conducted, both of idealized geometries (e.g., [19]) and scale models of WEC systems under development by private companies.
Real wave energy applications will demand the installation of arrays composed of large numbers of WECs. However, the performed studies are limited in number and refer to small wave farms. Therefore, there is a clear need for experiments with large WEC arrays.
1.4. Need for Experiments with Large WEC Arrays
Presently, no experimental studies detailing WEC response, power output and wave field modifications due to an array are publicly available. Data from large WEC arrays concerning the physical modeling of intra-array interactions and extra-array effects, combined with simultaneous measurements of WEC response, wave induced forces on the WECs and of the wave conditions, are not reported in literature.
Such data are essential for evaluation of the accuracy of the used numerical tools, their validation, as well as for their further development and improvement. Accurate measurements of individual WEC response, WEC array power output and spatial variation of wave conditions in the vicinity of the array are required to improve understanding of the fundamental processes influencing wave conditions down- and up-wave of wave energy converter arrays. Moreover, results from testing various WEC array geometric configurations will lead to the optimization of the array lay-outs for real applications.
1.5. A First Database for Large WEC Arrays, Created During the “WECwakes” Project
Recently, as part of the “WECwakes” research project funded by the EU FP7 HYDRALAB IV programme, experiments have been performed in the Shallow Water Wave Basin of the DHI (Hørsholm, Denmark) on large arrays of point absorber type WECs (up to 25 WEC units). The research performed within the WECwakes project focuses on generic heaving WECs.
A range of WEC array geometric configurations and wave conditions have been tested. Each WEC unit is composed of a buoy, designed to heave along a vertical shaft only, and can thus be modelled as a single degree of freedom system. Energy absorption through the WECs' power take-off (abbreviated as PTO) system, is modelled by realising energy dissipation through friction based damping of the WECs' heave motion. Wave gauges are used to measure the wave field within and around the arrays. Displacement meters are mounted on each WEC unit for the measurement of the heave displacement. The wave induced surge force is measured on five WECs along the central line of the array.
This experimental set-up of 25 individual WEC units in an array layout, placed in this large wave tank, is at present the largest set-up of its kind, studying the important impacts on power absorption and wave conditions of WEC array effects. Most importantly, the “WECwakes” database is comprehensive, and is applicable not only to WEC arrays but also to floating structures/platforms, stationary cylinders under wave action, etc., for understanding of e.g., wave impact on the cylinders and wave field modifications around them. The “WECwakes” database is accessible to the research community as specified under the HYDRALAB rules.
1.6. Paper Overview
A detailed overview of the design and execution procedure of the experiments and of the WECwakes database is given in Sections 2–4. In Section 5, experimental results are presented, for the incident wave conditions generated during the testing programme, the effect of WEC support structures on the wave field and the wave field modification caused by 25 heaving WECs in an array geometric configuration, for both irregular long- and short-crested waves. A summary of the presented findings and the characteristics of the WECwakes database are presented in Section 6.
2. Experimental Setup
2.1. Characteristics of an Individual Wave Energy Converter
The experimental arrangement is selected to attain WEC response amplitude operator (RAO) greater than unity, and a measurable power output, whilst ensuring that the system is simple to set up for multiple units, as discussed in [20]. Details on the WEC unit development, evaluation and experimental study for the preparation of the WECwakes project are presented in [20–22]. The preparatory testing of up to four first prototype WEC units, was followed by the construction of 25 identical WEC units, manufactured at the workshop of Ghent University.
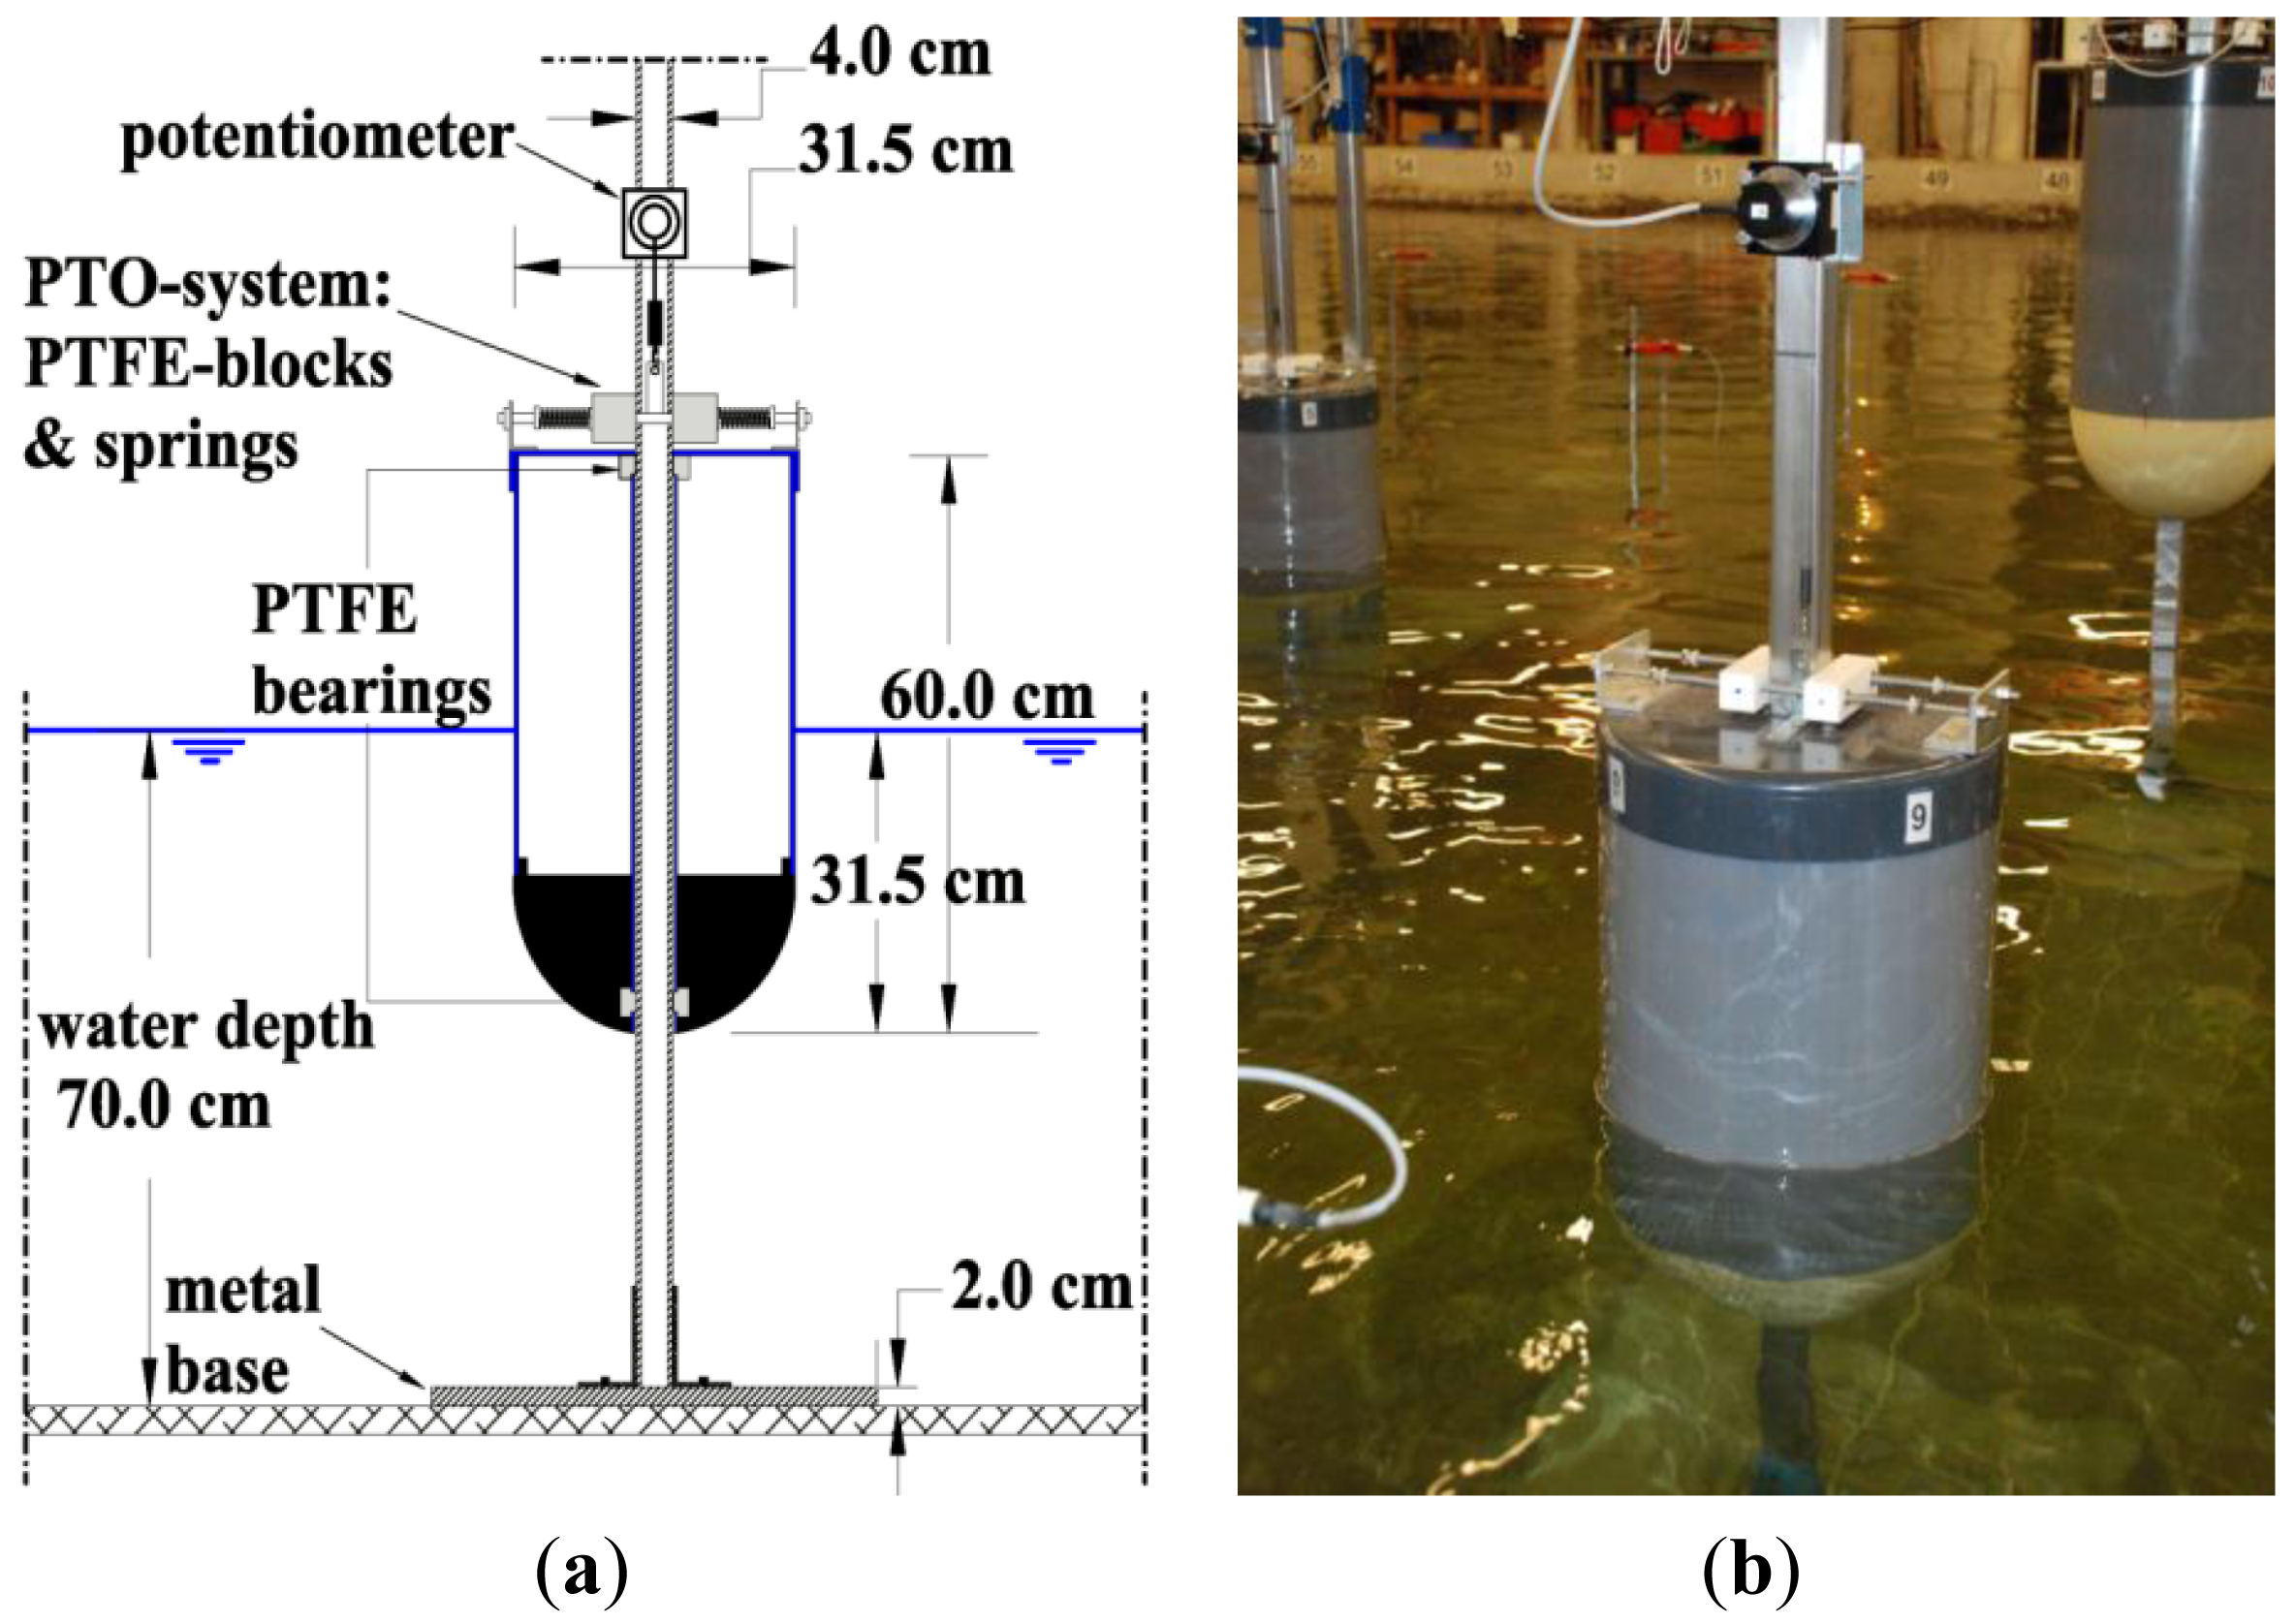
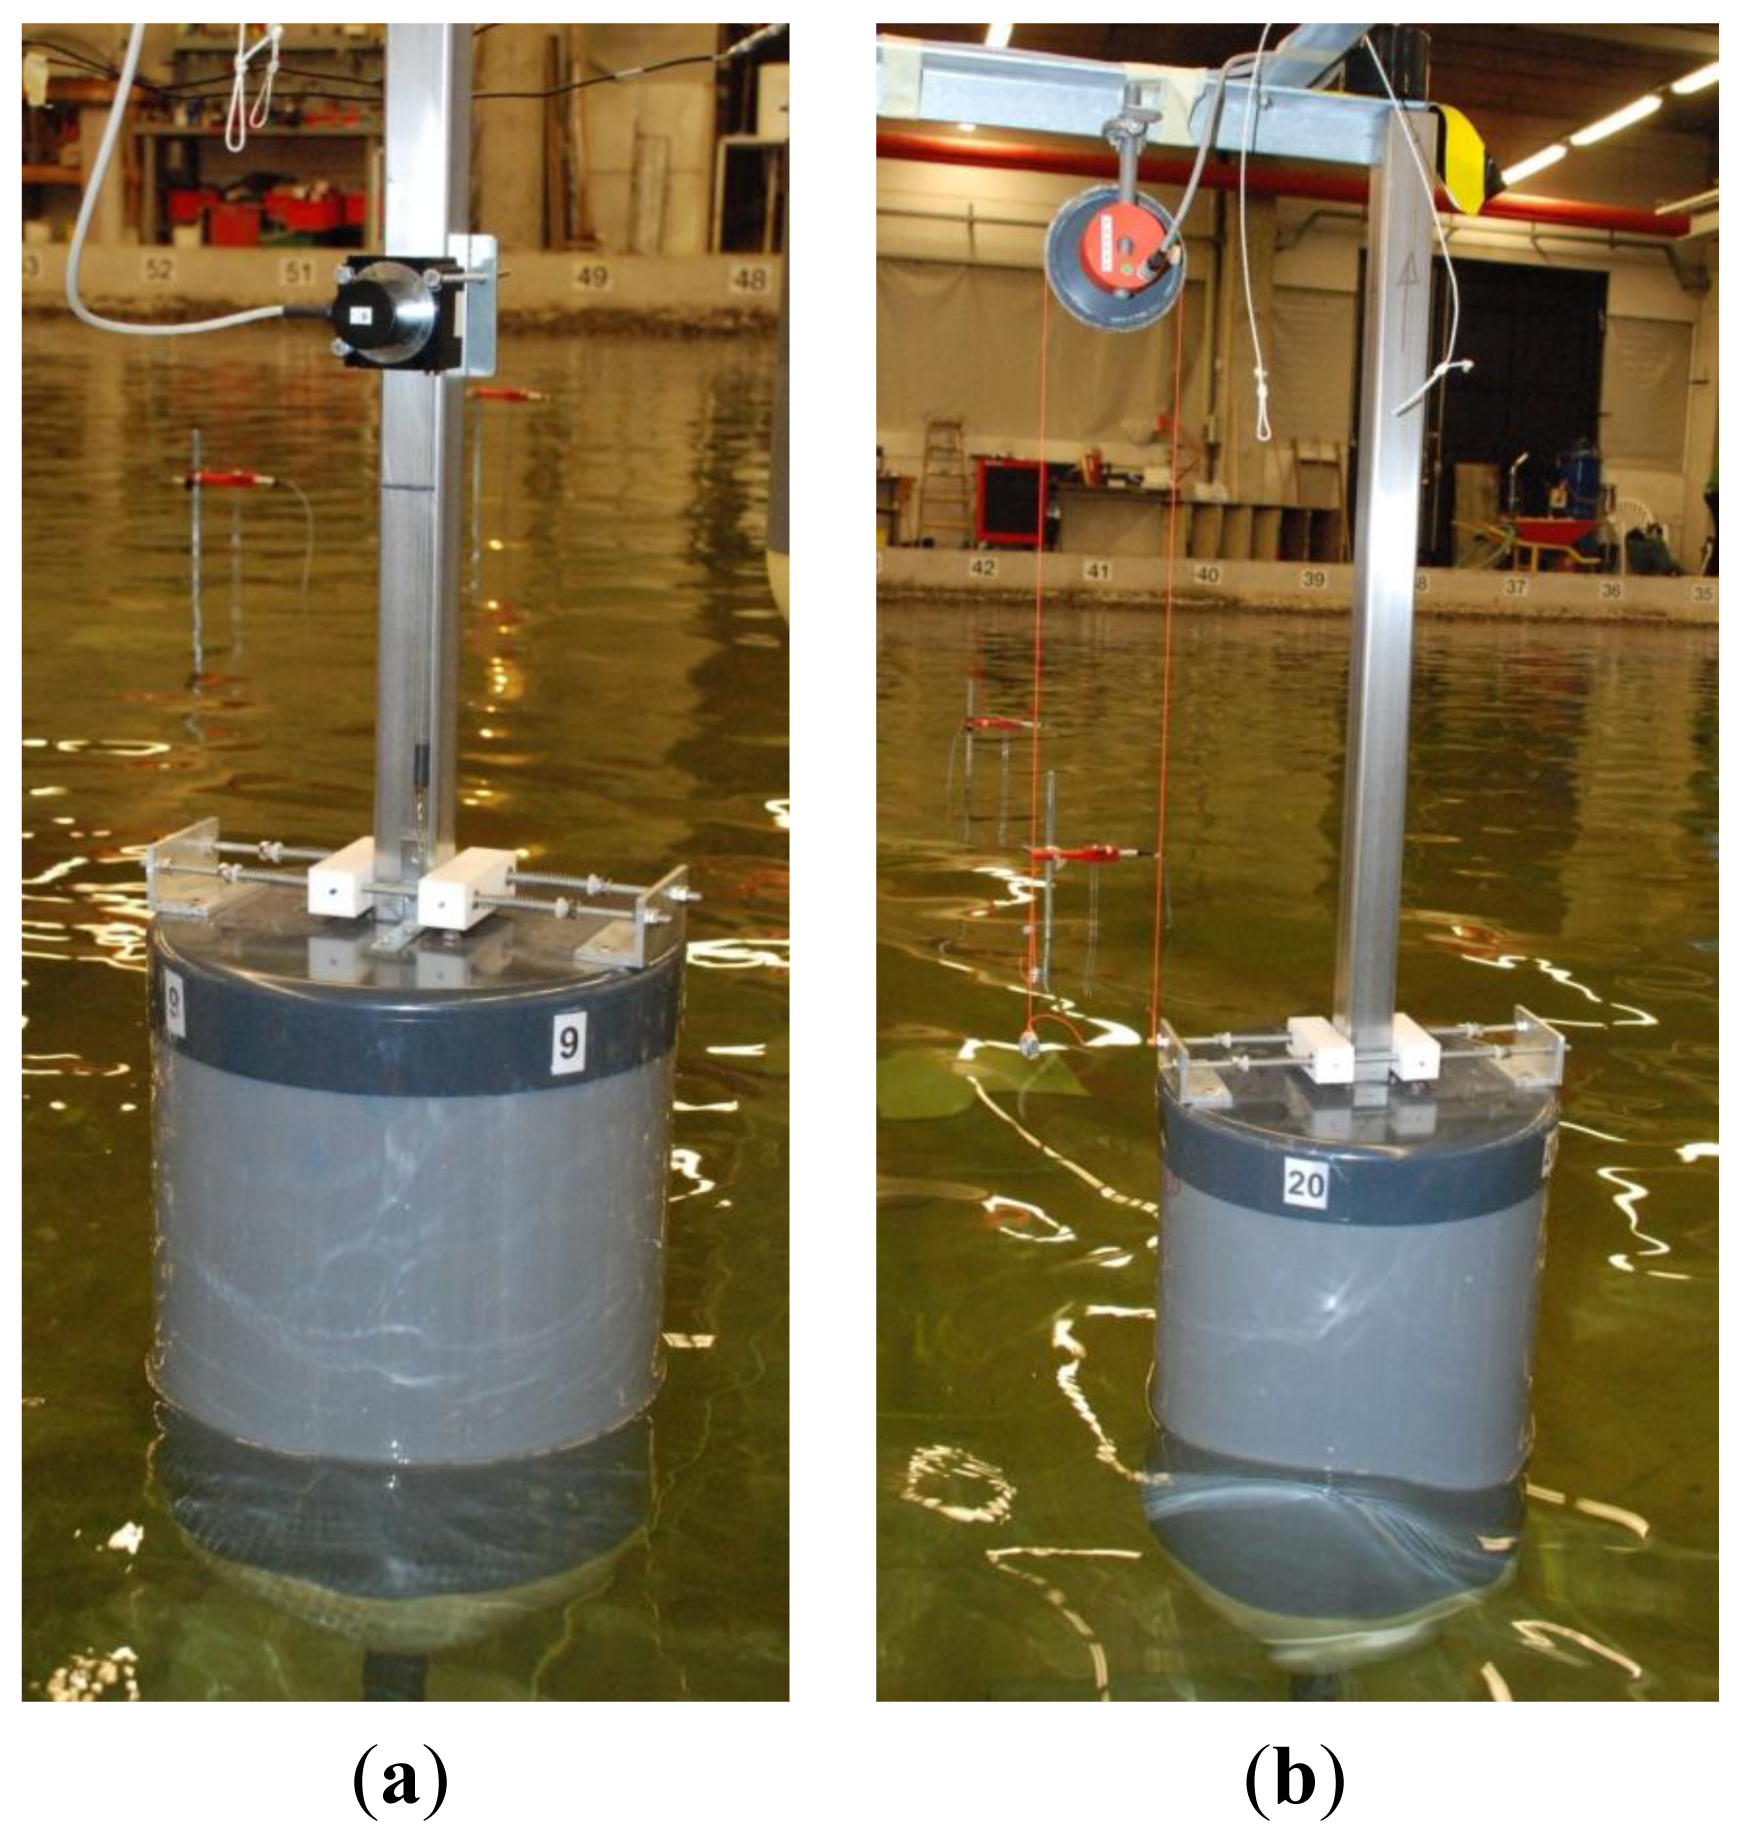
Each WEC unit comprises three main parts: (i) a hemispherical ended cylindrical buoy of diameter, D = 31.5 cm, and draft, dbuoy = 31.5 cm and overall height 60.0 cm; (ii) a vertical steel shaft of 40 mm square section with a gravity metal base; and (iii) a PTO-system based on friction brakes comprising polytetrafluoroethylene material (PTFE, commonly known as “Teflon”) blocks and four linear springs (Figure 2). The dry mass of the buoy is m = 20.490 kg and the natural period, by decay test and response measurement in regular waves, is Tn = 1.176 s. The upper part of the buoy is a horizontal polyvinylchloride (PVC) material cover, on which the PTO-system is installed and a potentiometer is connected for the measurement of the WEC's heave displacement (Figure 2).
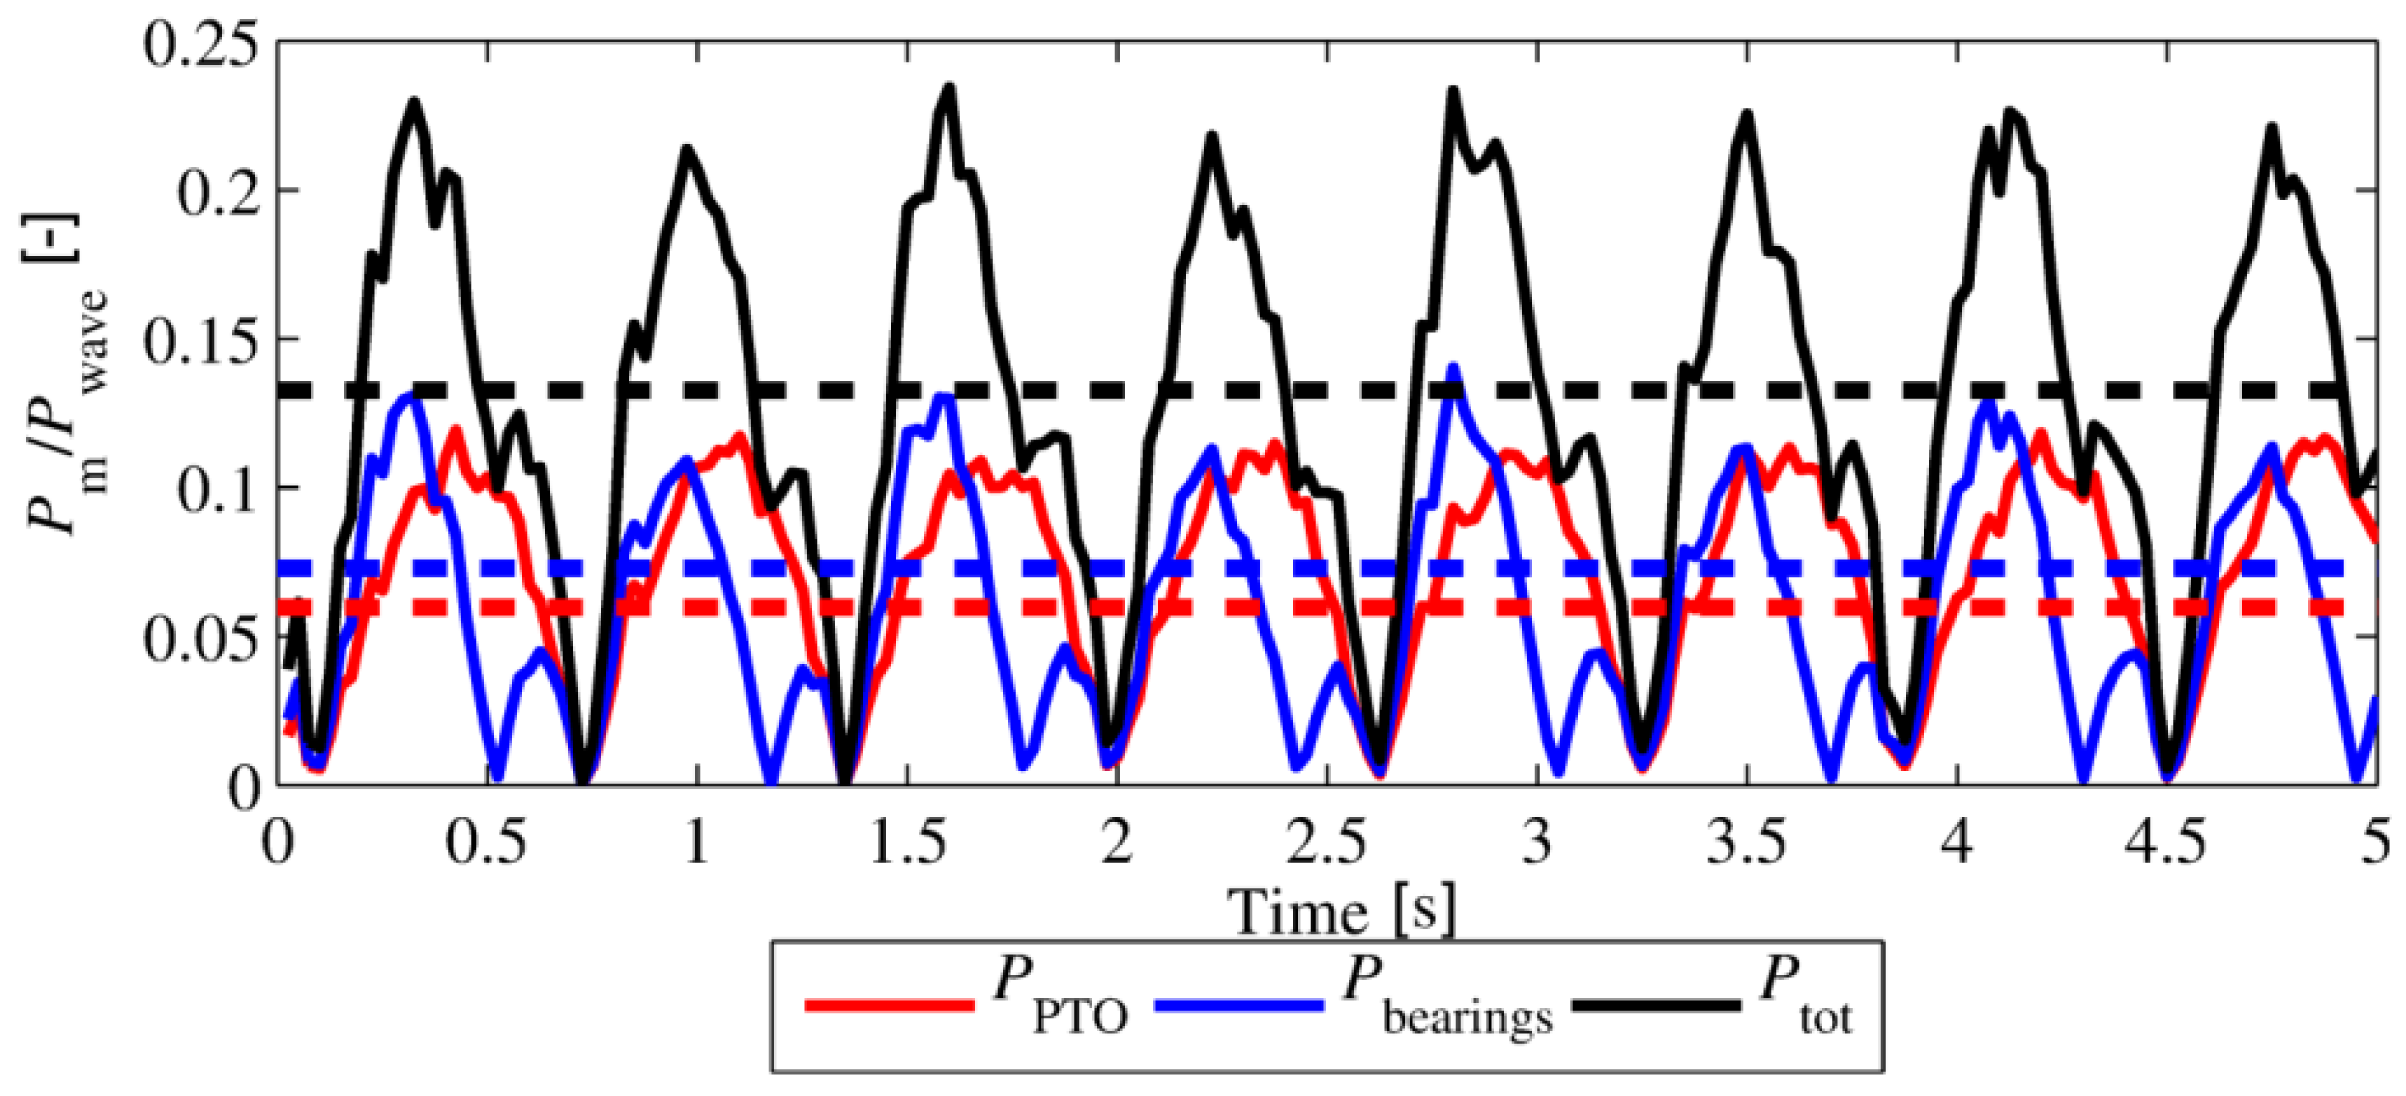
A power take off force, FPTO, is applied to the WEC through the PTO-system by friction brakes between the buoy and the supporting steel shaft. The resultant vertical frictional PTO force, FPTO, can be modelled to a reasonable accuracy using Coulomb damping [23] as:
Net power absorption, Ptot, is therefore obtained as:
Since surge force, Fsurge, is out of phase with the WEC velocity, ż(t), power due to bearings, Pbearings, (and therefore Ptot, as well) vary substantially during each wave cycle, as presented in Figure 3.
As shown in [24], results for WEC response amplitude operator (RAO) and power output, show reasonable agreement between measured response for individual WECs, and power output and WEC response predicted using a linear time domain model.
2.2. Description of the “WECwakes” Experimental Arrangement
Tests are performed in the DHI Shallow Water Wave Basin. The experimental facility is 25.0 m long and 35.0 m wide, with an overall depth of 0.8 m. Forty-four piston type wave paddles, each of width 0.5 m, generate waves at one end of the wave basin. The wave paddles are arranged in two segments of length 18.0 and 4.0 m with a 20.0 cm step between the two segments. Each wave paddle is 1.2 m high and 0.5 m wide, and thus the total width of the wave generator is 22.0 m. The 3D wave generator is designed to operate at water depths, dw, between 0.2 m and 0.8 m. The wave generator is equipped with Active Wave Absorption Control System (AWACS) in order to deal with undesired re-reflexion of waves to the wave generator, and to allow full control of the incident waves. A gravel beach with a slope of 1/5.59 provides energy absorption at the opposite end of the wave basin.
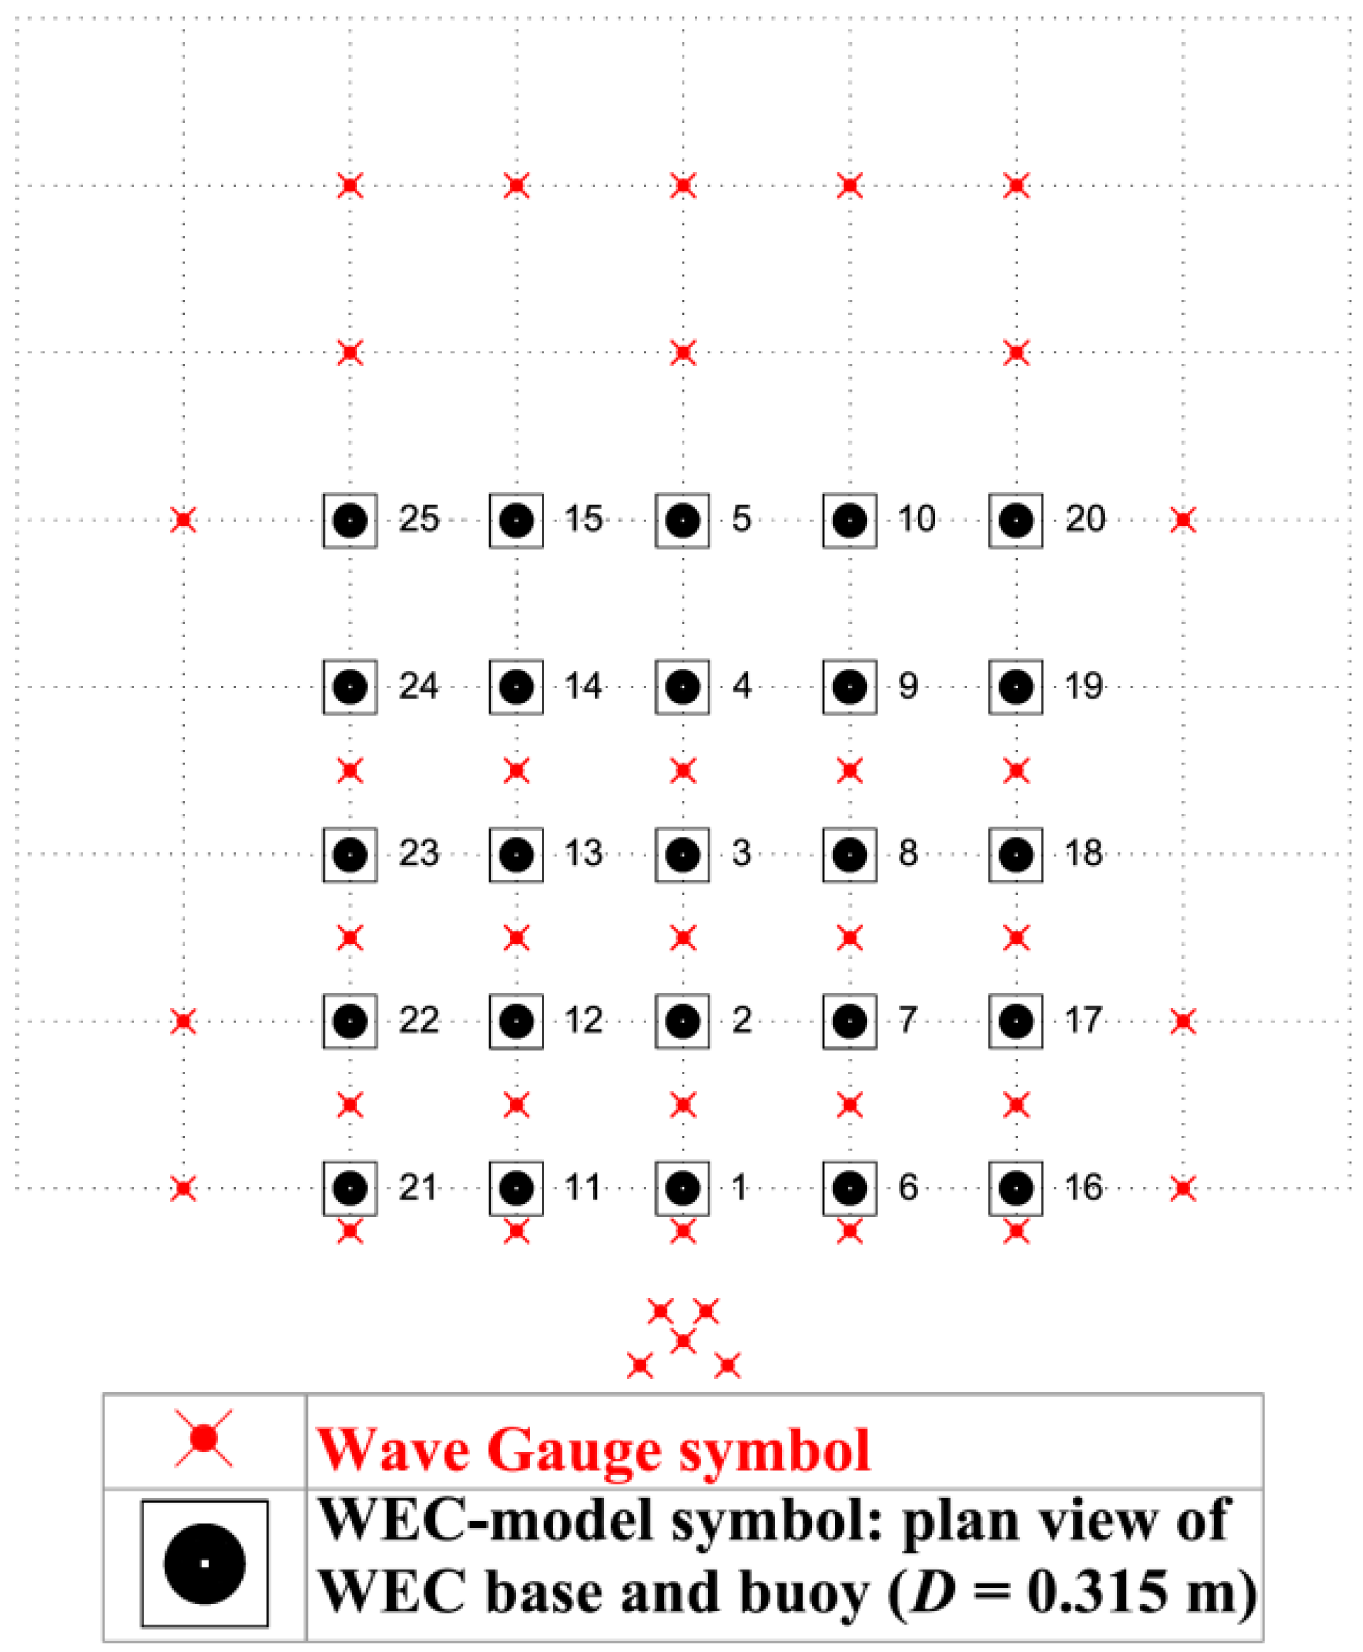
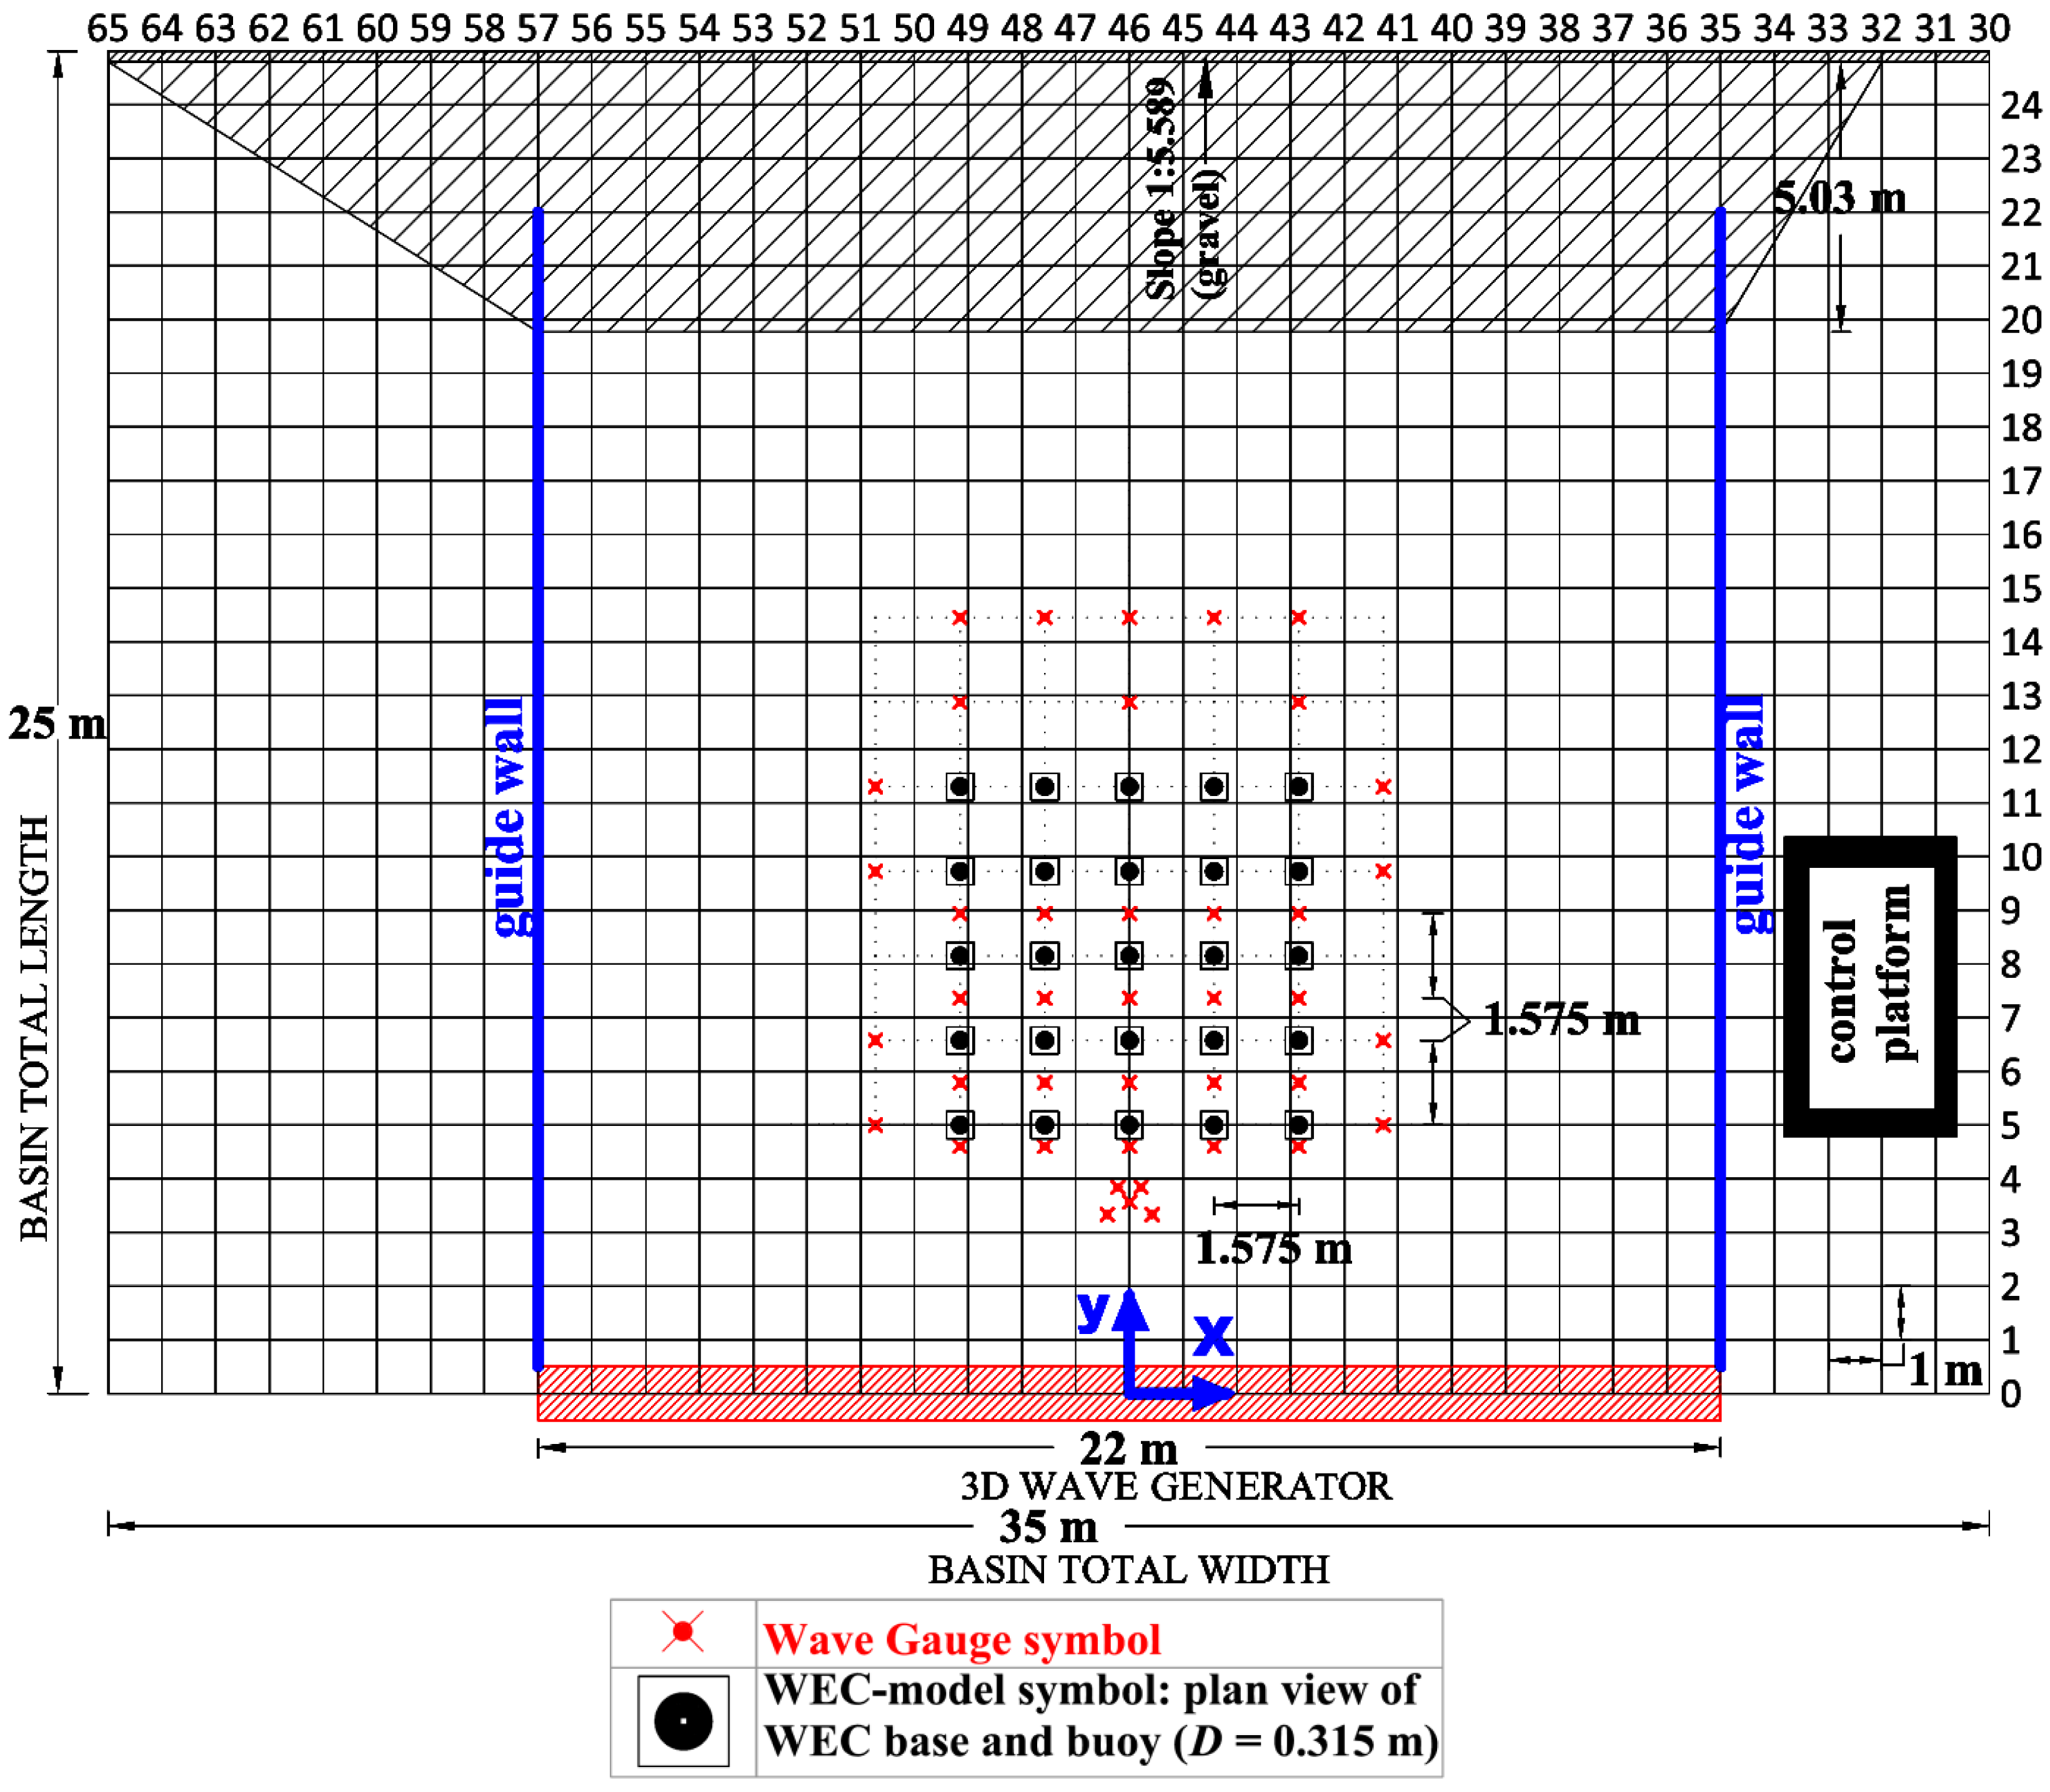
In Figure 4, a plan view of the general experimental arrangement in the wave basin, and the configuration comprising the 5 × 5-WEC rectilinear array, is presented, as well as the standard locations of the wave gauges. The lateral, w, and longitudinal, l, (centre-to-centre) spacing between the WECs, are w = l = 5D = 1.575 m, where D is the WEC diameter. The complexity of the tested WEC array layouts increases gradually. The experiments start with the testing of individual WEC units at different locations within the wave basin. Furthermore, different WEC arrays have been tested, with various geometric configurations and different/increasing WEC numbers.
The wave generator has a total width of 22.0 m and thus, does not extend across the entire wave basin width of 35.0 m. Vertical guide walls have been installed in order to avoid diffraction of the generated waves to either side of the basin. This technique results in a larger “effective” domain within the wave basin. Moreover, it simplifies the numerical treatment of the experimental set-up, using fully reflective boundaries for simulating the guide walls. The distance between the guide walls and the outermost WECs of the 5 × 5-WEC array, is nearly 25D = 7.875 m, and so reflection of waves diffracted and radiated by the array is not expected to substantially influence the findings. The guide walls comprise plywood panels that extend 2.0 m beyond the toe of the absorbing beach, such that directional waves are not reflected back to the test region.
For the installation of the WEC units in the wave basin, support structures have been used comprising: (i) the WEC metal gravity bases, 2.0 cm thick; (ii) the WEC steel vertical shafts of 4.0 cm × 4.0 cm section, as shown in Figure 2a and (iii) a connecting steel frame at the top of the WEC shafts, as shown in Figure 5.
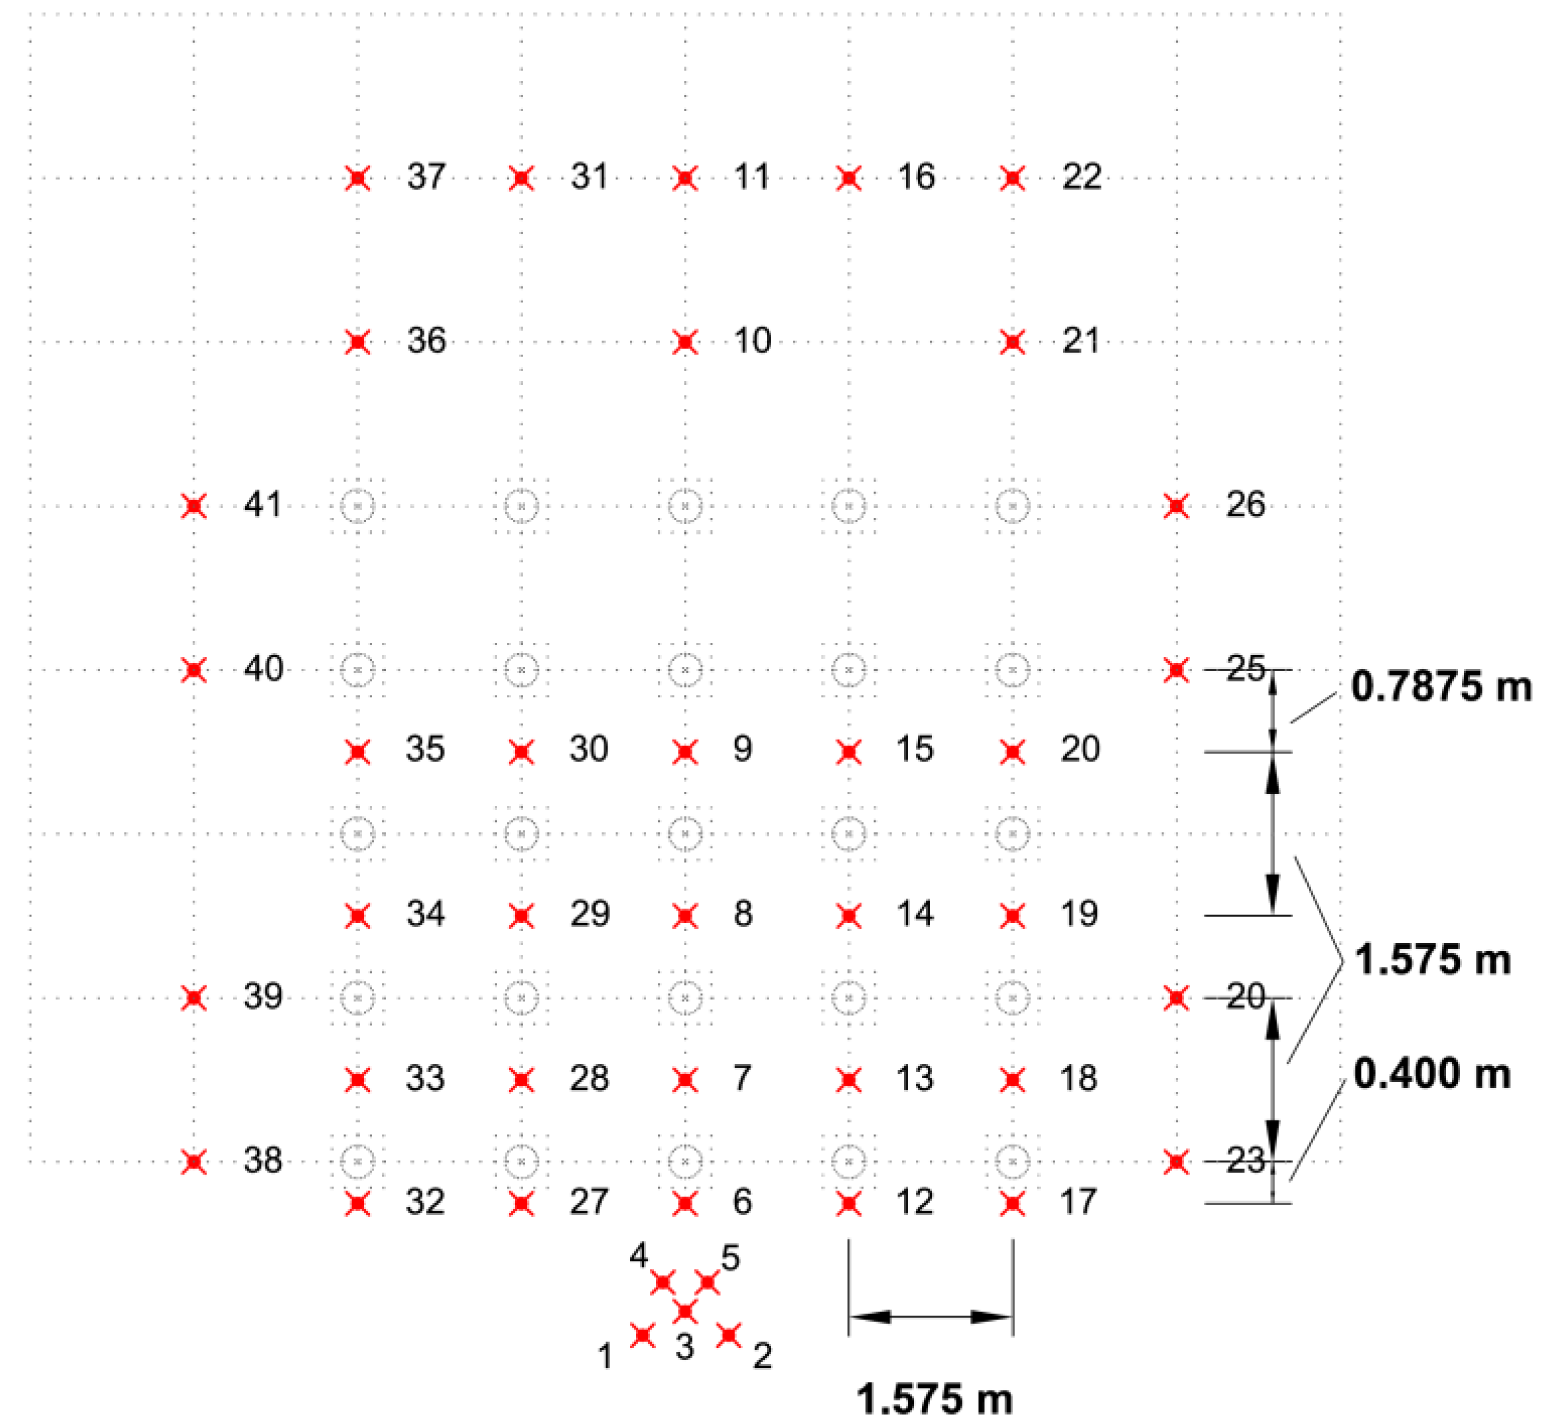
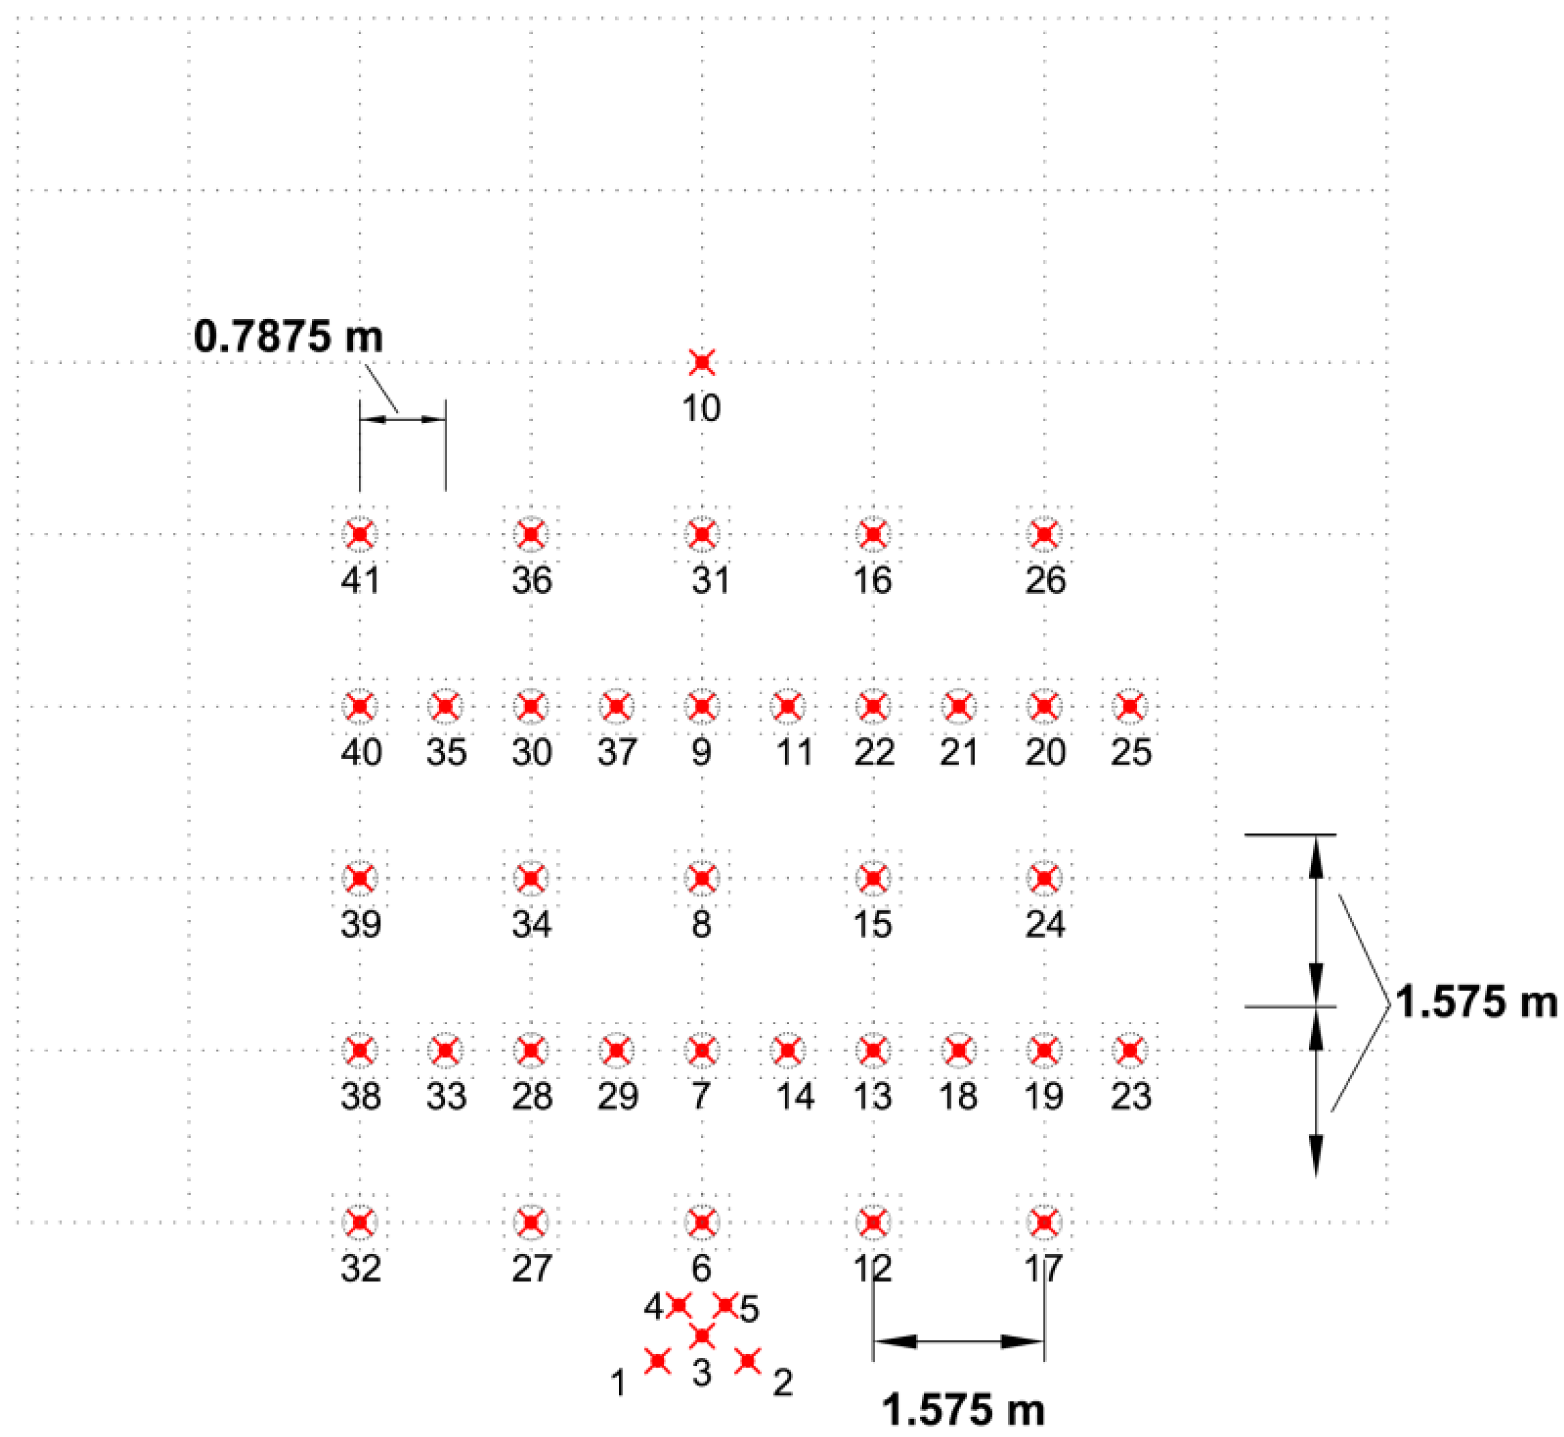
Two different layouts of these support structures (“shafts stencils”) have been constructed to install: (a) the 5 × 5-WEC rectilinear array (Figures 4 and 6) and all WEC (array) geometric configurations composed of less than 25 WEC units (“shafts stencil 1”) and (b) the 5 × 5-WEC staggered array (“shafts stencil 2”), for which the shafts of two WEC rows have been moved with an offset of 2.5D = 0.7875 m between alternating rows of WECs (Figure 7). Each of the 25 WEC units has been assigned a unique number, shown in Figures 6 and 7.
3. Instrumentation
3.1. Measured Parameters
During the “WECwakes” project, measurements of wave elevations, WEC heave displacement and surge forces on the WECs have been acquired simultaneously (up to 76 simultaneously measured parameters). A short overview is provided hereafter.
3.1.1. Measurements of Wave Elevations
Resistive Wave Gauges (abbreviated as WGs), have been used to acquire wave elevation time series (η(t)) at specific locations throughout the wave basin. A total number of 41 wave gauges have been used, positioned around and at the locations of the WEC units, according to the tested WEC array geometric configurations. Moreover, a “CERC 5 wave gauge array” introduced by Borgman and Panicker [25] is used in front of the WEC arrays for estimating wave directionality and wave reflection.
Two “WG plans” have been used throughout the experiments: (a) “WG plan 1” (Figure 8) for recording the wave elevations around the WEC units and (b) “WG plan 2” (Figure 9) for recording the wave elevations at all locations where WEC units have been installed and tested within all WEC array configurations. For setting up “WG plan 2”, all WEC units and the support structures have been removed and the wave gauges of “WG plan 1” have been moved to the centers of the WECs. Each of the 41 WGs is assigned a unique number as shown in Figures 8 and 9. Also, the undisturbed wave field has been recorded in an empty wave basin (without any WECs or support structures), using both “WG plans 1 and 2”.
3.1.2. Measurements of the Heave Displacement of the WEC Units
A potentiometer is attached to each WEC unit, for measuring time series of the heave displacement, z(t). In total, 25 potentiometers have been used. The used types of potentiometers are shown in Figure 10. The heave displacement measurements provide information on the WEC response, as well as data for calculating power absorption of the WEC units as presented in [20].
3.1.3. Measurements of the Wave Induced Surge Force on the WEC Units
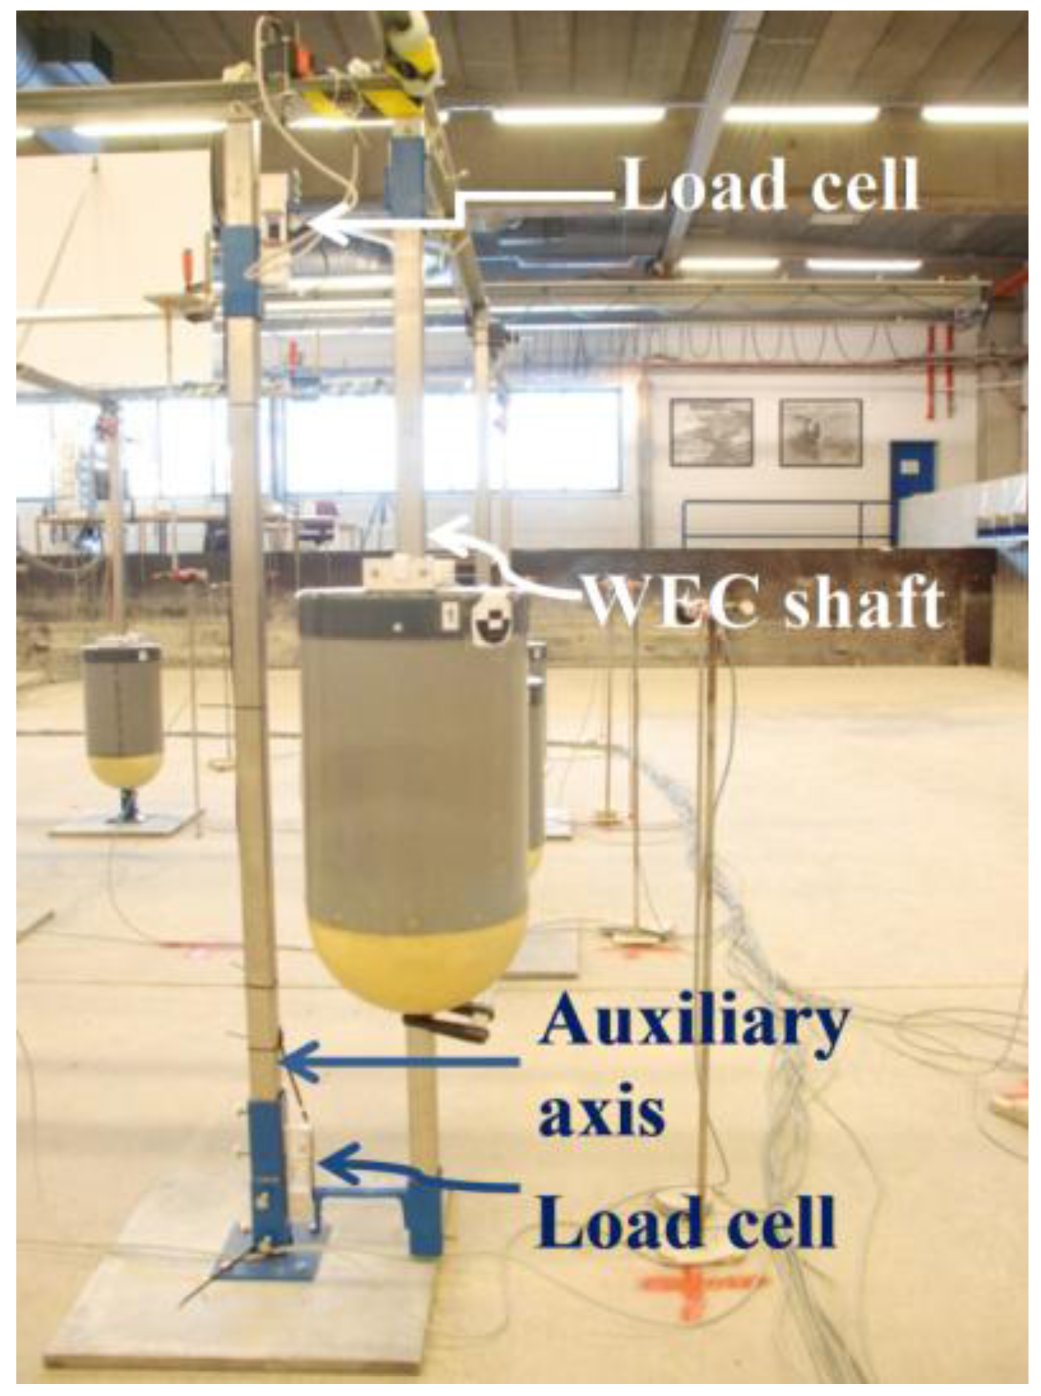
The arrangement for measuring the time varying wave induced surge force (Figure 11), Fsurge(t), on each WEC unit requires two load cells, attached both, at the top and at the bottom, respectively, of the WEC shaft and to an auxiliary parallel axis, in the longitudinal direction of the wave basin. To calculate Fsurge on a WEC unit, the sum is taken of the recorded signal at the top and the bottom load cell. Fsurge has been measured on WECs #01–05 (Figures 6 and 7) which are situated in the central column of the WEC array geometric configurations, and in total, ten load cells have been used.
4. Experimental Test Programme
4.1. Tested Sea States
Four types of waves have been considered: regular, polychromatic, long-crested irregular and short-crested irregular waves. For the majority of the tests, two wave periods, T = 1.180 s and T = 1.260 s, have been tested. The wave period, T = Tp = 1.180 s, corresponds to the natural period, Tn, of the WEC unit. The second wave period, T = Tp = 1.260 s, is selected based on the ratio between the wave length, L, and the lateral, w, and longitudinal, l, spacings between the WECs [26]. The water depth, has been kept constant throughout the entire testing period at dw = 0.70 m.
The regular waves are defined in terms of a wave period, T, and a wave height, H. For the majority of the regular wave tests, H = 0.074 m has been used. For the regular waves, wave attack of different directions is also considered, with waves propagating from the wave paddles to the WEC arrays under different wave angles, θ = 0°, 10° and 20°. The wave paddles are operating with activated AWACS. However, additional tests have been performed for regular waves without the AWACS activated, in order to study in detail the start of the WEC heave motion. The target sea state characteristics used to generate regular waves are summarized in Table 1.
Polychromatic waves which consist of superimposed regular waves with different wave lengths, L, have also been considered. The wave period, T, and wave height, H, thus varies during the test. A polychromatic wave can be expanded as a sum of regular (monochromatic) waves. The polychromatic waves have been defined based on [26], applying a random starting phase to each wave component. Polychromatic waves have been generated with wave propagation angle, θ = 0°. The target sea state characteristics used to generate polychromatic waves are presented in Table 2.
The irregular waves are defined by a JONSWAP spectrum, SJONSWAP(f), with peak period, Tp = T, and, for the majority of the tests, significant wave height based on the spectral density, Hm0 = 0.104 m, in order to achieve equivalent energy contents to the regular waves with H = 0.074 m.
Long-crested irregular waves have been generated with wave propagation angle, θ = 0°. Tests with irregular long-crested waves have been also performed for a wider range of significant wave heights, Hm0, and peak wave periods, Tp, as presented in Table 3.
The short-crested irregular waves have a directional spread that is defined by the parametrical cosine power 2s model [27]. The spreading parameter, s, gives the degree of directional energy concentration. In general, the value of s depends on whether wind or swell waves are considered: s = 10 for wind waves, s = 25 for swell with short decay distance and s = 75 for swell with long decay distance [28]. Short-crested irregular waves with s = 10 and s = 75 have been, here, considered to represent wind and swell seas, respectively. The selection of the irregular short-crested wave conditions is based on research findings by Troch et al. (e.g., [2]) and Beels et al. (e.g., [1,29,30]). Short-crested irregular waves have been generated with wave propagation angle, θ = 0°. The target sea state characteristics used to generate irregular short-crested waves are presented in Table 4.
Moreover, in Table 5, a summary of the tested wave basin and WEC array configurations is provided, with regard to the studied wave conditions. Conventionally, here a “row” of WECs refers to a number of devices oriented parallel to the wave generator. A “column” of WECs refers to a number of devices oriented perpendicular to the wave generator (i.e., parallel to the wave propagation direction, θ = 0°).
A short description of the wave basin and the WEC array configurations is given in the first column of Table 5, as well as in the last column where configuration sketches can be visualized. In columns 2–5, the types of tests regarding wave conditions are listed, for each wave basin and WEC (array) geometric configuration. In columns 6,7, it is indicated whether the diffracted wave field for WEC units or shafts under incident waves and whether tests for WEC decay motion have been performed for a specific WEC (array) configuration. For the tests of column 6, the WECs are held stationary at the equilibrium position (where the WEC buoy draft dbuoy = 31.5 m) and therefore the WECs behave as “obstacle cylinders” under wave action.
Regarding the PTO-system damping characteristics for the WEC array configurations of Table 5, the tests for individual WECs have been performed for damped WEC response, with varying spring compression in PTO dx within the range 10.5–50.5 mm, and for undamped WEC response (“free WEC response with dx = 0.0 mm and FPTO = 0 N). The 5-WEC Column tests have been performed for dx = 30.5 and 35.5 mm. The rest of the WEC array configurations have been tested using dx = 30.5 mm, which corresponds to optimum power absorption of an individual WEC as presented in [24].
Individual WEC units have been tested at various positions in the wave basin, to investigate the WECs' response. In total, 28 different WEC (array) geometric configurations have been tested during the WECwakes project.
5. Results and Discussion
5.1. Recorded Incident Wave Conditions
To determine the incident undisturbed (i.e., no WECs present) wave field conditions, each sea state has been recorded for three wave basin arrangements:
at the wave gauge locations of “WG plan 1” (Figure 8) used during WEC (array) tests for both “WEC shafts stencils 1 and 2” (WEC units are held stationary above the water surface; WEC shafts are present);
at the wave gauge locations of “WG plan 1” (Figure 8) used during WEC (array) tests in an empty wave basin (i.e., no WEC support structures are present);
at the wave gauge locations of “WG plan 2” (Figure 9) in an empty wave basin (i.e., no WEC support structures are present).
In this paper, wave field results for long- and short crested (with spreading parameter, s = 10) irregular waves are presented. Moreover, for all data reported here, the wave generator has been operated in absorption mode, with activated AWACS. The data have been analysed using Wavelab [31]. In all figures presented in Section 5, the basin width (X, columns) and length (Y, rows) are expressed in number of WEC unit diameters, D = 0.315 m, with the start of the axes set at the centre on WEC unit #01.
Across the width of the wave basin, a spatial variation of the measured wave height, Hm0, is observed (Figure 12a): long-crested waves; Figure 12b: short-crested waves with s = 10). The subscripts “m0” and “0i” denote “measured value” and “target value” of irregular waves, respectively. In Figure 12a,b, the discrete values of the non-dimensional measured wave height at each wave gauge location, (Hm0/H0i), are shown throughout the wave basin. Moreover, contour plots are presented of the absolute values of the differences calculated using Equation (4):
In Figure 12a,b, the differences remain in the largest part of the wave basin within the range 0.0%–10.0%, with limited wave gauge locations exceeding 15.0%. The cause of this spatial variation of wave height are attributed to small differences of wave generation across the wave basin width and development of slightly varying reflection from the wave absorbing beach. The profile of the wave absorbing beach has been constructed manually, using gravel material. Change in the geometry of the beach profile has been observed, between the first and the last day of the experiments, after exposure to varying wave conditions with varying wave attack angles. Therefore, the beach profile does not have completely identical characteristics along the basin width, which can be responsible for different reflection characteristics and the above variation in the measured wave height, Hm0, along the wave basin width.
Moreover, repetitive data variation, e.g., the peak of absolute difference larger than 15.0% found at a specific wave gauge location of “WG plan 2” between WECs #22 and #12, shown in Figure 12a,b, may indicate a localized laboratory effect related to the operation of this specific wave gauge during the experiments shown in Figure 12a,b.
In conclusion, the accuracy of the generated waves for the irregular wave conditions presented here, is described by differences of 5.0% and 10.0% for long- and short-crested waves, respectively, in the largest part of the wave basin, and remains below 10.0% and 15.0% (besides at two WG locations), respectively, in the entire basin.
5.2. Influence of the WEC Support Structures on the Incident Wave Field
The measured wave heights, Hm0, for irregular waves, from the tests with and without the presence of the WEC support structures have been compared, in order to quantify the influence of the WEC shafts and metal bases on the incident wave field.
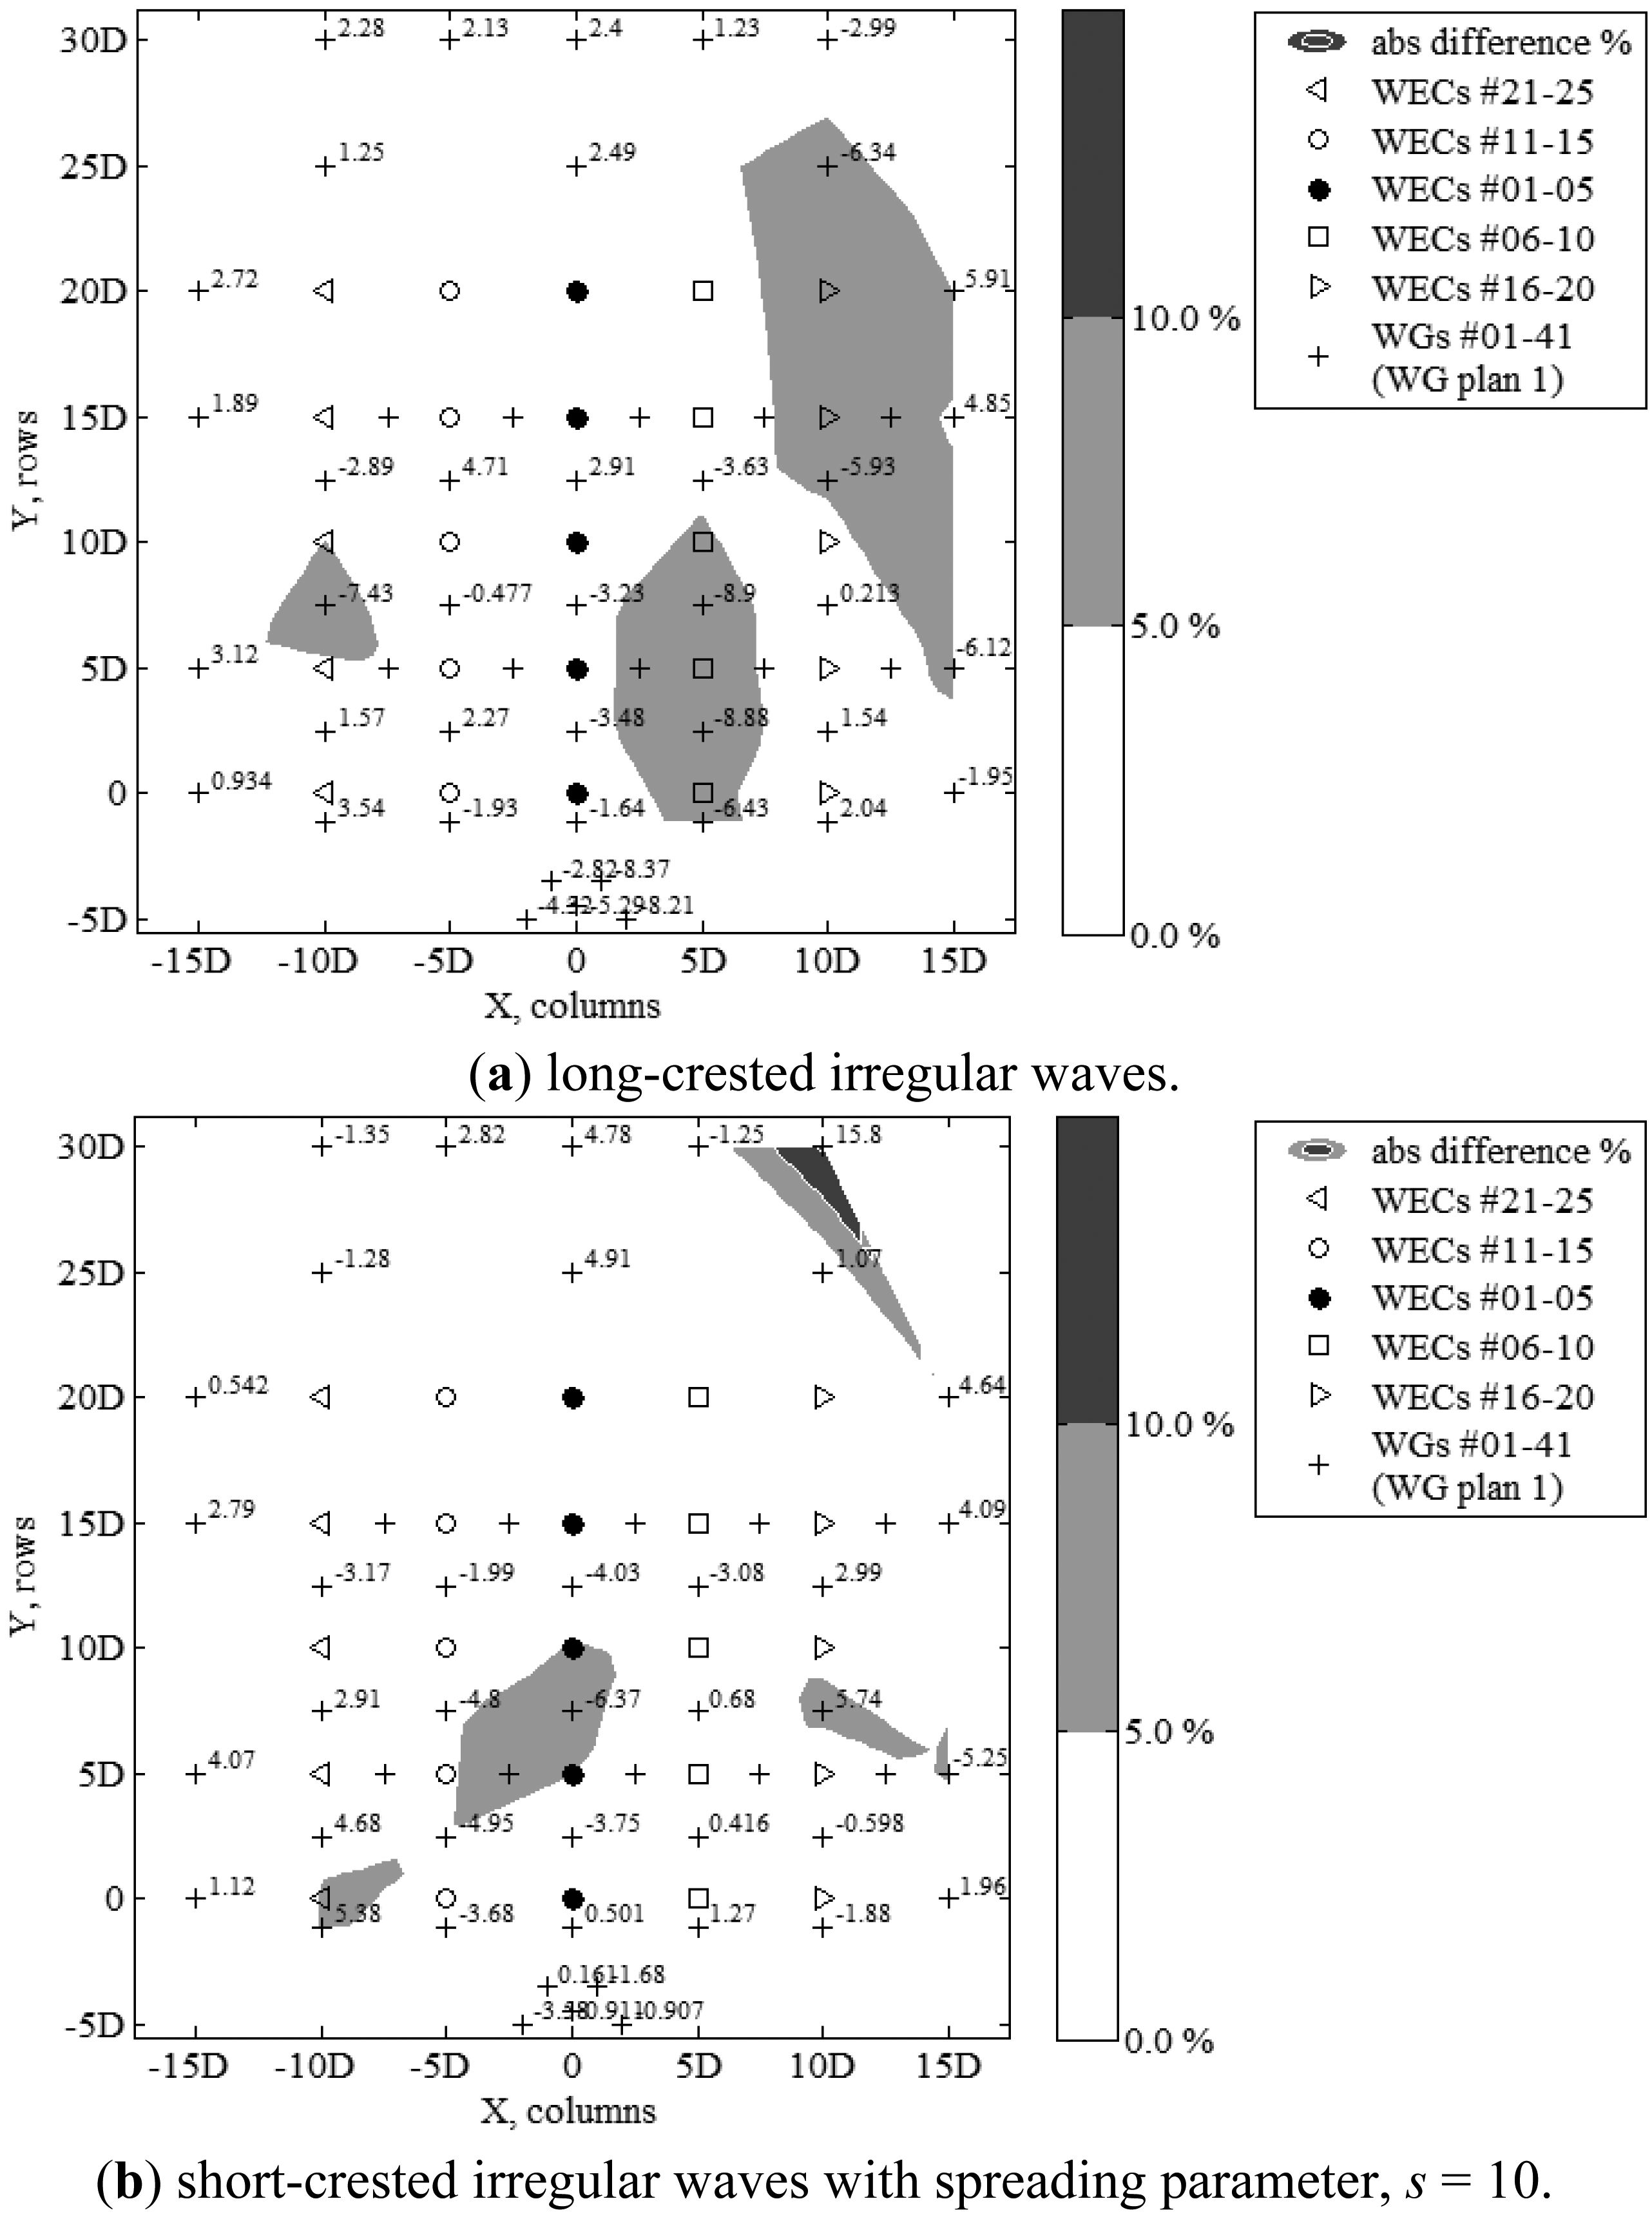
The difference percentages in the recorded wave height, Hm0, normalised to the target wave height, H0i, between the tests with the presence of WEC support structures and tests in an empty wave basin, are given for irregular long-crested (Figure 13a) and short-crested (for s = 10) (Figure 13b) waves with wave period, Tp = 1.26 s, and target significant wave amplitude H0i = 0.104 m.
The discrete values of the difference percentages shown in Figure 3a,b are calculated by subtracting the non-dimensional wave heights measured in an empty wave basin, from the wave heights at the same wave gauge locations with the presence of the WEC support structures. The wave heights are made non-dimensional by diving by the wave heights measured in an empty wave basin. A positive value thus indicates an increase in wave height, Hm0, due to the presence of the WEC support structures, while a negative value indicates wave height decrease. Moreover, shading contour plots of the absolute values of the calculated differences, are presented.
In both Figure 13a,b for irregular waves, the variations are found up to 5.0% for the largest part of the test region. For long-crested waves (Figure 13a), the area where the variation is ranging between 5.0% and 10.0% is limited, with only nine measurements out of 41, found for variation larger than 5.5% and a maximum value of −8.96%. For short-crested waves (Figure 13b), the area where the variation is ranging between 5.0% and 10.0% is even smaller, with only two measurements out of 41, found for variation larger than 5.5% and a maximum value of 15.8%.
However, the variations do not appear at the same locations and are randomly distributed across the test region: there is an increase at specific locations and a decrease at other nearby locations, without a noticeable trend. The variations shown in Figure 13a,b using two different tests (without and with WEC support structures) are similar to the spatial variations described in Section 5.1, and even smaller. Therefore, the effect of the presence of the WEC support structures, on the wave height, Hm0, is confirmed to be small.
5.3. Wave Field Modification around a 5 × 5-WEC Rectilinear Array
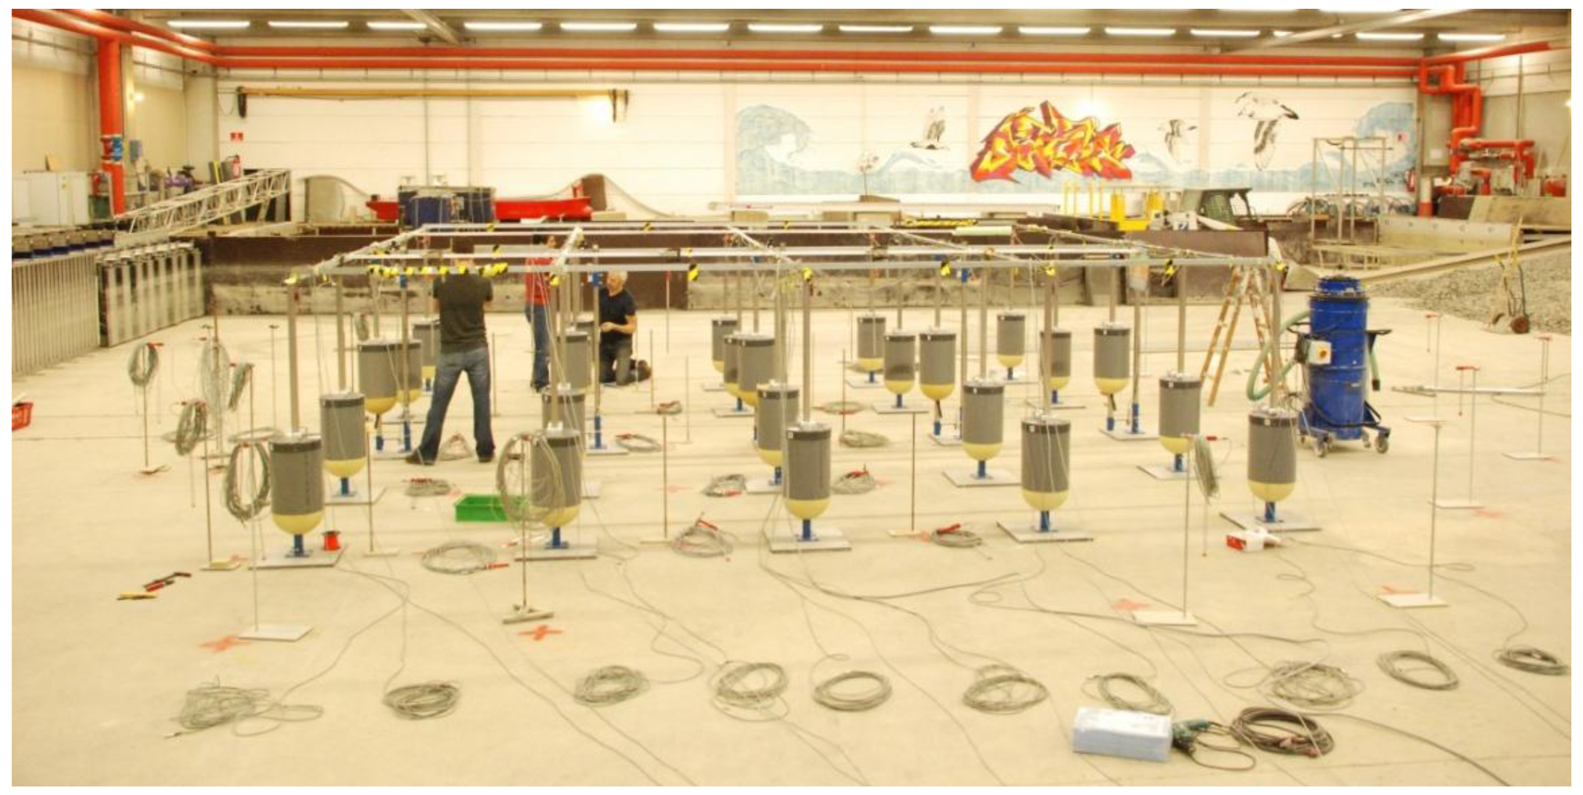
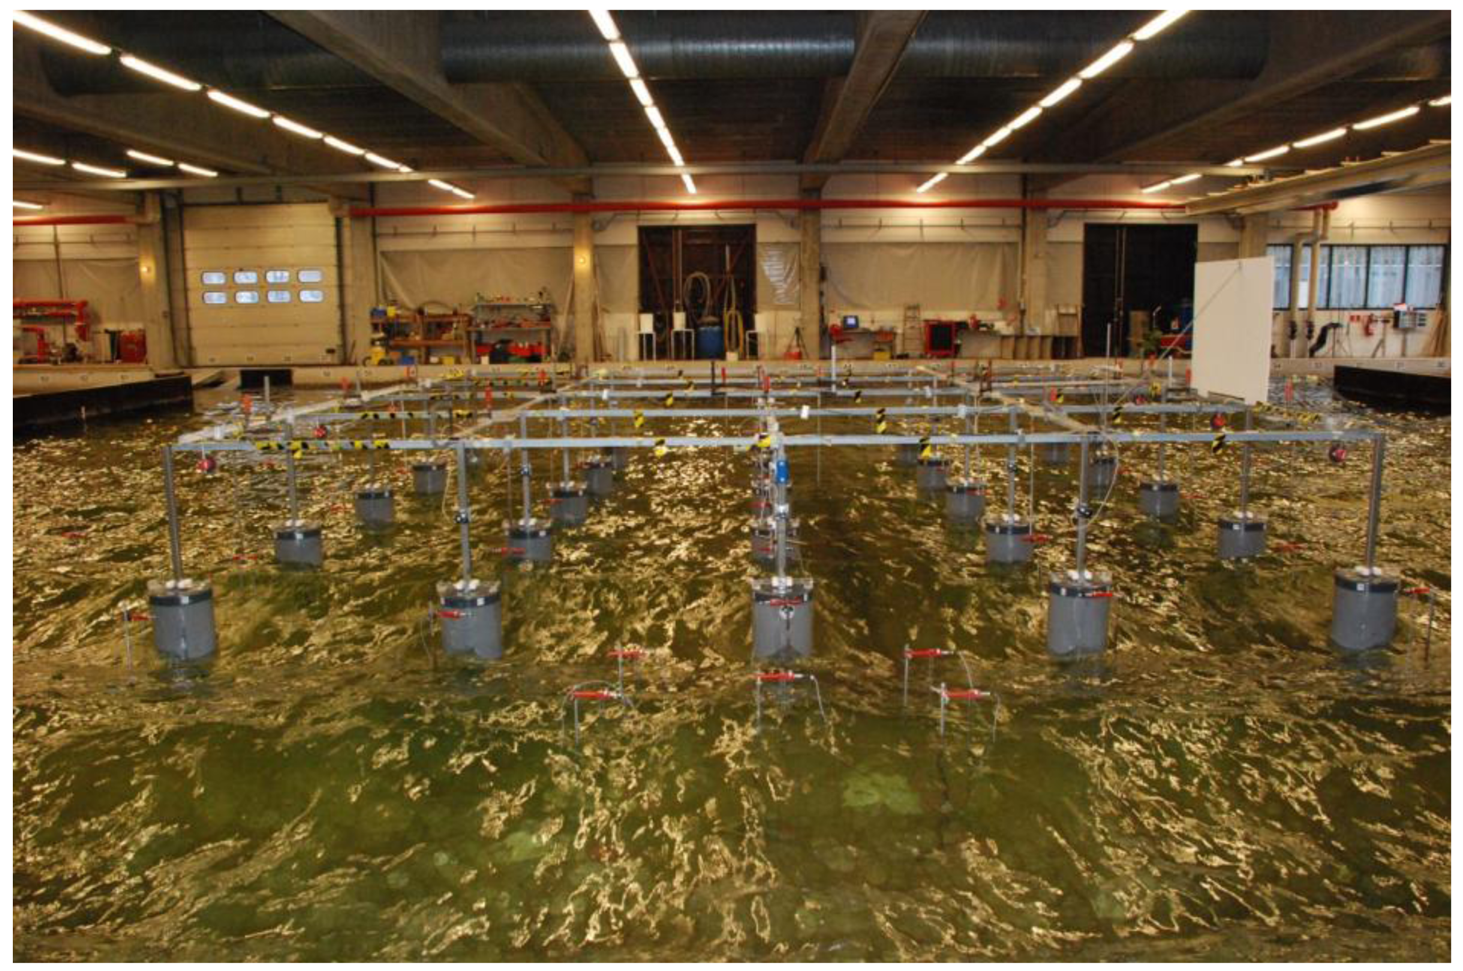
One of the WECwakes project objectives is to study the effect of WEC arrays on the wave field. In this paper, the wave field modifications due to wave energy extraction and the WECs' motion have been quantified, around a 5 × 5-WEC rectilinear array. An illustration of the WEC array during experiments in the DHI wave basin, is shown in Figure 14.
Irregular long-crested and short-crested waves (s = 10) waves, defined by JONSWAP spectra with target significant wave height Hm0 = 0.104 m and Tp = 1.26 s are analysed to separate the following contributing wave field components: (i) the diffracted wave field due to stationary WEC units; and (ii) the radiated wave field due to oscillation of the WEC units under incident wave field.
To measure the combined incident and diffracted wave field, all 25 WEC units are held stationary at mean draft, dbuoy = 0.315 m. To measure the combined incident-diffracted-radiated wave field (or else the “perturbed” wave field) due to the response of the WECs, damping has been applied through the PTO-system (with dx = 30.4 mm spring compression increment used on each WEC unit) and through the shaft bearings. The diffracted wave field is then calculated as the difference between the wave field measured around stationary WEC units and the incident wave field. The radiated wave field is calculated as the difference between the measured perturbed wave field and the diffracted wave field. The radiated wave field includes radiated waves that are subsequently diffracted, and it also accounts for the absorption effects at the WEC units.
The following difference percentage terms are defined and plotted in Figure 15 for the 5 × 5-WEC rectilinear array:
- (a)
wave diffraction around stationary WEC units. For quantifying the diffraction effect, the recorded undisturbed wave field when no WECs or shafts are present is used to exclude the wave basin effects that develop in the empty wave basin:
- (b)
a variant of Equation (5) showing the difference percentage used for quantifying the effect of the wave diffraction around stationary WEC units relative to the target undisturbed wave field. This variant shows the differences between the recorded and the target undisturbed wave field when no WECs or shafts are present:
- (c)
difference percentage used for quantifying the effect of radiation on the perturbed wave field due to damped response of the WEC units:
- (d)
difference percentage used for quantifying the effect of the heaving WECs under wave action (causing the perturbed wave field), on the recorded undisturbed wave field:
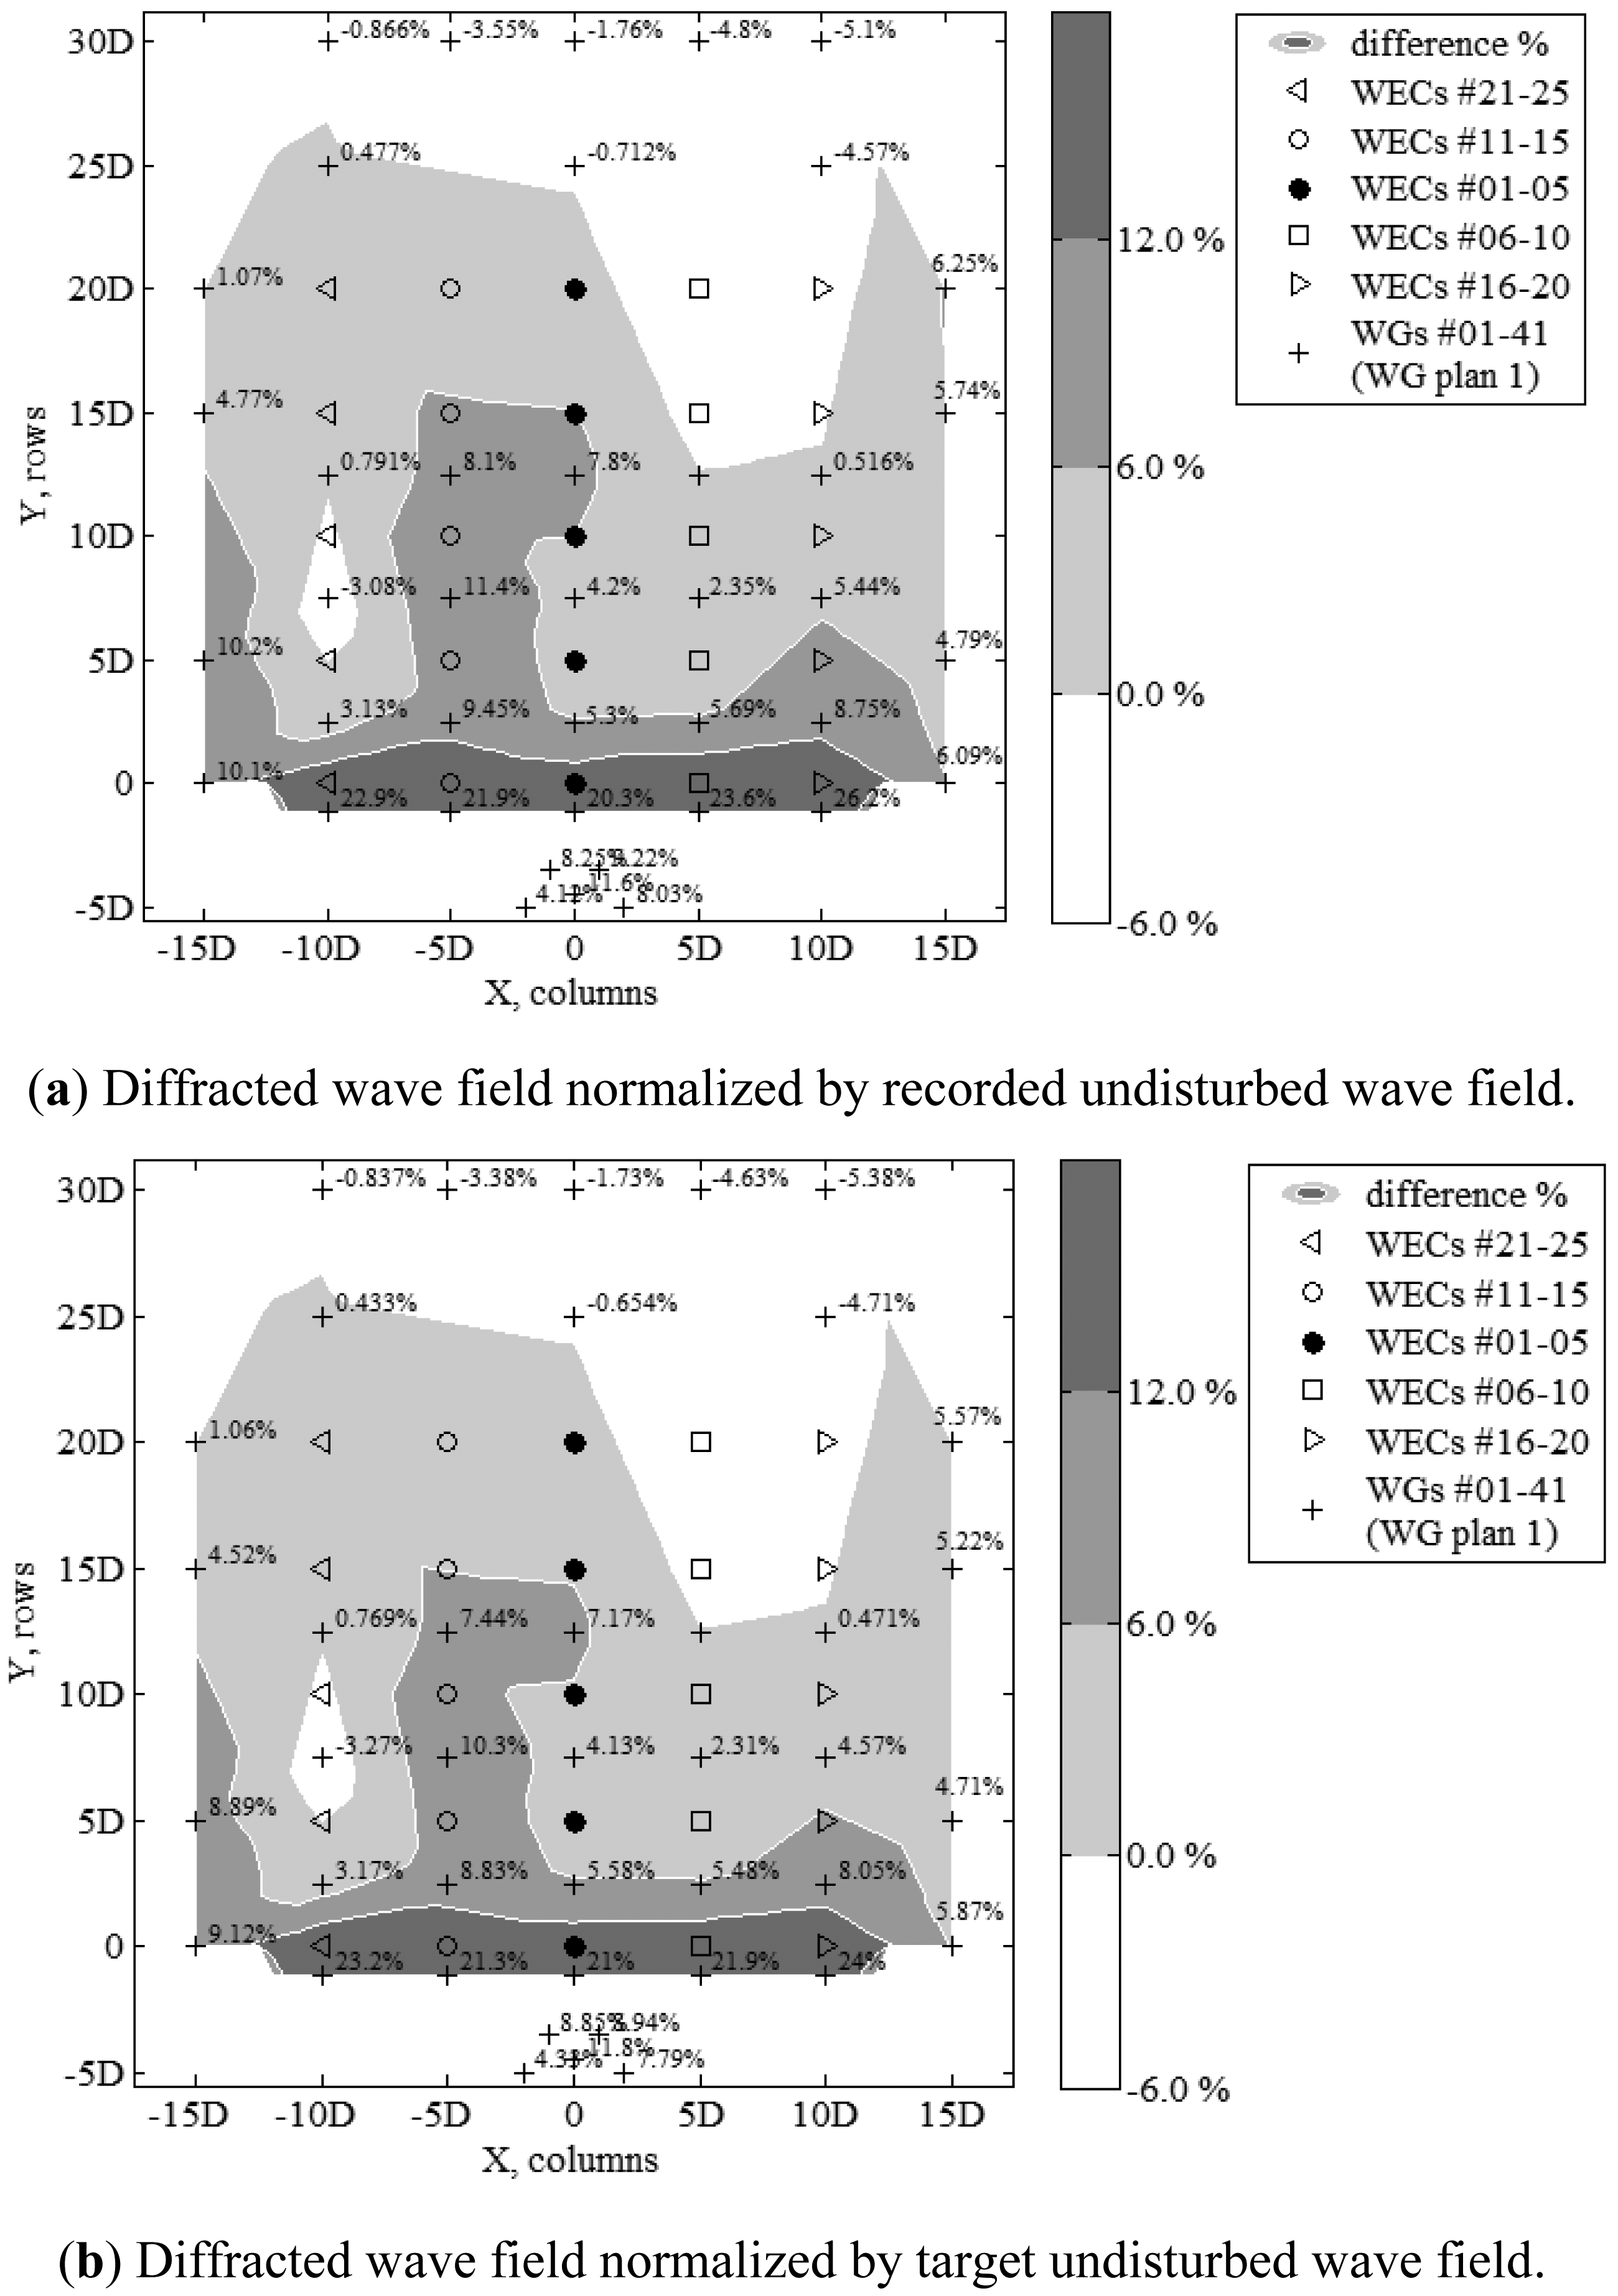
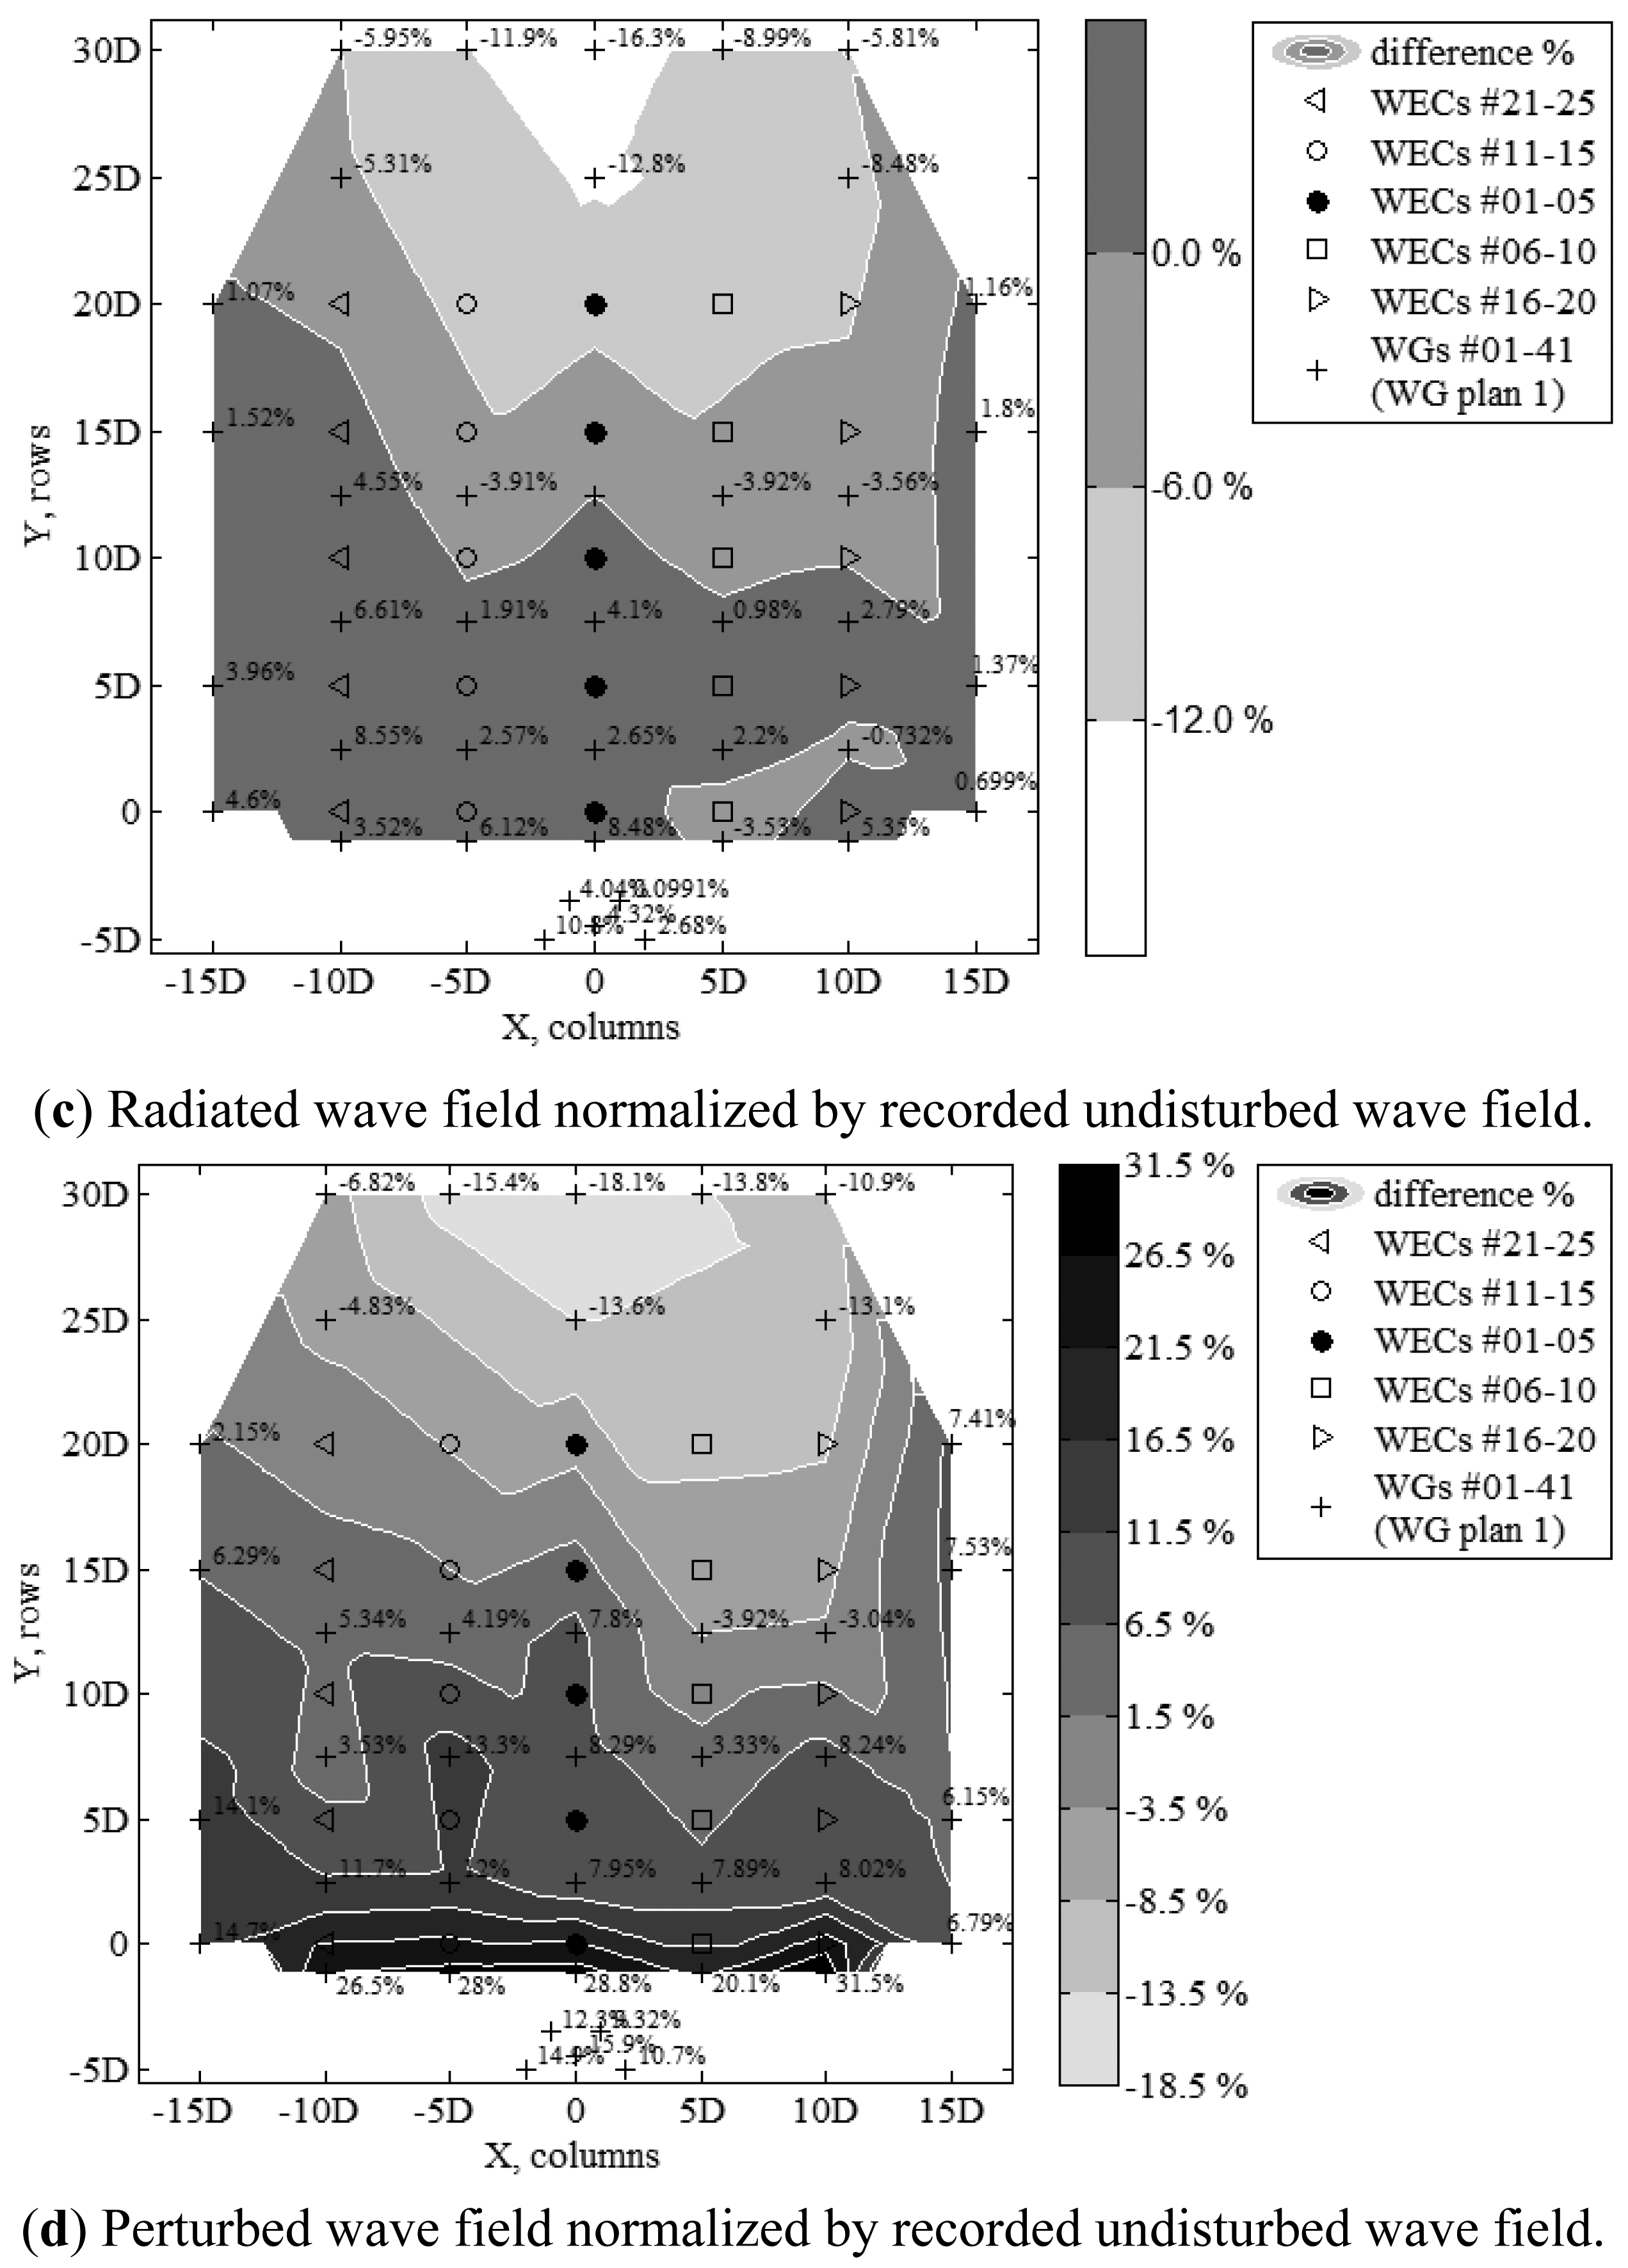
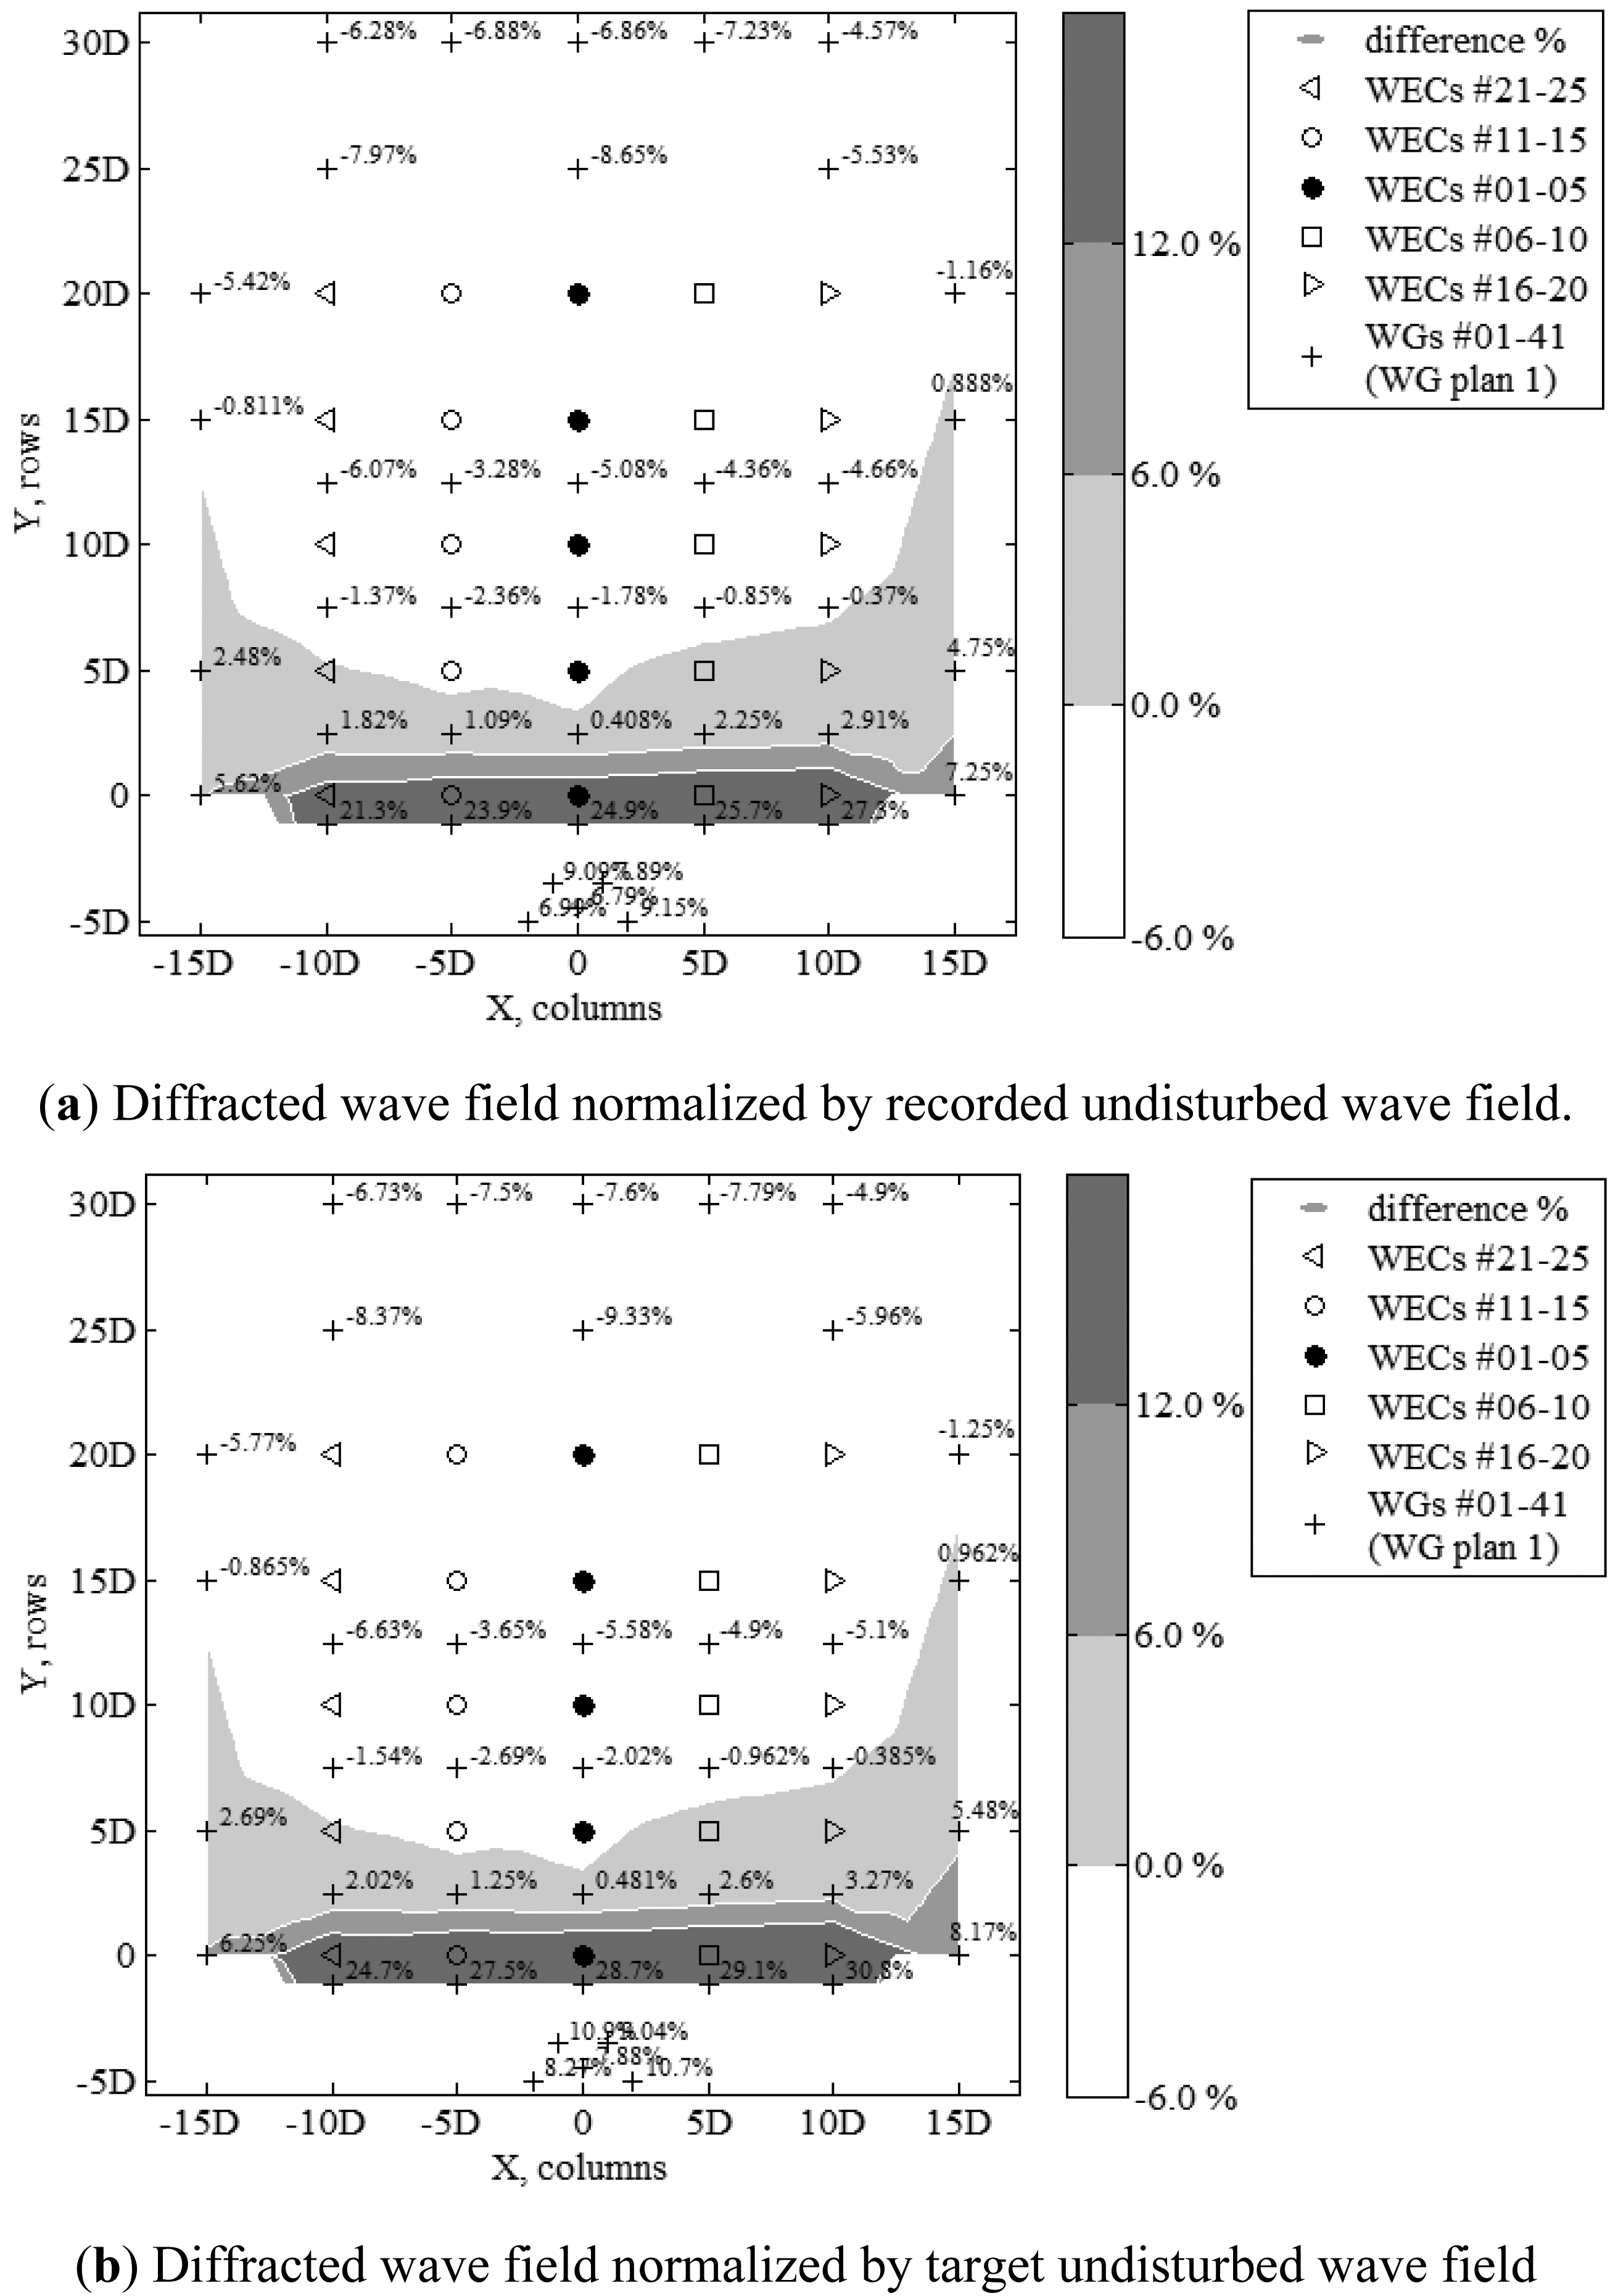
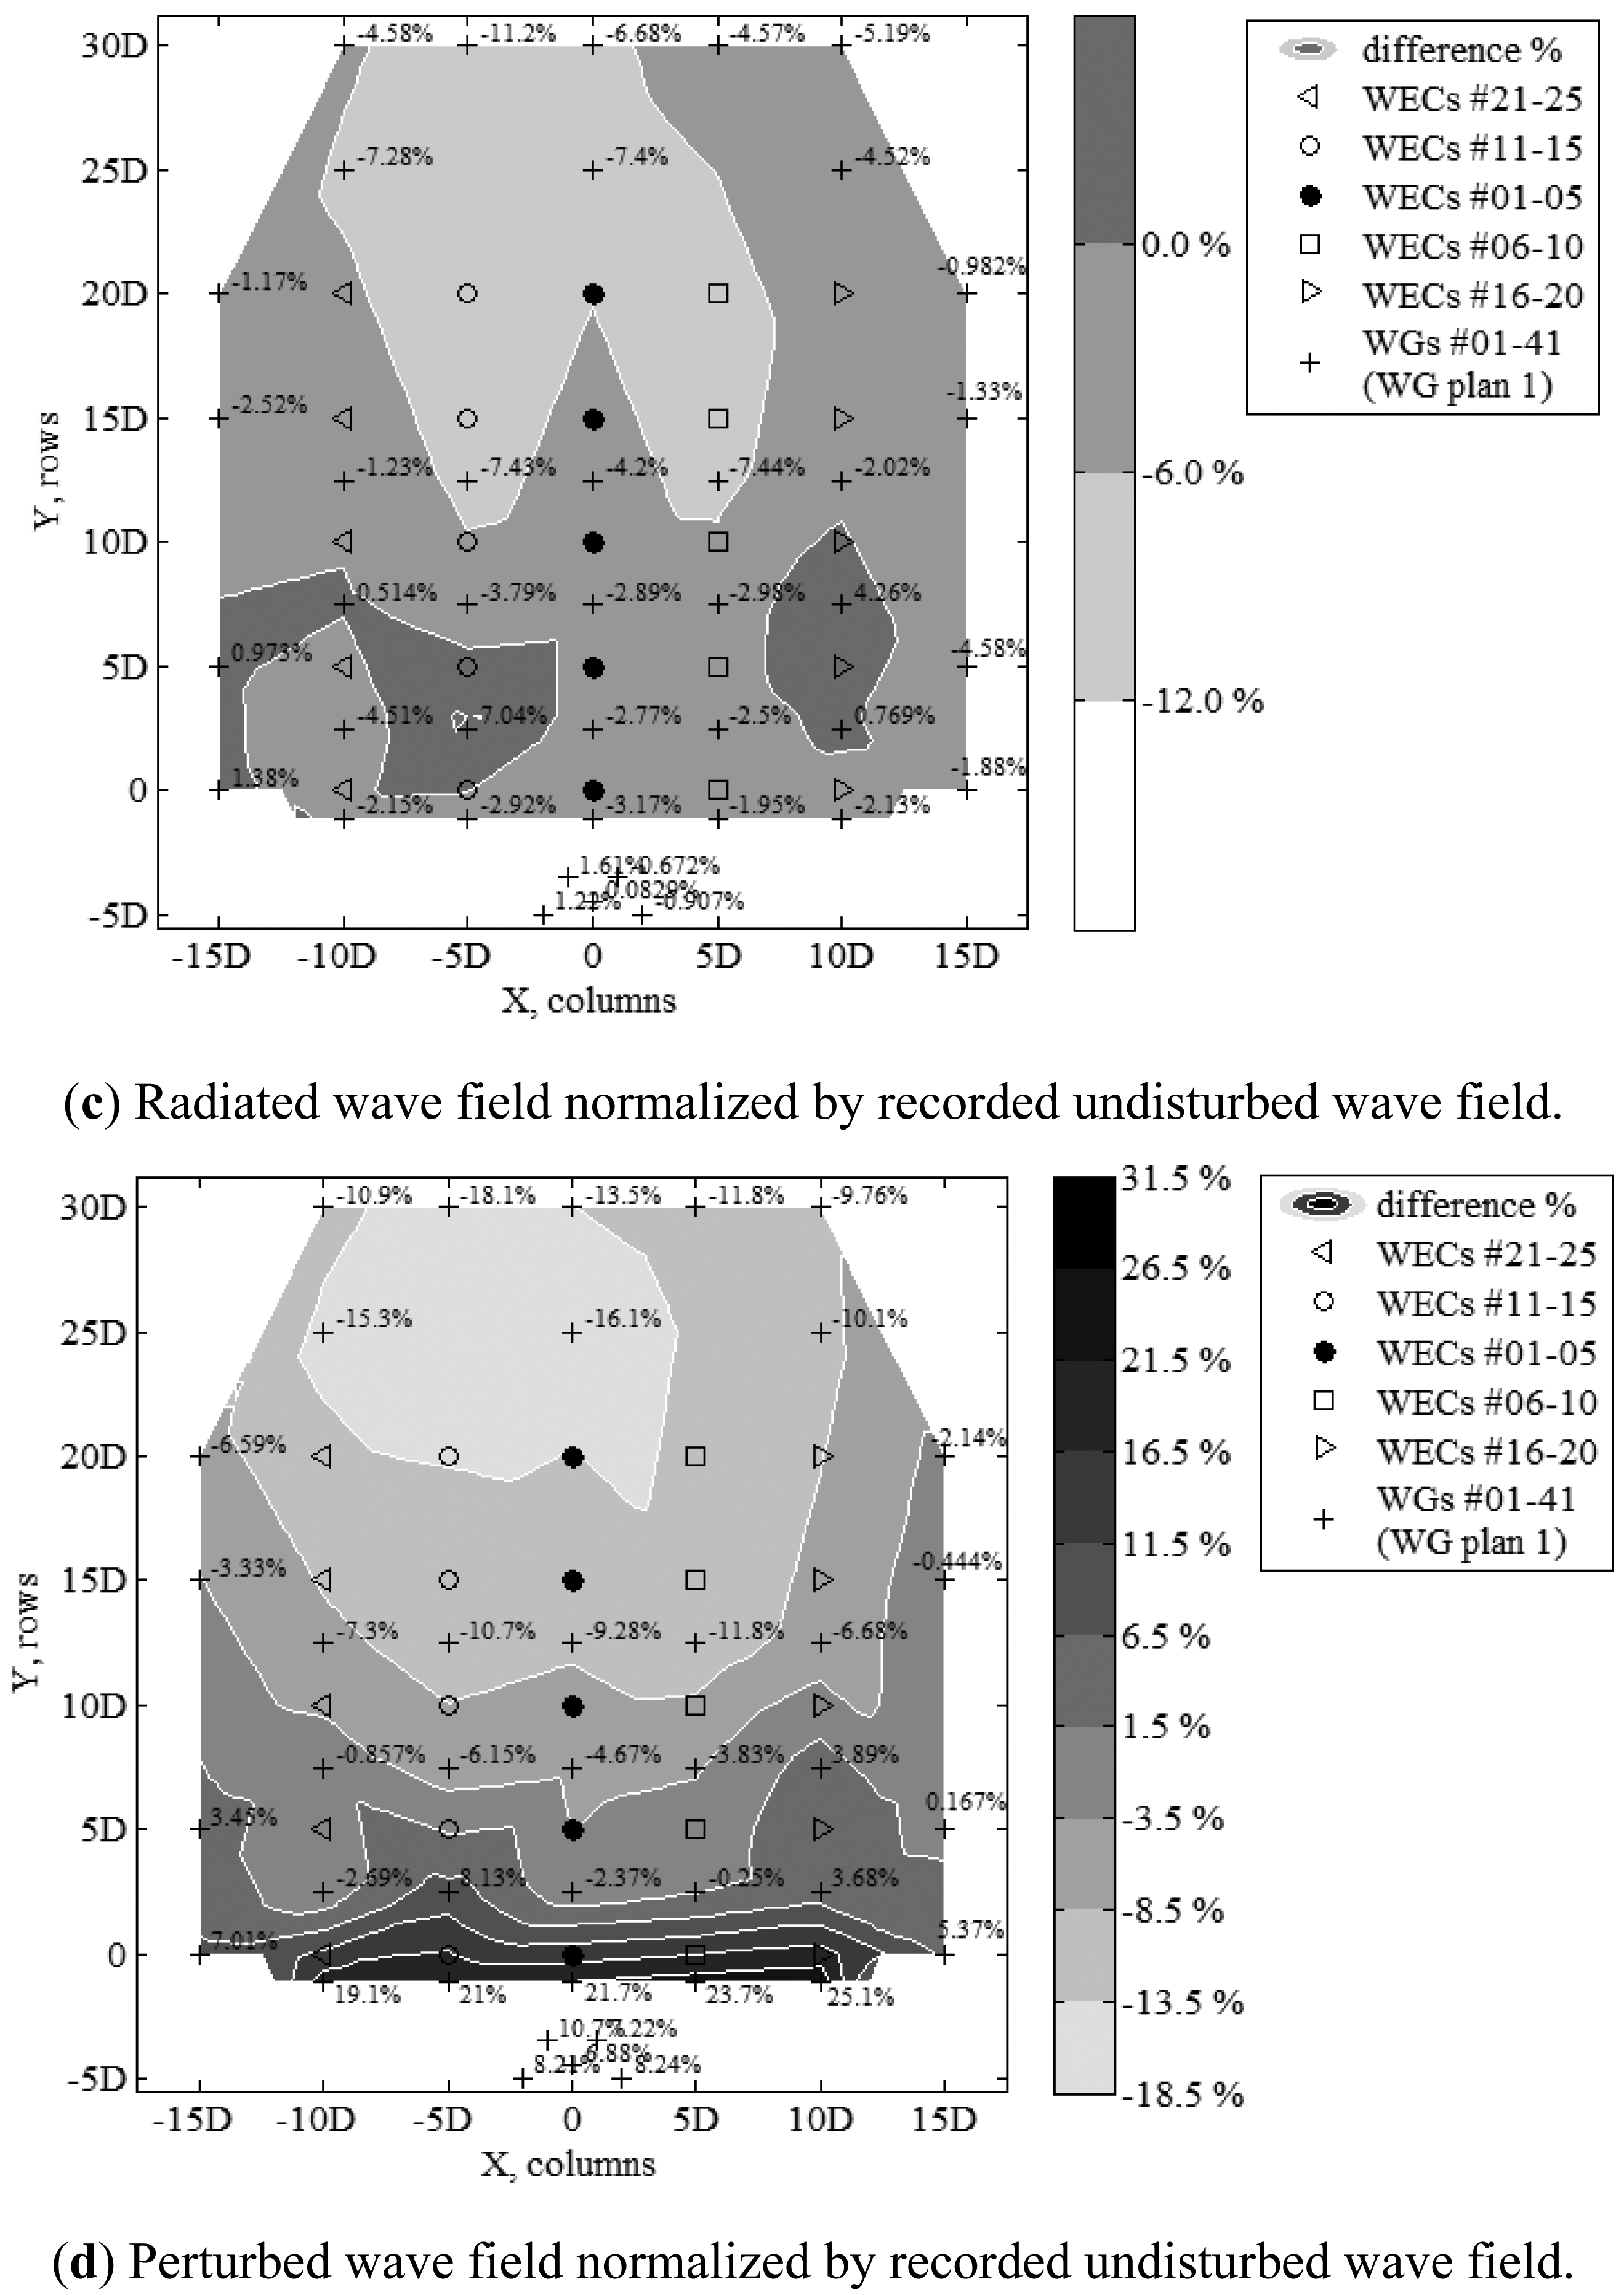
The measured change of the wave field for unidirectional irregular waves, is presented separately for the diffracted (Figure 15a,b), the radiated (Figure 15c) and the perturbed (Figure 15d) wave field. Similarly, Figure 16a,d presents the wave fields for the short-crested waves with spreading parameter, s = 10. Note that in Figures 15a,b and 16a,b, the difference percentages are positive, when diffraction effects around the stationary WEC units increase the incident wave field heights compared to the undisturbed incident wave field when no WECs are present. Also in Figures 15c and 16c, the difference percentages are positive, when radiation effects due to the WECs response increase the perturbed wave field heights, compared to the combined incident and diffracted wave field. Moreover in Figures 15d and 16d, the difference percentages are positive, when the effect of the heaving WECs under wave action causes increase of the perturbed wave field heights, compared to the undisturbed incident wave field.
On the other hand, negative difference percentages indicate a decrease of the diffracted wave field component (Figures 15a,b and 16a,b) compared to the undisturbed incident wave field, and that radiation effects (Figures 15c and 16c) decrease the perturbed wave field heights, compared to the combined incident and diffracted wave field. In Figures 15d and 16d, negative difference percentages indicate wave height attenuation caused by the heaving WECs under wave action, compared to the undisturbed incident wave field. The negative differences, therefore, presented in Figures 15d and 16d refer to wave height decrease due to wave power extraction by the WEC units.
For unidirectional waves, up to 5.10% of wave height decrease downwave and 26.20% wave height increase upwave is observed when the 25 WEC units are held stationary at mean draft, dbuoy (Figure 15a). For short-crested waves (s = 10), wave height decrease downwave ranges between 7.23% and 8.65% and the increase upwave reaches 27.30% (Figure 16a). These percentages differ slightly in Figure 15b where the recorded wave heights are normalized by the target wave height H0i (at the same WG locations, 5.38% of wave height decrease downwave and 24.00% wave height increase upwave, respectively). Also for short-crested waves, these percentages show small variation, with the wave height decrease downwave ranging between 7.79% and 9.33% and the increase upwave reaching 30.80% (Figure 16b).
When looking at the effect of the WECs on the wave field due to radiation only, for long-crested waves (Figure 15c) approximately 16.30% wave height decrease is observed downwave the WEC array and 8.48%–10.80% increase upwave. For short-crested waves (Figure 16c), the effect of radiation is similar downwave the array, where 11.20% wave height decrease is observed. Upwave, the situation is different compared to long-crested waves, as the wave heights decrease by 1.95%–3.17% directly upwave the first row of five WECs. Closer to the wave paddles, again, wave height increase is observed, similarly to the long-crested waves but limited (up to 1.61%).
As presented in Figures 15d and 16d for the perturbed wave field, there is clearly wave height attenuation in the lee of the WEC array due to the operation of the heaving WEC units. Up to 18.10% of wave height decrease is observed downwave (and 31.50% very localised wave height increase upwave the first row of five WECs) when the 25 WECs are operating under long-crested waves. For short-crested waves, the same order of magnitude of wave height decrease is found downwave the array (up to 18.10%). Upwave the first row of five WECs, 25.10% very localised wave height increase is observed similarly to the unidirectional waves, but 6.0% smaller increase.
When comparing long- to short-crested waves, with regard to the extent of WEC array effects, several observations can be made.
Regarding the diffraction effect on the recorded undisturbed wave field (Figures 15a and 16a), the zone where wave height increase is observed for short-crested waves, is very limited compared to the long-crested waves, so that increase stops after the second row of five WECs for directional waves. Consequently, wave height decrease is observed already after the second row of five WECs for short-crested waves, while for long-crested waves this decrease occurs only after a distance of 5D downwave the last row of five WECs. The order of magnitudes of the maximum percentages found for wave height decrease and increase when looking at the same locations/distances upwave or downwave the array, are, nevertheless, very similar for both wave types; i.e., in front of the first row of WECs or within the “CERC 5 WG array” and at locations with coordinates [(−5D, 5D); (10D, 30D)], respectively. Moreover, for both wave types, wave height increase higher than 6.0% is observed within a zone with similar extents, i.e., this zone is limited within the WGs surrounding the first row of five WECs, which are the first WECs facing the incoming waves. As conclusion from the above observations for Figures 15a and 16a, the largest wave field variations between long- and short-crested waves are found between the zone downwave the second row of WECs and at a distance 5D downwave the last row of WECs. This zone of variations between short- and long-crested waves has the same length as the length of the WEC array (20D). The same conclusions can be made when comparing Figures 15b and 16b. Also, note that the differences presented in Figures 15a,b and 16a,b are progressing from positive (wave height increase) to negative (wave height decrease), almost “parallel” to the WEC rows towards the opposite end of the wave basin (landshore).
Regarding the radiation effect on the perturbed wave field due to damped response of the WEC units (Figures 15c and 16c), the zone where wave height increase is observed for short-crested waves, is very limited compared to the long-crested waves. For unidirectional waves this increase is still observed until the WECs of the third row, while wave height decrease starts clearly after the third row of WECs. For both long- and short crested waves, at the outermost sides of the array this decrease is smaller. The order of magnitudes of the maximum percentages found for wave height decrease when looking at the same distances downwave the array, are similar for both wave types; e.g., at the location with coordinates (−5D, 30D). Moreover, after the last row of WECs, the patterns of wave height decrease are similar for the two sea states and variations become higher than −6.00%. As conclusion from the above observations for Figures 15c and 16c, the largest wave field variations between long- and short-crested waves are found for the zone upwave the third row of WECs. Also, note that the differences presented in Figures 15c and 16c are progressing from positive (wave height increase) to negative (wave height decrease) towards the opposite end of the wave basin (landshore), with a diagonal pattern towards the WEC columns located at the sides of the WEC array.
Regarding the effect on the recorded undisturbed wave field caused by the perturbed wave field around the WEC array (Figures 15d and 16d), the zone where wave height increase is observed for short-crested waves, is very limited compared to the long-crested waves, so that increase stops downwave the first row of five WECs for directional waves. Consequently, wave height decrease is observed already after the first row of WECs for short-crested waves, while for long-crested waves this decrease occurs only after the third row of five WECs. The order of magnitudes of the maximum percentages found for wave height decrease and increase when looking at the same locations/distances upwave or downwave the array, are, nevertheless, very similar for both wave types; i.e., in front of the first row of WECs or within the “CERC 5 WG array” and at locations with coordinates [(−5D, 5D); (10D, 30D)], respectively. Moreover, for both wave types, wave height increase higher than 12.10% is observed within a zone with similar extents, i.e., this zone is limited to the WGs in front of the first row of five WECs, which are the first WECs facing the incoming waves. As conclusion from the above observations for Figures 15d and 16d, the largest wave field variations between long- and short-crested waves are found between the zone downwave the first row of WECs and at a distance 5D downwave the last row of WECs. This zone of variations between short- and long-crested waves has a length of 25D. Also, note that the differences presented in Figures 15d and 16d for wave height increase between 8.00% and 31.50% are progressing, almost “parallel” to the first WEC row towards the opposite end of the wave basin (landshore). When wave height attenuation starts to take over, the pattern of the differences for both sea states becomes diagonal towards the WEC columns located at the sides of the WEC array.
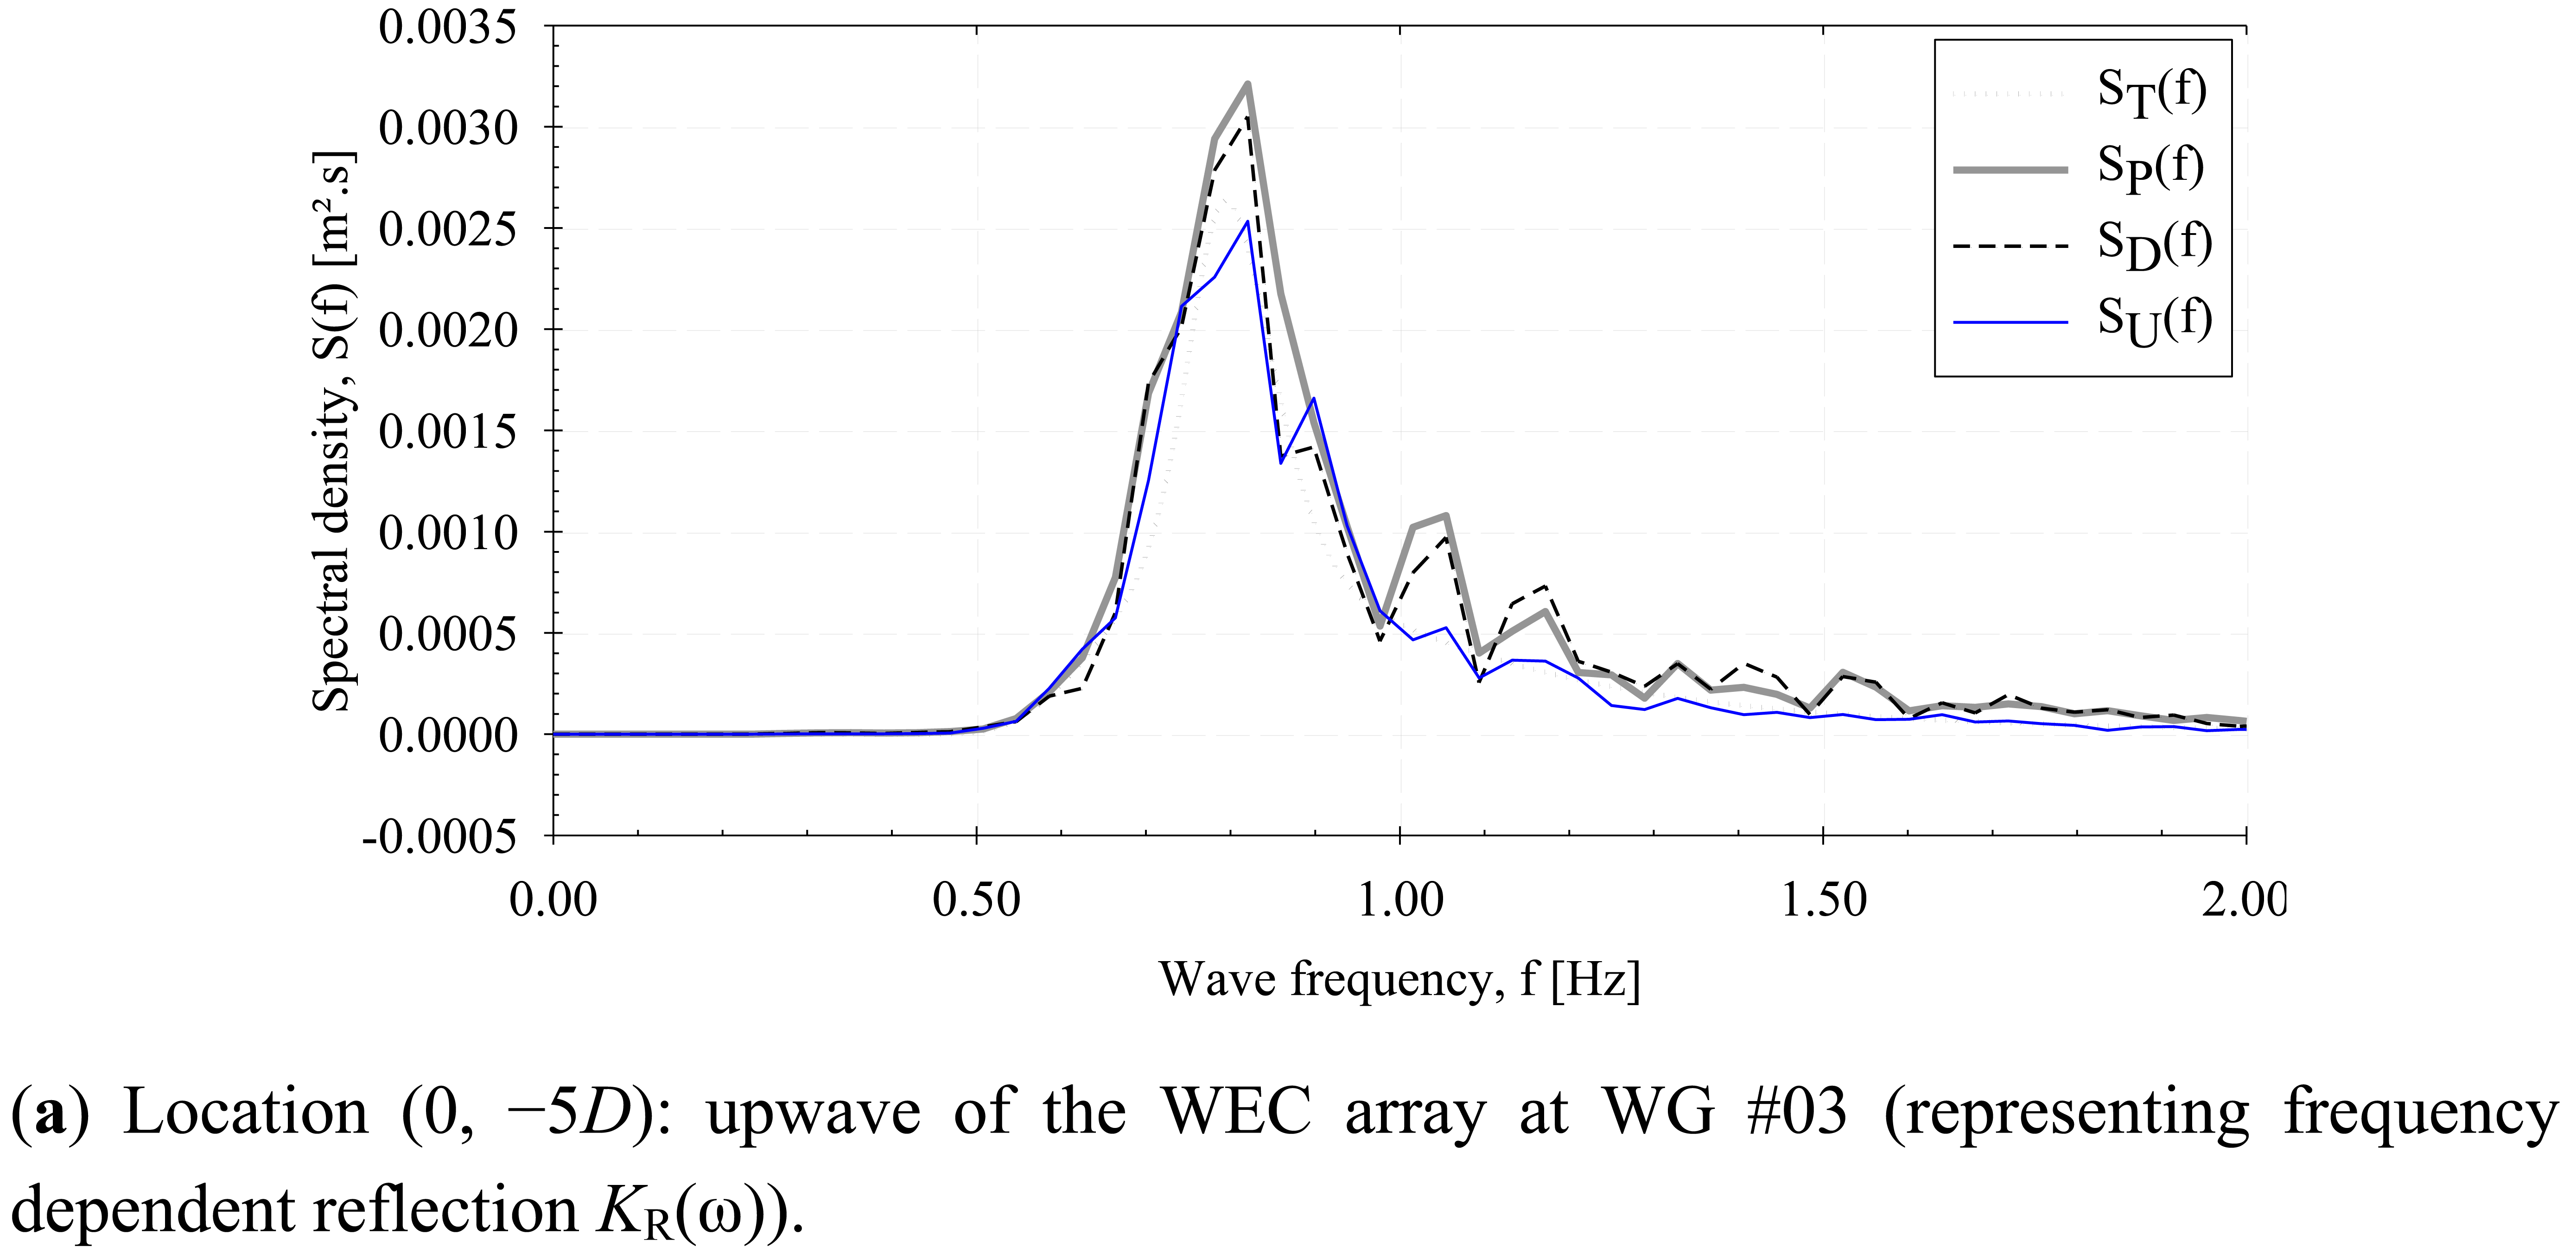
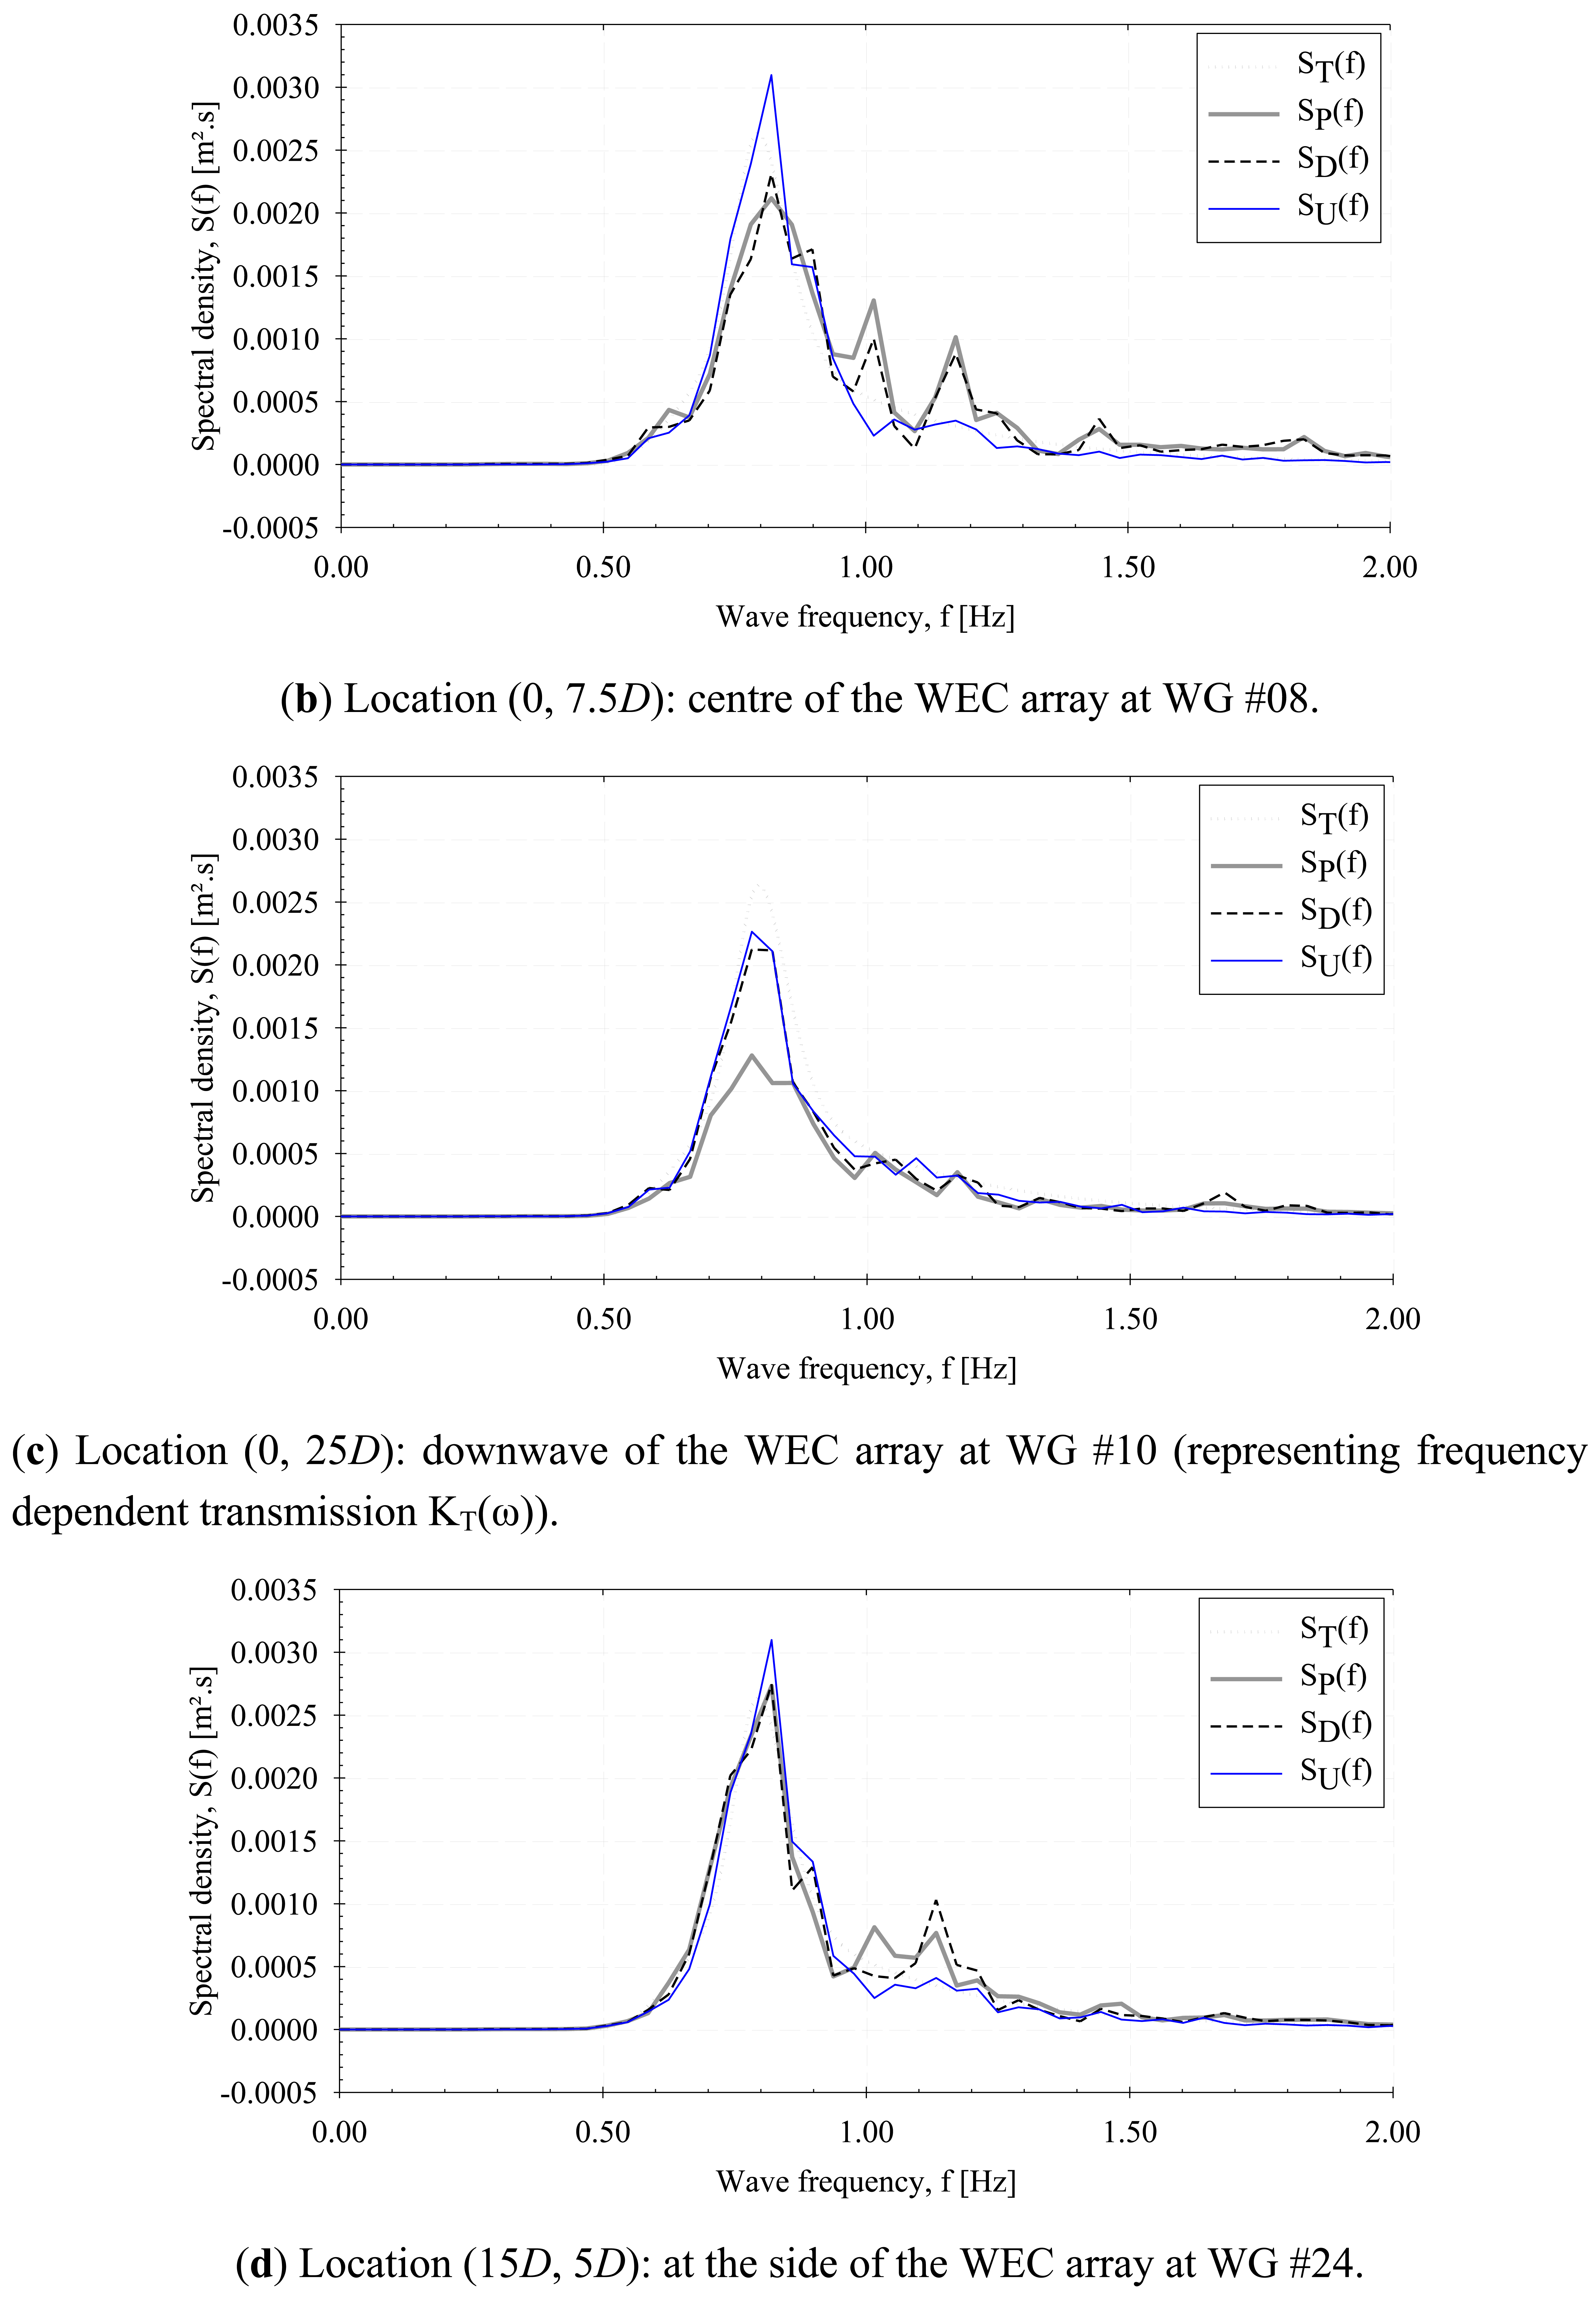
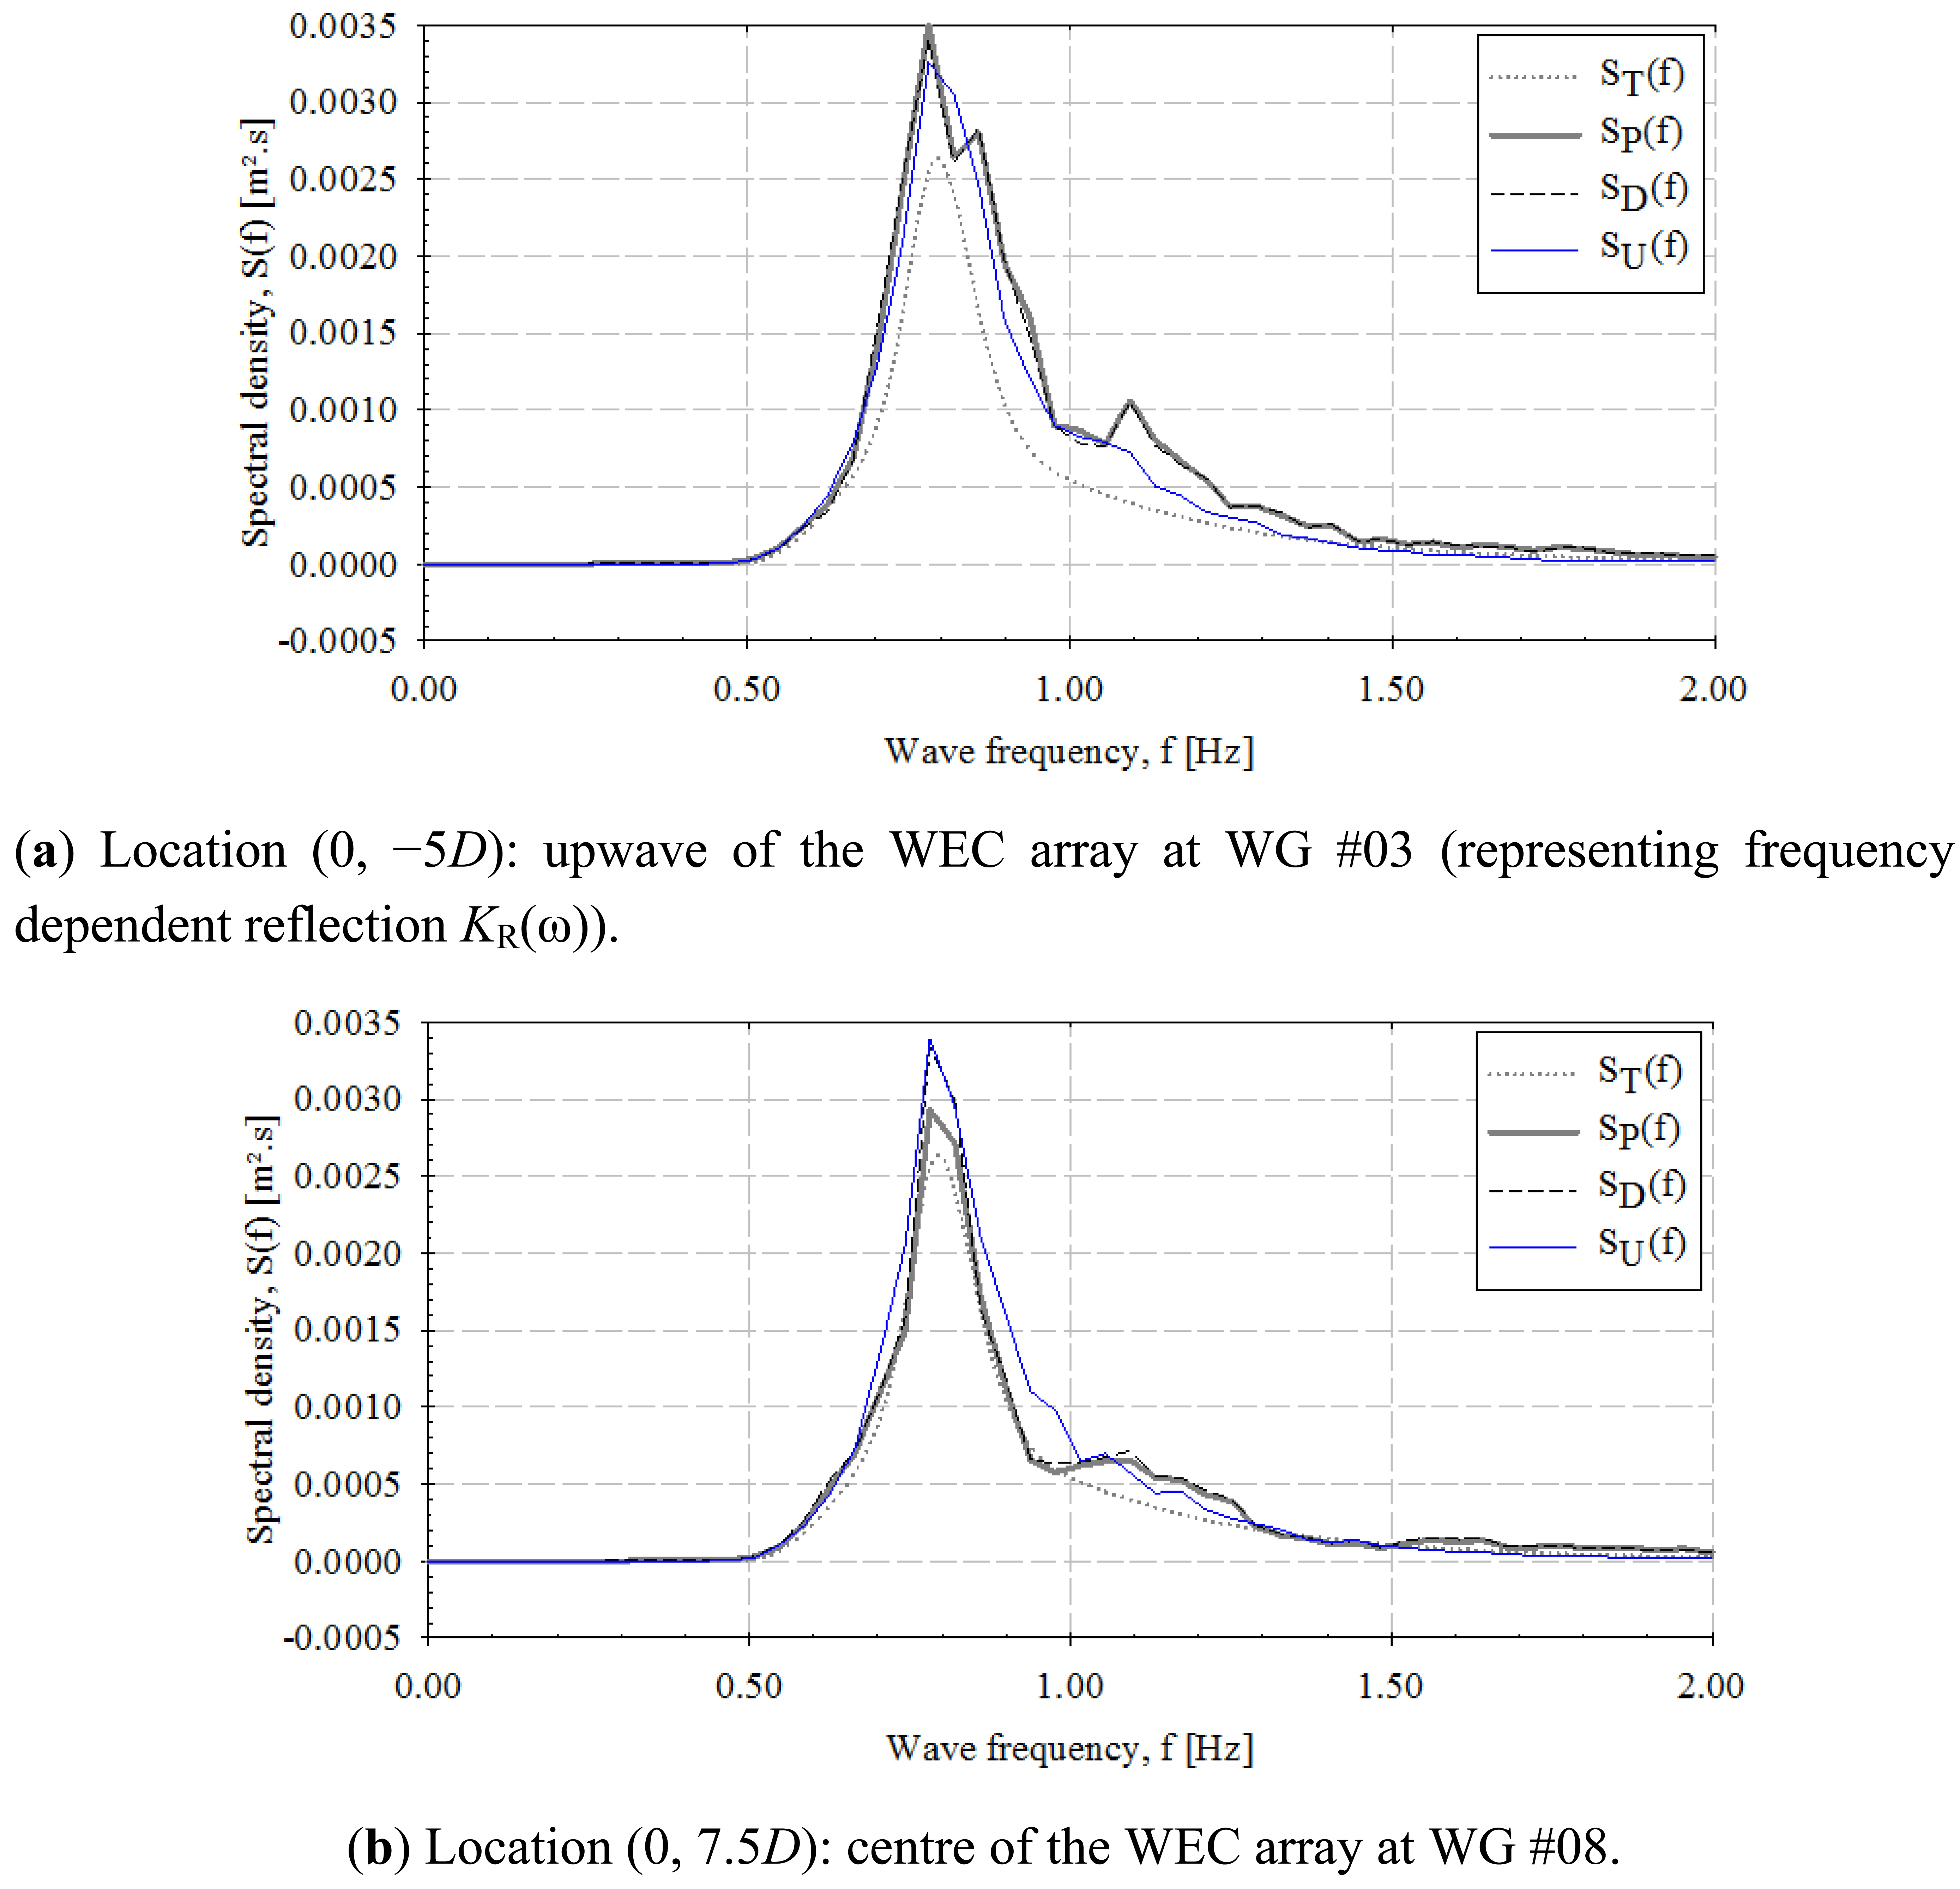
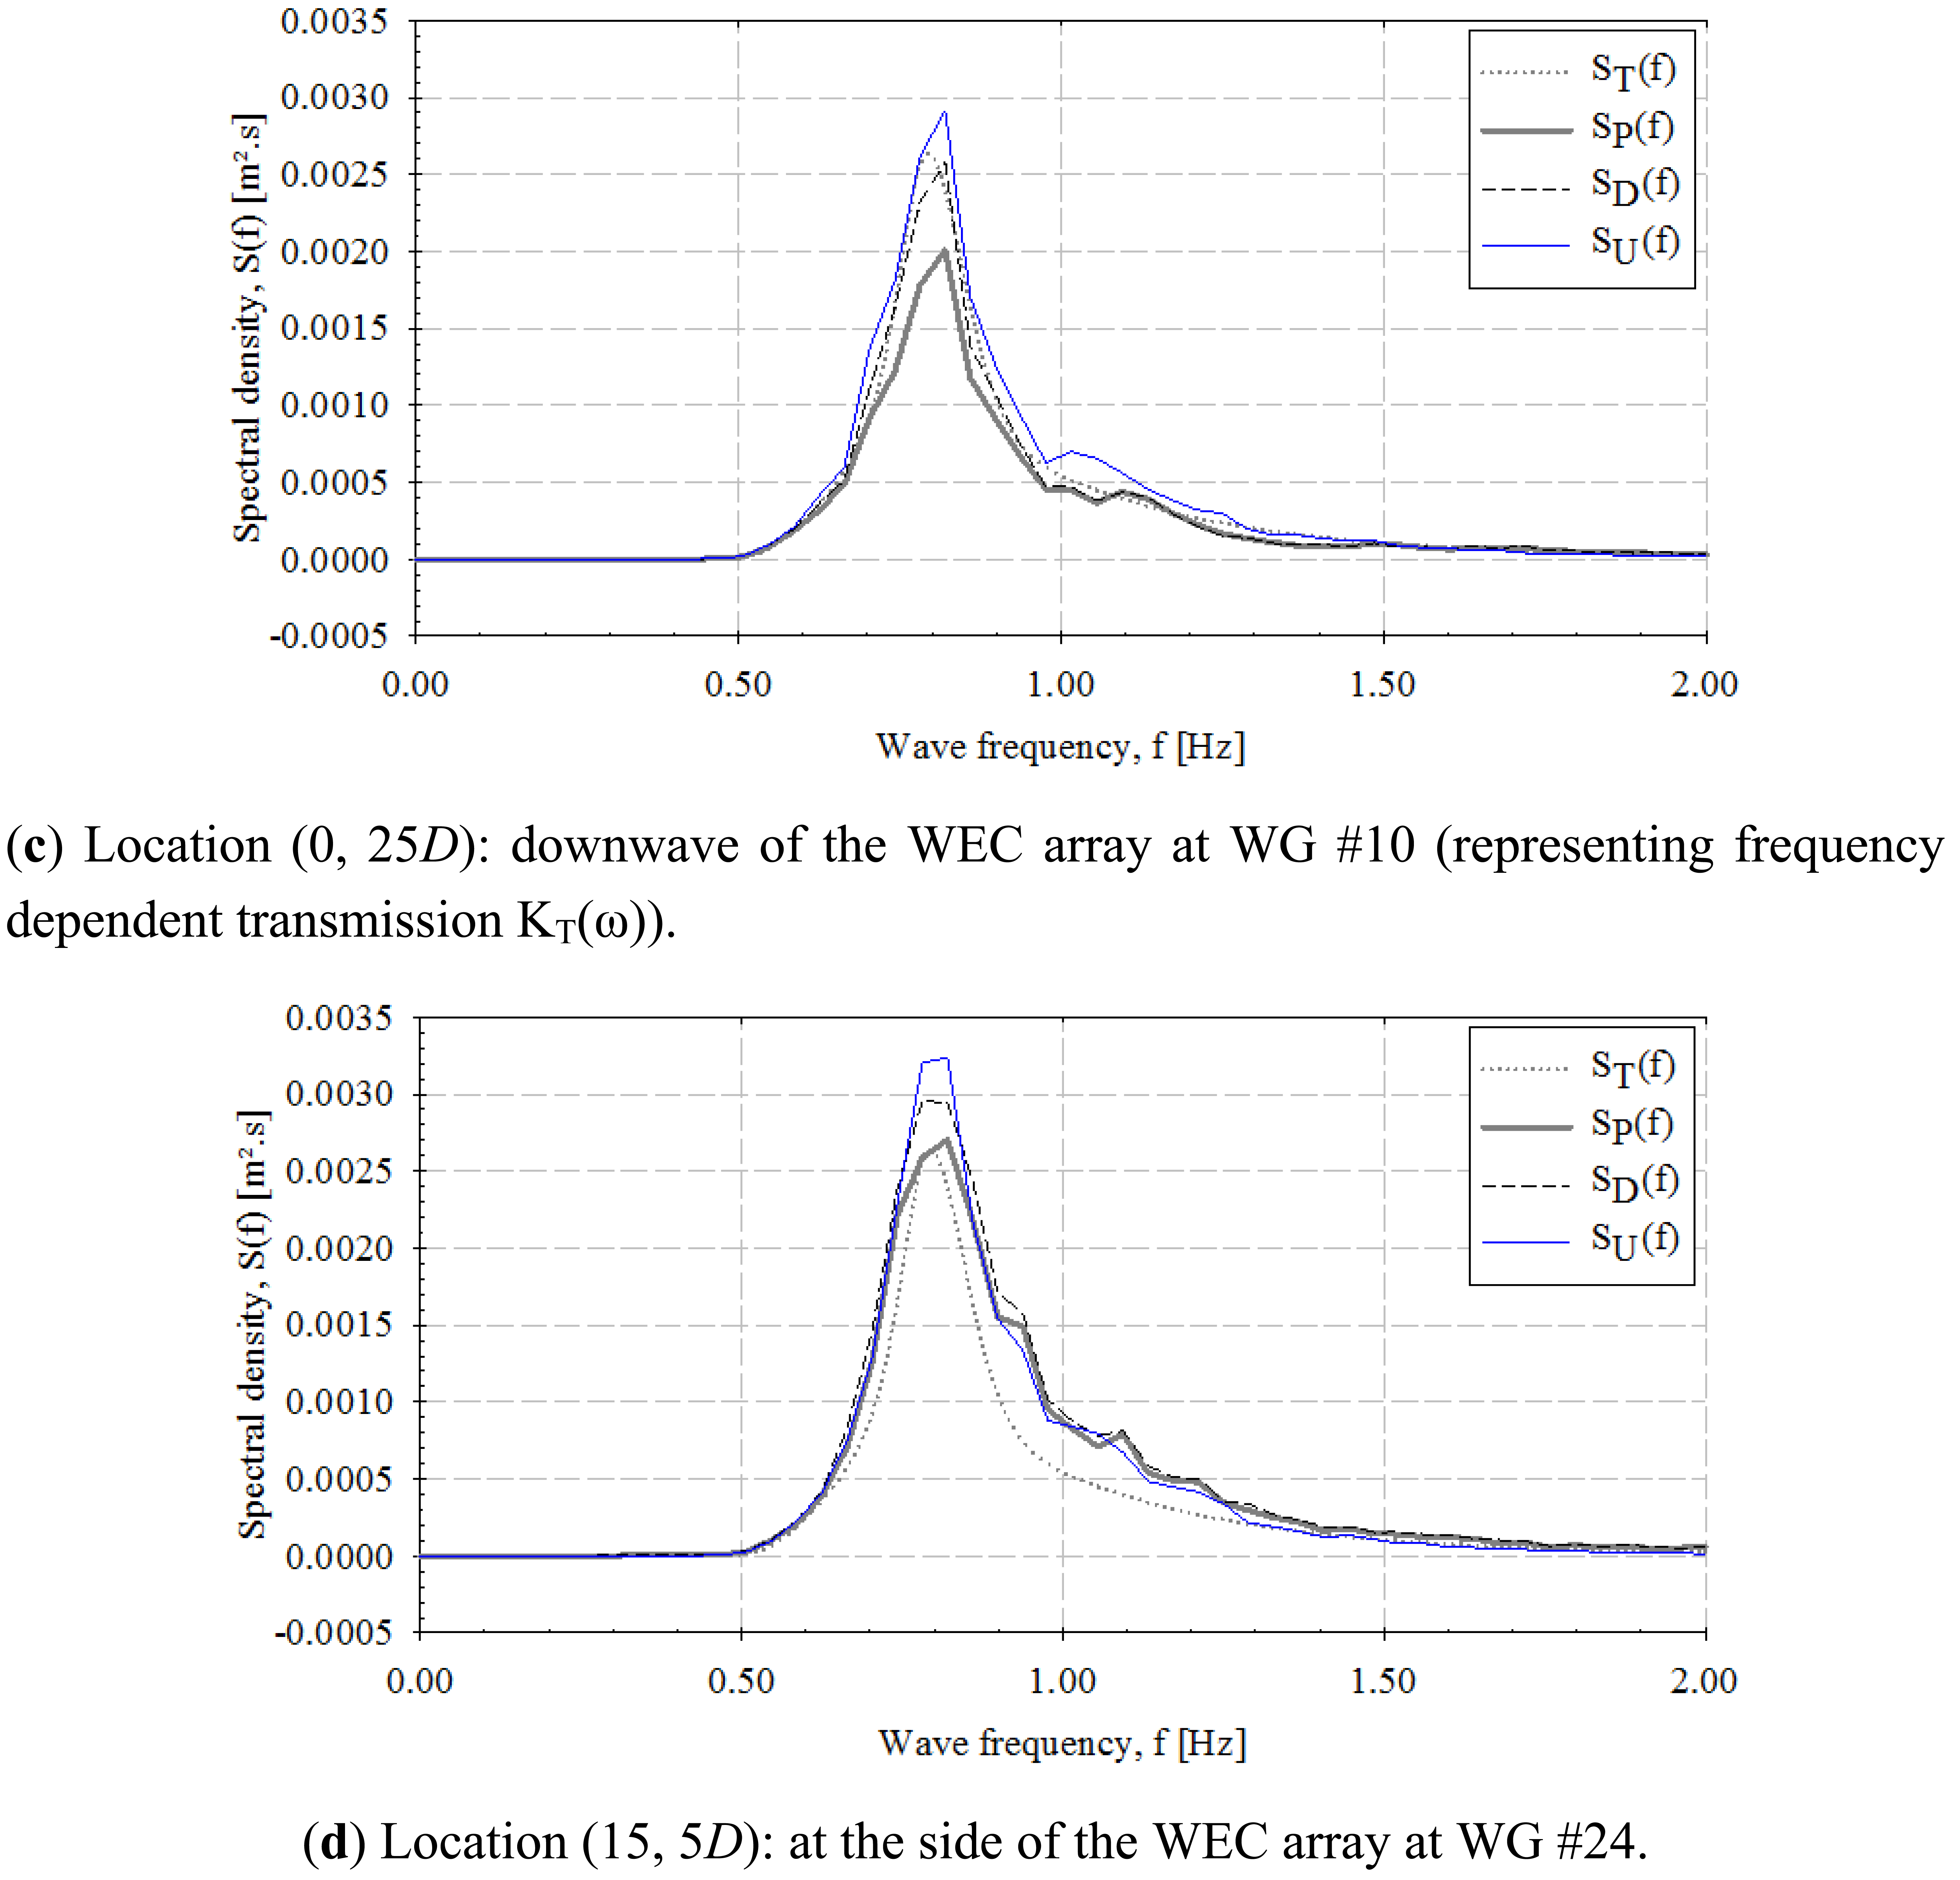
In Figure 17, for long-crested waves, and Figure 18, for short-crested waves, the wave spectra are plotted for various locations around the WEC array for the recorded undisturbed wave field (no WECs are present), the diffracted wave field around stationary WEC units, the perturbed wave field due to responding WEC units and for the target undisturbed wave field, respectively. The locations considered are: (0, −5D) upwave of the WEC array at WG #03, (0, 7.5D) at the centre of the WEC array at WG #08, (0, 25D) downwave of the WEC array at WG #10, and (15D, 5D) at the side of the WEC array at WG #24. The change of Hm0 at these locations is as shown in Figures 15 and 16.
Therefore, spectra of the target (or else the “theoretical”) wave field, ST(f), the recorded undisturbed wave field, SU(f), the diffracted wave field only, SD(f), and the perturbed wave field, SP(f), are presented. SD(f) is very similar to SP(f), showing low impact of the radiated wave field on the resulting perturbed wave spectra upwave (Figures 17a and 18a), especially for short-crested waves. The same conclusion can be drawn for the location given at the centre of the WEC array in Figures 17b and 18b. Downwave the WEC array (Figures 17c and 18c), diffracted and undisturbed wave spectra are similar, especially for long-crested waves, so nearly all of the transmitted wave change is due to radiation at this specific location. At the side of the WEC array, the recorded undisturbed wave field and the perturbed wave field spectra do not show large variations, showing limited effect of the WEC units on the resulting perturbed wave field at that location. Moreover, downwave the WEC array (at WG #10) a clear wave spectrum attenuation is observed when comparing the perturbed to the recorded undisturbed wave field spectrum, for both sea states.
6. Conclusions
Experiments have been performed in a large wave basin with wave energy converter arrays of different geometric configurations and for varying wave conditions. Wave elevations, the WECs' heave displacement and wave induced surge forces on the WECs have been simultaneously measured.
The results presented in this paper concern a set of long- and short crested wave conditions and show wave field variation of the generated waves in an empty wave basin, the effect of the structures used for supporting the WECs and the wave field modifications caused by a 5 × 5-WEC rectilinear array. The accuracy of the generated wave fields is evaluated and the effect of the support structures is confirmed to be small.
Regarding the wave field modifications caused by the presented WEC array configuration, the measured change of the wave field compared to the undisturbed wave field, is presented separately for the diffracted, the radiated and the perturbed wave field around the WECs.
There is clearly wave height attenuation in the lee of the WEC array due to the heaving WECs which extract energy from the waves. Up to 18.10% of wave height decrease is observed downwave the array when the 25 WECs are operating, for both long- and short-crested waves.
However, the pattern of wave height attenuation within the WEC array differs for the two presented sea states. For short-crested wind waves (spreading parameter s = 10), wave height decrease is observed already after the first row of five WECs, while for long-crested waves this decrease occurs only after the third row of five WECs.
The results for wave height attenuation found downwave the WEC array can be further used for estimating the coastline evolution due to the presence of a WEC array, i.e., by applying traditional formulae predicting the long-shore sediment transport and erosion or accretion, based on wave height parameters, e.g., as performed by Mendoza et al. in [32], and Nørgaard and Lykke Andersen in [33].
The data obtained from these experimental tests will be very useful to validate and extend a large range of numerical models used to model response, power absorption and wave field modifications due to oscillating WECs. Validation of such models will enable optimization of the geometrical layout of WEC arrays for real applications and will therefore enable reduction of the cost of energy from wave energy systems.
Most importantly, the “WECwakes” database is comprehensive, and is applicable not only to WEC arrays but also to floating structures/platforms, stationary cylinders under wave action, etc., for understanding of e.g., wave impact on the cylinders and wave field modifications around them.
It has been shown that: (i) large-scale experiments have been performed with large WEC arrays composed of up to 25 WECs; (ii) within the “WECwakes” project, a comprehensive WEC array database for heaving WECs has been created in which wave elevations, WEC response and wave induced surge forces on the WECs have been simultaneously measured. The “WECwakes” database comprises a wide range of parameter variations such as: the array geometric configuration, the WEC number, the lateral and longitudinal (centre-to-centre) spacing between the WECs, the WECs' motion (decay motion, stationary WECs, free response or damped motion of WECs with varying damping), wave conditions (varying wave period, wave heights, wave attack angles) and wave types (regular, polychromatic, irregular long- and short-crested with varying spreading parameters); and (iii) a large rectilinear array of 25 WECs is shown to have significant effect on the resulting wave field downwave the WEC array, which can influence neighbouring activities in the sea, coastal eco-systems and even the coastline and the coastal defence conditions and parameters, for real wave energy applications.
Acknowledgments
The WECwakes project is funded by the EU FP7 HYDRALAB IV programme (contract no. 261520). The project is a consortium of the seven European partners represented by authors 1 to 8 and coordinated by Ghent University-Belgium (Peter Troch; Vasiliki Stratigaki). The project team would also like to thank the staff of DHI (including Jens Kirkegaard) for their support and the researchers from all partners institutions involved with conduct of the experiments.
In addition, the authors would like to acknowledge the Queen's Marine Laboratory—QML (N. Ireland, UK), Flanders Hydraulics Research (Antwerp, Belgium), and Ghent University (Ghent, Belgium-Department of Civil Engineering (wave flume) and Department of Materials Science and Engineering (tensile testing machine) for providing their experimental facilities for tests with WEC models, during the preparatory phase of the WECwakes research project. We would also like to acknowledge The Structural Design of Wave Energy Devices project (SDWED).
The construction of the WEC models at the workshop of Ghent University has been funded by the Research Foundation Flanders (FWO)-Contract Number FWO-KAN-15 23 712 N.
Finally, the first author would like to acknowledge her Ph.D. funding grant by the Research Foundation Flanders, Belgium (FWO).
Conflicts of Interest
The authors declare no conflict of interest.
References
- Beels, C.; Troch, P.; Kofoed, J.P.; Frigaard, P.; Vindahl Kringelum, J.; Carsten Kromann, P.; Heyman Donovan, M.; De Rouck, J.; De Backer, G. A methodology for production and cost assessment of a farm of wave energy converters. Renew. Energy 2010, 36, 3402–3416. [Google Scholar]
- Troch, P.; Beels, C.; De Rouck, J.; De Backer, G. Wake Effects Behind a Farm of Wave Energy Converters for Irregular Long-Crested and Short-Crested Waves. Proceedings of the International Conference on Coastal Engineering, Shanghai, China, 30 June–5 July 2010.
- Child, B.F.M. On the Configuration of Arrays of Floating Wave Energy Converters. Ph.D. Thesis, The University of Edinburgh, Edinburgh, UK, 22 November 2011. [Google Scholar]
- Borgarino, B.; Babarit, A.; Ferrant, P. Impact of wave interactions effects on energy absorption in large arrays of wave energy converters. Ocean Eng. 2012, 41, 79–88. [Google Scholar]
- Babarit, A. On the park effect in arrays of oscillating wave energy converters. Renew. Energy 2013, 58, 68–78. [Google Scholar]
- Folley, M.; Babarit, A.; O' Boyle, L.; Child, B.; Forehand, D.; Silverthorne, K.; Spinneken, J.; Stratigaki, V.; Troch, P. A Review of Numerical Modeling of Wave Energy Converter Arrays. Proceedings of the 31st International Conference on Offshore Mechanics & Arctic Engineering, Rio de Janeiro, Brazil, 10–15 June 2012.
- Li, Y.; Yu, Y.-H. A synthesis of numerical methods for modeling wave energy converter-point absorbers. Renew. Sustain. Energy Rev. 2012, 16, 4352–4364. [Google Scholar]
- Troch, P. MILDwave—A Numerical Model for Propagation and Transformation of Linear Water Waves; Internal Report; Department of Civil Engineering, Ghent University: Zwijnaarde, Belgium, 1998. [Google Scholar]
- Vantorre, M.; Banasiak, R.; Verhoeven, R. Modelling of hydraulic performance and wave energy extraction by a point absorber in heave. Appl. Ocean. Res. 2004, 26, 61–72. [Google Scholar]
- De Backer, G. Hydrodynamic Design Optimization of Wave Energy Converters Consisting of Heaving Point Absorbers. Ph.D. Thesis, Department of Civil Engineering, Ghent University, Zwijnaarde, Belgium, 18 November 2009. [Google Scholar]
- Zanuttigh, B.; Angelelli, E.; Kofoed, J.P. Effects of mooring systems on the performance of a wave activated body energy converter. Renew. Energy 2013, 57, 422–431. [Google Scholar]
- Budal, K.; Falnes, J.; Kyllingstad, A.; Oltedal, G. Experiments with Point Absorbers in Regular Waves. Proceedings of the 1st Symposium on Wave Energy Utilization, Gothenburg, Sweden, 30 October–1 November 1979; pp. 253–282.
- Vantorre, M. Third-Order Potential Theory for Determining the Hydrodynamic Forces on Axisymmetric Floating and Submerged Bodies in a Forced Periodic Heave Motion. Ph.D. Thesis, Ghent University, Zwijnaarde, Belgium, 1985. [Google Scholar]
- Marquis, L.; Kramer, M.; Frigaard, P. First Power Production Figures from the Wave Star Roshage Wave Energy Converter. Proceedings of the 3rd International Conference on Ocean Energy (ICOE-2010), Bilbao, Spain, 6–8 October 2010.
- Thomas, S.; Weller, S.; Stallard, T.J. Float Response within an Array: Numerical and Experimental Comparison. Proceedings of the 2nd International Conference on Ocean Energy (ICOE), Brest, France, 15–17 October 2008.
- Weller, S.D.; Stallard, T.J.; Stansby, P.K. Interaction factors for a rectangular array of heaving floats in irregular waves. IET Renew. Power Gener. 2010, 4, 628–637. [Google Scholar]
- Alexandre, A.; Stallard, T.; Stansby, P.K. Transformation of Wave Spectra across a Line of Wave Devices. Proceedings of the 8th European Wave and Tidal Energy Conference, Uppsala, Sweden, 7–10 September 2009.
- Ashton, I.; Johanning, L.; Linfoot, B. Measurement of the Effect of Power Absorption in the Lee of a Wave Energy Converter. Proceedings of the 28th International Conference on Offshore Mechanics & Arctic Engineering (OMAE 2009), Honolulu, HI, USA, 31 May–5 June 2009; Volume OMAE2009-79793.
- Folley, M.; Whittaker, T. Preliminary Cross-Validation of Wave Energy Converter Array Interactions. Proceedings of the OMAE2013 Conference, Nantes, France, 9–14 June 2013.
- Stratigaki, V.; Troch, P.; Stallard, T.; Forehand, D.; Vantorre, M.; Kofoed, J.P.; Babarit, A.; Folley, M.; Benoit, M. Development of heaving wave energy converters for large-scale WEC array experiments; Unpublished work.
- Stratigaki, V.; Troch, P.; Stallard, T.; Kofoed, J.P.; Benoit, M.; Mattarollo, G.; Babarit, A.; Forehand, D.; Folley, M. Large Scale Experiments on Farms of Heaving Buoys for Investigation of Wake Dimensions, Near-Field and Far-Field Effects. Proceedings of the International Conference on Coastal Engineering 2012 (ICCE2012), Santander, Spain, 1–6 July 2012.
- Stratigaki, V.; Troch, P.; Vantorre, M.; Folley, M.; Stallard, T.; Forehand, D.; Kofoed, J.P.; Babarit, A.; Benoit, M. Development of a Point Absorber Wave Energy Converter for Investigation of Wake Effects and Wave Energy Absorption. Proceedings of the 4th International Coastlab12 Conference, Ghent, Belgium, 17–20 September 2012.
- Bjarte-Larsson, T. Friction for a Floating Body heaving along a Fixed Vertical Guiding Strut. Proceedings of the 7th EWTEC, Porto, Portugal, 11–13 September 2007.
- Troch, P.; Stratigaki, V.; Stallard, T.; Kofoed, J.P.; Forehand, D.; Folley, M.; Benoit, M.; Babarit, A.; Gallach Sánchez, D.; de Bosscher, L.; et al. Large Scale Physical Modeling of an Array of 25 Wave Energy Converters in the WECwakes Project. Proceedings of the 10th European Wave and Tidal Energy Conference Series (EWTEC), Aalborg, Denmark, 2–5 September 2013.
- Borgman, L.E.; Panicker, N.N. Design Study for a Suggested Wave Gauge Array off Point Mugu, California; Technical Report 1–14; Hydraulic Engineering Laboratory, University of California at Berkeley: Berkeley, CA, USA, 1970. [Google Scholar]
- O'Boyle, L. Wave Fields around Wave Energy Converter Arrays. Ph.D. Thesis, Queen's University Belfast, Belfast, UK, September 2013. [Google Scholar]
- Longuet-Higgins, M.S.; Cartwright, D.E.; Smith, N.D. Observations of the Directional Spectrum of Sea Waves Using Motions of a Floating Buoy. In Ocean Wave Spectra; Prentice Hall: New York, NY, USA, 1963; pp. 111–136. [Google Scholar]
- Goda, Y.; Suzuki, Y. Computation of Refraction and Diffraction of Sea Waves with Mitsuyasu's Directional Spectrum; Technical Note of the Port and Harbour Research Institute, Ministry of Transport: Tokyo, Japan, 1975; 230, p. 45. [Google Scholar]
- Beels, C.; Troch, P.; De Backer, G.; Vantorre, M.; De Rouck, J. Numerical implementation and sensitivity analysis of a wave energy converter in a time-dependent mild-slope equation model. Coast. Eng. 2010, 57, 471–492. [Google Scholar]
- Beels, C.; Troch, P.; De Visch, K.; Kofoed, J.P.; De Backer, G. Application of the time-dependent mild-slope equations for the simulation of wake effects in the lee of a farm of Wave Dragon wave energy converters. Renew. Energy 2010, 35, 1644–1661. [Google Scholar]
- Aalborg University. WaveLab 3.33 Manual. Available online: http://www.hydrosoft.civil.auc.dk/ (accessed on 1 December 2013).
- Mendoza, E.; Silva, R.; Zanuttigh, B.; Angelelli, E.; Lykke Andersen, T.; Martinelli, L.; Nørgaard, J.Q.H.; Ruol, P. Beach response to wave energy converter farms acting as coastal defense. Coast. Eng. 2013. in press. Available online: http://dx.doi.org/10.1016/j.coastaleng.2013.10.018 (accessed on 12 November 2013). [Google Scholar]
- Nørgaard, J.H.; Lykke Andersen, T. Experimental and Numerical Investigation of Wave Transmission from a Floating Wave Dragon Wave Energy Converter. Proceedings of the International Ocean and Polar Engineering Conference, Rhodes (ISOPE), Rhodes, Greece, 17–22 June 2012.


| Wave height H (m) | Wave amplitude, a (m) | Wave period, T (s) | Wave angle, θ (°) | ||
|---|---|---|---|---|---|
| 0.074 | 0.037 | 1.180 | 0 | 10 | 20 |
| 1.260 | 0 | 10 | 20 | ||
| Wave height, H (m) | Wave amplitude, a (m) | Wave period, T (s) |
|---|---|---|
| 0.024 | 0.012 | 0.870 |
| 0.030 | 0.015 | 1.008 |
| 0.036 | 0.018 | 1.178 |
| 0.032 | 0.016 | 1.217 |
| 0.030 | 0.015 | 1.260 |
| 0.022 | 0.011 | 1.385 |
| 0.018 | 0.009 | 1.510 |
| Significant wave height, Hm0 (m) | Significant wave amplitude, am0 (m) | Peak wave period, Tp (s) |
|---|---|---|
| 0.0749 | 0.0375 | 1.050 |
| 0.0816 | 0.0408 | 1.100 |
| 0.1040 | 0.052 | 1.180 |
| 1.260 | ||
| 1.350 | ||
| 1.500 |
| Directional spreading parameter, s (-) | Significant wave height, Hm0 (m) | Significant wave amplitude, am0 (m) | Peak wave period, Tp (s) |
|---|---|---|---|
| 75 | 0.104 | 0.052 | 1.260 |
| 10 | 0.104 | 0.052 | 1.260 |
| Configuration | Types of tests regarding wave conditions | ||||||
|---|---|---|---|---|---|---|---|
| Regular | Poly-chromatic | Irregular Long-crested | Irregular Short-crested | Diffracted wave field | WEC decay motion | WEC lay-out sketches | |
| Waves only | √ | √ | √ | √ | √ (shafts) | N/A | - |
| Individual WEC | √ | √ | √ | √ | √ | √ |  |
| 2-WEC Column A | √ | √ | √ | √ (spacing, l=5D) | √ (spacing, l=5D) | √ |  |
| 2-WEC Row B | √ | √ | √ | - | √ (spacing, w=5D) | - |  |
| 5-WEC Column C | √ | √ | √ | √ (middle column) | √ (middle column) | √ (middle column) |  |
| 5-WEC Row | √ | √ | √ | - | - | - |  |
| 10-WEC, 2 Columns | √ | √ | √ | - | - | - |  |
| 5 × 5-WEC rectilinear array | √ | √ | √ | √ | √ | - |  |
| 5 × 5-WEC staggered array | √ | √ | √ | √ | √ | - |  |
| 3 × 3-WEC rectilinear 10D | √ | √ | √ | √ | - | - |  |
| 3 × 3-WEC rectilinear 5D | √ | √ | √ | √ | - | - | 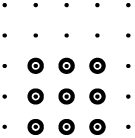 |
| 13-WEC staggered array | √ | √ | √ | √ | √ | - | 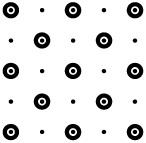 |
Notes:ASpacing, l, 5D to 20D 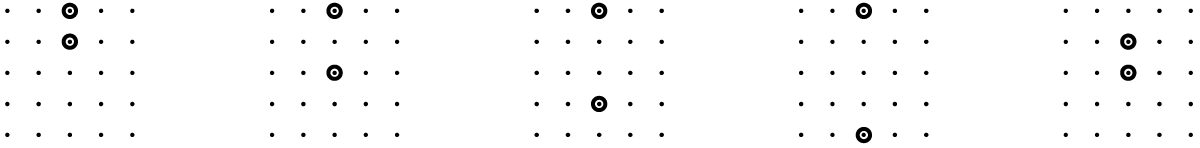 BSpacing, w, 5D to 20D
 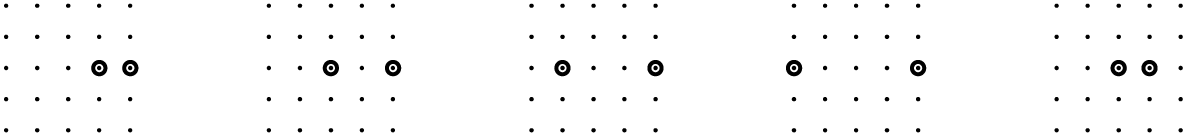 CRepetition on each column

© 2014 by the authors; licensee MDPI, Basel, Switzerland. This article is an open access article distributed under the terms and conditions of the Creative Commons Attribution license ( http://creativecommons.org/licenses/by/3.0/).
Share and Cite
Stratigaki, V.; Troch, P.; Stallard, T.; Forehand, D.; Kofoed, J.P.; Folley, M.; Benoit, M.; Babarit, A.; Kirkegaard, J. Wave Basin Experiments with Large Wave Energy Converter Arrays to Study Interactions between the Converters and Effects on Other Users in the Sea and the Coastal Area. Energies 2014, 7, 701-734. https://doi.org/10.3390/en7020701
Stratigaki V, Troch P, Stallard T, Forehand D, Kofoed JP, Folley M, Benoit M, Babarit A, Kirkegaard J. Wave Basin Experiments with Large Wave Energy Converter Arrays to Study Interactions between the Converters and Effects on Other Users in the Sea and the Coastal Area. Energies. 2014; 7(2):701-734. https://doi.org/10.3390/en7020701
Chicago/Turabian StyleStratigaki, Vasiliki, Peter Troch, Tim Stallard, David Forehand, Jens Peter Kofoed, Matt Folley, Michel Benoit, Aurélien Babarit, and Jens Kirkegaard. 2014. "Wave Basin Experiments with Large Wave Energy Converter Arrays to Study Interactions between the Converters and Effects on Other Users in the Sea and the Coastal Area" Energies 7, no. 2: 701-734. https://doi.org/10.3390/en7020701