Energy and GHG Analysis of Rural Household Biogas Systems in China

Abstract
: The Chinese government has taken great efforts to popularize rural household scale biogas digesters, since they are regarded as an effective approach to address energy shortage issues in rural areas and as a potential way of reducing greenhouse gas (GHG) emissions. Focusing on a typical rural household biogas system, the aim of this study is to systematically quantify its total direct and indirect energy, concentrating on non-renewable energy and the associated GHG emission cost over the entire life cycle to understand its net dynamic benefits. The results show that the total energetic cost for biogas output is 2.19 J/J, of which 0.56 J is from non-renewable energy sources and the GHG emission cost is 4.54 × 10⁻⁵ g CO2-equivalent (CO2-eq), with respect to its design life cycle of 20 years. Correspondingly, a net non-renewable energy saving of 9.89 × 10¹⁰ J and GHG emission reduction of 50.45 t CO2-eq can be obtained considering the coal substitution and manure disposal. However, it must be run for at least 10 and 3 years, to obtain positive net non-renewable energy savings and GHG emission reduction benefits, respectively. These results have policy implications for development orientation, follow-up services, program management and even national financial subsidy methods.1. Introduction
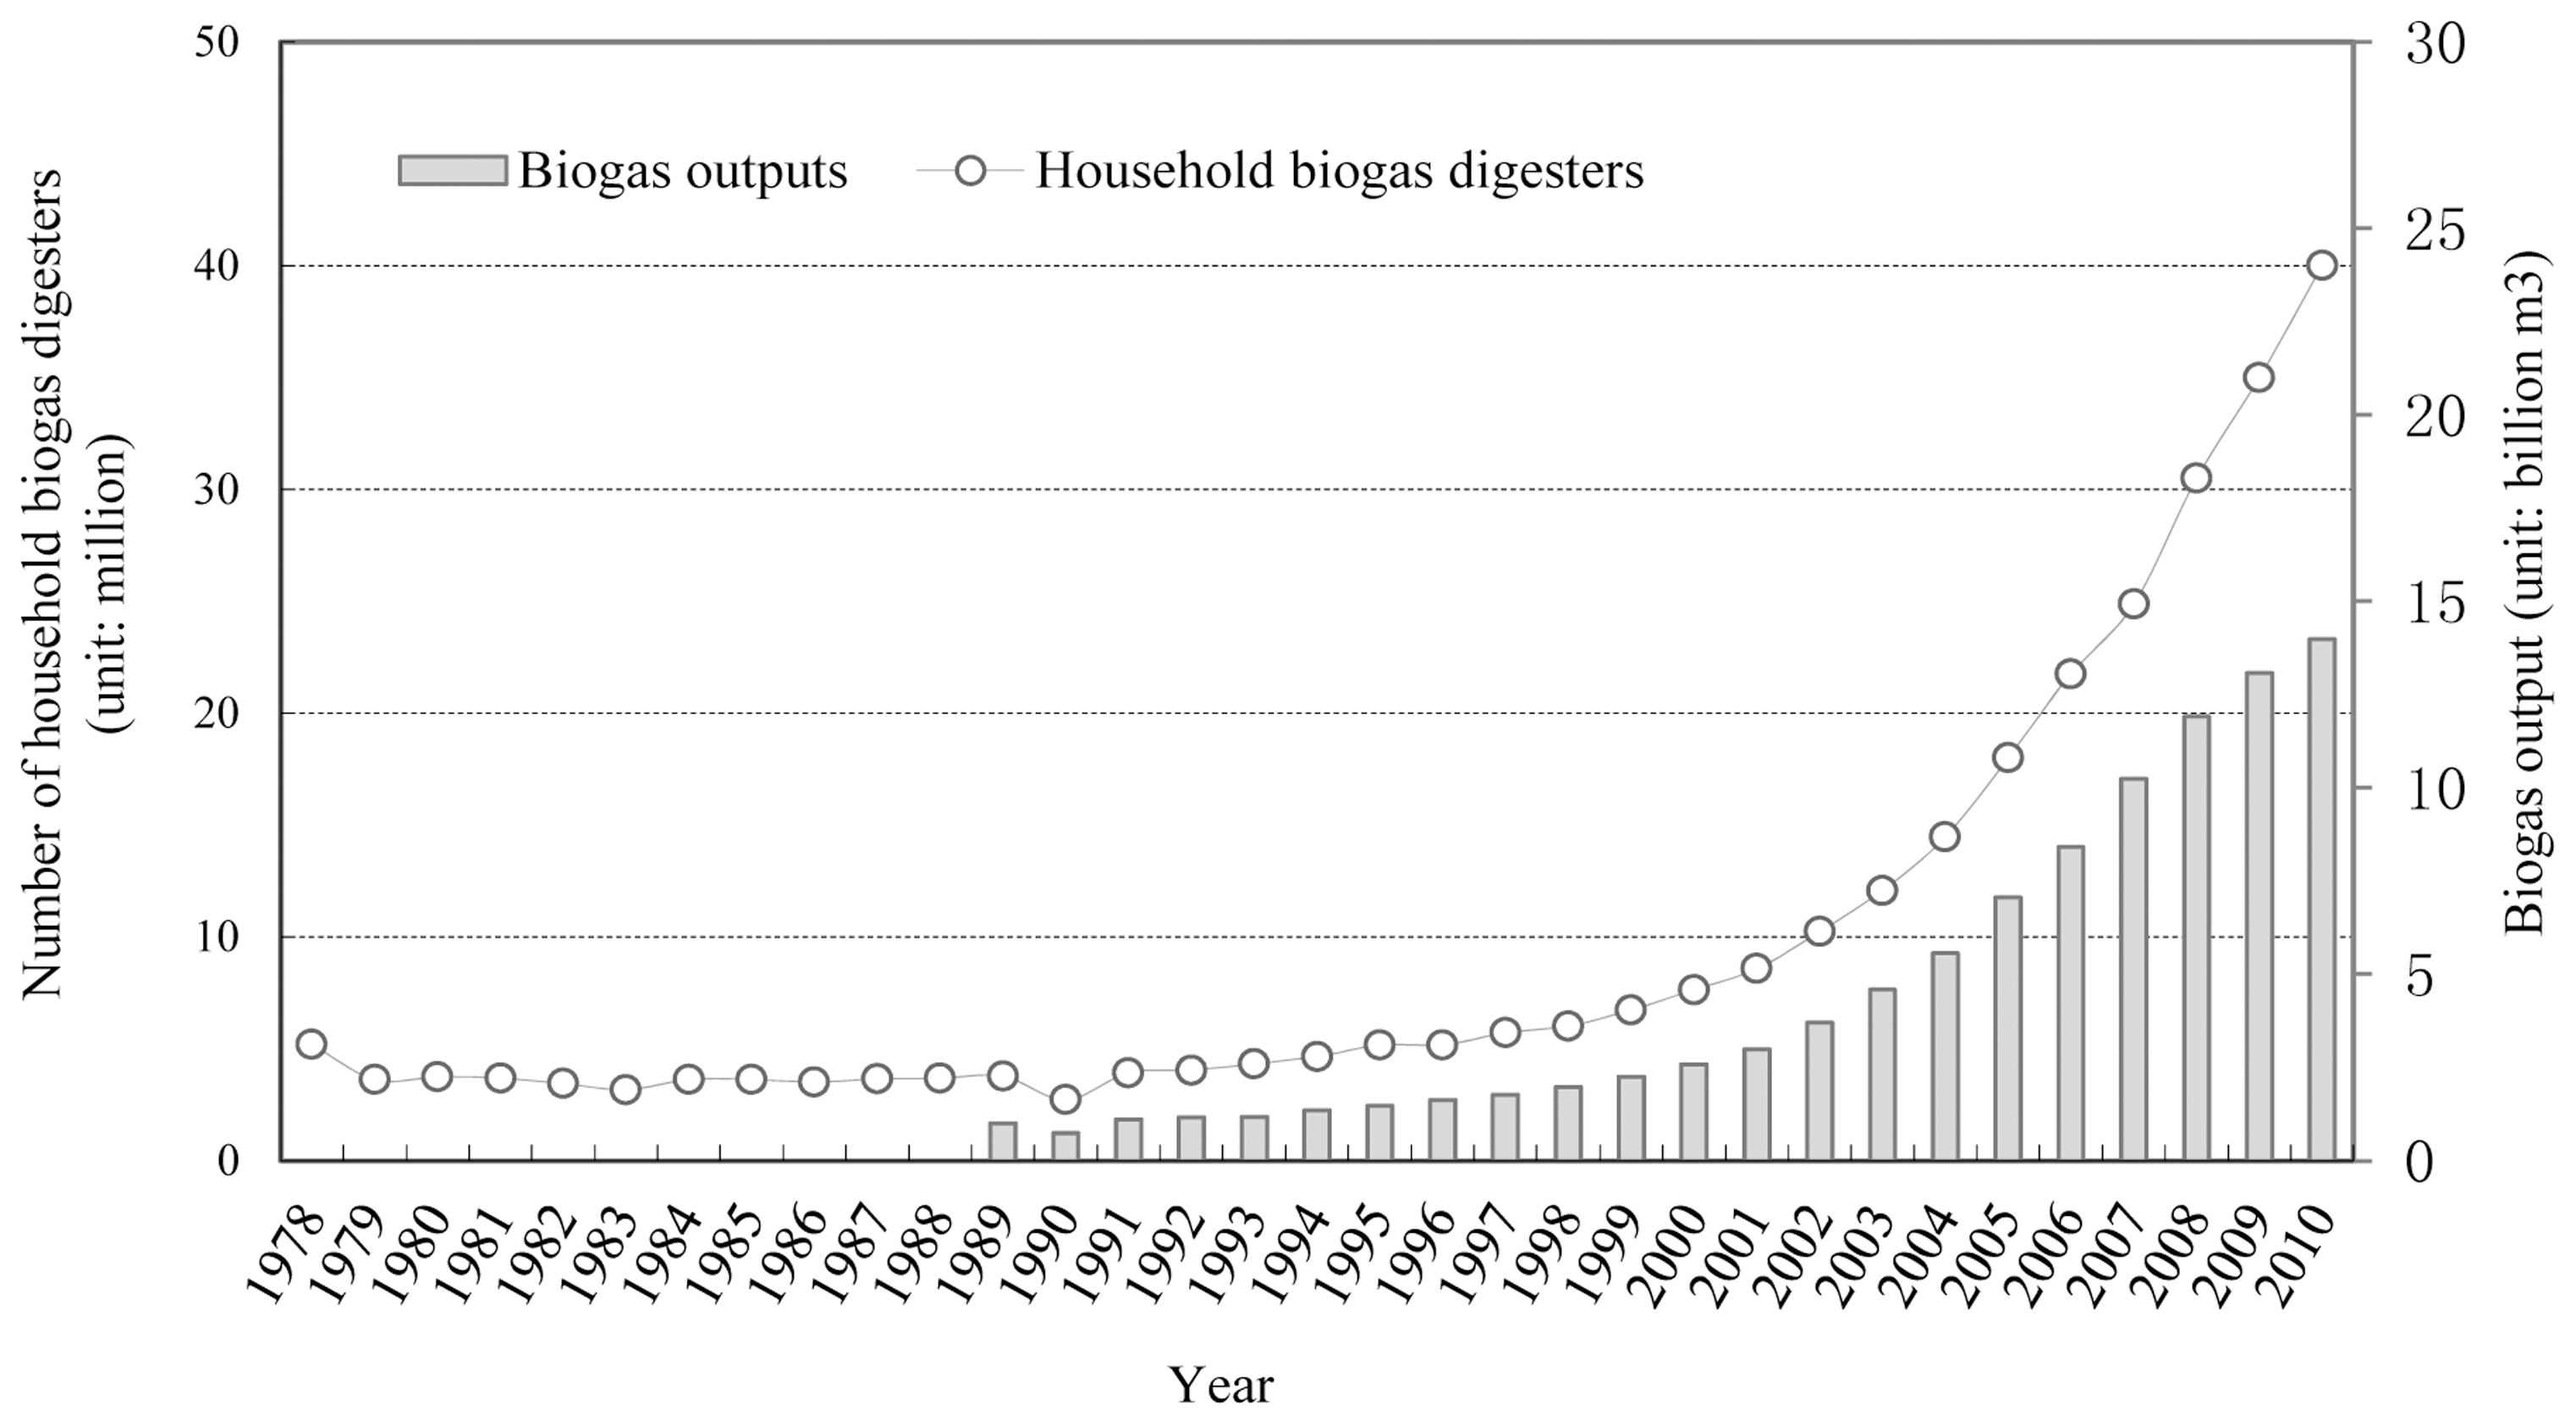
China was one of the first countries in the world to use biogas technology early in its history and it continues to play a leading role in the development and dissemination of household biogas technology. The first unofficial test to ferment biogas was undertaken in Guangdong Province back in the 1880s [1,2]. However, it was not until the 1970s that the large-scale development of household biogas systems began in China, when the Chinese government introduced wide-scale biogas technology nationally to address energy shortages in rural areas [3]. To relieve the ever-increasing pressure as the largest GHG emitter, China is currently placing substantial focus on biogas development as a possible measure to mitigate carbon emissions [4,5]. Figure 1 shows the number of household biogas digesters and annual biogas outputs from 1978 to 2010, from which it can be found that the household biogas project in rural China has experienced its fastest growth since 2000. By the end of 2010 there were about 40 million family-sized biogas digesters in China, with a total output of 13.90 billion m3 (amounting to about 9.93 million t of standard coal), which makes China the biogas capital of the world. Consequently, household biogas digesters can be found throughout the country, mainly in the Yangtze River Basin. More than 90% of rural household scale digesters are hydraulic biogas digesters, among which the “China dome” digester constructed of clay, brick, and concrete in 6, 8 and 10 m3 volumes and mainly using livestock manure as substrate has become the standard type [2,3].
Like other renewable energy-based systems, rural household biogas systems seem to have no direct fossil energy inputs and related GHG emissions. However, any energy conversion system needs extra energy to deliver that energy to society [6]. With regard to renewable energy initiatives, in order to enable the delivery of energy to users, high quality, non-renewable energies are necessary and utilized to capture and concentrate the dispersed, lower quality, renewable resources [7]. As a matter of fact, the necessity for systematic analysis was emphasized in previous studies on the evaluation of some renewable projects to estimate the total direct and indirect energy inputs and associated GHG emissions of the systems over their entire life cycle [8–11]. For example, [12–14] compared the energy return on investment and GHG emission savings between bio-ethanol and conventional petroleum and diesel over their entire life cycle. Life-cycle energy and GHG assessments of corn-ethanol production in China were conducted by [15,16], which definitely contributed to the systematic understanding of the cost-benefits of such a controversial alternative. In addition, [17,18] represented the non-renewable energy cost and GHG emission analysis of a wind power plant and a solar power tower plant in China. Similar studies have been performed for a village-level biomass gasification project and a wood pellets production plant in China to investigate from a life cycle perspective the renewability of such energy alternatives [19,20].
Considering the rapid increase in household scale biogas digester construction and the optimistic expectations about their global warming abatement potential by decision makers, a reliable and systematic account of energy and GHG emission for rural household biogas energy projects has recently become of supreme importance. Previous studies on household biogas digesters were mainly based on the processed life cycle analysis, which could only take a direct or a small part of the indirect energy demands and emissions into account [21–27]. For example, [3] estimated that in China biogas provided 832.48 PJ of energy for households and curtailed 7.32 × 10⁷ t CO2-eq of GHGs annually. It has been also estimated that the implementation of rural household biogas facilities could reduce China's emissions by 1.43−2.02 t CO2-eq per digester, annually [28]. The values reported by [24,25] are 1.70 and 1.91 t CO2 per digester per year, respectively. However, these results have been constrained by the following facts: (1) the main focus was on the anaerobic fermentation system itself, and the end use of the biogas was not included in the system boundaries when accounting for the GHG reduction benefits; (2) indirect energy inputs and GHG emissions associated with the production and transportation of materials and services necessary for the construction and maintenance of biogas systems was not considered; and (3) it is often assumed that the digester can be operated normally to the end of its full design life cycle, which rarely occurs in reality [25,29,30].
This paper aims to systematically evaluate the cost and benefit of energy and GHG emissions associated with a typical rural household biogas system with regard to different life cycle scenarios, in order to shed light on the more effective rural biogas use and to suggest appropriate rural biogas development policies. The material, energy inputs and related GHG emissions over the entire life cycle of this rural household biogas system were taken into consideration, i.e., from construction, utilization, through to demolition. It is worthwhile to emphasize that dynamic analyses of GHGs emission reduction potential and energy savings were conducted for different operational lifetime scenarios, in consideration of methane emissions avoidance and substitution of fossil energy. This study helps to identify whether household biogas projects have energy saving and GHG emission reduction benefits with regard to different running times, which definitely could provide essential policy implications supportive of development orientation, follow-up services, management and even national financial subsidy methods for rural household biogas projects in China.
2. Methodology
Energy analysis of any renewable energy conversion process is a comparison of energy output with the energy needed to supply all inputs—the energy source, materials, and services [15]. One of the key indicators of such an analysis is the energy return on investment (EROI), defined as the ratio of energy extracted or delivered by a process to the energy used directly and indirectly in that process [31]. In fact, what we are really concerned with is the renewability of biogas production from household biogas system in consideration of the non-renewable energy requirements for such a project over the entire life cycle. As a reformulation of EROI, the reciprocal of EROI addressed by [32] as energy cost indictor to denote how much energy should be invested to obtain one unit of energy contained in the final product, was also used in this study. Correspondingly, the energy and non-renewable energy cost of the final product, i.e., biogas, can be expressed as:
With regard to the energy saving benefit, it can be calculated by the subtracting energy invested in the process from biogas energy produced or saved due to energy substitution. Similarly, the GHG emission reduction benefit is the difference between GHG reduction and GHG emitted by input flows and biogas combustion. In this study, it is assumed that the biogas produced is all used as a substitute for coal for cooking. It should be noted that the energy savings and emission reduction from fertilizer substitution are neglected in this study because of the assumption that the value of biogas fertilizer is similar to that of the initial manure [33]. Therefore, the energy saving (Eben) and GHG emission mitigation benefits (GHGben) can be calculated using Equations (3) and (4):
For systematic accounting, the energy and non-renewable energy intensities as well as GHG emission coefficients must be the embodied ones, including both direct and indirect parts. Zhou [34] performed an environmentally extended input-output analysis (EIOA) and presented a database for embodiment intensity for all the 151 kinds of typical commodities in the Chinese economy, conclusively provided as a systematic account of the embodied ecological elements in the Chinese national economy, including energy and nonrenewable energy intensities as well as GHG emission coefficients. Using this database, [17,18] estimated the total fossil energy cost and associated GHG emissions of a 1.5 MW solar power tower plant and 1.25 MW wind turbine in China, respectively. As a follow up to the above studies, this work follows the same methodology and adopts most of the energy/nonrenewable intensities and conversion coefficients of GHGs associated with the resource flows of household biogas systems from the references [17,18,34,35]. In contrast to the indirect coefficients related to the resources, the direct energy content of manure used as fermentation material and biogas, as well as the GHG emission factors of biogas and coal combustion are derived from the works of [36,37], respectively.
The calculation of CH4 emissions avoided by manure disposal is based on the 2006 IPCC Guidelines [38], a method cited in previous research [3,28,39]. Methane mitigation was the only GHG type concerned here, since nearly no CO2 and N2O is emitted from manures in biogas digesters. The amount of CH4 reduction by manure management (GHGman) can be calculated as follows (using swine manure as an example):
The related data on the construction and maintenance of the typical rural household biogas project are derived from standard design sheets and our own survey of rural household biogas systems in Guizhou Province in 2010 and 2011. In addition, some assumptions are necessary to make the work easy to accomplish, namely: (1) the annual output of biogas remains constant; (2) when the digester is abandoned, the waste building materials cannot be reused in other programs.
3. Inventory of the Household Biogas System
The rural household biogas system examined in this study is very popular in South China and is known as the Three in One model, for three renovations of kitchen, toilet and livestock shed with one tank. It is usually equipped with an anaerobic biogas digester with a capacity of 8 m3, a pigpen, a toilet and related pipeline and combustion devices for the biogas (Figure 2). The entire life cycle of this system is considered from digester construction to biogas use. The demolition of the digester is not considered, in line with assumption (2) above.
3.1. Construction
The building of an anaerobic biogas digester is usually the principal work involved in the construction of the whole system. As shown in Table 1 of Section 4, the main building materials for biogas tank construction are concrete and cement blocks. The total amount of concrete needed for an 8 m3 tank is about 3.3 t, of which 1.8 t correspond to the cement blocks made of concrete. The charging pipe is polyvinyl chloride (PVC) tubing, about 5 kg. In addition, a set of pipes, fittings and joint sealant made of synthetic rubber are necessary to transfer the biogas to combustion devices without leakage. The energy and GHGs from all the transportation processes and those due to labor and tools used in the construction process are not considered due to unavailability of suitable data.
In addition, the old and traditional latrine, livestock shed and stoves have to be renovated to work with the digester. About 4 t, 0.18 t and 6.93 t of concrete are needed for the renovations to the toilet, stove and pigpen, respectively. With regard to toilet and stove, the concrete is mainly used for plastering the walls. By comparison, more concrete is needed for the pigpen renovation due to the fact that the ground has to be cemented over for effective manure collection and digester charging. The detailed material inputs of these three renovations can also be found in Table 1. For the renovation of the stove, it is essential to install a unit which is designed for the combustion of methane and to install the auxiliary devices, such as the biogas purifier and manometer. The pigpen should be spacious enough, at least 10 square meters, to feed five or more pigs. The roof of the pigpen is usually covered by several precast hollow slabs, which weigh 0.9 t in total, including about 0.8 t concrete and 0.1 t of steel. The pigpen and toilet should be connected with the digester to make it easy to wash and sweep manure into the digester.
3.2. Operation and Maintenance
According to local investigations and the technical instructions on rural household biogas digesters and three renovations, released by the Ministry of Agriculture (MOA), it is essential to feed at least five pigs to provide sufficient fermentation materials for the normal operation of the household digester of 8 m3, and the annual total dry excrement is about 1200 kg [40]. Additionally, it is also assumed that all tubes are replaced every five years and the biogas stoves are replaced every 10 years during its life cycle of 20 years, to maintain the normal operation of this system. The annual biogas output in this paper is assumed to be 450 m3 according to previous studies [4,24], which can provide a substitute for 0.77 t of coal in terms of equivalent effective calorific value of combustion [7].
4. Results and Discussion
4.1. Energy and GHG Emission Cost
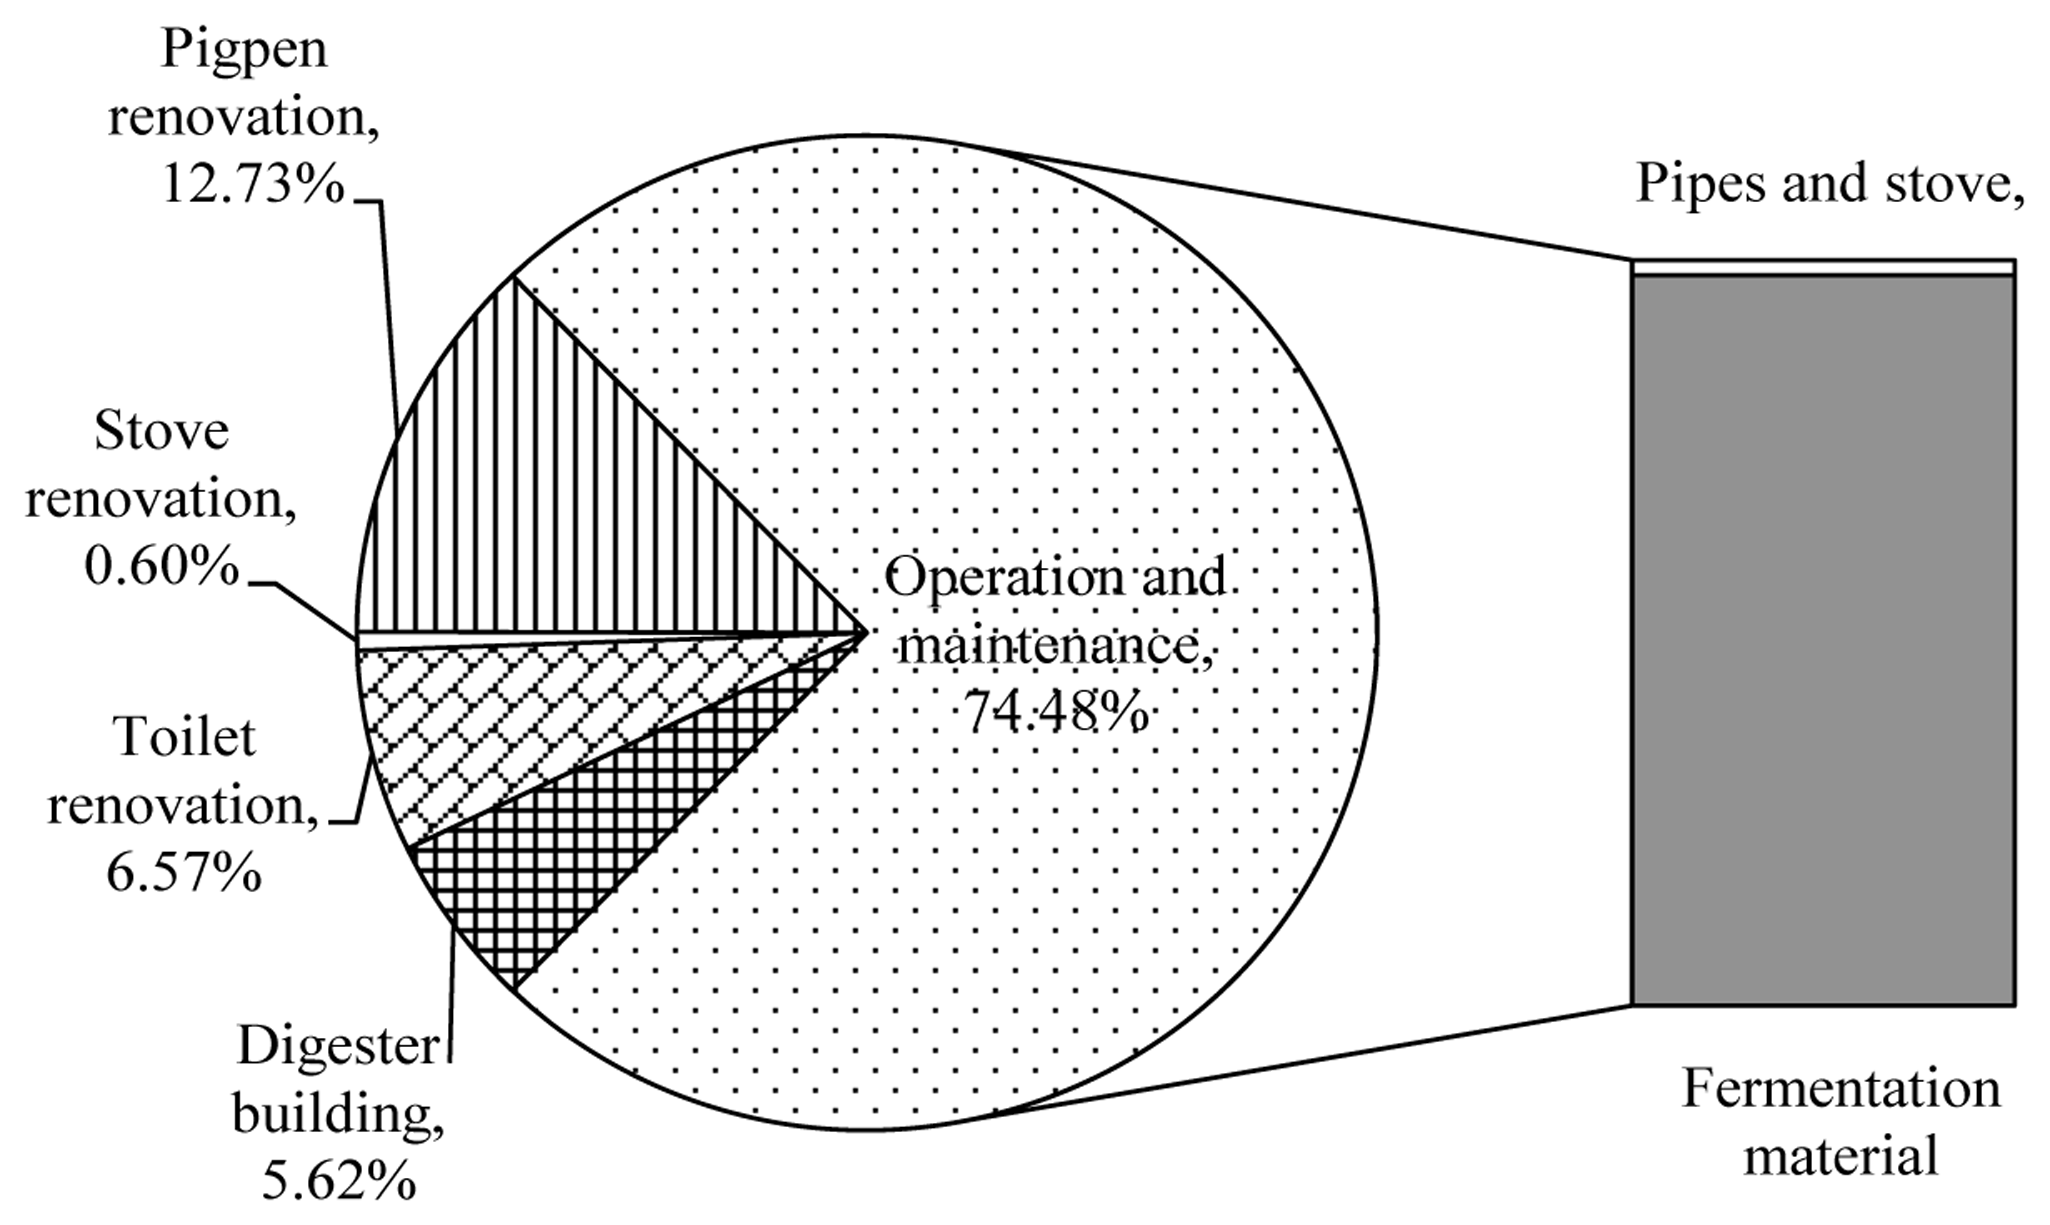
Table 1 shows the results of the energy investment and GHG emissions associated with a typical rural household biogas system with an 8 m3 bio-digester during its life cycle. The total energy investment for a 20 year life cycle of this biogas system is 4.13 × 10¹¹ J, of which 1.05 × 10¹¹ J is from non-renewable sources. As mentioned in Section 3, the annual biogas output is assumed to be 450 m3, i.e., 9.41 × 10⁹ J of energy per year, and the total biogas output for 20 years is 1.88 × 10¹¹ J. Therefore, the Ecost for biogas is calculated as 2.19, while more importantly, the NEcost is 0.56, indicating that 0.56 J of non-renewable energy is needed to produce a unit of biogas energy. Further analysis of the energy investment for each stage shows that the construction stage (including digester building and three renovations) and operation and maintenance stage contribute differently to the total energy cost, with percentages of 25.52% and 74.48%, respectively (see Figure 3). If only the construction stage is considered, the building materials, i.e., cement blocks and concrete, are the dominant energy investment sources. Correspondingly, the renovation of the pigpen accounts for the largest energy investment at this stage (13%) due to the large quantity of concrete used in wall plastering and ground treatment, while the stove renovation accounts for less than 1% of this part. In fact, the fermentation material (manure) is the largest contributor to the total energy cost, which represents 73% and 98% of the total and those in the operation and maintenance stage, respectively.
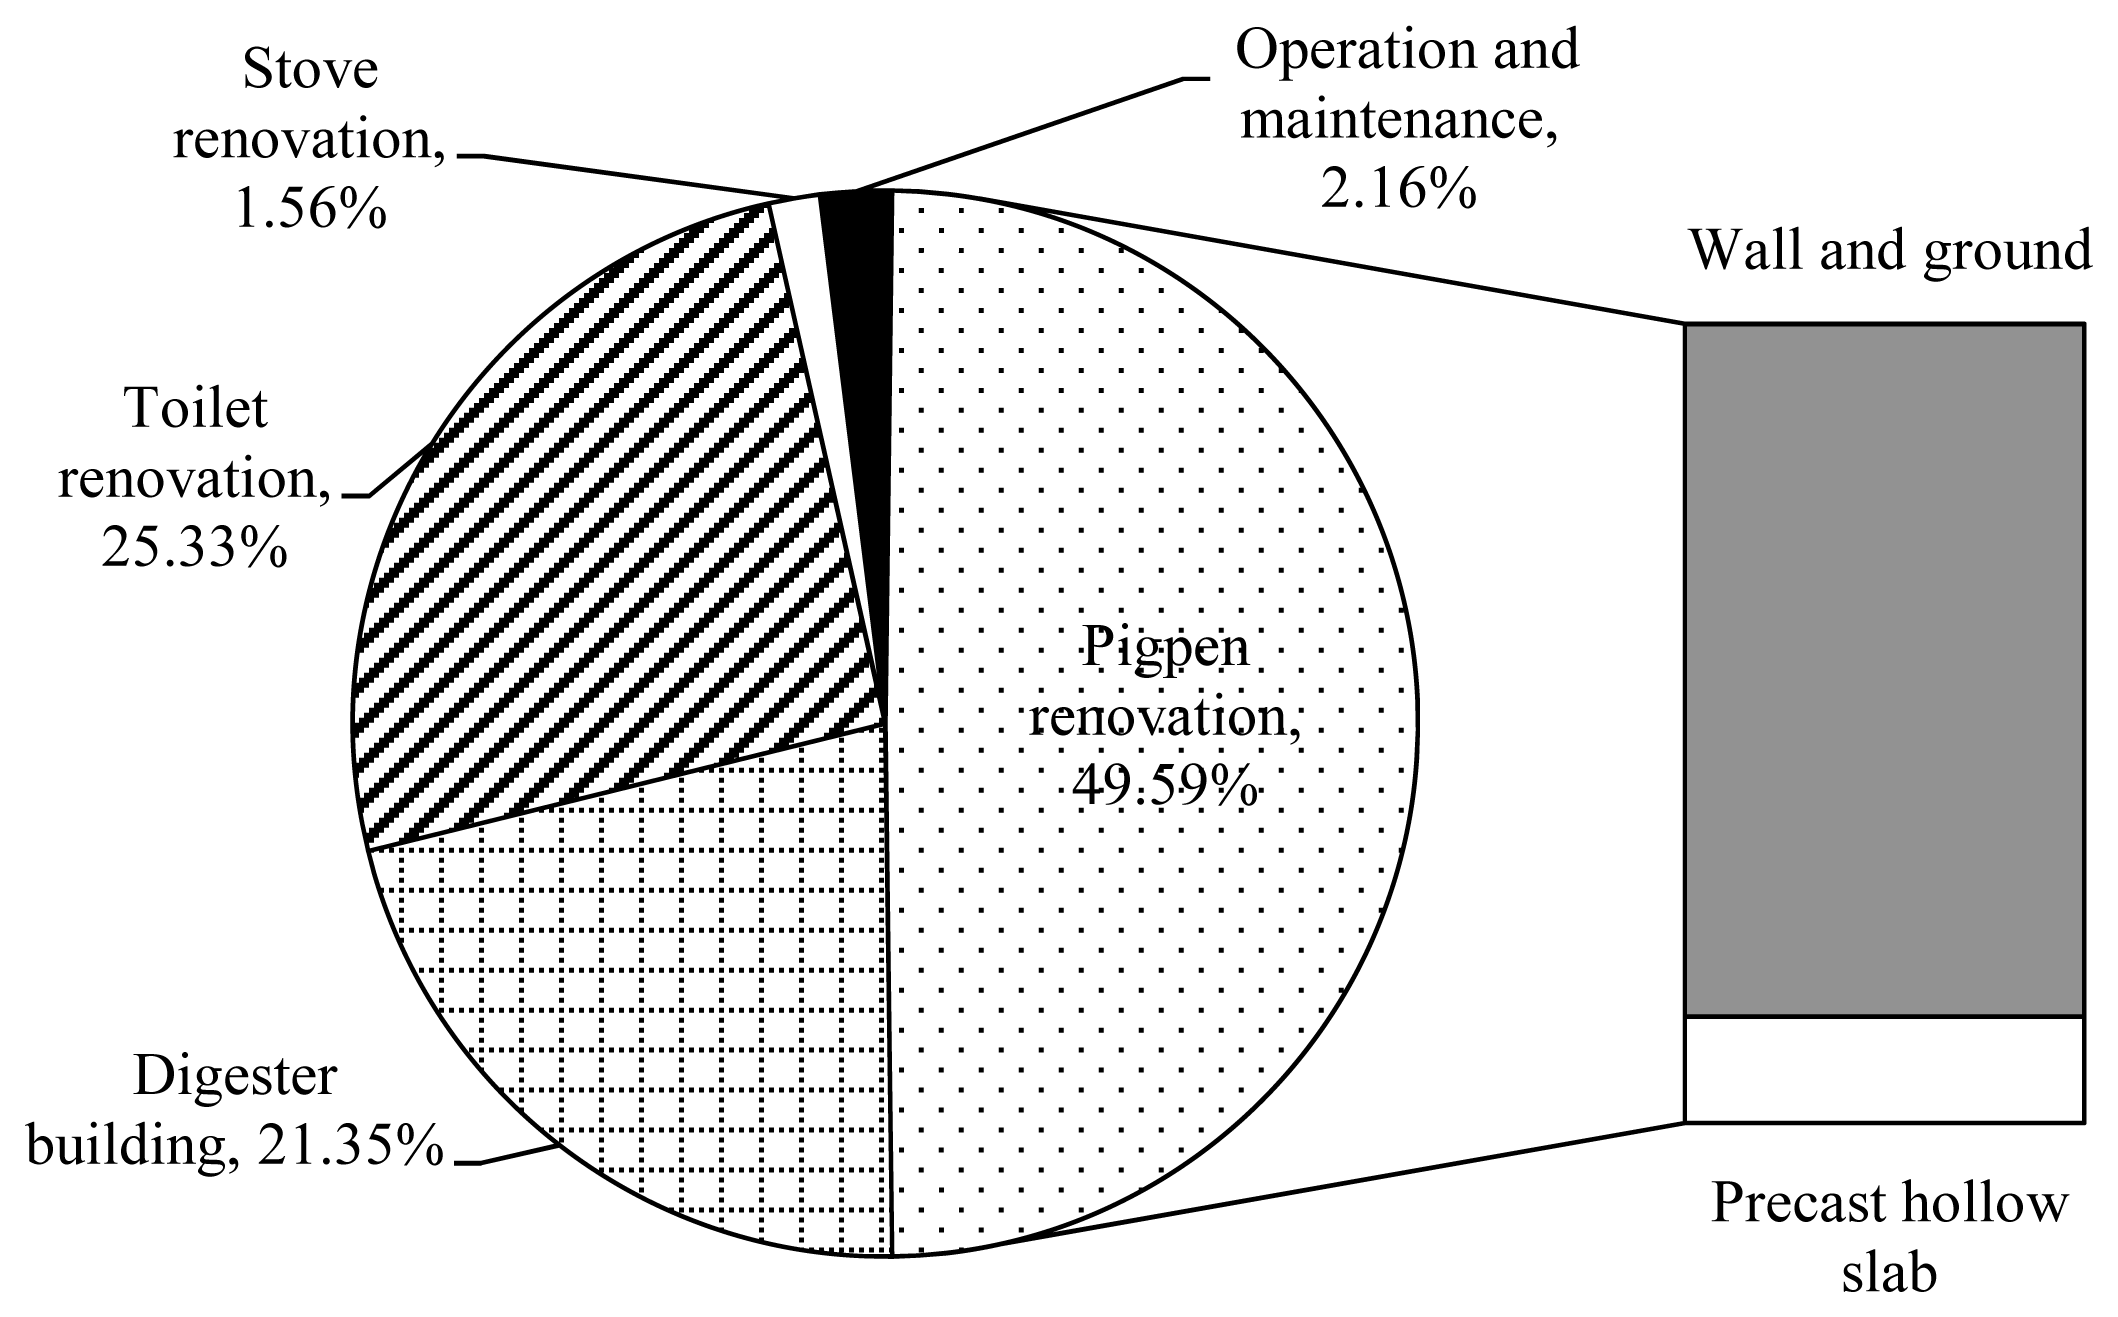
Similarly, the GHGs emission associated with the construction as well as operation and maintenance are also listed in Table 1. The total GHGs emission for a 20 year life cycle of the rural household biogas system is 8.54 t CO2-eq, and the GHGs emission required to generate 1 J of biogas energy are 4.54 × 10⁻⁵ g CO2-eq. As shown in Figure 4, nearly 98% of the total GHGs are derived from the construction stage mainly due to the utilization of steel and concrete, while GHGs in the operation and maintenance stage take up only 2%, due to replacement of some pipelines and stoves. As for the construction stage, the GHGs emission caused by the pigpen renovation takes up nearly half of the totals, due to the same fact that a large proportion of the concrete and steel are consumed in this part. The percentage of GHG emissions from the digester building and toilet renovation are 21% and 25%, respectively, while stove renovation accounts for a little more than 1% of the emissions from the construction stage.
To evaluate the energy savings and GHGs emission reduction benefits with regard to full life cycle utilization, two further factors should be taken into account, namely disposal of the manure and energy source substitution [41]. As mentioned above, consumption of about 0.77 t of coal can be avoided annually by biogas use and the energy consumption and GHG emission intensities during the production process of coal are 1.02 × 10⁹ J/t and 0.57 t CO2-eq/t, as shown in [34]. The GHG emission coefficient of coal and biogas combustion is 1.92 t CO2-eq/t and 1.17 × 10⁻³ t CO2-eq/m3 [37]. The manure treated during the 20 years of the life cycle is 24.0 t in terms of dry weight and the CH4 mitigation from manure management can be calculated to be 31.10 t CO2-eq according to Equation (5). Therefore, according to Equations (3) and (4), the energy saving benefits (Eben), and GHG emission mitigation benefits (GHGben), are evaluated as 9.89 × 10¹⁰ J and 50.45 t CO2-eq for the rural house biogas system considered in this study.
However, all these net benefits in energy savings and GHGs emission reduction of the household biogas system can only be achieved under the assumption that the system runs successfully over its entire nominal life cycle of 20 years. Unfortunately, our local investigations in Guizhou, as well as other previous studies, show that a large proportion of household biogas projects have fallen into disuse within 3 years after their construction, as we will discuss in Section 4.2.
4.2. Scenario Analysis for Different Running Times
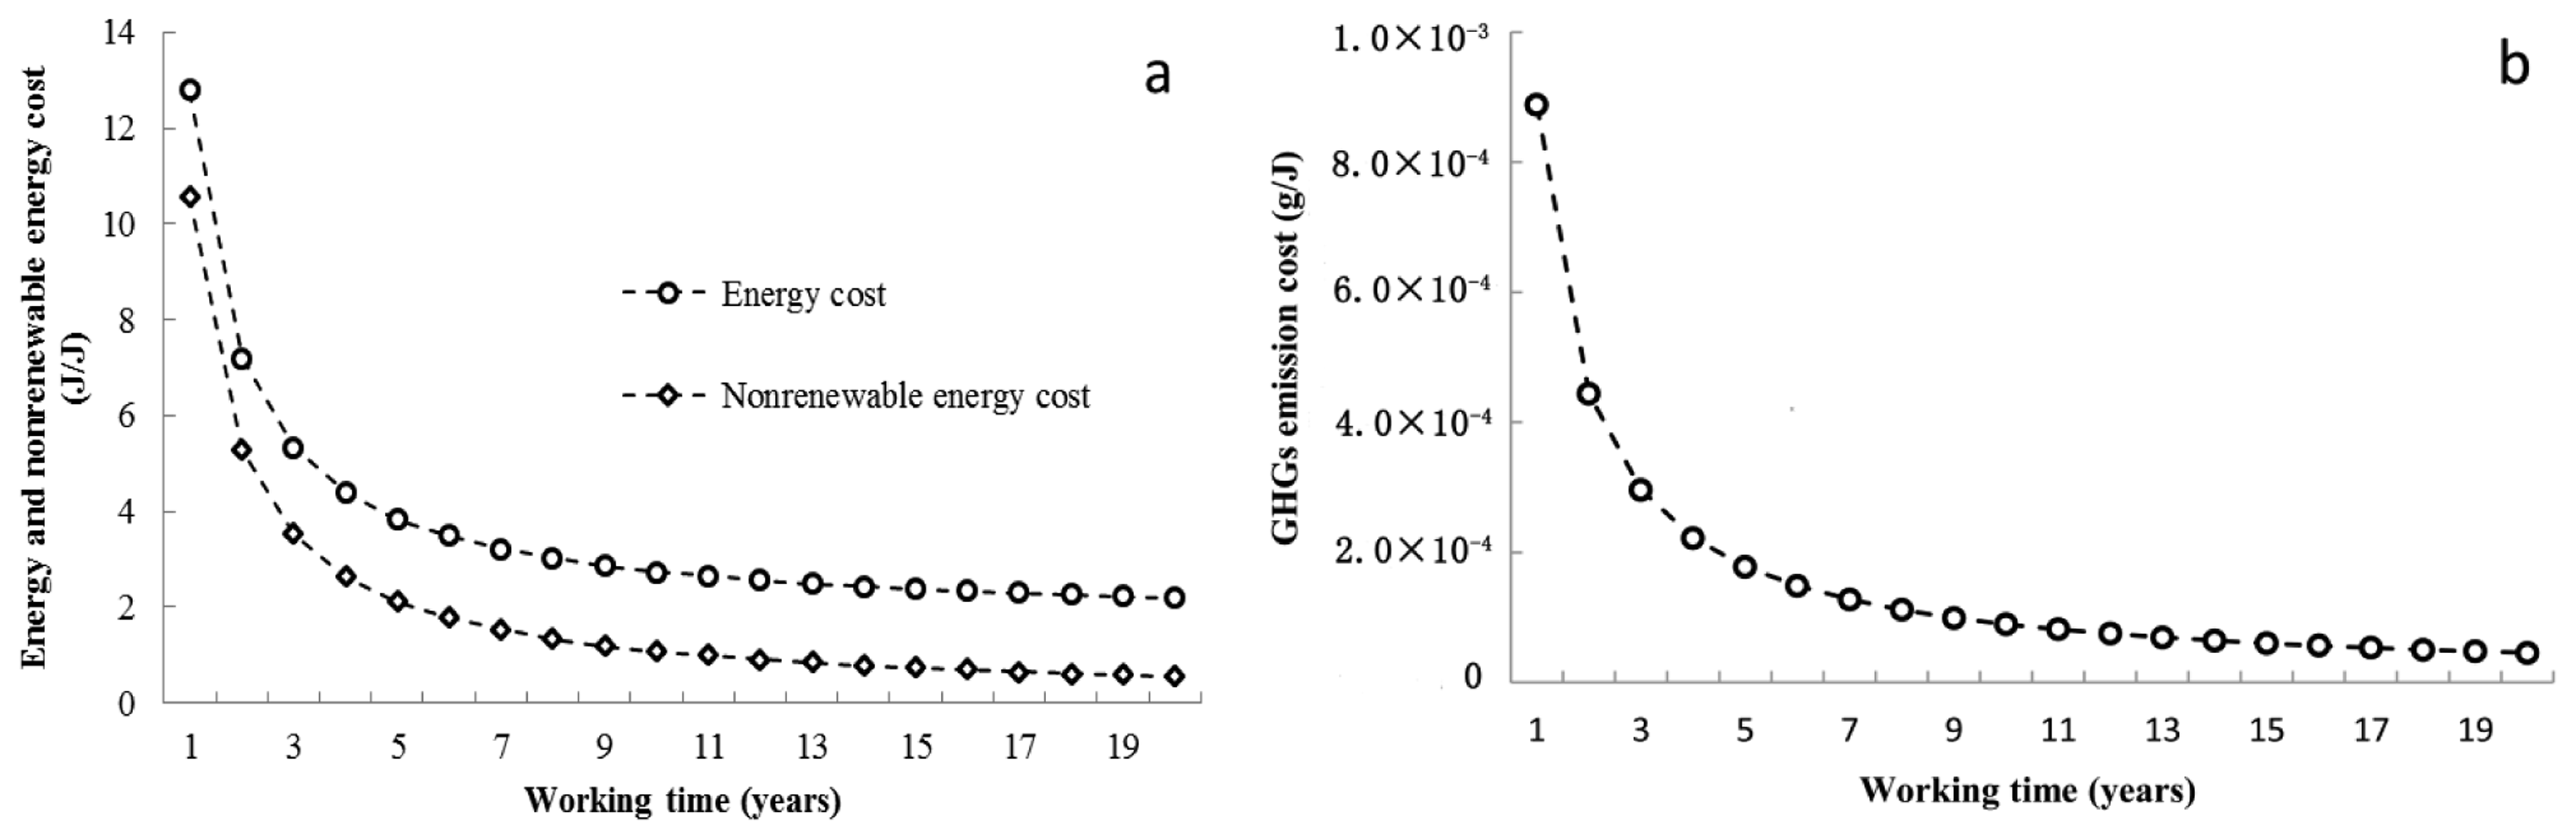
In light of the unstable running of the household biogas project in rural China, a scenario analysis was conducted to find variation of the energy cost, GHGs emissions, as well as appropriate benefits under different operating conditions. With regard to different scenarios of running time, both the energy and GHGs emission costs illustrated a trend of steady decrease with an increase of running time, see Figure 5a and Figure 5b. For instance, if the digester was only operated for one year, the energy and GHG emission cost for unit output will be 12.78 J and 8.88 × 10⁻⁴ g CO2-eq, in contrast to the values of 2.19 J and 4.54 × 10⁻⁵ g CO2-eq for a 20-year life cycle. It is also found that the rate of decrease of the cost has been gradually declining, especially during the first 5 years, and the decrease rate of energy and GHG emission cost have average values of 26% and 33%, respectively. However, the average rate of decline for the last 5 years is only 2% and 5%, which indicates that it is essential to ensure the stable operation of a digester during the first several years to offset the construction cost.
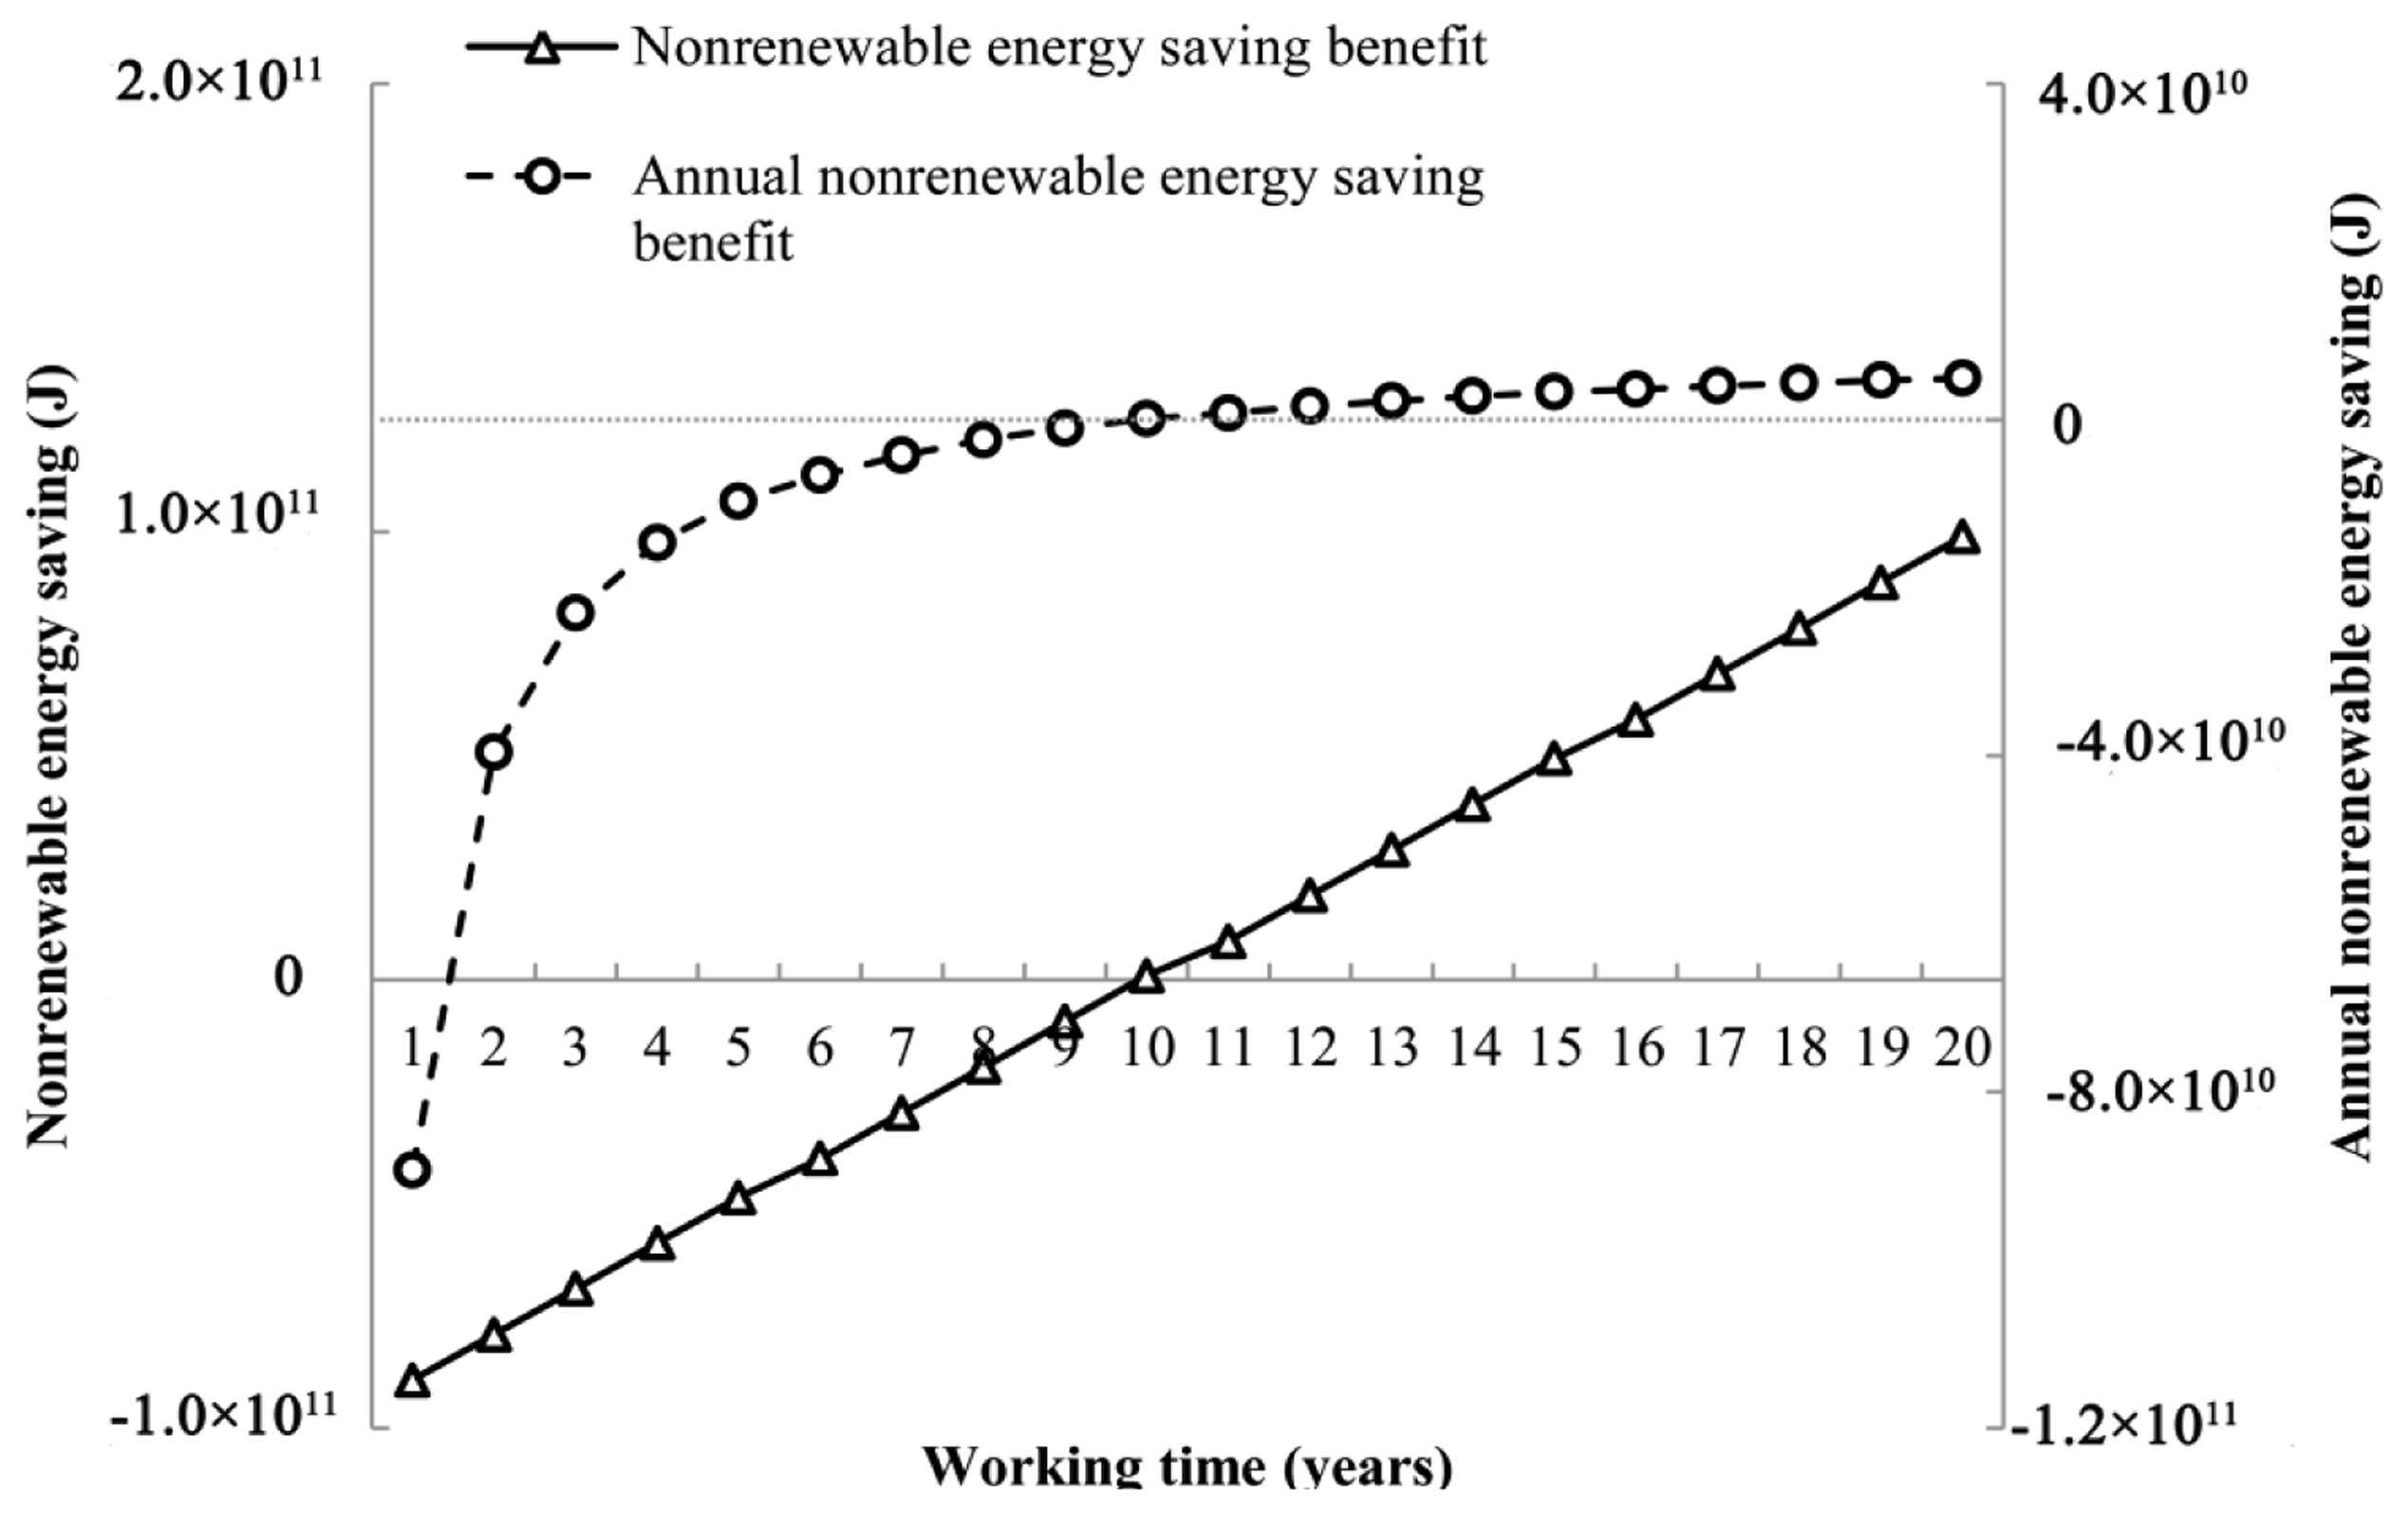
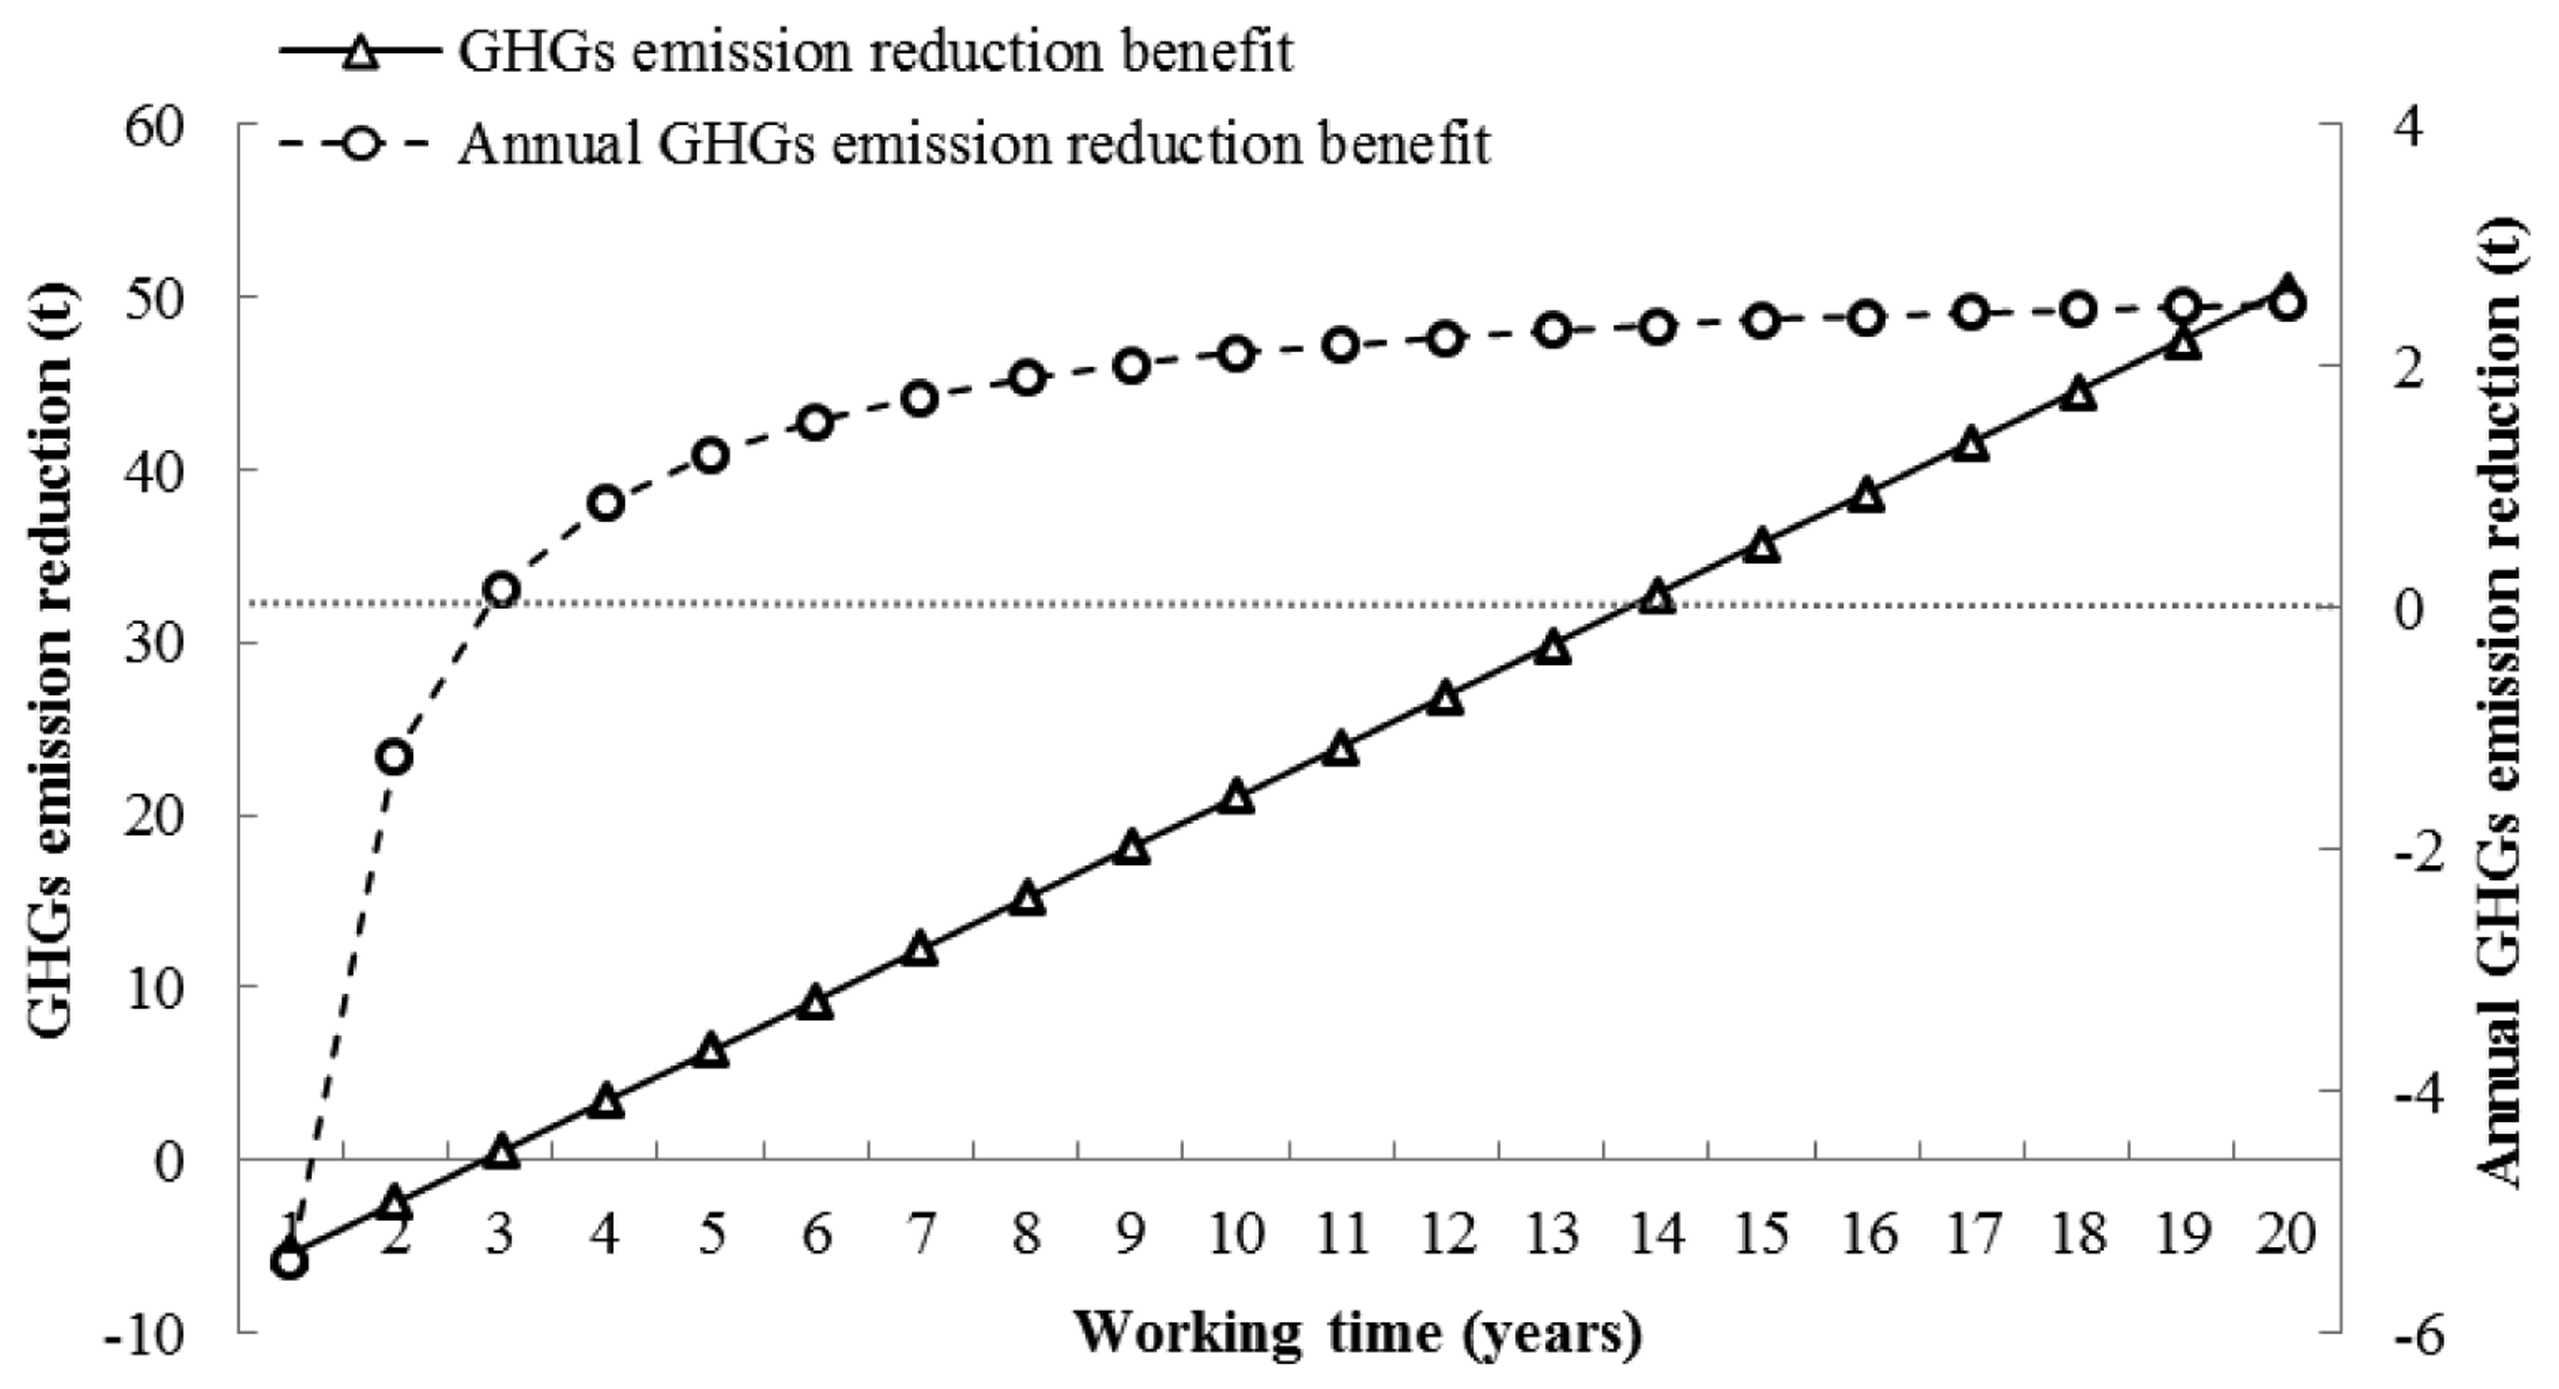
In line with the cost, the benefit variation of energy saving and GHG emission mitigation associated with different operating life is also illustrated in Figures 6 and 7, respectively. The total energy savings and GHG emissions reduced will increase linearly with the increase in operational life, due to the hypothesis of constant values for the annual manure disposal and biogas output. The total energy saving benefit is −8.93 × 10¹⁰ J under the condition of one year's operation, while it climbs to 9.89 × 10¹⁰ J if normally operated to its design life of 20 years. Similarly, the total GHG emission mitigation benefit increases from −5.40 to 50.45 t CO2-eq with the increase of operating life. The annual energy saving and GHG emission reduction benefit can be defined as the quotient of total benefits divided by operational life. Like the cost, these two annual benefits have also undergone a trend characterized by a gradually slowing growth rate with the variation of operational life from 1 to 20 years. The annual energy saving and GHG emission mitigation benefits increase from −8.93 × 10¹⁰ to 4.94 × 10⁹ J and from −5.40 to 2.52 t CO2-eq in its entire life cycle, respectively. The most meaningful findings that need to be highlighted are that to acquire positive net energy savings and GHG emission reduction benefits, a biogas digester must be operated for at least 10 and 3 years, respectively, according to the results shown in Figures 6 and 7.
4.3. Policy Implications
Theoretically, the rural household biogas system could be in normal operation for 20 years [25]. However, our primary survey of 150 household biogas projects in Guizhou Province shows that more than 42% of bio-digesters are abandoned within 2–3 years after their construction, which is consistent with previous investigations [42]. Among those that are still in use, about 32% encounter many obstacles such as unavailability of fermentation materials, leakage, and unstable biogas production. In rural areas, household biogas projects are often justified on the basis of the private benefits and cost accruing to the individual households [43]. In normal case, the payback period of a household biogas digester ranges from 3 to 5 years [44]. The disappointing operation of bio-digesters is detrimental for the fulfillment of its economic returns as well as energy saving and emission mitigation benefits [45].
For a long time, the phenomenon of emphasizing the construction but neglecting management has caused a profound impact on the development of rural household biogas projects in China. The Government often encourages the uptake of family-size bio-digesters by providing financial aid, leading to the successful development of pilot projects. Financial aids including subsidies and microfinance schemes are designed to facilitate the construction of new digesters, but more importantly, it can be concluded from this study that some incentives have to be provided for their sustained operation. In practice, the operation process of a biogas digester will encounter many bottlenecks, such as unavailability of fermentation material, poor follow-up management as well as the imperfect subsidy policy [45].
Livestock and poultry manure, especially those from pigs, are the main fermentation sources for biogas in rural China. With the changes of rural lifestyle, less materials for fermentation (animal manure, human excreta and other organic waste) is available because more and more pigs and other livestock are being kept and fed at intensive farms instead of individual households. Although alternative fermentation materials are regarded as replacements to supplement the inadequate manure source, including agricultural waste, solid municipal waste, as well as industrial organic waste and energy crops [46], the technical know-how is not advanced enough and economically viable to farmers. One of the possible approaches is to formulate policies for a manure exchange market between peasants and aquaculture enterprises. Nevertheless, the strategy of the wide promotion of household biogas projects should be re-examined with regard to the changes of resource and transition of rural society. Medium and large-scale biogas plants may comply with the changes in manure production associated with large scale animal husbandry.
The follow-up management of biogas digesters is another key issue in the operation of these units. Usually, the operation and maintenance work is poorly accomplished by famers themselves, due to their low level education and lack of technical advice. Important aspects such as regular cleaning of the digested slurry to ensure normal operation are neglected by farmers. The biogas tank and pipes often leak biogas after short operation times due to the poor construction quality and equipment. In fact, there are no standards to guide the production of the necessary components and equipment for household scale biogas systems, which are usually gathered from different market sources and have to be modified in order to fit together. Therefore, more financial and technical support, as well as policy on standardization of digester construction and technical support is badly needed to ensure the sustained operation of digesters, at least beyond the payback period of the various benefits (finance, energy saving, and GHG emission mitigation).
Although the results from this study intuitively provide a basis for energy savings and carbon reduction benefits based on long term system viability, the local farmers' choices are largely determined by the short term economic benefits and other related factors, since environmental support is generally not perceived as an important aspect in biogas development and management. To rural families who receive services from the biogas digesters, the benefits include cleaner energy, time saved on firewood collection, as well as digest slurry used as organic fertilizer; Increased off-farming employment income in urban areas, unstable biogas supply as well as relatively complicated operation and maintenance (for not well educated local farmers) make rural house biogas projects less and less attractive. Farmers would like to go to work in cities and then purchase commercial energy supplies such as coal and electricity using money earned in city. The indirect benefits acquired from a household biogas system, such as mitigation of methane, a powerful GHG released from the open decomposition of animal wastes, and preventing carbon dioxide emissions from burning firewood and fossil energy, have no direct impact on farmers' attitudes toward biogas systems. These positive externalities of the household biogas utilization can be internalized by subsidies or compensation [47,48]. Some research has pointed out that society is likely to benefit more than just the individual recipient does [49]. The current subsidy schemes largely focus on the construction stage, but do not necessarily ensure sustained operation, which is essential for the environmental benefits. Therefore, there is an urgent need to readjust the related subsidy system to encourage household digester owners to maximize the utilization of carbon emission reduction potential by ensuring long-term running, e.g., the subsides could be provided on the basis of the actual consumption of biogas from digesters by rural families. It is important to note that an overall evaluation of the ecological service function of rural household biogas program should be implemented, which will provide the criteria for subsidies or ecological compensation.
5. Conclusions
A systematic energy and GHG emission analysis of the household biogas project in rural China is conducted to find the energetic and GHG emission cost of biogas utilization and its energy saving and GHG emission reduction benefits with regard to different running time scenarios. In a typical household biogas system with a 8 m3 digester which is very popular in South China and known as the Three In One Model, the energy cost (Ecost) requirement and the GHG emission per unit output of biogas are 2.19 J and 4.54 × 10⁻⁵g CO2-eq, respectively. The non-renewable energy cost (NEcost) is 0.56 J, indicating a relatively acceptable renewability of the biogas system with respect to full life cycle normal operation. The analysis also indicates that a large proportion of energy invested and GHGs are derived from the digester construction phase and the three required renovations for their large concrete and steel usage. Further, considering the disposal of manure and energy substitution, the results show that the total energy saved (Eben) and GHG emission mitigated (GHGben) by a rural household biogas digester are 9.89 × 10¹⁰ J and 50.45 t CO2-eq during its 20 year entire life cycle. By scenario analysis of running life, the household biogas system must be run for at least 10 and 3 years, respectively, to enjoy these positive net energy saving and GHGs emission reduction benefits. However, in practice, rural household biogas projects suffer from a high rate of obsolescence, due to fermentation material shortages, poor follow-up services and inappropriate financial subsidies.
With regard to the sustainable operation of the household biogas project, several points should be clarified in consideration of the analysis result in this paper. Firstly, the strategy of the wide promotion of household biogas projects should be re-examined with regard to the changes of resource availability and the transition of rural society. Medium and large-scale biogas plants may comply better with the changes in manure production associated with large scale animal husbandry. Secondly, the equipment standardization and professional technical services for maintenance are a primary urgent task. Lastly, institutional innovation on economic subsidy methods is essential, with respect to the energy saving and GHG emission reduction benefits of rural household biogas systems in China.
It is important to note that the results obtained in this study could have been affected by the rough estimation of parameters like manure disposal and problems inherent in the input-output method for estimation of embodied resource coefficients. Nevertheless, it is a starting point for systematic evaluation of rural household biogas projects as well as other renewable energy alternatives.
Acknowledgments
This work was supported by the National Natural Science Foundation of China (Grant No. 41371521) and National Science Foundation for Innovative Research Group (Grant No. 51121003).
Conflicts of Interest
The authors declare no conflict of interest.
References
- Guo, S.Y.; Pu, J.H. Early History of Biogas in China; Science and Technology Literature Press, Chongqing Branch: Chongqing, China, 1988; in Chinese. [Google Scholar]
- Chen, Y.; Yang, G.H.; Sweeney, S.; Feng, Y.Z. Household biogas use in rural China: A study of opportunities and constraints. Renew. Sustain. Energy Rev. 2010, 14, 545–549. [Google Scholar]
- Liu, Y.; Kuang, Y.Q.; Huang, N.S.; Wu, Z.F.; Xu, L.Z. Popularizing household-scale biogas digesters for rural sustainable energy development and greenhouse gas mitigation. Renew. Energy 2008, 33, 2027–2035. [Google Scholar]
- Jiang, X.Y.; Sommer, S.G.; Christensen, K.V. A review of the biogas industry in China. Energy Policy 2011, 39, 6073–6081. [Google Scholar]
- Thu, C.T.T.; Cuong, P.H.; Hang, L.T.; Chao, N.V.; Anh, L.X.; Trach, N.X.; Sommer, S.G. Manure management practices on biogas and non-biogas and non-biogas pig farms in developing countries e using livestock farms in Vietnam as an example. J. Clean Prod. 2012, 27, 64–71. [Google Scholar]
- Borjesson, P.; Tufvesson, L.M. Agricultural crop-based bio-fuel-resource efficiency and environmental performance including direct land use changes. J. Clean. Prod. 2011, 19, 108–120. [Google Scholar]
- Zhang, L.X.; Wang, C.B.; Song, B. Carbon emission reduction potential of a typical household biogas system in China. J. Clean Prod. 2013, 47, 415–421. [Google Scholar]
- Lave, L.B.; Cobas-Flores, E.; Hendrickson, C.T.; McMichael, F.C. Using input-output analysis to estimate economy-wide discharges. Environ. Sci. Technol. 1995, 29, 420A–426A. [Google Scholar]
- Joshi, S. Product environmental life-cycle assessment using input-output techniques. J. Ind. Ecol. 1999, 3, 95–120. [Google Scholar]
- Hendrickson, C.T.; Lave, L.B.; Matthews, H.S. Environmental Life Cycle Assessment of Goods and Services: An Input-Output Approach; Resource for the Future: Washington, DC, USA, 2006. [Google Scholar]
- Yang, Q.; Chen, B.; Xi, J.; He, Y.F.; Chen, G.Q. Exergetic evaluation of corn-ethanol production in China. Commun. Nonlinear Sci. Numer. Simul. 2009, 14, 2450–2461. [Google Scholar]
- Baral, A.; Baksh, B.R. Comparative Study of Biofuels vs. Petroleum Fuels Using Input-Output Hybrid Life-Cycle Assessment. Proceedings of the AlChE 2006 Annual Meeting, San Francisco, CA, USA, 12–17 November 2006; Available online: http://www.nt.ntnu.no/users/skoge/prost/proceedings/aiche-2006/data/papers/P69370.pdf (accessed on 18 November 2013).
- Baral, A.; Bakshi, B.R. Emergy analysis using US economic input-output models with application to life cycles of gasoline and corn ethanol. Ecol. Model. 2010, 221, 1807–1818. [Google Scholar]
- Li, X.H.; Ji, J.P.; Ma, X.M.; Wang, J.T. Life cycle greenhouse gas emission assessement of fuel ethanol based on EIO-LCA. Acta. Sci. Nat. Univ. Pekin. 2011, 47, 1–8, in Chinese. [Google Scholar]
- Yang, Q.; Chen, G.Q. Nonrenewable energy cost of corn-ethanol in China. Energy Policy 2012, 41, 340–347. [Google Scholar]
- Yang, Q.; Chen, G.Q. Greenhouse gas emission of corn-ethanol production in China. Ecol. Model. 2013, 252, 176–184. [Google Scholar]
- Chen, G.Q.; Yang, Q.; Zhao, Y.H. Renewability of wind power in China: A case study of nonrenewable energy cost and greenhouse gas emission by a plant in Guangxi. Renew. Sustain. Energy Rev. 2011, 15, 2322–2329. [Google Scholar]
- Chen, G.Q.; Yang, Q.; Zhao, Y.H.; Wang, Z.F. Nonrenewable energy cost and greenhouse gas emissions of a 1.5 MW solar power tower plant in China. Renew. Sustain. Energy Rev. 2011, 15, 1961–1967. [Google Scholar]
- Wang, C.B.; Zhang, L.X.; Yang, S.Y.; Pang, M.Y. A hybrid life-cycle assessment of nonrenewable energy and greenhouse-gas emissions of a village-level biomass gasification project in China. Energies 2012, 5, 2708–2723. [Google Scholar]
- Wang, C.B.; Zhang, L.X.; Liu, J. Cost of non-renewable energy in production of wood pellets in China. Front. Earth Sci. 2013, 7, 199–205. [Google Scholar]
- Wang, G.H. Analysis method on reducing emission of SO2 and CO2 rural energy construction. Trans. Chin. Soc. Agric. Eng. 1999, 15, 169–172, in Chinese. [Google Scholar]
- Wang, X.H.; Li, J.F. Influence of using household biogas digesters on household energy consumption in rural areas-a case study in Lianshui County in China. Renew. Sustain. Energy Rev. 2005, 9, 229–236. [Google Scholar]
- Zhang, P.D.; Jia, G.M.; Wang, G. Contribution to emission reduction of CO2 and SO2 by household biogas construction in rural China. Renew. Sustain. Energy Rev. 2007, 11, 1903–1912. [Google Scholar]
- Shen, L.F.; Wang, Q.; Xuan, Z.; Ma, Q.L.; Zhao, Q.Y.; Zhang, Q.G. Effects of household biogas pond construction on energy-saving, emission-reducing and increase in farmers' income. Trans. Chin. Soc. Agric. Eng. 2009, 10, 220–226, in Chinese. [Google Scholar]
- Wang, M.X.; Xia, X.F.; Chai, Y.H.; Liu, J.G. Life cycle energy conservation and emissions reduction benefits of rural household biogas project. Trans. Chin. Soc. Agric. Eng. 2010, 11, 245–250, in Chinese. [Google Scholar]
- Poeschl, M.; Ward, S.; Owende, P. Environmental impacts of biogas deployment—Part I: Life cycle inventory for evaluation of production process emissions to air. J. Clean Prod. 2012, 24, 168–183. [Google Scholar]
- Poeschl, M.; Ward, S.; Owende, P. Environmental impacts of biogas deployment—Part II: Life cycle assessment of multiple production and utilization pathways. J. Clean Prod. 2012, 24, 184–201. [Google Scholar]
- Dong, H.M.; Li, Y.E.; Zhu, Z.P.; Tao, X.P. Greenhouse gas emission reduction potential of rural household biogas CDM project. Trans. Chin. Soc. Agric. Eng. 2009, 25, 293–297, in Chinese. [Google Scholar]
- Wang, Y.M.; Liu, R.H.; Bian, Z.M. Economic evaluation on trinity biogas ecosystem. Renew. Energy 2005, 116, 39–42, in Chinese. [Google Scholar]
- Cherubini, F.; Bargigli, S.; Ulgiati, S. Life cycle assessment (LCA) of waste management strategies: Landfilling, sorting plant and incineration. Energy 2009, 34, 2116–2123. [Google Scholar]
- Cleveland, C.; Costanza, R. Energy Return on Investment (EROI). Available online: http://www.eoearth.org/article/Energy_return_on_investment_(EROI) (accessed on 18 November 2013).
- Chen, H.; Chen, G.Q. Energy cost of rapeseed-based biodiesel as alternative energy in China. Renew. Energy 2011, 36, 1374–1378. [Google Scholar]
- Purohit, P.; Kandpal, T.C. Techno-economics of biogas-based water pumping in India: An attempt to internalize CO2 emissions mitigation and other economic benefits. Renew. Sustain. Energy Rev. 2007, 11, 1208–1226. [Google Scholar]
- Zhou, J.B. Embodied Ecological Elements Accounting of National Economy; Peking University: Beijing, China, 2008; in Chinese. [Google Scholar]
- Chen, G.Q.; Chen, Z.M. Carbon emissions and resources use by Chinese economy 2007: A 135-secotor inventory and input-output embodiment. Commun. Nonlinear Sci. Numer. Simul. 2010, 15, 3647–3732. [Google Scholar]
- Ptasinski, K.J.; Prins, M.J.; Pierik, A. Exergetic evaluation of biomass gasification. Energy 2007, 32, 568–574. [Google Scholar]
- Wang, C.B.; Zhang, L.X.; Li, G.S. The accounting of carbon emissions from energy combustion in rural China. Trans. Chin. Soc. Agric. Eng. 2011, 27, 6–16, in Chinese. [Google Scholar]
- Intergovernmental Panel on Climate Change (IPCC). 2006 IPCC Guidelines for National Greenhouse Gas Inventories; The National Greenhouse Gas Inventories Programme, Institute for Global Environmental Strategies (IGES): Tokyo, Japan, 2007. [Google Scholar]
- Liu, L.N.; Wang, X.H. Life cycle assessment of biogas eco-agricultural mode. China Biogas 2008, 26, 17–24, in Chinese. [Google Scholar]
- Ministry of Agriculture (MOA). Technology Criterion on Rural Biogas Digester and Three Renovations. Available online: http://wenku.baidu.com/view/3b5ad9c24028915f804dc264.html (accessed on 18 November 2013).
- Ishikawa, S.; Hoshiba, S.; Hinata, T.; Hishinuma, T.; Morita, S. Evaluation of a biogas plant from life cycle assessment (LCA). Int. Congr. Ser. 2006, 1293, 230–233. [Google Scholar]
- Dhingra, R.; Christensen, E.R.; Liu, Y.; Zhong, B.; Wu, C.F.; Yost, M.G.; Remais, J.V. Greenhouse gas emission reductions from domestic anaerobic digesters linked with sustainable sanitation in rural China. Environ. Sci. Technol. 2011, 45, 2345–2352. [Google Scholar]
- Srinivasan, S. Positive externalities of domestic biogas initiatives: Implications for financing. Renew. Sustain. Energy Rev. 2008, 12, 1467–1484. [Google Scholar]
- Fan, J.C.; Wang, Y.G.; Qin, S.P. Economic evaluation of biomass energy technology. Energy Eng. 2003, 4, 19–23, in Chinese. [Google Scholar]
- Han, J.Y.; Mol, A.P.J.; Lu, Y.L.; Zhang, L. Small-scale bio-energy projects in rural China: Lessons to be learnt. Energy Policy 2008, 36, 2154–2162. [Google Scholar]
- Pang, Y.Z.; Liu, Y.P.; Li, X.J.; Wang, K.S.; Yuan, H.R. Improving biodegradability and biogas production of corn stover through sodium hydroxide solid state pretreatment. Energy Fuel 2008, 22, 2761–2766. [Google Scholar]
- Bala, B.K.; Hossain, M.M. Economics of biogas digesters in Bangladesh. Energy 1992, 17, 939–944. [Google Scholar]
- Tampier, M. Distributed Energy Utilities—It is all about Financing. Available online: http://www.renewableenergyaccess.com/rea/news/story?id=44964 (accessed on 18 November 2013).
- Clarke, G.S.R.G.; Wallsten, S.J. Universal Service: Empirical Evidence on the Provision of Infrastructure Services to Rural and Poor Urban Consumers. In Infrastructure for Poor People; Brook, P.J., Irwin, T.C., Eds.; The World Bank: Washington, DC, USA, 2003. [Google Scholar]


| Item | Component | Materials | Quantity | Unit | Energy intensity (J/Unit)a | Non-renewable energy intensity (J/Unit)b | GHG intensity (tCO2-eq/Unit) | Energy (J) | Non-renewable energy (J) | GHG (tCO2-eq) |
|---|---|---|---|---|---|---|---|---|---|---|
| Digester building | ||||||||||
| Tank | Concrete | 3.30 × 100 | t | 6.35 × 10⁹ | 6.03 × 10⁹ | 5.30 × 10⁻¹ | 2.10 × 10¹⁰ | 1.99 × 10¹⁰ | 1.75 × 100 | |
| Steel | 2.00 × 10⁻² | t | 3.43 × 10¹⁰ | 3.26 × 10¹⁰ | 1.39 × 100 | 6.86 × 10⁸ | 6.52 × 10⁸ | 2.78 × 10⁻² | ||
| Pipe and fittings | Synthetic rubber | 3.00 × 10⁻² | t | 3.19 × 10¹⁰ | 2.66 × 10¹⁰ | 1.02 × 100 | 9.57 × 10⁸ | 7.99 × 10⁸ | 3.06 × 10⁻² | |
| Charging pipe | Plastic | 5.00 × 10⁻³ | t | 1.08 × 10¹¹ | 1.04 × 10¹¹ | 2.99 × 100 | 5.40 × 10⁸ | 5.19 × 10⁸ | 1.50 × 10⁻² | |
| Sealants | Synthetic rubber | 1.00 × 10−03 | t | 3.19 × 10¹⁰ | 2.66 × 10¹⁰ | 1.02 × 100 | 3.19 × 10⁷ | 2.66 × 10⁷ | 1.02 × 10⁻³ | |
| Subtotal | 2.32 × 10¹⁰ | 2.19 × 10¹⁰ | 1.82 × 100 | |||||||
| Toilet renovation | ||||||||||
| Wall | Concrete | 4.00 × 100 | t | 6.35 × 10⁹ | 6.03 × 10⁹ | 5.30 × 10⁻¹ | 2.54 × 10¹⁰ | 2.41 × 10¹⁰ | 2.12 × 100 | |
| Steel | 2.50 × 10⁻³ | t | 3.43 × 10¹⁰ | 3.26 × 10¹⁰ | 1.39 × 100 | 8.58 × 10⁷ | 8.15 × 10⁷ | 3.48 × 10⁻³ | ||
| Urinal | Refractory | 3.00 × 10⁻² | t | 1.37 × 10¹⁰ | 1.30 × 10¹⁰ | 3.00 × 10⁻¹ | 4.11 × 10⁸ | 3.91 × 10⁸ | 9.00 × 10⁻³ | |
| Door | Timber | 2.34 × 10⁻¹ | m3 | 5.22 × 10⁹ | 3.40 × 10⁹ | 1.30 × 10⁻¹ | 1.22 × 10⁹ | 7.95 × 10⁸ | 3.04 × 10⁻² | |
| Subtotal | 2.71 × 10¹⁰ | 2.54 × 10¹⁰ | 2.16 × 100 | |||||||
| Stove renovation | ||||||||||
| Wall | Concrete | 1.76 × 10⁻¹ | t | 6.35 × 10⁹ | 6.03 × 10⁹ | 5.30 × 10⁻¹ | 1.12 × 10⁹ | 1.06 × 10⁹ | 9.33 × 10⁻² | |
| Steel | 2.50 × 10⁻³ | t | 3.43 × 10¹⁰ | 3.26 × 10¹⁰ | 1.39 × 100 | 8.58 × 10⁷ | 8.15 × 10⁷ | 3.48 × 10⁻³ | ||
| Stove | Iron alloy | 1.00 × 10⁻² | t | 1.04 × 10¹¹ | 9.98 × 10¹⁰ | 2.96 × 100 | 1.04 × 10⁹ | 9.98 × 10⁸ | 2.96 × 10⁻² | |
| Cast iron | 5.00 × 10⁻⁴ | t | 3.08 × 10¹⁰ | 2.93 × 10¹⁰ | 1.25 × 100 | 1.54 × 10⁷ | 1.47 × 10⁷ | 6.25 × 10⁻⁴ | ||
| Governor and airway | Plastic | 2.00 × 10⁻³ | t | 1.08 × 10¹¹ | 1.04 × 10¹¹ | 2.99 × 100 | 2.16 × 10⁸ | 2.07 × 10⁸ | 5.98 × 10⁻³ | |
| Subtotal | 2.47 × 10⁹ | 2.36 × 10⁹ | 1.33 × 10⁻¹ | |||||||
| Pigpen renovation | ||||||||||
| Wall and ground | Concrete | 6.93 × 100 | t | 6.35 × 10⁹ | 6.03 × 10⁹ | 5.30 × 10⁻¹ | 4.40 × 10¹⁰ | 4.18 × 10¹⁰ | 3.67 × 100 | |
| Precast hollow slab | Concrete | 8.00 × 10⁻¹ | t | 6.35 × 10⁹ | 6.03 × 10⁹ | 5.30 × 10⁻¹ | 5.08 × 10⁹ | 4.82 × 10⁹ | 4.24 × 10⁻¹ | |
| steel | 1.00 × 10⁻¹ | t | 3.43 × 10¹⁰ | 3.26 × 10¹⁰ | 1.39 × 100 | 3.43 × 10⁹ | 3.26 × 10⁹ | 1.39 × 10⁻¹ | ||
| Subtotal | 5.25 × 10¹⁰ | 4.99 × 10¹⁰ | 4.23 × 100 | |||||||
| Operation and maintenance | ||||||||||
| Pipe and fittings | Synthetic rubber | 9.00 × 10⁻² | t | 3.19 × 10¹⁰ | 2.66 × 10¹⁰ | 1.02 × 100 | 2.87 × 10⁹ | 2.40 × 10⁹ | 9.18 × 10⁻² | |
| Charging pipe | Plastic | 1.50 × 10⁻² | t | 1.08 × 10¹¹ | 1.04 × 10¹¹ | 2.99 × 100 | 1.62 × 10⁹ | 1.56 × 10⁹ | 4.49 × 10⁻² | |
| Governor and airway | Plastic | 6.00 × 10⁻³ | t | 1.08 × 10¹¹ | 1.04 × 10¹¹ | 2.99 × 100 | 6.48 × 10⁸ | 6.22 × 10⁸ | 1.79 × 10⁻² | |
| Stove | Iron alloy | 1.00 × 10⁻² | t | 1.04 × 10¹¹ | 9.98 × 10¹⁰ | 2.96 × 100 | 1.04 × 10⁹ | 9.98 × 10⁸ | 2.96 × 10⁻² | |
| Cast iron | 5.00 × 10⁻⁴ | t | 3.08 × 10¹⁰ | 2.93 × 10¹⁰ | 1.25 × 100 | 1.54 × 10⁷ | 1.47 × 10⁷ | 6.25 × 10⁻⁴ | ||
| Fermentation material | Manure | 2.40 × 101 | t | 1.25 × 10¹⁰ | 3.01 × 10¹¹ | |||||
| Subtotal | 3.07 × 10¹¹ | 5.59 × 10⁹ | 1.85 × 10⁻¹ | |||||||
| Total | 4.13 × 10¹¹ | 1.05 × 10¹¹ | 8.54 × 100 | |||||||
a, bFor all the resource inputs except fermentation material of manure, they refer to embodied energy or non-renewable energy intensities, i.e., the energy or non-renewable energy that are required when produce these resource items. For manure, they refer to energy content of this biomass material while the energy invested to produce it is ignored, since it is the by-product of livestock farming and more importantly that energy is very minor compared to its own energy content.
© 2014 by the authors; licensee MDPI, Basel, Switzerland. This article is an open access article distributed under the terms and conditions of the Creative Commons Attribution license ( http://creativecommons.org/licenses/by/3.0/).
Share and Cite
Zhang, L.; Wang, C. Energy and GHG Analysis of Rural Household Biogas Systems in China. Energies 2014, 7, 767-784. https://doi.org/10.3390/en7020767
Zhang L, Wang C. Energy and GHG Analysis of Rural Household Biogas Systems in China. Energies. 2014; 7(2):767-784. https://doi.org/10.3390/en7020767
Chicago/Turabian StyleZhang, Lixiao, and Changbo Wang. 2014. "Energy and GHG Analysis of Rural Household Biogas Systems in China" Energies 7, no. 2: 767-784. https://doi.org/10.3390/en7020767