The Influence of Loading Rate and Variable Temperatures on Microbial Communities in Anaerobic Digesters


Abstract
: The relationship between seasonal temperatures, organic loading rate (OLR) and the structure of archaeal communities in anaerobic digesters was investigated. Previous studies have often assessed archaeal community structure at fixed temperatures and constant OLRs, or at variable temperatures not characteristic of temperate climates. The goal of this study was to determine the maximum OLR that would maintain a balanced microbial ecosystem during operation in a variable temperature range expected in a temperate climate (27–10 °C). Four-liter laboratory digesters were operated in a semi-continuous mode using dairy cow manure as the feedstock. At OLRs of 1.8 and 0.8 kg VS/m3·day the digesters soured (pH < 6.5) as a result of a decrease in temperature. The structure of the archaeal community in the sour digesters became increasingly similar to the manure feedstock with gains in the relative abundance of hydrogenotrophic methanogens. At an OLR of 0.3 kg VS/m3·day the digesters did not sour, but the archaeal community was primarily hydrogenotrophic methanogens. Recommendations for operating an ambient temperature digester year round in a temperate climate are to reduce the OLR to at least 0.3 kg VS/m3·day in colder temperatures to prevent a shift to the microbial community associated with the sour digesters.
1. Introduction
Anaerobic digestion, the microbial degradation of organic matter in the absence of molecular oxygen, is utilized as a method of waste treatment and renewable energy production. Bacteria convert carbohydrates, lipids and proteins to short chain fatty acids, hydrogen and carbon dioxide that are then utilized by the archaea to produce methane and carbon dioxide [1]. Anaerobic digesters have been built on many different scales worldwide from large mechanized systems operating at constant temperatures to smaller family and community digesters that lack temperature control [2]. There are more than 30 million small-scale ambient temperature fixed-dome, floating dome and Taiwanese model anaerobic digesters in Asia and Latin America [3,4]. In temperate climates, biogas yield in these systems is reduced at colder temperatures and may be accompanied by process upset and souring of the digester during winter [5].
A sour digester is characterized by a reduction in pH below the range (6.5 to 7.6) that is typically considered optimal for anaerobic digestion [6]. A digester can sour in colder climates because archaea are more sensitive than bacteria to inhibitory conditions such as low temperature and pH. As the temperature decreases, the slower relative growth and decreased activity of the archaea results in accumulation of volatile fatty acids (VFAs) and a subsequent drop in pH. Accumulated VFAs further inhibit the archaeal community and eventually the sour digester fails completely and the production of methane ceases [7].
The primary goal of this study was to determine the maximum organic loading rate (OLR) that would maintain a balanced microbial ecosystem during operation in a variable temperature range expected in a temperate climate (27–10 °C). The effect of three different OLRs on the structure and function of the archaeal communities was evaluated during temperature phases representative of temperate climates using terminal restriction fragment length polymorphisms (T-RFLP) of 16S rRNA genes. Increased knowledge of the microbial community response to environmental and operational changes may lead to greater understanding of factors influencing anaerobic digestion and result in more efficient systems [8].
There have been many studies that have assessed the effect of OLRs on the archaeal community structure but they have often been conducted at fixed temperatures. Rincón et al. [9] investigated the archaeal community structure in a mesophilic (35 °C) laboratory digester processing olive mill solid residue at loading rates ranging from 0.8–11.0 g COD/L. They found that the archaeal community remained relatively stable in the presence of increasing OLR with the genus Methanosaeta remaining the most abundant. Bialek et al. [10] assessed the archaeal community response and digester performance in a psychrophilic (10 °C) laboratory EGSB reactor at loading rates between 0.5 and 5 kg COD m−3·day−1. The acetolastic Methanosaeta remained the most abundant taxa at all loading rates, but the levels of hydrogenotrophic methanogens increased at above 2 kg COD m−3·day−1. Above this loading rate, the COD removal efficiency of the reactor began to decline and there were increasing levels of VFAs in the digester effluent. The digester performance recovered after subsequent reduction of the OLR to 2 kg COD m−3·day−1.
Other studies [11] have assessed the impact of different loading rates (10–3.75 kg COD m−3·day−1) and variable temperatures 15–4 °C on microbial communities dynamics and digester performance. These authors found a decrease in the relative abundance of Methanosaeta-like acetoclasitc methanogens and an increase in the abundance of Methanocorpusculum-like hydrogenotrophic methanogens as the temperature and OLR were reduced during the course of the experiment. Despite the decrease in abundance Methanosaeta-like methaogens remained in the reactor throughout the experiment. Although some reduction in COD removal efficiency occurred with temperature, the digester in this study continued to demonstrate process stability at 4 °C. While these authors were able to maintain high OLRs at psychrophilic temperatures, the slow temperature decline (1,162 days) is not characteristic of the type of variable temperature changes that would be seen in an ambient temperature digester in a temperate climate.
Additional studies have described the shifts in microbial communities in response to ambient temperature change, but did not assess different organic loading rates. Rastogi et al. [12], used methyl-coenzyme M reductase A (mcrA) genes to characterize the difference between the summer and winter methanogen communities. They sampled a 25-liter KVIC model floating dome digester in April (36 °C) and December (24.2 °C). They found that the methanogen community became less diverse in the colder weather, with an increase in the percent abundance of the Methanomicrobiales clones to 98.6%. These authors also reported a corresponding drop in the volume of biogas produced from 14.5 to 11.0 L/day and an increase in volatile fatty acids and a drop in pH.
The secondary goal of this study was to assess the reproducibility of laboratory scale reactors both in terms of microbial community structure and performance. Studies using laboratory scale reactors have often been conducted without replication of the different treatments or with feedstocks other than cow manure or processes other than anaerobic digestion [13–17].
2. Results and Discussion
2.1. High OLR (1.8 kg VS/m3·Day) Digesters
2.1.1. Digester Performance
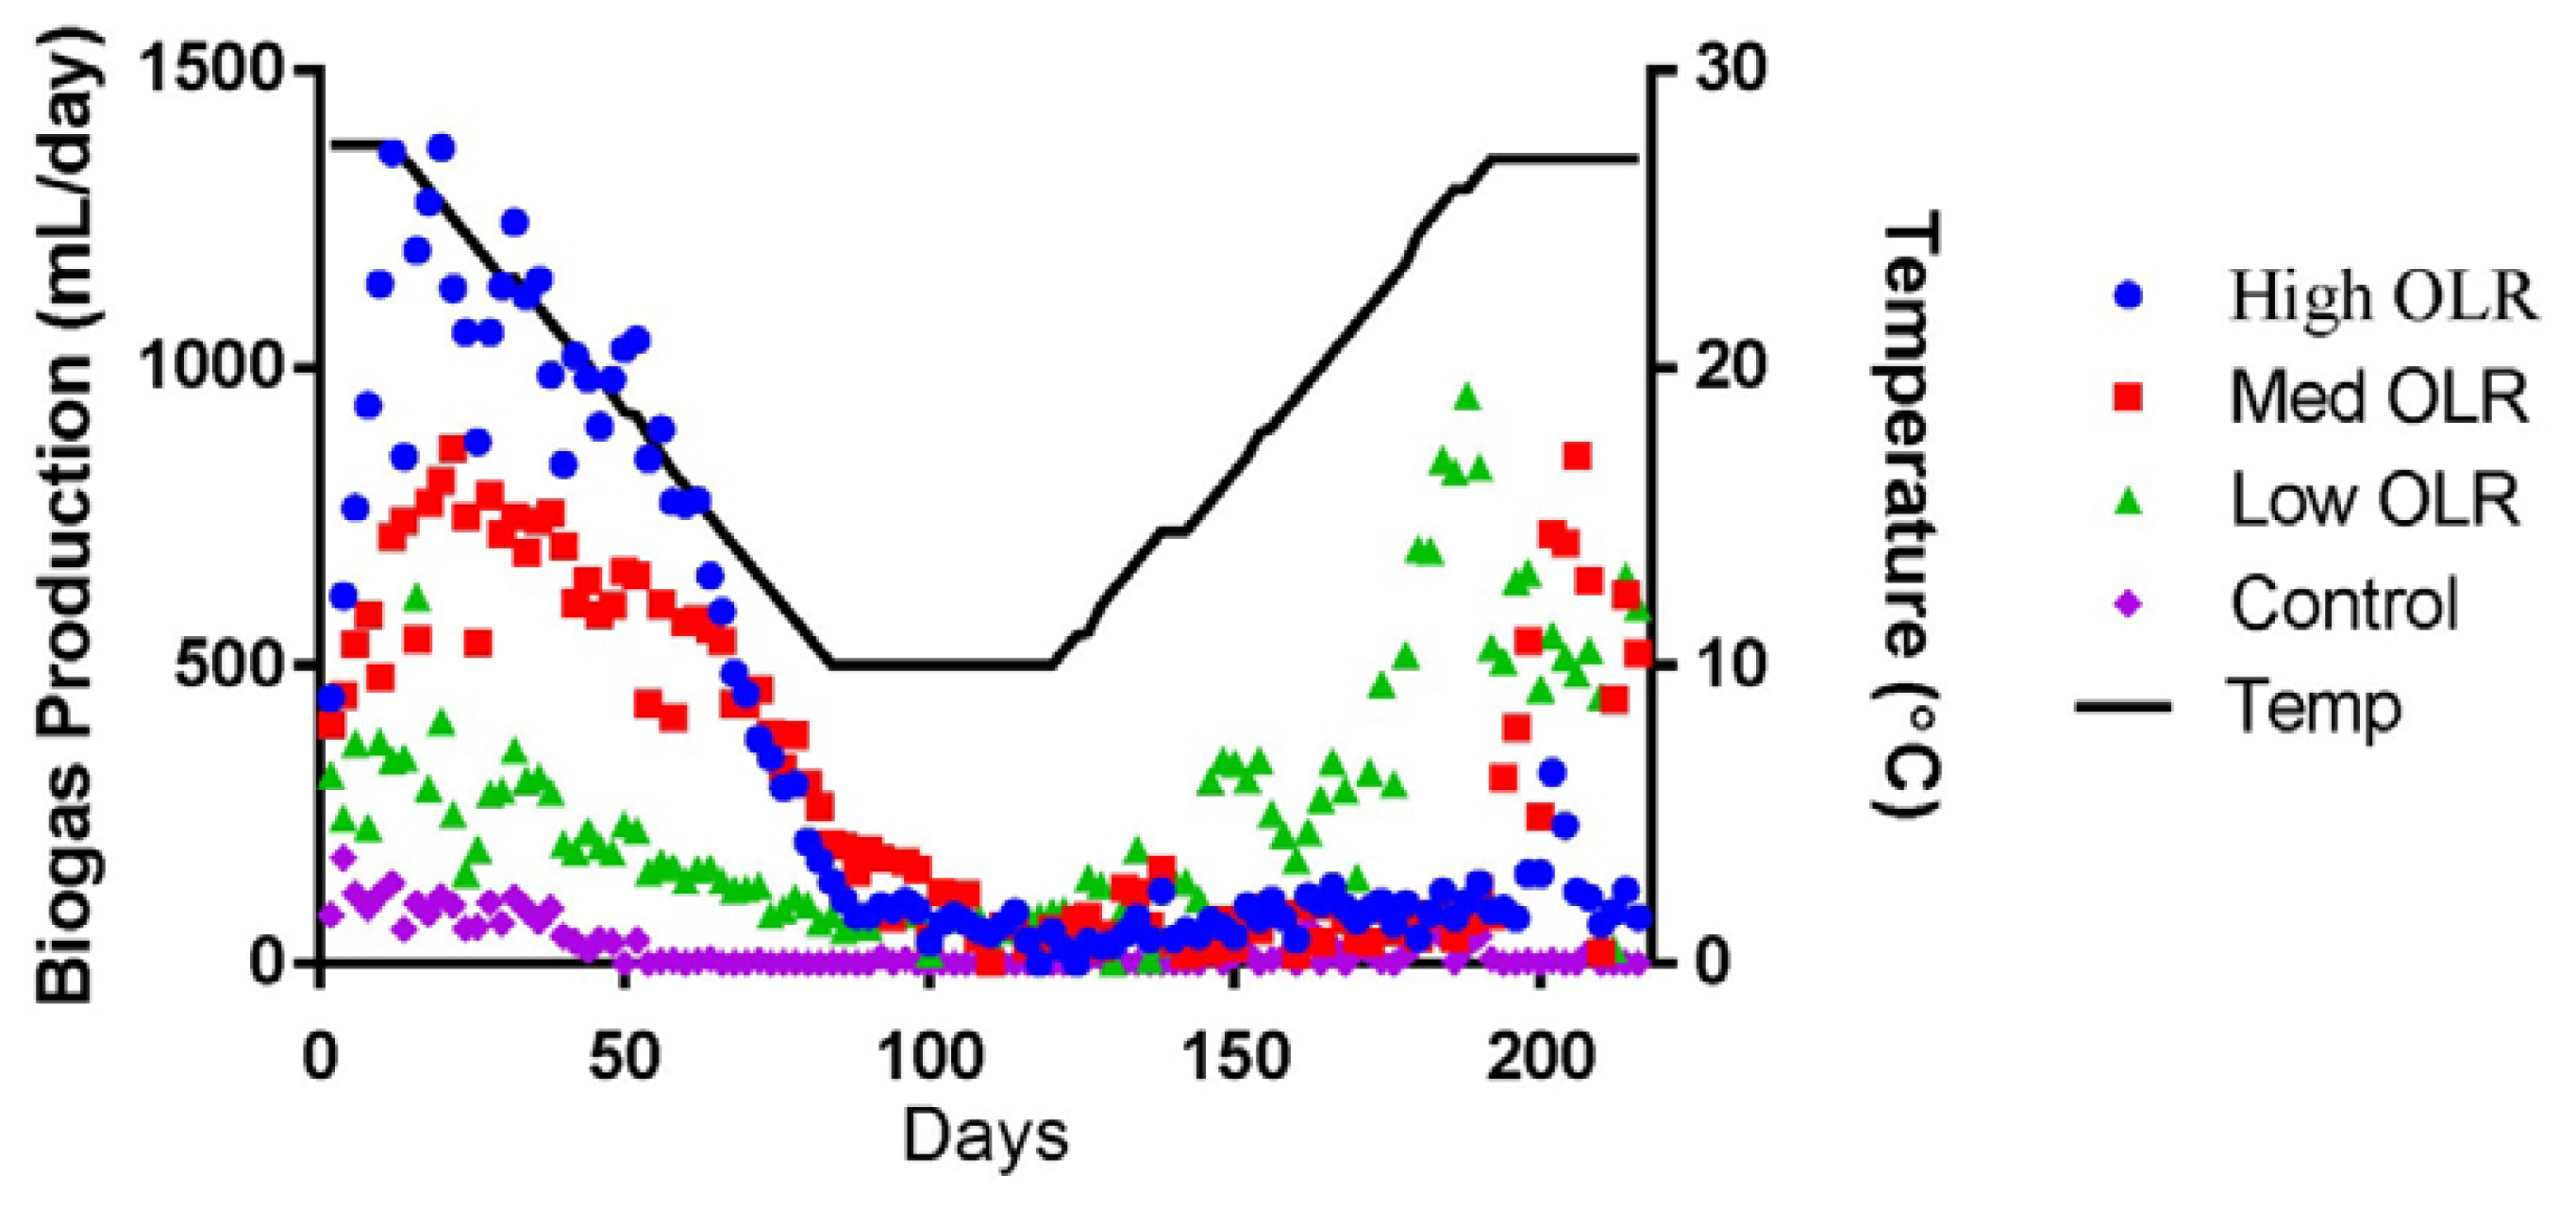
The average daily biogas production declined during the decreasing temperature phase from 1,360 to 173 mL/day (Figure 1) and the %CH4 declined from 54% to 34%. During this same time period, the average pH in the High OLR digesters declined from 7.71 to 6.92 and the VFA/Alkalinity ratio increased from 0.17 to 0.65. VFA/Alkalinity values between 0.3 and 0.4 are typically indicators of stable anaerobic digestions with maximum biogas yield for a particular temperature [18]. The value of 0.65 on day 82 indicated that the maximum loading rate had already been exceeded for 10 °C. The VFA/Alkalinity ratio exceed 0.4 on day 78 (11.5 °C) but the sour pH (<6.5) did not occur until day 100 during the stationary temperature phase. The performance of the High OLR digesters continued to decline during the stationary and increasing temperature phases. Biogas production remained low (77 mL/day; 19 %CH4) at the end of the experiment indicating process failure. The final average pH of the sour digesters was 5.52 and the VFA/Alkalinity ratio was 4.47.
2.1.2. Archaeal Community Dynamics
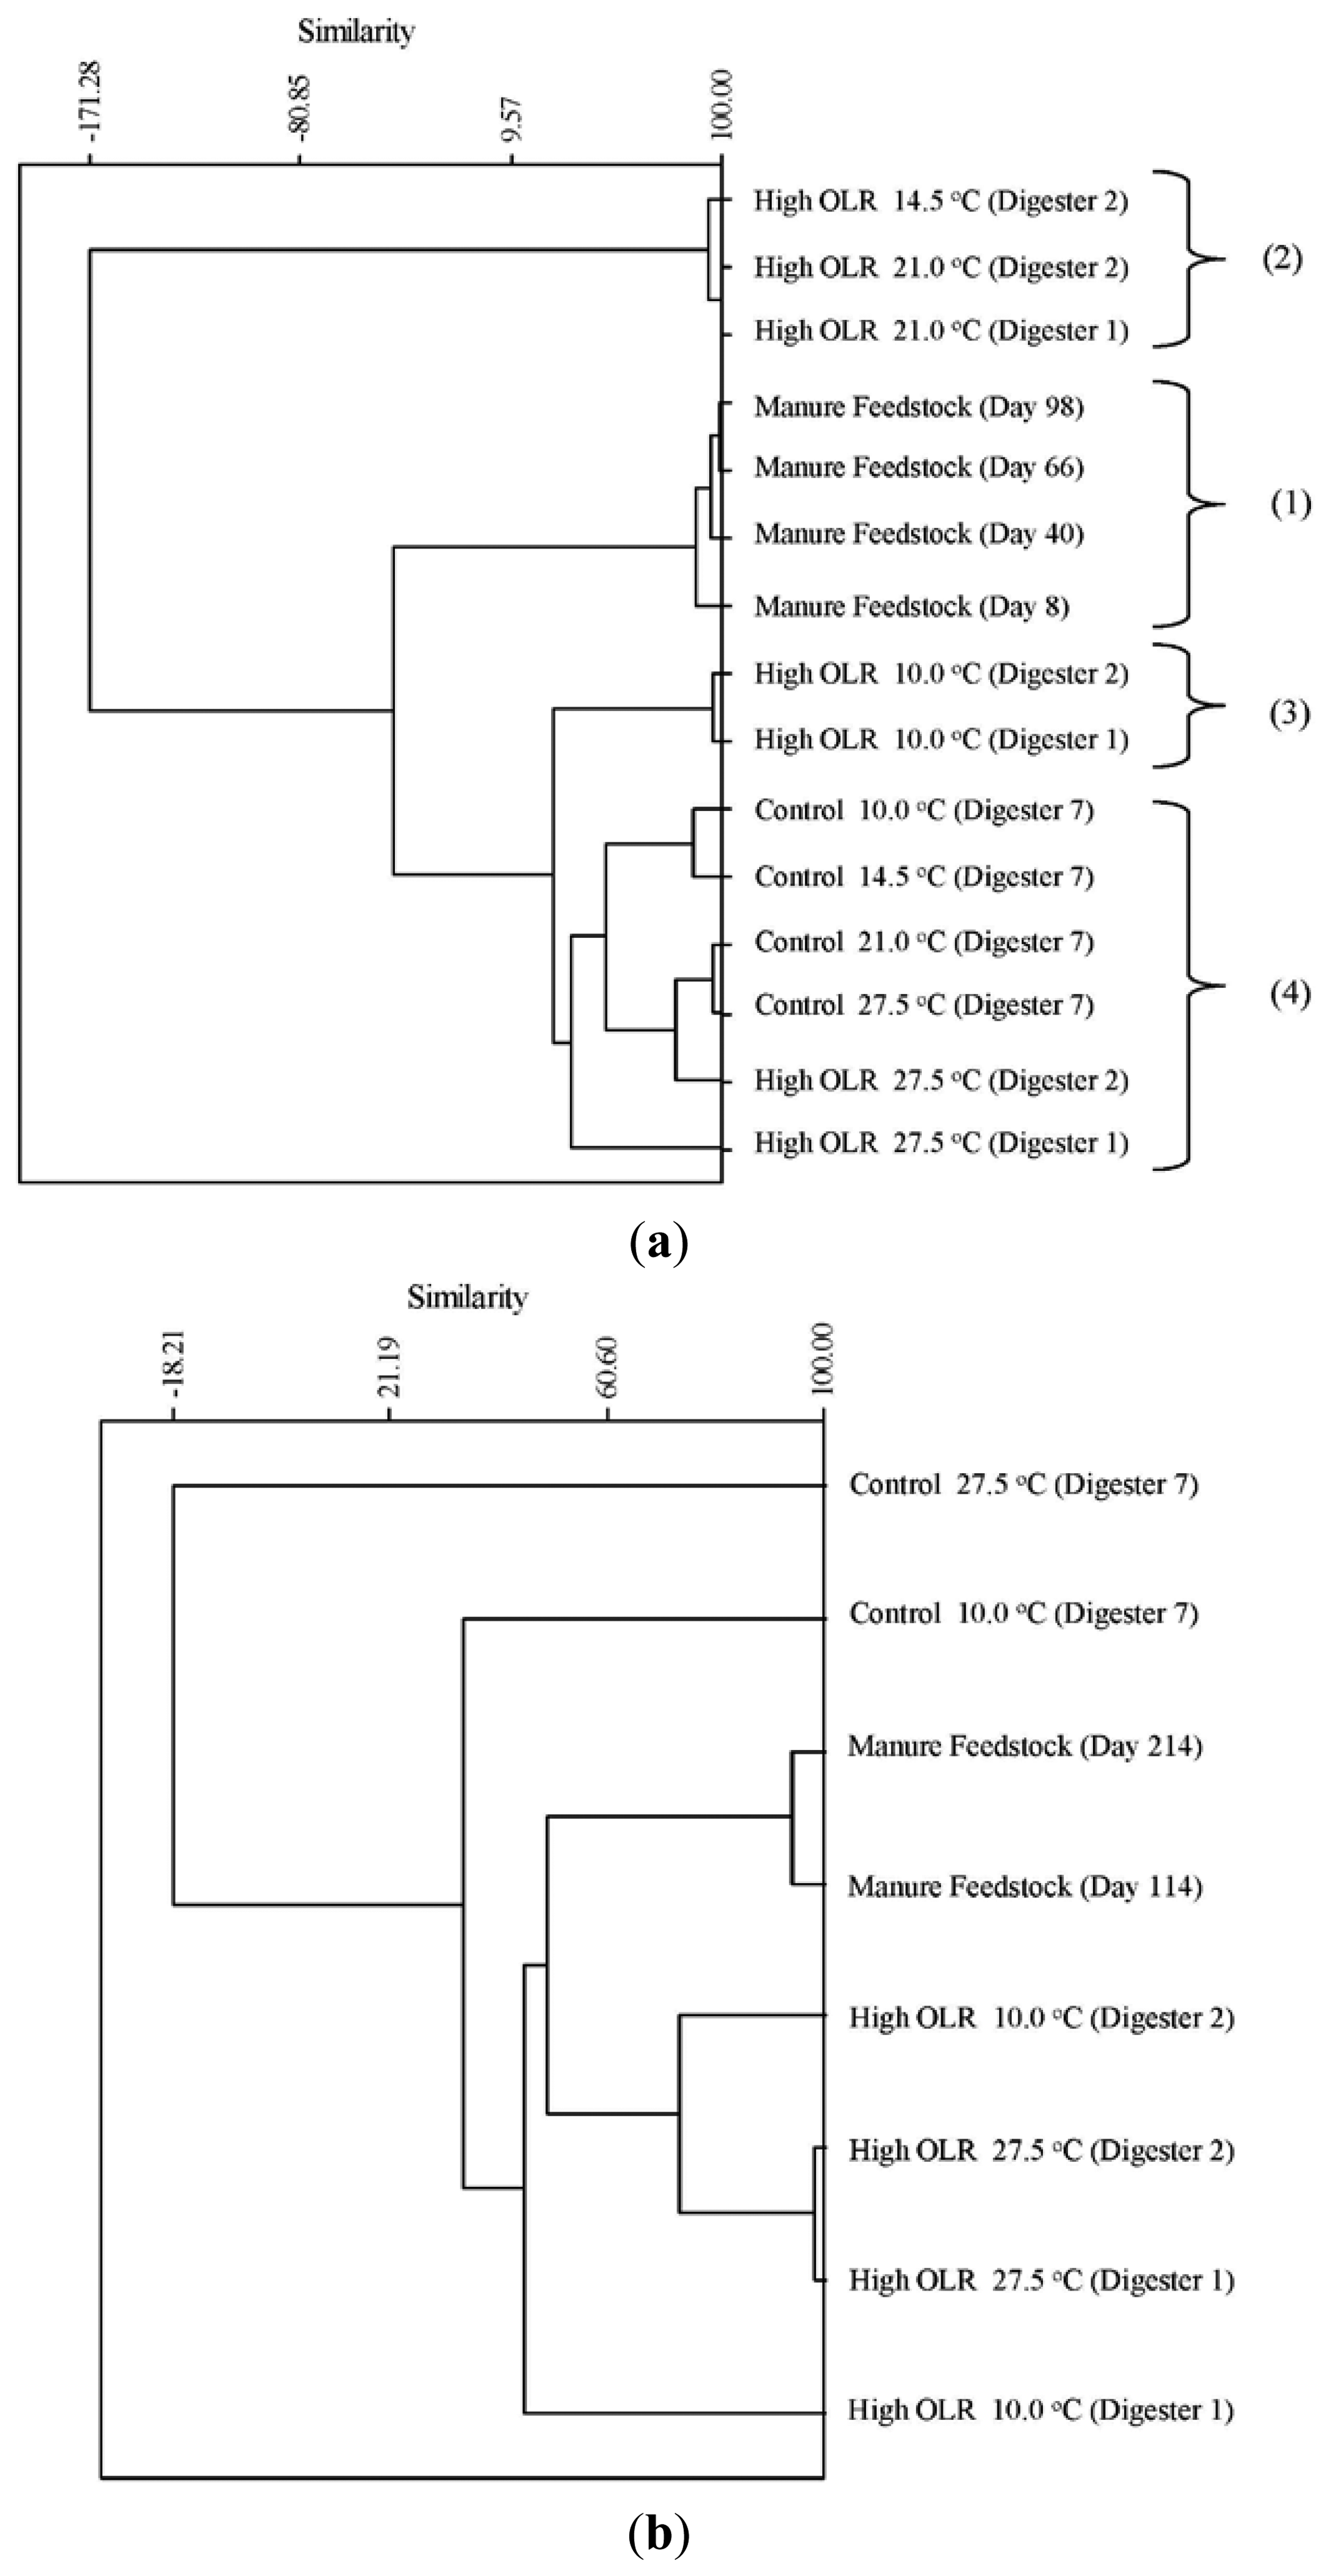
The cluster analysis of the archaeal TRFs during the decreasing temperature phase produced four clusters of community types (Figure 2a). The four manure samples (1) were clustered together indicating a significant difference from the digester communities during the first phase of the experiment. Cluster (2) was very dissimilar from both the manure as well as the remainder of the digester samples. These were the samples from the high OLR digesters at 21 and 14.5 °C. These were the three samples that had the highest relative abundance of TRF 280 (Methanosaeta) and TRF 181 (Methanosarcina) that are acetoclastic methanogens. The cluster containing the samples from the high OLR digesters at 10 °C (3) were the first ones where TRF 785 appears in the digesters. This TRF is characteristic of the hydrogenotrophic methanogen genus Methanobrevibacter. The final cluster (4) contains the control samples from the initial stationary and decreasing temperature phase as well as the high OLR digesters during the initial stationary phase. This cluster is characterized by the low relative abundance (>5%) of the acetoclastic methanogens Methanosarcina (TRF181) and Methanosaeta (TRF 280). During the increasing temperature phase, all the samples from the High OLR digesters (Figure 2b) were clustered with the two manure samples indicating a similar archaeal community structure. All of these samples had a pH below 6.6, which is the low end of the optimum pH range for growth of acetoclastic methanogens [19].
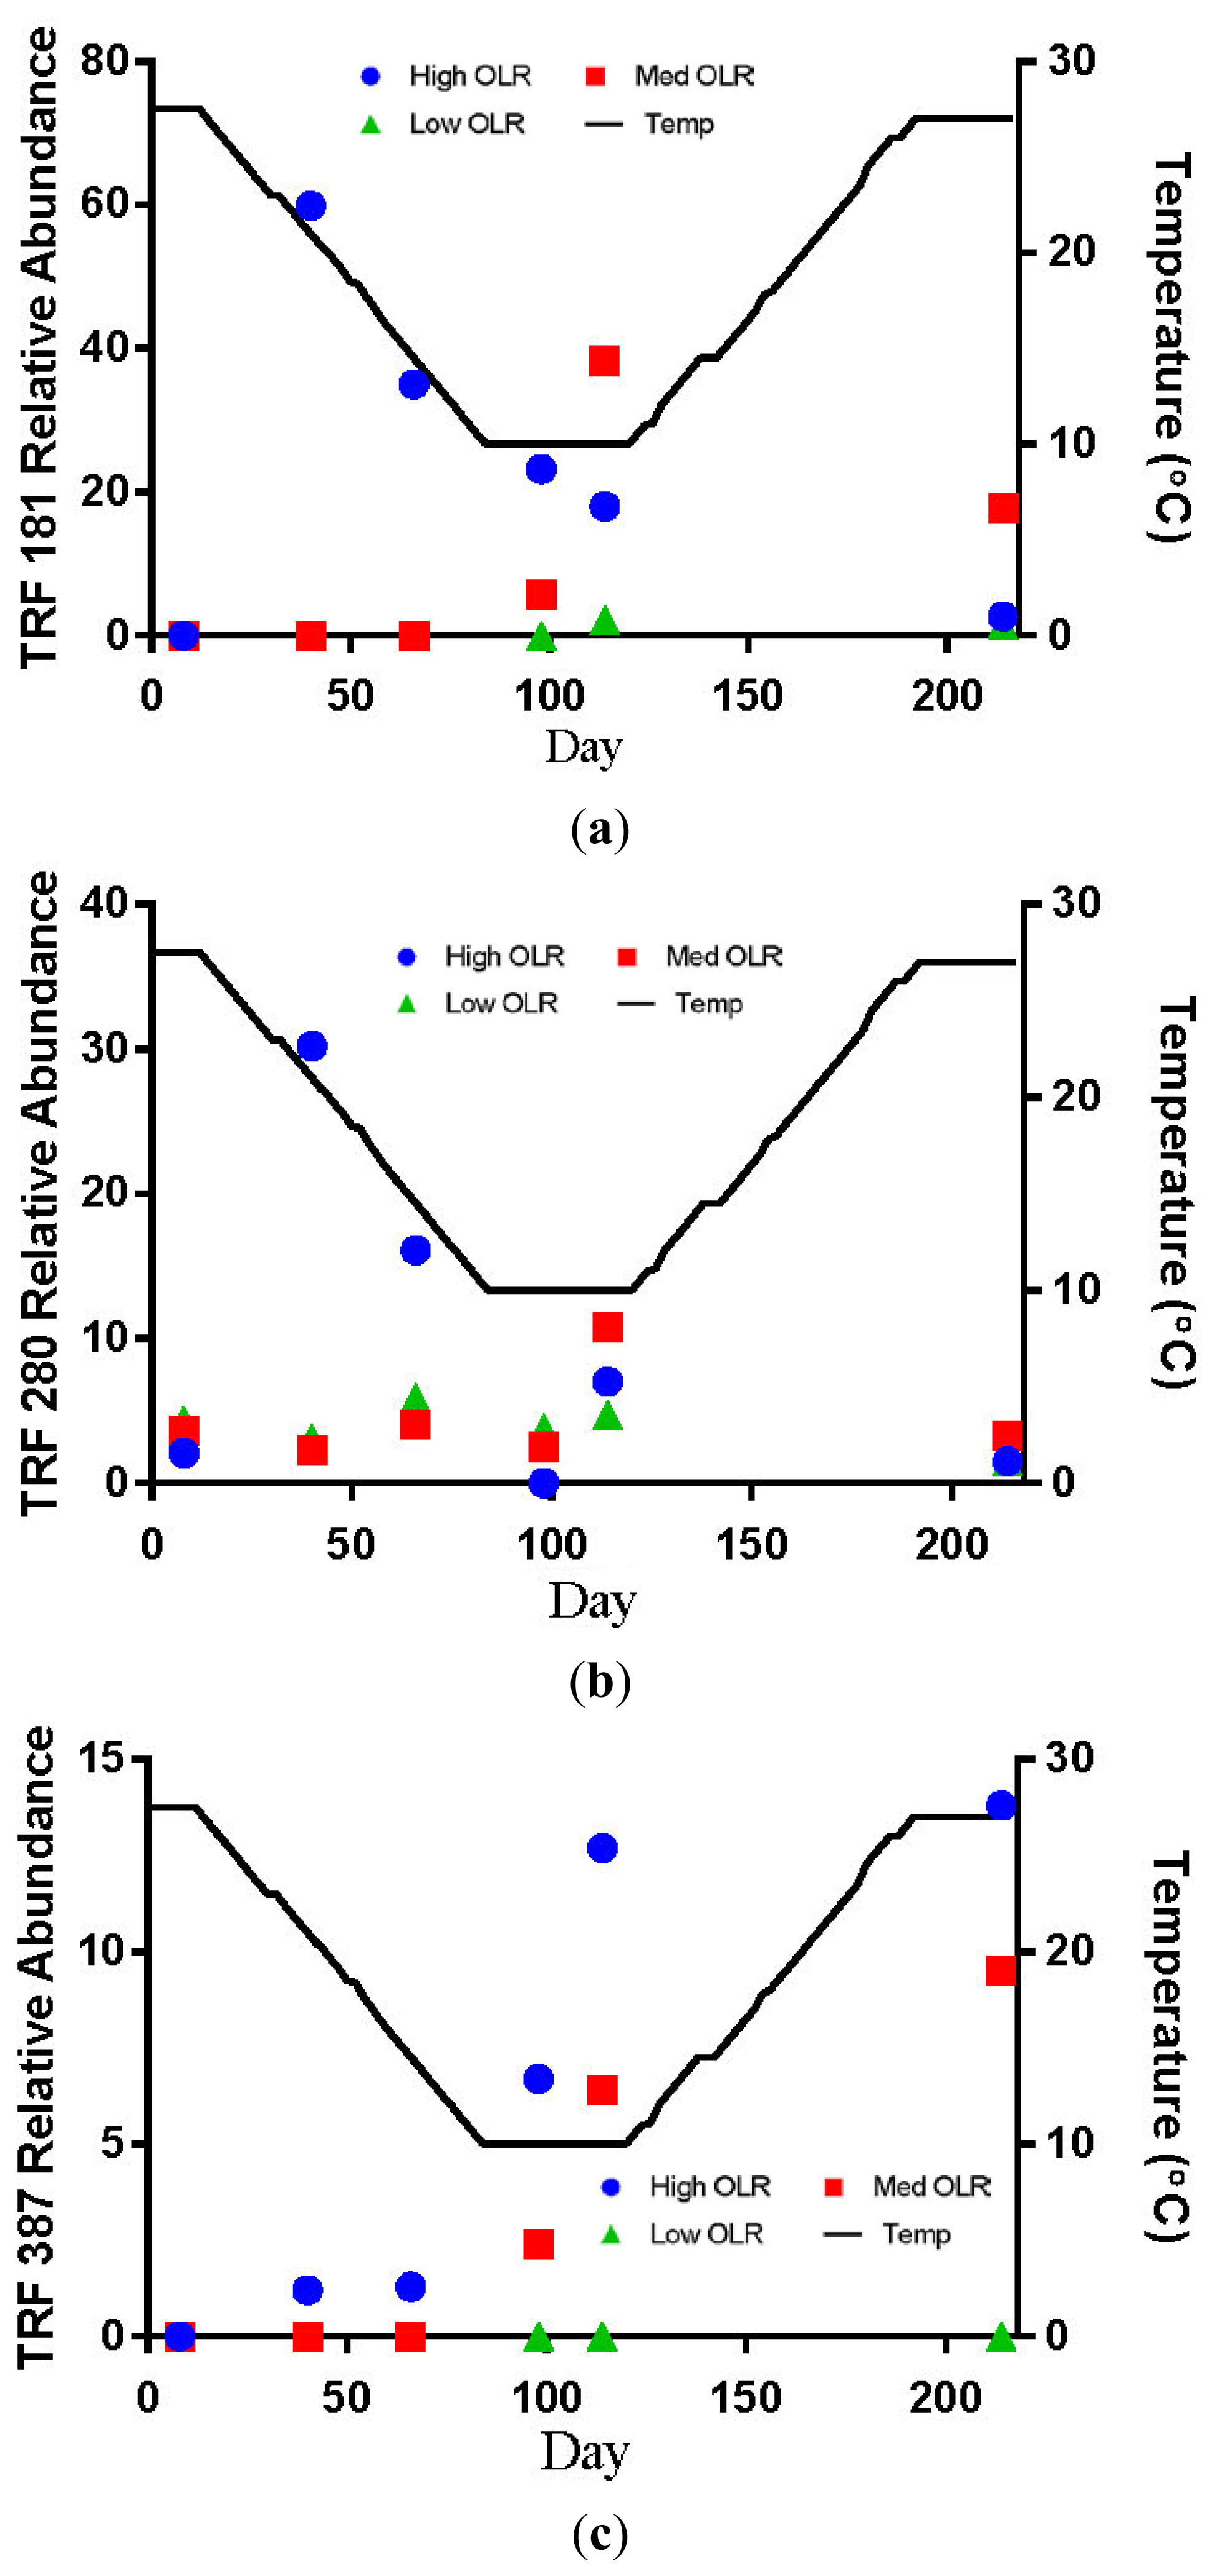
TRF 181 was first detected at 21 °C in the High OLR digesters at an average relative abundance of 60% (Figure 3a). This value declines to 18% by the end of the decreasing temperature phase of the experiment. At the end of the stationary temperature phase (10 °C) TRF 181 remained at 18% of the relative abundance. For the High OLR digesters, the percentage of TRF 181 continued to decline during the increasing temperature phase to 3% of the relative abundance in the final sample at 27.5 °C. TRF 280 was also first detected at 21 °C in the High OLR digesters at an average relative abundance of 30% (Figure 3b). This value declined to 10% by the time the digester temperature was 14.5 °C. There were no other samples that had TRF 280 > 10% of the relative abundance. These results indicate that higher loading rates and warmer temperatures favored the presence of acetoclastic methanogens.
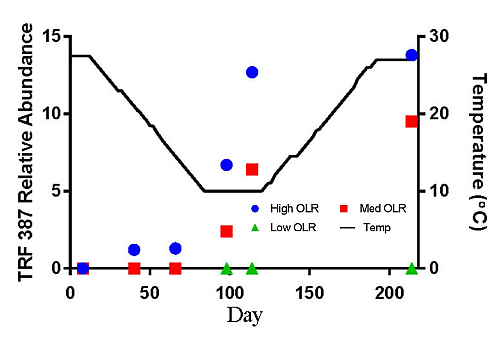
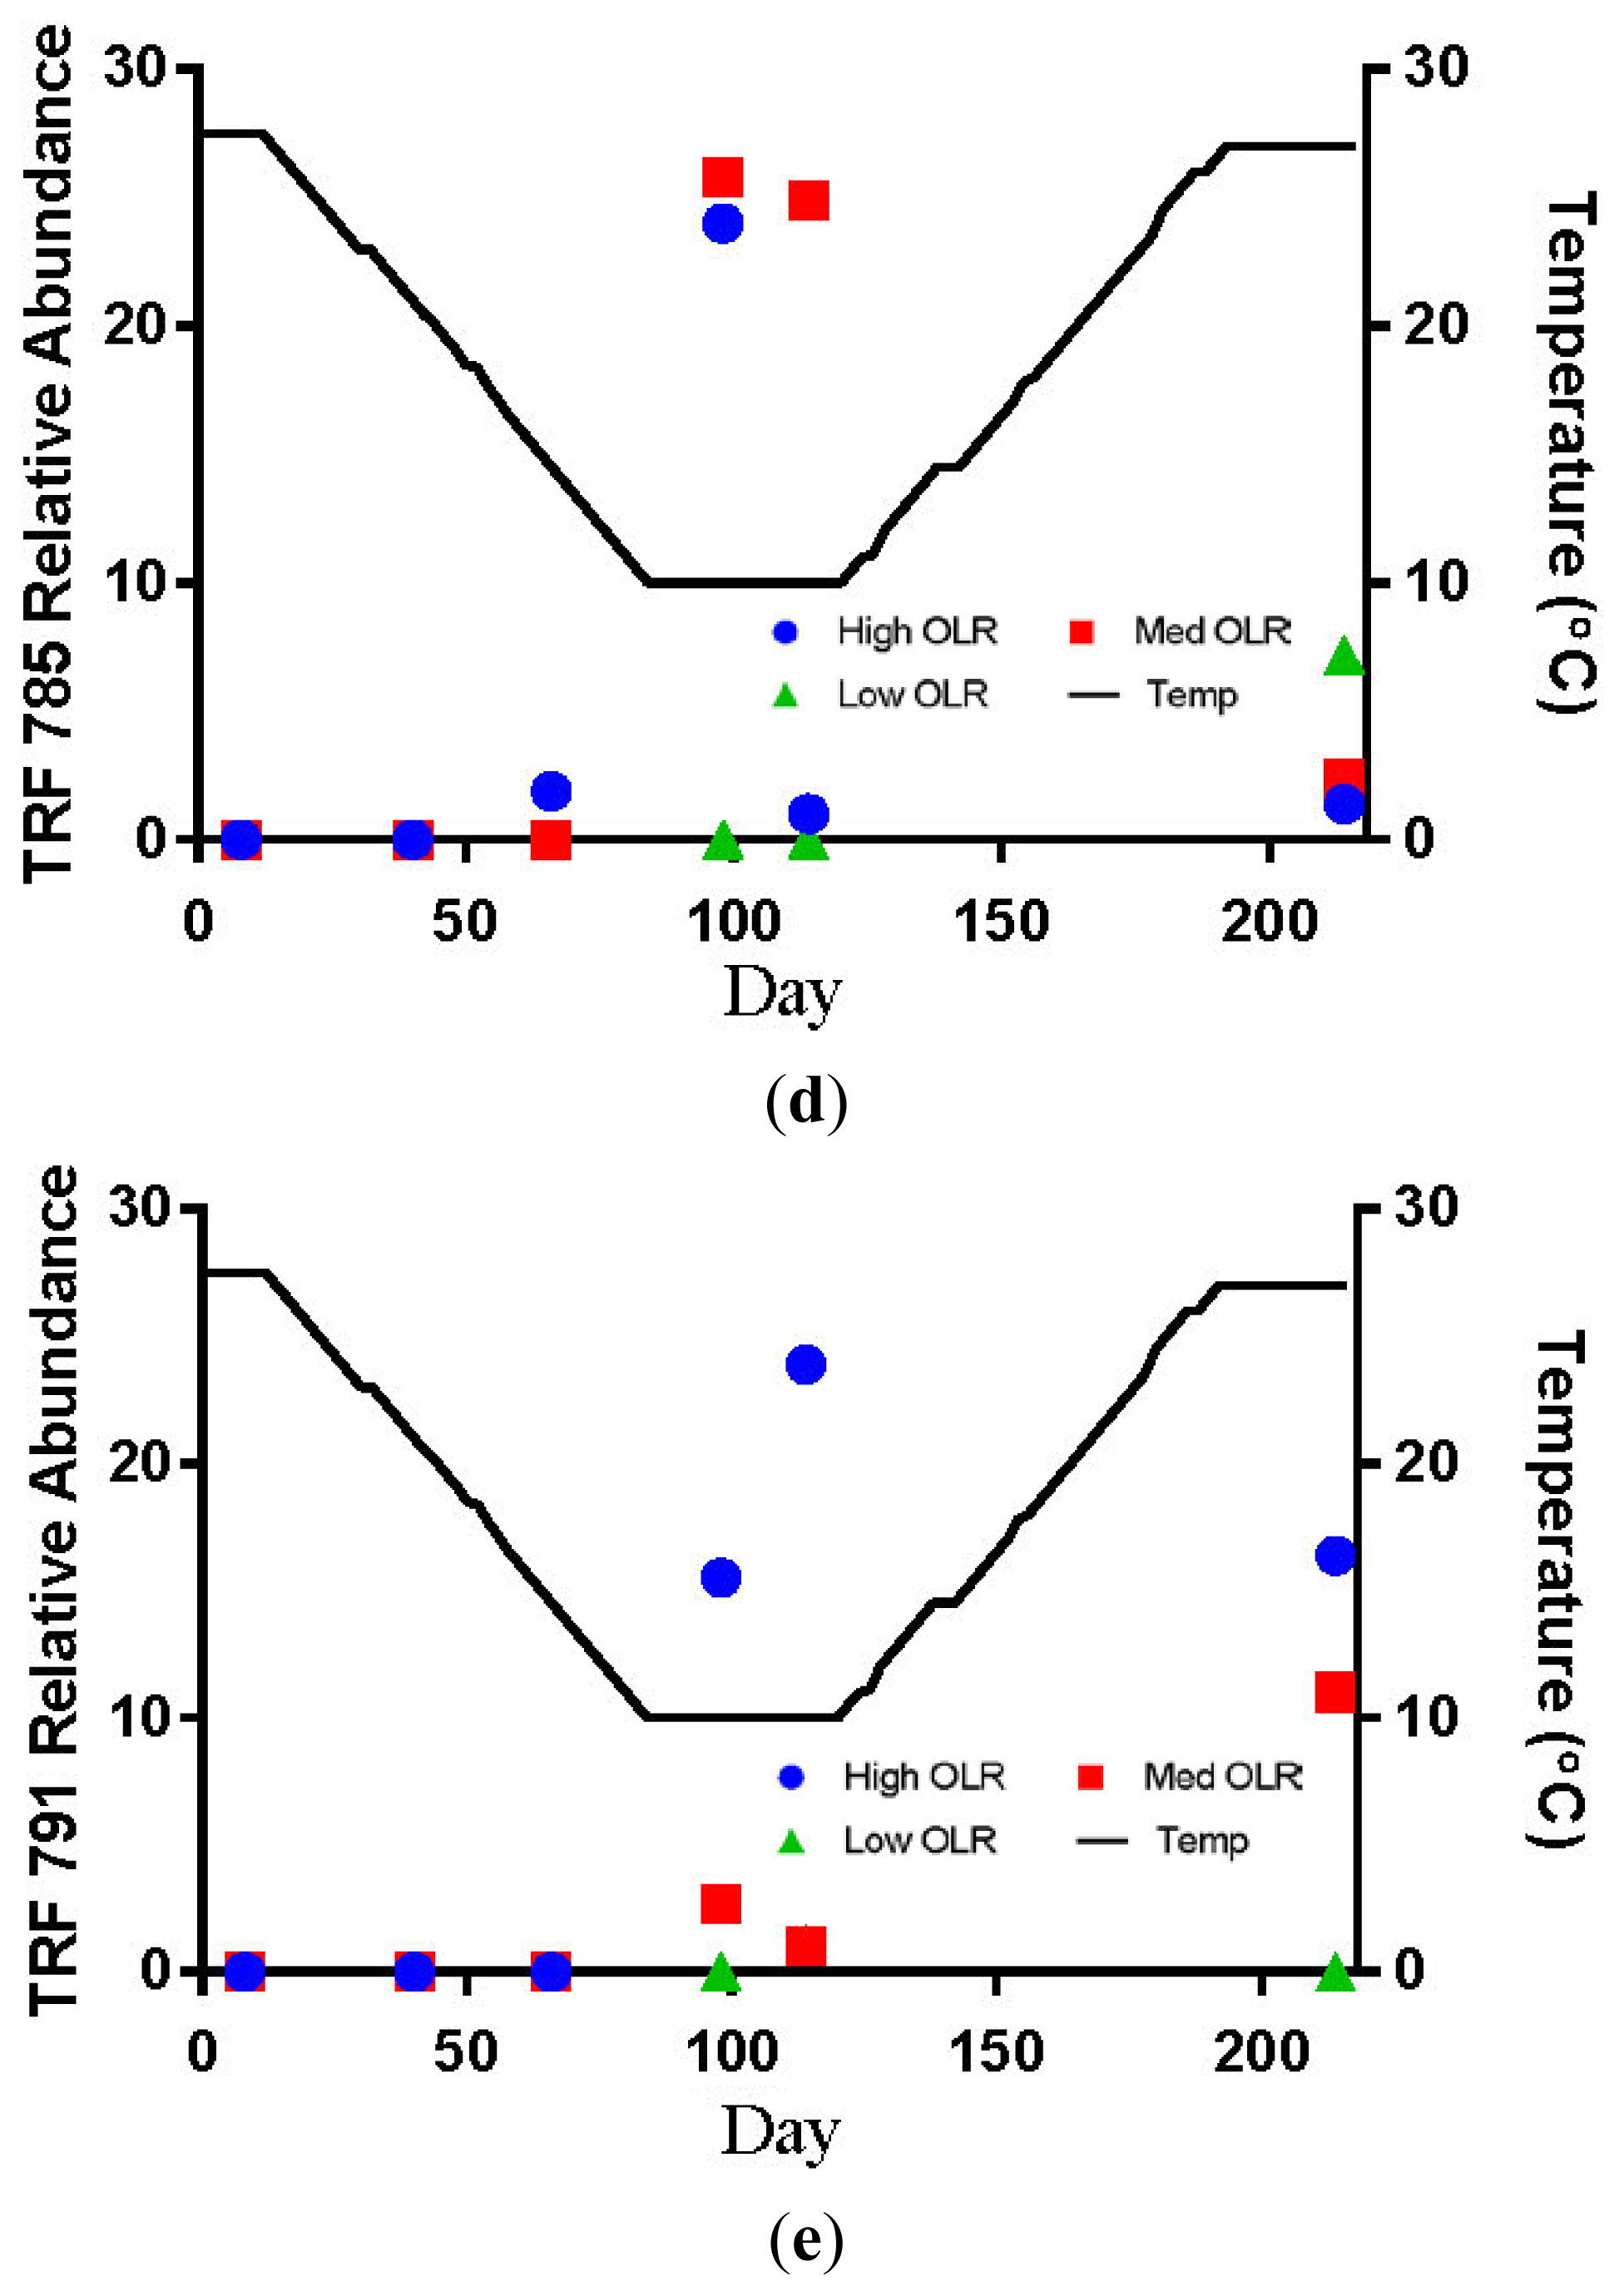
The hydrogenotrophic archaea (TRFs 387, 785 and 791) showed a different response to temperature and loading rate than the acetoclastic methanogens (Figures 3c–e). The highest levels of TRF 387 occurred in the manure feedstock, with an average relative abundance of approximately 40% for all samples analyzed. The identity of this TRF is less certain than that of TRFs 181 and 280 but it is possibly a member of the genus Methanobrevibacter or the family Methanomicrobiaceae The higher relative abundance of the hydrogenotrophic methanogens in the manure was consistent with the findings of Rastogi et al. [20] who found that the hyrogenotrophic methanogens were the predominant taxa in cow manure. The relative abundance of TRF 387 increased as the digesters soured and remained around 14% until the end of the experiment. TRF 785 was not detected in any of the feedstock samples but was first detected in the High OLR digesters at the end of the decreasing temperature phase (Figure 3d). TRF 791 which is also likely a member of the genus Methanobrevibacter showed a similar response to TRFs 785 and 387.
There are a number of factors that may be responsible for the shift from acetoclastic to hydrogenotrophic methanogens in the High OLR digesters such as temperature and pH. The drop in temperature may have favored the growth of hydrogenotrophic methanogens that are more tolerant to colder temperatures [12]. Differences in the relative amounts of acetoclastic and hydrogenotrophic methanogens can also be influenced by changes in pH [19]. These authors reported that the optimum pH range for acetoclastic methanogens is between 6.6 and 7.3 with strong inhibition below pH 6.2. In this study, the acetoclastic methanogens (TRFs 181 and 280) began to decline in abundance in the High OLR digesters between 27.5 and 14.5 °C in the decreasing temperature phase. By the time the digesters were below pH 6.6 on day 114 (10 °C) the relative abundance had decreased by more than 50%.
2.2. Medium OLR (0.8 kg VS/m3·Day) Digesters
2.2.1. Digester Performance
The average daily biogas production declined during the decreasing temperature phase from 715 to 263 mL/day (Figure 1) and the %CH4 in the declined from 57% to 48%. During this same time period, the average pH in the Med OLR digesters declined from 7.71 to 7.35 and the VFA/Alkalinity ratio increased slightly from 0.19 to 0.25. The average VFA/Alkalinity ratio exceeded 0.4 on day 92 and had increased to 1.03 by the end of the stationary temperature phase (day 120) when the pH was 7.2. The average pH in the Medium OLR digesters continued to drop during the increasing temperature phase. The pH dropped below 6.5 on day 133 (13 °C) and was 5.84 by the end of the experiment. Unlike the High OLR digesters, the average biogas production at the Medium OLR increased to 521 mL/day during the increasing temperature phase, but the %CH4 had only increased to 24% indicating that a loading rate of 0.8 kg VS/m3·day was still too high to avoid process upset at 10 °C.
2.2.2. Archaeal Community Dynamics
The cluster dendrogram for the medium OLR digesters (not shown) also had a distinct cluster for the manure samples that was very dissimilar from the digester samples. Unlike the High OLR digesters, the Medium OLR digesters maintained a similar archaeal community structure throughout the decreasing temperature phase. The archaeal communities in the Medium OLR digesters were very dissimilar from any of the manure samples at the start of the increasing temperature phase (10 °C). By the end of the increasing temperature phase, they were clustered with the manure samples, and the digester pH was <6.0. One of the dominant TRFs in both the manure and sour digester samples was TRF 387 bp.
The relative abundance of TRFs 181 and 280 remained below 10% for all digester samples in the Medium OLR treatment during the decreasing temperature phase. The failure of the acetoclastic methanogens to develop sufficient populations at the OLR may have been due to insufficient start-up time before the temperature began decreasing. The only other detections of TRF 181 > 10% of the relative abundance occurred during the stationary (40%) and increasing temperature phases (17%, Figure 3a). TRF 785 was not detected in any of the feedstock samples but was first detected in Medium OLR digesters on day 92 (10 °C) during the stationary temperature phase (Figure 3d). The average relative abundance was approximately 25% at 10 °C. The only other occurrence of TRF 785 > 10% of the relative abundance was at the end of the stationary temperature phase on day 114. These results indicate that colder temperatures and intermediate organic loading rate favored the increase of hyrdrogenotrophic methanogens. The shift from acetoclastic to hydrogenotrophic methanogens in the Medium OLR digester is likely due more to pH than temperature. The increase in the relative abundance of TRF 181 to 40% occurred after the digester temperature had dropped to 10 °C but before the pH had decreased below the optimum level for acetoclastic methanogens. Demirel Scherer [19] reported that the optimum pH range for acetoclastic methanogens is between 6.6 and 7.3 with strong inhibition below pH 6.2.
2.3. Low OLR (0.3 kg VS/m3·Day) Digesters
2.3.1. Digester Performance
The average daily biogas production declined during the decreasing temperature phase from 345 to 44 mL/day (Figure 1) and the %CH4 in the declined from 57% to 48%. During this same time period, the average pH in the Low OLR digesters declined from 7.71 to 7.56 and the VFA/Alkalinity ratio increased slightly from 0.14 to 0.23. Unlike the High and Medium OLR digester, the pH in the Low OLR digesters never dropped below 7.2 and the VFA/Alkalinity ratio generally remained below 0.4 during the experiment. The %CH4 in the biogas did decline during the stationary temperature phase to 37% on day 90 but increased to 63% at the end of the increasing temperature phase (day 192). The Low OLR digesters saw an increase in the average daily biogas production as the temperature increased and were producing approximately 600 mL biogas/day at the end of the experiment. This is more than twice the volume of biogas that these digesters produced at the same temperature (27 °C) at the start of the experiment.
2.3.2. Archaeal Community Dynamics
The cluster analysis of the Low OLR digester samples (not shown) indicated that the archaeal community maintained a very similar structure during both the decreasing and increasing temperature phases that was very dissimilar from the manure. The archaeal community in these digesters had a greater similarity to the control digesters than to the manure. Unlike the High and Medium OLR digesters, the Low OLR digesters did not have any single TRF increase above 12% of the relative abundance. The total abundance was more evenly distributed among a greater number of TRFs than in the other two treatments.
The low OLR digesters never developed any detectable levels of TRF 181 and only detections of TRF 280 with <10% of the relative abundance. The most abundant TRFs in these digesters were between 778 and 805 bp, an apparent size including the 785 bp fragment that is characteristic of hyrdrogenotrophic Methanobrevibacter. The overall characteristic of the Low OLR digesters is a greater number of TRFs accounting for the majority of the relative abundance than in the High or Medium OLR digesters. While not conclusively identified, the TRFs in the range of 778 to 805 are likely related to Methanobrevibacter and also use H2 and CO2 as substrates for CH4 production. The biogas production after the increasing temperature phase suggests that it is possible to produce biogas with greater than 50% CH4 through the hydrogenotrophic pathway. The absence of any significant amounts of acetoclastic methanogens in the Low OLR and control digesters may be related to pH level, which was generally above the optimal level for the growth of acetoclastic methanogens during the warmer temperatures.
2.3. Reproducibility of Replicate Digesters
2.3.1. Digester Performance
The reproducibility of digester function was evaluated for the following performance measures; pH, total alkalinity, total volatile fatty acids, daily biogas volume and percent methane. Overall, there was a high degree of reproducibility of digester performance for these parameters. At the 0.5 level of significance, the Mann-Whitney comparison of the digester pairs indicated that during fifteen of the twenty comparisons, the replicated digesters were performing similarly (i.e., were not significantly different). Only the daily biogas volume in the Medium OLR digesters during the final increasing temperature phase and the Low OLR digesters during the stationary temperature phase and final increasing temperature phase were dissimilar. The difference in biogas yield in the Medium OLR digesters during the final increasing temperature phase was very significant. One digester was producing almost no biogas while the other was generating almost 1,000 mL/day. The cause of this difference is not certain, as the other performance measures were very similar.
2.3.2. Archaeal T-RFLP Profiles
The average percent similarity (P) for the archaeal replicate digester pairs was 0.59 ± 0.28 (Table 1). The lowest average P was for the low OLR digesters (0.27), while the most variable were the high OLR digesters (standard deviation = 0.30). The highest P for any duplicate pair was the high OLR digester at 21.0 °C (0.93) while the lowest value (0.15) was in the low OLR digesters during the increasing temperature phase. The average SSM was higher and less variable (0.89 ± 0.06) compared to the average percent similarity (P). This was likely due to the fact that, unlike P, the SSM considers the shared absence of a species to be a measure of similarity. The large number of shared absences in the T-RFLP profiles accounts for the larger values of SSM. There is disagreement in the literature as to whether or not shared absences are biologically meaningful [21]. In the case of this study, it is appropriate to include these because there are constantly new species being introduced into the digesters and absence of the same taxa is an indication that both digesters in the replicate pair do not provide a suitable environment for their growth. An example of this would be the absence of the acetoclastic methanogens (TRFs 181 and 280) in the sour digesters. Likewise, TRF 387, which was abundant in the manure feedstock, did not become established in the digesters until they become sour.
There have been few published studies that have evaluated the similarity of digester performance and microbial community composition in replicate reactors. Fernandez et al. [17] evaluated two sets of four replicate reactors and found good replication of digester function between replicates, and similar percent frequency of the dominant microbial morphotypes. These authors did not use T-RFLP methodology or calculate P or SSM so their results are not directly comparable. In another study, Hashsham et al. [16] found that the microbial communities in 25% of the replicate reactors exhibited “anomalous behavior”.
In this study, the variation between digester replicates could be due to the fact that the manure feedstock was a heterogeneous matrix and the different aliquots loaded into the replicate digesters likely do not contain the same types and numbers of species. Functional redundancy could also explain some of the dissimilarity in replicate reactors. If different organisms are capable of the same function(s), and the initial community is diverse, then the microbial structure that develops could vary depending on the initial composition. Overall, the variation in microbial community structure in replicate reactors was consistent with other published studies.
3. Experimental Section
3.1. Laboratory Anaerobic Digester Design
The experimental apparatus consisted of eight bench scale anaerobic digesters constructed from 4-liter square high density polyethylene bottles with screw cap lids (293 mm × 144 mm × 144 mm). Teflon tape was used on the cap threads to ensure a gas tight seal. A ¾ inch PVC pipe for sampling and loading was fitted in the center of each lid with a Uniseal® (Pentair Aquatic Eco-Systems Inc., Schaffhausen, Switzerland) and epoxy adhesive. A number 4 rubber stopper was used to cap each PVC pipe opening. The lower end of the PVC pipe was extended below the level of the digester slurry to prevent oxygen from entering the digester headspace during sampling and loading. The digesters were shaken for 10 s prior to sampling and after loading. No other stirring or mixing of the digester contents occurred during the experiment. A luer lock fitting with Tygon tubing was also installed in each cap to connect the digesters to separate wet tip gas meters to quantify the biogas. The temperature of the digesters was maintained with a water bath (Techne ESRB-7, Bio-Techne, Minneapolis, MN, USA). Each digester contained three liters of slurry and approximately one liter of headspace.
3.2. Inoculum and Feedstock Source
The laboratory digesters were inoculated with slurry from the anaerobic digesters located at the City of Columbus and City of Akron wastewater treatment plants. The laboratory digester inoculum contained an equal volume of slurry from each of the municipal digesters. The pH of the inoculums was 7.9 and the volatile solids (VS) content was 3%. Each laboratory digester was inoculated with three liters of the mixed municipal digester slurry. The feedstock for the laboratory digesters was dairy cow manure collected weekly from the feeding stalls at The Ohio State University Waterman Dairy Facility. The Waterman herd during the experimental period was composed of approximately 60 Jersey cows. Fresh manure was shoveled from the stall floor and diluted with ambient temperature groundwater in a 2:1 ratio of manure to water during the summer and fall of 2011. The diluted manure contained approximately 8% total solids and 7% volatile solids. Each batch of feedstock was used for one week and was refrigerated at 4 °C between digester loading. The percent total and volatile solids of the diluted manure were determined after collection. The volume of feedstock added to each treatment was adjusted weekly based on the solids content. This was done to maintain the same organic loading rates (OLR) during the duration of the experiment.
3.3. Organic Loading Rates and Temperature Profile
The microbial community response to temperature was determined at three different organic loading rates (OLR) with one replicate for each treatment. Digesters 7 and 8 were used as a control and were loaded every other day with 35 mL of the same mixed municipal digester slurry that was used as the inoculum. Digesters 1 and 2 were loaded at the rate of 1.3 kg VS/m3·day (High OLR), digesters 3 and 4 at the rate of 0.8 kg VS/m3·day (Medium OLR), digesters 5 and 6 at the rate of 0.3 kg VS/m3·day (Low OLR) and the control digesters were loaded at a rate of 0.19 kg VS/m3·day. The OLR was kept constant in each of the digesters during the course of the experiment. The hydraulic retention time (HRT) in days for each of the three treatments and the control are as follows; High OLR (43 days), Medium OLR (71 days), Low OLR (188 days) and control (171 days). Prior to loading, an equal amount of digester slurry was removed from each digester using a serological pipette in order to maintain a constant volume throughout the experiment. The slurry that was removed prior to loading was used for the microbial community and other analyses. The digesters were loaded every other day during the experiment by adding the manure feedstock to the ¾ inch PVC pipe with a graduated cylinder. A 40 mL pipette was used to force the feedstock from the pipe into the digester slurry. After loading, each digester was shaken for 10 s to ensure complete mixing.
The entire experiment lasted 214 days and was designed to simulate the annual temperature changes experienced by an anaerobic digester in a temperate climate. The temperature range was selected based on the temperature range of a buried, fixed-dome anaerobic digester at the Waterman Dairy. The time frame was compressed to reduce the amount of time necessary to evaluate the seasonal effects. The temperature of the water bath was 27.5 °C at the start of the experiment and reduced by 0.5 °C after each loading until a final temperature of 10 °C was reached on day 84 of the experiment. This decreasing temperature phase simulated the decrease in temperature from the summer maximum to the winter minimum. In the second phase of the experiment, the temperature of the water bath was held stationary at 10 °C until day 122 of the experiment. The stationary temperature phase simulated the prolonged period of psychrophilic temperature that occurred in the Waterman digester during the winter. The final phase of the experiment, the increasing temperature phase, occurred between days 123 and 214 when the temperature was increased from 10 °C to 27.5 °C. This phase of the experiment simulated the spring and summer warming of the digester.
3.4. Microbial Sample Collection
Samples for microbial community profiles were collected on the following days during the experiment; day 8 (27.5 °C), day 40 (21 °C), day 66 (14.5 °C), day 98 (10 °C), day 114 (10 °C) and day 214 (27.5 °C). Each digester was shaken for 10 s prior to sampling to mix the digester contents. Digester slurry was withdrawn prior to loading using a 40 mL pipette and then transferred to a graduated cylinder. Approximately 0.6 to 0.8 grams (400 μL) of digester slurry was transferred to 2.0 mL microcentrifuge tubes using a 1000 μL pipette. Each digester was sampled in triplicate and the microcentrifuge tubes were frozen at −20 °C until DNA extraction.
3.5. Microbial Community Analysis
To characterize the archaeal community composition in the laboratory digesters, terminal restriction fragment length polymorphisms (T-RFLP) of the 16S rRNA genes were used. This method produces genetic fingerprints of the microbial communities that can be translated into phylogenic information without the need for direct sequencing of the individual 16S rRNA gene fragments. The microbial communities were analyzed by comparing the T-RFLP from multiple restriction enzyme digestions of the polymerase chain reaction (PCR) amplified 16S rRNA genes.
3.5.1. Genomic DNA Extraction
Total genomic DNA from each digester sample was extracted using the Qiagen Stool DNA MiniKit (Germantown, MD, USA). The MiniKit protocol was altered to include the addition of glass beads (0.1 and 0.5 mm) as well as longer incubation times (10 min) at 70 °C. The glass beads were added prior to vortexing the samples in order to increase the DNA yield in the extracts by physical disruption of the cell wall. The incubation times were increased in order to give the extraction buffer a longer time to dissolve the cell membrane and increase DNA yield. The presence and quality of DNA in the extracts was confirmed on 1% agarose gels in 0.5X Tris-borate-EDTA (Thermo Fisher Scientific, Pittsburgh, PA, USA) and visualized by ethidium bromide staining. The samples were electrophoresed at 25 V for the first 15 min and then at 50 V for the remainder of the run. A 10 kb DNA size standard (New England Biolabs, Ipswich, MD, USA) was included with each run. The gel images were produced with a ChemiDoc XRS gel imaging system (Bio-Rad, Hercules, CA, USA). The quantity of DNA in the extracts was determined using a Qubit Fluorometer (Invitrogen, Carlsbad, CA, USA) and 10 μL of sample.
3.5.2. Polymerase Chain Reaction
The target sequence in the extracted DNA, the 16S rRNA gene, was amplified by the polymerase chain reaction (PCR) with universal archaeal primers Ar109f (5′-[VIC]-ACKGCTCAGTAACACGT-3′) and Ar912rt (5′-[FAM]-GTCGCTCCCCCGCCAATTCCTTTA-3′). Each 50 μL PCR reaction mixture contained 1.0 μL DNA extract, which contained approximately 30 ng of genomic DNA. The reaction also contained 25 μL of 2× Phusion Master Mix (New England Biolabs) and 0.4 μM of each primer. The remainder of the reaction was composed of DNA free water. The initial denaturation was at 98 °C for 30 s followed by 35 cycles (denature at 98 °C for 10 s, anneal at 58 °C for 20 s, extend at 72 °C for 24 s and final extension at 72 °C for 5 min) and then held at 4 °C in the thermal cycler until transferred to a −20 °C freezer. Duplicate extracts from each sample were amplified in separate reactions and pooled prior to cleanup for a total volume of 100 μL. Pooled PCR products were purified with the QiaQuick PCR Purification Kit (Qiagen) according to the manufacture's protocol. Each sample was eluted with 50 μL of buffer AE. An additional 50 μL of buffer AE was added to the cleanup sample and mixed by pipetting.
3.5.3. Restriction Digestions
The pooled PCR products were digested separately in 50 μL reactions with AluI, BfaI or TaqI restriction endonucleases (New England Biolabs) in 200 μL PCR reaction tubes. For all three enzymes, the reaction mixtures were incubated in a thermal cycler for one hour and then the restriction enzymes were heat inactivated for 20 min. Each digestion included 20 μL of PCR product and 5 μL 10× NEBuffer 4. The AluI digestions contained 1 μL (10 U) of enzyme and 24 μL of DNA free water. The reaction temperature was 37 °C with an inactivation temperature of 65 °C. The BfaI digestions contained 1 μL (5 U) of enzyme and 24 μL of DNA free water. The reaction temperature was 37 °C with an inactivation temperature of 80 °C. The TaqI digestion contained 1 μL (20 U) of enzyme, 0.5 μL of bovine serum albumin (0.1 μL/μL) and 23.5 μL of DNA free water. The reaction temperature was 65 °C with an inactivation temperature of 80 °C. Restriction products were visualized on 2% agarose gels as described above. Each gel also was loaded with 3 μL of a 100 bp DNA size standard (New England Biolabs).
3.5.4. T-RFLP Analysis
The terminal restriction fragment (TRF) sizing was performed by The Ohio State University Plant-Microbe Genomics Facility (PMGF) using an Applied Biosystems 3730 DNA Analyzer (Carlsbad, CA, USA) that compares the TRF to the internal size standard LIZ1200. Relative abundance of the different microbial taxa was determined by comparing the relative signal intensity of the VIC and FAM dyes attached to each TRF. Following the convention of Padmasiri et al. [22], only those TRFs that generated peaks greater than 50 relative fluorescence units were considered to be operational taxonomic units (OTUs). The peak area of each OTU was divided by the total peak are of all OTUs in each sample and then multiplied by 100 to calculate the relative abundance of each OTU [22]. Prior to TRF sizing, the restriction products were purified by the PMGF using the AMPure® purification system (Beckman Coulter, Indianapolis, IN, USA).
The identity of specific microorganisms corresponding to a particular TRF length was aided by using the Microbial Community Analysis (MiCA) database at the University of Idaho [23]. The experimental data were compared to the results of the in silico amplification and digestion of the 16S rRNA sequences in the MiCA database using the same primer-enzyme combinations. The Ribosomal Database Project (R10, U27) 10,346 Good Quality (>1200) archaeal database was queried allowing 10 mismatches within 15 bases of the 5′ end of the primer and returned 9965 records. While only one ID method was used in this study, the additional calibration and validation procedures described below resulted in robust results, such as reported in previous studies with one ID method [22,24]. Future work could further validate these results using multiple ID methods The identification of the dominant TRFs was determined in a prior experiment [25] using a virtual digest of actual cloned sequences from the digester samples. This experiment used manure feedstock from the same source as well as the same primers and restriction enzymes. The virtual digest of the archaeal clones from that study were used to determine the magnitude of the difference between the observed TRF lengths in the experimental data and the predicted TRF lengths in the in silico digestion of the cloned sequences. The dominant archaeal TRFs were also compared to the results of Lueders and Friedrich [26] who used the same primer enzyme combination in their study.
3.6. Analysis of Biogas and pH
Approximately 30 mL of biogas was collected from each digester every other day prior to digester loading for the analysis of biogas composition. The composition of the biogas (CH4 and CO2) produced in the digester was quantified using a Shimadzu GC-14A gas chromatograph (Shimadzu Corporation, Kyoto, Japan) equipped with a thermal conductivity detector (TCD) and helium as the carrier gas. The volume of biogas was recorded prior to loading the digesters. The total volume of biogas produced in each digester was recorded during operation of the digesters by a wet tip gas meter (Wet Tip Gas Meters). The wet tip gas meters were external to the water bath containing the digesters and remained at the fairly constant (∼20 °C) lab temperature. In the wet tip meters, the biogas accumulates in one compartment prior to tipping. This allowed for sufficient time for the gas temperature to approach that of the laboratory temperature before being measured. Each wet tip meter was calibrated approximately every two weeks by forcing air through the meter and recording the volume associated with one tip. The pH of each digester sample was measured immediately after collection using a Fisher Scientific Education pH/Ion 510 bench pH meter (Pittsburgh, PA, USA).
3.7. Alkalinity and Total Volatile Fatty Acids
Alkalinity and total volatile fatty acids were determined for each digester sample on all days when the digesters were loaded, except when microbial samples were collected. These days were omitted due to insufficient sample volume from digesters five through eight. For total inorganic carbonate alkalinity (TIC) and total volatile fatty acids (TVFAs), the sample was first centrifuged at 7500 rpm for 20 min in 15 mL plastic centrifuge tubes. Then, the supernatant was diluted with deionized water in a 1 to 3 ratio, and a total of 20 mL were titrated with 0.1 N H2SO4 to end points of pH 5.0 and 4.4. The following empirical formulas were used for calculation [18]:
Data from these titrations was used to calculate the VFA to alkalinity ratio.
3.8. Data Analysis
3.8.1. T-RFLP Data
Community relatedness dendrograms using the relative abundance of each TRF were produced by cluster analysis (Squared Euclidean distance, Ward linkage) with Minitab 16 Statistical Software (Minitab, Inc. State College, PA, USA).
3.9. Reproducibility of Replicate Digesters
The reproducibility of the replicate digesters was assessed for both the digester performance data as well as the microbial community profiles (T-RFLP data). The following performance data were compared for each set of replicate digesters using the Mann-Whitney test; biogas yield (mL), pH, total VFAs and total Alkalinity. The reproducibility of the archaeal communities was assessed for each replicate sample using the following two different measures of community similarity:
Percentage similarity (P) [21]:
Simple Matching Coefficient (SM) [21]:
| a | = the number of species in both sample A and sample B; |
| b | = the number of species in sample B but not in sample A; |
| c | = the number of species in sample A but not in sample B; |
| d | = the number of species absent in both sample A and sample B. |
For the purpose of the study, a “species” is defined by a particular TRF even though a particular TRF may represent more than a single species. The percentage similarity (P) evaluates the reproducibility of the microbial community based only on the shared similarity and does not take into account the shared absences. The simple matching coefficient does evaluate similarity based on shared absences but only looks at presence or absence data, and does not evaluate the data based on the relative abundance of the TRFs.
4. Conclusions
The results of this study indicate that an OLR of 0.3 kg VS/m3·day was necessary to maintain an archaeal community that would utilize VFAs at a similar rate to their production and prevent the digester from becoming sour. The archaeal communities in the High and Medium OLR digesters all shifted to a structure similar to the manure by the end of the experiment that resulted in a sour digester and failure to recover CH4 production after the temperature had warmed. The archaeal community in the Low OLR digesters did not shift to the manure type, but the loading rate was insufficient to produce viable amount of biogas during the 10 °C time period. The Low OLR digesters did maintain a similar community structure throughout the experiment but it was characteristic of hydrogenotrophic methanogens rather than acetoclastic methanogens.
A higher OLR than 0.3 kg VS/m3·day may have been possible if the digesters had been given a longer start up time to allow a greater relative abundance of acetoclastic methanogens to develop prior to decreasing the temperature. Higher levels of Methanosaeta have been detected in ambient temperature systems at lower temperatures and higher loading rates [25]. The digester in that study was operated above 27 °C for approximately 28 days and the reduction in temperature was more gradual than in this laboratory experiment. Because of short start up time, the result of this study should not be used to generalize about digesters that have had a longer period of time to stabilize.
The comparison of replicate T-RFLP profiles and digester performance indicated that replicates could vary in similarity between very similar to very dissimilar In general the performance measures had greater reproducibility than the T-RFLP profiles. Given the very large disparity in a few of the comparisons it is recommended that at least three laboratory replicates be used in future studies.
Acknowledgments
The funding for this project was provided by grants from the Ohio Agricultural Research and Development Center. We would also like to acknowledge the support provided by the Ohio State University Department of Food, Agricultural and Biological Engineering and the College of Public Health.
Conflicts of Interest
The authors declare no conflict of interest.
References
- Gerardi, M.H. The Microbiology of Anaerobic Digesters; John Wiley and Sons: Hoboken, NJ, USA, 2003; pp. 3–10. [Google Scholar]
- Nand, K. Biomethanation from Agro-Industrial and Food Processing Wastes. In Biotechnology: Food Fermentation Microbiology, Biochemistry and Technology; Joshi, V.K., Pandey, A., Eds.; Educational Publishers and Distributers: Kerala, India, 1999; Volume 2, pp. 1349–1372. [Google Scholar]
- Huttunen, S.; Lampinen, A. Bioenergy Technology Evaluation and Potential in Costa Rica; University of Jyväskylä Printing House: Jyväskylä, Finland, 2005. [Google Scholar]
- Lansing, S.; Botero, R.B.; Martin, J.F. Waste treatment and biogas quality in small-scale agricultural digesters. Bioresour. Technol 2008, 99, 5881–5890. [Google Scholar]
- Dhaked, R.K.; Singh, P.; Singh, L. Biomethanation under psychrophilic conditions. Waste Manag 2010, 30, 2490–2496. [Google Scholar]
- Labatut, R.A.; Gooch, C.A. Monitoring of Anaerobic Digestion Process to Optimize Performanceand Prevent System Failure. Proceedings of the Got Manure? Enhancing Environmental and Economic Sustainability, New York, NY, USA, 28–29 March 2012; pp. 209–225.
- Chen, Y.; Cheng, J.J.; Creamer, K.S. Inhibition of anaerobic digester processes: A review. Bioresour. Technol 2008, 99, 4044–4064. [Google Scholar]
- Appels, L.; Lauwers, J.; Degréve, J.; Helsen, L.; Lievens, B.; Willems, K.; van Impe, J.; Dewil, R. Anaerobic digestion in global bio-energy production: Potential and research challenges. Renew. Sustain. Energy Rev. 2011, 15, 4295–4301. [Google Scholar]
- Rincón, B.; Borja, R.; González, J.M.; Portillo, M.C.; Sáiz-Jiménez, C. Influence of organic loading rate and hydraulic retention time on the performance, stability and microbial communities of one-stage anaerobic digestion of two-phase olive mill solid residue. Biochem. Eng. J. 2008, 40, 253–261. [Google Scholar]
- Bialek, K.; Cysneiros, D.; O'Flaherty, V. Low-temperature (10 °C) anaerobic digestion of dilute dairy wastewater in an EGSB bioreactor: Microbial community structure, population dynamics, and kinetics of methanogenic populations. Archaea 2013, 2013, 346171. [Google Scholar] [CrossRef]
- McKeown, R.; Scully, C.; Enright, A.; Chinalia, F.; Lee, C.; Mahony, T.; Gavin Collins, G.; Vincent O'Flaherty, V. Psychrophilic methanogenic community development during long-term cultivation of anaerobic granular biofilms. Int. Soc. Microb. Ecol. J. 2009, 3, 1231–1242. [Google Scholar]
- Rastogi, G.; Ranade, D.R.; Yeole, T.Y.; Patole, M.S.; Shouche, Y.S. Investigation of methanogen population structure in biogas reactor by molecular characterization of methyl-co-enzyme M reductase A (mcrA) genes. Bioresour. Technol 2008, 99, 5317–5326. [Google Scholar]
- Ziganshin, A.M.; Schmidt, T.; Scholwin, F.; Il'inskaya, O.N.; Harms, H.; Kleinsteuber, S. Bacteria and archaea involved in anaerobic digestion of distillers grains with solubles. Appl. Microbiol. Biotechnol 2011, 89, 2039–2052. [Google Scholar]
- Gentile, M.E.; Nyman, J.L.; Criddle, C.S. Correlation of patterns of denitrification instability in replicated bioreactor communities with shifts in the relative abundance and the denitrification patterns of specific populations. Int. Soc. Microb. Ecol. J. 2007, 1, 714–728. [Google Scholar]
- McGuinness, L.M.; Salganik, M.; Vega, L.; Pickering, K.D.; Kerkhof, L.J. Replicability of bacterial communities in deniftifying bioreactors as measured by PCR/T-RFLP analysis. Environ. Sci. Technol 2006, 40, 509–515. [Google Scholar]
- Hashsham, S.; Fernadez, A.; Dollhopf, S.; Dazzo, F.; Hickey, R.; Tiedje, J. Parallel processing of substrate correlates with greater functional stability in methanogenic bioreactor communities perturbed by glucose. Appl. Environ. Microbiol 2000, 66, 4050–4057. [Google Scholar]
- Fernadez, A.; Hashsham, S.A.; Dollhopf, S.L.; Raskin, L.; Glagoleve, O.; Dazzo, F.B.; Hickey, R.F.; Criddle, C.S.; Tiedje, J.M. Flexible community structure correlates with stable community function in methanogenic bioreactor communities perturbed by glucose. Appl. Environ. Microbiol 2000, 66, 4058–4067. [Google Scholar]
- Lossie, U.; Pütz, P. Targeted Control of Biogas Plants with the Help of FOS/TAC; Laboratory Analysis, Titration FOS/TAC; Hach-Lange Maroc Sarlau: Casablanca, Morocco, 2001. [Google Scholar]
- Demirel, B.; Scherer, P. The role of acetotrophic and hydrogenotrophic methanogens during anaerobic conversion of biomass to methane: A review. Rev. Environ. Sci. Biotechnol 2008, 7, 173–190. [Google Scholar]
- Rastogi, G.; Ranade, D.R.; Yeole, T.Y.; Patole, M.S.; Shouche, Y.S. Molecular analysis of methanogenic diversity associated with cattle dung. World J. Microbiol. Biotechnol 2008, 24, 2973–2979. [Google Scholar]
- Krebs, C.J. Ecological Methodology; Harper and Row Publishers: New York, NY, USA, 1989; pp. 293–301. [Google Scholar]
- Padmasiri, S.I.; Zhang, J.; Fitch, M.; Norddahl, B.; Morgenroth, E.; Raskin, L. Methanogenic population dynamics and performance of an anaerobic membrane bioreactor (AnMBR) treating swine manure under high shear conditions. Water Res. 2007, 41, 134–144. [Google Scholar]
- Microbial Community Analysis (MiCA). Available online: http://mica.ibest.uidaho.edu/ (accessed on 8 February 2014).
- Gomez, E.; Martin, J.; Michel, F. Effects of organic loading rate on reactor performance and archaeal community structure in mesophilic anaerobic digesters treating municipal sewage sludge. Waste Manag. Res. 2001, 29, 1117–1123. [Google Scholar]
- Ciotola, R.J.; Martin, J.F.; Castańo, J.M.; Lee, J.; Michel, F. Microbial community response to seasonal temperature variation is a small-scale anaerobic digester. Energies 2013, 6, 5182–5199. [Google Scholar]
- Lueders, T.; Friedrich, M. Archaeal population dynamics during sequential reduction processes in rice field soil. Appl. Environ. Microbiol 2000, 66, 2732–2742. [Google Scholar]


| Day | OLR | Digesters | Temperature (°C) | P | SSM |
|---|---|---|---|---|---|
| 8 | High | 1,2 | 27.5 | 0.19 | 0.91 |
| 8 | Medium | 3,4 | 27.5 | 0.78 | 0.96 |
| 40 | High | 1,2 | 21.0 | 0.93 | 0.92 |
| 40 | Low | 5,6 | 21.0 | 0.36 | 0.90 |
| 66 | Medium | 3,4 | 14.5 | 0.67 | 0.95 |
| 66 | Low | 5,6 | 14.5 | 0.43 | 0.94 |
| 98 | High | 1,2 | 10.0 | 0.80 | 0.83 |
| 98 | Medium | 3,4 | 10.0 | 0.74 | 0.97 |
| 114 | High | 1,2 | 10.0 | 0.53 | 0.79 |
| 114 | Medium | 3,4 | 10.0 | 0.87 | 0.89 |
| 114 | Low | 5,6 | 10.0 | 0.15 | 0.89 |
| 214 | High | 1,2 | 27.5 | 0.84 | 0.89 |
| 214 | Medium | 3,4 | 27.5 | 0.80 | 0.82 |
| 214 | Low | 5,6 | 27.5 | 0.15 | 0.82 |
| Average | – | – | – | 0.59 | 0.89 |
| STDEV | – | – | – | 0.28 | 0.06 |
© 2014 by the authors; licensee MDPI, Basel, Switzerland This article is an open access article distributed under the terms and conditions of the Creative Commons Attribution license ( http://creativecommons.org/licenses/by/3.0/).
Share and Cite
Ciotola, R.J.; Martin, J.F.; Tamkin, A.; Castańo, J.M.; Rosenblum, J.; Bisesi, M.S.; Lee, J. The Influence of Loading Rate and Variable Temperatures on Microbial Communities in Anaerobic Digesters. Energies 2014, 7, 785-803. https://doi.org/10.3390/en7020785
Ciotola RJ, Martin JF, Tamkin A, Castańo JM, Rosenblum J, Bisesi MS, Lee J. The Influence of Loading Rate and Variable Temperatures on Microbial Communities in Anaerobic Digesters. Energies. 2014; 7(2):785-803. https://doi.org/10.3390/en7020785
Chicago/Turabian StyleCiotola, Richard J., Jay F. Martin, Abigail Tamkin, Juan M. Castańo, James Rosenblum, Michael S. Bisesi, and Jiyoung Lee. 2014. "The Influence of Loading Rate and Variable Temperatures on Microbial Communities in Anaerobic Digesters" Energies 7, no. 2: 785-803. https://doi.org/10.3390/en7020785