Modelling and Internal Fuzzy Model Power Control of a Francis Water Turbine

Abstract
: This paper presents dynamic modelling of a Francis turbine with a surge tank and the control of a hydro power plant (HPP). Non-linear and linear models include technical parameters and show high similarity to measurement data. Turbine power control with an internal model control (IMC) is proposed, based on a turbine fuzzy model. Considering appropriate control responses in the entire area of turbine power, the model parameters of the process are determined from a fuzzy model, which are further included in the internal model controller. The results are compared to a proportional-integral (PI) controller tuned with an integral absolute error (IAE) objective function, and show an improved response of internal model control.1. Introduction
In HPPs, a digital turbine governor is an indispensable part of the control system. The stability of frequency, active power control, water flow control, turbine start-up procedure and emergency shut-down implemented with algorithms are major functions of digital turbine governor. Connected to Supervisory Control and Data Acquisition (SCADA), the unit controller, the excitation system and the digital voltage controller, it enables the operator to change the operating states of generator, i.e., the rotational speed, active power, reactive power and voltage.
With reference to achieving suitable control results and exploring the dynamic responses of a hydro power plant unit, it is necessary to obtain a mathematical hydraulic model of the hydro turbine and other parts of water system. Different types of hydraulic non-linear models were proposed in [1]: a non-linear model assuming a non-elastic water column, a model including travelling waves, and a model including a surge tank effect. In [2–7], the authors applied a non-linear or linearised model with a non-elastic water column to study the transient behaviour of a Francis turbine. Chen et al. provided a nonlinear dynamical model with surge tank presented with state space equations, analysed with bifurcation diagrams, phase orbits and spectrograms [8], however a comparison to the real system was neglected. In [9] authors developed interesting non-linear and linearised hydro turbine models with transient stability analysis in the free and open source Power System Analysis Toolbox (PSAT) software, although a conventional controller without a sophisticated tuning method was used.
Many recommendations of modelling, design and testing control systems for hydraulic turbines are described in international standards [10,11] and a few modern methods in [12,13], nevertheless in most cases a proportional-integral-derivative (PID) or proportional-integral (PI) controller is used for speed, active power, water level, flow and wicket gate opening control. However, the parameter determining process is usually taken on site acceptance tests; some recommendation limits are proposed in [11].
In [14] a particle swarm method was applied as a strategy in an improved gravitational search algorithm for identification of an optimal water turbine model and controller parameters. Fang et al. introduced the particle swarm optimization method of controller tuning in water turbine frequency control [15]. In [16] an internal model control (IMC) tuned PID controller in comparison with Ziegler-Nichols and singular frequency based tuning was studied for frequency control of hydropower system with a water hammer effect. The design of a PID controller based on sensitivity margin specifications was introduced in [17], where the author proposed the controller with respect to sensitivity peak specification. As a result in these cases, authors obtained optimal tuned PID parameters for water turbine control that could not necessarily result in optimal transient behaviour due to simplifications of the models and nonlinearity of real processes at different operating points.
In this paper, the focus is on mathematical modelling and the fuzzy power control approach of a Francis turbine of Aggregate 1 at hydro power plant (HPP) Moste. In the second section, the paper includes a comparison of non-linear and linearised models, with and without the surge tank of the Francis Turbine 1 in HPP Moste. In the third section, a fuzzy model of the Francis turbine has been applied based on a first order linearised model. Section 4 presents a fuzzy IMC controller with tuning parameter T to ensure a suitable dynamic response in working points and middle sections. At the end of Section 4, the comparison to the PI controller has been applied, tuned by the integral absolute error (IAE) objective function.
2. Non-Linear and Linearised Model of Turbine Dynamics
2.1. Description of the Hydro Power Plant
Slovenian hydro power production consists of three HPP chains placed on the Sava, Soca and Drava Rivers. As the first HPP on the Sava River chain with a unique accumulative operation type, HPP Moste plays an important role in the Slovenian hydro power plant generation portfolio.
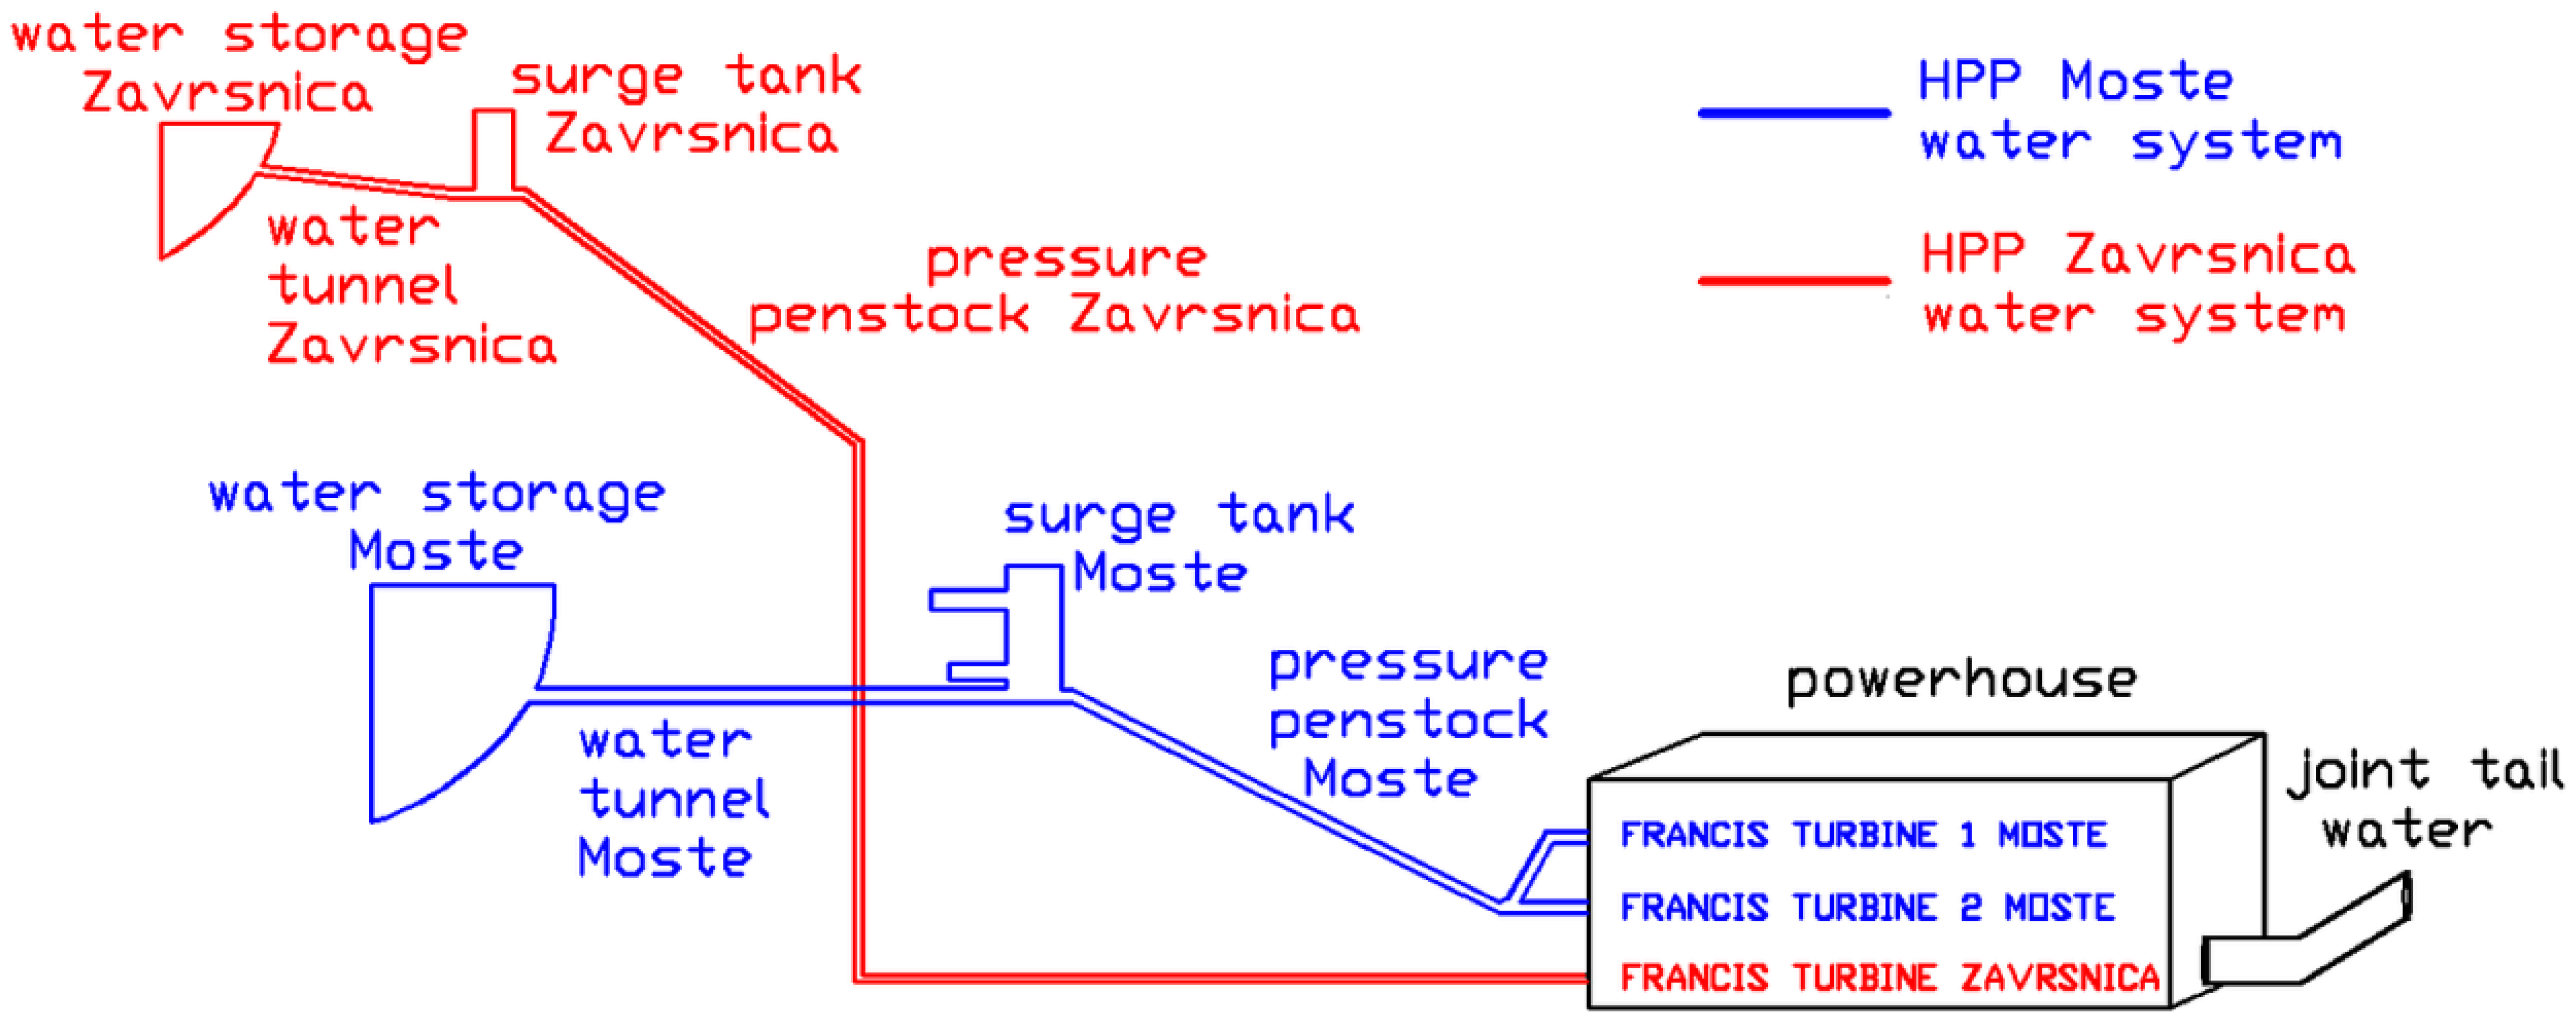
HPP Moste is part of the HPP Moste and HPP Zavrsnica water system depicted in Figure 1. Besides 2,940,000 m3 of useful volume of water storage, a −6.25 m water level deviation is allowed. After the water intake object, there is a surge tank connected by a tunnel. The pressure penstock connects the surge tank with a powerhouse, comprised of two Francis turbines (HPP Moste) and one Francis turbine (HPP Zavrsnica) with a joint tail-water conduit.
2.2. Turbine Model with Water Conduit
Turbine dynamics with the penstock are derived from second Newton's law [1,18] described with Equation (1):
With reference to water inertia time [10]:
Equation (1) becomes expressed in per unit:
In Equation (2), the water inertia time Tw includes the characteristics of all water passages with area sections Ai; corresponding lengths Li with rated discharge Qr; rated head Hr and gravity g. The change of water flow in the conduit is expressed in Equation (3), where h is the head at turbine; hf is the friction head loss in the penstock and hsp is the tail water head loss per unit. Water flow through the turbine [5] is given by:
Turbine power Pm in p.u. is expressed by:
With purpose of analysing dynamic responses, linearisation in the surrounding area of operating point R was made with a Taylor series procedure (considering first two elements), e.g., linearisation of the non-linear head at turbine admission h:
We obtain linearised Equation (9):
The linearisation process for all relations between Equations (3) and (5) was made with the real parameters of the Francis turbine 1 on HPP Moste. According to the synchronised generator and the fixed network frequency Δw = 0 assumption, only the first part of Equation (5) will be concerned in further analysis. The transfer function between turbine power Pm and wicket gate opening G is proposed in Equation (10):
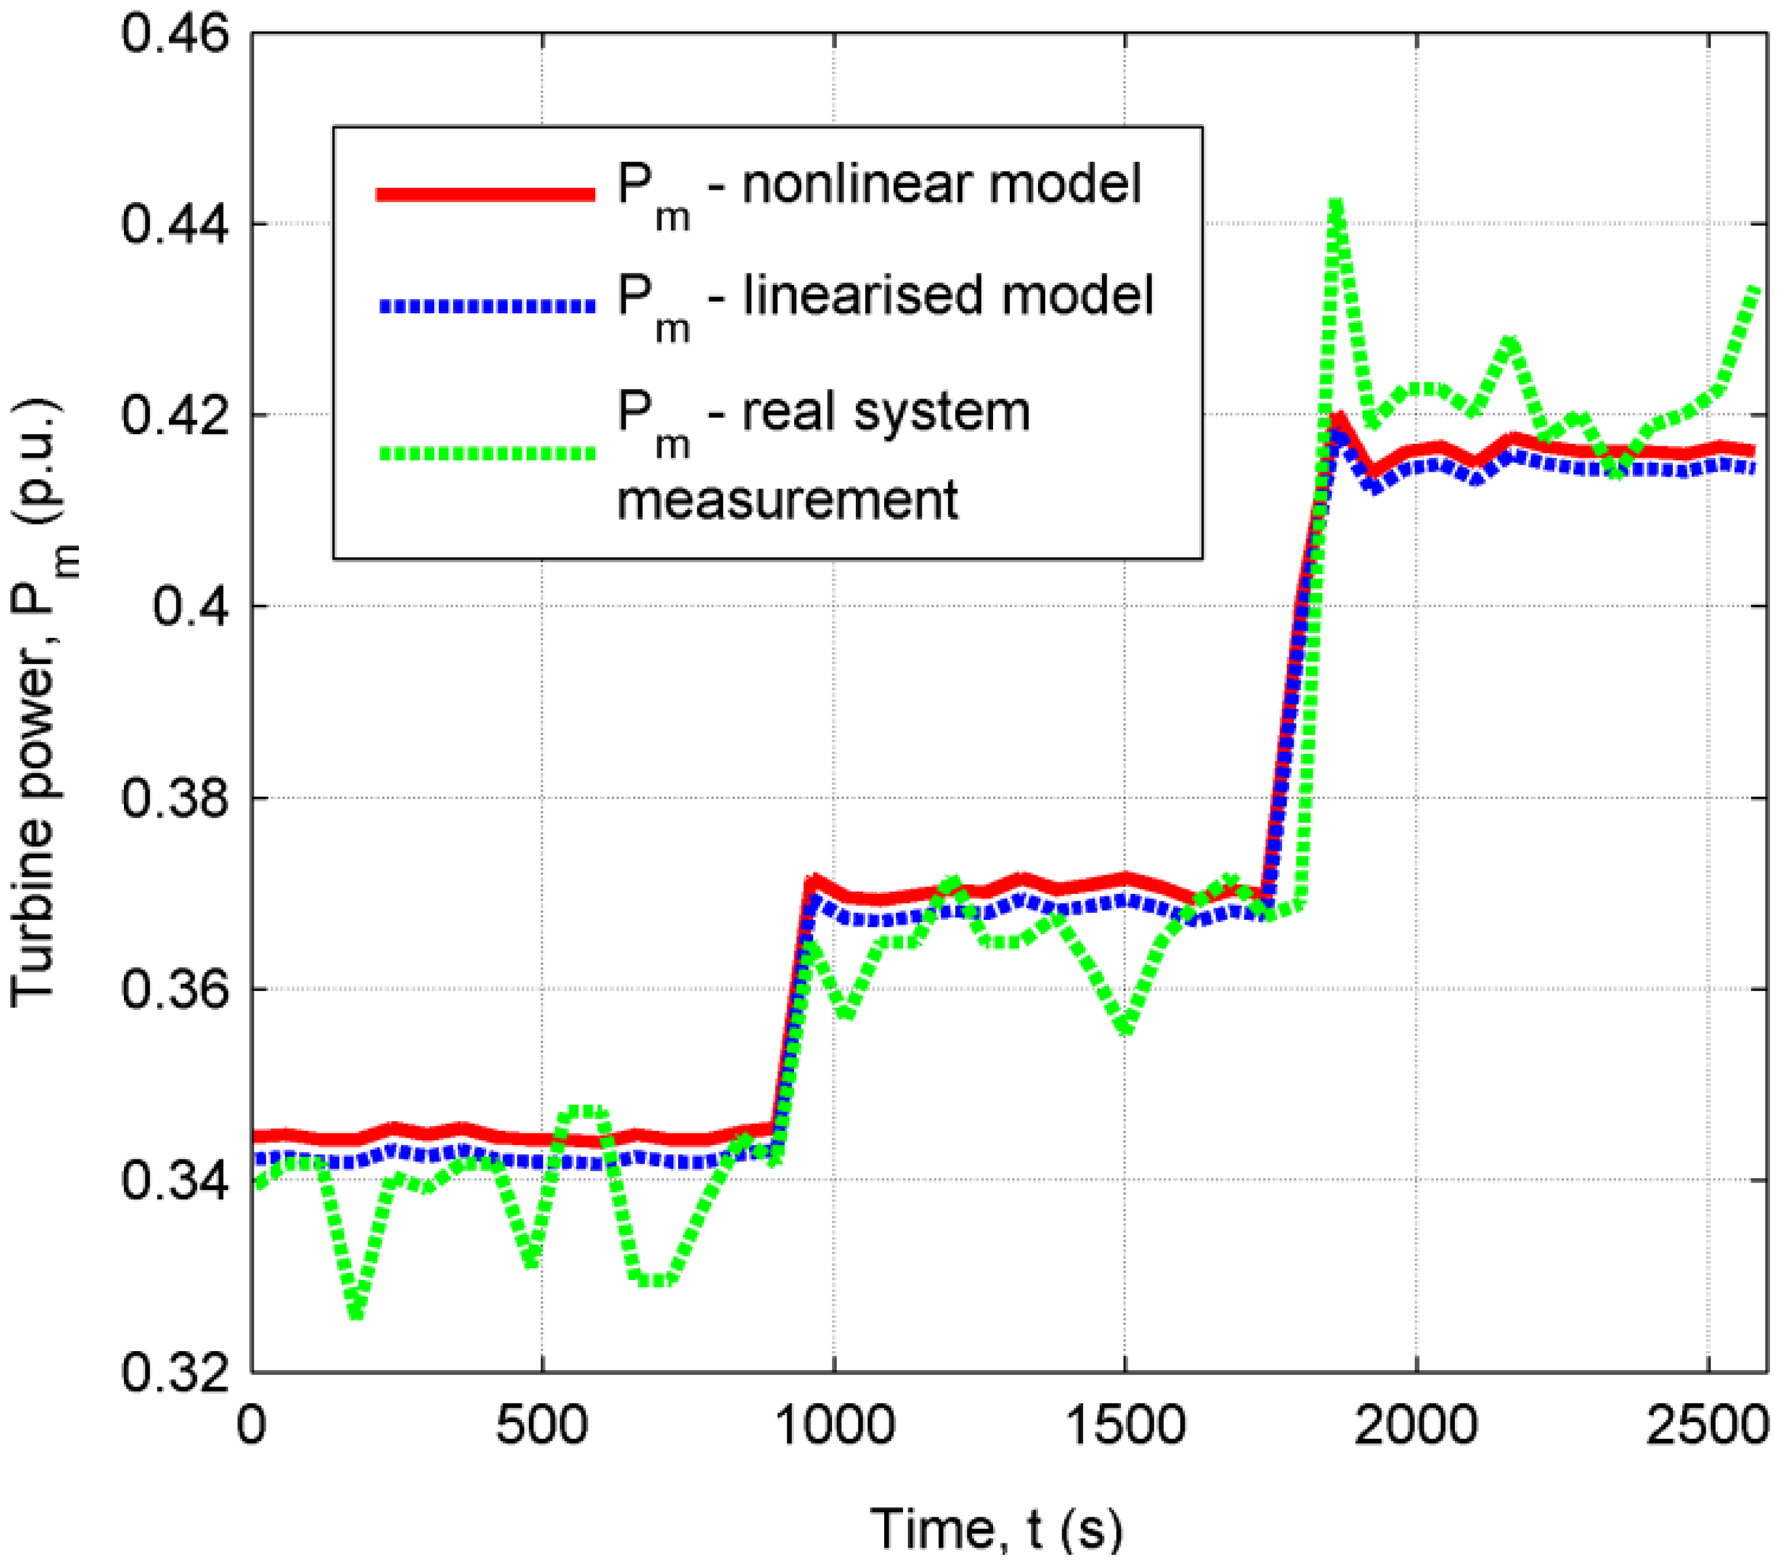
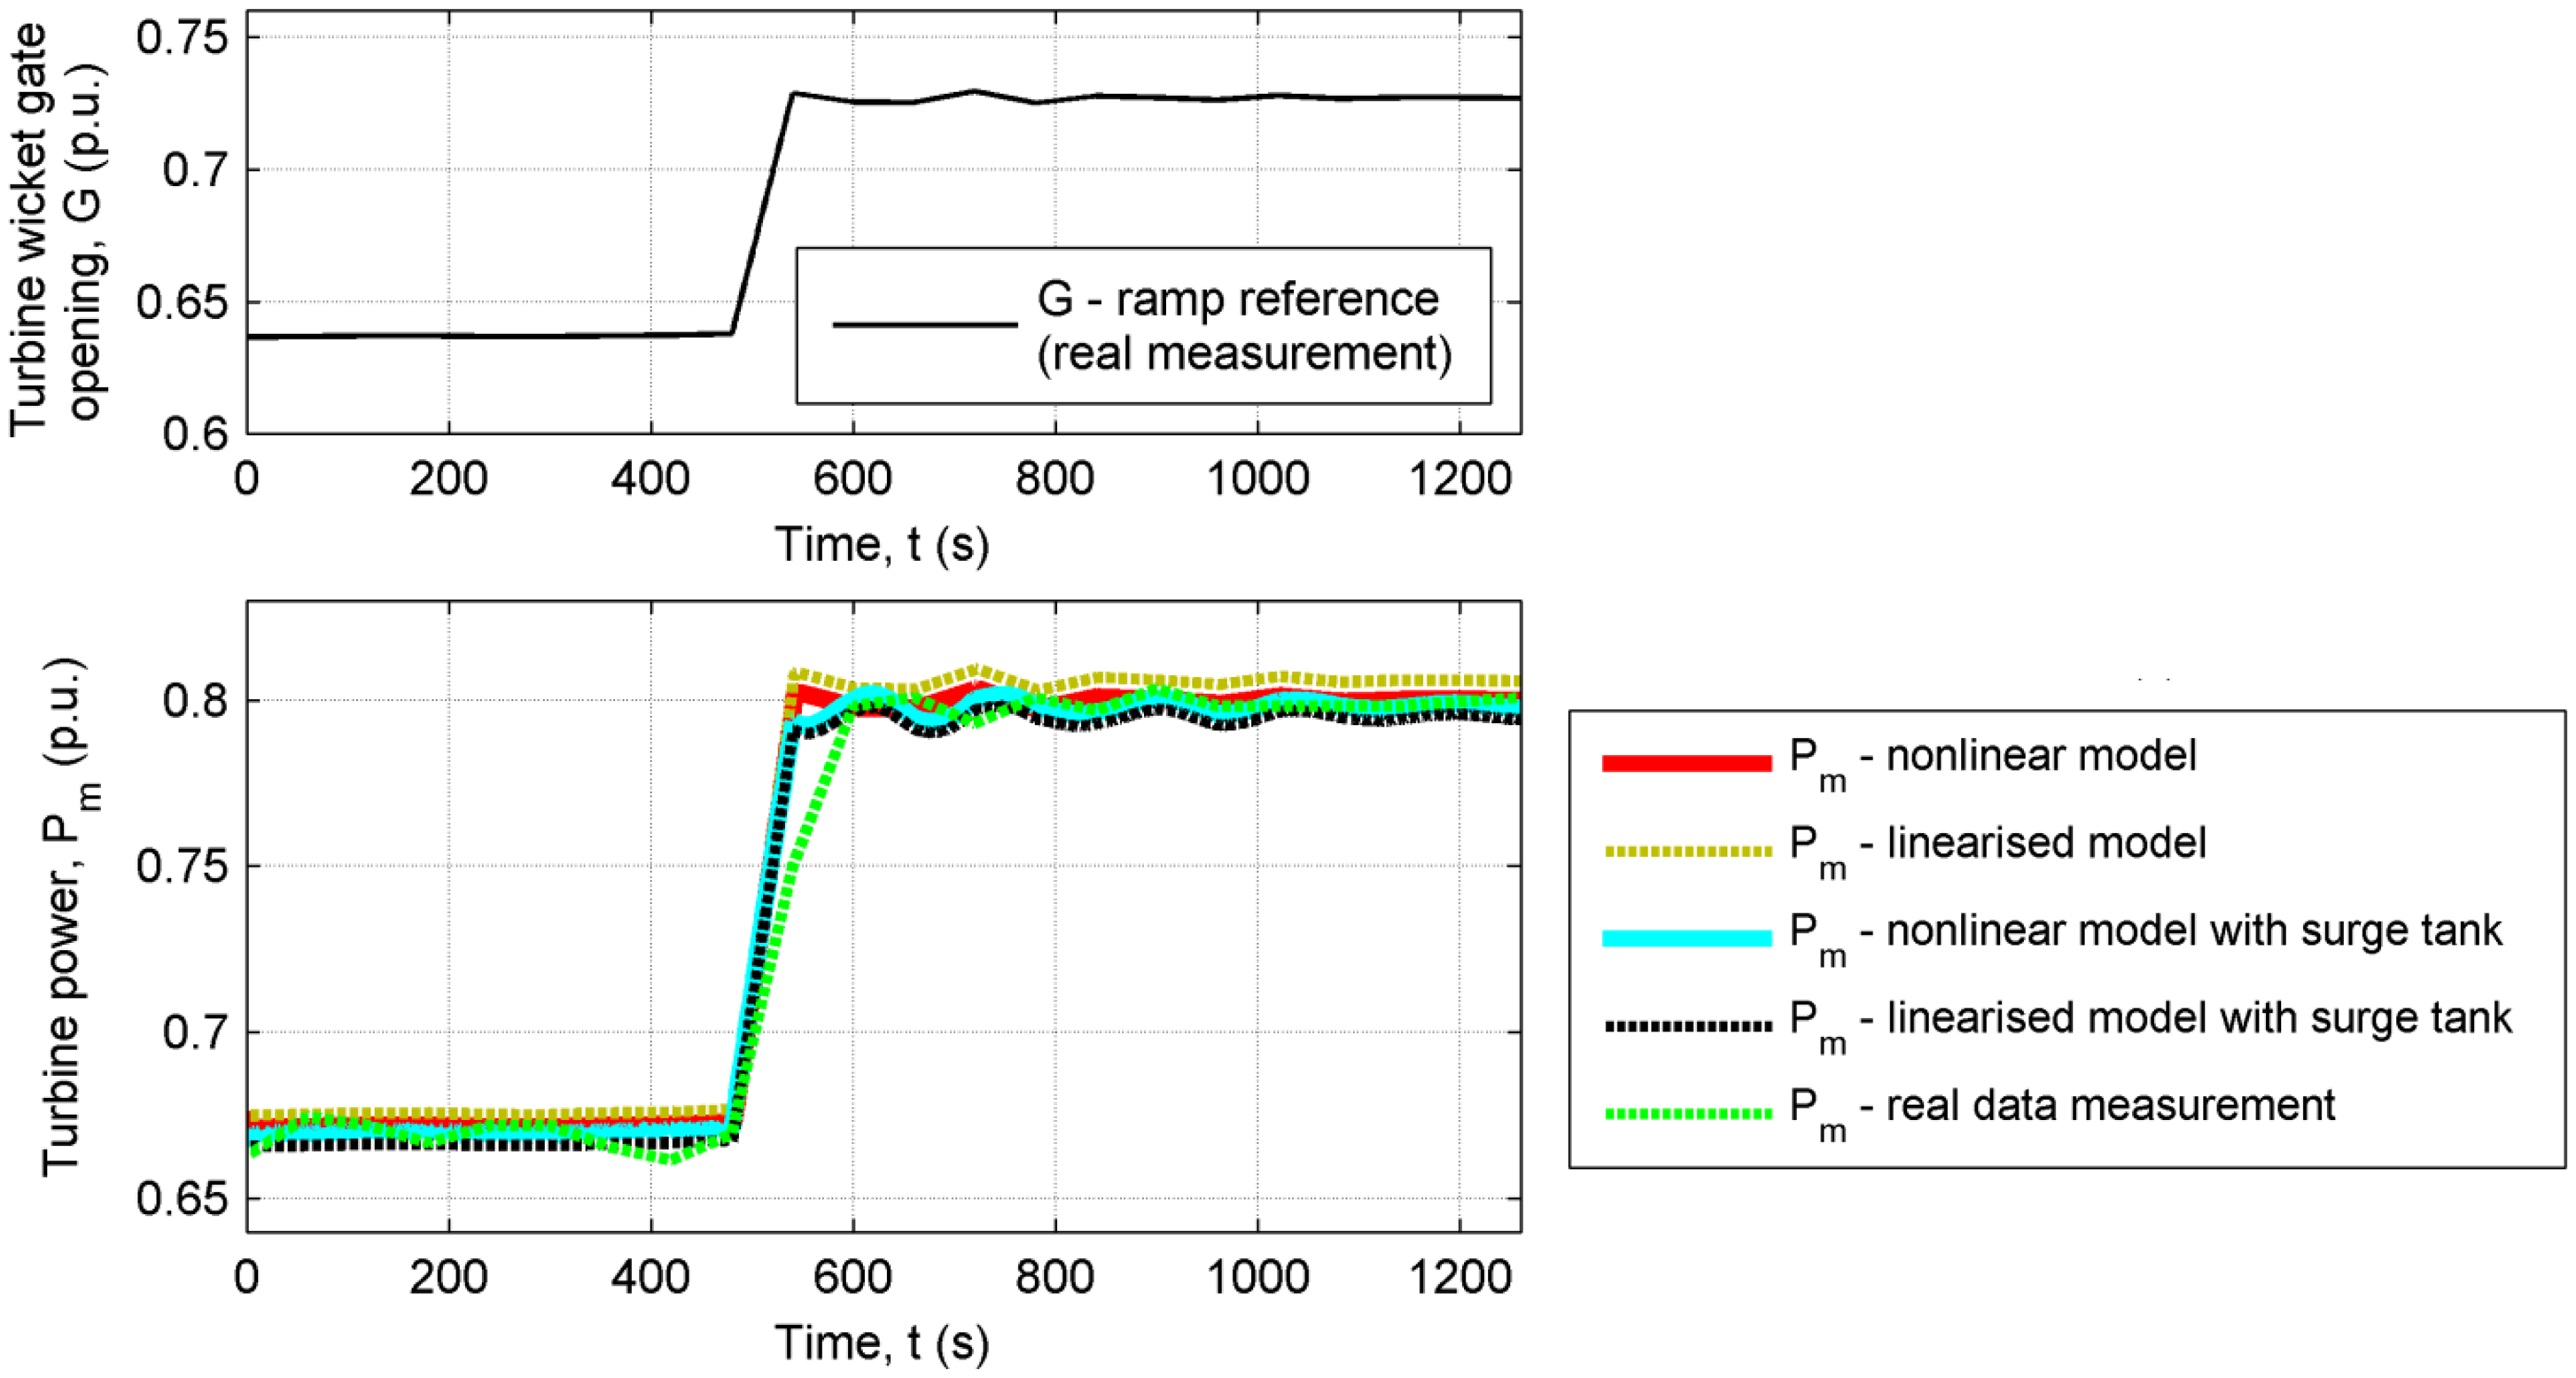
In connection to negative numerator coefficient b0 in Equation (11), the non-minimal phase type of dynamic system is observed. In Figure 2, the matching of the nonlinear and calculated linear models is presented with simulation results at operating point Pm = 0.3422, G = 0.4416, q = 0.431, h = 0.9524, hf = 0.0076 and hsp = 0.015, all p.u. with real ramp reference of the wicket gate opening, in comparison to real system measurement.
2.3. Surge Tank Modelling
In high-head HPPs, the surge tank is often included in the water system for providing the limits of water pressure fluctuation and water speed decreases in water tunnels and penstocks. There are some other important functions of surge tanks that influence the water system [18,19]: hydraulic separation of water tunnel and pressure penstock, decreasing of water hammer effect evaluation, improved results of turbine control, and acceleration of water level stabilisation.
With reference to model improvement, the surge tank with Equations (15) and (16) were included in the previously described Francis turbine model with conduit:
The surge tank implemented on HPP Moste has two extended horizontal chambers with enlarged upper and bottom surface areas, A1_kom and A3_kom. Therefore, three different areas Aw (A1_kom, A2_kom and A3_kom) were added to the model, depending on absolute surge tank water level calculated with relation:
The friction loss of head hs and hfr with friction factors fp2 and fp3 in the water tunnel are presented in Equation (19):
Coefficients of the numerator, denominator and all other parameters in simulation are related to the real system (Francis turbine 1 HPP Moste with penstock and surge tank) and are described in Appendixes A.1. and A.2.
With the real ramp reference (slower opening rate) obtained from the HPP measurement (from 5 to 6 MW), the transient response is practically without undershot (Figure 3). With 1260 s of the simulation time, approximately ±1% of fluctuating power is presented after the reference was changed (ΔG = 0.0903).
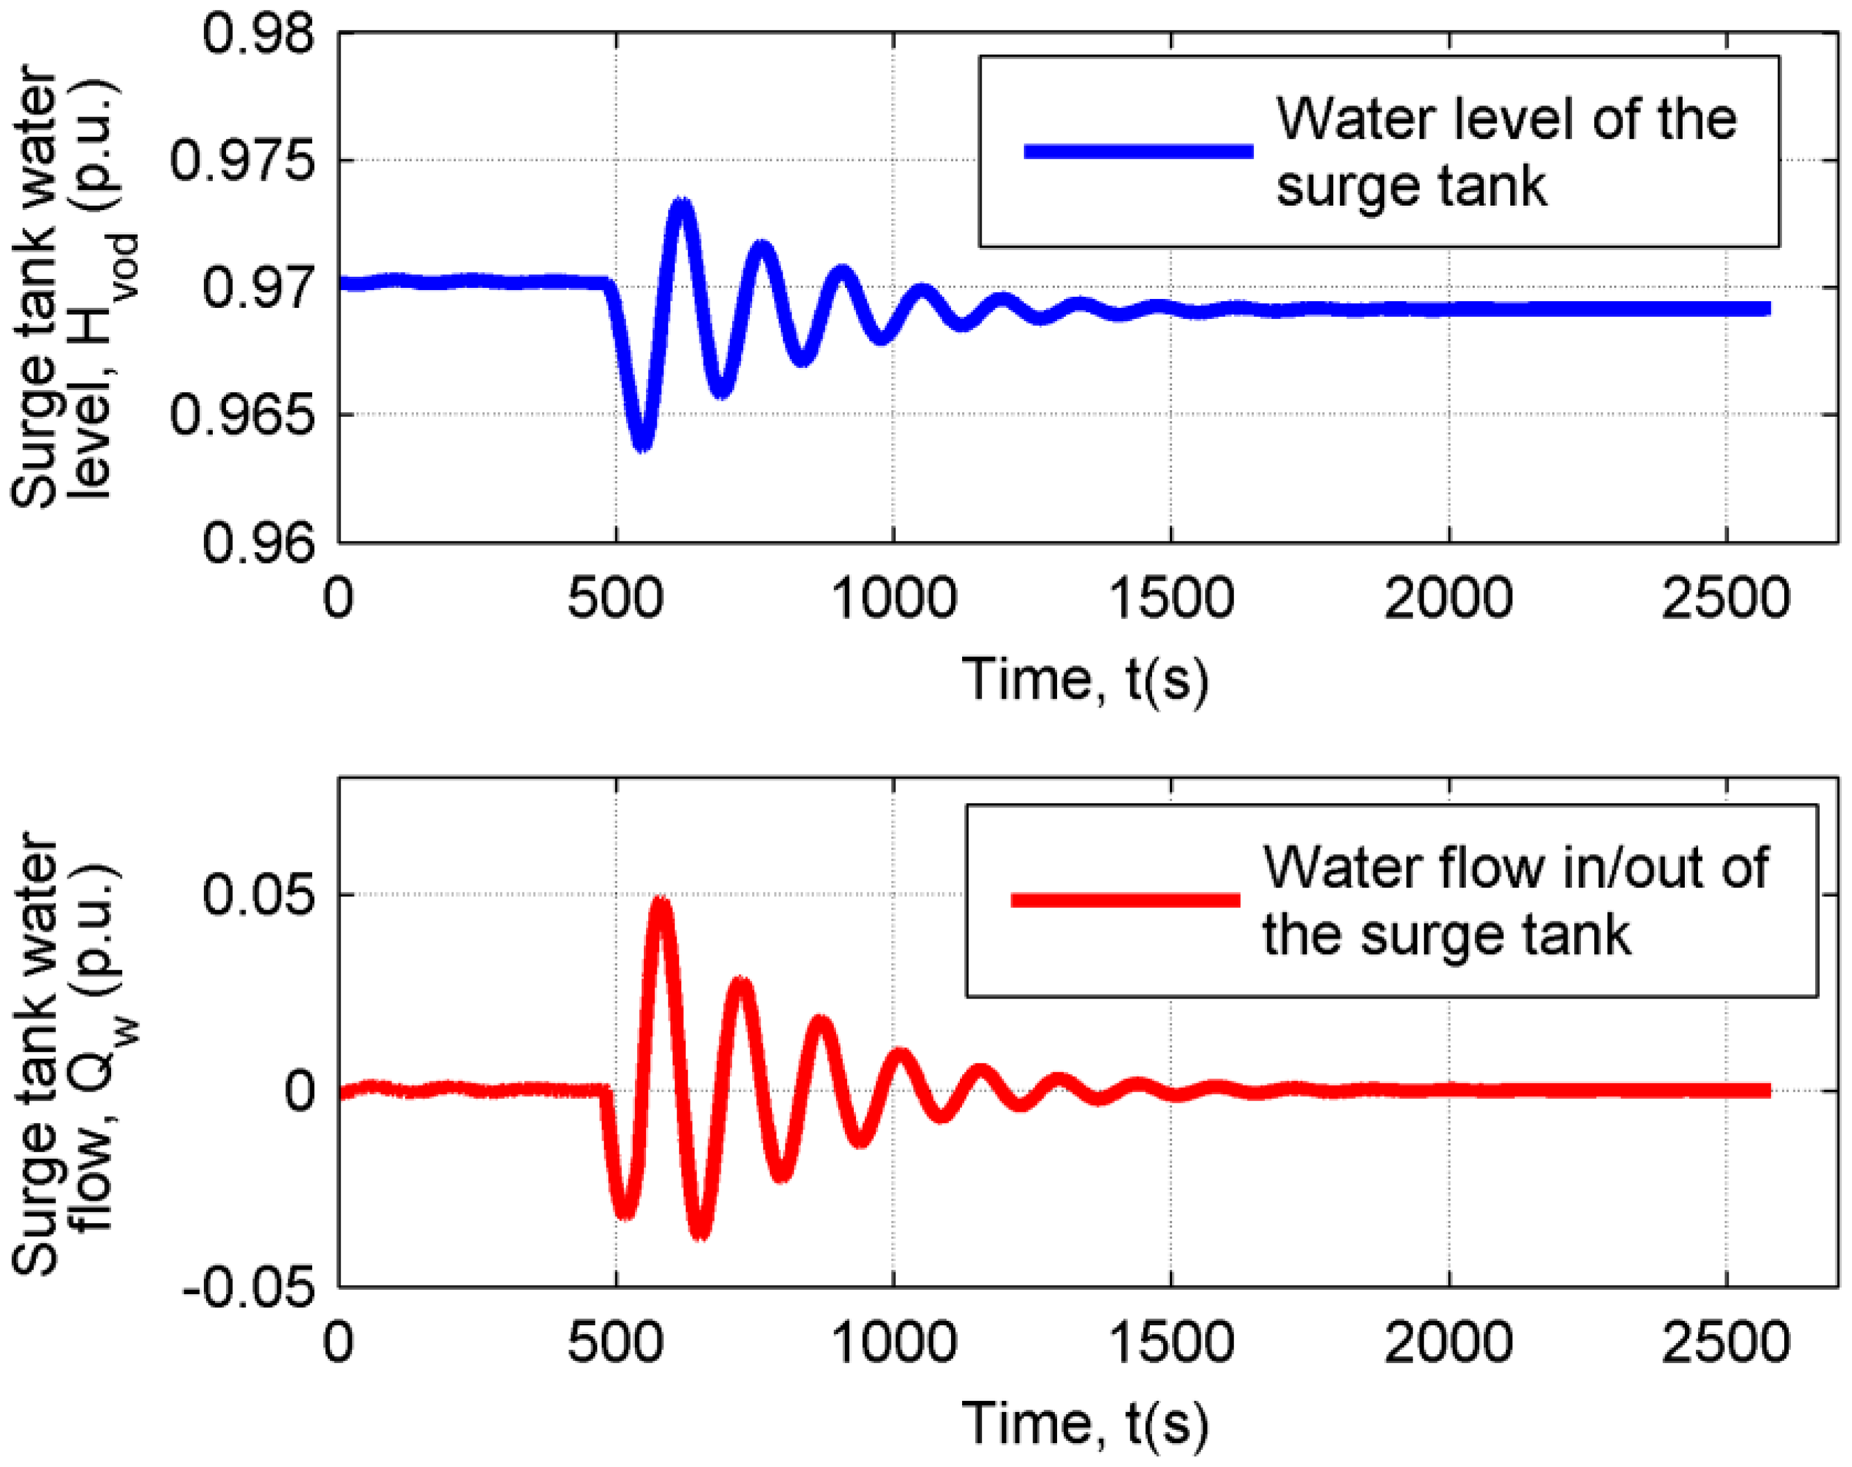
Surge tank level Hvod and water flow Qw were also observed (Figure 4) during the transient response in the nonlinear model (ramp reference). The maximum difference of the water level in the surge tank was 0.0096 p.u. (0.68 m).
3. Fuzzy Model
In connection with the high similarity of transient responses (models with/without surge tank) depicted in Figure 3, a first order model (without surge tank) is used for fuzzy modelling. A transfer function derived from Equation (10) with time constants T1, T2 and gain K is presented in Equation (25):
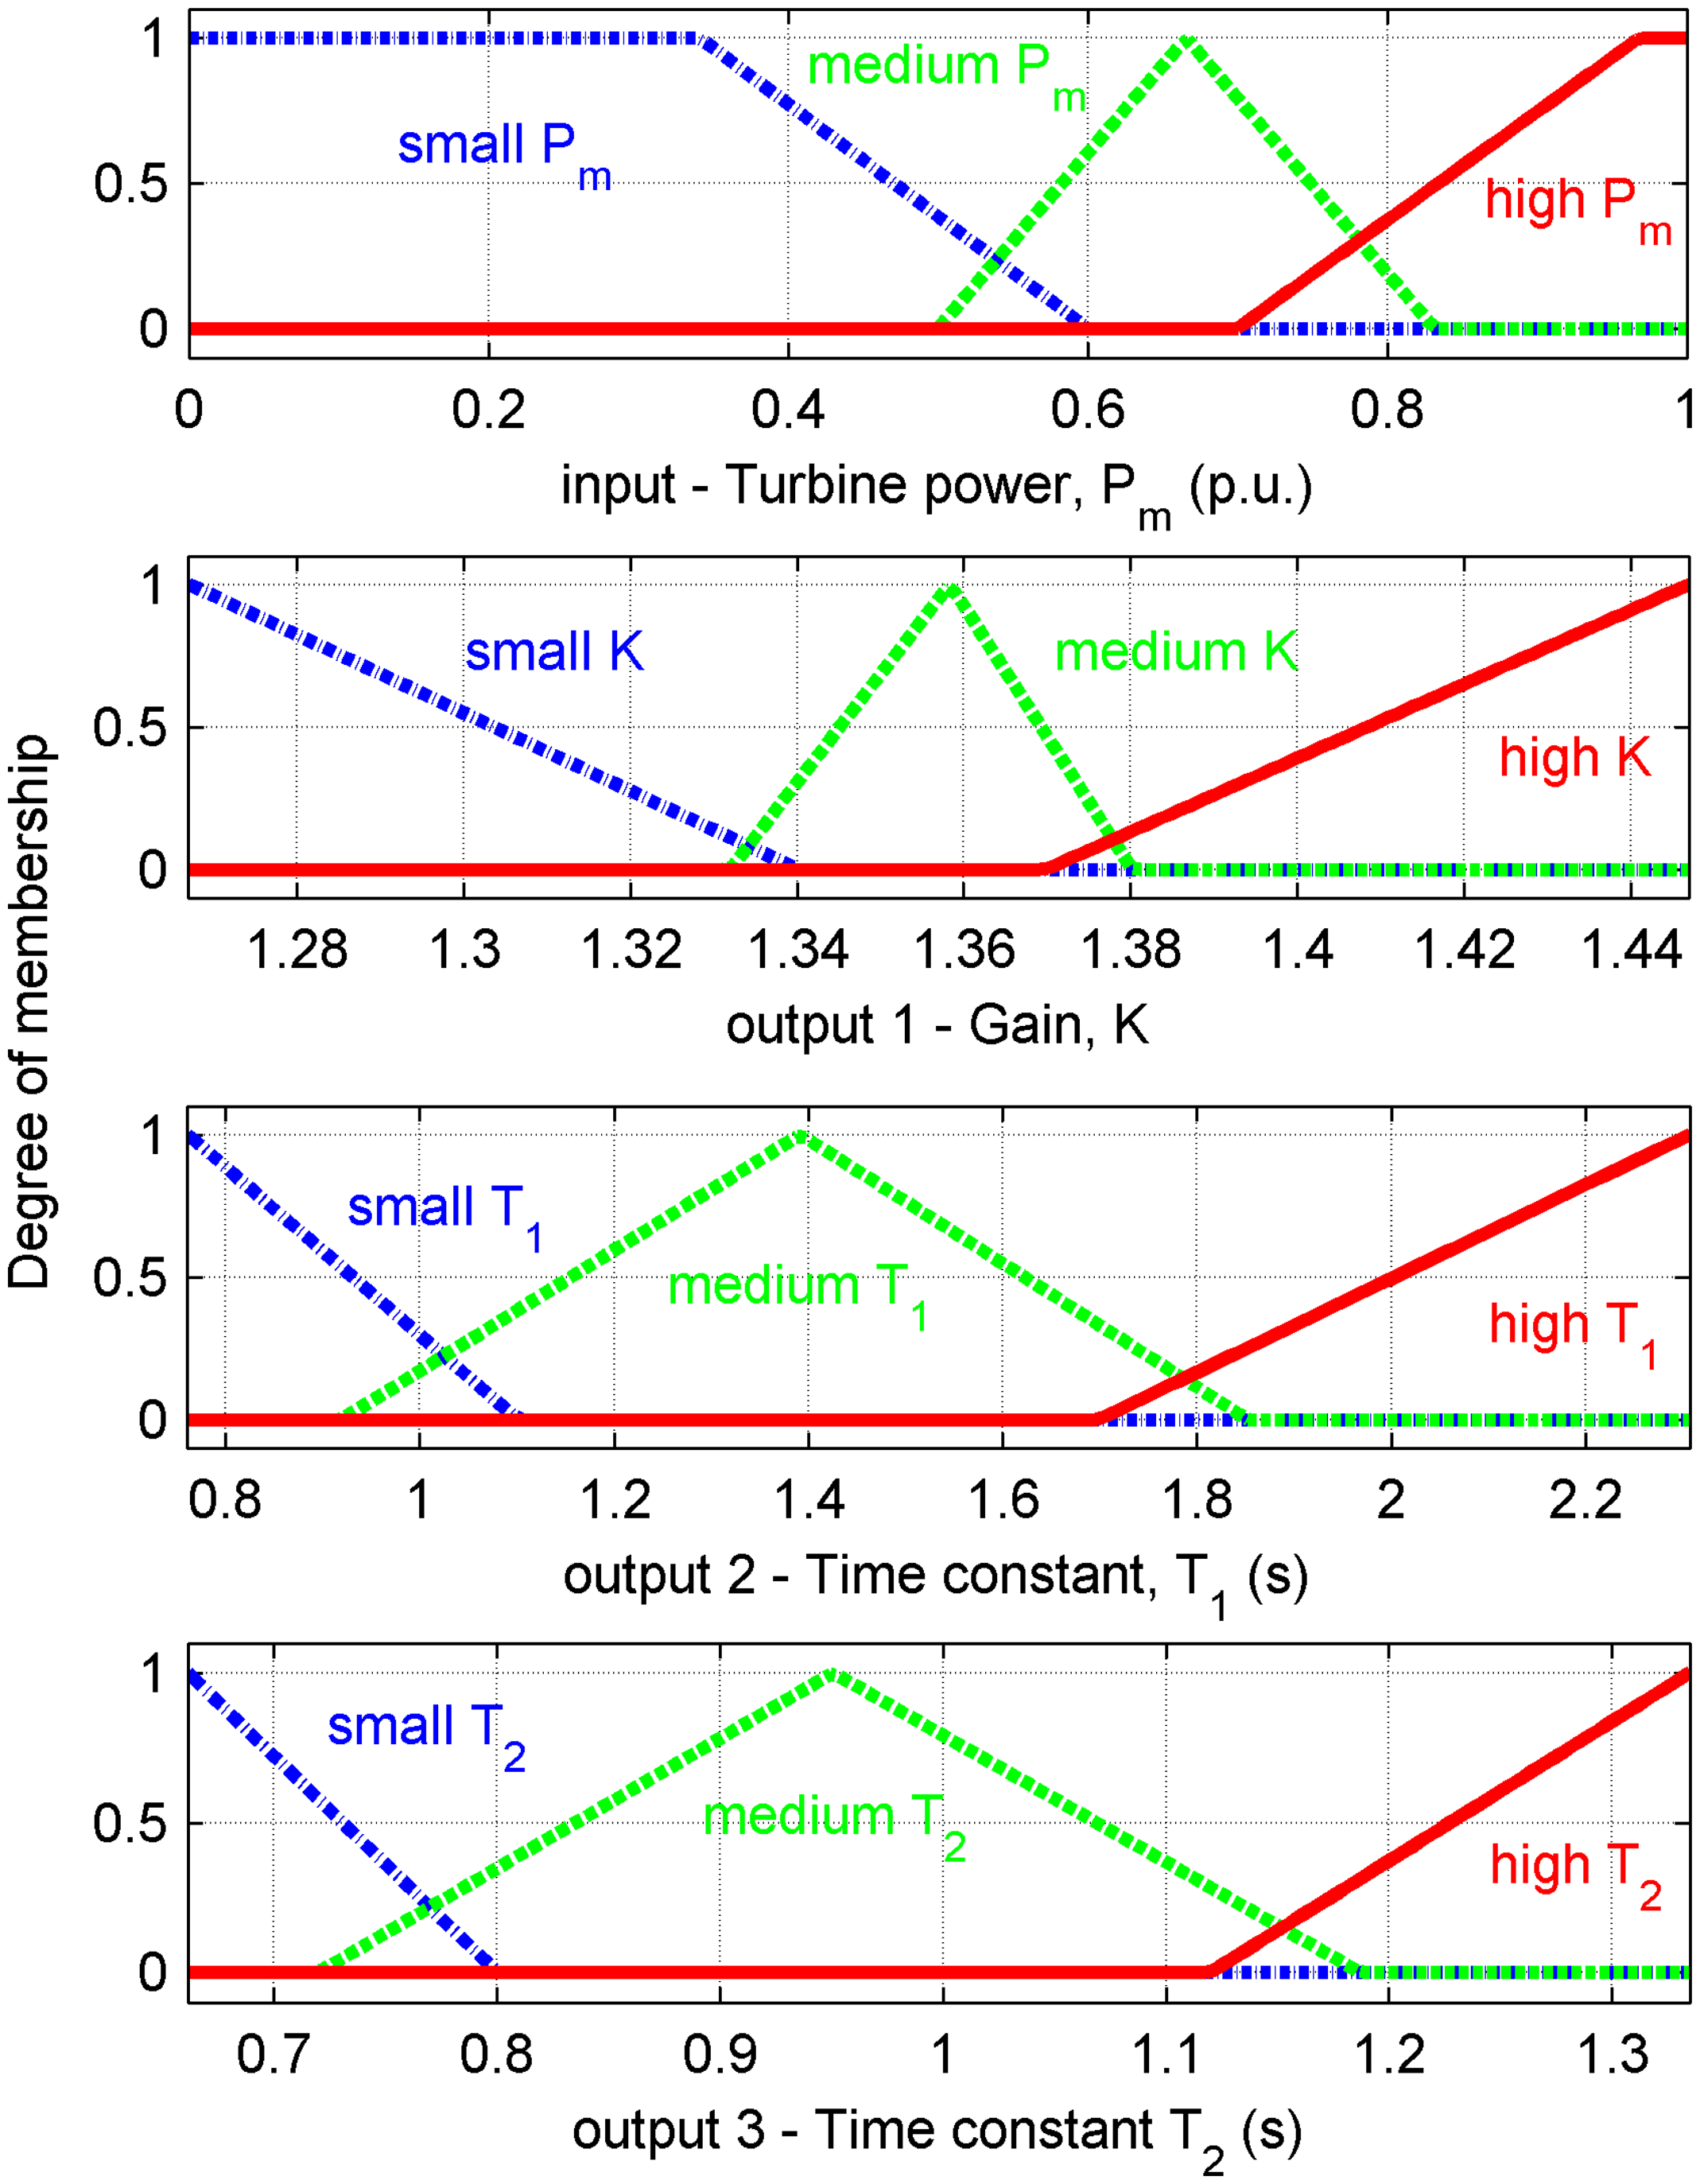
Due to the nonlinearity of the process, a fuzzy model was realised to determine the parameters in the middle sections of the working points. Membership functions, describing degrees of membership for input parameter Pm and output parameters K, T1 and T2 are presented in Figure 5.
Membership functions with triangular and trapezoidal shapes were determined based on the knowledge acquired from operating experiences and intuitiveness. Fuzzy rules added to the fuzzy model are presented with rule list interpretation:
| IF turbine power Pm = small, THEN: |
| − K = medium |
| − T1 = small |
| − T2 = small |
| IF turbine power Pm = medium, THEN: |
| − K = high |
| − T1 = medium |
| − T2 = medium |
| IF turbine power Pm = high, THEN: |
| − K = small |
| − T1 = high |
| − T2 = high |
Determination of output fuzzy set was made with an aggregation method (maximum) and with a defuzzification process, where the centroid method (also called centre of area, centre of gravity) was used to obtain crisp values of parameters [20]. Turbine model parameters in working points and middle sections obtained with fuzzy model are listed in Table 1.
4. Fuzzy IMC Control and Comparison to PI Control
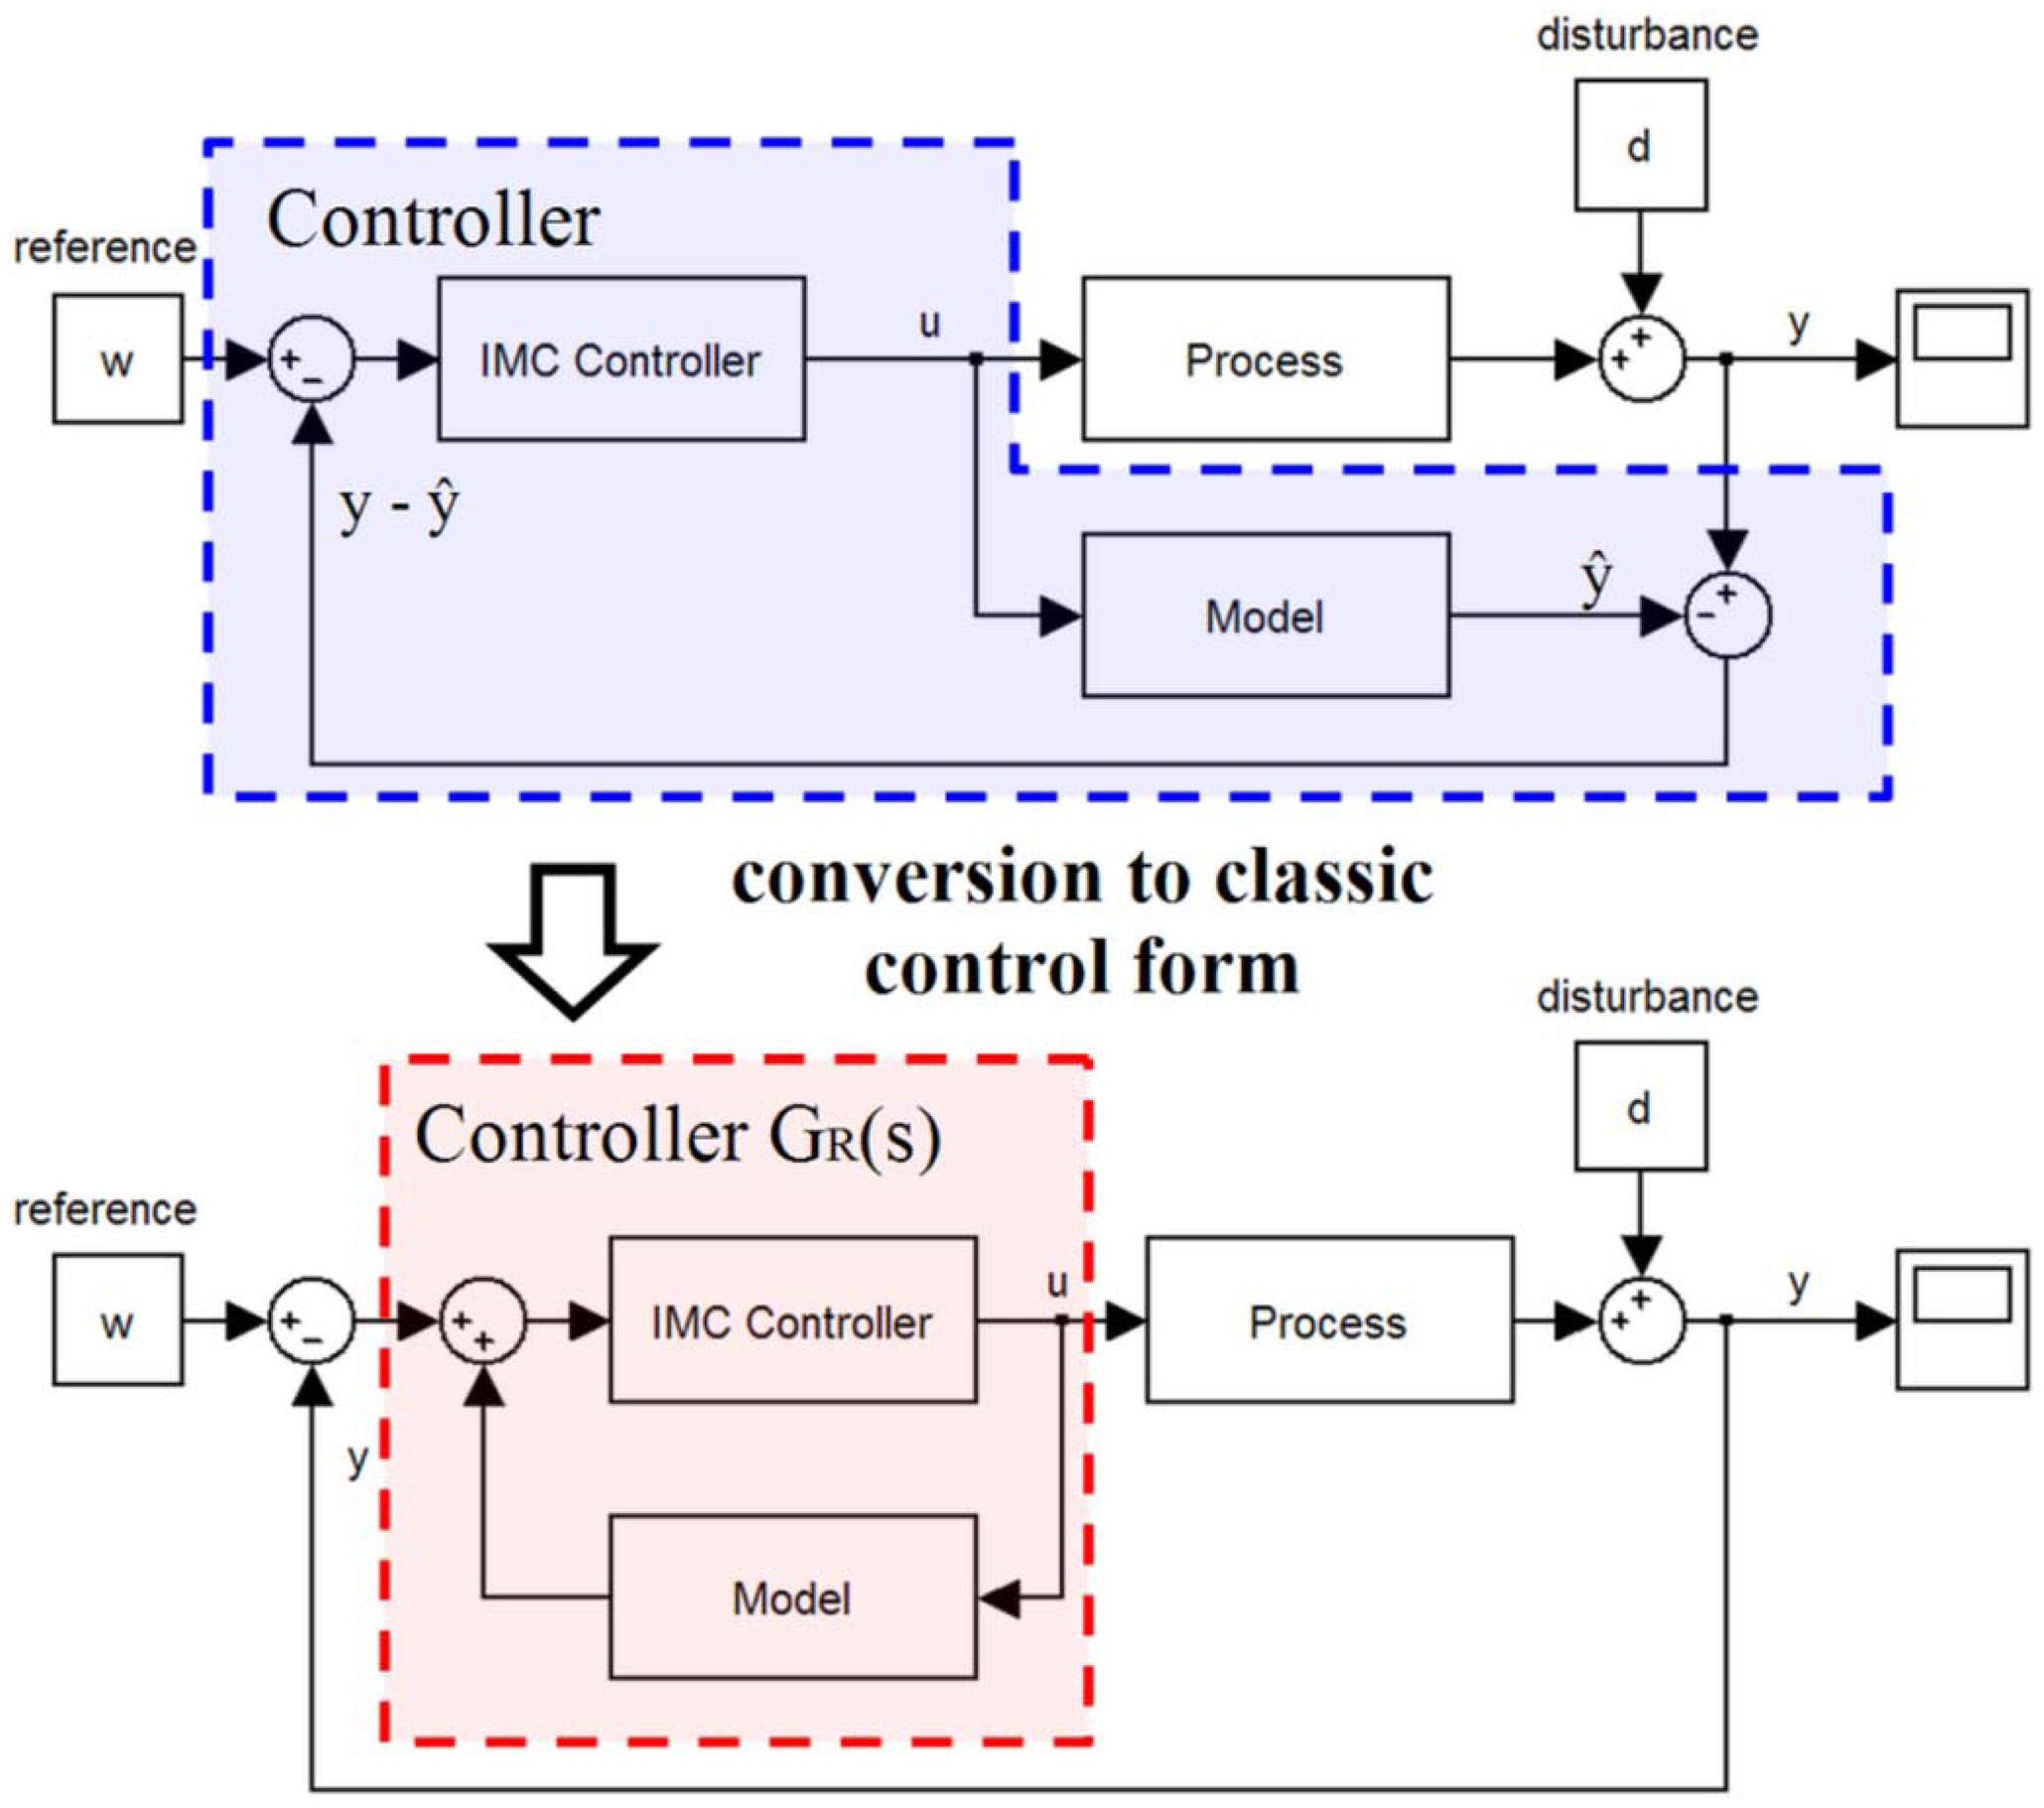
In connection to IMC calculation, the fuzzy model of the Francis turbine proposed in Section 3 is used. With IMC, a model is parallel-added to the process (Figure 6) and the difference between the output of the process and model is used for the feedback signal.
In an ideal case, when disturbance d = 0 and assuming the model is identical to the process, the feedback is inactive. Conversion to classic control form is made with Equation (26):
In the first step, the minimal phase and all-pass part of the process transfer function are expressed with Equation (27):
The ideal IMC controller is an inversed minimal phase part that results in mirror-transformed zeros over the ordinate axis:
Due to easier realisation and increased robustness, a PT1 (first order) filter with tuning parameter T is added to the ideal IMC controller:
Considering Equation (26) and Figure 6, conversion to a classic controller GR(s) is expressed with Equation (30):
Referring to different parameters in working points from the fuzzy model, the IMC controller is presented with a matrix of transfer functions MR(s), with different tuning parameter T:
The results of IMC with a nonlinear model and surge tank are presented in Figure 7, with 0.05 p.u. step response of turbine power and output of controller signal (wicket gate opening) in the first (G = 0.4416, Pm = 0.3408) and second working point (G = 0.6367, Pm = 0.6657). In the third working point (G = 0.9, Pm = 0.9684), a −0.05 p.u. step response was realised. The results shows a small undershoot (first and second working point) and a small overshoot at the third working point.
The fuzzy IMC controller algorithm was additionally formed with a fuzzy system to determine parameter T depending on turbine power Pm; while other parameters K, T1 and T2 are observed from a turbine fuzzy model. Results after the defuzzification process (centroid method) of tuning parameter T are presented in Table 2.
If a hydraulic model of turbine and water passages are known, a PID or PI controller could be used for turbine power control, tuned with IAE expressed with Equation (32) or integral time absolute error (ITAE) objective function (33) with a simulation procedure [11].
In Equations (32) and (33), Pr is the reference power and P is the actual power output. In connection to the IMC result validation, a PI controller with the same model was proposed. The tuning process was made with the IAE objective function, expressed with Equation (32), and tested in the same working points as the fuzzy IMC controller. A similar fuzzy system (with input—Pm, output Kp and KI) was realised with calculated PI parameters, listed in Table 2.
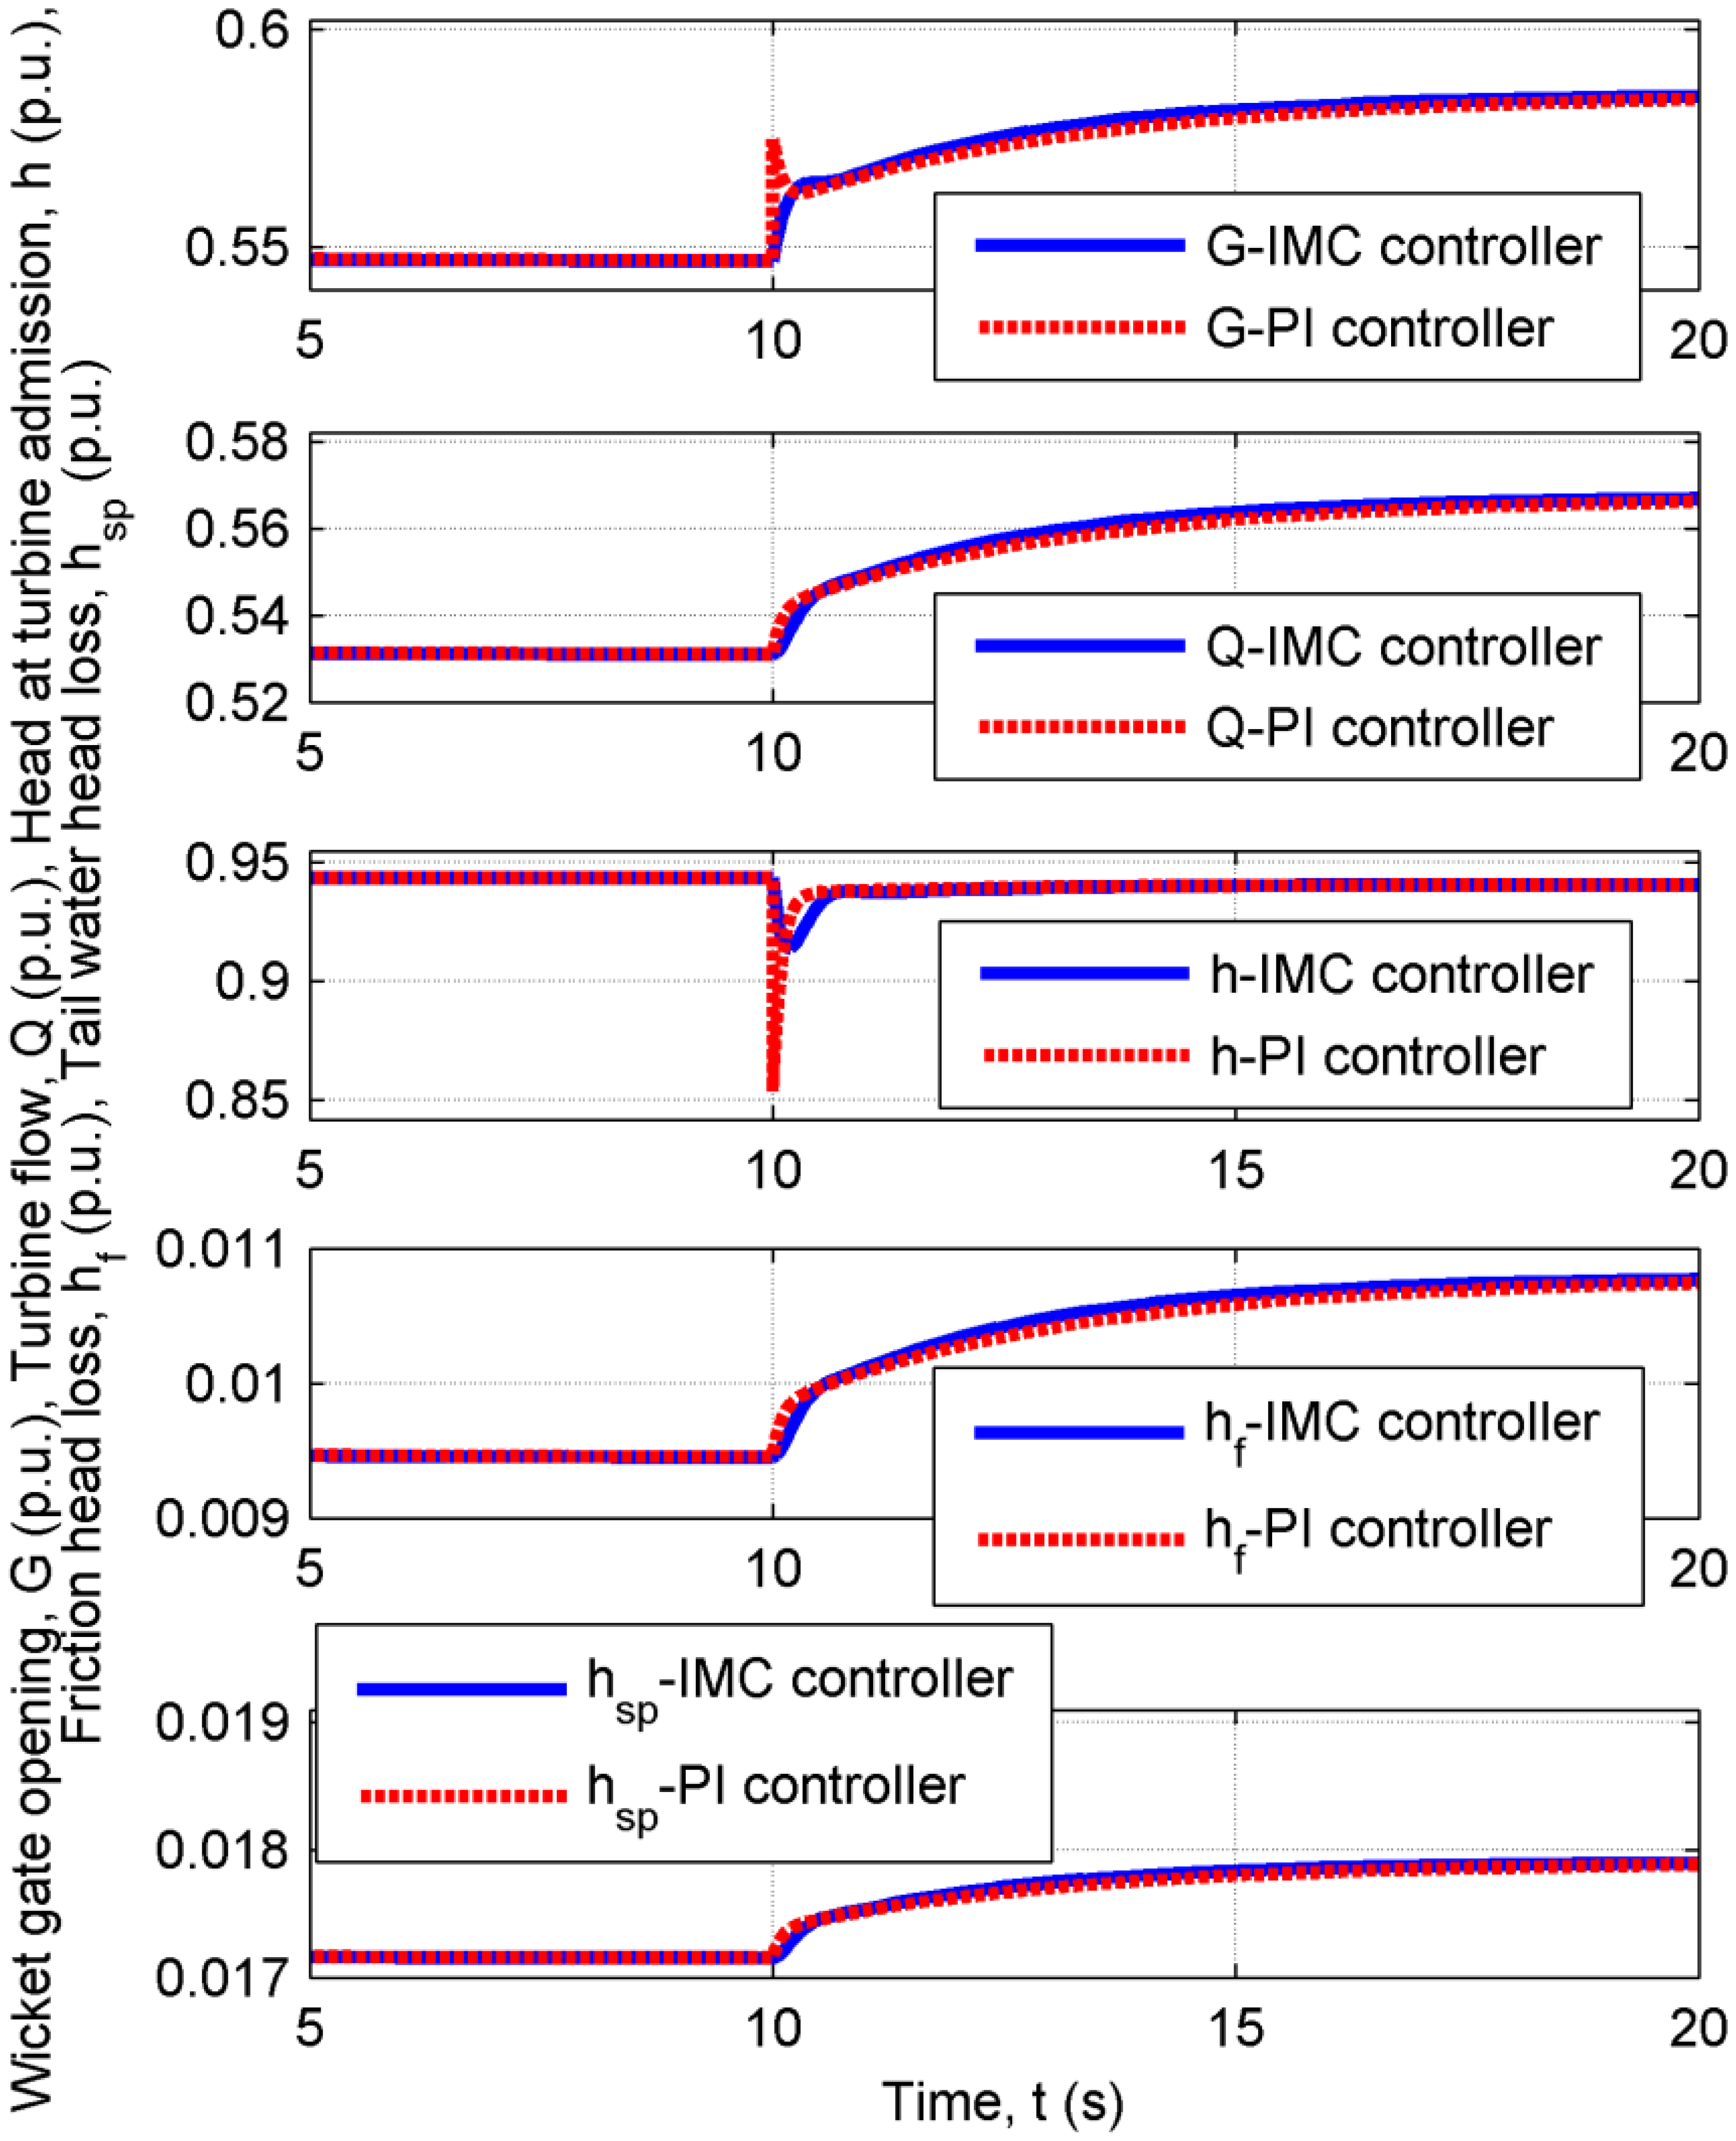
Figure 8 presents turbine wicket gate opening G, turbine flow Q, head at turbine admission h; friction head loss hf; and tail water hsp for both controllers in Pm = 0.484 middle section. The influence of the PI controller proportional part fast response results in a 6% higher variation of head h at turbine admission, which consequently causes a higher under-control effect of turbine power, compared to fuzzy IMC control.
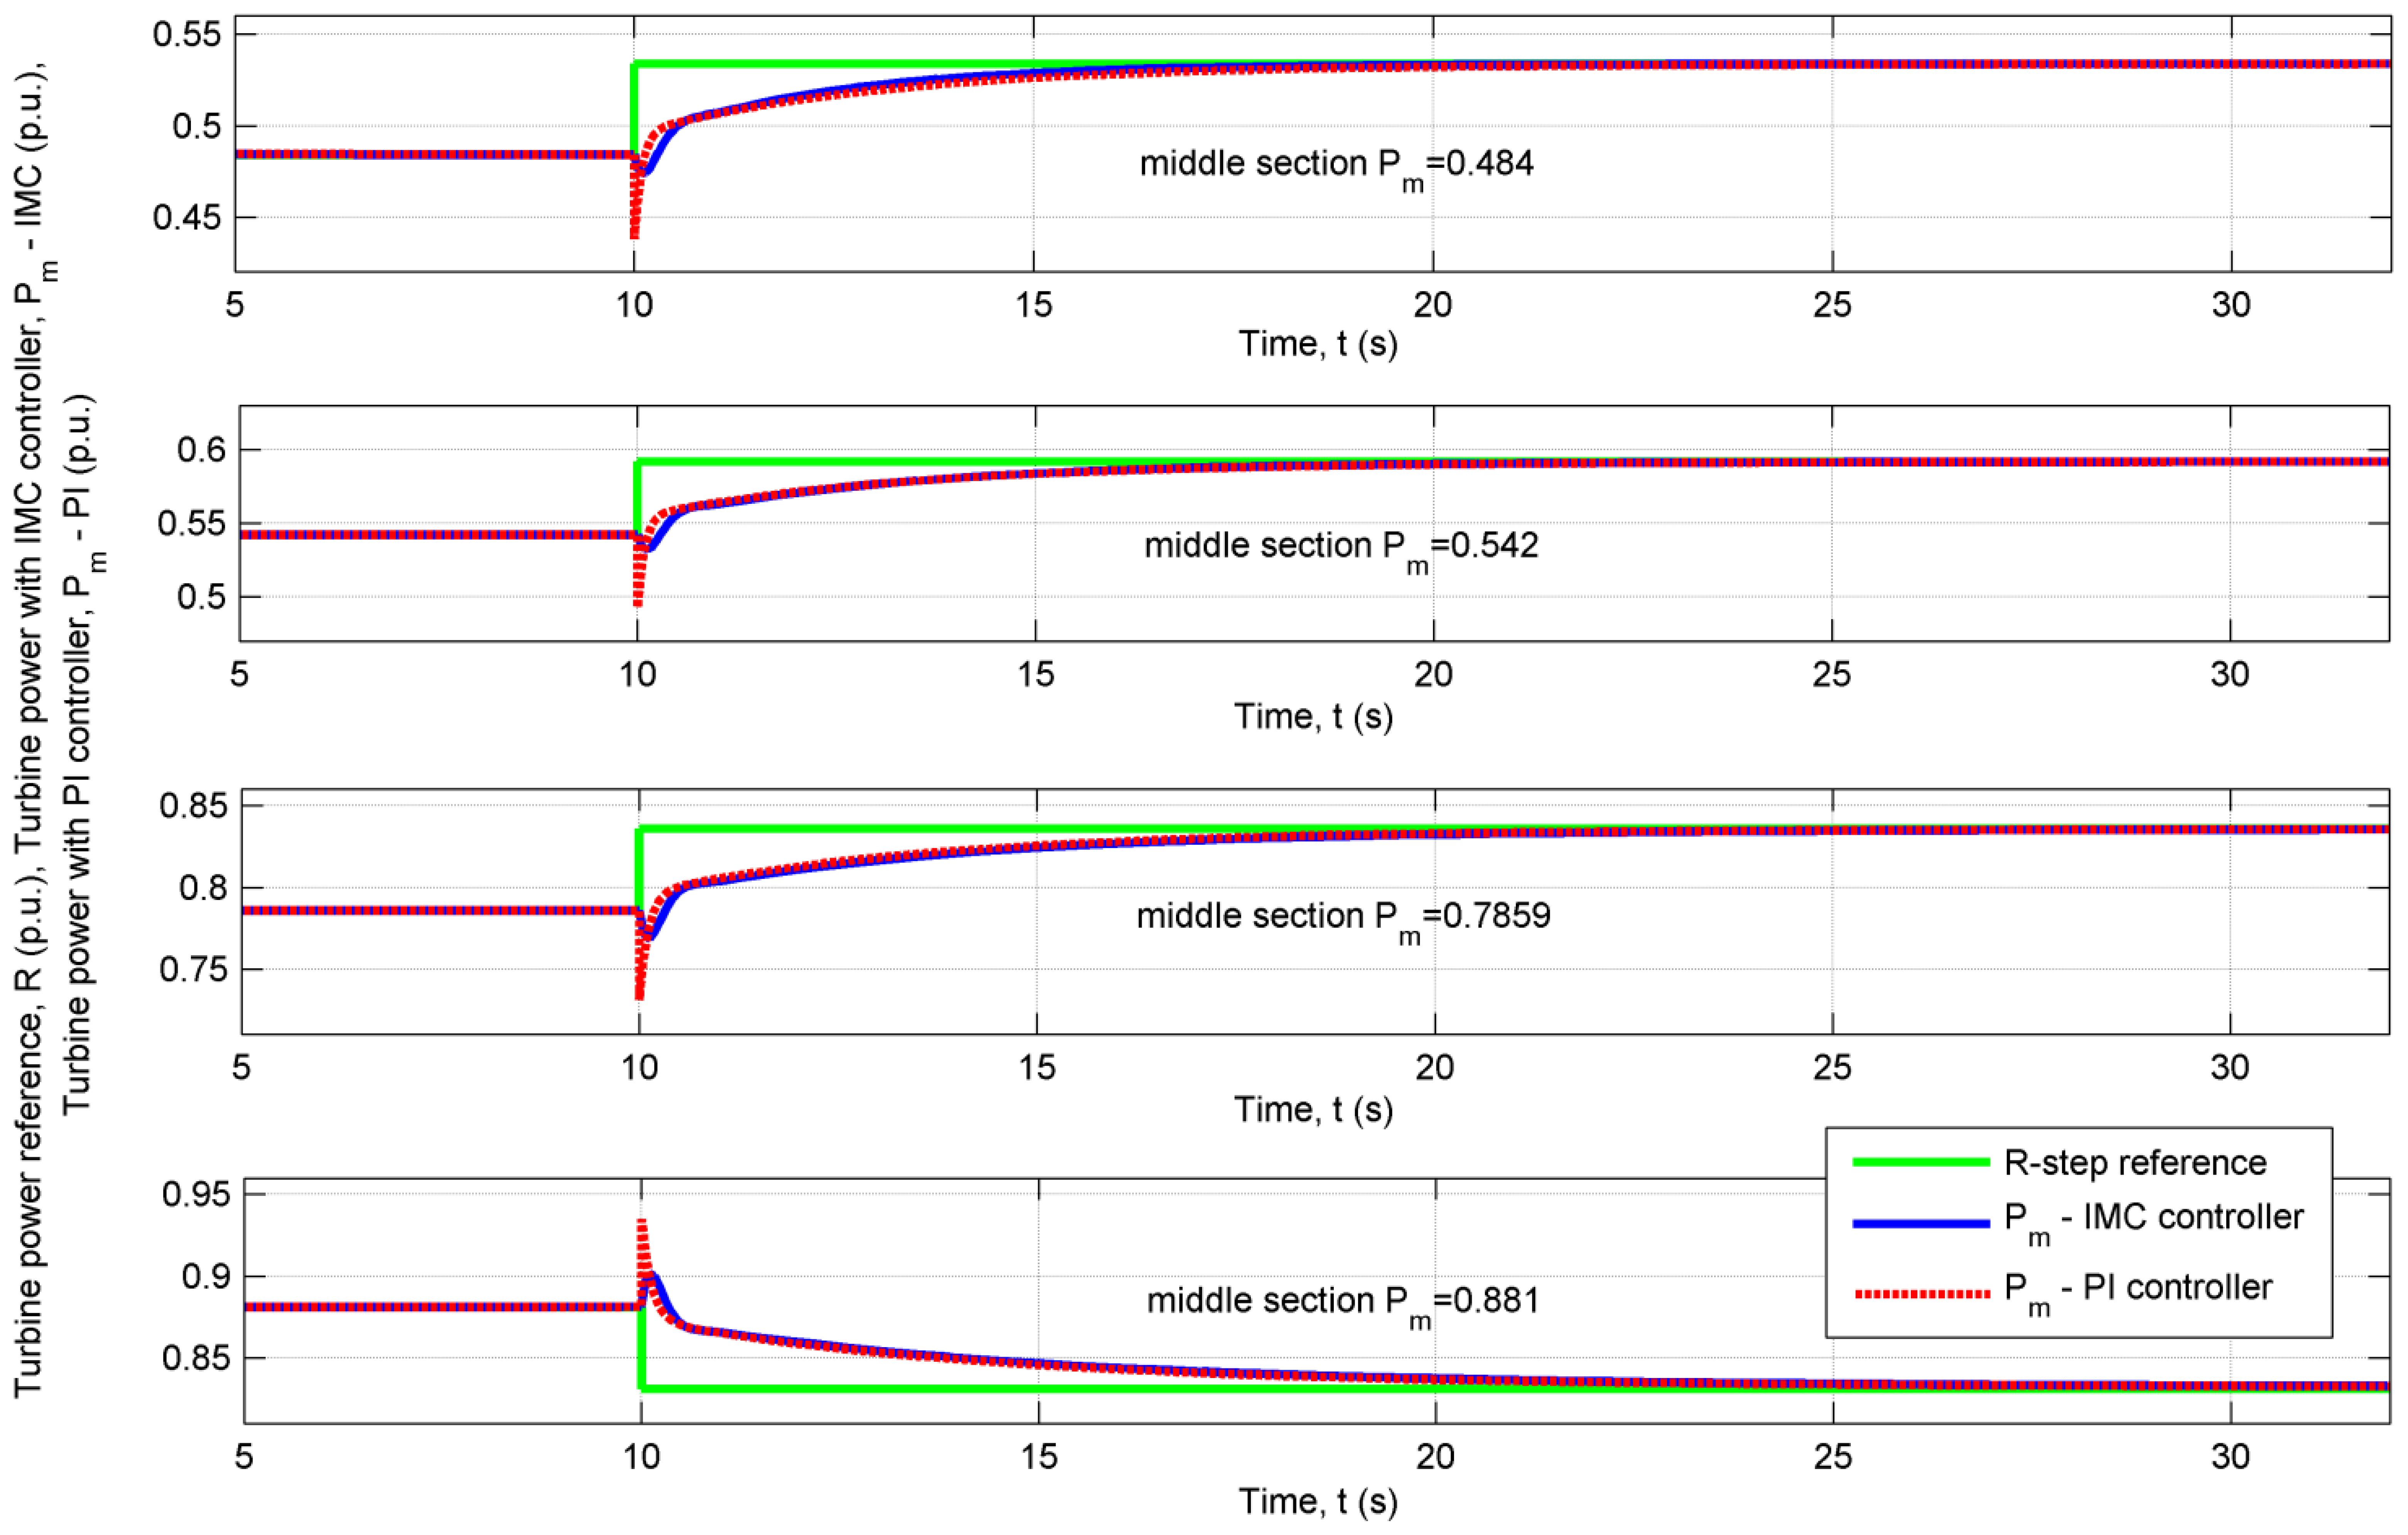
The fuzzy IMC controller in middle section Pm = 0.484 provides 0.200 p.u. undershoot Mp in comparison to 0.915 p.u. with PI controller (Figure 9). Comparison results for the four middle sections of working points are presented in Table 2 (bolded values).
The smallest under-control power effect with 0.200 p.u. undershoot is obtained with IMC in Pm = 0.484 (Table 3); however, the highest under-control effect 1.088 p.u. is observed at Pm = 0.7859 with PI controller. Turbine head drop Δh has the smallest value 0.020 p.u. with the IMC controller in Pm = 0.881; and the highest value 0.086 p.u. with the PI controller in Pm = 0.484 middle section.
In comparison to the PI controller, fuzzy IMC presents better results, with lower undershoots Mp in all four middle sections and with approximately the same settle time on the step reference of turbine power Pm.
Fuzzy IMC also provides smaller variations of head Δh at turbine admission, which ensures fewer oscillations of the HPP water system.
5. Conclusions
In this paper, the dynamic modelling of a Francis turbine 1 (HPP Moste) with and without a surge tank with linearisation and IMC power control was proposed. With the actual HPP technical data (water tunnels and conduits), the presented models show a good match to the real data measurement.
With linearisation, a first-order transfer function with non-minimal phase was used for fuzzy modelling. Concerning appropriately defined input and output membership functions, a fuzzy rule list and the defuzzification process (centroid method), the crisp parameters of the Francis turbine model were calculated.
Based on the fuzzy model, a fuzzy IMC controller was proposed with calculation of tuning parameter T, depending on turbine power. For IMC validation, the PI controller with IAE objective function and fuzzy inference system (similar to IMC) was proposed. A comparison of the fuzzy IMC and PI control with maximum undershoot Mp and head variations Δh criterion in the middle sections of working points shows that IMC has better results due to the smaller undershoot on step response, smaller head variations Δh and easier tuning process (one tuning parameter T) in case of acquired model.
The applied methodology with the extension of working points with different static heads can be used as algorithm in digital turbine governor in order to ensure better results in water turbine power control.
Conflicts of Interest
The authors declare no conflict of interest.
Appendix
A1. Numerator and Denominator Coefficients of Transfer Function Presented in Section 2.3. (24)
A2. Model Parameters

| Parameter | Symbol | Value |
|---|---|---|
| Generator rated power | Pg, r | 9 MVA |
| Maximum turbine rated power | Pm, r | 7.5 MW |
| Rated turbine power | Pr | 6.692 MW |
| Maximum turbine flow | Qmax | 14 m3/s |
| Rated turbine flow | Qr | 13 m3/s |
| No-load flow | qnl | 0.19 p.u. |
| Rated turbine head p.u. | hr | 0.824 p.u. |
| Static head p.u. | h0 | 0.9740 p.u. |
| Static head | hb | 68.62 m |
| Gravity constant | g | 9.80665 m/s2 |
| Water inertia time | Tw1 | 2.2361 s |
| Water inertia time | Tw2 | 0.7267 s |
| Water inertia time | Tw3 | 2.9628 s |
| Surge tank intake loss | f0 | 0.0005 |
| Friction loss penstock | fp1 | 0.0136 |
| Friction loss water tunnel | fp2 | 0.0136 |
| Additional friction loss of the water tunnel | fp3 | 0.01 |
| Additional friction loss of the penstock | fp4 | 0.003 |
| Surge tank parameter | Cs | 225.5150 s |
| Turbine damping | D | 0.5 p.u./p.u. |
| Surge tank upper chamber area | A1_kom | 316.6 m2 |
| Surge tank main chamber area | A2_kom | 44.2 m2 |
| Surge tank bottom chamber area | A3_kom | 276.4 m2 |
References
- De Mello, F.P.; Koessler, R.J.; Agee, J.; Anderson, P.M.; Doudna, J.H.; Fish, J.H., III; Hamm, P.A.L.; Kundur, P.; Lee, D.C.; Rogers, G.J.; et al. Hydraulic turbine and turbine control models for system dynamic studies. IEEE Trans. Power Syst. 1992, 7, 167–179. [Google Scholar]
- De Jaeger, E.; Janssens, N.; Malfliet, B.; van de Meulebroeke, F. Hydro turbine model for system dynamic studies. IEEE Trans. Power Syst. 1994, 9, 1709–1715. [Google Scholar]
- Ng, T.B.; Walker, G.J.; Sargison, J.E. Modelling of Transient Behaviour in a Francis Turbine Power Plant. Proceedings of the 15th Australasian Fluid Mechanics Conference, Sydney, Australia, 13–17 December 2004.
- Fraile-Ardanuy, J.; Wilhelmi, J.R.; Fraile-Mora, J.; Pérez, J.I.; Sarasua, I. A Dynamic Model of Adjustable Speed Hydro Plants. Proceedings of the 9th Congreso Hispano Luso de Ingeniería Eléctrica, Marbella, Spain, 30 June–2 July 2005.
- Hannett, L.N.; Feltes, J.W.; Fardanesh, B. Field tests to validate hydro turbine-governor model structure and parameters. IEEE Trans. Power Syst. 1994, 9, 1744–1751. [Google Scholar]
- Němec, Z.; Němec, V. Water turbine power control feasible conception. Eng. Mech. 2009, 16, 403–411. [Google Scholar]
- Win, T.N. Hydraulic Governor Control System for Francis Turbine. Proceedings of at the GMSARN International Conference on Sustainable Development: Issues and Prospects for the GMS, Kunming, China, 12–14 November 2008.
- Chen, D.; Ding, C.; Ma, X.; Yuan, P.; Ba, D. Nonlinear dynamical analysis of hydro-turbine governing system with a surge tank. Appl. Math. Model. 2013, 37, 7611–7623. [Google Scholar]
- Li, W.; Vanfretti, L.; Chompoobutrgool, Y. Development and implementation of hydro turbine and governor models in a free and open source software package. Simul. Model. Pract. Theory 2012, 24, 84–102. [Google Scholar]
- International Electrotechnical Committee (IEC). IEC 60308: Hydraulic Turbines—Testing of Control Systems, 2nd ed.; IEC: Geneva, Switzerland, 2005. [Google Scholar]
- International Electrotechnical Committee (IEC). IEC 61362: Guide to Specification of Hydraulic Turbine Control Systems, 1st ed.; IEC: Geneva, Switzerland, 1998. [Google Scholar]
- Mahmoud, M.; Dutton, K.; Denman, M. Design and simulation of a nonlinear fuzzy controller for a hydropower plant. Electr. Power Syst. Res. 2005, 73, 87–99. [Google Scholar]
- Tan, W. Unified tuning of PID load frequency controller for power systems via IMC. IEEE Trans. Power Syst. 2010, 25, 341–350. [Google Scholar]
- Chen, Z.; Yuan, X.; Tian, H.; Ji, B. Improved gravitational search algorithm for parameter identification of water turbine regulation system. Energy Convers. Manag. 2014, 78, 306–315. [Google Scholar]
- Fang, H.; Chen, L.; Shen, Z. Application of an improved PSO algorithm to optimal tuning of PID gains for water turbine governor. Energy Convers. Manag. 2011, 52, 1763–1770. [Google Scholar]
- Naik, K.A.; Srikanth, P.; Negi, P. IMC tuned PID governor controller for hydro power plant with water hammer effect. Procedia Technol. 2012, 4, 845–853. [Google Scholar]
- Hušek, P. PID controller design for hydraulic turbine based on sensitivity margin specifications. Int. J. Electr. Power Syst. 2014, 55, 460–466. [Google Scholar]
- Giesecke, J.; Mosonyi, E. Wasserkraftanlagen: Planung, Bau und Betrieb, 2nd ed.; Springer: Berlin, Germany, 1998; pp. 293–305. [Google Scholar]
- Mosonyi, E. Water Power Development: High-Head Power Plants, 3rd ed.; Akadémiai Kiadó: Budapest, Hungary, 1991; Volume 2/B, pp. 975–985. [Google Scholar]
- Ross, T.J. Fuzzy Logic with Engineering Applications, 2nd ed.; John Wiley & Sons: Chichester, UK, 2004; p. 101. [Google Scholar]


| Turbine power | K | T1 | T2 |
|---|---|---|---|
| Pm = 0.34081 | 1.3583 | 0.7610 | 0.6614 |
| Pm = 0.484 | 1.3565 | 0.8922 | 0.7150 |
| Pm = 0.542 | 1.3935 | 1.2863 | 0.9139 |
| Pm = 0.6657 | 1.4470 | 1.3918 | 0.9506 |
| Pm = 0.7859 | 1.3537 | 1.6694 | 1.0515 |
| Pm = 0.881 | 1.2929 | 2.0928 | 1.2593 |
| Pm = 0.9684 | 1.2671 | 2.3073 | 1.3348 |
| Turbine power | T (IMC) | KP (PI) | KI (PI) |
|---|---|---|---|
| Pm = 0.34081 | 0.3000 | 0.2983 | 0.3154 |
| Pm = 0.484 | 0.2786 | 0.2912 | 0.3016 |
| Pm = 0.542 | 0.2178 | 0.2709 | 0.2594 |
| Pm = 0.6657 | 0.2000 | 0.2764 | 0.2437 |
| Pm = 0.7859 | 0.1671 | 0.2520 | 0.2318 |
| Pm = 0.881 | 0.1064 | 0.2329 | 0.1932 |
| Pm = 0.9684 | 0.0800 | 0.2225 | 0.1759 |
| Comparison IMC/PI control | Pm = 0.484 | Pm = 0.542 | Pm = 0.7859 | Pm = 0.881 |
|---|---|---|---|---|
| Mp IMC (p.u.) | 0.200 | 0.202 | 0.340 | 0.410 |
| Mp PI (p.u.) | 0.915 | 0.990 | 1.088 | 1.076 |
| Δh IMC (p.u.) | 0.027 | 0.022 | 0.022 | 0.020 |
| Δh PI (p.u.) | 0.086 | 0.083 | 0.061 | 0.050 |
© 2014 by the authors; licensee MDPI, Basel, Switzerland. This article is an open access article distributed under the terms and conditions of the Creative Commons Attribution license ( http://creativecommons.org/licenses/by/3.0/).
Share and Cite
Nagode, K.; Škrjanc, I. Modelling and Internal Fuzzy Model Power Control of a Francis Water Turbine. Energies 2014, 7, 874-889. https://doi.org/10.3390/en7020874
Nagode K, Škrjanc I. Modelling and Internal Fuzzy Model Power Control of a Francis Water Turbine. Energies. 2014; 7(2):874-889. https://doi.org/10.3390/en7020874
Chicago/Turabian StyleNagode, Klemen, and Igor Škrjanc. 2014. "Modelling and Internal Fuzzy Model Power Control of a Francis Water Turbine" Energies 7, no. 2: 874-889. https://doi.org/10.3390/en7020874