Planning Minimum Interurban Fast Charging Infrastructure for Electric Vehicles: Methodology and Application to Spain

Abstract
: The goal of the research is to assess the minimum requirement of fast charging infrastructure to allow country-wide interurban electric vehicle (EV) mobility. Charging times comparable to fueling times in conventional internal combustion vehicles are nowadays feasible, given the current availability of fast charging technologies. The main contribution of this paper is the analysis of the planning method and the investment requirements for the necessary infrastructure, including the definition of the Maximum Distance between Fast Charge (MDFC) and the Basic Highway Charging Infrastructure (BHCI) concepts. According to the calculations, distance between stations will be region-dependent, influenced primarily by weather conditions. The study considers that the initial investment should be sufficient to promote the EV adoption, proposing an initial state-financed public infrastructure and, once the adoption rate for EVs increases, additional infrastructure will be likely developed through private investment. The Spanish network of state highways is used as a case study to demonstrate the methodology and calculate the investment required. Further, the results are discussed and quantitatively compared to other incentives and policies supporting EV technology adoption in the light-vehicle sector.1. Introduction
Road transport is one of the main contributors to CO2 emissions and other pollutants; hence, reducing the use of fossil fuels is a major sustainability objective for the European Union (EU) [1]. The shift to EV technology represents an opportunity for sustainable transport to achieve the EU goals, due to higher energy efficiency and renewable energy content. Still some drawbacks hinder this transition, such as charging limitations and the so-called “range anxiety”.
Range anxiety can be defined as the fear of not being able to reach a charging point for an EV. In this regard, the lack of available fast charging (level III, direct current (DC) or alternate current (AC) charge) stations, along highways, influences the use of electric vehicles (EVs), up to now restricted mainly to in-city mobility. However, fast charging technology together with battery swapping, already available on the market, allow EV interurban mobility with charging times comparable to refueling times for internal combustion vehicles. Additionally, although range anxiety may have other psychological reasons [2], the availability of fast chargers or battery exchange for interurban mobility is essential to prevent the appearance of this fear, since slow charging would extend the travel times beyond what is acceptable for any user, spending more time in the charging station than in the travel itself. Thus, according to the technology currently available, fast charging allows 15–20 min recharge for approximately 200 km range, while slow charging at 3 kW, would approximately take 3 h for 100 km range. Hence, with fast charging, a 500 km trip could imply two charging stops of 15–20 min each, compared to internal combustion vehicle only stopping once for 10 min.
Slow charging can be done by using conventional electric sockets, therefore, to a large extent, the availability of a basic charging infrastructure already exists. However, the power requirements could imply necessary adaptation of existing low voltage infrastructure. The use of specific charging connectors, additionally, makes it necessary to adapt the normal sockets/plugs for EV charging. Furthermore, in order to complement the in-house charging points, public charging stations and parking charging points would have to be increased [3].
On the other hand, little investment on the necessary charging infrastructure has been detected in the private sector; this fact seems to be due to the difficulty of estimating the rate of EV adoption and its subsequent demand growth. Nevertheless, the EV sales are also influenced by the availability of charging infrastructures, since the development of these facilities accelerates the EV adoption [4]. Thus, the dilemma of charging infrastructure versus EV, in terms of what to promote first, is part of a wider technological controversy [5,6], with social and cultural implications [7].
Experience with the operation of EVs has been analyzed in various studies as it is the case of the German households [8], concluding that normal commute range does not require other than private home slow charging devices, although the development of fast charging points would increase the use of EVs, also affecting their usage patterns. Additionally, research conducted by the Tokyo Electric Power Company in Tokyo, Japan 2007–2008 [9] has revealed an increase in the distance driven by EV users if fast chargers were available. It has been also argued that public fast charging infrastructure had a usage encouragement effect in the early stages of EV deployment [10].
Regarding economics of EV charging, Schroeder and Traber [11] concluded that fast charging is unlikely to be profitable without an increased EV adoption, and that the main risks for the investment on fast charging infrastructures were the EV adoption rates, local use rates, and competition between public and private charging devices. The results of the research suggest that initial high risk investment for public fast chargers could be incentivized or directly state owned. Additionally, in the case of interurban, highway fast chargers, the competition between private and public chargers is not present, therefore, the key to profitability will be the EV adoption rates and the usage patterns for interurban mobility.
Policy support is analyzed in depth in the specialized literature [12], as it is the case of the assessment of the public support for electric mobility in Japan. The relevance of standards has been highlighted for infrastructure deployment in the US [13], whereas San Román et al. [14] frame the regulatory and associated business models for stakeholders involved in the electric mobility sector. Developments in batteries, carbon reduction policy, new business propositions and image of EVs, have been also identified as a pathway to vehicle electrification [6]. Other policy implications, in regard to electric mobility, such as the effects on energy market and emissions, have been considered for the case of Portugal [15,16]. Likewise, relevant research output exists on the synergies among EV charging, renewable energy integration and power system management [17–19].
Although the planning of the EV charging point infrastructure has not received much attention in practice, relevant studies have been performed in this field. For instance, in order to plan strategic public charging stations, an agent based tool built on user patterns was developed [20]. While focused on city mobility, Liu [3] established a charging infrastructure for fast and slow charging stations, for the city of Beijing. Another perspective, simulating planned charging posts versus free entry, has been researched for the city of Barcelona [21]. Results showed planned charging stations equilibrium difficult sound finance and may discourage necessary infrastructure. The proposal of this paper is to obtain an optimum minimization of the EV charging infrastructure in the planning period sufficient to accelerate the subsequent free entry by private investors.
Optimal placement of charging stations has already been considered with multivariable optimization methods, to minimize the total travelled distance between centralized charging stations. Recent models focus on large-scale integration, with distances between charging stations, below 30 km [22].
A direct reference to the distance between fast charging in highways is found in the report by Zero Emission Resource Organization (ZERO) [23] on Norway's EV infrastructure; “would probably have to be available every 40–60 km for maximum effect”, were factors influencing range are also detailed. This paper scrutinizes the statement.
In summary, previous literature has not resolved the definition or methodology to calculate minimum highway fast charge infrastructure, although real countrywide decisions have been initiated to build this kind of infrastructure around the world. The work presented here focuses on the deployment of highway fast charging, by examining in detail the distance between stations, and proposes a methodology for planning infrastructure deployment. The study has focused on passenger vehicles, as we consider sufficient availability of models, and taking into account public transportation high-load models are currently not suitable for the interurban transportation, due to the weight and range capability. However, the considered fast-charging stations are valid for any vehicle complying with the charging standards.
Although the issues related with battery performance, life-cycling, as analyzed in other research, or the grid implications and grid services of fast charging are not considered here in-depth [24,25], it is interesting to mention that there are potential services to be offered also by fast charging points, such as power quality services only discharging slightly the battery [26]. Other services and applications, as highlighted in the available research, may not be feasible for highway fast charging, due to the need of the user to charge as fast as possible and continue the highway trip [25], unless the charging stations are paired with energy storage.
The article is divided in five sections. The introduction is followed by the methodology description, the Minimum Distance between Fast Charging and the Basic Highway Charging Infrastructure (BHCI), the latter includes the case study of Spain. The article closes with a conclusion, including policy recommendations.
2. Methodology
The goal of the research is to assess the minimum requirement of fast charging infrastructure to allow country-wide highway EV mobility. In-city mobility is already possible given home charging possibilities, but country-wide mobility would need a minimum infrastructure of fast charging posts to further promote the use of EVs for longer journeys.
The basic figure for the infrastructure planning is defined as the Maximum Distance between Fast Charge (MDFC), and is the number of km between fast charging stations that would allow every EV to reach the station, including a margin of security. This concept, developed as part of the research, is considered essential to plan interurban EV infrastructure. The calculation of the distance between two consecutive fast charges along the highway infrastructure has been identified as a priority for the infrastructure, since this value makes the optimal position of the charging stations easily locatable. Additionally, compared to other methods focusing on the number of charging stations per vehicle, calculating the distance with the proposed method is more practical, as it better enables the location of the charging stations, as well as the calculation of the necessary investment.
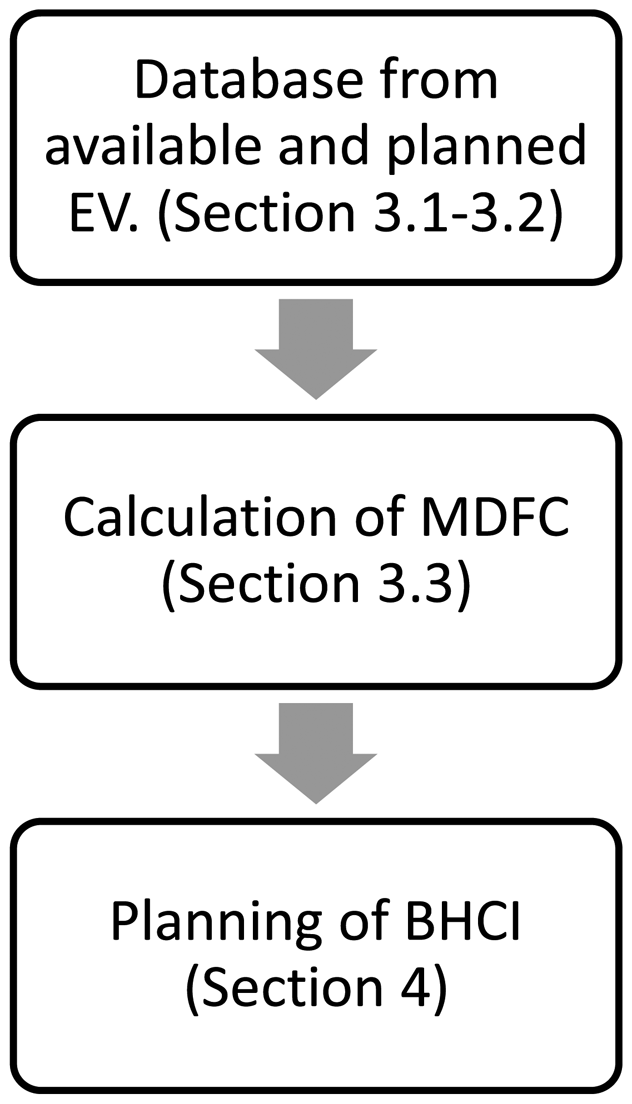
To analyze range and range evolution, the available EVs in the market are selected discarding city vehicles with short ranges or vehicles with no fast charging capability. As the infrastructure deployment may take several years, the distances and infrastructure method takes into account progressive range extension evolution or is calculated based on the minimum range in the target vehicle category. Complementary info for the MDFC calculation is the weather conditions and flexibility margins, both factors considered country specific and explained in Section 3. The strategic location of charging posts utilizes the maximum distance value and the main highway infrastructure, complemented with the most transited areas. The method is presented as the assessment of a BHCI defined as the minimum charging points needed in a country's highways to allow the country-wide transportation with any single EV. The process followed is simplified in Figure 1.
3. MDFC
3.1. Input Data
The main input data for calculating the MDFC, consists of the information obtained from EV manufacturers. The available and planned EV models, provided with fast charging capability, are show in Table 1. Any of these vehicles could be used for transportation distances above their range, given the availability of fast charging stations along the route.
Other variables influencing the calculation of the MDFC are the weather conditions, the road and traffic status, and the driving and driving and charging behavioural patterns in the selected area. The MDFC will be therefore territory dependent, as variables mentioned as inputs vary with the region or area conditions where the distance is to be calculated.
3.2. Classification
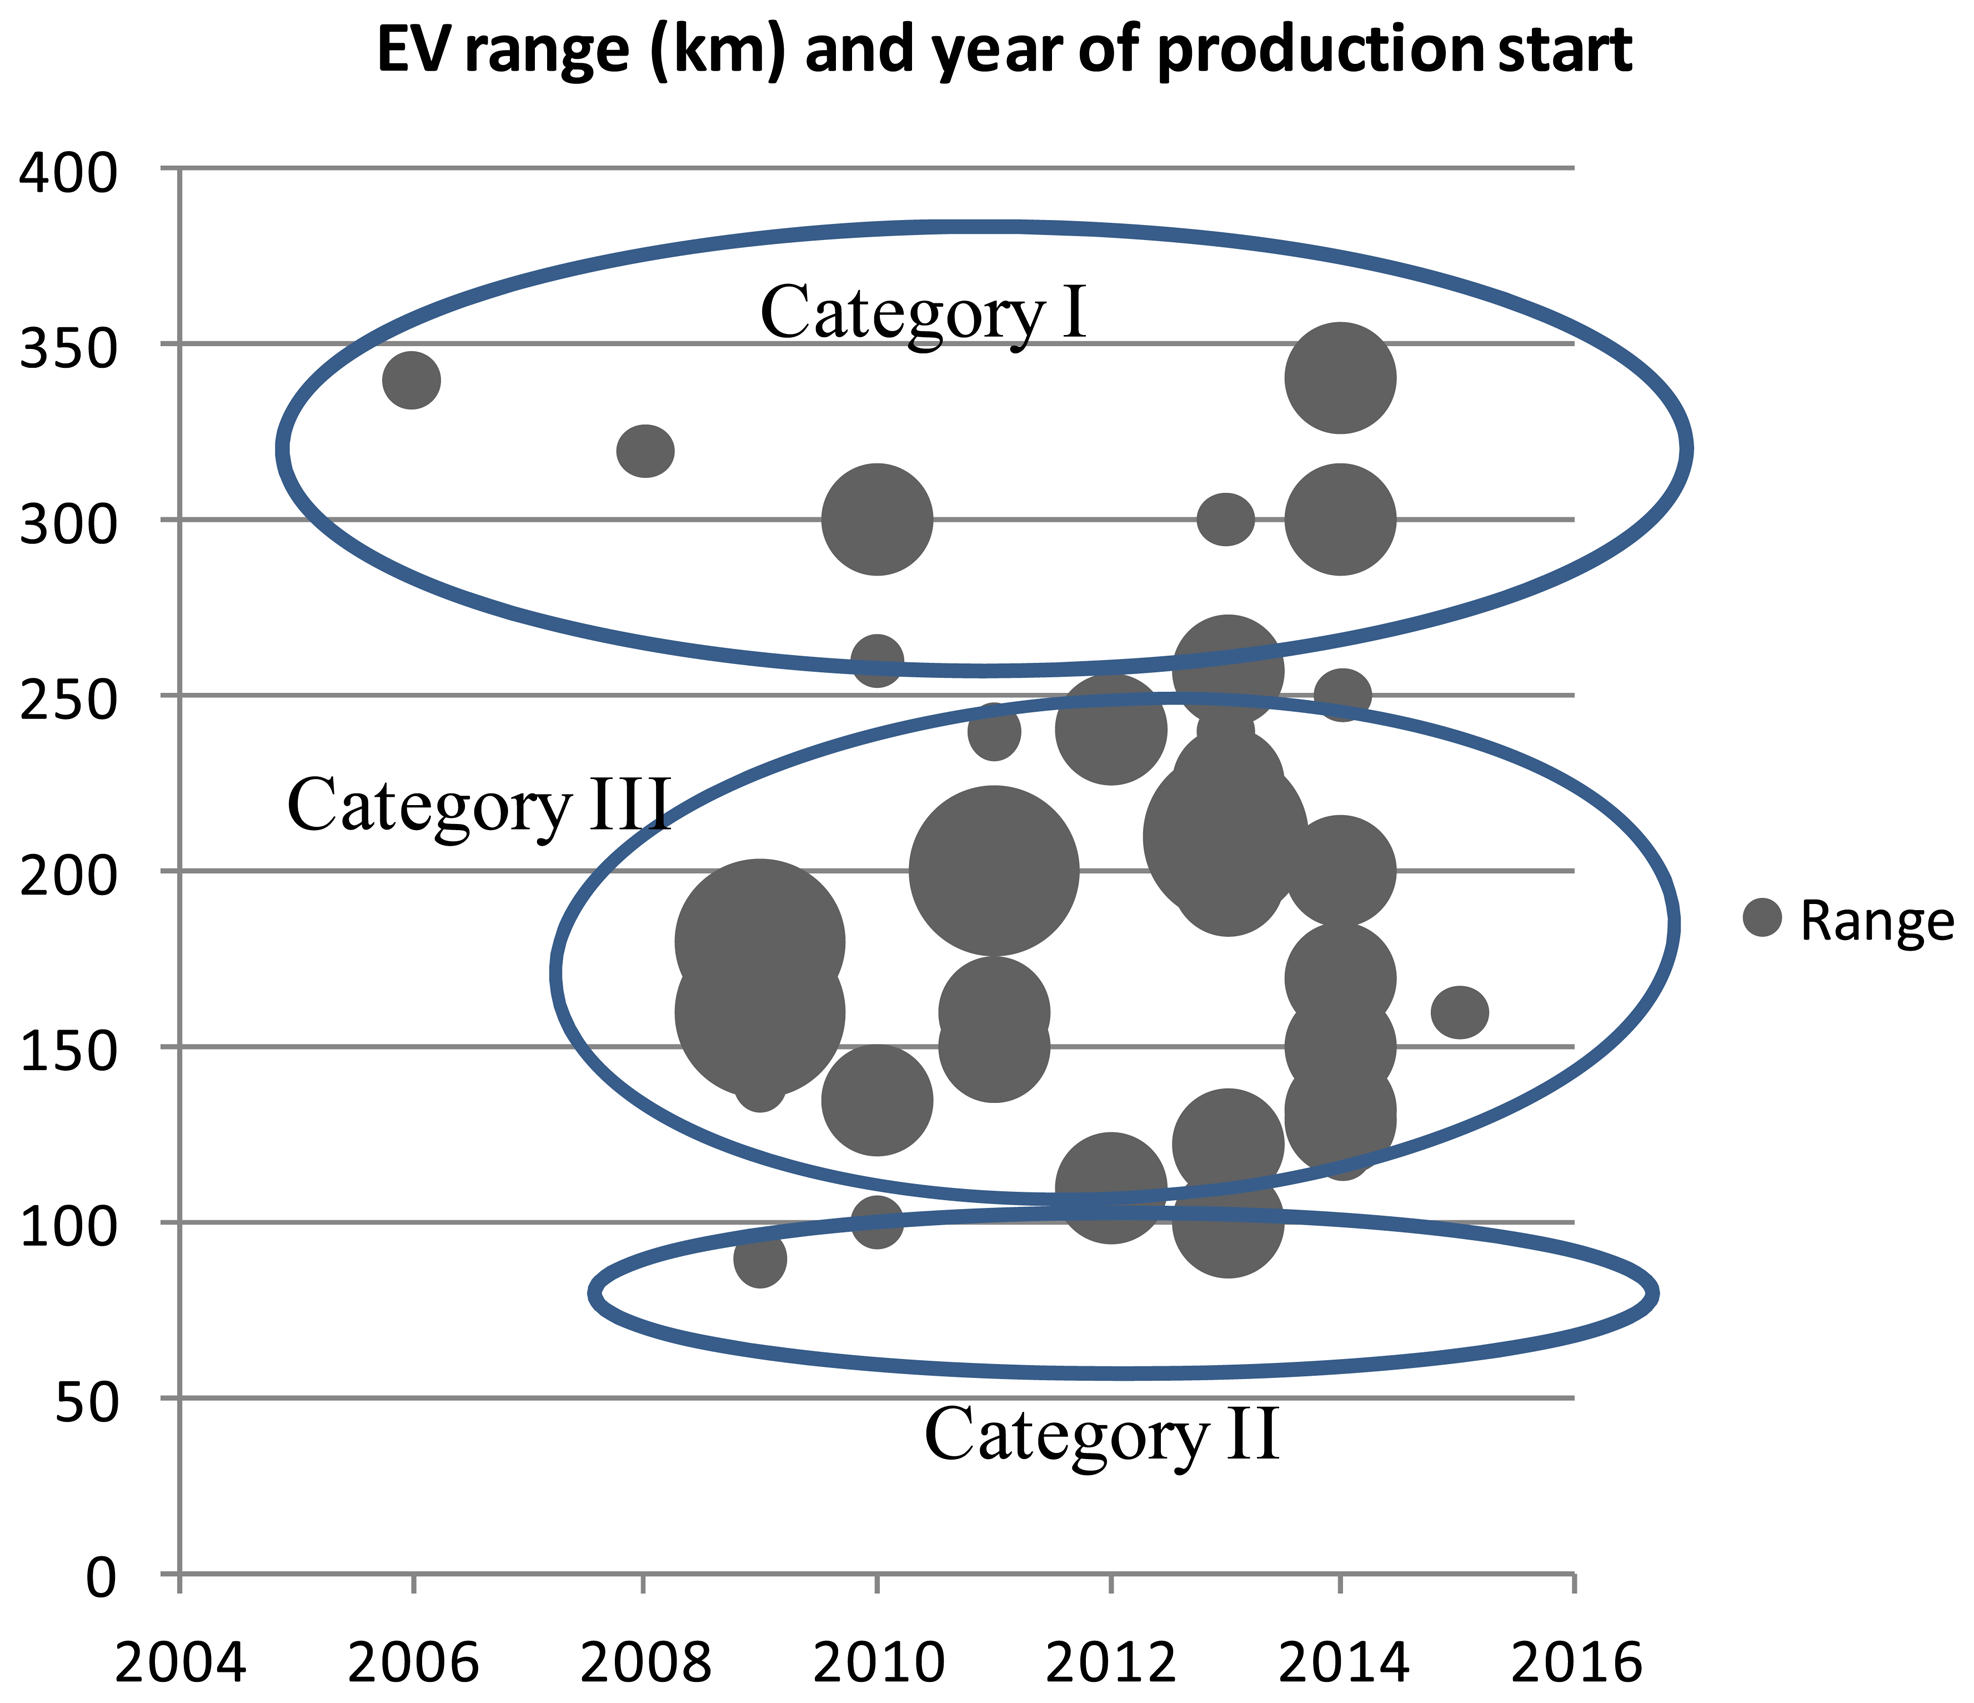
In order to simplify the modeling, focusing on the relevant vehicles, we can classify the available EVs in three categories. First, the high-range category I comprises exclusive models with limited serial production and range equal or above 300 km. Second, the fast charge enabled city cars belong to Category II, which have a range of 100 km or less, and although capable of long interurban routes, will probably not be used for journeys involving more than two charging stops (<300 km). Third and last, the main group of EV models takes part of Category III, with the highest serial produced units and user adoption.
Figure 2 shows the different categories proposed, where the size of the circles represents the manufacturing scale of the models. The analysis of the MDFC will be calculated from the Category III models, the most serial-produced, highway and fast charge enabled vehicles.
3.3. MDFC and Range Trend
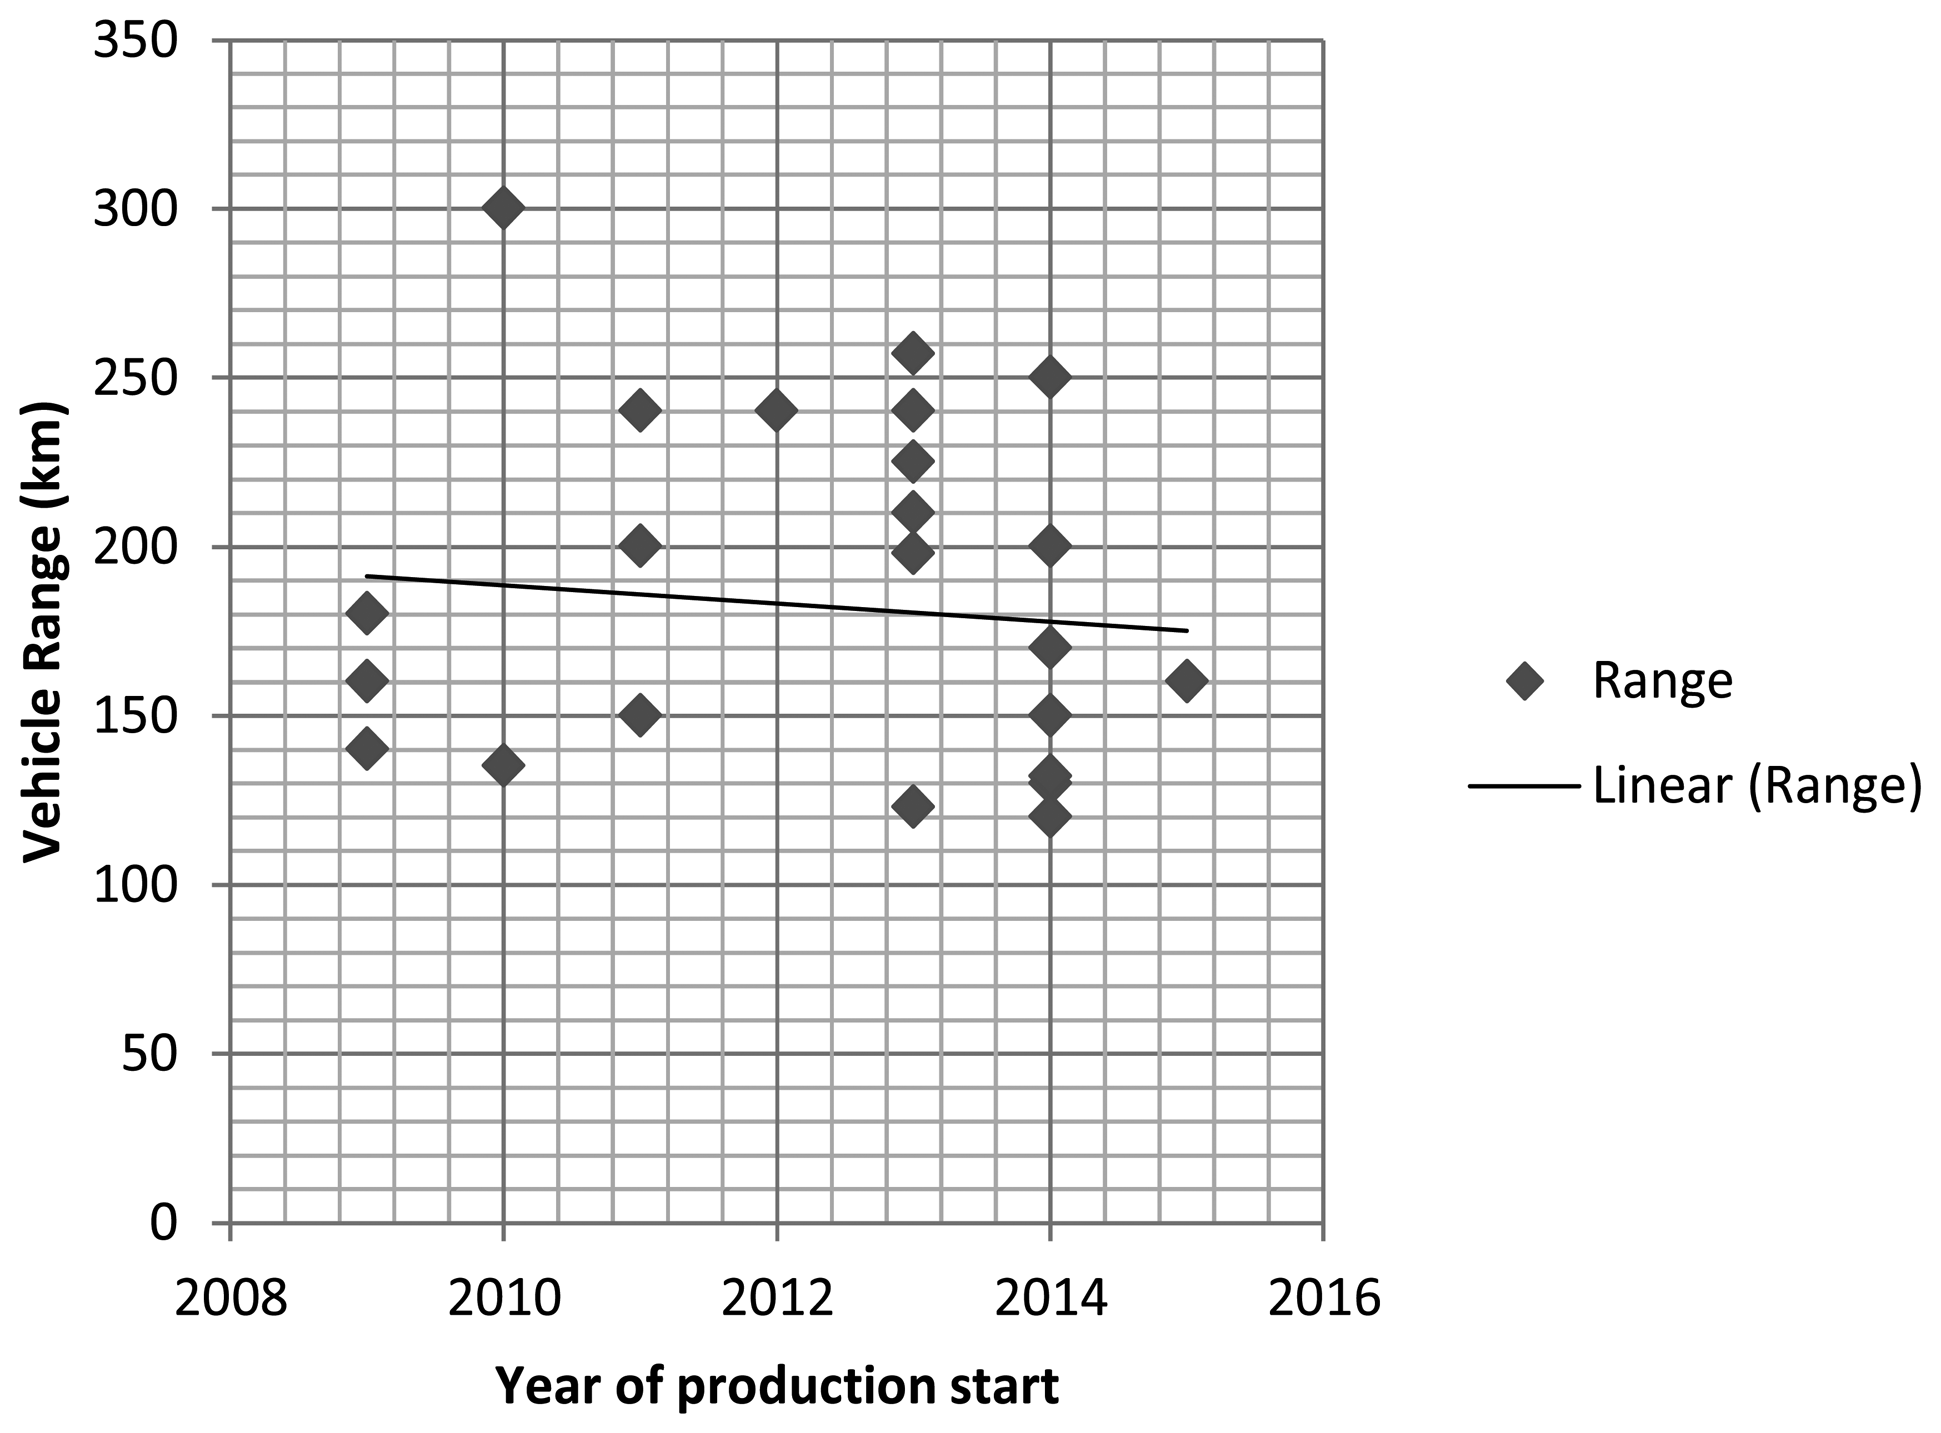
Given the selected categories, the evolution of the minimum range and the mean range can be analyzed. As it has been proposed, MDFC is based on the Category III vehicles, where the shortest range in the category is 123 km and the average is 182 km. The analysis of the category evolution shows the mean range has not grown with time, as models planned for 2014 have ranges closer to 150 km rather than 200 km. Additionally, Figure 3 represents the linear trend in range for the vehicles included in Category III, according to manufacturer's production plans for 2014 and 2016. This trend is represented to show the available range for the existing models. As it can be seen in the graphic, range has not been increased in most recent EV models; conversely, its average value has slightly decreased along the last years, although still remaining in the range of 150–200 km. Battery cost reductions or breakthrough innovations are possible factors that might increase the commercially available range in future EV vehicles in the following years, but unless the vehicles are used for interurban transportation, there is no practical sense in increasing the capacity, other than the use of the battery as energy storage for other uses.
The calculation can be factored by the number of existing Category III EV, in order to calculate the average range of the vehicles actually in use. Based on the accumulated sold units (estimate values are included in Table 2) the average range of EVs with fast charge, estimated operational, is 200.2 km.
Although the average range of the Category III vehicles is 182 km, if only most sold vehicles are considered it would be higher (200 km), in order to calculate the MDFC, a conservative approach should allow every model to have a range above the MDFC. By contrast, a method inducing the least infrastructure investment would consider the average. The vehicle that sets the minimum range in the category at the point of the research is the Chevrolet Spark, with a 132 km range. Battery capacity losses on the EV fleet on the roads would be also a limiting factor to increase the MDFC, even if the average range were increased. In order to calculate the MDFC considering a safety margin, both for weather and for other motives, including road and traffic conditions, we propose the calculation formula as in Equation (1):
Weather conditions, both cold (increased vehicle drag/resistance, battery performance and the use of heating) and hot (primarily air conditioning), affect EV performance. Although further operational data will be required to model the range influence, current simulations show that air conditioning/heating is the single largest auxiliary load on any vehicle by an order of magnitude [28]; the worst case simulation resulted in range reduction of 40%. The paper presented solutions for reducing these auxiliaries, by means of advanced glazing and ventilation. Other research, found weather conditions not only affect battery performance, but also choice of transportation, supporting the idea of simultaneity factor for calculating MDFC [29]. Real operational fleet performance data could be retrieved from Fleetcarma [30], with ranges been reduced up to 40% (at −7 °C), and not reaching 40 km in lowest temperatures (−20 °C), also influenced mainly by the cabin heating use but also the acceleration patterns. For example, fleet supervision data shows examples that smooth driving and an unheated cabin provided 2.4 times the range compared with aggressive driving and a heated cabin. With hot temperatures, range is also reduced due to air conditioning use, but the component efficiency is not as much influenced negatively as in cold temperatures. Testing of the MiEV EV [31] showed the maximum range reduction was 46% for maximum air conditioning and 68% for maximum heating. It is relevant to highlight that conventional heaters have a coefficient of performance (COP) of 1, but using heat pumps would reduce the burden on the efficiency, also reducing the effect of the heating load on the range decrease. We propose the values for Mw summarized in Table 3, based on the current findings, for the purpose of the research. Thus, we have selected the 40% reduction when winter temperatures are frequently below 0 °C and 50% reduction when temperatures are below −10 °C, following the results from the literatures [28,30]. Although the research [31] mentioned previously found higher values (68%), this value has been considered an extreme value when heating was used constantly at maximum. Concerning the air conditioning, the maximum has been selected as 30% for the hottest climates, following the values from the mentioned experiments and experience, but lower to the maximum found (46%), where air conditioning was used at maximum constantly. Additionally, improvements in the battery and power train efficiency with temperature protection, as well as vehicle glazing, ventilation and comfort are expected, meaning the weather margin would have to be reviewed and updated.
In order to consider the driving conditions during the whole year, both the heating and the air conditioning requirements have to be taken into account. Hence, the worst case scenario would be a region where there are extreme cold temperatures in winter and high temperatures in summer, which affects the range (implying a 50% weather margin) and also the battery life cycle.
The flexibility margin has to include the road and traffic conditions, the driving style and charging patterns. Another input in the margin is the highway influence, as EVs official range (for example, US Environmental Protection Agency (EPA) or New European Driving Cycle (NEDC) is higher than range for full highway trips. Highway range will be lower than the mentioned official cycles because of the speed. Mf will therefore need to be at least the range reduction due to highway speed. Supported by the manufacturer's highway range data on ideal conditions, highway speed of 89 km/h will imply less than a 10% range decrease, but 105 km/h reduces the range approximately 20%. The flexibility margin is set here to be 80% to account for this reduction, and could be increased by road, traffic, driving style and charging patterns. In order for the infrastructure to be of use for at least 10 years of life-time, possible increases in speed limits could also be considered. Table 4 summarizes the estimation for these factors.
The simultaneity factor “k”, considers the coincidence of weather conditions and flexibility margin. If behavioural factors defer EV driving when weather conditions are cold or most highway trips are when weather conditions are more appropriate (for example city to coast trips in summer), the simultaneity factor will have a reduced value. Suggested value, when weather margin is not necessary (null or 10%), then all flexibility has to be taken into account, k is set to 1. With high weather margins, above 40%, simultaneity has to consider that with harsh conditions, the average speed is limited because of user precaution.
Values for the estimated worst case scenario, considering minimum range is 123 km, with 50% weather margin, 120 km/h average highway speed limit by users, aggressive driving patterns, high-traffic, and no full-charging habits, and a simultaneity factor of 1, give a result for the MDFC of 12.3 km. Limit conditions and behaviour, such as these are not reasonable, and would entail a non-efficient infrastructure at present. However, modularity of fast charging stations, that don't require economies of scale as gas stations, allows a more distributed deployment, once the basic infrastructure is met. Accordingly, with widespread adoption of EVs, a MDFC of 12.3 km is not an unreasonable scenario in years to come.
Actual research and real testing data does not allow a more precise calculation of the underlying factors influencing MDFC, so they need to be estimated, and the selection of their values should not be arbitrary. These estimations are based on available research, experimental and real road experiential data. On the other hand, the model doesn't allow obtaining a certain desired value for the MDFC. Besides, additional experimental data is required to base flexibility margin on improved evidence, but this framework for a systematic approach already allows the calculation.
4. BHCI
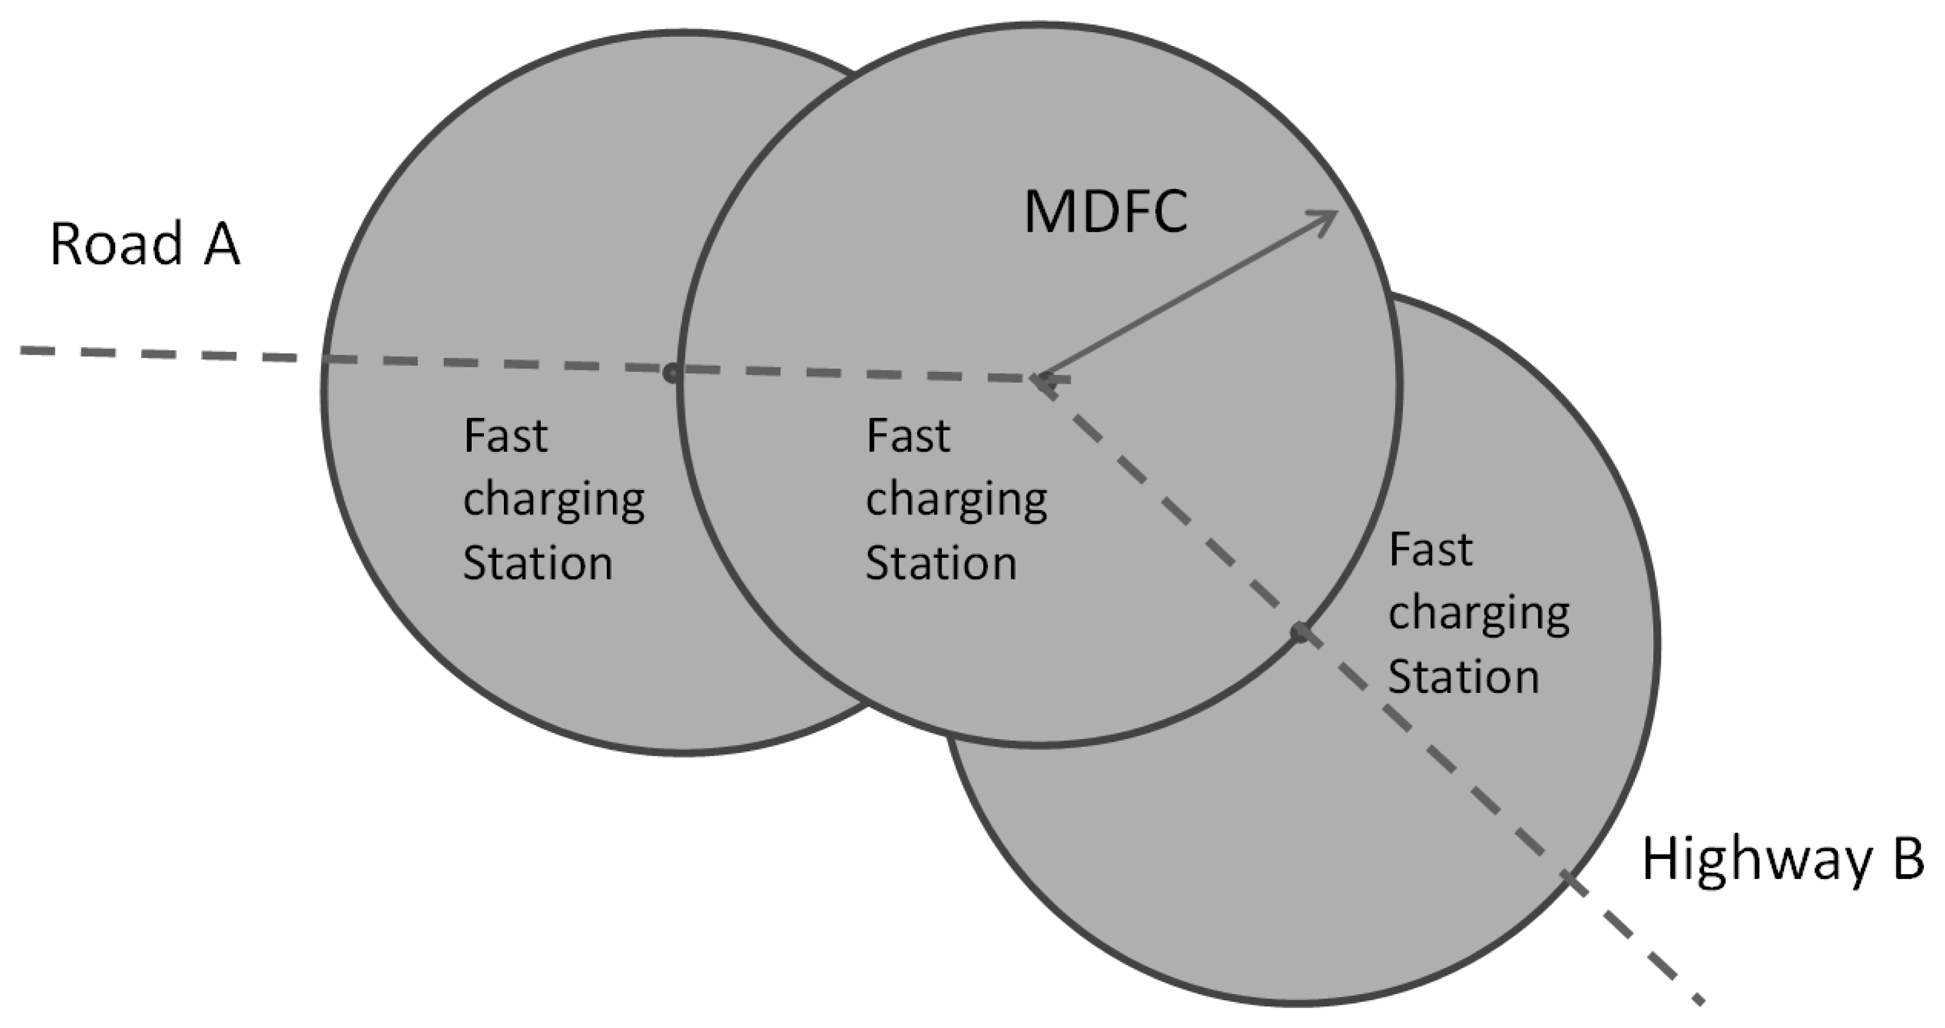
The BHCI is defined as the number of fast charging stations that are necessary for any single EV during its travel through a country from any given location to any other within the country making use of these charging stations. This original concept is proposed and defined, as a planning tool for EV enabling infrastructure. According to the previous explanation, the distance between two consecutive charging stations must be inferior to the MDFC along the existent national road infrastructure. As shown on Figure 4, fast charging stations allow highway range, but also secondary coverage in stations away from the main state highway would be necessary to satisfy the MDFC requirements.
The whole economic investment required for a BHCI to be deployed has to take into account the initial investment, as well as the operation and maintenance costs, during the lifetime of the infrastructure. Return on investment from the charging infrastructure will mainly depend on the facility utilization, as has been already concluded [11].
The investment costs for the infrastructure are simplified in Table 5. Prices will probably decrease with time, associated with technological evolution and economies of scale. Specifically considering a country-wide deployment, the scaling factor reduces the global spending compared to investments for single units. The costs estimated in this work are those considered by Schroeder and Traber [11], since they seem conservative and sufficient for the purpose of this research. However, market price of a fast charging station requested to manufacturers during the research was around 25,000 € for material costs. The current price is 40% lower than the conservative value used in the estimations (only the maintenance for super-fast has been corrected to 10% of material cost). In order to value the investment, it is necessary to consider the operational expenses, but also the operational revenues. Operational revenues depend on the usage of the chargers and the selling price, and would require further estimations for the usage patterns.
Here, the Level III DC, without regard to the charging standard being considered, is the solution chosen for investment calculations. The charging time achieved with this fast charge solution allows 80% battery charging in less than 20 min, so comparable to conventional combustion engine cars.
The cost-benefit analysis for fast charging stations, as mentioned in the introduction, is mainly dependent on the EV adoption rate; however, other factors such as the usage rates have been also identified to influence this analysis [11]. Besides, for the infrastructure as a whole, and disregarding the economic benefits of the fast charging station operator, the added value of the fast charging infrastructure includes the reduction of the polluting emissions coming from the vehicles, the reduction in energy imports and the reduction in transportation costs for the users of the vehicles.
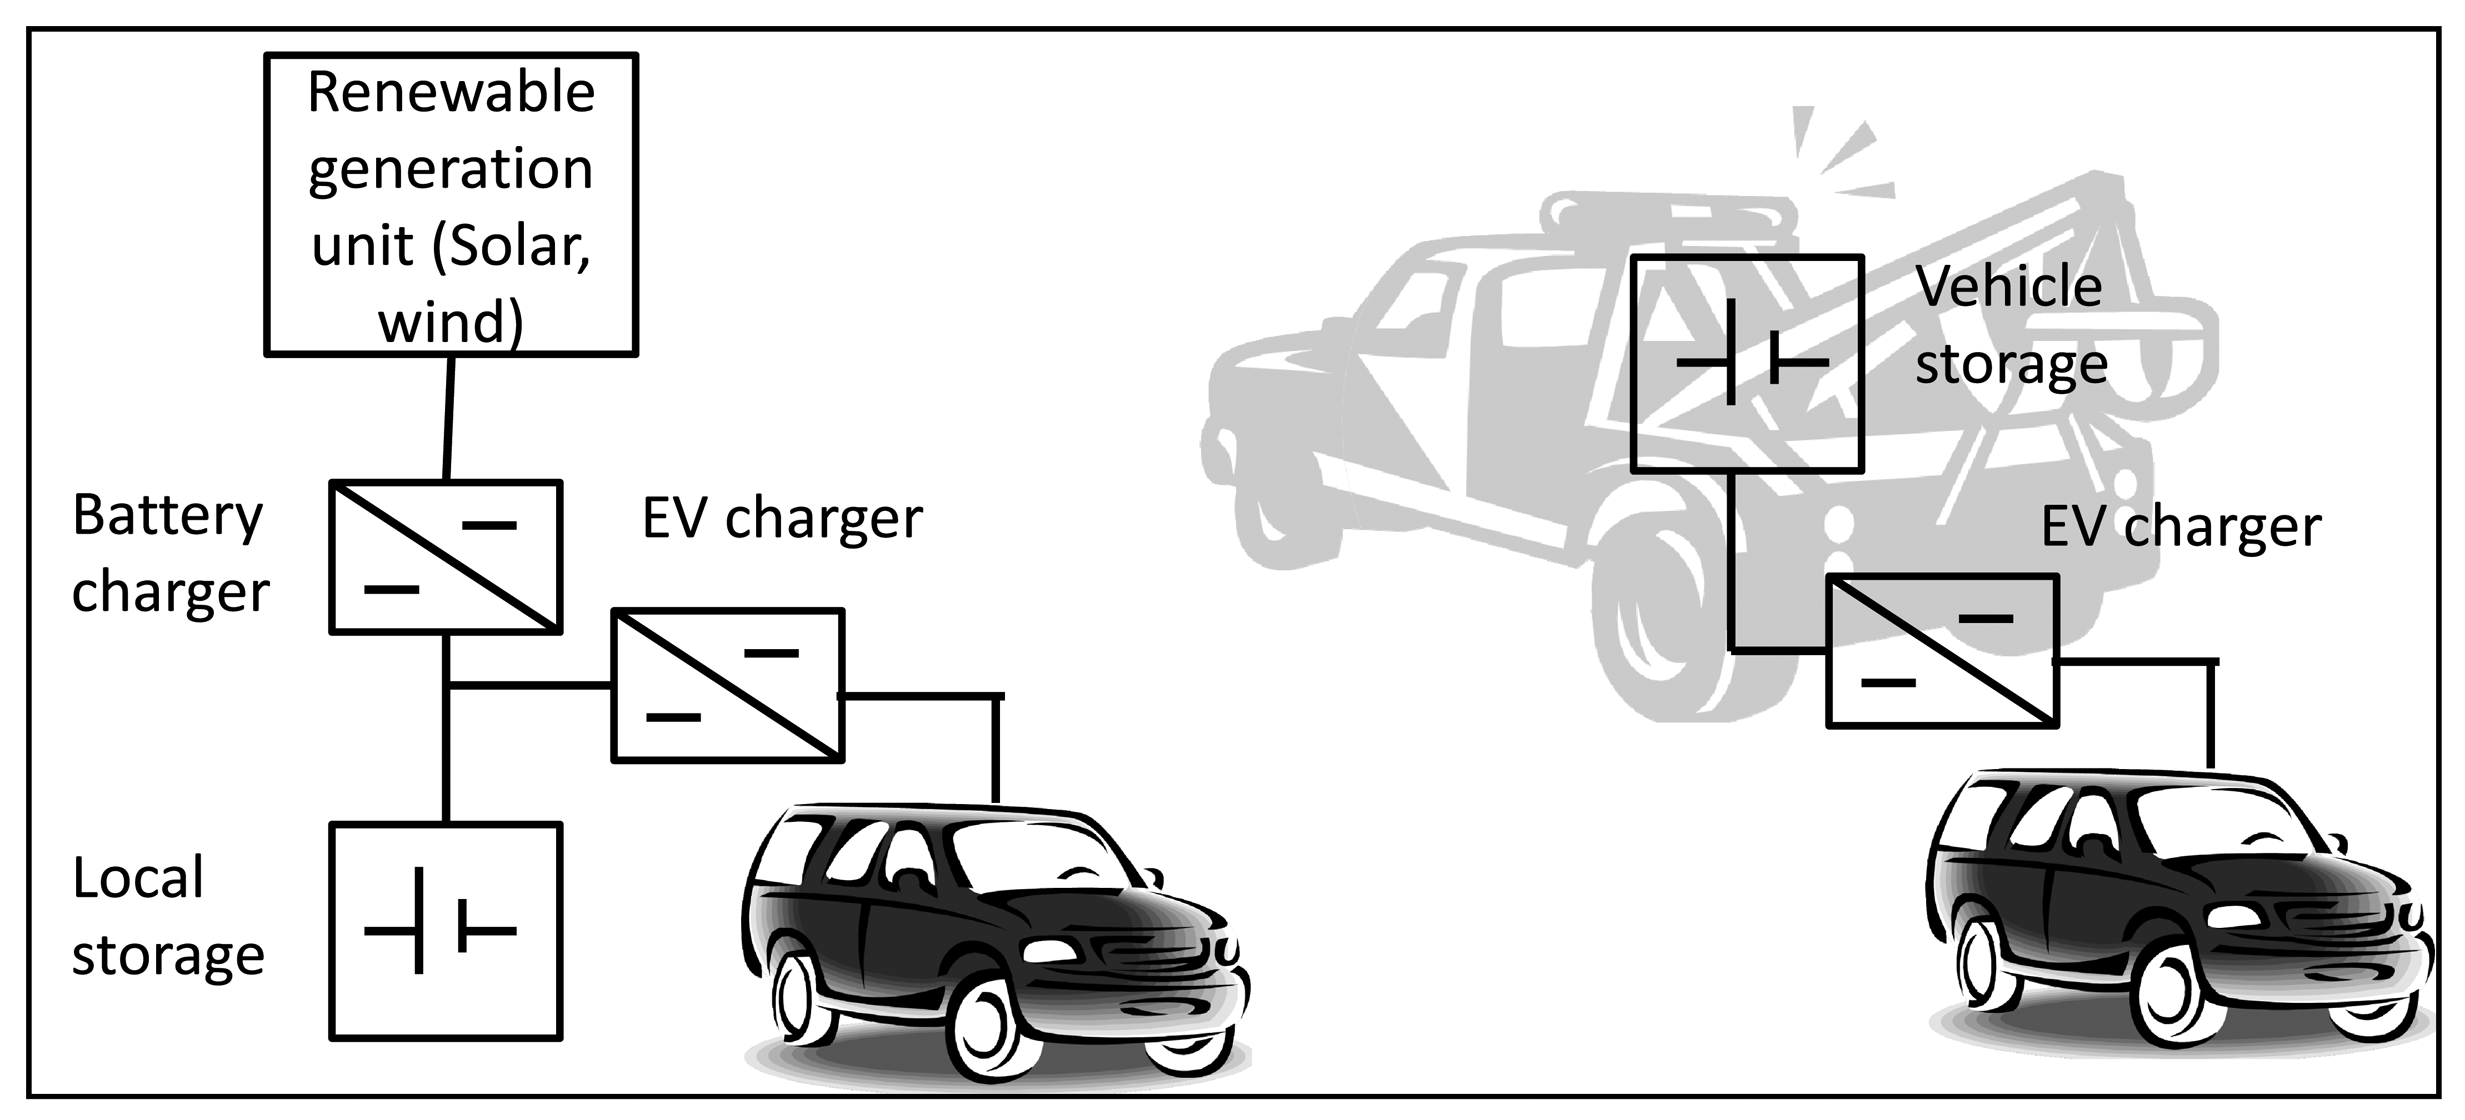
Due to the fact that there is need for a grid connection, the fast charging stations may be located in existing gas stations; they can be deployed close to a grid connection or otherwise being built as an off-grid renewable charging stations or by using charging vehicles (Figure 5 illustrates both concepts). Charging vehicles would service vehicles in case of loss of charge. Besides, when seasonal overload of certain infrastructure is expected, fast charging vehicles may act as extra fast charging stations, so the operational costs are kept at reasonable levels in periods of high charging demand. This would be possible because no physical station has to be built just for those periods of high demand with the associated power costs and other fixed expenditure.
A consideration for locating synergistically the fast charging stations is to use electrified rail infrastructure, utilizing the installed grid infrastructure. In most cases the highway infrastructure goes parallel to the railway infrastructure, therefore, electrified highway mobility could rely on existing electrified transport, as it is the case of the train.
The use of a Geographic Information System (GIS) would be a next step to locate the charging stations definitively, next to existing electric infrastructure. Real location would bring the BCHI figures to a deployment phase, but for the investment calculation presented here, is not of additional relevance.
4.1. Examples of EV Infrastructure Development
The deployment of fast charging infrastructure within a countrywide planning is already a fact in various countries, with different estimates of the necessary distance between fast charging stations. Examples of these deployments are summarized below:
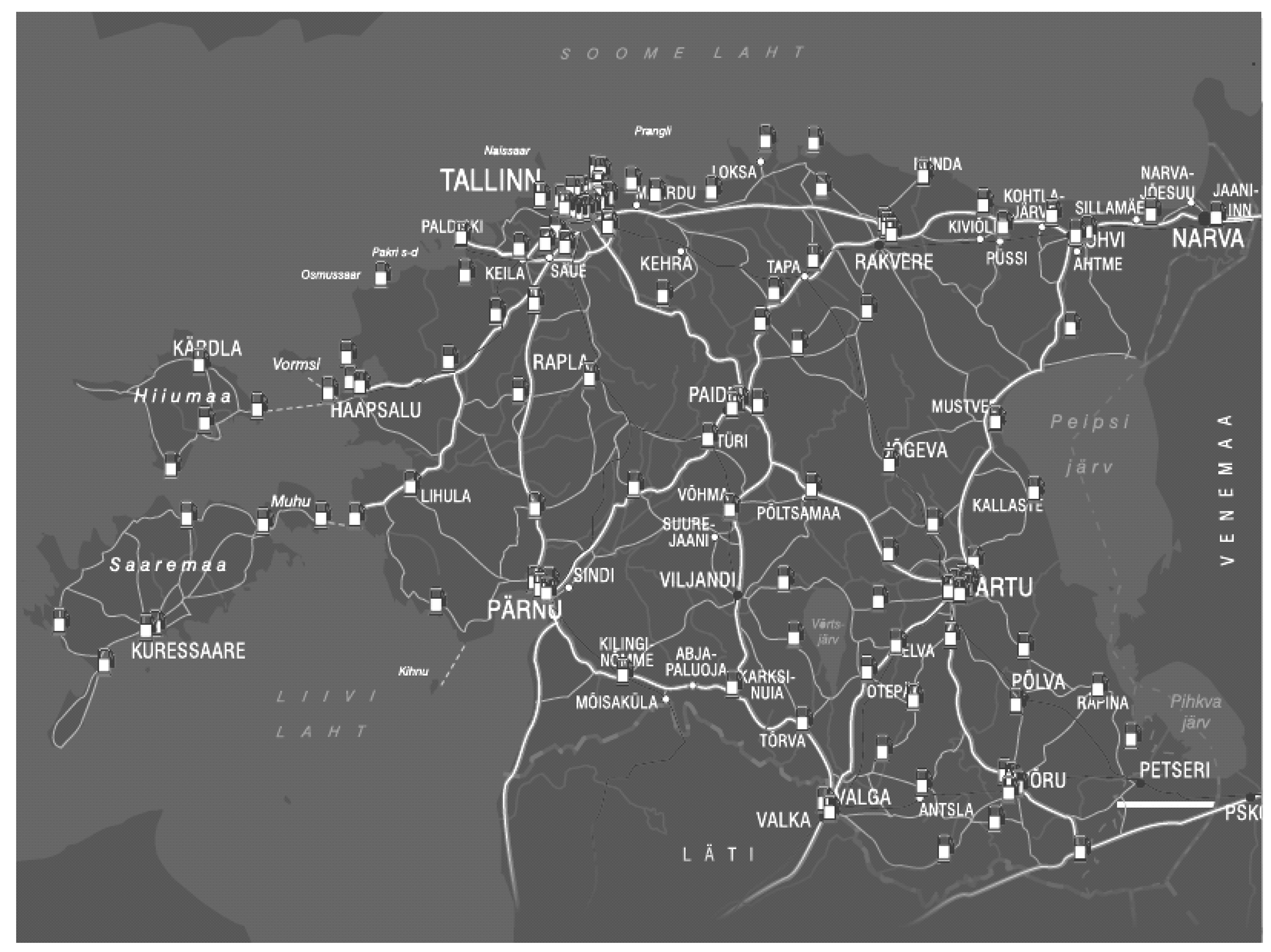
Estonia will install, during 2014, 165 fast chargers, in a government lead infrastructure planning for a country wide development. The MDFC in highways has been set to 60 km. Estonia has 1.3 million inhabitants and a surface of 45,227 km2, therefore, the ratios of chargers are one point of fast charge per 7878 people and per 274.1 km2. A map with the planned infrastructure is shown in Figure 6. From the MDFC calculations, if we consider frequent cold temperatures, and low hot temperatures, weather margin result is 40% according to the proposed model. With speeds of 90 km/h in interurban roads and 110 km/h in highways, the flexibility factor is estimated as 15% for this variable. Not considering additional flexibility factors, and a simultaneity factor of 0.9 in order to consider speed reductions together with bad weather conditions. The resulting MDFC is 57.19 km, when using the minimum range of 123 km, similar to the distance planned for the country. Furthermore, if the standard for the fast chargers were the “Chademo”, the minimum EV range would be 160 km, corresponding to the MiEV model, as the model with lowest range in the standard, with a resulting MDFC of 74.4 km in this case.
In the USA, the “West Coast Electric Highway” consists of fast charging stations located every 40–80 km along the Interstate 5 and other major roadways. In this case, the calculated MDFC is between 67.6 km for areas with winter temperatures close to 0 °C, high traffic, and speed limit, and 111.9 km in areas with low speed limit and mild weather.
In Germany, since 2011, there are 13 fast charging stations placed at highway gas stations, between Hamburg and Dortmund.
In France, the project “Energy Corridor Alsace” starts with six charging stations, and is part of a wider, CROME cross-border project with Germany, proving vehicles may travel across the border and recharge in both countries [33].
In Norway, the company Ishavskraft has deployed fast charging stations between Oslo and the Swedish border, where the distance between chargers does not exceed 50 km [34]. The calculated MDFC, taking into account the speed limit is 80 km/h and that temperatures below −20 °C are not infrequent, is 61.5 km. With a MDFC of 50 km as was decided, EVs could still reach the charging stations with reductions of range up to 60% caused by low temperatures.
Japan is the country with the highest density of fast charging stations, with over 1500 units, and in the case of highway stations, the “Japan Charging network Lim” services these stations [35].
In The Netherlands, Fastned has decided to install fast chargers with a MDFC of 50 km, 200 units that will serve 16 million people [36]. The chargers per capita compared to the Estonian project is 10 times lower, nevertheless the density of chargers will be higher, one every 207 km2 versus one per 274 km2. The calculated MDFC for this case would have the same values as for the Estonian highways, with a resulting value of 57 km.
From these examples it can be noticed that the MDFC remains close to 50 km in most cases, although the weather margin would differ between these countries, for example with a difference of up to a 100% between Norway and the areas with least weather margin in the western coast of the USA. One consequence of small MDFC is that even city cars with fast charge could be able to use the infrastructure; another consequence is that the initial investment could be reduced if the conditions point to a higher MDFC. By using the calculation presented in Section 3, the precise charging stations that would be necessary could be planned in order to promote the use of EVs for interurban trips.
4.2. Application on the Spanish Highway Infrastructure
Spain has a strong reliance on road transportation and a dependence on energy imports above the EU average. The transport sector consumes most primary energy (26%), and causes 28% of the CO2 emissions [37]. Meanwhile, the electric system accommodates above 30% of renewable content, therefore, electrifying transport would imply a higher efficiency and lower emissions.
In order to reduce its emissions, increase its renewable share of energy consumption, improve its energy efficiency and reduce its energy import bill, the electrification of the transport in Spain is essential, as declared in the “Movele Plan” to promote EV adoption, and the “Electric Vehicle Impulse Strategy” defined by the government [38]. One of the reasons for the low adoption of EV in Spain is the use of personal cars for interurban and central-to-coast journeys, involving long distances, as can be inferred from the mean daily indexes of vehicle intensity, calculated by the Spanish so-called “State Highways Network” [39].
Additionally, fast charging points located in cities will probably be used only for emergency charging, when slow charging services at home, office or parking lots would not be able to allow the desired mobility. Additional use of intra-urban fast charging points could be the provision of charging services for EV when needed during the day. The calculation of the BHCI, aims at enabling interurban electric mobility, where fast charging (or battery swapping) is the only viable possibility.
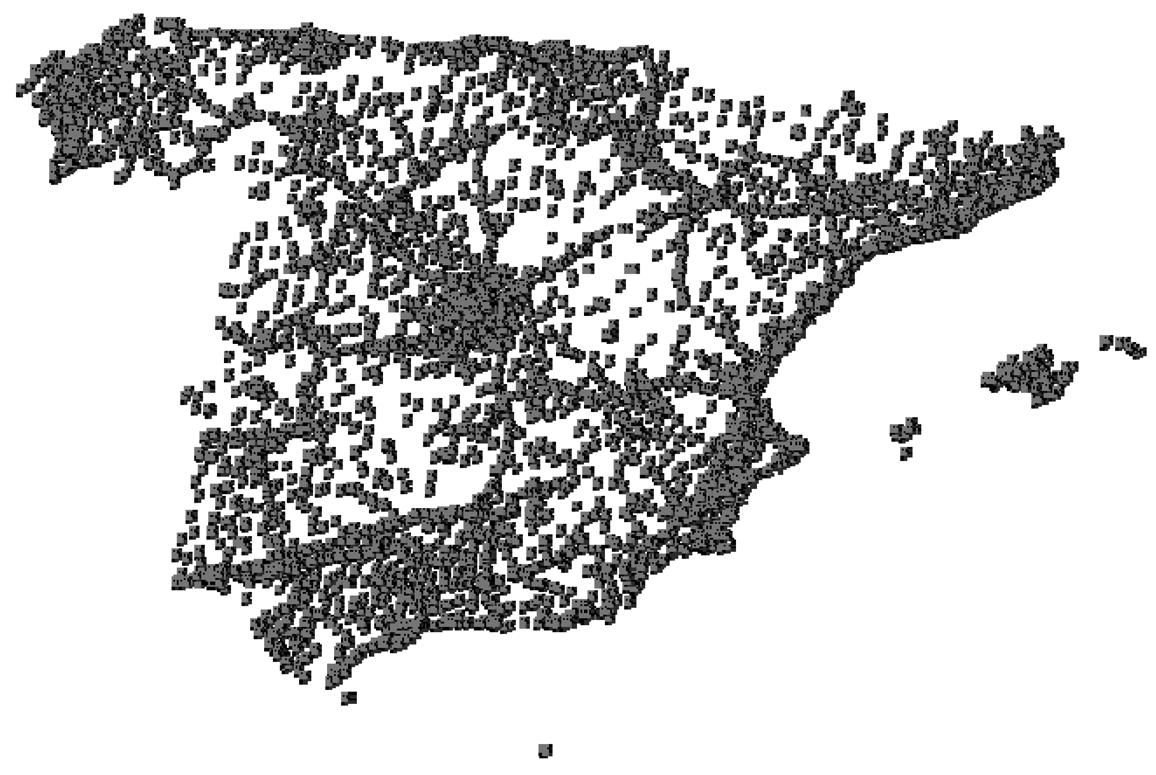
Considering the ratios of the electrification of the Spanish territory and the availability of gas stations (Figure 7), it is evident the feasibility of slow charging electric posts in more than two orders of magnitude higher than gas stations. The number of gas stations in Spain is 9425, while the electrical meters are 27.5 million, 2920 times greater, according to the National Statistics Institute of Spain. Spatial density is one gas station per 18 km2, compared to 147 connections for electricity supply per km2. Per capita ratios reach figures of one gas station for 3765 people compared to one electricity meter for every 1.56 people. The relevance of these ratios is clear in the availability of possible slow chargers, but doesn't ensure mobility, primarily for interurban transport, as it has been mentioned in the introduction of this paper.
Paradoxically, until 2001, the minimum distance between gas stations in highways in Spain was set by the regulation to 20 km, but this was later eliminated in order to allow new investors to install more facilities. What is essential in the actual stage of the EV adoption is the availability of a minimum number of fast charging stations to ensure there is enough charging service for EV users in the country, that is, to develop the necessary BHCI. In order to achieve this goal, the MDFC could be set as mandatory in the regulation, either supplied by the state or any private entrant.
If Spain were to install fast chargers, with similar ratios of density per square kilometer or per capita to The Netherlands and Estonia, between 1517 (considering Spain's extension) and 590 (considering per capita) chargers would be required. The necessary capital costs of the infrastructure would be between 83.5 million Euros and 32.4 million Euros, with a yearly operating cost of between 6 million and 2.3 million. To compare these figures, the Movele plan [38] allocated 10 million Euros, where 8 million where for vehicle acquisition and 1.5 million for slow charge infrastructure deployment. The actual PIVE plan, intended to promote the purchase of efficient vehicles, has involved 75 million in its first edition, and 150 million have been allocated for on the second edition and the third edition, in development at the time of this research, has a budget of 70 million Euros. However, such amount of money for the initial investment on the infrastructure is not considered necessary, therefore, we will calculate the minimum BHCI by means of more appropriate methods (using the MDFC).
Based on the MDFC, the location of the fast charging points has to be designed to allow country-wide electrical transportation. As for Spain, the MDFC components are estimated for the whole country as:
| Rm: | 123 km—Minimum range in Category III; |
| Mw: | 25% 30%—High temperatures are common in summer, but cold temperatures below 0 °C only in some areas; |
| Mf: | 20% for speed limit, as there is an extensive 120 km network. Additional factor would take into account a 5% margin for driving patterns and traffic; |
| k: | 0.8—Speed limit is lower in areas with non-ideal road conditions and weather, and major interurban mobility takes place with good weather conditions. |
The resulting value as per Equation (1) is between 61.5 km and 67.65 km, the latter value for mild weather regions. Temperature margin has to be considered higher for regions with more severe winters (Castilla y León in Spain for example), to obtain a more precise MDFC.
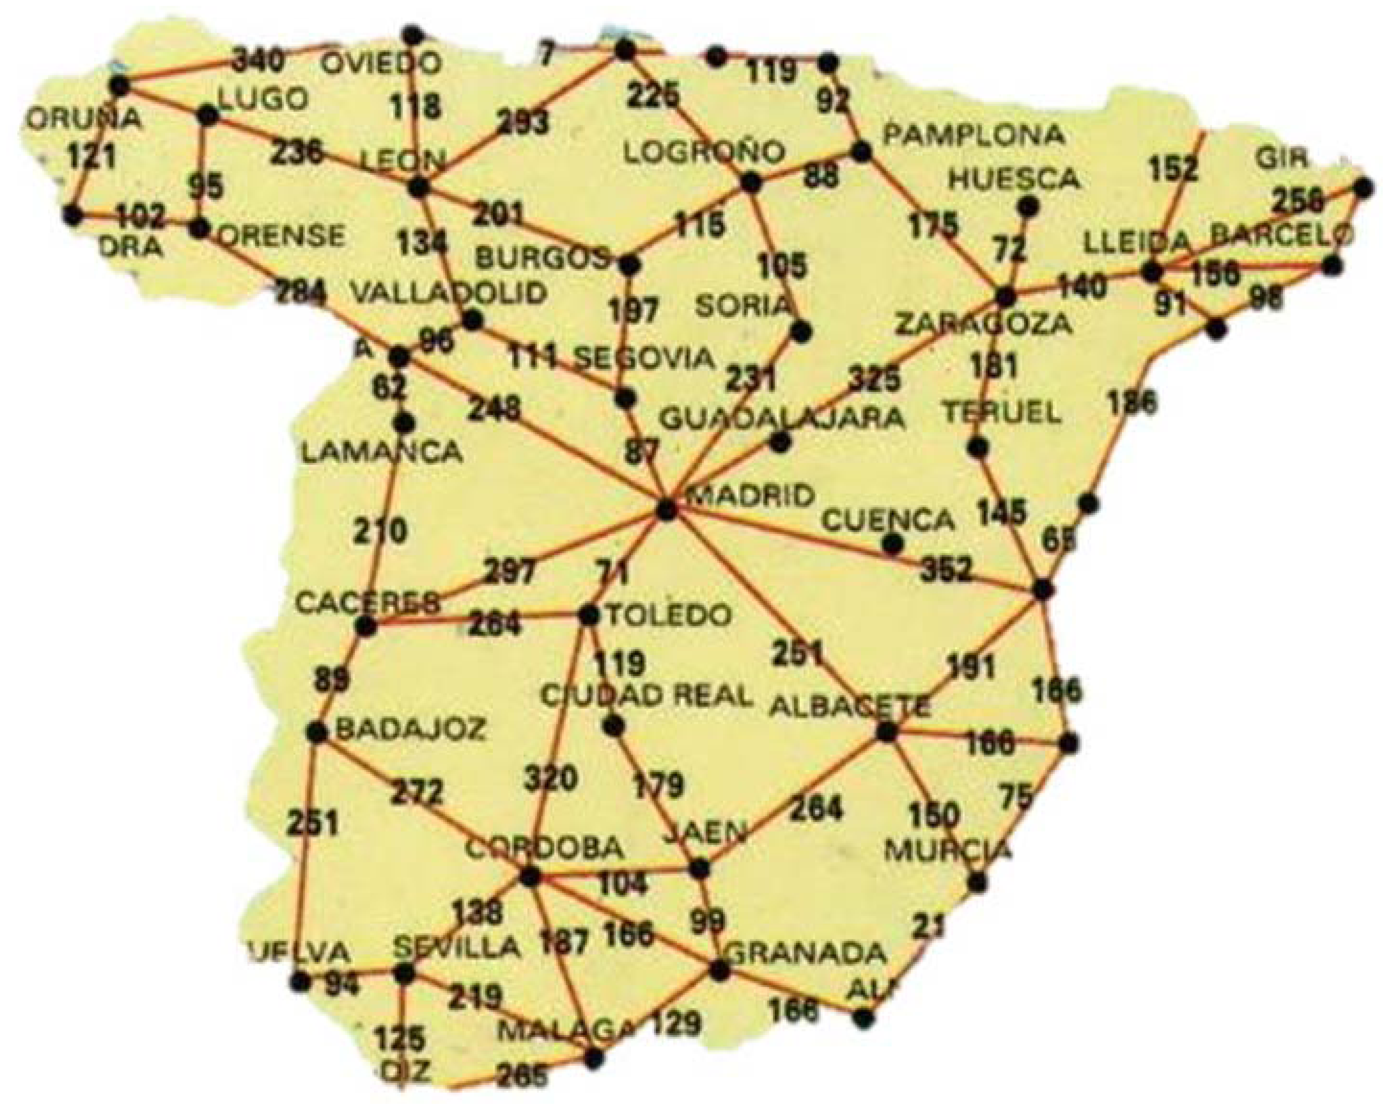
The links among all the province capitals, through the state highway network have a minimum distance of 44 km (between Valladolid and Palencia) and a maximum distance of 297 km (from Cáceres to Madrid). Having a fast charger in every province capital could be an option, resulting in 50 fast charging stations, plus additional chargers among the capitals with a distance between them greater than the MDFC. Calculating these intercity charging stations, the requirement is of 44 additional chargers. Such an investment would be the “major city fast charging network” (Figure 8) that could be used for interurban and also intra urban mobility, and would require a capital expenditure (CAPEX) of approximately 5.1 million Euros, with operational expenditure (OPEX) of 376 thousand Euros per year. The drawback is the non-linearity of the routes and the deviations that it would entail, even if it was placed beside the highway infrastructure. This fact is the reason for calculating the BHCI using the topology of the main state highways to maximize the range. However, building an infrastructure (by public initiative, for example) does not impede the deployment of a parallel privately owned group of charging stations in the cities.
Another basic calculation for the BHCI, without taking into account the topology of the existing highways, is to calculate the needed infrastructure based on the total state highway network, as in Equation (2). This approach may give an estimate of the quantity of fast charging points, where Tn is the total network length in km, and the resulting BHCI is the number of required stations.
For the case of Spain, with a 26,037 km State Highway Network, the resulting values are between 384 and 423 charging stations. The quantity is lower than the ratio-calculated infrastructure based on smaller countries, nevertheless meaning an infrastructure worth 21–23 million Euros and with an annual operating cost of between 1.5 million and 1.69 million Euros.
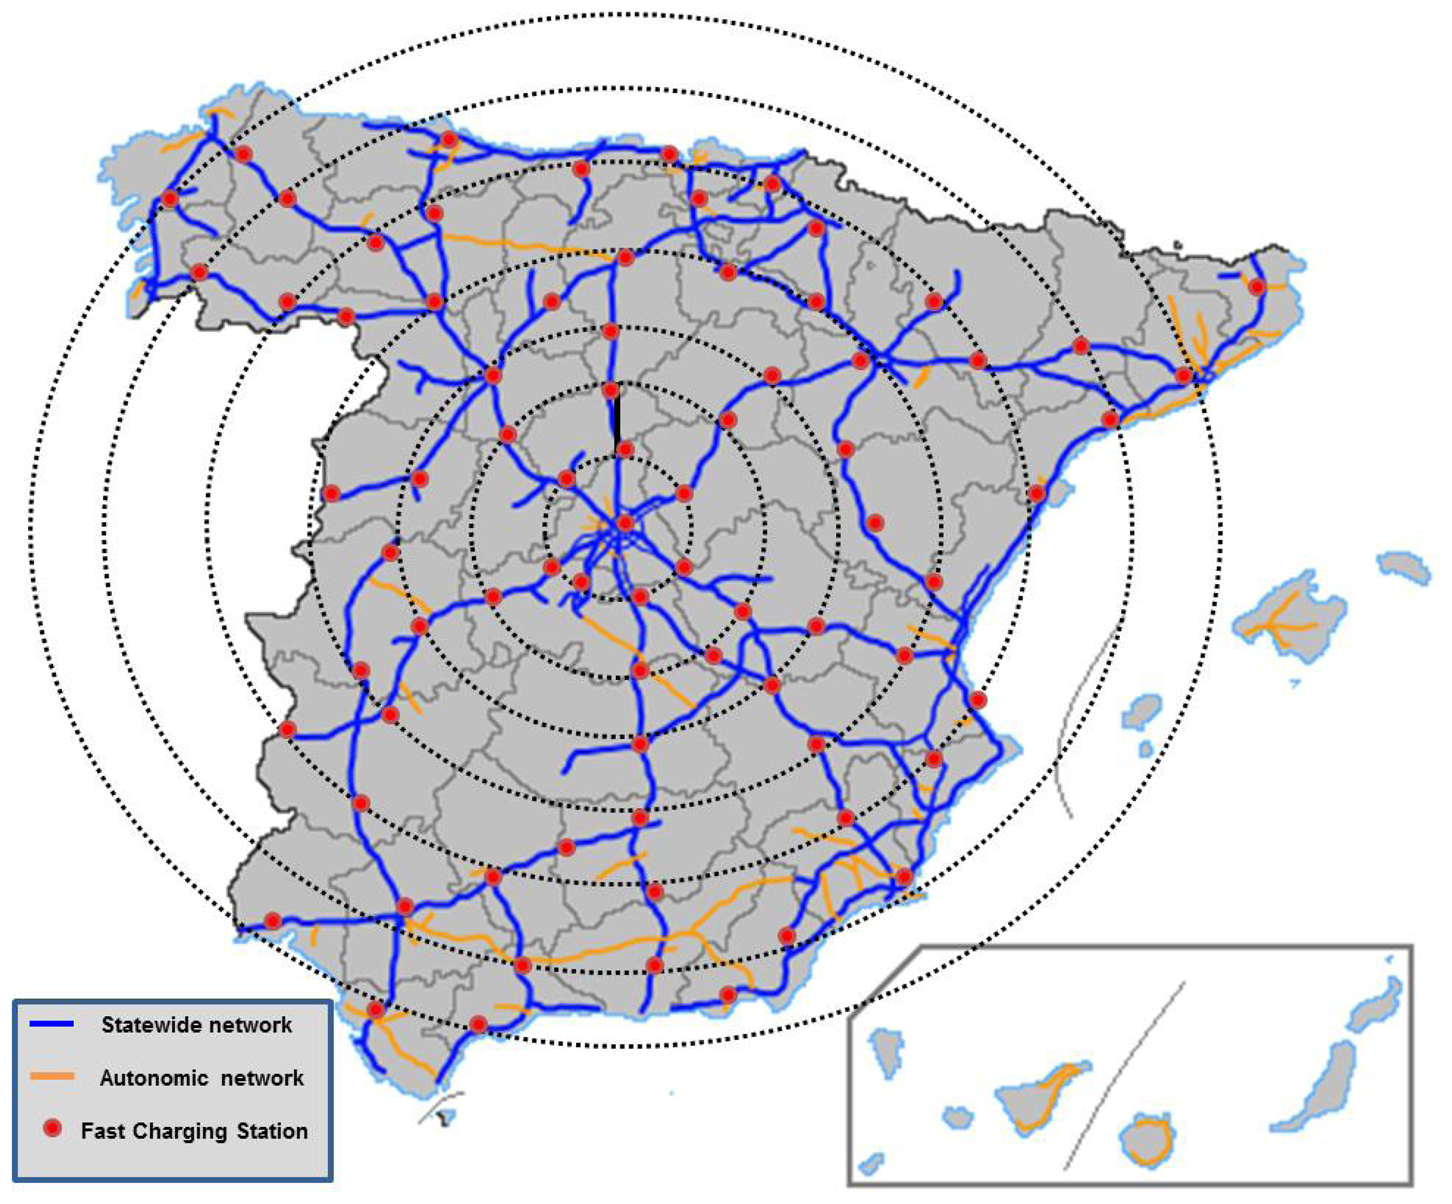
Another proposal for the planning of the deployment is through a highway-topology calculation of the BHCI, as mentioned above. Figure 9 represents the state highway network with the high value of MDFC of 67.65 km range, with a radial approach, starting in Madrid, and following the different state highways. The selection would ensure the possibility of routes from Madrid to any destination on the state highways.
The required investment for a minimum infrastructure allowing the mobility in the whole highway infrastructure of Spain following the radial MDFC method implies the deployment of 76 fast charging stations. The investment in this case would be 4.18 million Euros and a yearly maintenance of 304 thousand Euros.
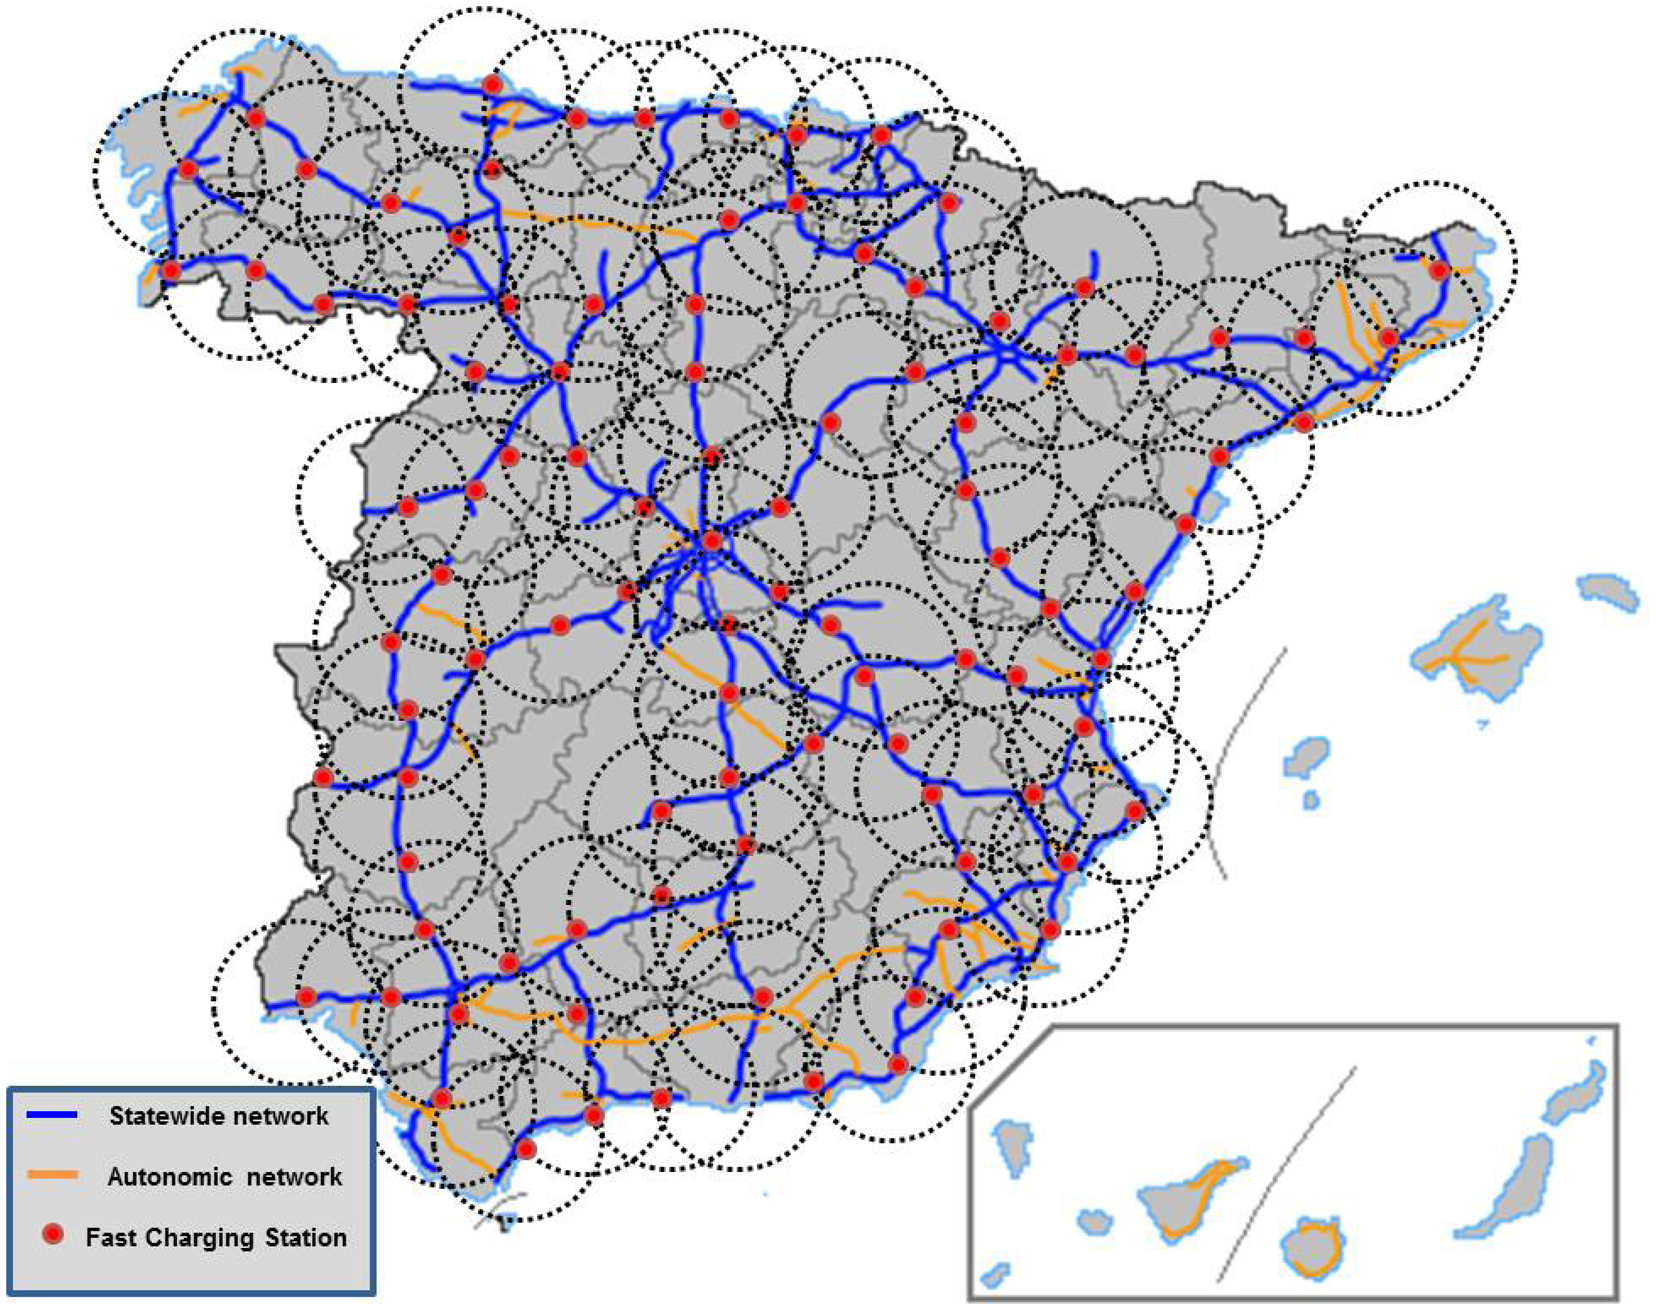
If the topology follows the network, with individual range the location is done more precisely and the number of charging stations is higher, as seen in Figure 10. The figure also gives an impression of the secondary network covered with the range from the charging stations. Only a small portion of the country, apart from the state highways, estimated in less than 10%, would be out of range from a fast charging station.
Ninety-nine fast charging stations are calculated using the individual range, as the distance between radial MDFC may be higher on the national highway network. The investment using this method requires 5.44 million Euros and an operational cost of 396 thousand Euros per year. The summary of different infrastructure calculations is summarized in Table 6, where the approaches can be compared.
An example on the infrastructure utilization can be considered with the use of a Nissan Leaf, to cover the distance between Madrid and La Coruña (591 km). With fast charging stations every 67 km, and a range of 200 km, with normal weather conditions and charging up to 80%, three stops would be necessary, each of below 20 min, and with a total time close to seven hours. A conventional combustion vehicle could complete the same route with normally two stops (respecting required rest periods for safety), but would probably not save more than half an hour. The difference between both technologies is therefore no longer substantial, underlining the importance of having highway fast charging infrastructure to enable more sustainable transport.
The previous results, excluding the total state highway calculation and the ratio-based, highlight the fact that country wide e-mobility would be available for a budget close to 5 million Euros. Furthermore, if we compare these results with other methodologies, such as those involving the number of fast charging stations per vehicle, the necessary investment could be even lower when considering the actual vehicle stock; however, it turns to be higher when the calculations are based on the expected units to be using the infrastructure in the following years. If the calculation is made by using methods such as the one described by Xu [22], the MDFC would be minimized and the investment would be higher, because of the model minimizing the distance traveled by the EVs (as in inter-urban charging infrastructure). The budget resulting from our research represents a small part of the state supported vehicle acquisition programs in place in Spain nowadays. Relevance must be given to the fact that given a certain use of the infrastructure, the infrastructure can become profitable. Moreover, not only the positive consequences of emission reduction, reduced energy dependence and energy efficiency are to be considered, but also the possibility of direct profitability of the fast charging service.
An example of the cost-benefit analysis for the proposed infrastructure can be calculated from one of the BHCI estimations. If we select 99 charging stations, with an investment of 5.44 M€ and an operating cost of 396 k€ per year, considering electric consumption costs in the station of 0.13 €/kWh and the sales price to be 0.3 €/kW h, the number of charges per year and per station can be calculated for covering operating costs or for achieving a 10 year return on capital investment. These calculations are shown in Table 7. In order for the number of charges to be possible, at least eight vehicles per day would have to charge in every station. Considering that most of the state highways have more than 10,000 vehicles per day as mean daily index, with a small percentage of the vehicles being electric the results of the calculations could be feasible.
The benefit for the vehicle users is evident with regard to the cost of transport, given an efficiency of 8 kW h/100 km compared to, for example 7 L/100 km of a combustion vehicle. With 0.3 €/kW h of electric sales price and a price per liter of 1.4 €/L (based on actual market prices in Spain), the cost per km is 75% less with the EV (2.4 €/100 km versus 9.8 €/100 km).
The deployment of charging stations should follow a prioritization, based on the daily mean index of vehicles measured by the state highways. The methodology for prioritization requires further research and modeling to complement the actual methodology.
Taking into consideration the cost reduction curve for the charging stations, the cost of building the infrastructure will evolve following a learning curve. At the date of this publication, the investment costs according to material prices are already 40% lower than the estimates from 2012 [11]. Once demand and vehicle use has ramped up sufficiently, state owned or state supported infrastructure will move to a privately managed infrastructure.
5. Conclusions
This paper estimates a country wide infrastructure to allow full interurban EV by calculating the MDFC. The values influencing the MDFC are presented and calculated. Besides, from the analysis undertaken, we can extract a simple and clear conclusion; the required fast charging infrastructure does not imply a high upfront investment compared to other EV incentive plans. For the case of Spain, less than 5 million Euros would allow a countrywide fast charging electrical infrastructure, requiring less than 100 fast charging stations. Although the focus is Spain for the calculations, a general applicability of the methodology is possible. The paper also compares the MDFC values with existing country wide deployment projects of fast charging infrastructure, obtaining similar if slightly higher values (>10%). These projects have a more conservative MDFC, the risk of the EVs not reaching the next fast charging station is minimized, but effective investment could have been reduced selecting the calculated MDFC.
The building of the BHCI is proposed to be promoted as an enabling infrastructure, state-owned or subsidized by the government to charging management retailers. The return on investment will not be in the short run, unless the EV adoption ramps-up above expectations, but would complement the benefits of promoting interurban electrical mobility. Reduction in energy dependence, energy trade unbalance, and consequently less trade deficit to be financed, are the main values for the country.
Together with fiscal levers as proposed by Turcksi et al. [24], financial support, and emission restrictions that have the goal of making road transport more sustainable, an additional proposal, related with the content of the research, for energy policy is to favor highway electric mobility by reducing toll in highways, to foster the e-mobility for interurban routes.
The proposed model aims at setting the infrastructure with objectivity, despite the current uncertainty on how weather, flexibility and simultaneity of factors influence range. Further research on these factors, in parallel with the implementation of technology enhancements for EV, may improve the methodology presented in the paper. For this matter, increased EV adoption and consequent increase in experiential data for interurban transportation will prove valuable.
Conflicts of Interest
The authors declare no conflict of interest.
References
- European Commission. Directive 2009/33/EC of the European Parliament and the Council of 23 April 2009 on the promotion of clean and energy-efficient road transport vehicles. Off. J. Eur. Union 2009, L120, 5–12.
- Franke, T.; Neumann, I.; Bühler, F.; Cocron, P.; Krems, J.F. Experiencing range in an electric vehicle: Understanding psychological barriers. Appl. Psychol. 2012, 61, 368–391. [Google Scholar]
- Liu, J. Electric vehicle charging infrastructure assignment and power grid impacts assessment in Beijing. Energy Policy 2012, 51, 544–557. [Google Scholar]
- Boulanger, A.G.; Chu, A.C.; Maxx, S.; Waltz, D.L. Vehicle electrification: Status and issues. IEEE Proc. 2011, 99, 1116–1138. [Google Scholar]
- Cowan, R.; Hultén, S. Escaping lock-in: The case of the electric vehicle. Technol. Forecast. Soc. Chang. 1996, 53, 61–79. [Google Scholar]
- Dijk, M.; Orsato, R.J.; Kemp, R. The emergence of an electric mobility trajectory. Energy Policy 2013, 52, 135–145. [Google Scholar]
- Arvizu, S. The Plug-in Vehicle Network: Driving Change in the U.S. Auto Industry. 2011. Available online: http://www.misselectric.com/wp-content/uploads/2011/01/PlugInNetwork1.pdf (accessed on 20 July 2013). [Google Scholar]
- Hartmann, N.; Oezdemir, E.; Goyns, P.; Eltrop, L. Modeling the Plug-in Availability and Calculation of Energy Storage Potential of Electric Vehicles in Germany. Proceedings of the EVS24 International Battery, Hybrid and Fuel Cell Electric Vehicle Symposium, Stavanger, Norway, 13–16 May 2009.
- Botsford, C.; Szczepanek, A. Fast Charging vs. Slow Charging: Pros and Cons for the New Age of Electric Vehicles. Proceedings of the EVS24 International Battery, Hybrid and Fuel Cell Electric Vehicle Symposium, Stavanger, Norway, 13–16 May 2009.
- Bakker, J.J. Contesting Range Anxiety: The Role of Electric Vehicle Charging Infrastructure in the Transportation Transition. Master's Thesis, Eindhoven University of Technology, Eindhoven, The Netherlands, 2011. Available online: http://alexandria.tue.nl/extra2/afstversl/tm/Bakker_2011.pdf (accessed on 10 October 2013). [Google Scholar]
- Schroeder, A.; Traber, T. The economics of fast charging infrastructure for electric vehicles. Energy Policy 2012, 43, 136–144. [Google Scholar]
- Ahman, M. Government policy and the development of electric vehicles in Japan. Energy Policy 2006, 34, 433–443. [Google Scholar]
- Brown, S.; Pyke, D.; Steenhof, P. Electric vehicles, the role and importance of standards in an emerging market. Energy Policy 2010, 38, 3797–3806. [Google Scholar]
- San Román, T.G.; Momber, I.; Abad, M.R.; Sánchez Miralles, Á. Regulatory framework and business models for charging plug-in electric vehicles: Infrastructure, agents, and commercial relationships. Energy Policy 2011, 39, 6360–6375. [Google Scholar]
- Camus, C.; Farias, T.; Esteves, J. Potential impacts assessment of plug-in electric vehicles on the Portuguese energy market. Energy Policy 2011, 39, 5883–5897. [Google Scholar]
- Baptista, P.C.; Silva, C.M.; Farias, T.L.; Heywood, J.B. Energy and environmental impacts of alternative pathways for the Portuguese road transportation sector. Energy Policy 2012, 51, 802–815. [Google Scholar]
- Andersen, P.H.; Mathews, J.A.; Rask, M. Integrating private transport into renewable energy policy: The strategy of creating intelligent recharging grids for electric vehicles. Energy Policy 2009, 37, 2481–2486. [Google Scholar]
- Camus, C.; Farias, T. The electric vehicles as a mean to reduce CO2 emissions and energy costs in isolated regions. The São Miguel (Azores) case study. Energy Policy 2012, 43, 153–165. [Google Scholar]
- Lund, E.; Kempton, W. Integration of renewable energy into the transport and electricity sectors through V2G. Energy Policy 2008, 36, 3578–3587. [Google Scholar]
- Sweda, T.; Klabjan, D. An Agent-Based Decision Support System for Electric Vehicle Charging Infrastructure Deployment. Proceedings of the IEEE Vehicle Power and Propulsion Conference (VPPC), Chicago, IL, USA, 6–9 September 2011; pp. 1–5.
- Bernardo, V.; Borrel, J.-R.; Perdiguero, J. Fast Charging Stations: Network Planning versus Free Entry. Available online: http://www.cemfi.es/ftp/pdf/papers/wshop/version_3.pdf (accessed on 5 July 2013).
- Xu, H.; Miao, S.; Zhang, C.; Shi, D. Optimal placement of charging infrastructures for large-scale integration of pure electric vehicles into grid. Int. J. Electr. Power Energy Syst. 2013, 53, 159–165. [Google Scholar]
- Zero Emission Resource Organisation (ZERO). Taking Charge. Introducing Fast Chargers in Norway; ZERO: Oslo, Norway, 2012. Available online: http://www.zero.no/FC1E25BD-4B49-4146-9272-4F9F680849DB/FinalDownload/DownloadId-6BC26B10165D518C559395C8F1956C88/FC1E25BD-4B49-4146-9272-4F9F680849DB/publikasjoner/introducing-fast-chargers-in-norway.pdf (accessed on 25 July 2013).
- Turcksin, L.; Mairesse, O.; Macharis, C.; van Mierlo, J. Encouraging environmentally friendlier cars via fiscal measures: General methodology and application to Belgium. Energies 2013, 6, 471–491. [Google Scholar]
- Falahi, M.; Ehsani, M.; Xie, L.; Butler-Purry, K. Potential power quality benefits of electric vehicles. IEEE Trans. Sustain. Energy 2013, 4, 1016–1023. [Google Scholar]
- Ehsani, M.; Fahali, M.; Lotfifard, S. Vehicle to grid services: Potential and applications. Energies 2012, 5, 4076–4090. [Google Scholar]
- Global EV Outlook. Understanding the Electric Vehicle Landscape to 2020; International Energy Agency (IEA): Paris, France, April 2013. Available online: http://www.iea.org/publications/globalevoutlook_2013.pdf (accessed on 5 December 2013).
- Farrington, R.; Rugh, J. Impact of Vehicle Air-Conditioning on Fuel Economy, Tailpipe Emissions, and Electric Vehicle Range, NREL/CP-540–28960. 2010. Available online: http://www.nrel.gov/docs/fy00osti/28960.pdf (accessed on 10 October 2013). [Google Scholar]
- Leahy, P.G.; Floey, A.M. Impact of Weather Conditions on Electric Vehicle Performance. Proceedings of the ITRN2011, University College Cork, Cork, Ireland, 31 August–1 September 2011.
- Fleetcarma. Webinars the Truth about EVs in Hot and Cold Weather, Real Fleet Findings. Available online: http://www.fleetcarma.com/en/Resources/Webinars (accessed on 15 July 2013).
- Umezu, K.; Noyama, H. Air-Conditioning System for Electric Vehicles (i-MiEV). Proceedings of the SAE Automotive Alternate Refrigerant Systems Symposium, Scottsdale, AZ, USA, 14 July 2010.
- ABB Group. World's First Nationwide EV Charging Network Starts—Based on ABB Fast Charger Technology. Available online: http://www.abb.com/cawp/seitp202/61df2f8f8c7d00a6c1257b18002d5e3c.aspx (accessed on 16 July 2013).
- Alsace Energy Corridor. The Installation of the First Rapid Charging Terminal. Available online: http://www.chademo.com/wp/wp-content/uploads/2012/12/June2012-ALSACEENERGYCORRIDOR_Theinstallationofthefirstrapid.pdf (accessed on 8 July 2013).
- Ishavsveien Project. Available online: http://www.ishavsveien.no (accessed on 8 July 2013).
- CHAdeMo Association. CHAdeMo Global Deployments. Available online: http://www.chademo.com/wp/blog/2013/01/06/346/ (accessed on 8 July 2013).
- Fastned Fast-Charging Plan. Available online: http://www.fastned.nl (accessed on 8 July 2013).
- BP Chair on Energy and Sustainability, Observatory of Energy and Sustainable Development in Spain 2012. Available online: http://www.upcomillas.es/Centros/bp/Documentos/Actividades/Observatorio/Marzo2013/Informe_Observatorio2012_web.pdf (accessed on 13 July 2013).
- Minetur, Ministry of Industry, Commerce and Tourism, Electrical Vehicle Impulse Strategy. 2010. Available online: http://www.minetur.gob.es/es-es/gabineteprensa/notasprensa/documents/estrategiaintegralveh%C3%ADculoelectrico060410.pdf (accessed on 14 July 2013).
- State Highways Network (Red de Carreteras del Estado), Mapa de intensidades 2011, Edited 2012. Available online: http://www.fomento.es/MFOM/LANG_CASTELLANO/DIRECCIONES_GENERALES/CARRETERAS/TRAFICO_VELOCIDADES/MAPAS/2011/NACIONAL/ (accessed on 14 July 2013).
- Minetur, Ministry of Industry, Commerce and Tourism, Geoportal for Hidrocarbons. Available online: http://geoportalgasolineras.es/ (accessed on 4 December 2013).


| Model | Year | Range (km) |
|---|---|---|
| Tesla Roadster | 2008 | 320 |
| MiEV | 2009 | 160 |
| Nissan LEAF | 2011 | 200 |
| Subaru plug-in Stella | 2009 | 90 |
| Protoscar Lampo (prototype) | 2014 | 200 |
| Citroën C-ZERO | 2009 | 160 |
| Peugeot iOn | 2009 | 160 |
| Berlingo | 2014 | 170 |
| Partner | 2014 | 170 |
| IQ e | 2013 | 100 |
| HondaFit | 2013 | 225 |
| Ford Focus electric | 2013 | 123 |
| Nissan Infinity EV Sedan | 2015 | 160 |
| Ecomove QBEAK | 2014 | 300 |
| Tesla S | 2013 | 257 |
| BMW active E | 2011 | 240 |
| BMW mini E | 2012 | 240 |
| BMW i3 | 2014 | 130 |
| Toyota RAV-EV | 2013 | 198 |
| Fiat 500-E | 2014 | 130 |
| Chevrolet Spark EV | 2014 | 132 |
| Altea XL electric | 2010 | 135 |
| Zytel Gorila | 2010 | 100 |
| MicroVETT Fiorino | 2009 | 140 |
| BYD E6 | 2010 | 300 |
| Lightning GT | 2013 | 240 |
| Mercedes SLS AMG | 2014 | 250 |
| Smart ED | 2012 | 110 |
| Think City | 2011 | 160 |
| Venturi Fetish | 2006 | 340 |
| Citroen DS3 Electrum | 2014 | 120 |
| Citroen Survolt | 2010 | 260 |
| Detroit Electric | 2013 | 300 |
| Tesla X | 2014 | 340 |
| Volvo C30 | 2011 | 150 |
| VW UP electric | 2014 | 150 |
| VW Golf E-motion | 2014 | 150 |
| Renault ZOE | 2013 | 210 |
| Model | Year | Range | Accumulated vehicle sales |
|---|---|---|---|
| Nissan LEAF | 2011 | 200 | >69,000 |
| MiEV | 2009 | 160 | >25,500 |
| Tesla S | 2013 | 257 | >12,500 |
| BYD E6 | 2010 | 300 | >2,850 |
| Renault ZOE | 2013 | 210 | >4,820 |
| Weather margin (Mw, %) as a function of weather conditions | |||
|---|---|---|---|
| Heating requirements low Lowest seasonal temperatures > 10 °C | Heating requirements base Seasonal temperatures > 0 °C | Heating requirements high Frequent seasonal temperatures < 0 °C | Heating requirements maximum Frequent seasonal temperatures < −10 °C |
| 0% | 20% | 40% | 50% |
| A/C requirements low Highest seasonal temperatures < 25 °C | A/C requirements base Seasonal temperatures (25–35 °C) | A/C requirements high Frequent seasonal temperatures > 35 °C | - |
| 0% | 10% | 30% | - |
| Speed flexibility margin | Margin increase factors | |||
|---|---|---|---|---|
| Highway speed | Mf estimated values | Aggressive driving style factor (+ Mf) | High traffic factor (+ Mf) | Non full charging pattern (+ Mf) |
| 89 km/h | 10% | 5% | 5% | 5% |
| 105 km/h | 20% | |||
| 120 km/h | 25% | |||
| Fast charging station characteristics | Super fast DC | Level III DC | Level III AC |
|---|---|---|---|
| Station Lifetime (years) | 10 | 10–15 | 10–15 |
| Load limit (V) | 2,000 | 500 | 400 (3 phase) |
| Load limit (A) | 125 | 125 | 96 (3 × 32) |
| Current | DC | DC | AC |
| Power limit (kW) | 250 | 62.5 | 50 |
| Duration of 20 kW h charging (min) | 5 | 19 | 24 |
| Material cost (€) | 60,000 | 40,000 | 40,000 |
| Grid reinforcement cost/civils (€) | 20,000 | 15,000 | 10,000 |
| Transformer cost if applicable (EUR) | 35,000 | 0–35,000 | 0 |
| Total CAPEX (EUR) | 115,000 | 55,000 | 50,000 |
| Maintenance and repair (EUR/year) *Rule-of-thumb: Up to 10% of material cost | 6,000 | 4,000 | 4,000 |
| Total OPEX (EUR) | 60,000 | 40,000 | 40,000 |
| Total investment cost (EUR) | 225,000 | 95,000 | 90,000 |
| Method of estimation | Number of charging stations | Capex cost (M€) | Opex cost (k€) |
|---|---|---|---|
| Radial fast charging network | 76 | 4.18 | 304 |
| Major city fast charging | 94 | 5.1 | 376 |
| Individual station range network | 99 | 5.44 | 396 |
| Total state highway km/MDFC | 384–423 | 21–23 | 1.5–1.69 |
| Ratios from other countries | 590–1,517 | 32.4–83.5 | 2,300–6,000 |
| Opex cost | 396,000 | €/year |
| Electric cost price | 0.13 | €/kW h |
| Sales margin | 0.17 | €/kW h |
| kW h/year to cover opex | 2,329,412 | kW h |
| Number of 20 kW h charges | 116,471 | number of charges |
| Number of charges per station | 1,176 | charges per station/year |
| For a 10 year capex ROI | 3,200,000 | kW h extra per year |
| Number of 20 kW h charges | 160,000 | number of charges |
| Number of charges per station | 1,616 | charges per station/year |
| Total charges per station & year for 10 year ROI | 2,793 | charges per station/year |
© 2014 by the authors; licensee MDPI, Basel, Switzerland. This article is an open access article distributed under the terms and conditions of the Creative Commons Attribution license ( http://creativecommons.org/licenses/by/3.0/).
Share and Cite
Colmenar-Santos, A.; De Palacio, C.; Borge-Diez, D.; Monzón-Alejandro, O. Planning Minimum Interurban Fast Charging Infrastructure for Electric Vehicles: Methodology and Application to Spain. Energies 2014, 7, 1207-1229. https://doi.org/10.3390/en7031207
Colmenar-Santos A, De Palacio C, Borge-Diez D, Monzón-Alejandro O. Planning Minimum Interurban Fast Charging Infrastructure for Electric Vehicles: Methodology and Application to Spain. Energies. 2014; 7(3):1207-1229. https://doi.org/10.3390/en7031207
Chicago/Turabian StyleColmenar-Santos, Antonio, Carlos De Palacio, David Borge-Diez, and Oscar Monzón-Alejandro. 2014. "Planning Minimum Interurban Fast Charging Infrastructure for Electric Vehicles: Methodology and Application to Spain" Energies 7, no. 3: 1207-1229. https://doi.org/10.3390/en7031207