Energy and Cost Saving of a Photovoltaic-Phase Change Materials (PV-PCM) System through Temperature Regulation and Performance Enhancement of Photovoltaics


Abstract
: The current research seeks to maintain high photovoltaic (PV) efficiency and increased operating PV life by maintaining them at a lower temperature. Solid-liquid phase change materials (PCM) are integrated into PV panels to absorb excess heat by latent heat absorption mechanism and regulate PV temperature. Electrical and thermal energy efficiency analysis of PV-PCM systems is conducted to evaluate their effectiveness in two different climates. Finally costs incurred due to inclusion of PCM into PV system and the resulting benefits are discussed in this paper. The results show that such systems are financially viable in higher temperature and higher solar radiation environment.1. Introduction
Silicon photovoltaics (PV) show a power drop above 25 °C panel temperature with a temperature coefficient ranging from −0.3%/K up to −0.65%/K [1,2] depending on type of PV cell and manufacturing technology [3]. Various mathematical correlations have been developed to describe the dependence of PV operating temperature on climatic conditions and PV materials [4]. The operating temperature reached by PV panels and associated power drop largely depends on the climate of the site. In Germany 50% of the solar radiation incident on a PV panel is above 600 W/m2, while in Sudan this value reaches 80%, resulting in different operating temperatures and associated power drop [5,6]. A maximum PV operating temperature of 125 °C has been reported in southern Libya (27.6°N and 14.2°E) resulting in a 69% reduction in the nominal power [7]. The advisable operating temperature limit for PV ranges from −40 °C to 85 °C [8] however in hot and arid climates, PV temperature frequently rises above upper limit of temperature range [7], which results in temperature induced power failure as well as PV cell delamination and rapid degradation [9] urging a strong need for PV temperature regulation to maximize both panel power output and life.
Different passive and active heat removal techniques have been used to maintain PV at lower temperatures. Passive heat removal in free standing PV relies on the buoyancy driven air flow in a duct behind the PV [10]. Heat removal depends on ratio of length to internal diameter (L/D) of the duct [11] with the maximum heat removal obtainable at an L/D of 20 [12]. Passive heat removal in building integrated photovoltaics (BIPV) relies on buoyant circulation of air in an opening or air channel, instead of a duct, behind the PV [13]. A theoretical analysis of buoyancy driven air flow in such an opening behind a façade integrated PV showed a maximum of 5 °C temperature reduction in averaged monthly temperature resulting in a net 2.5% increase in yearly electrical output of the PV [14]. Though the temperature reduction and the associated prevention of power drop is very low in such PV systems, improvements can be made by boosting heat transfer through suspending metal sheets and inserting fins in the air channel and optimizing the channel spacing [15,16].
Active cooling of PV relies on air or water flow on the front or back of the PV surface. The effect of air flow at different inlet velocities and air gaps on front side and back side of PV temperature was modelled and a maximum 34.2 °C temperature decrease was predicted at air inlet velocity of 1 m/s and front and back air gap of 20 mm [17]. Water flow on the front surface of a free standing PV has a decreased cell temperature of up to 22 °C along with decreasing reflection losses from PV surface yielding an 8%–9% increase in electrical power output [18]. Water flow on the back of a façade integrated PV has theoretically shown optimum electrical and thermal performance at a water flow rate of 0.05 kg/s for a particular system in the weather conditions of Hefei, China at solar radiation intensities of 405 and 432 W/m2 [19].
Passive cooling of BIPV with solid-liquid PCMs were experimentally and numerically evaluated using a paraffin wax as PCM and a rectangular aluminum container with internal dimension of (300 mm × 132 mm × 40 mm) having selectively coated front surface with a MAXORB (provided by INCO Selective Surfaces, Hereford, UK) selective solar absorbing film which has radiative properties similar to silicon to mimic a layer of PV cell [20] attached to the surface. Temperature distribution on the front surface and inside the PCM was predicted through 2D and 3D finite volume heat transfer models and were experimentally validated [21,22]. Building on this work, Hasan et al. [23] fabricated and characterized four different heat sinks attached to PV cell to investigate performance of five different types of PCM to find out the optimum PCM and the heat sink for this application. Two PCM, a eutectic mixture of capric acid-palmitic acid, PCM1 and a salt CaCl2·6H2O, PCM2 and an aluminum based heat sink were found promising. In current work larger PV panels with dimensions 771 mm × 665 mm are integrated with in an aluminum heat sink fitted internally with back to back vertical aluminum fins and filled with PCM to form a so called PV-PCM system. The devised system is deployed outdoors in two different climatic conditions, i.e., the cool climate of Ireland and the hot climate of Pakistan, to compare PV-PCM performance.
2. Experimental Set up and Procedure
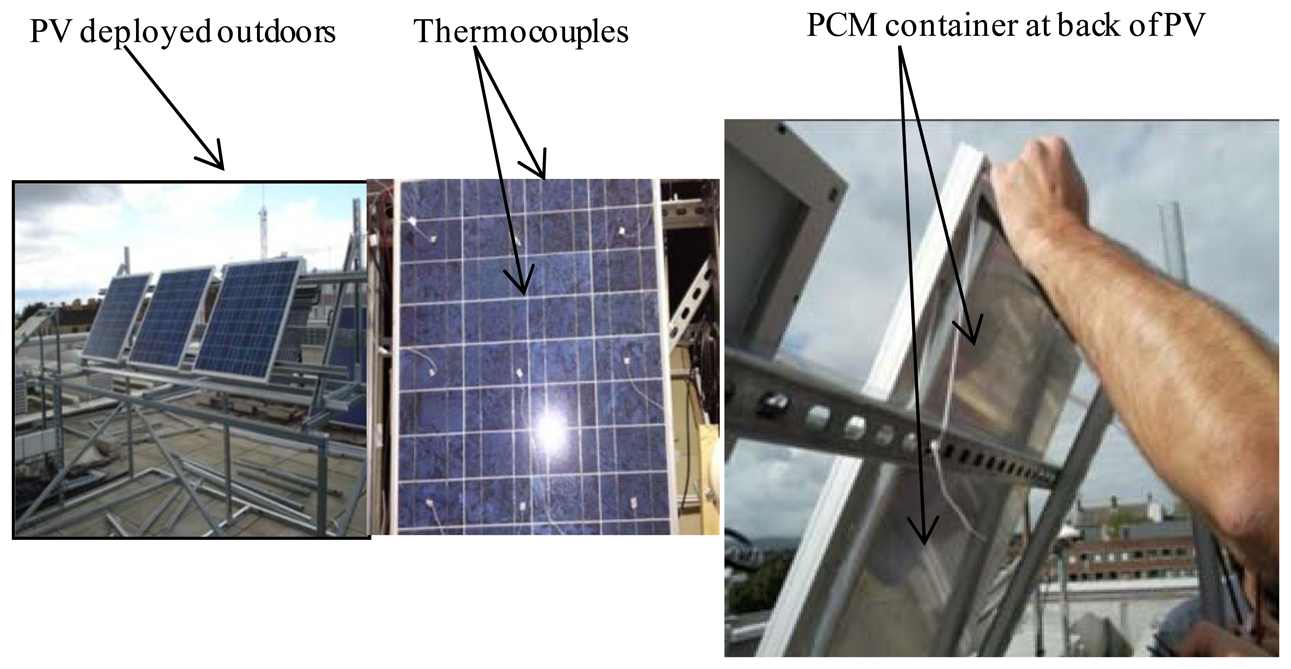
Three 65 W polycrystalline EVA encapsulated PV panels with 771 mm × 665 mm (STP065-12/Sb Suntech, Shanghai, China) were used in the experiments where one served as a reference and the other two were fabricated as PV-PCM shown in Figure 1.
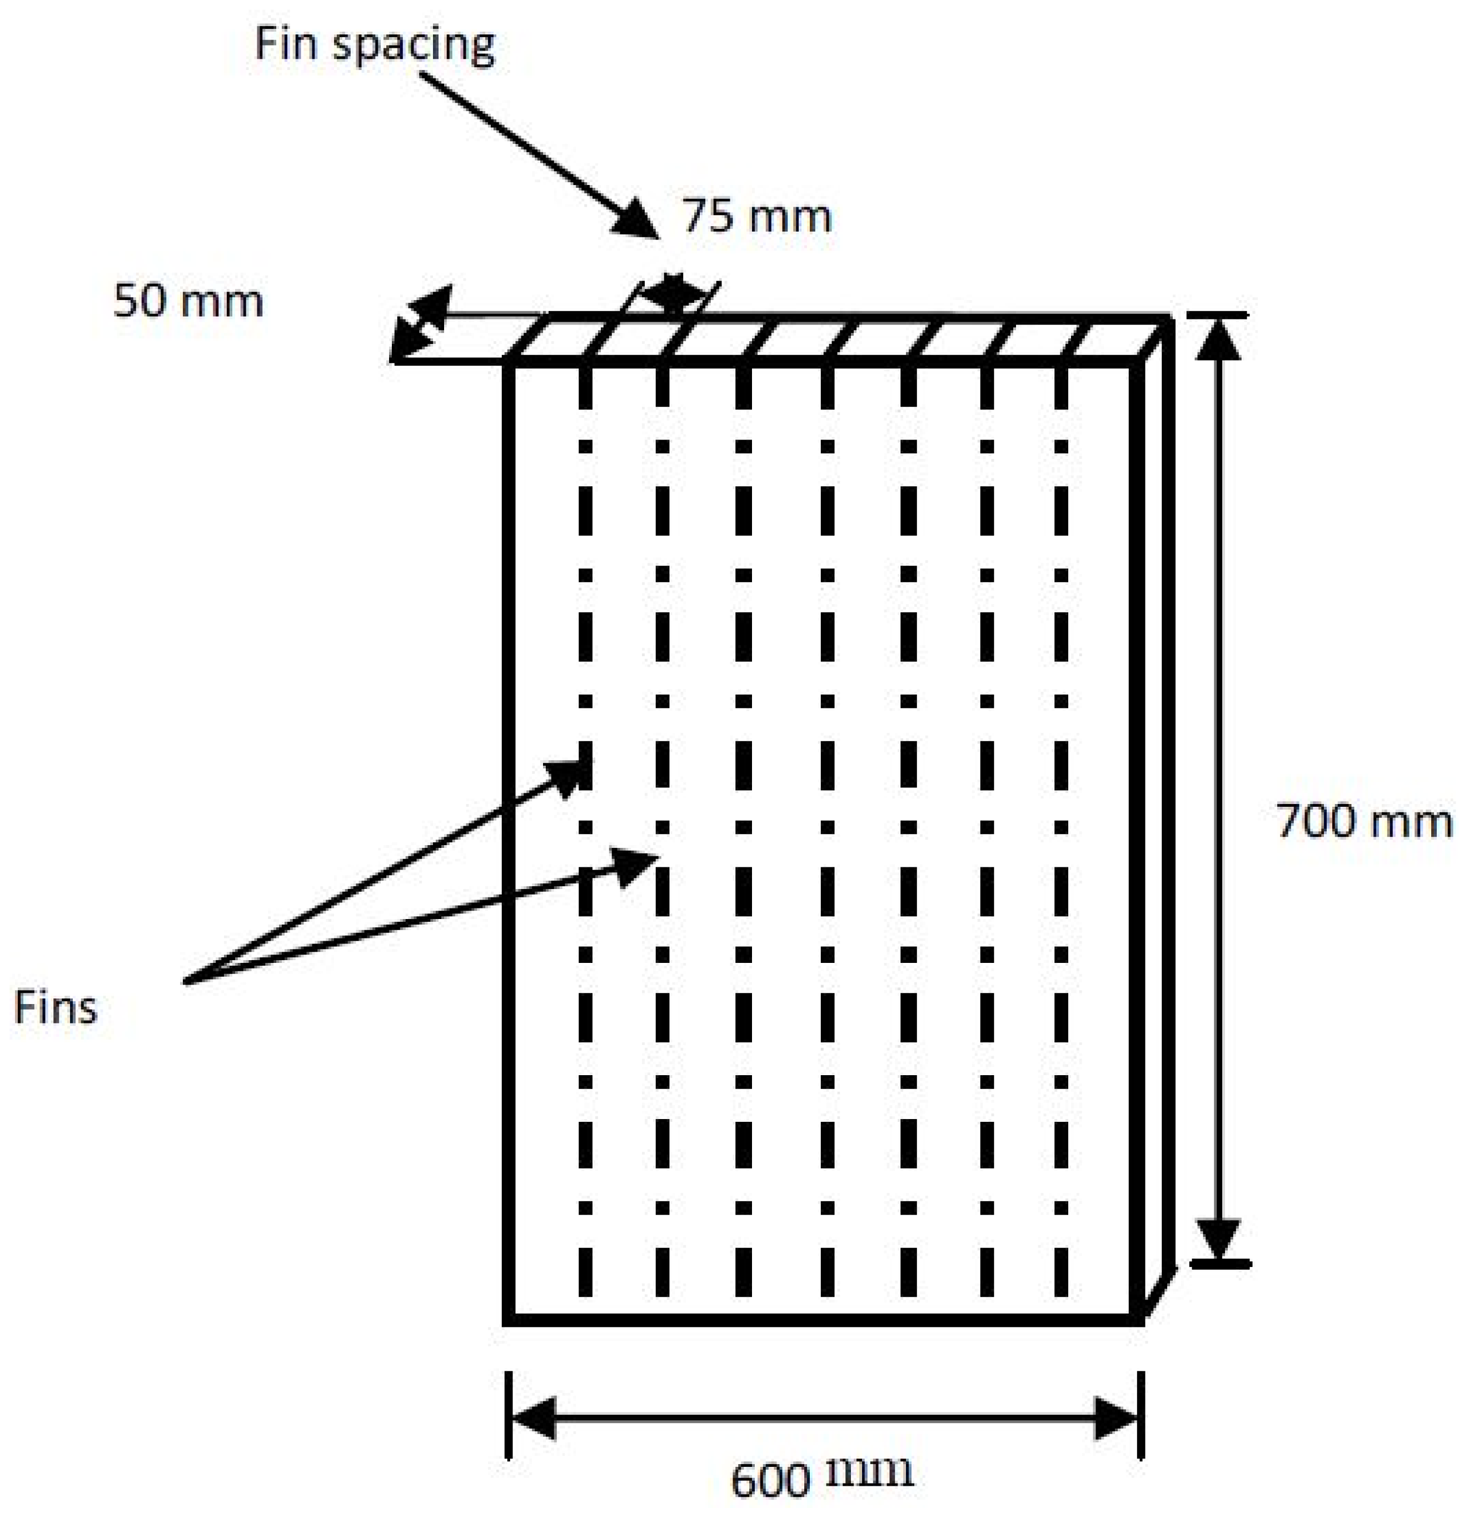
The calibrated t-type copper-constantan thermocouples with a measurement error of ±0.2 °C were installed on all systems at locations shown in the Figure 1 and a delta-T data logger was used to record the measured temperatures. Rectangular PCM containers of internal dimensions 600 mm × 700 mm × 40 mm were fabricated from a 5 mm thickness aluminium alloy (1050A) and fitted with straight vertical back to back fins of the same alloy with 75 mm horizontal spacing between fins as shown in the Figure 2.
Eutectic mixture of capric-palmitic acid, PCM1 from now onwards, was prepared by mixing 75.2% by weight of 98% pure capric acid (Sigma Aldrich, Dublin, Ireland) with 24.8% by weight of 98% pure palmitic acid (Sigma Aldrich) in melted form. The melted mixture was kept constantly heated at 70 °C and stirred for 12 h to get a uniform mixture of the fatty acids. Salt hydrate CaCl2·6H2O, PCM2 from now onwards, was also melted, raised to 70 °C and kept stirred for 12 h to get a uniform solution. The melted PCM were filled in integrated PV-PCM systems keeping 100 mm free space on top to allow for volume changes during melting and solidification. Both the PV-PCM were kept at 16 °C for ∼48 h until all PCM had fully solidified and were ready to be deployed outdoors for latent heat absorption and thermal regulation experiment. The PCMs and their thermo physical properties reported in literature are given in the Table 1.
The reference PV and PV-PCM were connected to multimeters to measure their open circuit voltages and short circuit currents. A CM6B pyranometer (Kipp and Zonen, Delft, The Netherlands) was installed at the latitude angle of both locations to measure the solar radiation intensity and a weather station measured ambient temperature and wind speed.
The reference PV and the two PV-PCM systems were deployed outdoors facing south at the latitude angles in Dublin, Ireland (53.33°N, 6.24°W) and Vehari, Pakistan (30.03°N, 72.25°E). The experiments were conducted from 27 August to 13 September in Dublin and from 30 October to 13 November in Vehari from 09:00 AM to 18:00 PM daily. The temperatures at front and back surfaces, the open circuit voltages (Voc) and short circuit currents (Isc) were measured for the reference PV and the two PV-PCM systems along with weather data of solar radiations, ambient temperatures and wind speeds at both sites.
3. Results and Discussion
3.1. Energy Efficiency Analysis of a PV-PCM System
The PV-PCM system in the current research is considered as a new type of a photovoltaic-thermal systems employing latent heat storage. The energy efficiency of a (PV-T) system can be defined as a ratio of total thermal (available on PV as heat) and electrical energy produced to the total solar energy falling on the PV surface given by Equation (1) [32]. Energy balance of a PV system is given by Equation (1):
Where Qsolar, Qelect, Qlost and Qstored are the solar energy falling on the PV panel, electrical energy output from PV the panel, thermal energy lost from the PV panel and thermal energy stored in the PV panel respectively. The Qsolar is given by Equation (2):
Where G is the global solar radiation intensity incident on the panel, and Apv is the area of the panel and, Δt is the duration of the experiment. Qelect is given by Equation (3):
Where Voc, Isc and FF are the open circuit voltage, short circuit current and fill factor for the panel respectively. At Voc, the current, I = 0 and at Isc the V = 0, which mean the product of Isc and Voc alone does not produce power from PV until multiplied with a factor which converts Isc into Imax (maximum extractable current) and Voc into Vmax ( maximum extractable voltage) called fill factor (FF) and given by Equation (4):
Where Vmax and Imax are the voltage and current respectively corresponding to maximum power point for the PV.
Qlost is obtained by the Equation (5):
Where νw is the wind speed measured at the site. Integration of PCM behind the PV panel stores the thermal energy available on the PV panel which otherwise would have been lost to the ambient. Heat absorption behind the PV panel regulates PV temperature resulting in an increase in PV electrical output. Consequently PV-PCM thermal as well as electrical output is higher than reference PV. Electrical energy efficiency is obtained by dividing electrical energy output by the solar energy incident on the PV given by Equation (8):
In the same way, thermal energy efficiency is obtained by dividing thermal energy stored by the solar energy incident on the PV panel given by Equation (9). Since the quality of thermal energy is not same as of the electrical energy, a conversion efficiency of 30% is used in Equation (9) to convert thermal energy into equivalent electrical energy:
Qsaved is the additional electrical as well as thermal energy saving by inclusion of PCM into PV compared to the reference PV and are calculated to determine the effectiveness of the PV-PCM systems in both climates and is given by Equation (10):
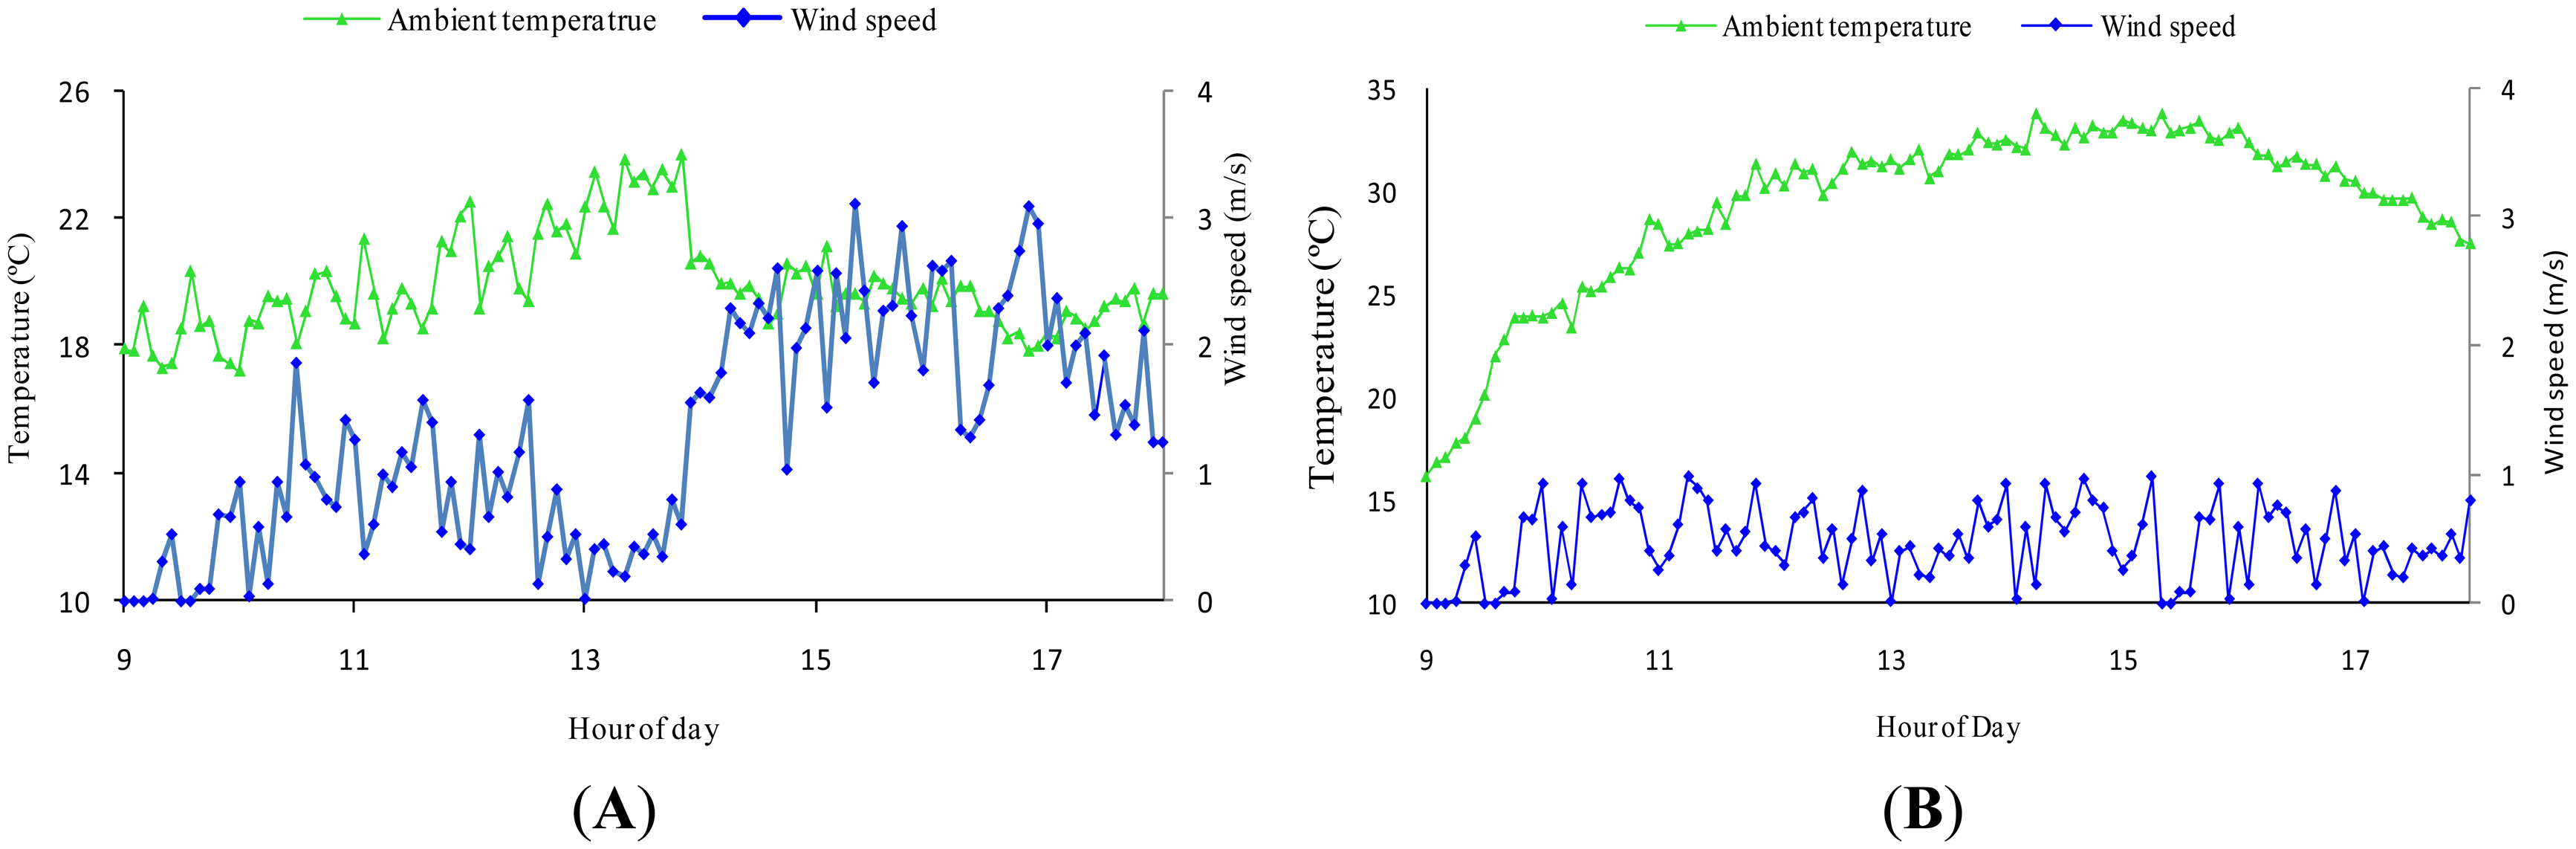
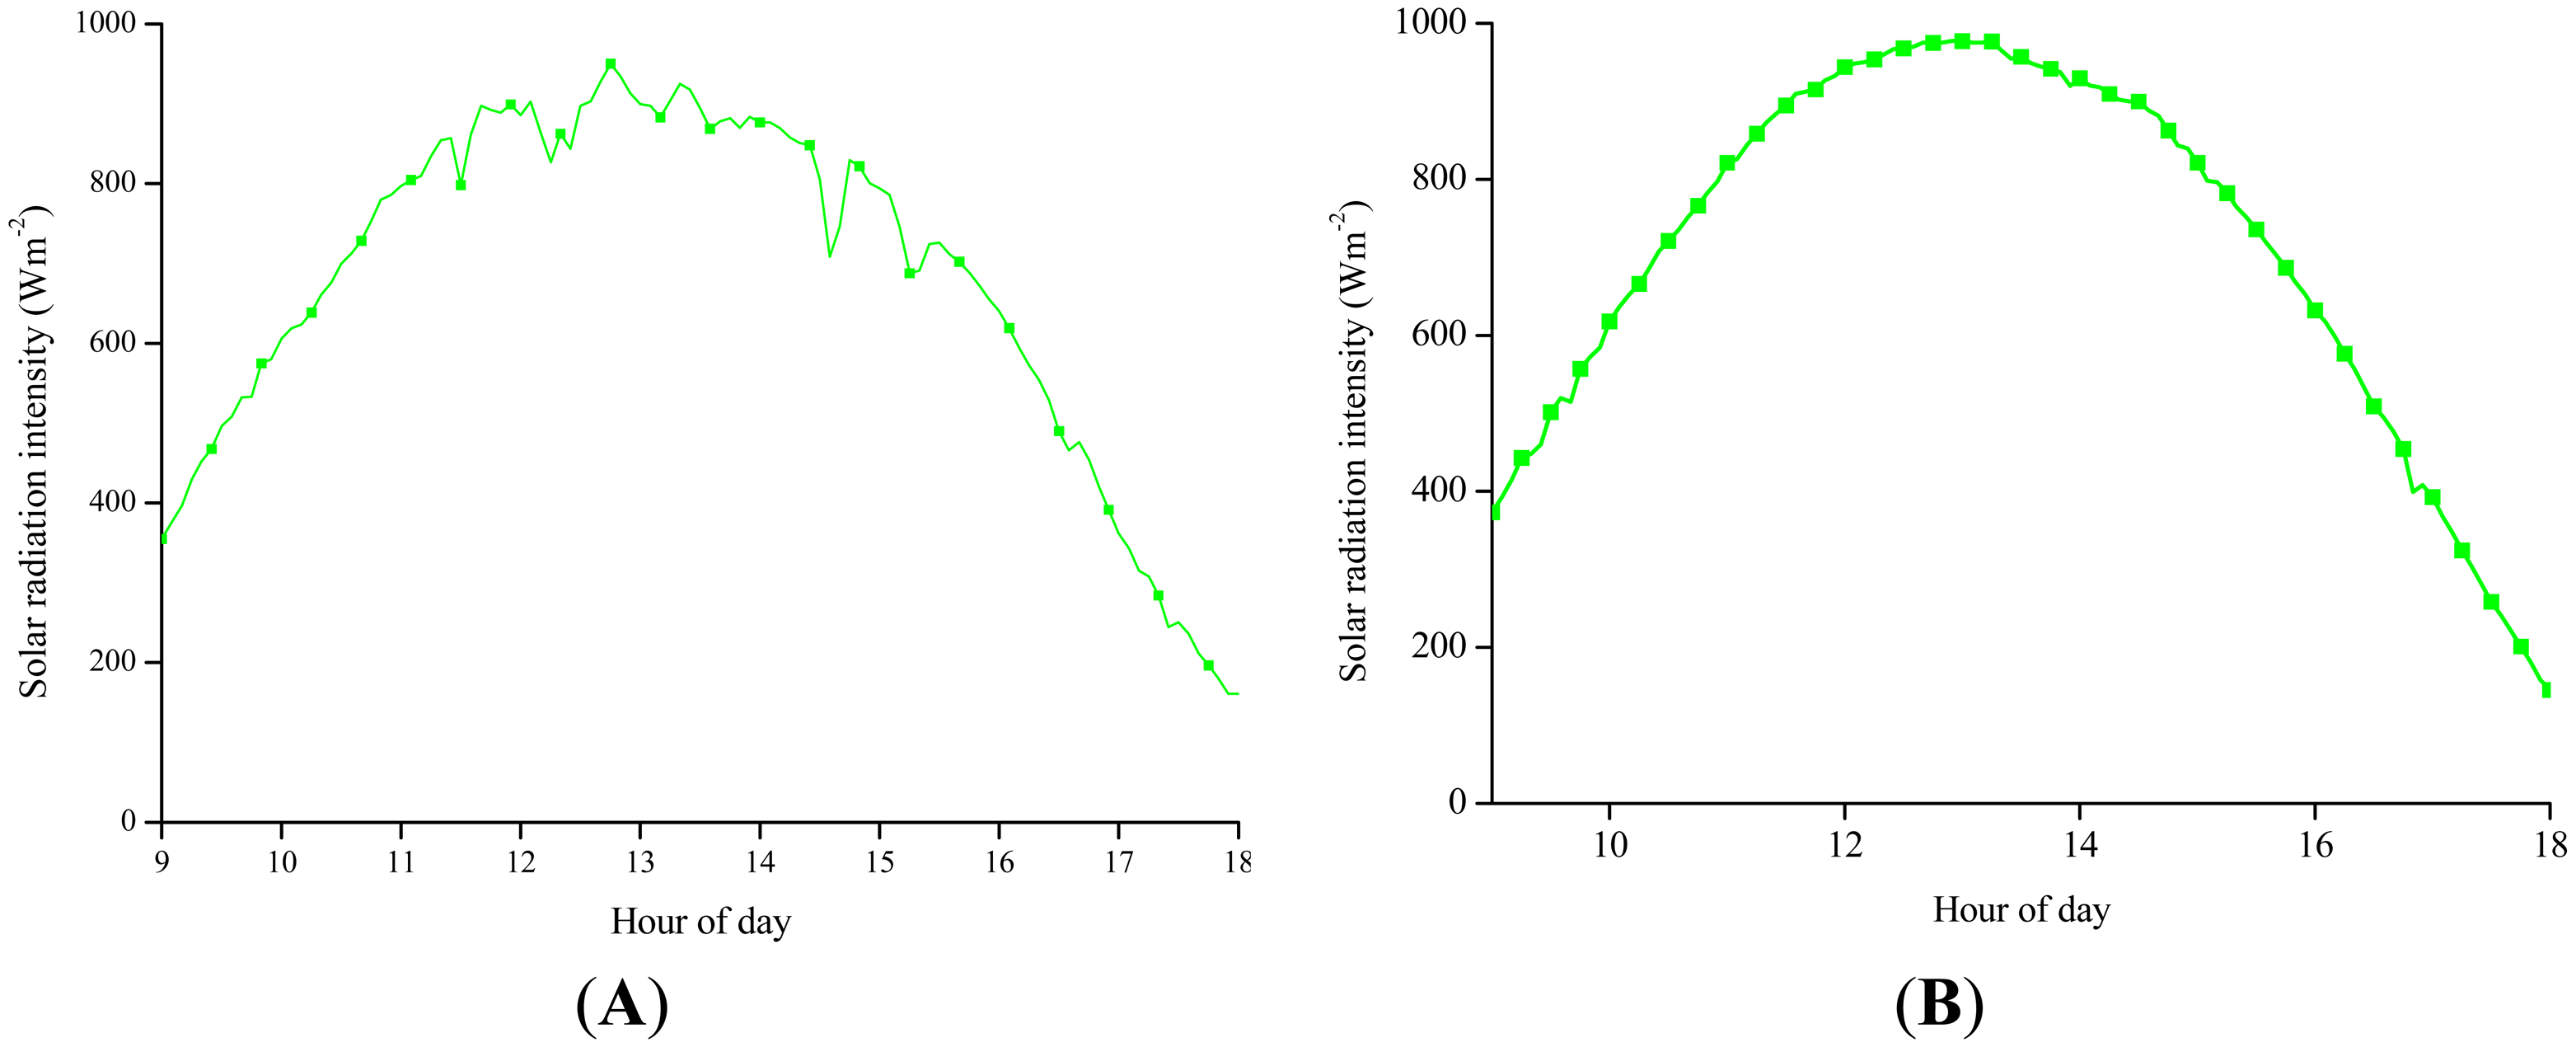
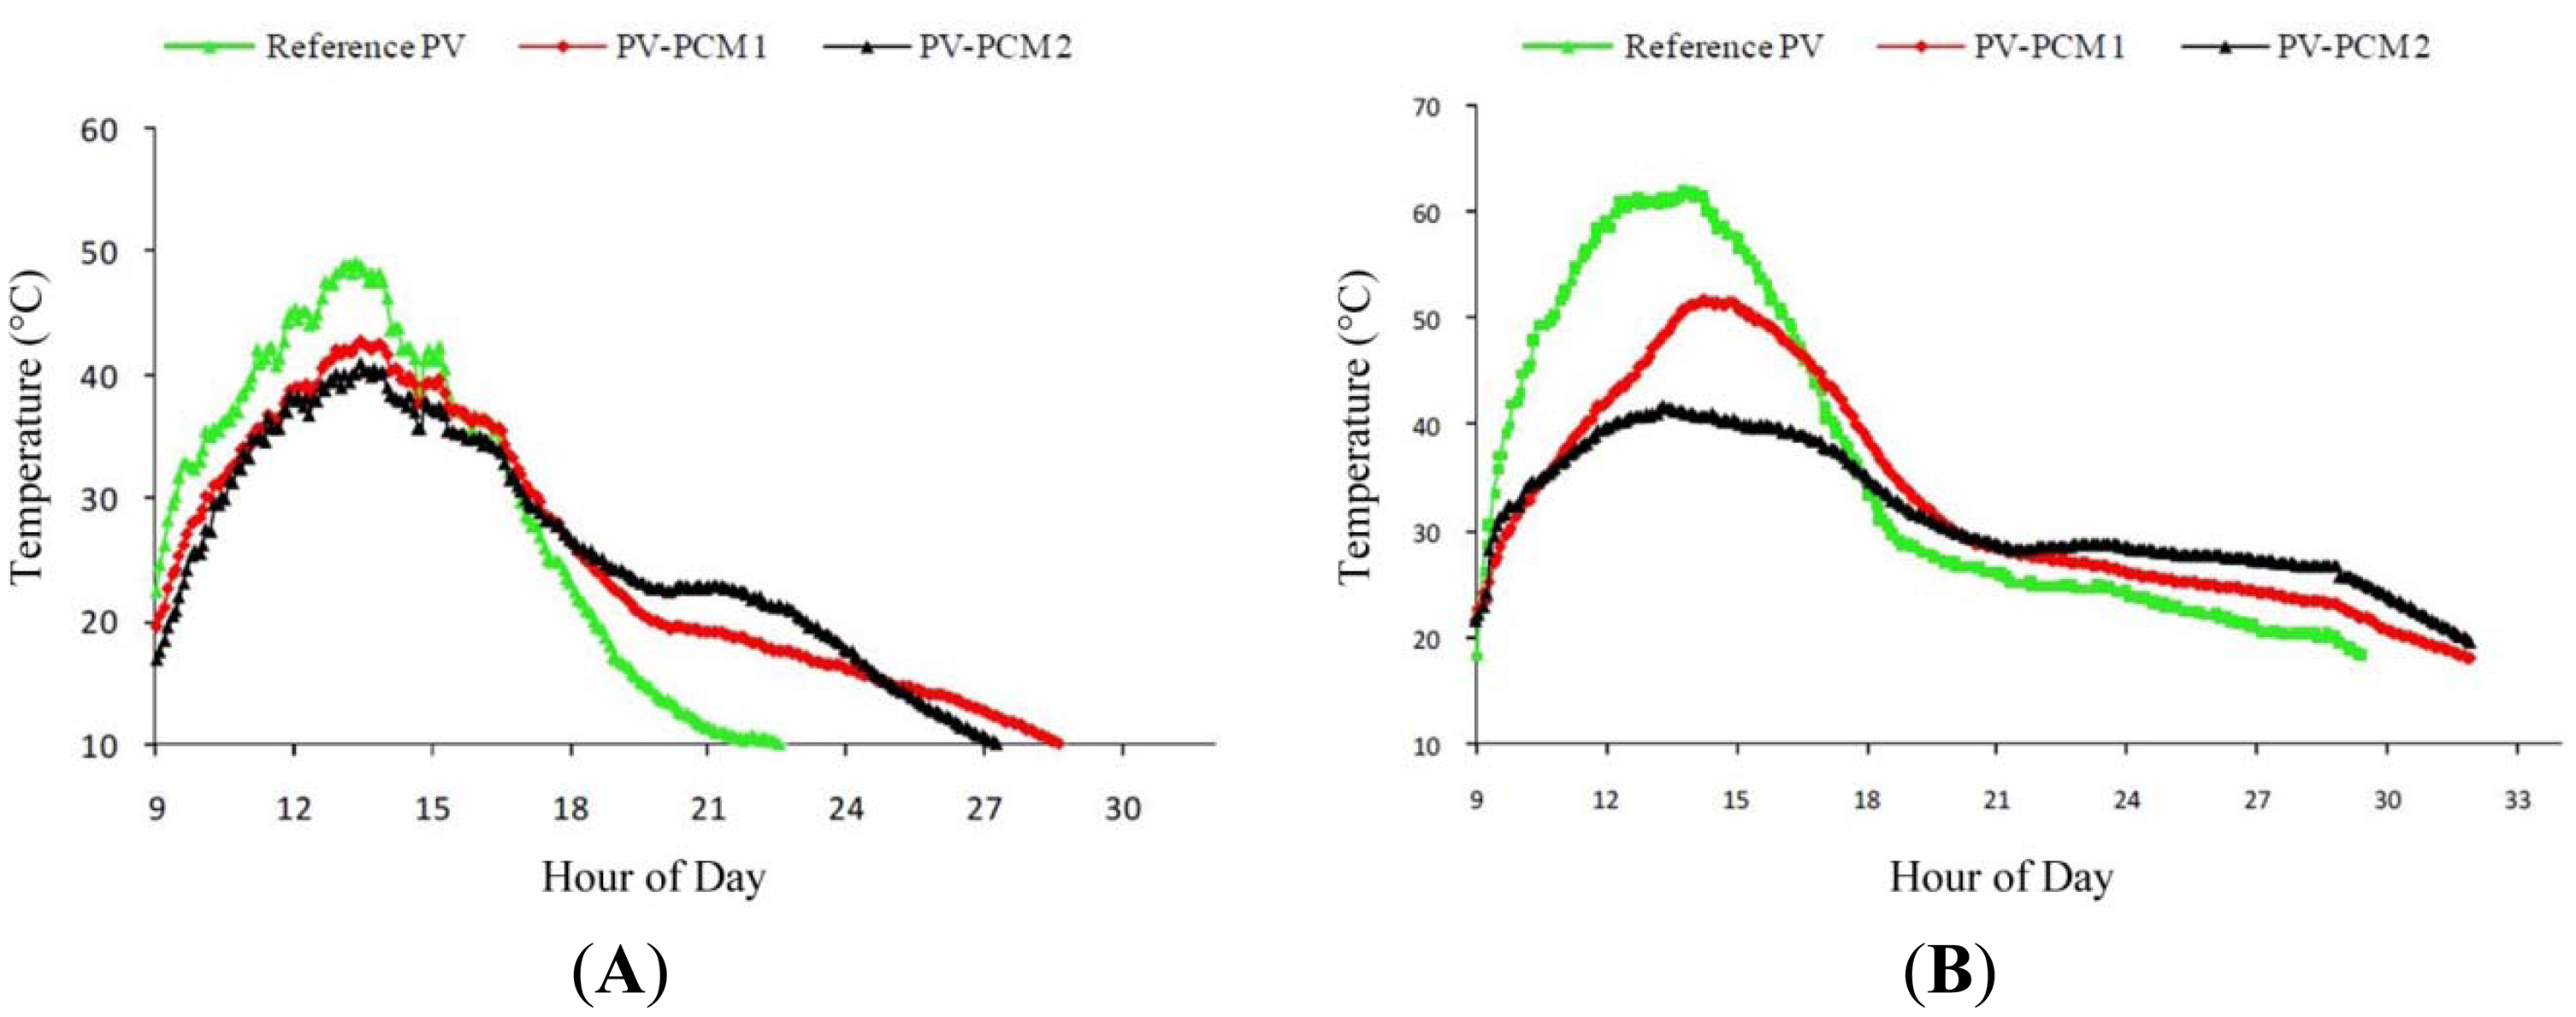
Wind speed (νw) is taken for Dublin, Ireland and Vehari, Pakistan on 12 September and 30 October, respectively shown in Figure 3. The average heat transfer coefficients (hca) were calculated for Ireland and Pakistan using Equation (7) taking average wind speed, νw of 1.22 m/s for Dublin and 0.48 m/s for Vehari respectively (Figure 3). Average hca are 9.93 W/m2·K for Dublin and 7.48 W/m2·K for Vehari. At peak solar radiation intensity of 970 W/m2 for Dublin, Ireland and 950 W/m2 for Vehari, Pakistan at 13:00 PM shown in Figure 4, the reference PV surface temperature in Dublin, Ireland was lower (49 °C) than that in Vehari, Pakistan (63 °C) shown in Figure 5 primarily due to more heat loss from the PV surface in Dublin, Ireland than in Vehari, Pakistan.
The input values used in Equations (1)–(10) were recorded during the experiment summarised in Table 2. Using Equations (8) and (9) energy efficiencies, ηelect and ηtherm were calculated for reference PV, PV-PCM1and PV-PCM2 for Dublin, Ireland and Vehari, Pakistan and are presented in Table 4.
3.2. Cost Incurred in Fabricating PV-PCM Systems
Crystalline silicon photovoltaic (PV) cells have currently a 90% share of the PV market [35]. As global silicon PV module manufacturing capacity has increased, average manufacturing costs have decreased from US$6/Wp (where Wp is peak power in watts) in 1992 to US$2.75/Wp in 2005 [36], with the rate of reduction being greatest in the period 1992–2000. The reduction in average costs slowed significantly after 2000 when the cost per Wp was already as low as $2.75 Wp equivalent to €2.03 Wp. A recent study has shown that actual costs of installed PV systems are $6.5/Wp in USA equivalent to €4.8/Wp [37]. In the next 20 years, total costs Wp of “1st generation” silicon PV technologies are predicted to fall by less than 30% [35]. This indicates that PV production costs are not expected to decrease enough in the near future so these costs will be used for cost and benefit comparison.
Total cost associated with the PV-PCM systems is derived from (i) cost of the PCM; (ii) cost of the containment materials; (iii) manufacturing cost of the container. Each of the cost is then further divided into the cost of materials when purchased in kilograms for the experiment and the cost of the materials when purchased in tonnes of the materials. Cost of the materials was €30/kg for PCM1 and €22/kg for PCM2 respectively when purchased in smaller quantities [38]. The cost is projected to reduce to €2.5/kg for PCM1 and €1.9/kg for PCM2 when purchased in tonnes [39]. 12 kg of PCM1 and 19 kg of PCM2 were consumed to make the PV-PCM1 and PV-PCM2 respectively. So the total cost of the PCM incurred was €360 and €418 when purchased in smaller quantities from local suppliers which is projected to reduce to €30 and €36 when purchased in larger quantities for PCM1 and PCM2 respectively.
The amount of aluminium alloy used to fabricate each PV-PCM system was 13 kg costing €3.8/kg when purchased from Pakistan and €5.6/kg when purchased from Ireland in smaller quantities. The cost of aluminium is €1.71/kg [26] for Asian market and €2.5/kg [40] for European market when purchased in tonnes. Total cost of aluminium is €74 when purchased for single PV-PCM system which drops to €32.5 when purchased for mass production of PV-PCM systems in Ireland. The cost of aluminium is €49.4 when purchased in smaller quantities to fabricate PV-PCM system and €22.2 when purchased for mass production of such PV-PCM systems in Pakistan. Cost of fabrication was €300 for Ireland and €40 for Pakistan for each PV-PCM system. If the production cost of mass produced systems decreases by a factor of 10 which is normal [41] then the manufacturing cost are expected to be €4 for Pakistan and €30 for Ireland. The PV-PCM containments may experience corrosion with certain PCM and would need a protective coating, the issue will be addressed in a future work with measured corrosion rates and corrosion protective coating materials while at this stage costs for corrosion protection is ignored. The above mentioned costs are presented in Table 3.
In the most simple cost analysis, cost incurred on the PV-PCM systems to regulate PV temperature is compared with the benefit obtained through combined electrical and equivalent thermal gain due to thermal energy storage and temperature drop in the panel. It can be observed that the cost incurred in Ireland on the production of PV-PCM systems was €734 for PV-PCM1 and €792 for PV-PCM2 produced as single system which is expected to drop to €92 for PV-PCM1 and €98 for PV-PCM2 when mass produced. Similarly the cost incurred on the production of single PV-PCM system in Pakistan was €413 for PV-PCM1 and €471 for PV-PCM2 and is expected to drop to €56 for PV-PCM1 and €62 for PV-PCM2 for mass production. Since the rated power of PV is 65 Wp so the additional cost incurred due to integration of PCM into PV for mass produced PV-PCM systems in Ireland is €1.41/Wp for PV-PCM1 and €1.50/Wp for PV-PCM2. Similarly the cost involved in mass produced PV-PCM systems in Pakistan is €0.86/Wp for PV-PCM1 and €0.95/Wp for PV-PCM2.
3.3. Financial Benefits of the Proposed PV-PCM Systems
Thermal energy stored is converted to equivalent electrical energy by considering 30% conversion efficiency and is added to electrical energy gain to obtain total energy gain shown in Table 4.
The total energy gain in Dublin was found to be 10.7 W and 15.8 W for PV-PCM1and PV-PCM2 respectively. The financial benefit is calculated by cost saving by multiplying cost per watt of PV (i.e., €4.81/W) to the total energy by PV-PCM system. In Ireland the financial benefit thus obtained are €51.5 and €76 for PV-PCM1 and PV-PCM2 respectively while cost incurred to mass produce such systems in Ireland was €92 and €98 being higher than the benefit of PV-PCM1 and PV-PCM2 respectively showing that such systems are not cost effective in Ireland.
Following same method the total energy gain in Vehari, Pakistan was 22 W and 33.7 W for PV-PCM1 and PV-PCM2 respectively which brings the financial benefit of €105.8 and €162 for PV-PCM1 and PV-PCM2 respectively. Compared to the cost incurred to mass produce PV-PCM1 and PV-PCM2 being €56 and €62, the benefit are almost two times higher which shows these systems are cost effective in climatic conditions of Pakistan.
4. Conclusions
The energy and economic analysis of the PV-PCM systems shows that in Ireland, the financial benefit of both PV-PCM systems lesser than the cost incurred to mass produce such systems confirming that such systems are not cost effective in Ireland. However cost of the PV-PCM systems is almost half of the benefit in Pakistan which shows such systems are cost effective in such climates and encourages the possibility of future research to improve performance to make them more effective. Additionally in the current analysis thermal energy stored in PCM is converted to equivalent electrical energy with a very low efficiency which limits the benefit of thermal energy which can be improved in future by a better heat exchanger design and using thermal energy directly for heating. Besides considering increased PV life due to reduced operating temperature and increased power density for building integrated PV which saves crucial space requirements in urban context were not considered in this analysis. Considering all above stated aspects the PV-PCM systems are expected to be attractive systems in hot climate like Pakistan.
Acknowledgments
This work has been supported by the Higher Education Authority through Strand 1 and Strand 3 funding, Science Foundation Ireland through their Research Frontiers Program and the Research Support Unit at Dublin Institute of Technology. The authors also acknowledge the technical and financial assistance provided by COST (European Cooperation in Science and Technology) through action TU0802: Next generation cost effective phase change materials for increased energy efficiency in renewable energy systems in buildings
Conflicts of Interest
The authors declare no conflict of interest.
References
- Radziemska, E. The effect of temperature on the power drop in crystalline silicon solar cell. Renew. Energy 2003, 28, 1–12. [Google Scholar]
- Radziemska, E.; Klugmann, E. Thermally affected parameters of the current-voltage characteristics of silicon photocell. Energy Convers. Manag. 2002, 43, 1889–1900. [Google Scholar]
- Makrides, G.; Zinsser, B.G.; George, E.; Schubert, M.; Werner, J.H. Temperature behaviour of different photovoltaic systems installed in Cyprus and Germany. Solar Energy Mater. Solar Cells 2009, 93, 1095–1099. [Google Scholar]
- Skoplaki, E.; Palyvos, J.A. Operating temperature of photovoltaic modules: A survey of pertinent correlations. Renew. Energy 2009, 34, 23–29. [Google Scholar]
- Bücher, K. Site dependence of the energy collection of PV modules. Solar Energy Mater. Solar Cells 1999, 47, 85–94. [Google Scholar]
- Breteque, A.E. Thermal aspects of C-Si photovoltaic module energy rating. Solar Energy 2009, 83, 1425–1433. [Google Scholar]
- Nassar, Y.F.; Salem, A.A. The reliability of the photovoltaic utilization in southern cities of Libya. Desalination 2007, 209, 86–90. [Google Scholar]
- Suntech STP065-12/Sb 65 Watts 12V Polycrystalline Solar Panel. Available online: http://www.arcmansolar.com/products/53.aspx?cid=7-12-11 (accessed on 23 October 2013).
- Saly, V.; Ruzinsky, M.; Redi, P. Indoor study and ageing tests of solar cells and encapsulations of experimental modules. Proceedings of the 24th International Spring Seminar on Electronics Technology: Concurrent Engineering in Electronic Packaging, Calimanesti-Caciulata, Romania, 5–9 May 2001.
- Brinkworth, B.J. Estimation of flow and heat transfer for the design of PV cooling duct. Solar Energy 2000, 69, 413–420. [Google Scholar]
- Brinkworth, B.J. A procedure for the routine calculation of laminar free and mixed convection in inclined ducts. Int. J. Heat Fluid Flow 2000, 21, 456–462. [Google Scholar]
- Brinkworth, B.J.; Sandberg, M. Design procedure for cooling ducts to minimise efficiency loss due to temperature rise in PV arrays. Solar Energy 2006, 80, 89–103. [Google Scholar]
- Gan, G.; Riffat, S.B. CFD modelling of air flow and thermal performance of an atrium integrated with photovoltaics. Build. Environ. 2004, 39, 735–748. [Google Scholar]
- Yun, G.Y.; McEvoy, M.; Steemers, K. Design and overall energy performance of a ventilated photovoltaic façade. Solar Energy 2007, 81, 383–394. [Google Scholar]
- Tonui, J.K.; Tripanagnostopoulos, Y. Air-cooled PV/T solar collectors with low cost performance improvements. Solar Energy 2007, 81, 498–511. [Google Scholar]
- Fossa, M.; Ménézo, C.; Leonardi, E. Experimental natural convection on vertical surfaces for building integrated photovoltaic (BIPV) applications. Exp. Therm. Fluid Sci. 2008, 32, 980–990. [Google Scholar]
- Mallick, T.K.; Eames, P.C.; Norton, B. Using air flow to alleviate temperature elevation in solar cells within asymmetric compound parabolic concentrator. Solar Energy 2007, 81, 173–184. [Google Scholar]
- Krauter, S. Increased electrical yield via water flow over the front of photovoltaic panels. Solar Energy Mater. Solar Cells 2004, 82, 131–137. [Google Scholar]
- Ji, J.; Han, J.; Chow, T.; Yi, H.; Lu, J.; He, W.; Sun, W. Effect of fluid flow and packing factor on energy performance of a wall-mounted hybrid photovoltaic/water-heating collector system. Energy Build. 2006, 38, 1380–1387. [Google Scholar]
- Huang, M.J.; Eames, P.C.; Norton, B. Thermal regulation of building-integrated photovoltaics using phase change materials. Int. J. Heat Mass Trans. 2004, 47, 2715–2733. [Google Scholar]
- Huang, M.J.; Eames, P.C.; Norton, B. Phase change materials for limiting temperature rise in building integrated photovoltaics. Solar Energy 2006, 80, 1121–1130. [Google Scholar]
- Huang, M.J.; Eames, P.C.; Norton, B. Comparison of a small-scale 3D PCM thermal control model with a validated 2D PCM thermal control model. Solar Energy Mater. Solar Cells 2006, 90, 1961–1972. [Google Scholar]
- Hasan, A.; McCormack, S.J.; Huang, M.J.; Norton, B. Evaluation of phase change materials for thermal regulation enhancement of building integrated photovoltaics. Solar Energy 2010, 84, 1601–1612. [Google Scholar]
- Sari, A.; Karaipekli, A. Preparation and thermal properties of capric acid/palmitic acid eutectic mixture as a phase change energy storage material. Mater. Lett. 2008, 62, 903–906. [Google Scholar]
- Tyagi, V.V.; Buddhi, D. Thermal cycle testing of calcium chloride hexahydrate as a possible PCM for latent heat storage. Solar Energy Mater. Solar Cells 2008, 92, 891–899. [Google Scholar]
- Commodity Online (2013). Available online: www.commodityonline.com/commodities/metals/1.html (accessed on 23 October 2013).
- Sharma, S.D.; Sagara, K. Latent heat storage materials and systems: A review. Int. J. Green Energy 2005, 2, 1–56. [Google Scholar]
- Sari, A.; Kaygusuz, K. Thermal performance of a eutectic mixture of lauric and stearic acids as PCM encapsulated in the annulus of two concentric pipes. Solar Energy 2002, 72, 493–504. [Google Scholar]
- Sedat, K.; Kamil, K.; Ahmet, S. Lauric and myristic acids eutectic mixture as phase change material for low-temperature heating applications. Int. J. Energy Res. 2005, 29, 857–870. [Google Scholar]
- El-Sebaii, A.A.; Al-Amir, S.; Al-Marzouki, F.M.; Faidah, A.S.; Al-Ghamdi, A.A.; Al-Heniti, S. Fast thermal cycling of acetanilide and magnesium chloride hexahydrate for indoor solar cooking. Energy Convers. Manag. 2009, 50, 3104–3111. [Google Scholar]
- Cabeza, L.F.; Roca, J.; Nogués, M.; Mehling, H.; Hiebler, S. Immersion corrosion tests on metal-salt hydrate pairs used for latent heat storage in the 48 to 58 °C temperature range. Mater. Corros. 2002, 53, 902–907. [Google Scholar]
- Joshi, A.S.; Dincer, I.; Reddy, B.V. Thermodynamic assessment of photovoltaic systems. Solar Energy 2009, 83, 1139–1149. [Google Scholar]
- Tiwari, G.N. Solar Energy: Fundamentals, Design, Modelling and Applications; New Delhi and CRC Press: Washington, DC, USA, 2002. [Google Scholar]
- Tiwari, A.; Sodha, M.S. Performance evaluation of solar PV/T system: An experimental validation. Solar Energy 2006, 80, 751–759. [Google Scholar]
- Bagnall, M.D. Photovoltaic technologies. Energy Policy 2008, 36, 4390–4396. [Google Scholar]
- Margolis, R.; Mitchell, R.; Zweibel, K. Lessons Learned from the Photovoltaic Manufacturing Technology/PV Manufacturing R&D and Thin-Film PV Partnership Projects; National Renewable Energy Laboratory: Golden, CO, USA, 2006. [Google Scholar]
- Installed Cost of Solar Photovoltaic Systems in United States Fell in 2008. Available online: http://www.sciencedaily.com/releases/2009/10/091021144249.htm (accessed on 23 October 2013).
- Sigma Aldrich (2013). Available online: http://www.sigmaaldrich.com (accessed on 23 October 2013).
- ICIS Pricing (2013). Available online: http://www.icispricing.com (accessed on 23 October 2013).
- London Metal Exchange. Available online: http://www.lme.com (accessed on 23 October 2013).
- KSB Pakistan. Available online: http://www.ksb.com.pk/products.htm (accessed on 23 October 2013).
Nomenclature
| FF | Fill factor |
| PCM | Phase change materials |
| PV | Photovoltaics |
| STC | Standard test conditions |
| APV | PV area exposed to solar radiation (m2) |
| APV-PCM | PV-PCM area exposed to solar radiation (m2) |
| G | Global solar radiation intensity (Wm2) |
| hca | Combined convective and radiative heat loss coefficient (Wm2K) |
| Isc | Short circuit current (Amp) |
| IscPV | Short circuit current of PV |
| Imax | Maximum current at STC |
| Qlost-PV | Heat released to ambient by PV (Wh) |
| Qlost-PV-PCM | Heat released to ambient by PV-PCM (Wh) |
| Qstored | Heat stored in PV-PCM system (Wh) |
| Qsaved | Amount of energy saved in PV by inclusion of PCM in PV |
| Tamb | Ambient temperature (°C) |
| TPV | PV temperature (°C) |
| TPV-PCM | PV-PCM temperature (°C) |
| νw | Wind speed (ms) |
| Voc | Open circuit voltage (volts) |
| VocPV | Open circuit voltage of the PV |
| Vmax | Voltage at maximum power point (volts) |
| ηelect | Electrical energy efficiency |
| ηtherm | Thermal energy efficiency |
| α | Absorptance of the PV surface |
| τ | Transmittance of the PV cover surface |


| Thermophysical properties | Eutectic of capric-palmitic acid (PCM1) | Calcium chloride hexahydrate CaCl2 ·6H2O (PCM2) | |
|---|---|---|---|
| Melting point, (°C) | 22.5 [24] | 29.8 [25] | |
| Heat of fusion (kJ·kg−1) | 173 [24] | 191 [25] | |
| Thermal conductivity (W·m−1·°C−1) | Solid | 0.14 [24] | 1.08 [26] |
| Liquid | 0.14 [27] | 0.56 [26] | |
| Density (kg·dm−3) | Solid | 0.87 [24] | 1.71 [25] |
| Liquid | 0.79 [24] | 1.56 [25] | |
| Specific heat capacity (kJ·kg−1·K−1) | Solid | 2 [28] | 1.4 [25] |
| Liquid | 2.3[28] | 2.1b [25] | |
| Kinematic viscosity (m2·s−1 × 10⁻³) | 0.0023 [24] | 1.84 [28] | |
| Thermal expansion coefficient (K−1) | 0.00078 [24] | 0.0005 [28] | |
| Thermal cyclic stability | Yes [29] | Yes [25], No [30] | |
| Corrosion to metals | Yes [31] | Yes [31] | |
| Chemical classification | Fatty Acid | Salt Hydrate | |
| Material source | Sigma Aldrich | Sigma Aldrich | |
| Measured Data | Time | Reference PV | PV-PCM1 | PV-PCM2 | |||
|---|---|---|---|---|---|---|---|
| Dublin | Vehari | Dublin | Vehari | Dublin | Vehari | ||
| Insolation G (W·m−2) | At peak | 970 | 950 | 970 | 950 | 970 | 950 |
| Average | 674 | 660 | 674 | 660 | 674 | 660 | |
| Temperature (°C) | At peak | 49 | 63 | 43 | 51 | 40 | 42 |
| Temperature Regulation (°C) | At peak | – | – | 7 | 17 | 10 | 21 |
| Fill Factor (%) | Average | – | 69.64 | 72.82 | 71.26 | 73.22 | 72.24 |
| Voc (V) | At peak | 20.1 | 18.32 | 20.81 | 19.71 | 20.95 | 20.15 |
| Average | 20.41 | 18.72 | 20.52 | 19.42 | 20.81 | 19.92 | |
| Isc (Amp) | At peak | 3.74 | 3.42 | 3.70 | 3.35 | 3.68 | 3.33 |
| Average | 2.82 | 2.45 | 2.77 | 2.41 | 2.78 | 2.39 | |
| Country | Cost type | Single fabricated PV-PCM system [Cost (€)] | Mass produced PV-PCM system [Cost (€)] | ||
|---|---|---|---|---|---|
| PV-PCM1 | PV-PCM2 | PV-PCM1 | PV-PCM2 | ||
| Ireland | PCM | 360 | 418 | 30 | 36 |
| Aluminium | 74 | 74 | 32 | 32 | |
| Manufacturing | 300 | 300 | 30 | 30 | |
| Net cost | 734 | 792 | 92 | 98 | |
| Pakistan | PCM | 360 | 418 | 30 | 36 |
| Aluminium | 49 | 49 | 22 | 22 | |
| Manufacturing | 4 | 4 | 4 | 4 | |
| Net Cost | 413 | 471 | 56 | 62 | |
| Measured Results | Ireland | Pakistan | |||
|---|---|---|---|---|---|
| Incident Solar Energy, Qsolar, GAPV(W) | 333 | 328.5 | |||
| Average electrical energy (W) | PV | Qelect | 33.4 | 43 | |
| Qsaved | 0 | 0 | |||
| PV-PCM1 | Qelect | 35.7 | 45.8 | ||
| Qsaved | 2.3 | 2.8 | |||
| PV-PCM2 | Qelect | 36.5 | 47.5 | ||
| Qsaved | 3.1 | 4.5 | |||
| average heat lost (W) | PV | 179.5 | 160.8 | ||
| PV-PCM1 | 149.3 | 94 | |||
| PV-PCM2 | 134 | 59 | |||
| Thermal Energy (W) | PV | Qstored | 120.1 | 124.7 | |
| Qsaved | 0 | 0 | |||
| PV-PCM1 | Qstored | 148 | 188.7 | ||
| Qsaved | 27.9 | 64 | |||
| PV-PCM2 | Qstored | 162.5 | 222 | ||
| Qsaved | 42.4 | 97.3 | |||
| Average energy efficiency (%) | PV | ηelect | 10 | 13.1 | |
| ηtherm | 10 .8 | 11.4 | |||
| PV-PCM1 | ηelect | 10.7 | 13.9 | ||
| ηtherm | 13.3 | 17.2 | |||
| PV-PCM2 | ηelect | 11 | 14.5 | ||
| ηtherm | 14.6 | 20.3 | |||
© 2014 by the authors; licensee MDPI, Basel, Switzerland. This article is an open access article distributed under the terms and conditions of the Creative Commons Attribution license ( http://creativecommons.org/licenses/by/3.0/).
Share and Cite
Hasan, A.; McCormack, S.J.; Huang, M.J.; Norton, B. Energy and Cost Saving of a Photovoltaic-Phase Change Materials (PV-PCM) System through Temperature Regulation and Performance Enhancement of Photovoltaics. Energies 2014, 7, 1318-1331. https://doi.org/10.3390/en7031318
Hasan A, McCormack SJ, Huang MJ, Norton B. Energy and Cost Saving of a Photovoltaic-Phase Change Materials (PV-PCM) System through Temperature Regulation and Performance Enhancement of Photovoltaics. Energies. 2014; 7(3):1318-1331. https://doi.org/10.3390/en7031318
Chicago/Turabian StyleHasan, Ahmad, Sarah Josephine McCormack, Ming Jun Huang, and Brian Norton. 2014. "Energy and Cost Saving of a Photovoltaic-Phase Change Materials (PV-PCM) System through Temperature Regulation and Performance Enhancement of Photovoltaics" Energies 7, no. 3: 1318-1331. https://doi.org/10.3390/en7031318