Extended Distributed State Estimation: A Detection Method against Tolerable False Data Injection Attacks in Smart Grids

Abstract
: False data injection (FDI) is considered to be one of the most dangerous cyber-attacks in smart grids, as it may lead to energy theft from end users, false dispatch in the distribution process, and device breakdown during power generation. In this paper, a novel kind of FDI attack, named tolerable false data injection (TFDI), is constructed. Such attacks exploit the traditional detector's tolerance of observation errors to bypass the traditional bad data detection. Then, a method based on extended distributed state estimation (EDSE) is proposed to detect TFDI in smart grids. The smart grid is decomposed into several subsystems, exploiting graph partition algorithms. Each subsystem is extended outward to include the adjacent buses and tie lines, and generate the extended subsystem. The Chi-squares test is applied to detect the false data in each extended subsystem. Through decomposition, the false data stands out distinctively from normal observation errors and the detection sensitivity is increased. Extensive TFDI attack cases are simulated in the Institute of Electrical and Electronics Engineers (IEEE) 14-, 39-, 118- and 300-bus systems. Simulation results show that the detection precision of the EDSE-based method is much higher than that of the traditional method, while the proposed method significantly reduces the associated computational costs.1. Introduction
In smart grids, information techniques are applied to provide a desirable infrastructure for real-time measurement, transmission, decision and control. For this purpose many sensors are deployed across millions of buildings and streets. They are connected to the information network, raising the issue of how to protect the system against false data injection (FDI) attacks, which are launched by hijacking and tampering with communication, or illegal access and control of electrical devices [1]. Moreover, FDI attacks are quite attractive to hackers, since the data in smart grid can be easily monetized (e.g., hackers can manipulate their energy costs by modifying the smart meter readings). The false data may also mislead the control center to take erroneous actions, which can be extremely dangerous for smart grids.
Power system state estimation (SE) has been believed to be a good solution to process the bad data, since the pioneering work of Schweppe in 1970 [2]. It is applied in supervisory control and data acquisition (SCADA) systems to reduce the observation errors, detect bad data and estimate the electrical states of power systems through processing the set of real-time redundant measurements, typically bus voltage magnitudes and phase angles.
It is believed the bad data detection methods, such as energy conservation test, the Chi-squares test and normalized residuals test [3], can protect the smart grids against the FDI attacks. While relatively effective against random noises, these detectors lack the ability to detect specialized and highly structured false data that conforms to the network topology and some particular physical laws. Recent works [4–10] have demonstrated that an adversary, armed with knowledge about the network's configuration, can successfully construct undetectable FDI attacks on SE avoiding detection. However, there are still some obstacles to launch such attacks. First, the attacker has to know the configuration of the power system, which is in general not easy to obtain. Second, the attacker has to access a sufficient number of smart meters. Some smart meters are protected by different mechanisms. It is almost impossible to get access to every meter. Third, some smart meter readings such as active power, reactive power and voltage are read-only. The attacker can only falsify some writable configuration parameters like the current transformer (CT) ratio and time. Finally, even when the above conditions are satisfied, the attacker still has to solve a non-deterministic polynomial (NP)-complete problem to find such a sparse attack vector, which has a high computational cost. Simulation results indicate that the attacker may need to compromise almost 80% of all meters to ensure finding an attack vector for targeted FDI attacks (unconstrained case) in the Institute of Electrical and Electronics Engineers (IEEE) 118-bus system [8]. The authors of [11] presented a “generic FDI”, which could bypass the bad data detection and did not require solving the NP-complete problem. However, to launch such an attack, the attacker has to know all sensor measurements and state values of the power system. In our work, it is shown that light-weight false data can bypass traditional bad data detection methods, exploiting their tolerance of observation errors. In experiments, when we injected false data into each bus in the IEEE 14-, 39-, 57-, 118- and 300-bus standard systems, a relative low detection precision is achieved by the Chi-squares test. These attacks exploit the detector's tolerance of normal cumulative random noises and hide among normal measurement errors. This kind of attack is named as tolerable false data injection (TFDI) in this paper. Compared with the strict conditions required by the undetectable FDI attack, the TFDI only requires the attacker to manipulate meters on target transmission lines. It is a relatively easy and practicable approach for attackers to falsify some specific measurements with limited knowledge about the system configuration and restricted access to smart meters.
Various advanced methods are proposed to detect the false data. Many researchers have studied how to find the important meters in FDI attacks, and investigated various security strategies to protect the important measurements, such as independent verification [11] and data encryption [12,13]. These methods would require extra investments on system implementation. Phasor measurement units (PMUs) have become increasingly deployed in power systems, providing accurate, synchronous, and secure sampling of the system states. How to economically deploy PMUs to best facilitate the state estimator to detect FDI attacks has become an interesting problem [6,14]. In addition, many smart algorithms are applied to detect the false data, such as geometrically-designed residual filter [15], and the adaptive cumulative sum (CUSUM) test [16]. Zonouz et al. [17] presented a security-oriented cyber-physical state estimation (SCPSE) system, in which the suspicious nodes in the cyber network are removed and the SE is applied to detect the false data with the remaining measurements, but the observability of the remaining measurements is a big problem for the SCPSE [17]. In the fully distributed power system, the distributed state estimation (DSE) is applied to detect false data, which is a two-level process: the local level is in charge of filtering the local bad data and the coordination level is applied to detect boundary bad data [18,19], but the coordination level SE faces constraints on observability.
In this paper, we propose a bad data detection method based on an extended distributed state estimation (EDSE). With this method, a power system is decomposed into several subsystems using graph partition algorithms. For each subsystem, buses are classified into three groups: internal bus, boundary bus and adjacent bus. Each subsystem is extended outward to include the adjacent buses and tie lines, and generate the extended subsystem. The SE and Chi-squares test are applied to detect whether there is any false data in each extended subsystem. Through decomposition, the false data will stand out from normal observation noises and the detection sensitivity will be improved. To verify the effectiveness of the EDSE-based method, extensive TFDI attack cases are designed to inject false data into the IEEE 14-, 39-, 118- and 300-bus systems. These TFDI attacks exploit the detector's tolerance of normal cumulative random noises and hide among normal measurement errors. They keep the test statistics lower than the threshold to bypass the Chi-squares test. Through decomposition, false data do not have enough space to hide behind normal measurement errors. They will stand out prominently and the detection sensitivity will be increased. The IEEE 14-bus system is selected to illustrate how the attack is constructed and how the EDSE-based false data detection method works. The IEEE 39-, 118- and 300-bus systems are used to carry out the simulations to discuss the detection performance, computation complexity and tunable parameters. Simulation results demonstrate that the detection accuracy of the EDSE-based method is much higher than the traditional bad data detection method on average, and the computation cost is reduced by over 90% in the IEEE 300-bus system.
To summarize, the contributions of this work are as follows:
- (1)
The possibility of random TFDI attack construction, which is much easier to launch than the well-known FDI method in [8], is proved;
- (2)
Several cases are initially designed and numerically analyzed to show how the TFDI attacks bypass the traditional bad data detection method, and to demonstrate their potential risks;
- (3)
A new method is proposed to detect the injected false data. The graph model is introduced to automatically decompose the smart grid, instead of manual power system partition based on the grid topology and geographical information in the power system DSE. Its detection accuracy is proved to be much higher than traditional methods and its computation complexity is significantly lowered.
The rest of this paper is organized as follows: the background of SE and bad data detection is given in Section 2; the TFDI attack is introduced in Section 3; in Section 4, a TFDI attack scenario is demonstrated to explain how to bypass the bad data detection, and prove the potential motivations and risks; the methodology of EDSE is presented in Section 5; in Section 6, the proposed method is tested with IEEE standard systems, and the results and analysis are also shown in this section; the concluding remarks and future work are given in Section 7.
2. Preliminaries
2.1. SE
Power system SE is widely used to ensure the safety and economy of operation of power system. The state variables are related to the measurements as shown in Equation (1):
In the SE, measurements are usually the values that can be observed easily, such as the line power flow, bus power injections, bus voltage magnitudes, and line current flow magnitudes, etc. The state variables are usually complex phasor voltages which cannot be measured conveniently. Both the measurements and state variables follow the same constraints, such as power balance theory and the Kirchhoff's Law, etc. When using the polar coordinates for a system containing N buses, the state vector will contain (2N − 1) elements, N bus voltage magnitudes and (N − 1) phase angles. In general, measurements are more than state variables (m > n), since there are more lines than buses and more kinds of measurements than state variables.
Essentially, power system SE is a process which uses real-time redundant measurements to improve data accuracy and automatically excluded from the error message caused by random interference. The objective is to find an estimate x̂ of x that is the best fit of the measurement z according to Equation (1). The problem is usually solved by the weighted least squares (WLS) algorithm [3]. The SE can be formulated as a quadratic optimization problem:
The convergence criterion is the following:
2.2. Bad Data Detection
Sensor measurements might be inaccurate because of device misconfiguration, device failures, malicious actions or other errors. The Chi-squares test is a common approach for detecting bad data according to the measurement residuals:
Assuming that all state variables are mutually independent and the sensor errors follow a normal distribution, the measurement residuals J(x̂) follows a chi-squared distribution with m − n degrees of freedom. The steps of the Chi-squares test are as follows:
- (1)
Solve the WLS estimation problem and compute the measurement residuals J(x̂).
- (2)
The threshold χ2(m−n),p is determined through a hypothesis test with a significance level p. There is a trade-off between false positive rate and false negative rate. A high threshold may lead to a high false alarm rate. According to [4], p = 95% is an empirical value.
- (3)
If , then bad data will be suspected. Else, the measurements will be assumed to be free of bad data.
3. TFDI
Most researches on the FDI construction follow the same idea: the attackers find an attack vector, a, to be equal to Hc. Then the manipulated measurement za = z + a can pass the bad data detection and identification of direct-current (DC) SE [8,9]. Thus, the measurement residual is:
From the perspective of the attacker, it is almost an unattainable mission to find an attack vector a in the real world. Firstly, the topology of the power system is one of the top secrets of most power companies. It is difficult to obtain the measurement matrix H. Secondly, solving the a = Hc, which in real systems is an ultra-high dimensional equation is difficult. It would be a NP-hard problem, when the attackers want to inject a specific data with limited compromised meters. Moreover, if the system topology is changed, the FDI attack would trigger bad data detection.
Subject to the constraints of invisible observation errors and the false alert rate, the tolerance mechanism for measurement errors in SE is necessary. Instead of solving the problem in Equation (6), the attacker can construct a TFDI below the threshold of estimated residuals:
Moreover, there is a high probability that the false data could not be detected when the attackers manipulate the data on both sides of the same transmission line. There are four power flow measurements per line. In each direction, there is a pair of active powers and reactive powers. Since the active power is related to economic interests, it is more attractive for attackers to falsify. On the transmission line Li,j (between the bus i and j), Pi,j denotes the active power from busi to busj, observed on busi, and Pj,i denotes the active power from busi to busj, observed on busj. The original active power from bus i to j and are changed by same times to be and simultaneously to guarantee the balance of line power flow.
Injected data levels (IDL) is defended to present the relative injected errors against the measurements:
Comparing with the strict conditions required by the undetectable FDI attack, the TFDI only needs the attacker to manipulate meters on target transmission lines. Moreover, from [8], it can be seen that the probability of finding an attack vector for a target FDI (unconstrained case) in an IEEE 300-bus system is about 20%, even if the attacker can compromise 60% of all smart meters. In experiments, traversal attacks are conducted in IEEE 57- and 300-bus systems. The probabilities to construct a TFDI are shown in Table 1. It can be seen that the possibility to construct a TFDI attack is much higher than for an undetectable FDI.
In addition, we modify the active power on each bus in IEEE 39-, 57- and 118-bus systems with different IDL. A relative low detection precision is performed by the Chi-squares test, as shown in Table 2. Furthermore, with the scale of the power system grows, the tolerance of measurement errors is accordingly increased. We can see from Table 2 that it is easier for the attackers to bypass the detection in the larger system.
It should be noted that the attackers construct the TFDI according to their limited information and constrained access to smart meters. They do not care about the observability of the system. TFDI attacks exploit the detector's tolerance of normal cumulative random noises and hide among normal measurement errors. It just falsifies some measurements of smart meters and has no influence on the system observability. The TFDI scheme mentioned above is compatible both in alternating current (AC) models and DC models and easy to achieve, therefore, the TFDI is an easy and practicable attack, of which power engineers and security people should be aware. In this paper, we will discuss the countermeasures against such attack scheme.
4. Attack Case and Potential Risks
4.1. Smart Meter Intrusion
Cyber techniques are the foundation of the FDI. The basic target for cyber-attacks is to obtain the authorization to make invalid operations on smart meters or network communications. For most smart meters, the communication protocol is Modbus/TCP or DNP 3.0/TCP. The port of Modbus/TCP is 502 and the port of DNP3.0/TCP is 20,000 by default. The attacker can first scan all hosts in the network segment, trying to find devices with opened 502 or 20,000 ports. Next, special hosts are found and marked to be suspicious. The attack can further communicate with these devices to obtain their product types and make sure they are smart meters.
Two strategies can be used to access smart meters: (1) Password cracking is the traditional method to intrude into devices. The modification of smart meter settings often requires authentication. However, considering the limited computational resource and storage, smart meters are not equipped with complex password mechanisms. For smart meters in this simulation, the password is made up of four numerical digits and only several seconds are needed to crack it; (2) Plaintext transmission is another vulnerability which can be used to access smart meters. Some smart meters are equipped with complex password mechanisms. However, for most smart meters, the communication protocol used is Modbus/TCP or DNP 3.0/TCP, in which information is transmitted as plaintext. Attackers can monitor the traffic flow to identify critical operations on smart meters requiring authentication, such as modifications of system time, IP addresses and firmware updates. If the package including authentication information is identified, attackers can seize the password and obtain access to smart meters.
With successful intrusion, the attacker can change measurement values. For most smart meters, measurement values such as active power and reactive power are read-only. However, some settings such as time and CT ratio are writable. A CT is used for measurement of alternating electric currents. The CT ratio K is defined as: K = I1/I2, where I1 is the primary current and I2 is the secondary current. The values of active power and reactive power will increase or decrease in proportion to the change of K. The attacker can change the CT ratio to manipulate the power flow measurements.
4.2. A TFDI Attack on IEEE 14-Bus System
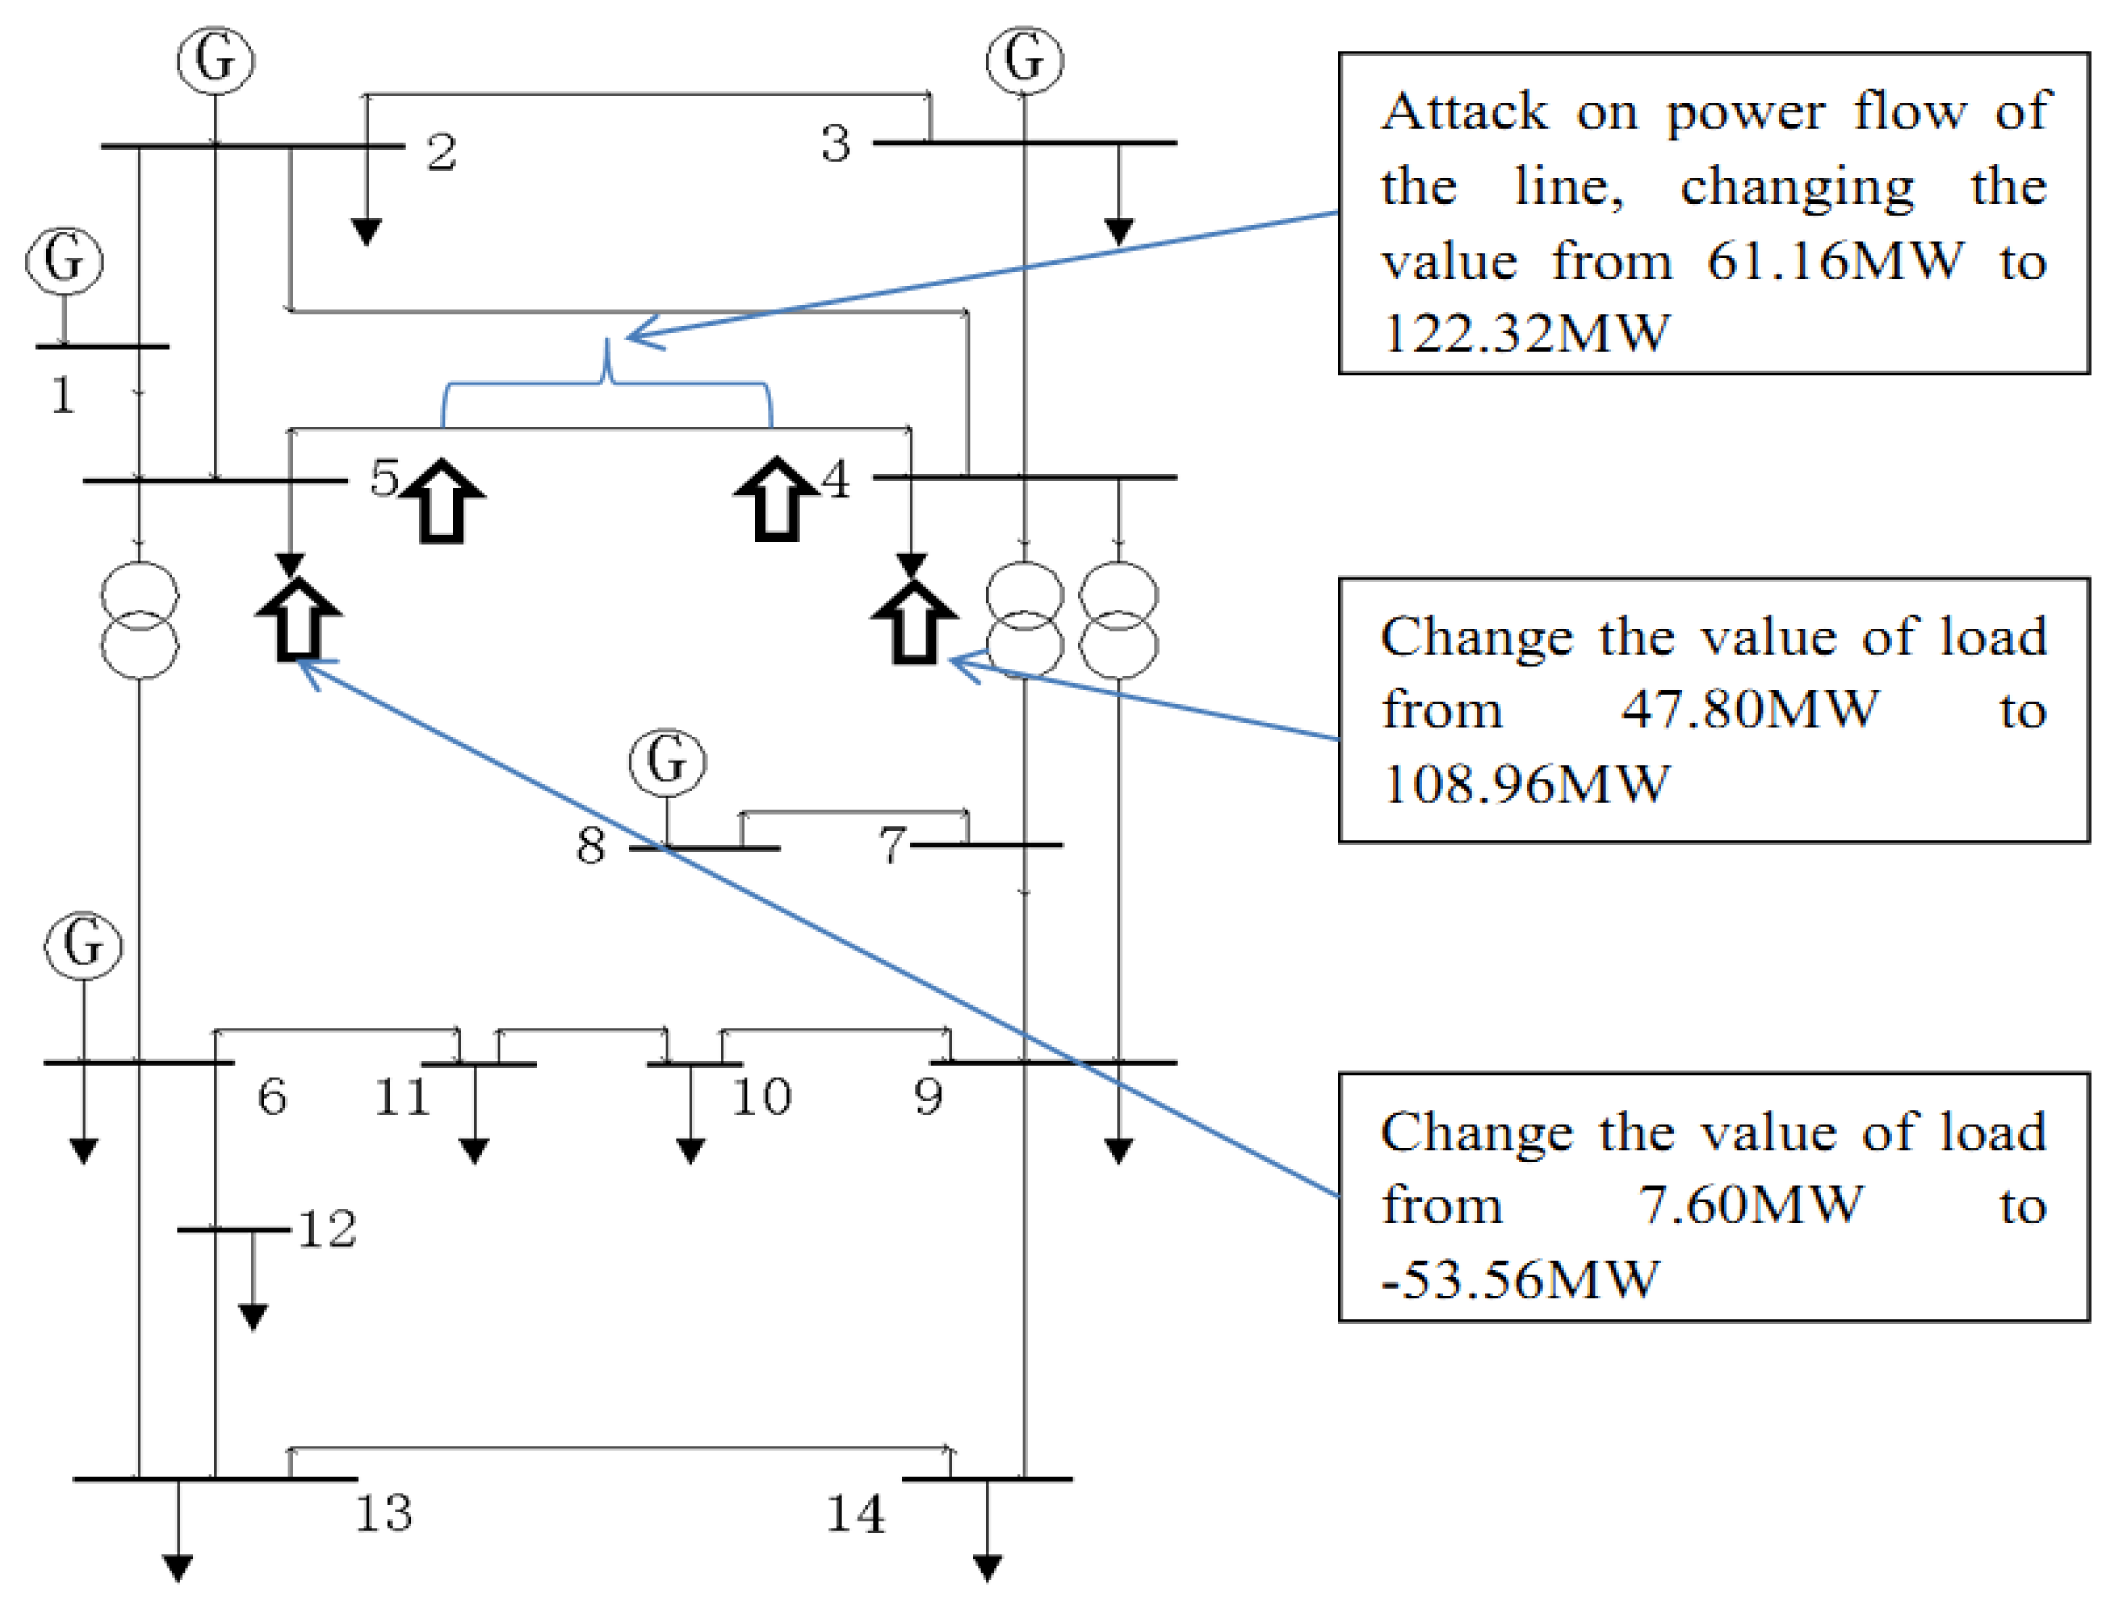
A simulation case is constructed to inject false data into the IEEE 14-bus system as shown in Figure 1. Measurements of active power are changed by falsifying the CT ratio of smart meters. This attack case is illustrated to demonstrate how to bypass traditional bad data detection through hiding the injected data among the normal observation errors, and analyze the potential risks of TFDI attacks.
The original loads on bus5 and bus4 are 7.60 MW and 47.80 MW, respectively. The power flow on the transmission line L5,4 is 61.16 MW. In the attack case, the hacker tries to move 60.96 MW of power load from bus5 to bus4. Thus, the load on bus5 and bus4 and the power flow on the transmission line L5,4 are modified to −53.56 MW, 108.96 MW and 122.32 MW, respectively, to maintain the power balance of these buses. The revised data is analyzed with the SE and J(x̂) is equal to 67.5471 by solving Equation (5), which is less than the threshold 72.1532. This shows that the traditional bad data detection method is inadequate and unable to detect this attack, and measurements will be assumed to be free of false data.
The result provided by SE is the basis for the energy management system (EMS). EMS is a system of computer-aided tools used by operators of electric utility grids to monitor, control, and optimize the performance of the generation and transmission system. Some adverse consequences will occur if the EMS is misled. Two potential risks are as follows:
Risk 1: Energy Theft
Energy theft is the most common and attractive motivation for hackers to launch TFDI attacks. In this case, the hacker tries to reduce the measurement of active power on bus5. Then, a TFDI attack is launched and 60.96 MW of power load is moved from bus5 to bus4. According to the current tariff published by the Pacific Gas & Electric Corporation [20], the electricity price is 0.18590$/kW h. If this attack lasts for one day, customers on bus5 may see their costs unjustly lowered by $272,871. It should be noted that the load on bus5 is changed to −53.56 MW. Generally, it seems ridiculous to change the load from a positive value to a negative value. However, this is quite normal under the smart grid paradigm. Demand response plays an indispensable role in the smart grid. For some energy-intensive industries, such as iron, steel and cement enterprises, captive power plants and energy storage devices are intrinsic [21]. When sufficient energy exists for production, these enterprises can participate in the demand side bidding and feed power back to the grid for their economic benefits. It may drive these energy-intensive enterprises to falsify the value of the smart meter and mislead the power company to believe that electrical energy is being fed back into the power grid.
Risk 2: Cracking Economic Dispatch
Economic dispatch is the short-term determination concerning the optimal output of a number of electricity generation facilities, which is to minimize the overall operating cost while satisfying the power load of system in a robust and reliable manner. To achieve economic dispatch, the optimal power flow (OPF) is applied to solve the load flow and determine a new set of values for generator's output that reduces the generation cost [22]. The cost of each generator is usually considered to be quadratic in power generation:
We calculate the OPF of this region with MATPOWER, a toolbox developed by the Cornell University [23]. The result shows that if the attack illustrated in Figure 1 is launched, the loads of bus4 and bus5 and the power flow on the line will change. The value of injected power on bus5 is negative after the modification. Thus bus5 pretends to feed energy back to the power grid, and will mislead the control center to reduce the generation output on bus1, bus2 and bus3 and increase the generation output on bus8 to meet the increased demand on bus4. Output of each generator will be adjusted to pursue the lowest generation cost [24]. In any normal situation, the optimal total generation cost is 8081.5$/h. After the hacker launches the attack, the output of bus8 rises sharply and the optimal total generation cost of the system increases by 5%.
5. EDSE-Based Bad Data Detection
As shown in Section 2.2, the threshold of the Chi-squares test is set to tolerate unpredictable and inevitable measurement noises. The attackers can elaborately construct TFDI attacks hidden in normal measurement noises. When the number of measurements grows, the Chi-square test has to tolerate larger cumulative normal observation errors from each measurement. If the large system can be reasonably decomposed, false data will not have enough space to hide among normal measurement noises. Based on this idea, an EDSE-based bad data detection method is proposed to handle TFDI attacks.
5.1. Power System Decomposition
Setting a smart grid with n buses and m transmission lines, the weighted-undirected graph model of power system can be established as G = {V, E}, where V is a set of vertex representing load buses or generators, and E is the set of edges representing the transmission lines in smart grids. The adjacency matrix of the graph is denoted by A = {ai,j}, i,j = 1, 2, …, n. The element ai,j is non-zero when bus i and bus j are directly connected and it also indicates the physical properties between the two buses. For the modeled graph, the weight of the branch can be determined as the following ways:
The basic topology of the power system (ai,j = 1 if bus i and bus j are connected);
The impedance of transmission lines;
The line power flow at each sampling time.
In this paper, we use the impedance (Z = R + jX) of transmission lines as weight of edges, which reflects the electrical distance between each bus. R is the resistance and is X reactance of the transmission line. Comparing with X, the value of R is very small. Therefore, the absolute value of line reactance |X| is chosen to be the weight of edge. The large graph is divided into several subgraphs using clustering algorithms, such as the L-bounded Graph Partition Method (LGPM) [25], the K-Medoid [26], and Chameleon [27], etc. In this paper, the LGPM method is applied to graph decomposition, since it is relatively stable and not affected by the choice of initial clustering centers. The main process of LGPM is illustrated in Table 3.
5.2. Subsystem Extension
After the graph partitioning, the power system graph is decomposed into several sub-graph. Accordingly, the power system is decomposed into a specific number psub of non-overlapping subsystems connected with each other by tie lines. Let MTIE denote the number of tie lines. In the subsystem k (described by subsys_k (k = 1, …, psub)), there are Nk buses and Mk lines. Let nk denote the number of state variables and mk denote the number of measurements, they should satisfy the following equations:
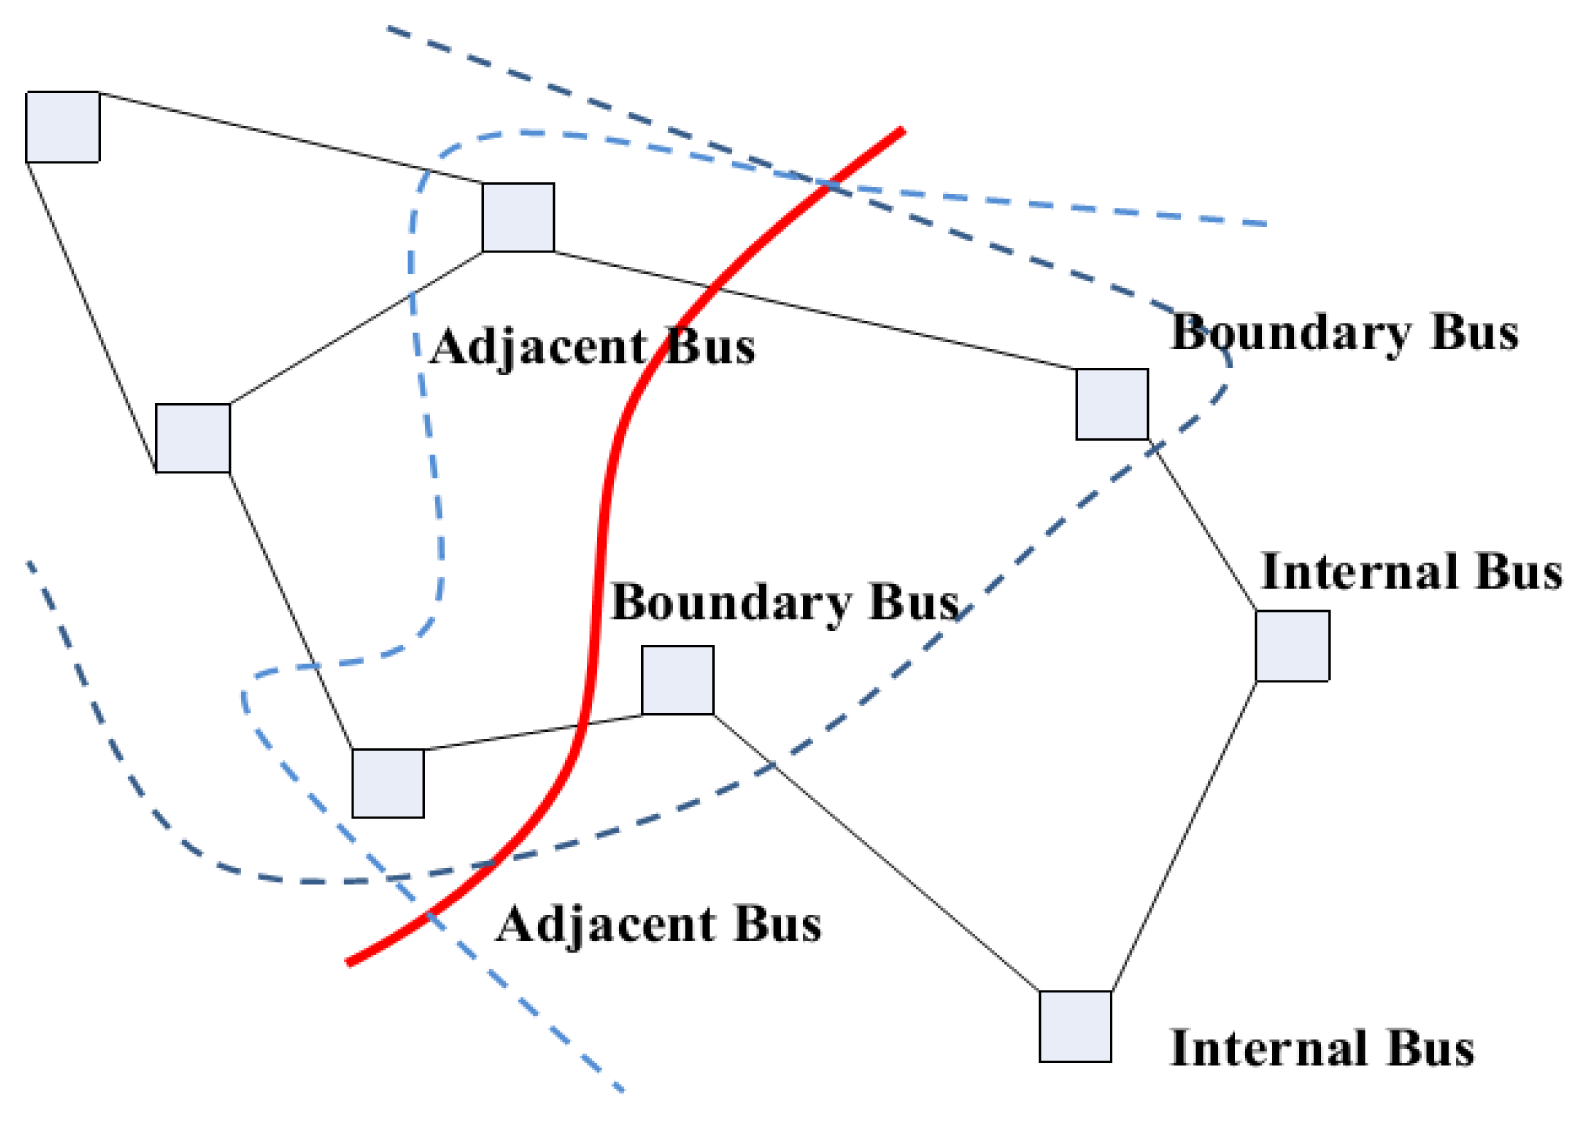
It should be noted that a sufficient redundancy of measurements must be ensured in each subsystem to carry out the SE, i.e., mk > nk. For each subsystem, buses can be grouped into three categories as shown in Figure 2:
- (1)
Internal Buses, all of whose directly connected buses belong to the subsystem;
- (2)
Boundary Buses, whose neighbors are this subsystem's internal buses and at least one bus from another subsystem;
- (3)
Adjacent Buses, which are a boundary bus of another subsystem with a connection to at least one boundary bus in this subsystem.
Tie-lines connect the boundary buses of each subsystem. According to the result of decomposition, the tie-lines will not be included into any subsystems. False data injected into the measurements on tie-lines will not be detected. If there are measurements on tie-lines, the subsystem should be extended to contain the adjacent buses, which help to identify attacks on tie lines between original subsystems.
Let denote the number of tie-lines directly connecting to subsys_k. The extension status of tie-lines can be determined by a binary set . If the i-th tie-line is included into subsys_k, , otherwise, . Thus, the number of buses and transmission lines in subsystem will be updated as follows:
5.3. Subsystem SE and Bad Data Detection
In this paper, we adopt a “line-only” method [28] in which values of active and reactive power flow on all transmission lines are selected to be measurements. Each subsystem possesses its own state estimator. The state estimator of each subsystem can be run in parallel and separately with the respect to their own slack bus. The SE of subsys_k can be formulated as follows:
The Chi-squares test is carried out in each subsystem to detect bad data. Referring to Section 2.2, the local threshold of bad data in subsys_k is determined by the local degree of freedom ok. The difference between the global and the local threshold is shown as below:
For SE, enough measurement redundancy must be ensured to eliminate random errors. It is obvious that . In addition, a global system will be divided at most into m + 1 subsystems after m transmission lines are removed. Therefore, the upper bound of psub is less than MTIE + 1. Therefore, we can obtain:
In addition, the upper bound of the number of extended tie-lines is . We can obtain:
All the aforementioned discussion suggests that the local degree of freedom ok is obviously lower than the global one. The threshold of the Chi-squares test in each subsystem could be less than that in the entire system. Therefore, the threshold is reasonably reduced without changing the detection confidence.
It should be noted that the EDSE-based method is also effective for other kinds of FDI, which exploit the detection threshold's tolerance of normal observation noises. Since it is difficult to find an attack vector a, which strictly satisfies a = Hc, some researchers try to relax this condition. The authors of [11] proposed that the “generic FDI attack” would be a future direction for attackers to inject false data without being detected. Such attack does not require the strict condition a = Hc, as long as the attacker chooses his attack vector a, satisfying the following equation:
Comparing with other DSE papers [19,29,30], the features of the proposed method are as follows:
- (1)
Although the system is divided into several subsystems, all subsystems' SEs are conducted by the only computing center which has the knowledge of the global system's estimate.
- (2)
Since this paper just focuses on the bad data detection in smart grids, it is not necessary to construct the aggregation level [30], which is required for each subsystem to achieve convergence of the entire power system's states to those of the centralized estimation. The computational complexity is remarkably reduced.
- (3)
In this paper, subsystems are overlapping, because each original subsystem is extended to contain the adjacent buses. After first-step decomposition, the tie-lines will not be included into any subsystems. False data injected into the measurements on tie-lines will not be detected. Subsystem extension helps to identify attacks on tie lines between original subsystems.
- (4)
The clustering algorithm is introduced for system decomposition. Through the graph establishment, the configuration of power system is taken into consideration. It is suitable for systems which do not have obvious physical or geographic features.
6. Experiments and Analysis
In this section, the performance of the EDSE-based method is studied: in Section 6.1, three attack cases are simulated on the IEEE 14-bus system. Bad data detection based on EDSE is applied to detect these attacks; in Section 6.2, the IEEE-39 bus system is used to present a statistical comparison of detection performances between the traditional and EDSE-based methods; in Section 6.3, we discuss the some TFDI attacks which are not detected by the EDSE-based method; the evaluation of time complexity is shown in Section 6.4; and in Section 6.5, the proper number of subsystems is discussed.
6.1. Attack Cases on IEEE 14-Bus Systems
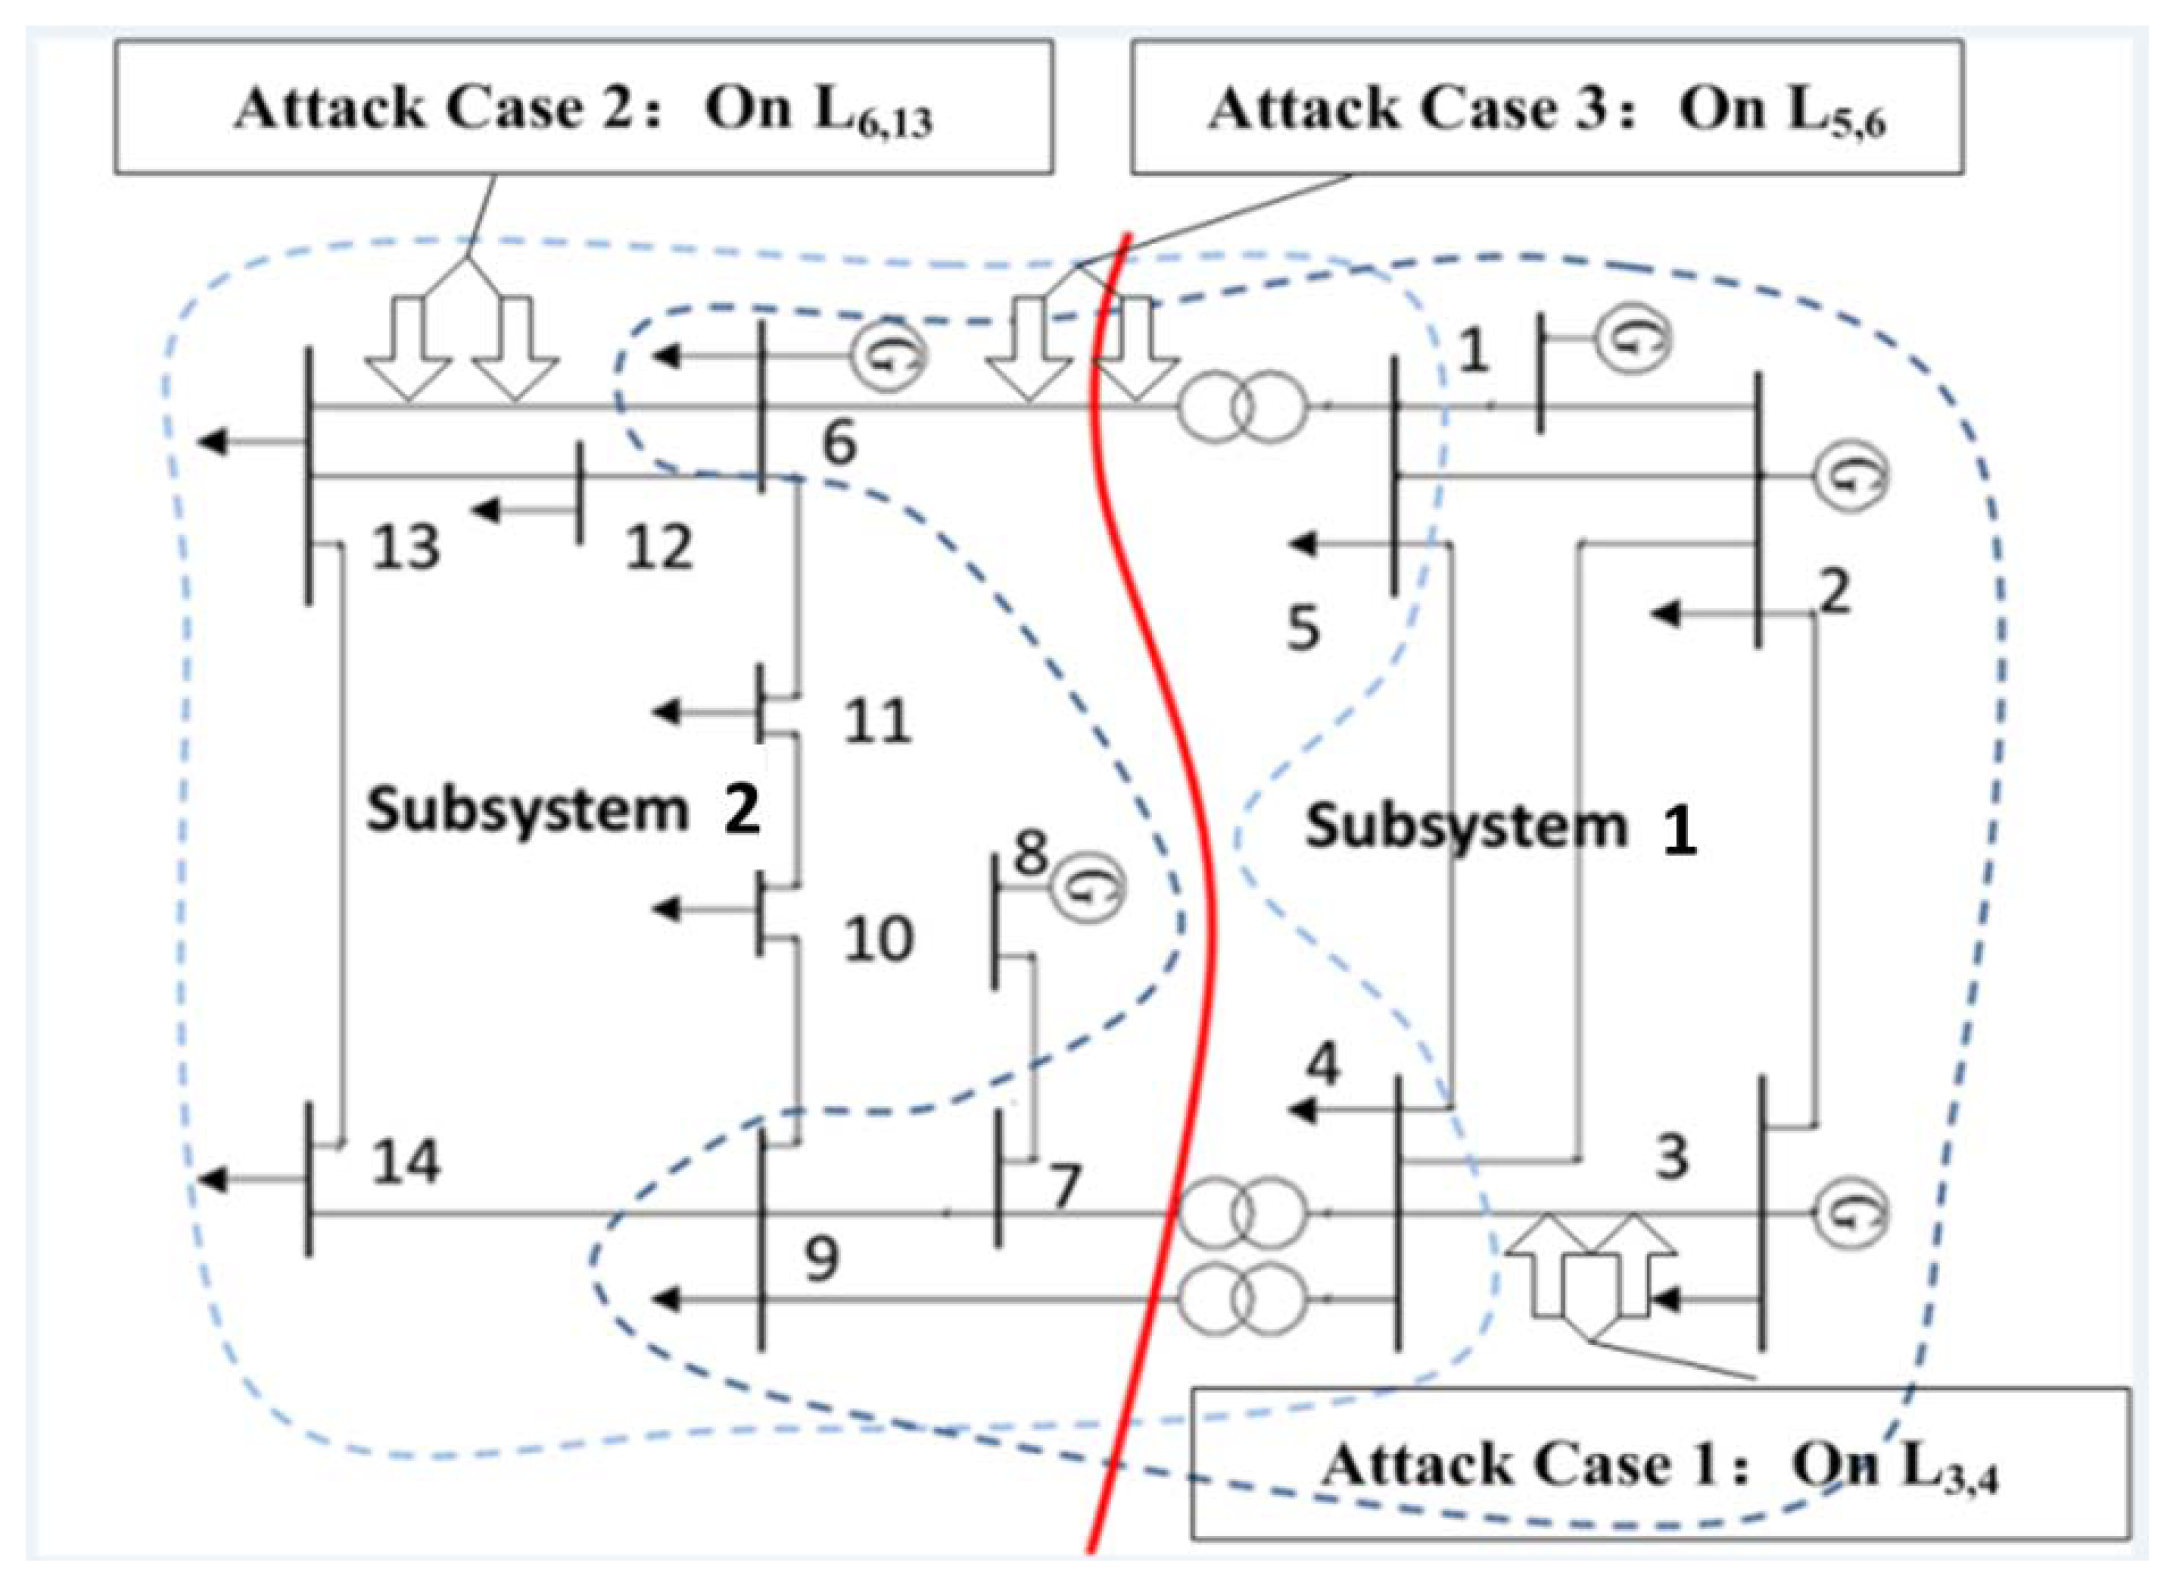
Three attack cases are constructed on the IEEE 14-bus system as shown in Figure 3. The decomposition of the IEEE 14-bus system is carried out by the LGPM.
As shown in Table 4, the IEEE 14-bus system is divided into two subsystems, “subsys_1” and “subsys_2”. L5,6, L4,7, L4,9 are tie lines. In subsys_1, there are 8 buses including adjacent buses: bus6, bus7 and bus9. The number of state variables n1 is 15 and the number of measurements m1 is 40. The degree of freedom o1 in this subsystem is m1 − n1 = 25. According to the property of distribution, the threshold of bad data suspicion is 43.77. In subsys_2, there are 11 buses, 21 state variables, and 52 measurements, and the threshold is 51.00. This indicates that the local threshold is much lower than the global one.
To test the performance of EDSE-based bad data detection, three attack cases are constructed as shown in Table 5. In Table 5, Li,j denotes the transmission line where the false data are injected. Pi,j denotes the active power from busi to busj, observed on busi. The active power Pi,j and Pj,i are modified at the same time to guarantee the balance of line power flow. The original measurements are simulated by MATPOWER and then the Gaussian noise is added. It should be noted that there is a tiny difference between |Pi,j| and |Pj,i|. These two active power measurements are observed at each end of the transmission line. There is some power loss on the transmission line. For an attacker, it is not easy to change the active power to arbitrary values, because active power is usually read-only. As explained in Section 4.1, attackers can change the active power through falsifying the CT ratio. In Attack Case 1–3, they increase the CT ratio by 2 times, 3 times and 1.5 times, respectively. In Attack Case 1, false data is only injected into subsys_1. The P4,5 is modified from −61.16 MW to −122.32 MW and P5,4 is modified from 61.67 MW to 122.34 MW. In Attack Case 2, false data is only injected into subsys_2. The P6,13 is modified from 17.75 MW to 53.24 MW, and P13,6 is modified from −17.54 MW to 52.61 MW. In Attack Case 3, the false data is injected into the tie line between subsys_1 and subsys_2. The P5,6 is modified from 66.13 MW to 99.20 MW, and P6,5 is modified from −66.13 MW to 99.20 MW.
As shown in Table 6, global values of J(x̂) are 54.91, 66.04 and 54.73 in three attack cases, respectively. Obviously, they are lower than the threshold To,p(72.15). Thus, the injected false data cannot be detected. When we adopt EDSE-based method to deal with the Attack Case 1, we find that: in subsys_1, the J(x̂) is 51.98, which is higher than the local threshold (43.77); in subsys_2, the J(x̂) is 25.22, which is below the local threshold (51.00). It implies that there is false data in subsys_1. Similarly in Attack Case 2, the EDSE-based method can detect the false data in subsys_2. In Attack Case 3, false data is detected in subsys_2. If the subsystem is not extended to include the adjacent buses, the FDI on tie-line L5,6 will not be found.
6.2. Traversal Attacks on IEEE 39-Bus System
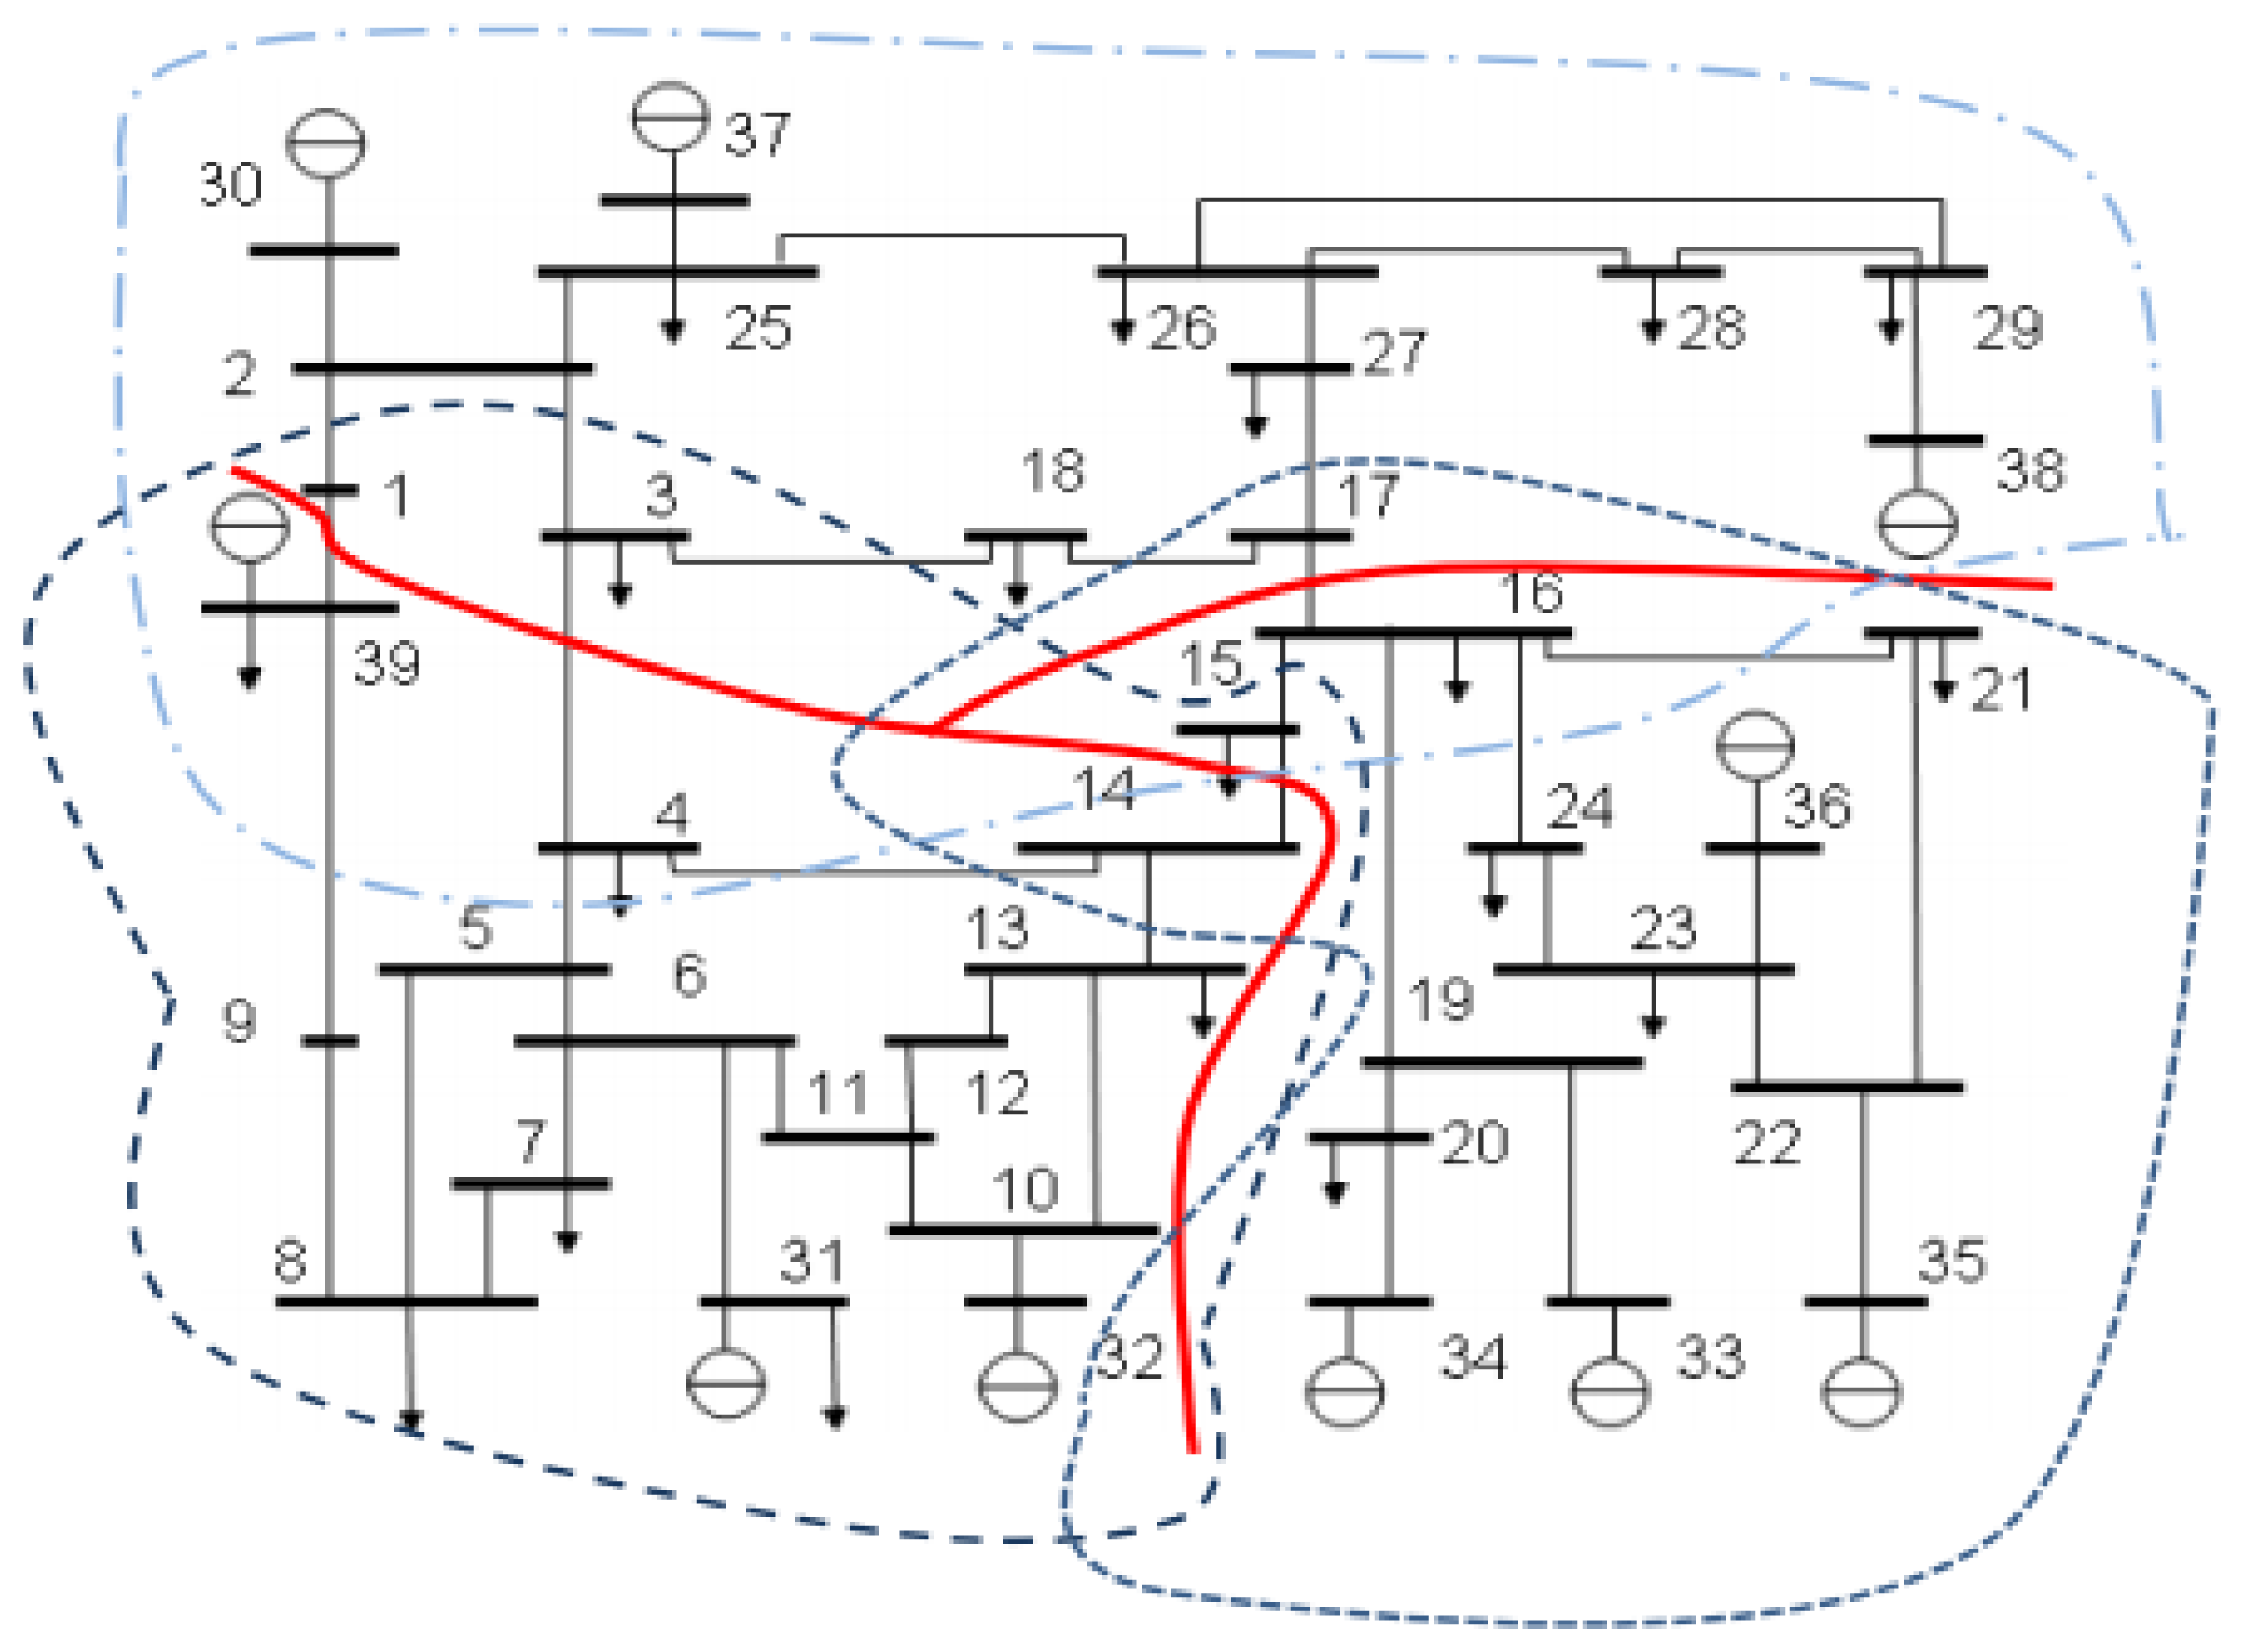
In this section, we present the comparison of detection precision between the traditional and EDSE-based methods on the IEEE 39-bus system. The system consists of 39 buses and 46 transmission lines, therefore, the number of state variables is 77, represented by n, and that includes 39 bus voltage magnitudes and 38 bus voltage phase angles. There are 92 pairs of active/reactive power flow measurements on transmission lines. The topology of the IEEE 39-bus system after decomposition is shown in Figure 4 and the detailed data of each subsystem are listed in Table 7.
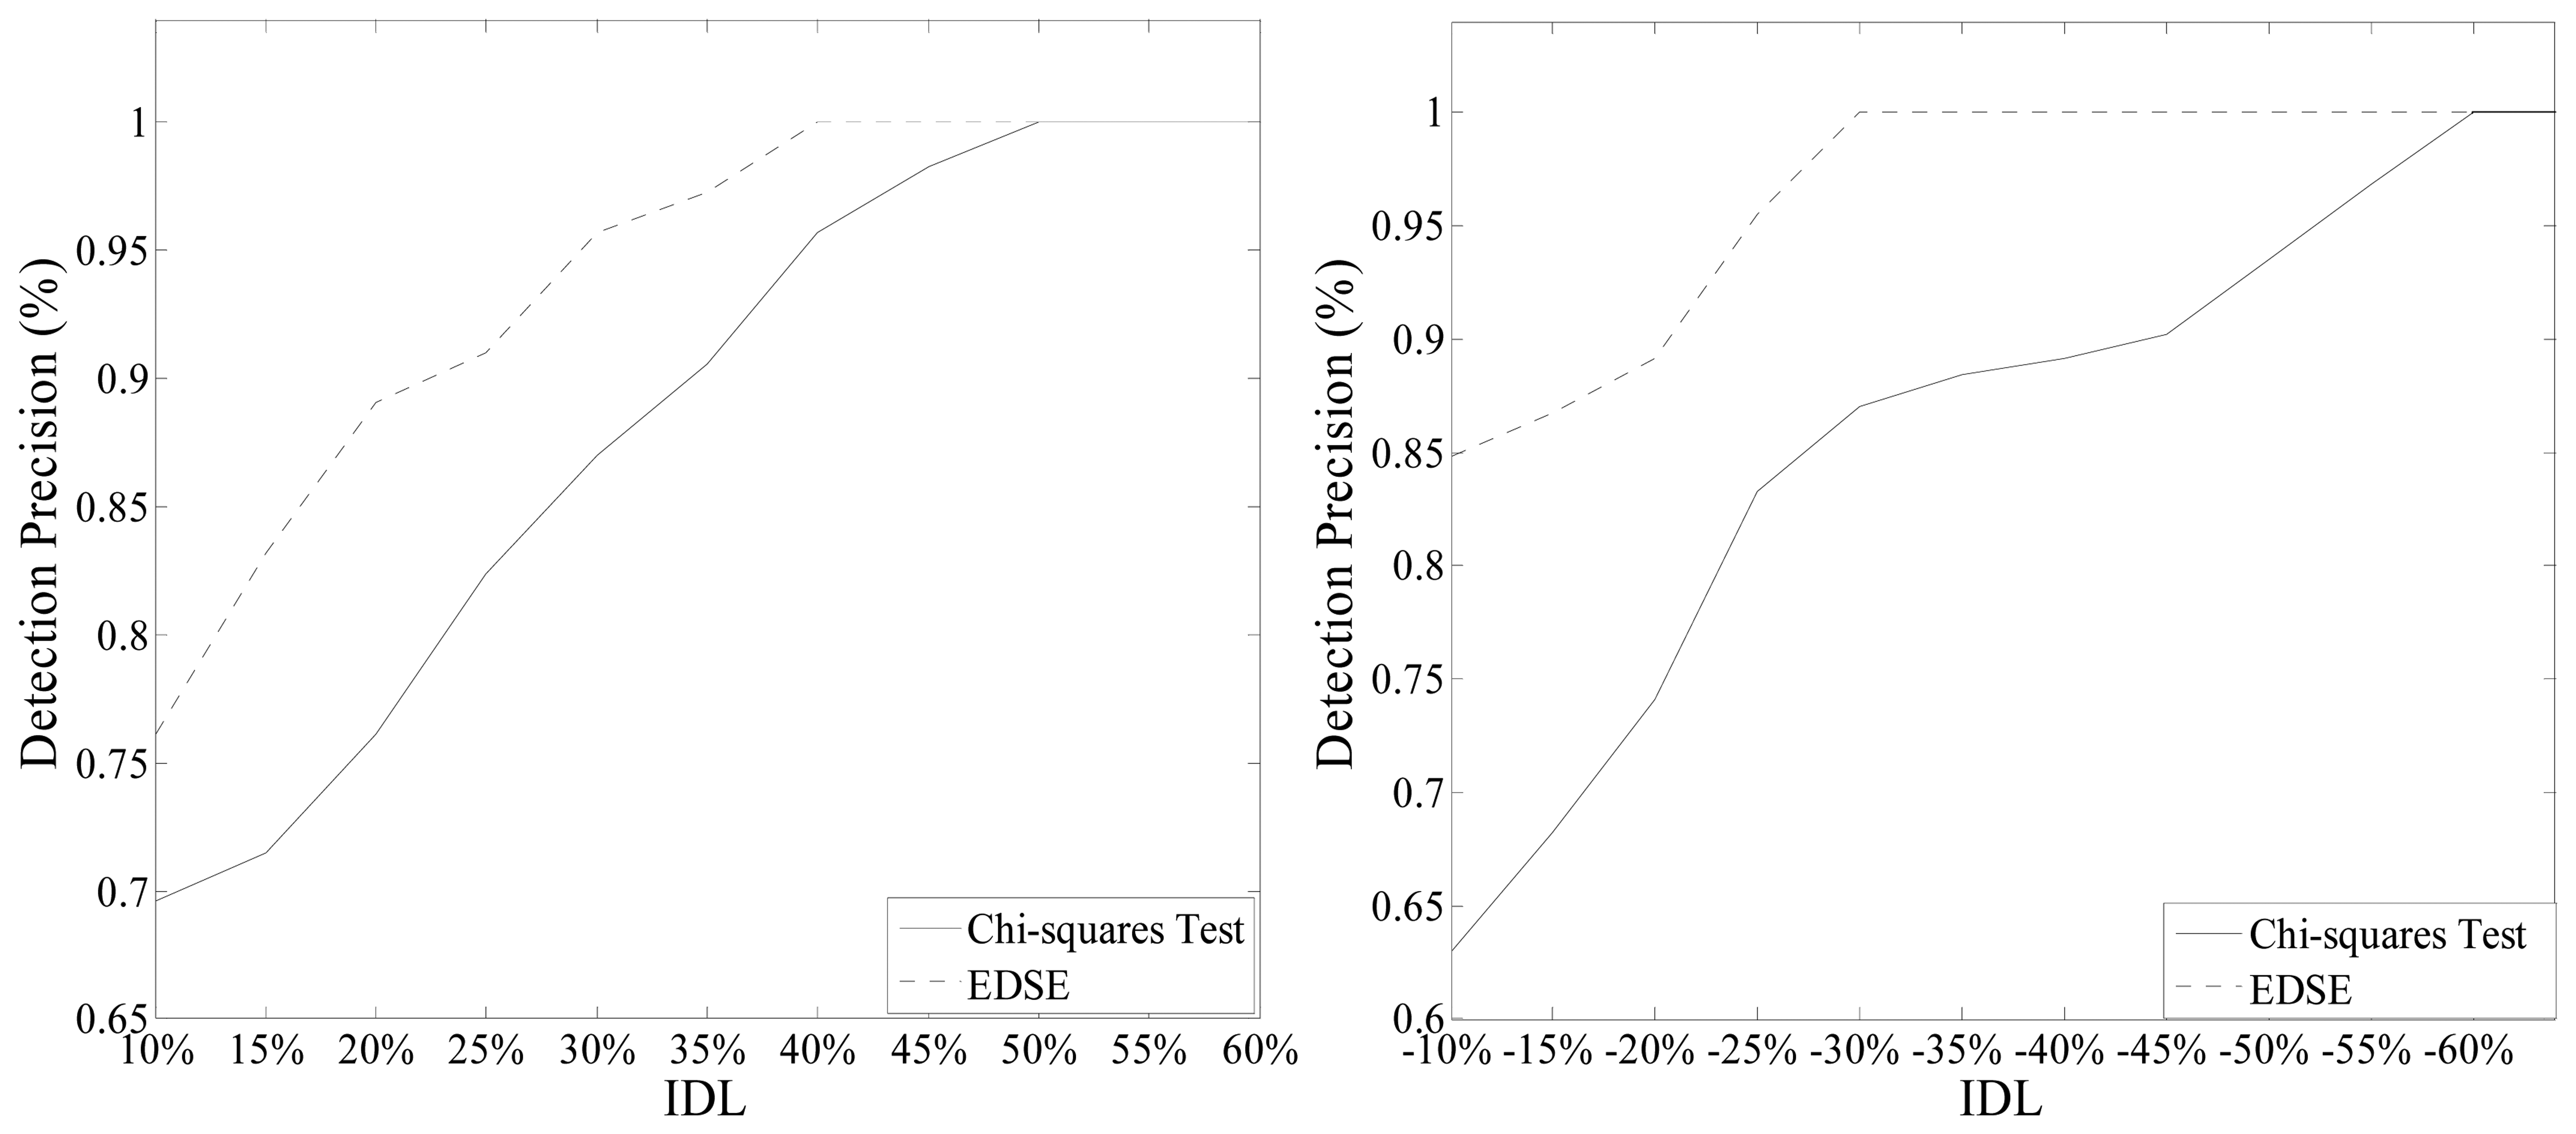
A slight modification of the original measurement is not worthwhile for attackers. Meanwhile, substantial falsification is easy to detect. We test the detection precision with the |IDL| from 10% to 50%. For each transmission line, we modify the measurement of the active power on this line and then record the total number of successful detection after traversing all the transmission lines. The final detection precision of the Chi-squares test and EDSE-based method are illustrated in Figure 5.
When IDL = −10%, 84.8% of injected data are detected by EDSE-method while the detection precision of Chi-squares test is only 63%. When IDL = +10%, the detection precision of the Chi-squares test and proposed method are 76.1% and 89.1%, respectively. The detection precision of the EDSE-based method is remarkably higher than that of the Chi-squares test for the lower IDL. With the increase of differences between original measurements and injected data, the performance of the Chi-squares comes to be closer to EDSE-based method. When IDL is higher than 50% or lower than −60%, all injected data can be detected by the proposed EDSE-based method and Chi-squares test. Overall, the detection precision is improved tremendously.
It can be seen that the EDSE approach cannot detect all the TFDI attacks, especially when the IDL is very low. However, attackers construct the attack according to the configuration of the global system. They do not know the decomposition model and the testing threshold of subsystem. In addition, a very slight modification on the original measurements is very attractive for the attackers. The attackers are more likely to maximize the injection, so long as the attack does not trigger the detector of the global system. Therefore, the EDSE approach would achieve a better performance in practice than in the traversal attack simulation shown in Figure 5.
6.3. Discussion of Undetected TFDI Attacks
Although the EDSE-based method greatly improves the detection precision than tradition method, some TFDI with slight IDL cannot yet be detected, as shown in Figure 5. In this section, we perform further analysis on the conditions under which a TFDI can be detected or cannot be detected by the EDSE detector.
From the traversal attack simulation on an IEEE 39-bus system, we find that attacks on the transmission lines connected to bus6, bus16 and bus26 are more likely to trigger the detector, even with very low IDL. From the perspective of graph theory, these buses have high degree (the number of neighboring edges of the node). It means there are many transmission lines connected to these buses. Such lines have a close connection with the rest parts of the system. A slight modification on measurements will cause a relatively great change of J(x̂).
The undetected lines are listed in Table 8. When the |IDL| is lower than 30%, the false data injected on L19,20, L19,33 and L20,34 cannot be easily detected by either the Chi-squares test or the EDSE-based method. Figure 4 shows that bus19, bus20, bus33 and bus34 form an “Isolated Island” out of the entire system. They are connected to other buses only by L16,19. The size of an “Isolated Island” is relatively small. Modification of the measurements in this “Isolated Island” is not strongly correlated with the rest. Therefore, the false data injected on these transmission lines cannot easily be detected.
From the above discussion, two conclusions can be drawn:
- (1)
EDSE has high detection sensitivity against the attacks on transmission lines which are connected to the high degree buses;
- (2)
For some “Isolated Islands” which is not strongly correlated with the rest parts of the system, TFDI on these transmission lines cannot be detected easily.
6.4. Time Complexity Analysis
Four standard IEEE power systems: 14-, 39-, 118- and 300-bus, are selected to compare the complexity between the traditional and EDSE-based methods. We design the detection programs based on the MATPOWER4.1 software (Cornell University, Ithaca, NY, USA), and run the experiments on the same computer equipped with a 2.2 GHz CPU and 3 GB of memory. Since each subsystem is independent, the EDSE program can be conducted in both serial mode and parallel model.
The result indicates a remarkable reduction in running-time as illustrated in Table 9. “EDSE (Serial)” means that bad data detection of each subsystem is conducted in sequence. “EDSE (Parallel)” means that bad data detection programs of all subsystems are conducted simultaneously. Computing time is decided by the largest subsystem. Taking the IEEE 14-bus as an example, the computation time drops from 14.7 ms to 11 ms when conducted in parallel. The running time in serial mode is higher than the traditional Chi-squares test since the IEEE 14-bus system is divided into two subsystems and the size of subsys_2 is close to that of the original system. For larger systems, the performance is more obvious. For the IEEE 118-bus system, the computation time is 0.791 s with the traditional method, while it only takes 0.2074 s in serial, which is about 26.3% of the traditional method, and 0.084 s in parallel, about 1.3% of the traditional method. For the IEEE 300-bus system, the computation time with the EDSE-based method is 7.5 s in serial mode, which is only 1/16 of the time compared to that of the traditional method. Obviously, the complexity and computation time for detecting the bad data can be reduced dramatically by using the proposed EDSE-based method. Furthermore, if the detection can be conducted in parallel, more execution time can be saved. Furthermore, it is possible to carry out the online bad data detection in a real smart grid consisting of hundreds of buses and thousands of transmission lines with the EDSE-based method.
6.5. Optimal Number of Subsystems
In this section, we discuss the optimal number of subsystems in EDSE. We decompose the IEEE 39-bus system into different numbers of subsystems and then analyze the running time and detection precision. False data with IDL = 15% is injected to a pair of active power flow measurements each time. The detailed result is shown in Table 10.
At the very start, the detection precision increases with the number of subsystems. Then, the EDSE reaches the maximum detection precision (93.5%) when the power system is decomposed into five subsystems. The precision begins to decrease when the number of subsystems exceeds six because the original system will be divided into some “Isolated Islands” mentioned in Section 6.3. In addition, too much decomposition cannot ensure the observability.
For the IEEE 39-bus system, the optimal number of subsystems can be set to 3–5, which represents a compromise between the running time and detection precision. In practice, the number of subsystems is strongly associated with the topology of the power system, execution mode (parallel or serial) and response time. The optimal number of subsystems can be selected offline according to the practical requirements.
7. Conclusions and Future Work
In this paper, TFDI attack cases are designed to explain how hackers can modify the data in smart grids and evade the traditional bad data detection methods in power systems. These attacks make use of the tolerance of the Chi-squares testing threshold and hide in normal observation errors. We discuss the potential risks of such attacks in smart grids, and evaluate the losses by energy theft and cracking economic dispatch on the IEEE 14-bus system.
To solve this problem, the EDSE-based method is proposed to detect TFDI attacks. The basic idea of this method is to improve the sensitivity of bad data detection by dividing a complex system into several subsystems. The EDSE-based method consists of the following steps: (1) decompose the power system into a certain number of subsystems using clustering algorithms; (2) extend each subsystem to include the adjacent buses; and (3) carry out SE and bad data detection in each subsystem.
In simulations, extensive TFDI attack cases are simulated in the IEEE 14-, 39-, 118- and 300-bus systems. Results show that the detection precision of EDSE-based method is improved tremendously. Moreover, the EDSE presents a new idea for online bad data detection, since its computational complexity is greatly reduced, and its detection process could be further sped up by parallel analysis of all extended subsystems.
Since FDI in smart grids is a cyber-physical attack which introduces interactive reactions both in the cyber network and power grid, the cyber-physical fusion strategy is considered as a better solution. In the future, we will further study a detection method which fuses the EDSE with the abnormality detection of traffic flow. Even though the EDSE does not detect the bad data, illegal access to smart meters will also trigger the alarms deployed in the communication network.
Acknowledgments
This work was supported by the National Natural Science Foundation (No. 91118005, 91218301, 61221063, 61203174, U1301254, and 61304212), Doctoral Fund of Ministry of Education of China (No. 20110201120010), the Fundamental Research Funds for the Central Universities and the Cisco University Research Program Fund, a corporate advised fund of Silicon Valley Community Foundation.
Conflicts of Interest
The authors declare no conflict of interest.
Nomenclature
| psub | The number of subsystems after decomposition |
| subsys_k | The label of subsystem after decomposition (1 ≤ k ≤ psub) |
| N | The number of buses in a power system |
| M | The number of transmission lines in a power system |
| MTIE | The number of tie lines |
| Nk | The number of buses in subsys_k |
The number of buses in subsys_k after extension | |
| Mp | The number of transmission lines in subsys_k |
The number of transmission lines in subsys_k after extension | |
| busi | Load bus/generators in power system, labeled according to the definition in the Institute of Electrical and Electronics Engineers (IEEE) standard case (1 ≤ i ≤ N) |
| Li,j | The transmission line connecting busi and busj |
| Pi,j | The active line power flow from busi to busj, observed on busi |
| x | State variables in power system, x = [x1,x2,…,xn]T |
| z | Measurements in power system, z = [z1,z2,…,zm]T |
| e | Measurements noise e = [e1,e2,…,em]T |
| R | The diagonal measurement covariance matrix |
| h(x) | The nonlinear function relating measurements z to state variables x |
| o | The degree of freedom in power system |
| To,p | The threshold of o degree of freedom corresponding to a detection confidence with probability p |
| xk | States variables in subsys_k, |
| zk | Measurements in subsys_k, |
| hk(xk) | The nonlinear function relating measurements zk to states variables xk in subsys_k |
| ok | The degree of freedom in subsys_k |
| ak | The false data injection attack (if exists) in subsys_k |
| G | The graph model for given smart grid |
The extension status of i th tie-line in subsys_k | |
| IDL | Injected data levels, the relative injected error against the original value of measurement |
References
- Bou-Harb, E.; Fachkha, C.; Pourzandi, M.; Debbabi, M.; Assi, C. Communication security for smart grid distribution networks. IEEE Commun. Mag. 2013, 51, 42–49. [Google Scholar]
- Schweppe, F.C.; Wildes, J. Power system static-state estimation, Part I: Exact model. IEEE Trans. Power Appar. Syst. 1970, PAS-89, 120–125. [Google Scholar]
- Abur, A.; Exposito, A.G. Power System State Estimation: Theory and Implementation; CRC Press: Boca Raton, FL, USA, 2004; pp. 44–80. [Google Scholar]
- Hug, G.; Giampapa, J.A. Vulnerability Assessment of AC state estimation with respect to false data injection cyber-attacks. IEEE Trans. Smart Grid 2012, 3, 1362–1370. [Google Scholar]
- Kosut, O.; Liyan, J.; Thomas, R.J.; Lang, T. Malicious data attacks on the smart grid. IEEE Trans. Smart Grid 2011, 2, 645–658. [Google Scholar]
- Giani, A.; Bitar, E.; Garcia, M.; McQueen, M.; Khargonekar, P.; Poolla, K. Smart grid data integrity attacks. IEEE Trans. Smart Grid 2013, 4, 1244–1253. [Google Scholar]
- Xie, L.; Mo, Y.; Sinopoli, B. Integrity data attacks in power market operations. IEEE Trans. Smart Grid 2011, 2, 659–666. [Google Scholar]
- Liu, Y.; Ning, P.; Reiter, M.K. False data injection attacks against state estimation in electric power grids. ACM Trans. Inf. Syst. Secur. (TISSEC) 2011, 14, 21–32. [Google Scholar]
- Huang, Y.; Esmalifalak, M.; Nguyen, H.; Zheng, R.; Han, Z.; Li, H.; Song, L. Bad data injection in smart grid: Attack and defense mechanisms. IEEE Commun. Mag. 2013, 51, 27–33. [Google Scholar]
- Yang, Q.; Yang, J.; Yu, W.; An, D.; Zhang, N.; Zhao, W. On false data injection attacks against power system state estimation: modeling and countermeasures. IEEE Trans. Parallel Distrib. Syst. 2013, 25, 717–729. [Google Scholar]
- Bobba, R.B.; Rogers, K.M.; Wang, Q.; Khurana, H.; Nahrstedt, K.; Overbye, T.J. Detecting False Data Injection Attacks on DC State Estimation. Proceedings of the Preprints of the First Workshop on Secure Control Systems, CPSWeek, Stockholm, Sweden, 12 April 2010.
- Dán, G.; Sandberg, H. Stealth Attacks and Protection Schemes for State Estimators in Power Systems. Proceedings of the First IEEE International Conference on Smart Grid Communications (SmartGridComm), Gaithersburg, MD, USA, 4–6 October 2010; pp. 214–219.
- Vukovic, O.; Kin, C.S.; Dan, G.; Sandberg, H. Network-aware mitigation of data integrity attacks on power system state estimation. IEEE J. Sel. Areas Commun. 2012, 30, 1108–1118. [Google Scholar]
- Kim, T.T.; Poor, H.V. Strategic protection against data injection attacks on power grids. IEEE Trans. Smart Grid 2011, 2, 326–333. [Google Scholar]
- Pasqualetti, F.; Dorfler, F.; Bullo, F. Cyber-Physical Attacks in Power Networks: Models, Fundamental Limitations and Monitor Design. Proceedings of the 50th IEEE Conference on Decision and Control and European Control Conference (CDC-ECC), Orlando, FL, USA, 12–15 December 2011; pp. 2195–2201.
- Shuguang, C.; Zhu, H.; Kar, S.; Kim, T.T.; Poor, H.V.; Tajer, A. Coordinated data-injection attack and detection in the smart grid: A detailed look at enriching detection solutions. IEEE Signal Process. Mag. 2012, 29, 106–115. [Google Scholar]
- Zonouz, S.; Rogers, K.M.; Berthier, R.; Bobba, R.B.; Sanders, W.H.; Overbye, T.J. SCPSE: Security-oriented cyber-physical state estimation for power grid critical infrastructures. IEEE Trans. Smart Grid 2012, 3, 1790–1799. [Google Scholar]
- Choi, D.-H.; Xie, L. Fully Distributed Bad Data Processing for Wide Area State Estimation. Proceedings of the IEEE International Conference on Smart Grid Communications (SmartGridComm), Brussels, Belgium, 17–20 October 2011; pp. 546–551.
- Xie, L.; Dae-Hyun, C.; Kar, S.; Poor, H.V. Fully distributed state estimation for wide-area monitoring systems. IEEE Trans. Smart Grid 2012, 3, 1154–1169. [Google Scholar]
- Electric Rates, Availiable online: http://www.pge.com/nots/rates/tariffs/electric.shtml#RESELEC (accessed on 30 October 2013).
- Wang, Z.; Gao, F.; Zhai, Q.; Wu, J.; Guan, X.; Zhang, H.; Liu, K.; Pan, L.; Dong, M. A Gradient Information Based Real Time Pricing Mechanism for Microgrid in Energy Intensive Enterprise. Proceedings of the 10th World Congress on Intelligent Control and Automation (WCICA), Beijing, China, 6–8 July 2012; pp. 2473–2478.
- Reid, G.F.; Hasdorff, L. Economic dispatch using quadratic programming. IEEE Trans. Power Appar. Syst. 1973, PAS-92, 2015–2023. [Google Scholar]
- Zimmerman, R.D.; Murillo-Sanchez, C.E.; Thomas, R.J. MATPOWER's Extensible Optimal Power Flow Architecture. Proceedings of the Power & Energy Society General Meeting, Calgary, AB, Canada, 26–30 July 2009; pp. 1–7.
- Dommel, H.W.; Tinney, W.F. Optimal power flow solutions. IEEE Trans. Power Appar. Syst. 1968, PAS-87, 1866–1876. [Google Scholar]
- Hespanha, J.P. An Efficient MATLAB Algorithm for Graph Partitioning; Department of Electrical and Computer Engineering, University of California, Santa Barbara: Santa Barbara, CA, USA, 8 October 2004, pp. 25–67.
- Zhang, Q.; Couloigner, I. A New and Efficient k-Medoid Algorithm for Spatial Clustering. In Computational Science and Its Applications—ICCSA 2005; Springer: Berlin/Heidelberg, Germany, 2005; pp. 181–189. [Google Scholar]
- Karypis, G.; Han, E.; Kumar, V. Chameleon: Hierarchical clustering using dynamic modeling. Computer 1999, 32, 68–75. [Google Scholar]
- Dopazo, J.F.; Ehrmann, S.T.; Sasson, A.M.; van Slyck, L.S. The AEP state estimation monitoring and security system. IEEE Trans. Power Appar. Syst. 1976, 95, 1618–1624. [Google Scholar]
- Vukovic, O.; Dan, G. On the Security of Distributed Power System State Estimation under Targeted Attacks. Proceedings of the 28th Annual ACM Symposium on Applied Computing, Coimbra, Portugal, 18–22 March 2013; pp. 666–672.
- Jiang, W.; Vittal, V.; Heydt, G.T. A distributed state estimator utilizing synchronized phasor measurements. IEEE Trans. Power Syst. 2007, 22, 563–571. [Google Scholar]


| System | Success probability with different IDL (%) | ||||||||
|---|---|---|---|---|---|---|---|---|---|
| 25% | 50% | 75% | 100% | 125% | 150% | 175% | 200% | ||
| IEEE 57 | 67 | 60 | 56 | 53 | 48 | 44 | 37 | 31 | |
| IEEE 300 | 72 | 66 | 61 | 58 | 55 | 52 | 47 | 41 | |
| IEEE 39-bus system | IEEE 57-bus system | IEEE 118-bus system | |||
|---|---|---|---|---|---|
| IDL | Detection precision | IDL | Detection precision | IDL | Detection precision |
| 10% | 67% | 120% | 51% | 150% | 75% |
| 20% | 76% | 150% | 56% | 200% | 82% |
| 30% | 89% | 200% | 69% | 250% | 86% |
| 40% | 96% | 300% | 76% | 300% | 88% |
| 50% | 100% | 400% | 79% | 350% | 93% |
| 60% | 100% | 500% | 85% | 400% | 94% |
| Algorithm 1 | LGPM |
| Data | The adjacency matrix A = {ai,j} for graph G; the number of subgraphs N |
| Subgraphs Gi (i = 1,2,…,N) | |
| Result | 1. Normalize a nonnegative symmetric matrix A′ from A and make it doubly stochastic; |
| 2. Spectural Partition: Calculate the N largest eigenvectors Ui (i = 1,2,…,N); | |
| 3. A general clustering algorithm (k-means or EM) using {Ui} and N as input s is adopted to get the attribution of each vertices; | |
| 4. Generate the adjacency matrix for each subgraphs. |
| System | Bus | n | m | o | To,p |
|---|---|---|---|---|---|
| Subsys_1 | 1,2,3,4,5,6,7,9 | 15 | 40 | 25 | 43.77 |
| Subsys_2 | 4,5,6,7,8,9,10,11,12,13,14 | 21 | 52 | 31 | 51.00 |
| Global | All | 27 | 80 | 53 | 72.15 |
| Attack Case | Modified measurement | Pi,j (MW) | Pj,i (MW) | ||
|---|---|---|---|---|---|
| Original value | Injected value | Original value | Injected value | ||
| Attack Case 1 | L4,5 | −61.16 | −122.32 | 61.67 | 122.34 |
| Attack Case 2 | L6,13 | 17.75 | 53.24 | −17.54 | −52.61 |
| Attack Case 3 | L5,6 | 66.13 | 99.20 | −66.13 | −99.20 |
| Attack Case | Global | Subsys_1 | Subsys_2 | |||
|---|---|---|---|---|---|---|
| To,p | To,p | To,p | ||||
| Attack Case 1 | 72.15 | 54.91 | 43.77 | 51.98 | 51.00 | 25.22 |
| Attack Case 2 | 66.04 | 13.11 | 59.05 | |||
| Attack Case 3 | 54.73 | 19.28 | 53.48 | |||
| System | N_bus | n | m | o | To,p |
|---|---|---|---|---|---|
| Subsys_1 | 16 | 31 | 68 | 37 | 53.38 |
| Subsys_2 | 17 | 33 | 76 | 43 | 60.48 |
| Subsys_3 | 14 | 27 | 56 | 29 | 35.05 |
| Global | 39 | 77 | 184 | 107 | 133.26 |
| IDL | Undetected lines | |
|---|---|---|
| Chi-squares Test | EDSE | |
| −50% | L19,20, L20,34, L22,35 | None |
| −40% | L19,20, L19,33, L20,34, L22,35, L25,37 | None |
| −30% | L19,20, L19,33, L20,34, L22,35, L23,36, L25,37 | L19,20, L20,34 |
| −20% | L10,11, L10,13, L10,32, L19,20, L19,33, L20,34, L22,35, L23,36, L25,37, L28,29,L29,38 | L9,39, L19,20, L20,34, L22,35, L25,37 |
| +20% | L10,32, L16,19, L19,33, L20,34, L22,35, L23,36, L25,37, L28,29 | L19,20 |
| +30% | L19,20, L20,34 | None |
| IEEE standard system | Running time (s) | ||
|---|---|---|---|
| The Chi-squares test | EDSE (Serial) | EDSE (Parallel) | |
| 14-bus | 0.015 | 0.022 | 0.011 |
| 39-bus | 0.063 | 0.047 | 0.013 |
| 118-bus | 0.791 | 0.207 | 0.084 |
| 300-bus | 123.695 | 7.470 | 5.650 |
| Number of subsystems | Running time(s) | Detection precision | Number of buses in the largest subsystem | |
|---|---|---|---|---|
| EDSE (Serial) | EDSE (Parallel) | |||
| 1 | N/A | 0.76 | 39 | |
| 2 | 0.0432 | 0.0309 | 0.83 | 28 |
| 3 | 0.0379 | 0.0157 | 0.87 | 17 |
| 4 | 0.0426 | 0.0153 | 0.91 | 17 |
| 5 | 0.048 | 0.0138 | 0.93 | 15 |
| 6 | 0.0522 | 0.0123 | 0.87 | 13 |
| 7 | 0.0597 | 0.0122 | 0.87 | 12 |
| 8 | 0.0624 | 0.0119 | 0.83 | 12 |
© 2014 by the authors; licensee MDPI, Basel, Switzerland. This article is an open access article distributed under the terms and conditions of the Creative Commons Attribution license ( http://creativecommons.org/licenses/by/3.0/).
Share and Cite
Wang, D.; Guan, X.; Liu, T.; Gu, Y.; Shen, C.; Xu, Z. Extended Distributed State Estimation: A Detection Method against Tolerable False Data Injection Attacks in Smart Grids. Energies 2014, 7, 1517-1538. https://doi.org/10.3390/en7031517
Wang D, Guan X, Liu T, Gu Y, Shen C, Xu Z. Extended Distributed State Estimation: A Detection Method against Tolerable False Data Injection Attacks in Smart Grids. Energies. 2014; 7(3):1517-1538. https://doi.org/10.3390/en7031517
Chicago/Turabian StyleWang, Dai, Xiaohong Guan, Ting Liu, Yun Gu, Chao Shen, and Zhanbo Xu. 2014. "Extended Distributed State Estimation: A Detection Method against Tolerable False Data Injection Attacks in Smart Grids" Energies 7, no. 3: 1517-1538. https://doi.org/10.3390/en7031517