Coordinated Control of Distributed and Bulk Energy Storage for Alleviation of Post-Contingency Overloads

Abstract
: This paper presents a novel corrective control strategy that can effectively coordinate distributed and bulk energy storage to relieve post-contingency overloads. Immediately following a contingency, distributed batteries are implemented to provide fast corrective actions to reduce power flows below their short-term emergency ratings. During the long-term period, Pumped Hydro Storage units work in pumping or generation mode to aid conventional generating units keep line flows below the normal ratings. This problem is formulated as a multi-stage Corrective Security-constrained OPF (CSCOPF). An algorithm based on Benders decomposition was proposed to find the optimal base case solution and seek feasible corrective actions to handle all contingencies. Case studies based on a modified RTS-96 system demonstrate the performance and effectiveness of the proposed control strategy.1. Introduction
Power systems have been operating in the way that requires the base case operating point can withstand an unexpected loss of components [1]. However, the traditional preventive dispatch is conservative, very costly, and even infeasible to implement for potentially dangerous contingencies [2]. Changing the dispatch paradigm from preventive to corrective would be useful to manage this situation, as it can take into account the operator's ability to take corrective actions after an outage occurs [3]. Corrective actions can eliminate post-contingency overloads on affected transmission lines, allowing the system operates with relaxed security but lower costs in the normal state. The primary tools for achieving this goal are programs for solving Corrective Security-constrained Optimal Power Flow (CSCOPF) problems [4–8].
Generation redispatch [3–7,9] is a commonly used corrective action incorporated in the CSCOPF to remedy post-contingency overloads, in which operators send orders to generators to increase/decrease their output in the event that any single generating unit or transmission line suddenly trips. However, this form of corrective action is only effective in the case of post-contingency power flows on lines are lower than their short-term emergency (STE) ratings [10], because most generators cannot adjust their output fast enough to relieve the STE overloads within several min, due to their slow ramp up/down rates [11]. In the literature, many researchers [4–7] have not considered the STE limits in their CSCOPF models, which eases the real-time computational burden, but ignoring such short-term emergency overloads may lead to cascading line tripping before the operator has redispatched generators [12]. In current practice, if there are no fast-response corrective actions available in the system, the generating units should be dispatched out-of-merit in the pre-contingency state to make sure that no post-contingency power flows on the affected lines would surpass their STE ratings [2,12–15]. This preventive/corrective combined measure can guarantee security during the post-contingency short-term state, whereas the preventive actions raise the operating costs.
Load shedding [16,17] is considered as the last resort for operators to restore system security when other corrective actions are not sufficient. If this desperate action is executed, significant amounts of loads would be shed in critical areas. To mitigate the amount of lost loads, new techniques and devices are necessarily introduced into the network to extract excess generation or provide back-up power support for relieving N-1congestion.
Energy storage (ES) can deliver multiple benefits that enhance grid performance, such as load following, peak shaving, spinning reserve, stability enhancement and power quality improvements [18,19]. With the recent rapid development of energy storage technologies and their flexibility during operation, interest in introducing energy storage to remove transmission congestion has been growing [20]. The investigation by U.S. EPRI [21] indicates the technical feasibility and potential benefits of energy storage to remedy N-1 emergency overloads in thermally constrained networks. In [22], an enhanced SCOPF formulation was studied, which incorporates the battery energy storage systems for relieving transmission emergency congestion. The combination of energy storage and FACTS devices was proposed to allow higher power transfer levels [23] and minimize power not served after the severe fault conditions [24].
In this paper, we focus on the use of different types of energy storage as corrective control resources to remove post-contingency overloads. Since the effectiveness of different energy storage technologies for corrective control is constrained not only by their ramp speed, but also the power and energy capacity that they are able to inject or store to cope with a contingency [25], the control of various forms of energy storage to relieve overloads has to be coordinated. The main contribution of this work is two-fold:
- (1)
A novel control strategy that can effectively coordinate distributed and bulk energy storage to relieve post-contingency overloads is proposed. Under the normal operating condition, this paradigm would reduce generation costs and increase the transmission capability. Following a contingency, control on a short-term and long-term timescale would reallocate the distributed and bulk energy storage to alleviate the violations.
- (2)
This problem is formulated as a multi-stage CSCOPF, and an algorithm based on Benders decomposition was proposed for the solution of the optimal base case dispatch and feasible corrective actions.
The remainder of this paper is organized as follows: Section 2 explains the coordinate control strategy of distributed and bulk energy storage. Section 3 details the mathematic model formulation. The solution methodology is given in Section 4. Section 5 presents the test results of case studies, and finally, Section 6 states the conclusions.
2. Coordinated Control Strategy
2.1. Post-Contingency Timeline
Every conductor used in transmission networks has associated thermal ratings [10], such as normal (continuous), STE, and long-term emergency (LTE) ratings. As in CSCOPF, the LTE rating is usually set the same as the normal rating, given the STE and normal rating for a circuit, the post-contingency timeline can be divided into two periods:
- (1)
Short-term period: Time period from the end of the transient stability region until the power flows on overloaded lines are brought back within their long-term ratings. This time period can only be last for a very short time period (typically 15 min).
- (2)
Long-term period: Time period during which the power flows on overloaded lines are limited below the long-term (normal) ratings. The time period is typically 30 min to several hours.
An understanding of the post-contingency timeline will help in choosing which storage technologies are best for a specific corrective control application.
2.2. Available Storage Technologies for Corrective Control
In some severe contingency scenarios, the power flow on an affected line may exceed its normal and STE ratings. Distributed ES (i.e., batteries) and bulk ES, such as Pumped Hydro Storage (PHS), Compressed Air Energy Storage (CAES), and some types of large batteries, can be controlled to correct the short-term and long-term violations. In this paper, two different energy storage systems, namely batteries and PHS are illustrated adapting to the proposed control strategy. Table 1 makes comparison of the key characteristics between current battery storage and PHS [25].
Batteries are one of the most cost-effective energy storage options available, which normally have limited power and energy capacity but with very fast ramp rate, capable of transitioning from zero to full output in microseconds to several seconds [26,27]. In addition, batteries can be containerized and easily installed in distributed applications across the transmission network [28]. Contribution to these characteristics, distributed batteries are suitable for providing fast corrective actions in the post-contingency short-term period.
PHS is the most widely implemented grid-scale energy storage, which typically provides hundreds to thousands of megawatts of capacity in a single facility [29,30]. Originally, these units were used for daily energy management [31,32], while the newer adjustable speed system design allows PHS with a flexible ability to adjust their input and output power in the pumping mode as well, PHS can thus provide ancillary services (frequency regulation, contingency reserves, etc.) or support the integration of renewable energy sources, which greatly increases overall plant efficiency [18,29,33,34]. We only consider the PHS units with adjustable speed system for enhancing system corrective security. Compared to the battery storage, PHS units have relatively slower response speed but much larger power and energy capacity, could be utilized to alleviate post-contingency long-term congestion.
2.3. Coordinated Control Strategy
The operator must deploy the distributed and bulk energy storage in a timely manner to clear the post-contingency short- and long-term violations. To coordinated control these storage units for relief of transmission N-1 congestion, two types of corrective control are proposed:
- (1)
Short-term Corrective Control: During the short-term period, distributed batteries are implemented to provide fast corrective actions. In this way, the immediately post-contingency flows could be larger than the STE rating, however the violations can be alleviated instantly by batteries. This control method ensures that the post-contingency system be stable to endure until the generators and PHS units have completely adjusted their output.
- (2)
Long-term Corrective Control: During the long-term period, PHS units work in pumping mode to absorb excess generation, or in generation mode to provide back-up power support. These corrective actions aid generating units keep line flows below the normal ratings. In this way, load shedding could be mitigated or avoided under some severe contingency conditions (i.e., failures of a large generator or a major transmission line).
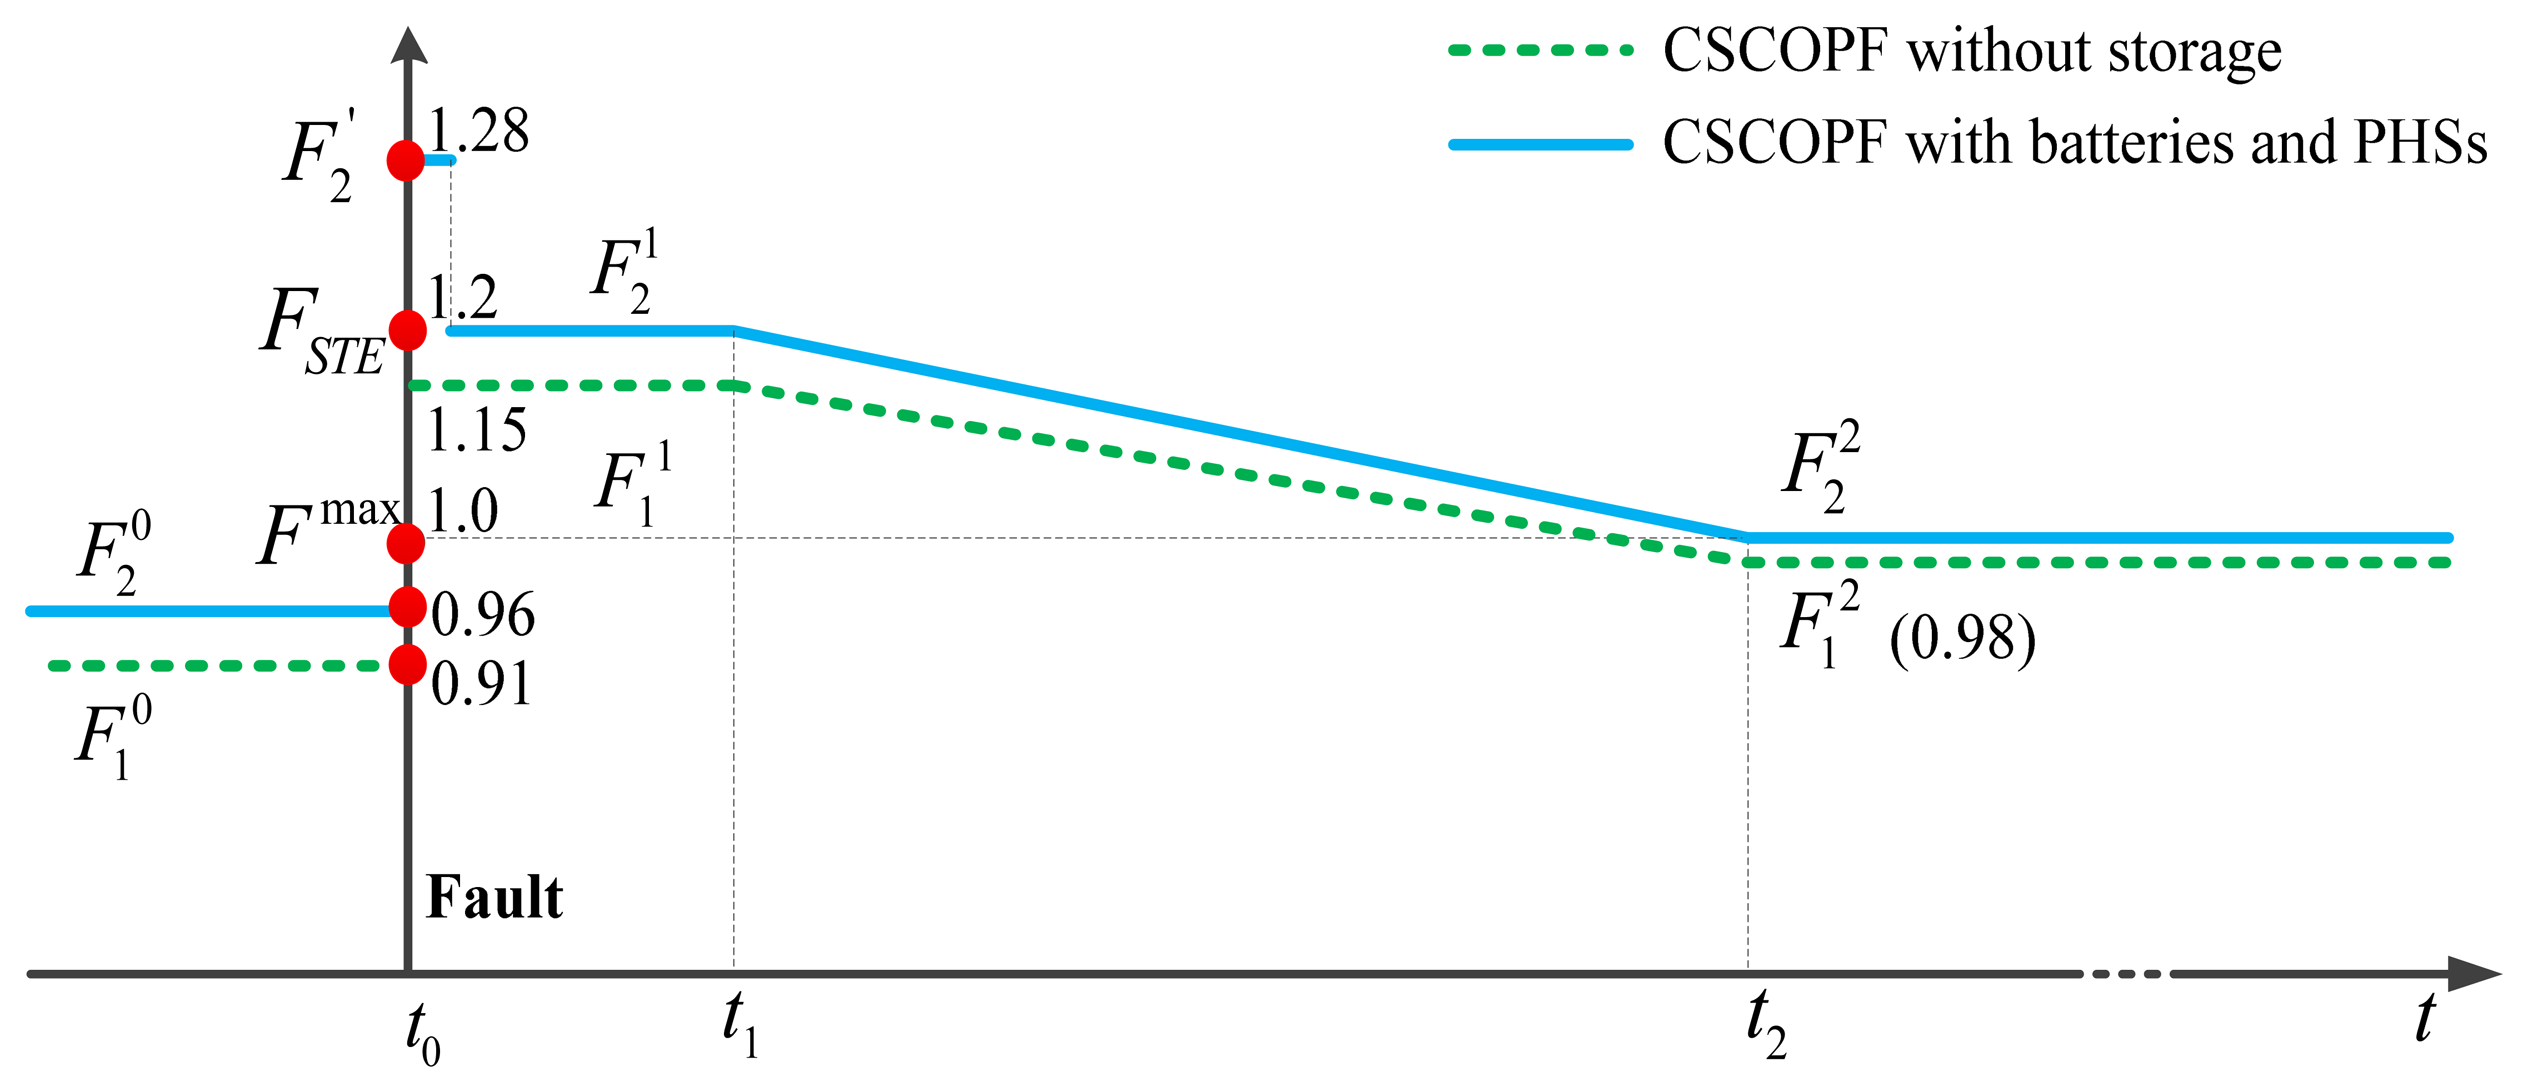
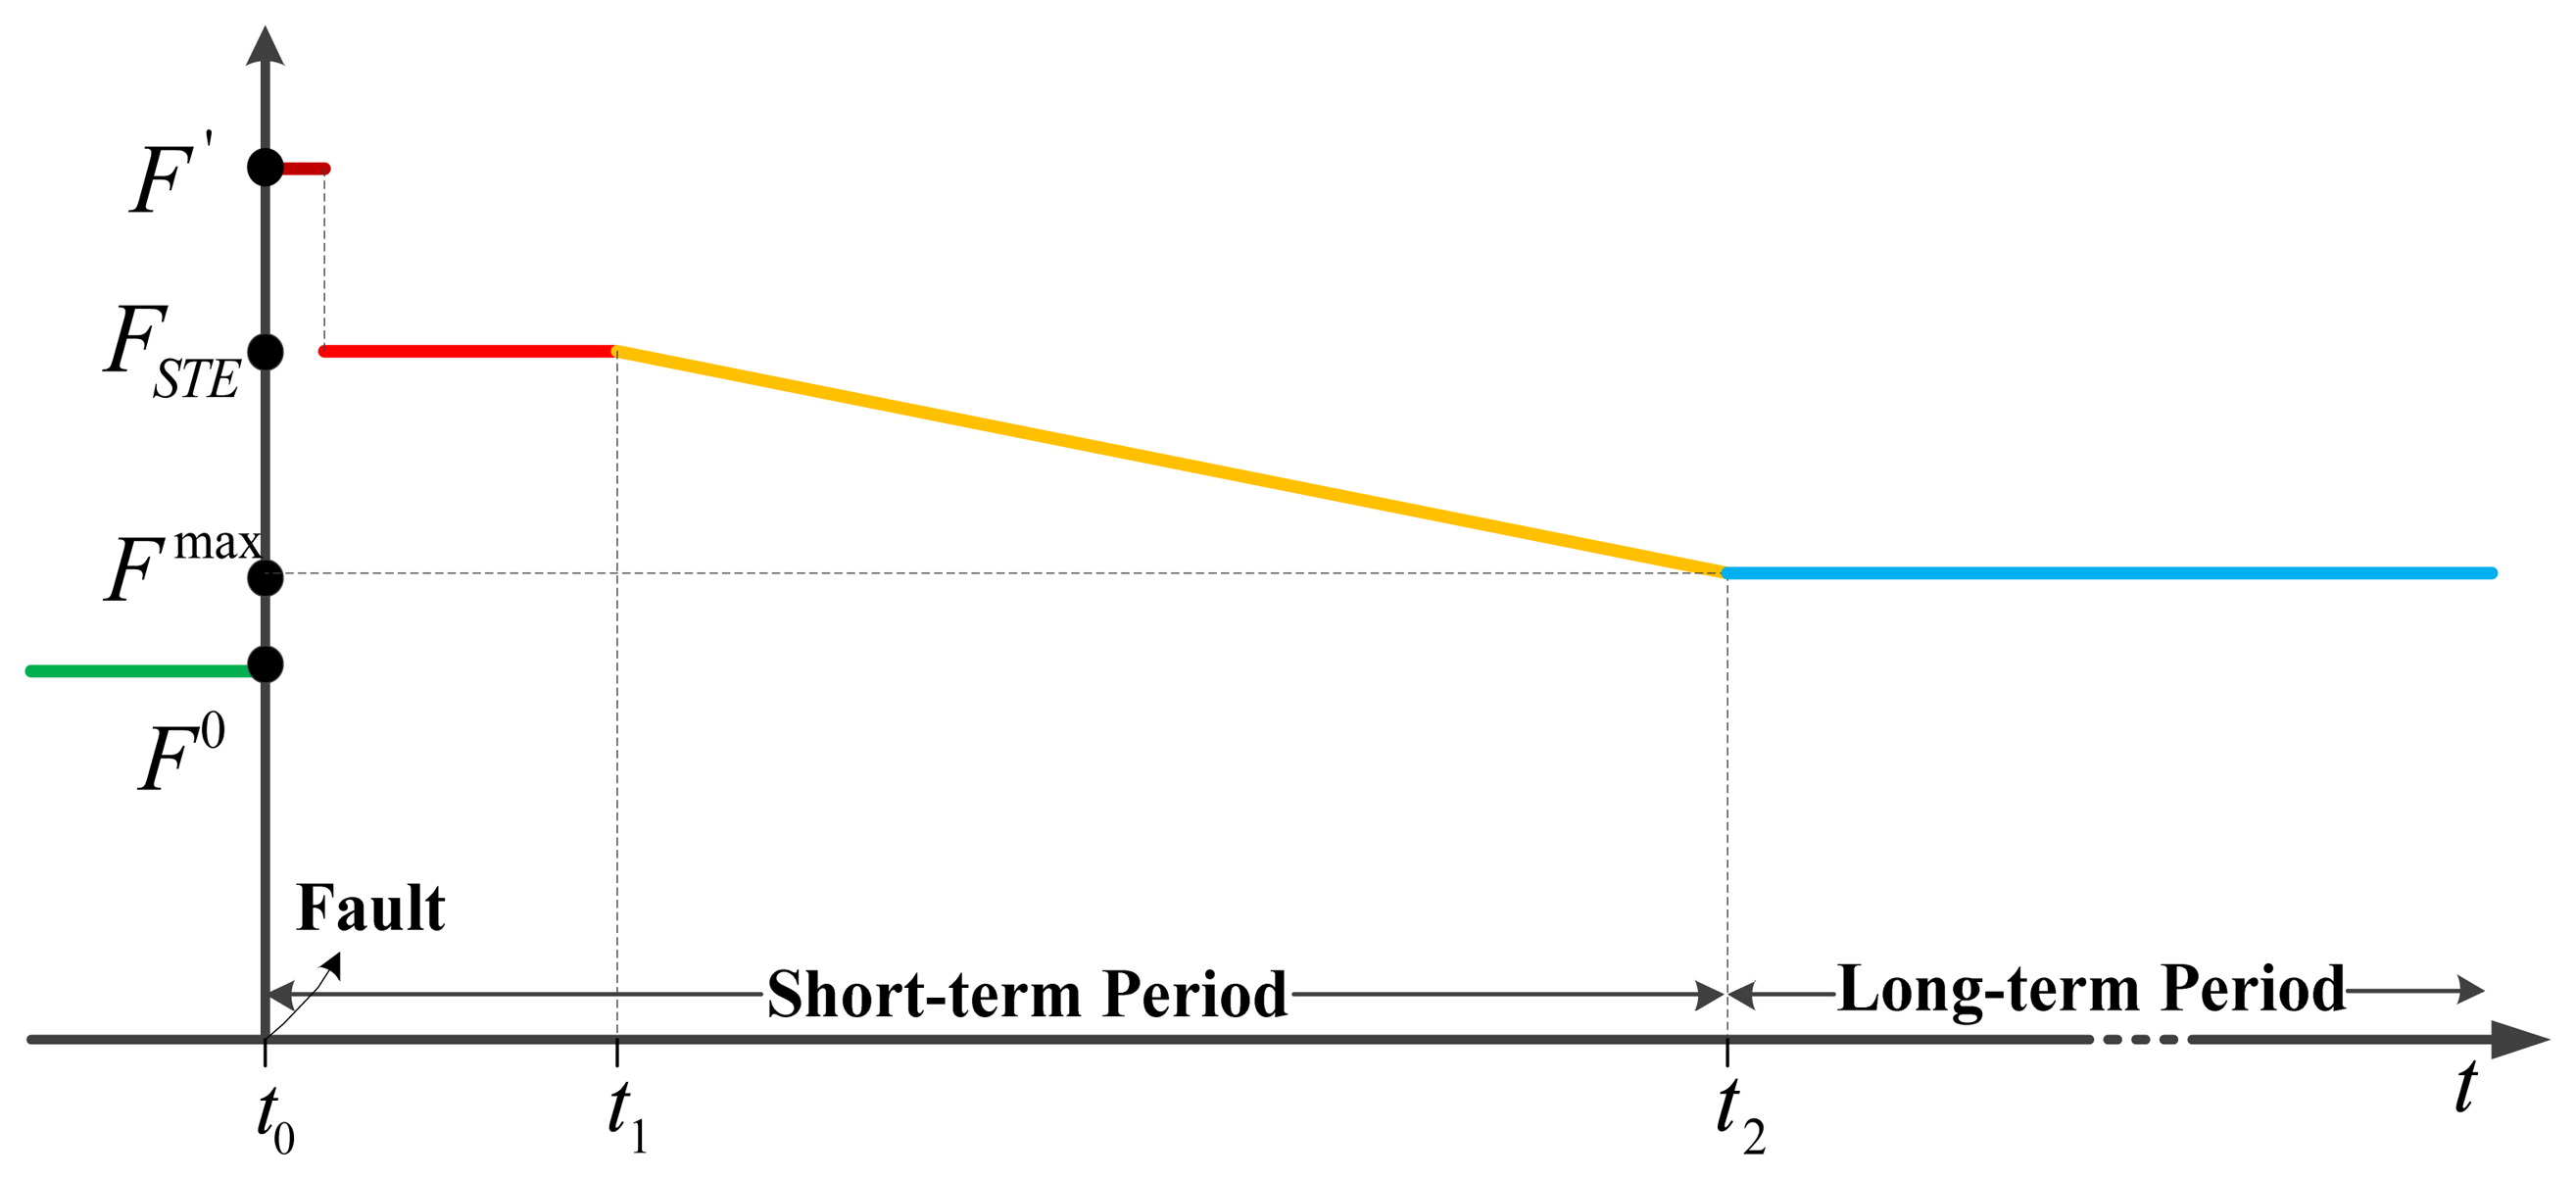
The detailed process of the proposed coordinated control strategy of distributed batteries and PHS units to relieve the post-contingency overloads is given as follows. To help understand, Figure 1 illustrates the evolution of power flow on an overloaded line (F0 in this figure represents the pre-contingency flow).
| Step 1: | Immediately after the fault occurs at time t0, distributed batteries are controlled instantly to discharge or charge power to bring the post-contingency line flows (F′) back down with their short-term emergency ratings (FSTE). Then, the power injections from distributed batteries will remain constant until time t1 when generators and PHS units start ramping. |
| Step 2: | During the ramping period from time t1 to t2, generators and PHS units adjust their output continuously. On the other hand, distributed batteries reduce continuously their injections and extractions, and consequently stop the charging/discharging process at time t2. During this time interval, the power flows on the overloaded lines decrease linearly until they reach their normal ratings (Fmax). |
| Step 3: | During the long-term period (after t2), the output of generators and PHS units keep constant to prevent the power flows exceeding the normal ratings. |
By implementing the proposed coordinated control, the post-contingency overloads on a transmission line could be corrected within the perspective of short- and long-term timeframes. To fulfill this control strategy, two key questions are required to be resolved:
- (1)
How much power should be discharged or charged instantly by batteries after a contingency occurs?
- (2)
How much power the PHS units should produce or absorb to aid generators removing long-term violations at time t2 (the operating point at the end of the short-term period)?
Given corrective actions at these two operating points, the post-contingency flows then could be controlled below the STE ratings and decreasing linearly during the ramping period (t1 to t2). Since security during this period is guaranteed, constraints associated with the ramping process are not necessarily considered in the CSCOPF model.
3. Problem Formulation
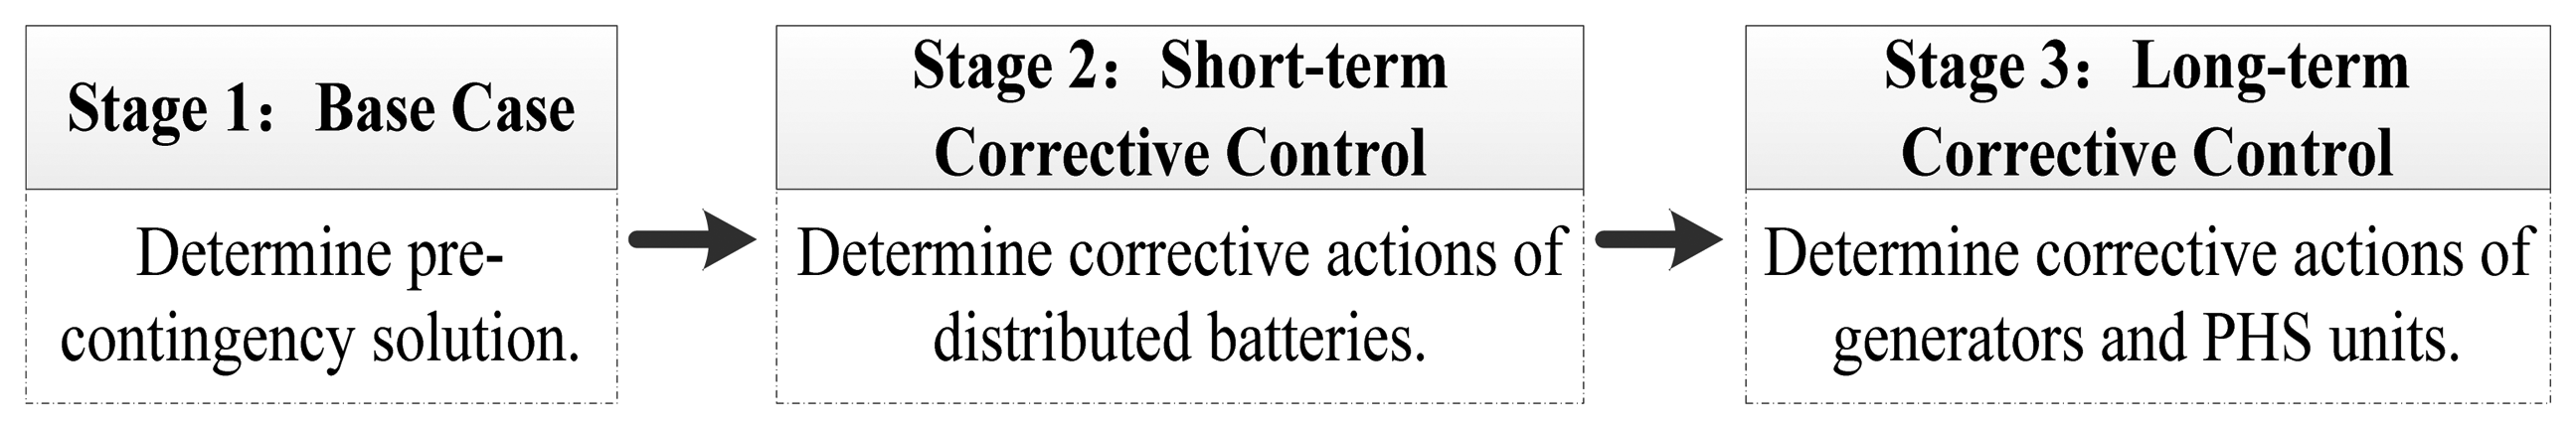
This problem is formulated as a three-stage CSCOPF formulation, explicitly modeling the timeframe to dispatch storage units to comply with the post-contingency security limits. The structure of this problem is shown in Figure 2. The first-stage problem determines the cheapest pre-contingency generation schedule with no continuous contribution from the energy storage units. For a given base case solution, the latter two-stage problems handle the post-contingency conditions, relieving the short- and long-term violations, respectively. Corrective actions in the post-contingency conditions involve those from distributed and bulk storage units, as well as those from conventional generators.
For simplicity sake, the pre- and post-contingency power flows are calculated using the DC power flow method, and generator outages are not considered. It is assumed that the energy stored and spare energy capacity available in each storage unit is large enough to cope with the contingencies. The best location for siting a battery to remove post-contingency short-term overloads is determined through the sensitivity analysis method given in [21].
3.1. Objective Function
The objective function is to minimize the base case generation cost of the generators, which is calculated using the quadratic cost functions:
The associated operating costs of storage units under contingency conditions are not included in the objective function [25,35,36]. The main reasons are given as follows:
- (1)
Energy storage normally have a high investment while relatively low operating cost [28].
- (2)
The probability of a contingency would occur is very small (close to zero), therefore, the expected operating costs for storage units to relieve overloads are not necessarily considered.
- (3)
Since the actual implementation of corrective actions occurs in real time, the proposed model is concerned about the feasibility of distributed and bulk storage units to comply with the post-contingency security, but not the optimal operating costs of such storage units to relieve overloads.
The objective function is subject to the pre-contingency, as well as the post-contingency short- and long-term security constraints.
3.2. Pre-Contingency Constraints
3.2.1. Power Balance Equation
The total generation should meet the load demand:
3.2.2. Base Case Transmission Limits
At base case, the power flows must not exceed the normal limits:
3.2.3. Power Output Limits
The power output of a generator should be within its limits:
3.3. Post-Contingency Short-Term Security Constraints
3.3.1. Power Balance Equation
The power output of generators remains the same immediately after the transmission contingency occurs. Thus, the power injections and extractions of the distributed batteries should be balanced to maintain the power balance in the system:
3.3.2. Short-Term Transmission Limits
Immediately following a contingency, distributed batteries respond instantly to bring line flows back within their short-term emergency ratings:
3.3.3. Power Limits of the Distributed Batteries
The battery is capable of transitioning from zero to full output continuously:
3.4. Post-Contingency Long-Term Security Constraints
3.4.1. Power Balance Equation
In the long-term period, the system power balance equation is as follows:
3.4.2. Long-Term Transmission Limits
The corrective actions from generators and PHS units should reset the power flows on each line be within its normal limit:
3.4.3. Generator Ramping Constraints
The redispatching amount of a generator should be within its ramping limits:
3.4.4. Generation Limits
The redispatched generation of a generator should be within its limits:
3.4.5. Online Status of the PHS Units
The online status of a PHS unit is modeled as follows:
3.4.6. Power Limits of the PHS Units
The power a PHS unit releases or absorbs should be within its limit:
4. Solution Approach
The proposed model is a large-scale mixed-integer programming (MIP) problem. It is difficult to solve the problem directly due to its high computing dimensionality, especially when the system is large and many N-1 contingencies are considered. Alternatively, Benders decomposition [37–39] can be used to solve this problem. The primal problem is decomposed into a master problem linked with two sets of Sub-problems. The master problem finds an optimal solution under normal state, which is an ordinary DC-OPF formulation augmented by the feasibility Benders cuts generated by the two sets of sub-problems. Sub-problems of type 1 and type 2 correspond to the second- and third-stage, seeking feasible corrective actions to remove the post-contingency short- and long-term overloads. It should be noted that non-negative slack variables are introduced to sub-problems 1 and 2 to ensure the problems are feasible. See the Appendix section for detailed models of the master and two types of sub-problems.
The master problem is solved using standard quadratic programming. Sub-problems 1 are linear, and can be solved using linear programming. Sub-problems 2 involve binary variables, the Branch-and-Cut method [40] is used to obtain feasible solution within a small duality gap. If the duality gap is set to zero, sub-problems 2 will obtain the optimal solution with a longer computation time.
The two sets of sub-problems are solved iteratively with the master problem until all short- and long-term post-contingency violations are removed using corrective actions (zero slack variables achieved). If, after solving a sub-problem, the corresponding slack variables are not equal to 0, then it is labeled an uncontrollable contingency, a feasibility Benders cut must be generated and added to the master problem for mitigating the violations in the next iteration:
The controllable contingencies are handled by corrective actions by storage and generating units without requiring any revisions to the existing base case solution.
The flowchart of the Benders decomposition based algorithm for solving the proposed multi-stage CSCOPF formulation is shown in Figure 3.
| Step 1: | Solve the master problem to determine an initial operating point; set the contingency index K = 1. |
| Step 2: | For contingency K, calculate the post-contingency power flows. |
| Step 3: | Check if the post-contingency flows are within their short-term emergency limits, if not, solve sub-problem 1 and generate a Benders cut for each sub-problem that is not feasible. |
| Step 4: | Check if all the post-contingency flows are within their long-term limits; for those that are not, solve a sub-problem of type 2 and generate a Benders cut when the problem is not feasible. |
| Step 5: | Let K = K + 1, and repeat steps 2 to 4. |
| Step 6: | When K > NC, if any sub-problems are not feasible, add the Benders cuts generated for each infeasible sub-problem to the master problem and repeat steps 1 to 5. Otherwise, stop and print solutions. |
5. Case Studies
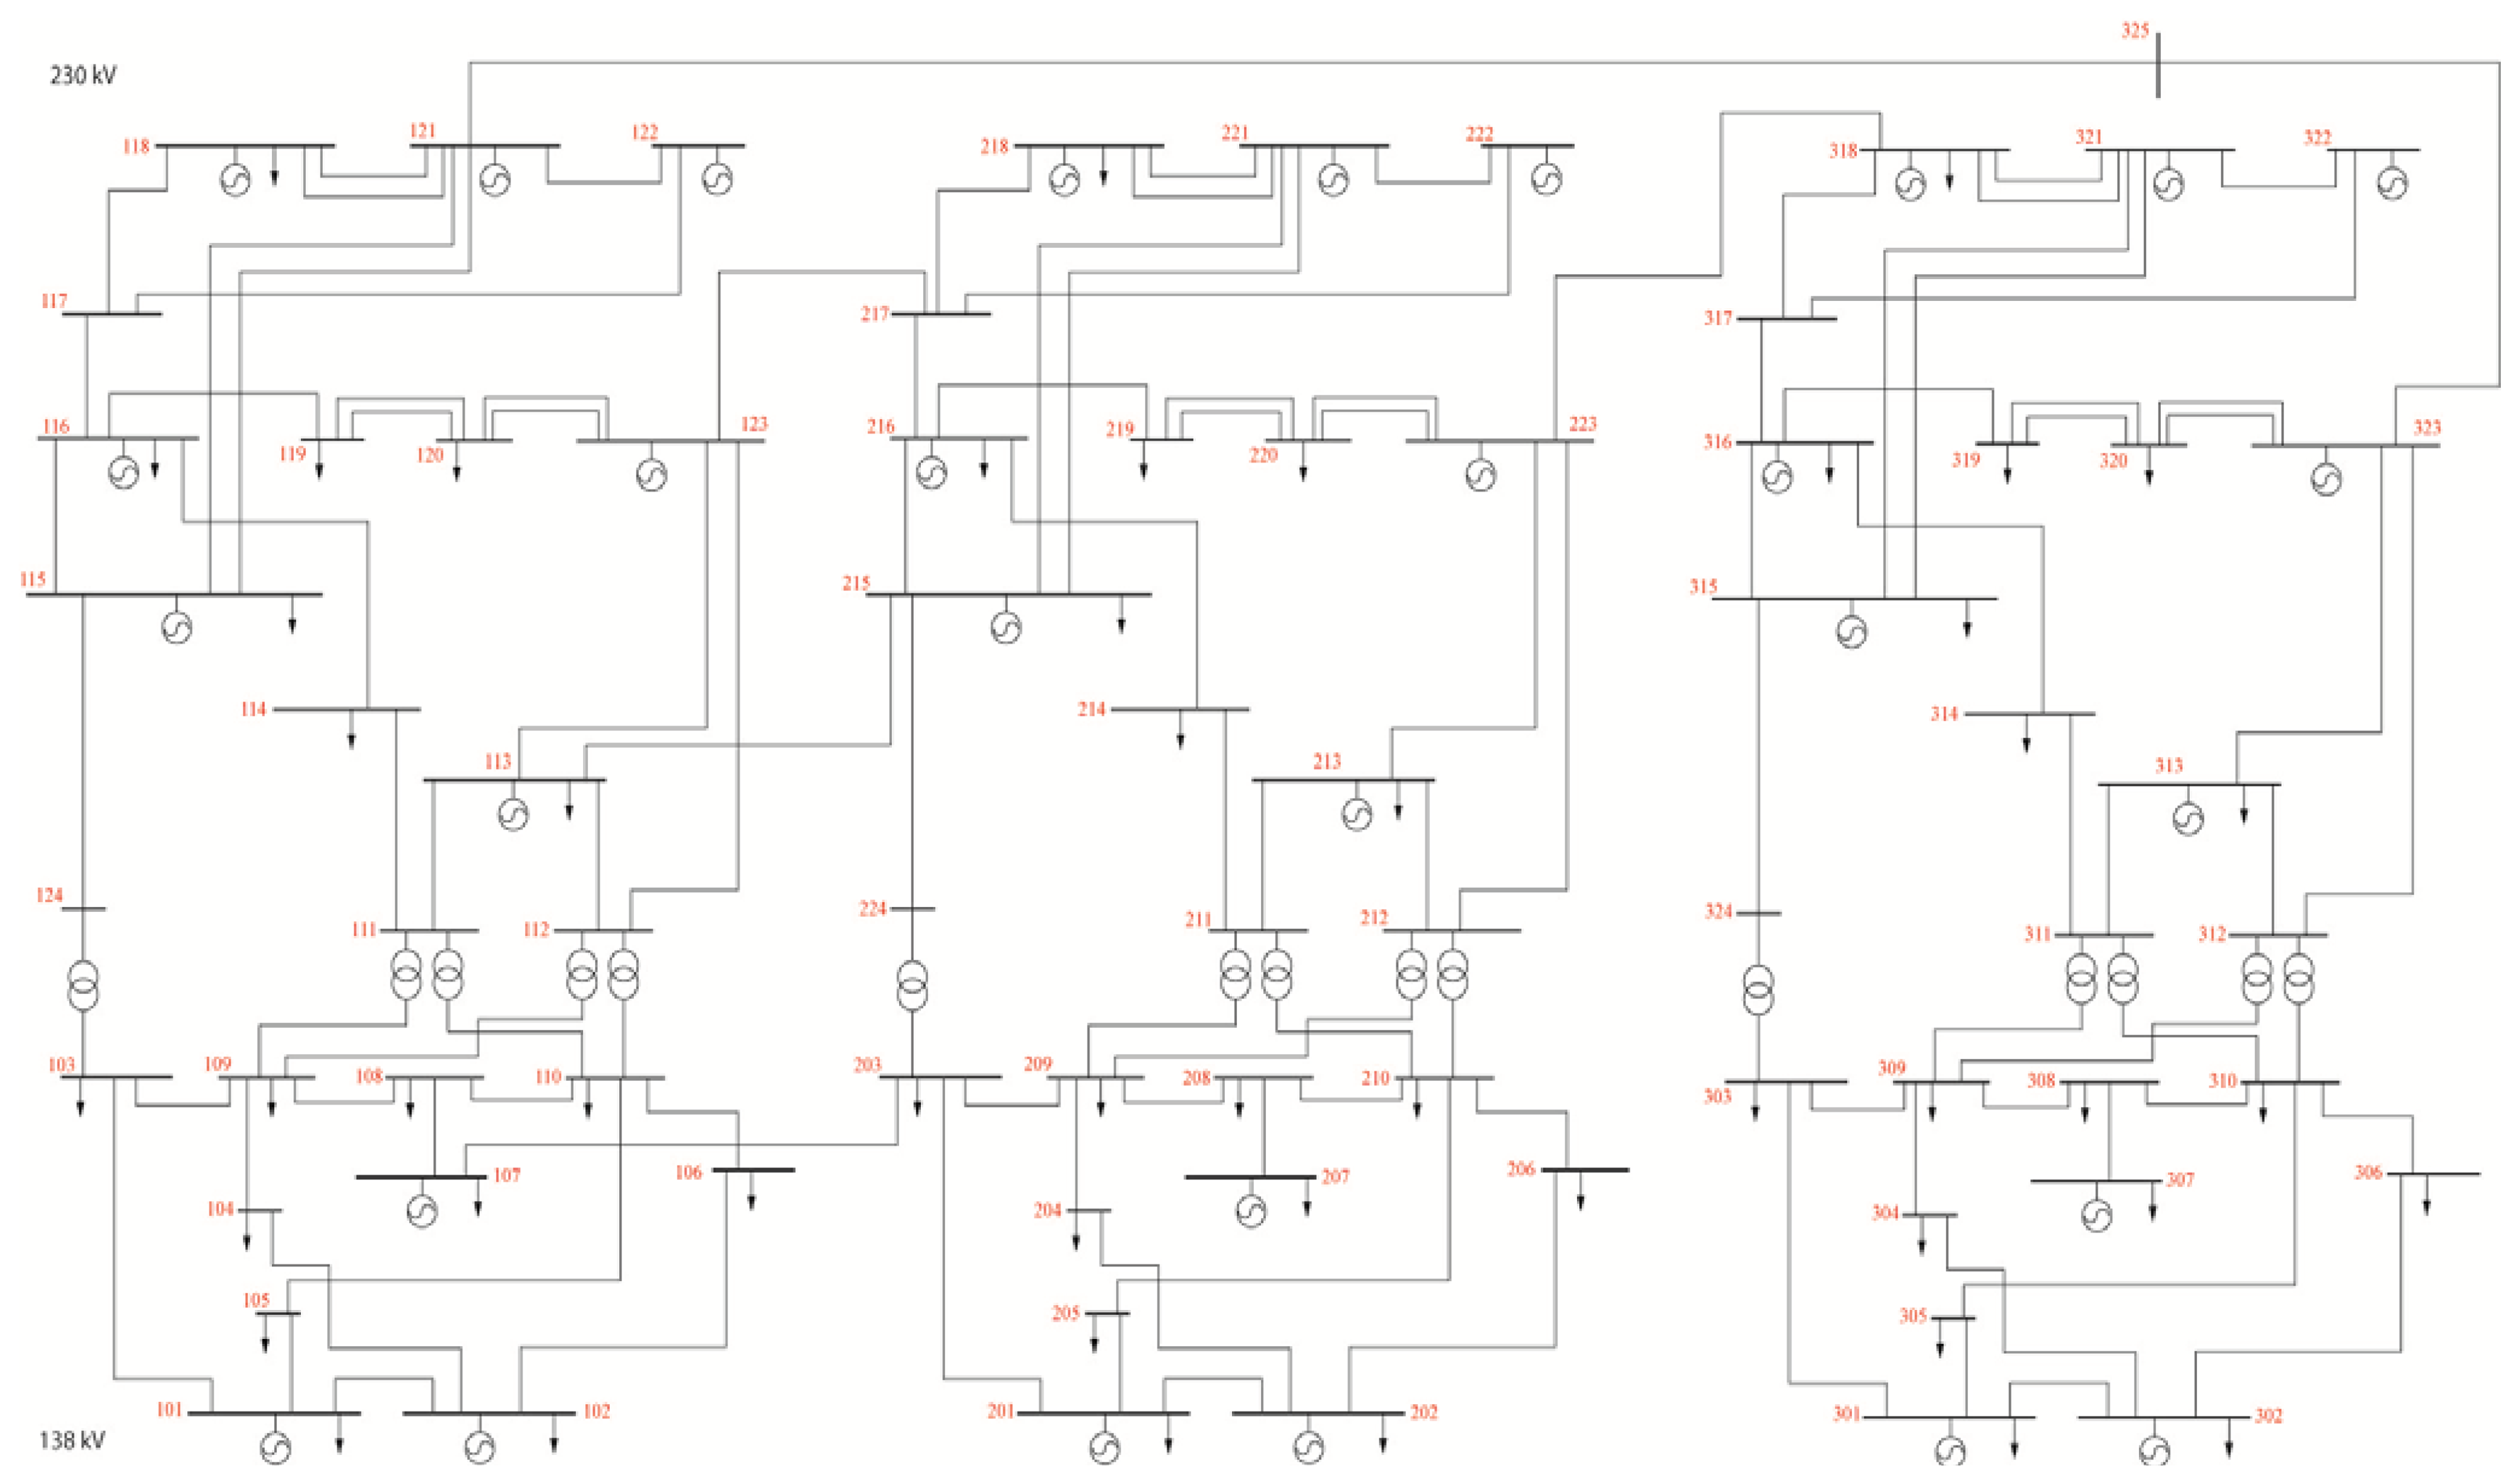
The proposed coordinated control strategy and algorithm have been tested using a modified RTS-96 system as shown in Figure 4, which consists of three interconnected areas (RTS-79 network), with 96 generators, 73 buses, and 120 lines. The modified line parameters of the RTS-96 system are given in Table A1 in the Appendix section. The STE rating of all lines is assumed to be 1.2 times larger than the normal rating. We consider all N-1 line outage contingencies as constraints of the CSCOPF model. All the experiments were performed on a personal computer with 4 Intel (R) Core (TM) i7-4700MQ CPU (2.4 GHz) and 8 Gb of memory. The programs are implemented using Matlab and CPLEX. To analyze the performance of the proposed coordinated control strategy, the following three cases were considered:
| Case 1: | Traditional CSCOPF without distributed or bulk energy storage installed in the system. Generators are preventively controlled to prevent the post-contingency flows exceeding the STE ratings. |
| Case 2: | CSCOPF with distributed batteries. 12 batteries each rated at 10 MW/10 MWh are distributedly installed in the system to provide short-term corrective actions. Only conventional generators are available to provide long-term corrective actions. The buses location of these batteries are: (106,108,113,114), (206,208,213,214), (306,308,313,314). |
| Case 3: | CSCOPF with distributed batteries and PHS units. The short-term corrective actions come from 12 batteries as described in Case 2. Both generators and 2 PHS units could provide long-term corrective actions. The location and power limits of the PHS units are given in Table 2. |
5.1. Results Obtained in Different Load Level
The simulation is performed for several load levels, in order to estimate the impact of distributed and bulk energy storage at different load levels. The base case load is 6122.2 MW, and the load level is increased in steps of 2.5%.
Tables 3, 4 and 5 show the results obtained by the three cases at each load level. NSC and NLC are the numbers of contingencies that result in a violation of the short-term and long-term limits, respectively. As increasing the load level, all the tables indicate an increase in the generation cost, and the CSCOPF models have to deal with more contingencies that violate the shot-term and long-term limits. The last column of Tables 3, 4 and 5 shows that the computation time for the three types of CSCOPF increases with the load level.
The CSCOPF without storage units is relatively costly. As no batteries were installed in the system, preventive actions have to be applied in the pre-contingency state to make sure that no short-term violations would occur, which increases the base case generation cost. On the other hand, since the model relies on generators to guard all the long-term security, under stress conditions (load level > 1.05), the overloads cannot be completely removed, load shedding have to be implemented to handle the contingencies, otherwise the program would be infeasible.
As shown in Table 4, the use of distributed batteries to prevent the power flows exceeding the STE ratings decreases the generation cost. For example, if the load level is 1.05, the generation cost obtained by the CSCOPF with batteries is $141,378, saving 0.3% compared to that without batteries ($141,812). It allows the system operates in a cheaper pre-contingency state, however generators are required to deal with more long-term violations. Note that distributed batteries in this model would rather aid generators to alleviate the long-term violations, nor further improve the system's maximum load ability.
Table 5 gives the results obtained by the CSCOPF when both distributed batteries and PHS units are available in the grid. Similar to Case 2, the post-contingency short-term overloads can be removed using corrective actions from the batteries. Moreover, the CSCOPF is able to withstand a much larger range of loads, owing to the PHS units. No loads are required to be shed or curtailed if the load level is not larger than 1.175. The maximum load level of the system increased 11.9% compared to those of Case 1 and Case 2. Therefore, the implementing of PHS units for long-term corrective control would greatly improve the system load ability and reduce the need for transmission expansion.
5.2. Pre- and Post-Contingency Power Flow Analysis
Figure 5 shows the evolution of the power flow on line L118 (the line connects buses 121 and 325) in the case of the outage of line L107 (the line connects buses 316 and 317). The dashed line in the figure represents the pre- and post-contingency flows obtained by the CSCOPF without storage (Case 1), the solid line represents the flows obtained by the CSCOPF with batteries and PHS units (Case 3). In both cases, the load level is 1.05.
As can be seen, if no storage units are placed, the pre-contingency loading level on line L118 is 0.91. After the outage of line L107, the immediately flow becomes 1.15, which is lower than the STE rating (1.2). In the long-term period, the flow (0.98) is adjusted to below the continuous rating (1.0).
If both distributed and bulk storage are installed, the pre-contingency loading level on line L118 is increased to 0.96. After the outage of line L107, the immediately flow (1.28) on line L118 would violate the STE rating. However, this flow is first reduced to the STE rating using the distributed batteries and then the continuous rating through power adjustment of the conventional generating units and PHS units. Hence, the coordinated control of batteries and PHS units provides means for efficient operation in the post-contingency state while still maintaining security in a robust way. It can thus enhance the transmission capability of certain transmission corridors, allowing the lines operating with higher power flows during the pre- and post-contingency state. As can be seen from Table 6, 71 lines in the RTS-96 network show an increase in their pre-contingency transmission capacity, including 27 lines in Area 1, 20 lines in Area 2, 21 lines in Area 3, and three tie-lines (L24, L118, L120) connect those two areas.
5.3. Corrective Actions of CSCOPF with Distributed and Bulk Storage
The short-term and long-term corrective actions in Case 3 (the load level is 1.05) are given in this part to further explain how the post-contingency overloads were cleared using coordinated control of distributed and bulk storage units.
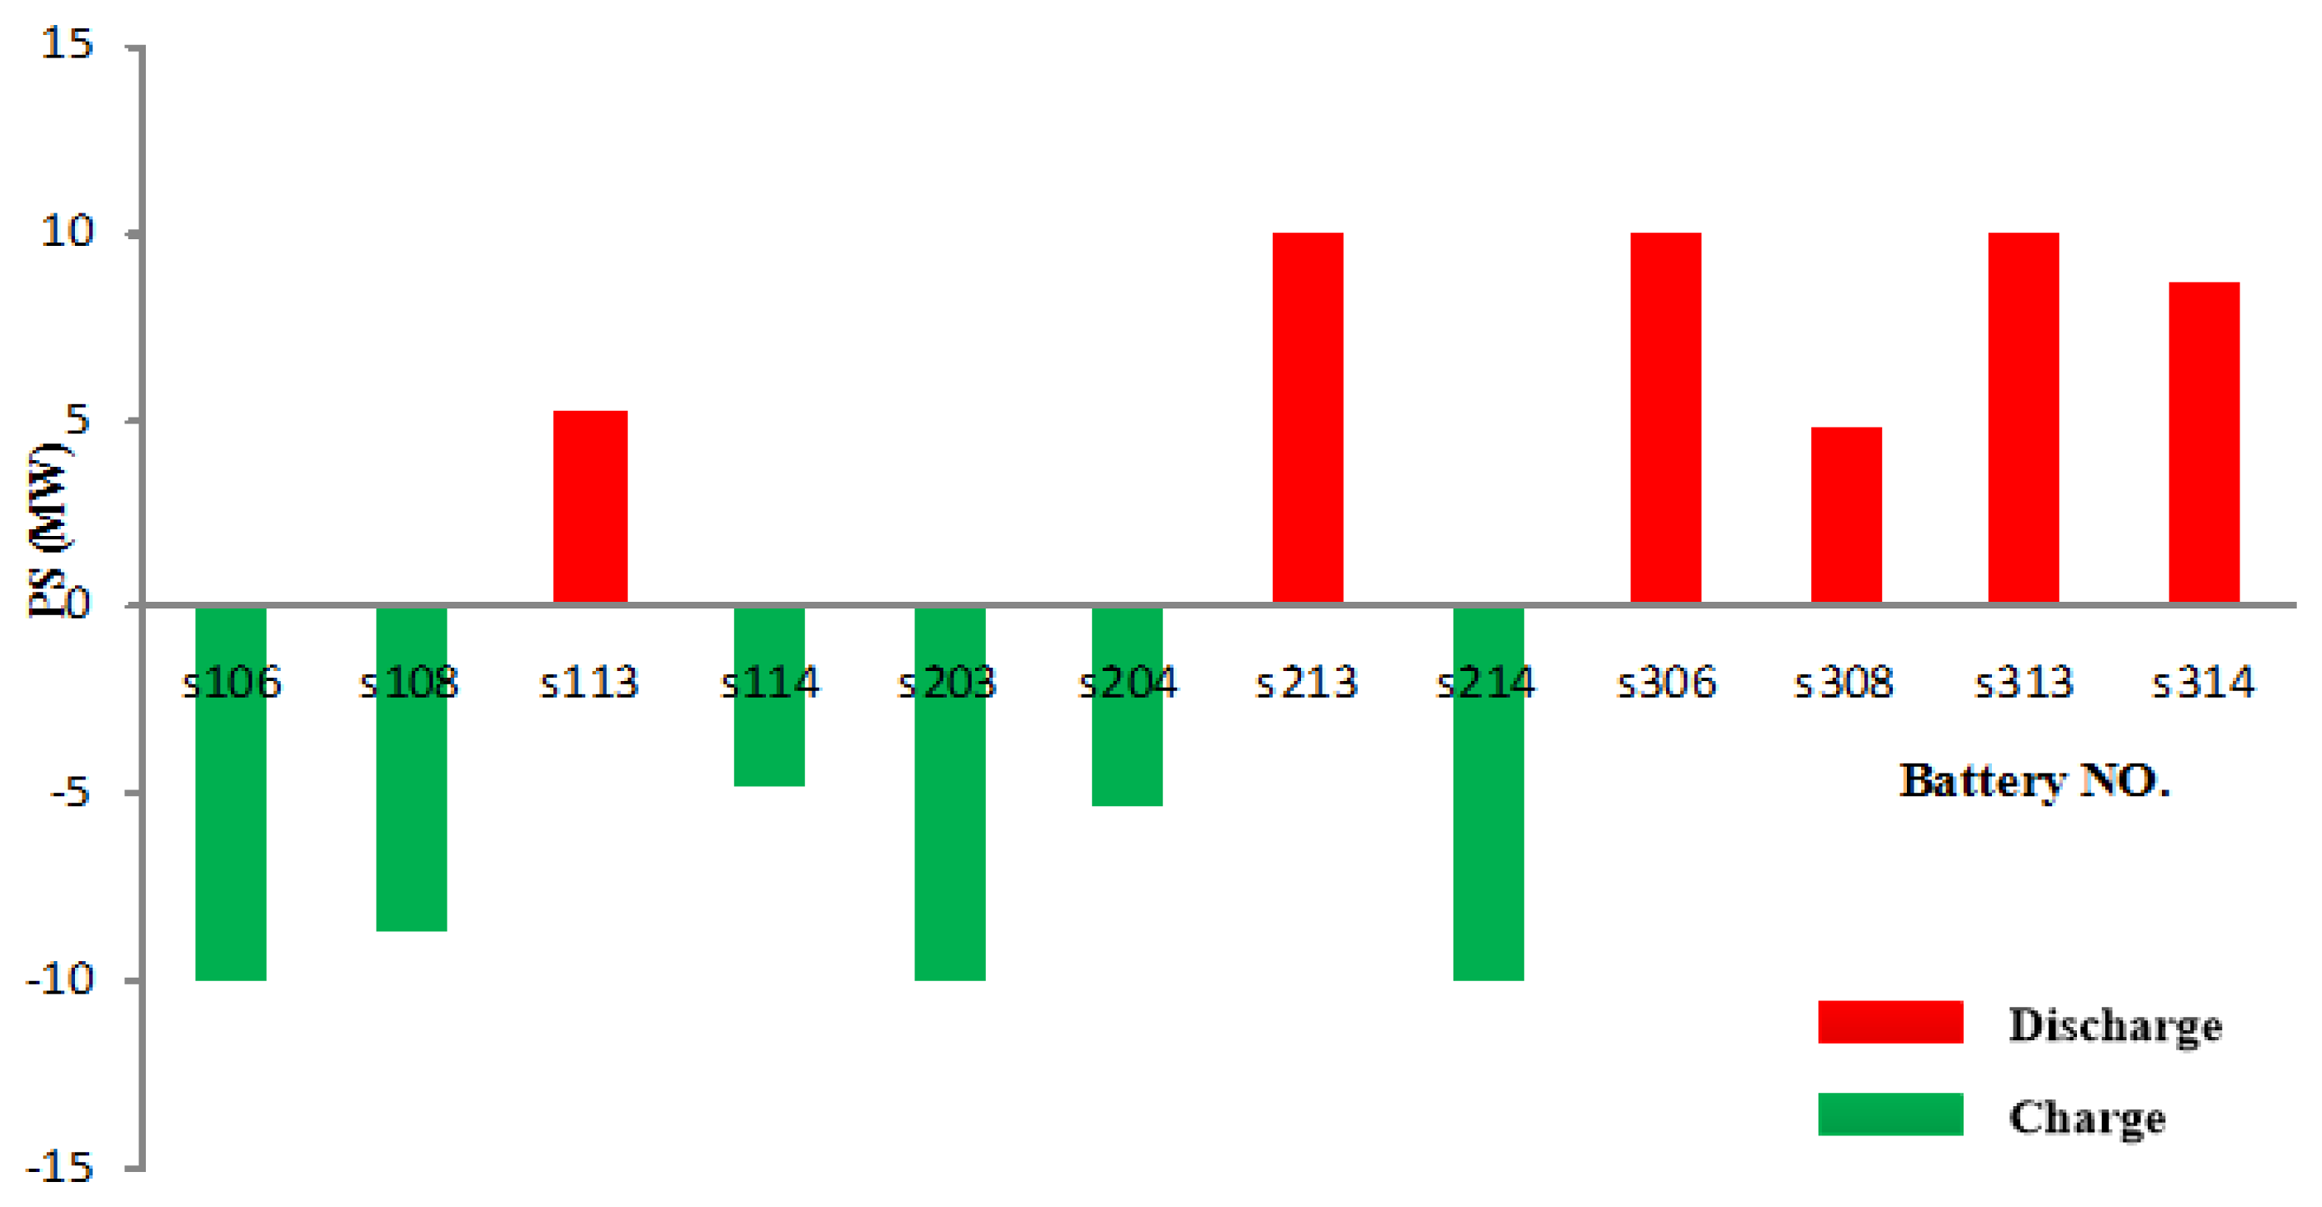
Figure 6 shows the corrective actions provided by the 12 batteries immediately after the outage of line L107. It can be seen that, batteries located in area 3 only need to provide corrective actions in the form of discharge, while batteries placed in area 1 and area 2 need charge or discharge. This is because that, to remove the post-contingency emergency overloads, batteries located downstream from the overloaded lines will inject power in the network, and other batteries located upstream from these lines might extract power from the network.
Table 7 illustrates that 12 contingencies, out of those that result in a violation of long-term limits (NLC = 34), require PHS units to provide corrective actions. In the case of the outage of line L27, L28, or L41, the PHS unit (PHS2) located at bus 317 in area 3 has to work in generation mode to provide back-up power to aid generators, while under other contingency conditions (L66, L67, L72, L86, L103, L104, L105, L106, L117), the PHS units located in area 2 or area 3 would work in pumping mode to absorb excess power from the network. If the long-term period is set to 1 hour, it would require that 50 × 1 = 50 MWh spare energy capacity be available in PHS1, while 230 MWh energy should be stored and 225 MWh energy margin in PHS2.
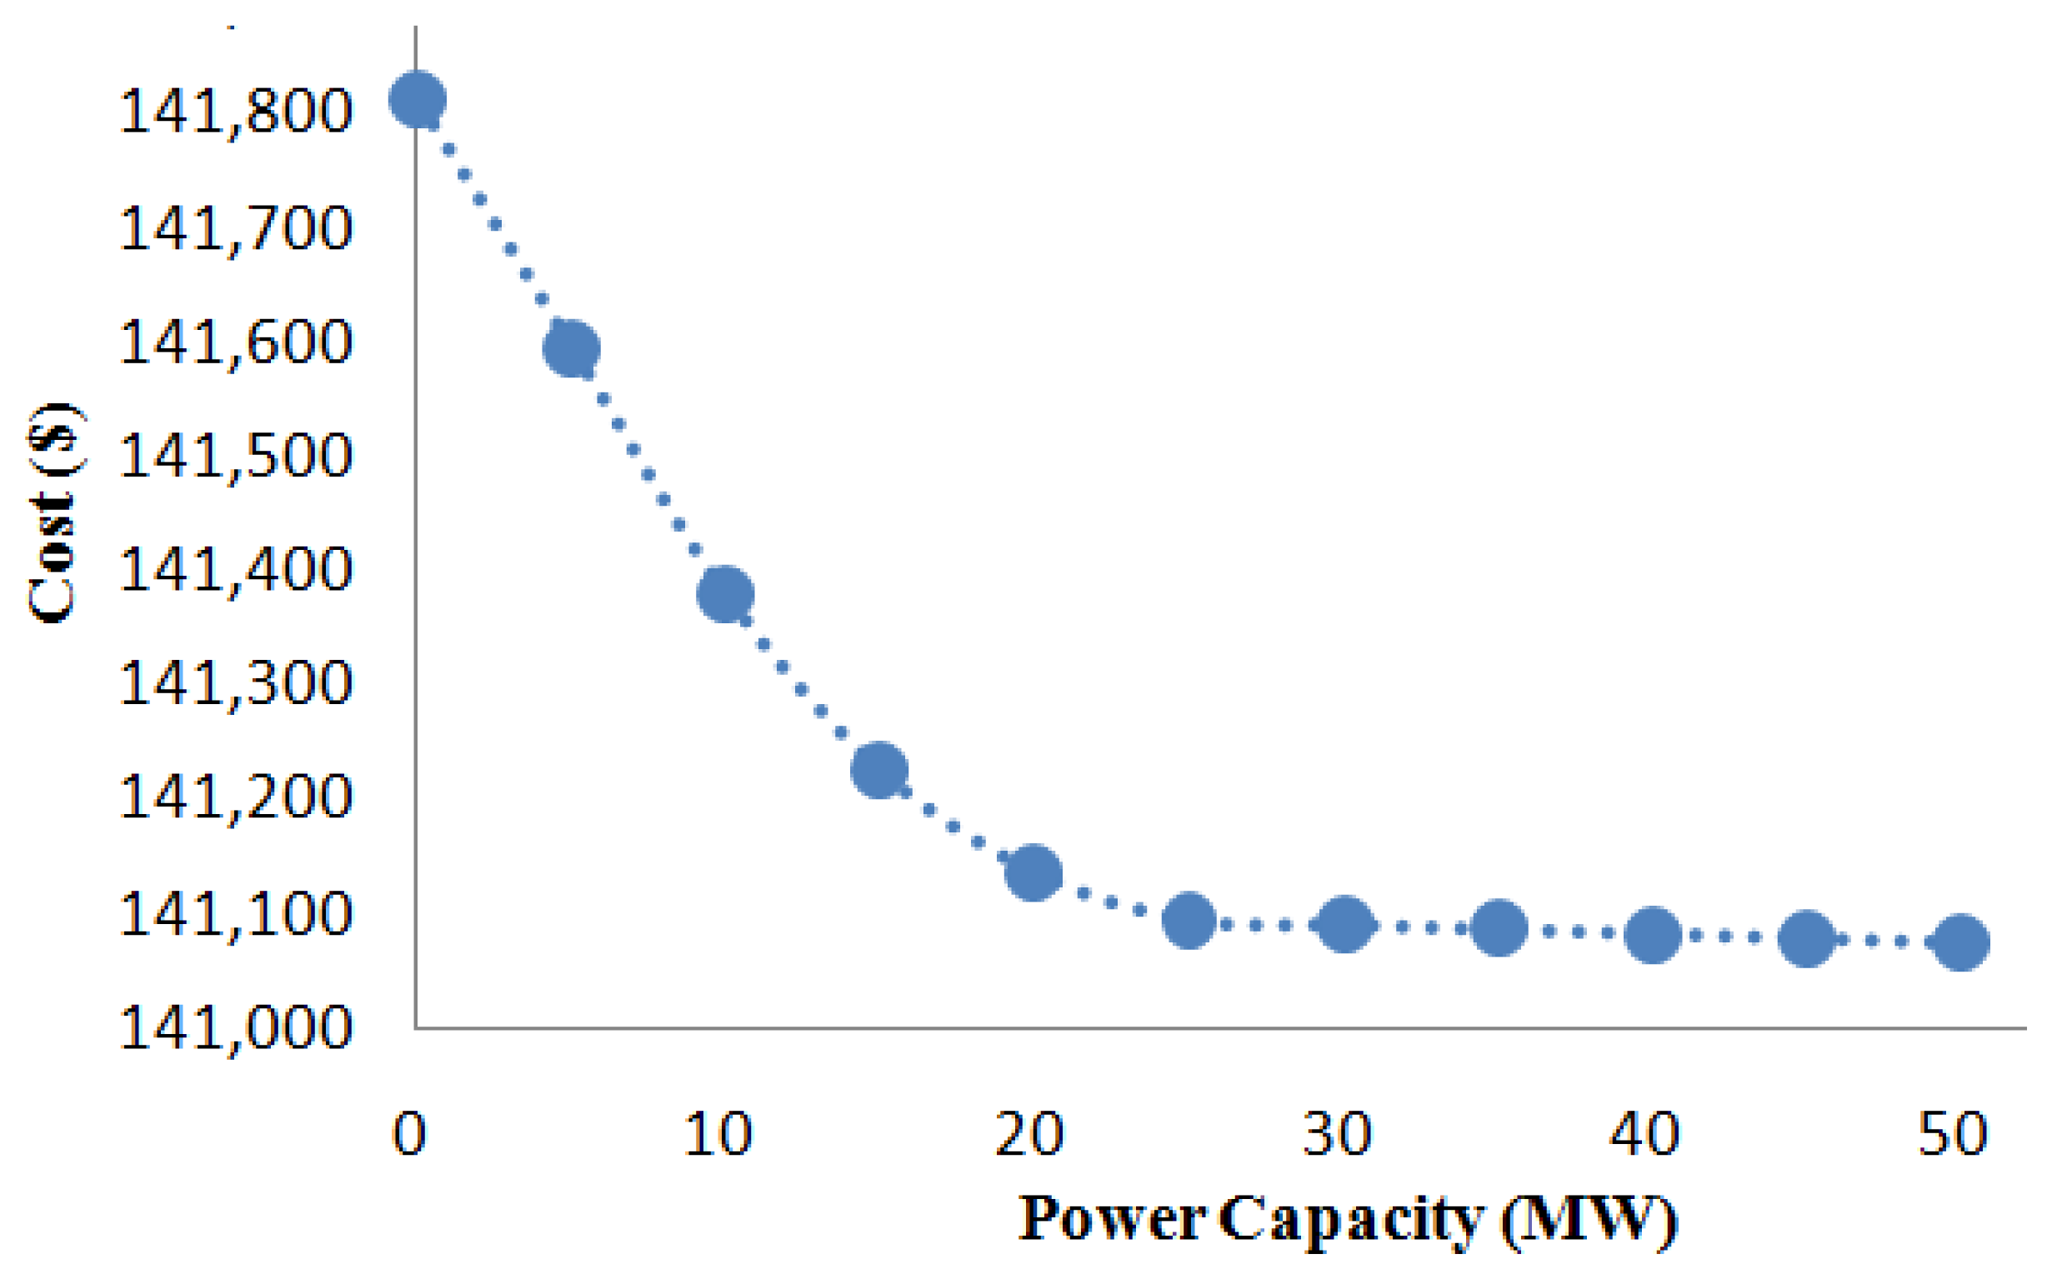
5.4. Effect of the Power Capacity of Distributed Batteries
The effect of the power capacity of distributed batteries on the generation cost is studied here (Case 3 with load level equals to 1.05). Figure 7 shows how the generation cost varies as the power capacity of the batteries. The power capacity of each battery was varied from 0 to 50 MW. As one would expect, lower generation cost could be achieved as increasing the power capacity of batteries. The choice of how much power capacity of a battery is adopted for correcting short-term overloads would depend on its investment costs.
5.5. Effect of the Number and Power Capacity of PHS Units
To analyze the effect of CSCOPF with different number of PHS units, three cases were considered:
Case 4: 1 PHS unit is installed at bus 117 in area 1.
Case 5: 2 PHS units located at buses 117 and 217 (Area 2).
Case 6: 3 PHS units located at buses 117, 217, and 317 (Area 3).
For all the cases, each PHS unit has the same power capacity with PHS2 as given in Table 2, the system base case load is 6122.2 MW. It can be seen from Table 8, if more PHS units in the network are used for post-contingency corrective control, the system could have a larger load level, and the CSCOPF allows more long-term violations to be removed by corrective actions using storage units.
The power capacity of each PHS unit in case 6 was increased in steps of 40 MW. To help understand the impact of the power rating of PHS units on the generation dispatch, the expected amount of generation redispatch (EG), and the expected amount of power adjustment of PHS units (ES) are calculated:
Table 9 indicates that, at base case, the expected amount of power adjustment of PHS units increases as the power capacity of PHS units increases, while the expected amount of generation redispatch decreases. This demonstrates that if larger PHS units are available in the system, less post-contingency generation redispatch is required, as more corrective actions can be provided by the PHS units to move back the power flows on affected lines below their normal ratings. Table 9 also shows that the increasing of power capacity of the PHS units impacts the system's overall load ability.
6. Conclusions
A novel corrective control strategy that can coordinate distributed and bulk energy storage for relief of post-contingency overloads has been presented in this paper. This problem is formulated as a multi-stage CSCOPF incorporating the distributed batteries and PHS units. Immediately after a contingency, batteries are used to provide fast-response corrective actions to prevent the power flows on affected lines exceeding their short-term emergency ratings. In the long-term period, PHS units work in generation or pumping mode to aid generators bring the flows down within the normal limits.
An algorithm based on Benders decomposition was proposed to solve the proposed CSCOPF model. The primal problem was decomposed into a pre-contingency master problem linked with two sets of post-contingency sub-problems. The master problem determines the optimal base case solution, while the two types of sub-problems seek feasible corrective actions to handle all contingencies.
Test results on a modified RTS-96 system demonstrate that the proposed control strategy offers the following advantages:
- (1)
Coordinated control of distributed batteries and PHS units following an outage could effectively remove post-contingency overloads and guarantee system operational reliability.
- (2)
It lightens the requirement of preventive/corrective actions from conventional generators, thus decreases the generation costs.
- (3)
It allows the system operates with higher pre- and post-contingency power flows, therefore reinforces the available transfer capabilities. It would thus reduce the need for investments in additional or upgraded transmission lines.
Although this paper is focused on the intraday single operating point, the proposed coordinated control method can also be extended to the multi-period CSCOPF or day-ahead Security-constrained Unit Commitment problems. These topics are left for future work.
Acknowledgments
The work of Yunfeng Wen, Shufeng Dong and Chuangxin Guo was supported in part by the State Key Development Program for Basic Research of China (2013CB228206), in part by the National Natural Science Foundation of China (51177143), and in part by the Zhejiang Province Natural Science Key Foundation (LZ12E07002).
Conflicts of Interest
The authors declare no conflict of interest.
Appendix
The optimization models of the master and sub-problems are given as below:
A1. Master Problem
The master problem corresponds to Equations (2)–(4) of the primal problem with the objective to minimize the base case generation cost Equation (1). It is an ordinary DC-OPF formulation augmented by the feasibility Benders cuts Equation (17) generated by the two sets of Sub-problems.
A2. Sub-Problem 1
Slack variables sk are added to the post-contingency short-term transmission limits to ensure the sub-problem 1 is feasible. The objective of sub-problem 1 is to minimize the sum of slack variables, subject to the post-contingency shot-term security constraints:
A3. Sub-Problem 2
Slack variables rk are added to the generator ramping constraints to ensure the sub-problem 2 is feasible. The objective of sub-problem 2 is to minimize the sum of slack variables, subject to the post-contingency long-term security constraints:
The modified line parameters of the RTS-96 system are given in the following table:

| Line Number | From | To | x | Fmax (MW) | Line Number | From | To | x | Fmax (MW) |
|---|---|---|---|---|---|---|---|---|---|
| L1 | 101 | 102 | 0.014 | 150 | L61 | 212 | 213 | 0.048 | 250 |
| L2 | 101 | 103 | 0.211 | 150 | L62 | 212 | 223 | 0.097 | 300 |
| L3 | 101 | 105 | 0.085 | 150 | L63 | 213 | 223 | 0.087 | 300 |
| L4 | 102 | 104 | 0.127 | 150 | L64 | 214 | 216 | 0.059 | 300 |
| L5 | 102 | 106 | 0.192 | 150 | L65 | 215 | 216 | 0.017 | 300 |
| L6 | 103 | 109 | 0.119 | 150 | L66 | 215 | 221 | 0.049 | 300 |
| L7 | 103 | 124 | 0.084 | 300 | L67 | 215 | 221 | 0.049 | 300 |
| L8 | 104 | 109 | 0.104 | 150 | L68 | 215 | 224 | 0.052 | 300 |
| L9 | 105 | 110 | 0.088 | 150 | L69 | 216 | 217 | 0.026 | 300 |
| L10 | 106 | 110 | 0.061 | 150 | L70 | 216 | 219 | 0.023 | 300 |
| L11 | 107 | 108 | 0.061 | 150 | L71 | 217 | 218 | 0.014 | 300 |
| L12 | 107 | 203 | 0.161 | 150 | L72 | 217 | 222 | 0.105 | 250 |
| L13 | 108 | 109 | 0.165 | 150 | L73 | 218 | 221 | 0.026 | 250 |
| L14 | 108 | 110 | 0.165 | 150 | L74 | 218 | 221 | 0.026 | 250 |
| L15 | 109 | 111 | 0.084 | 300 | L75 | 219 | 220 | 0.04 | 250 |
| L16 | 109 | 112 | 0.084 | 300 | L76 | 219 | 220 | 0.04 | 250 |
| L17 | 110 | 111 | 0.084 | 300 | L77 | 220 | 223 | 0.022 | 250 |
| L18 | 110 | 112 | 0.084 | 300 | L78 | 220 | 223 | 0.022 | 250 |
| L19 | 111 | 113 | 0.048 | 300 | L79 | 221 | 222 | 0.068 | 250 |
| L20 | 111 | 114 | 0.042 | 300 | L80 | 301 | 302 | 0.014 | 150 |
| L21 | 112 | 113 | 0.048 | 300 | L81 | 301 | 303 | 0.211 | 150 |
| L22 | 112 | 123 | 0.097 | 300 | L82 | 301 | 305 | 0.085 | 150 |
| L23 | 113 | 123 | 0.087 | 300 | L83 | 302 | 304 | 0.127 | 150 |
| L24 | 113 | 215 | 0.075 | 300 | L84 | 302 | 306 | 0.192 | 150 |
| L25 | 114 | 116 | 0.059 | 300 | L85 | 303 | 309 | 0.119 | 150 |
| L26 | 115 | 116 | 0.017 | 300 | L86 | 303 | 324 | 0.084 | 220 |
| L27 | 115 | 121 | 0.049 | 300 | L87 | 304 | 309 | 0.104 | 150 |
| L28 | 115 | 121 | 0.049 | 300 | L88 | 305 | 310 | 0.088 | 150 |
| L29 | 115 | 124 | 0.052 | 300 | L89 | 306 | 310 | 0.061 | 125 |
| L30 | 116 | 117 | 0.026 | 300 | L90 | 307 | 308 | 0.061 | 150 |
| L31 | 116 | 119 | 0.023 | 300 | L91 | 308 | 309 | 0.165 | 125 |
| L32 | 117 | 118 | 0.014 | 300 | L92 | 308 | 310 | 0.165 | 125 |
| L33 | 117 | 122 | 0.105 | 300 | L93 | 309 | 311 | 0.084 | 250 |
| L34 | 118 | 121 | 0.026 | 300 | L94 | 309 | 312 | 0.084 | 250 |
| L35 | 118 | 121 | 0.026 | 300 | L95 | 310 | 311 | 0.084 | 250 |
| L36 | 119 | 120 | 0.04 | 300 | L96 | 310 | 312 | 0.084 | 250 |
| L37 | 119 | 120 | 0.04 | 300 | L97 | 311 | 313 | 0.048 | 250 |
| L38 | 120 | 123 | 0.022 | 300 | L98 | 311 | 314 | 0.042 | 250 |
| L39 | 120 | 123 | 0.022 | 300 | L99 | 312 | 313 | 0.048 | 250 |
| L40 | 121 | 122 | 0.068 | 300 | L100 | 312 | 323 | 0.097 | 300 |
| L41 | 123 | 217 | 0.074 | 300 | L101 | 313 | 323 | 0.087 | 300 |
| L42 | 201 | 202 | 0.014 | 150 | L102 | 314 | 316 | 0.059 | 270 |
| L43 | 201 | 203 | 0.211 | 150 | L103 | 315 | 316 | 0.017 | 300 |
| L44 | 201 | 205 | 0.085 | 150 | L104 | 315 | 321 | 0.049 | 270 |
| L45 | 202 | 204 | 0.127 | 150 | L105 | 315 | 321 | 0.049 | 270 |
| L46 | 202 | 206 | 0.192 | 150 | L106 | 315 | 324 | 0.052 | 270 |
| L47 | 203 | 209 | 0.119 | 150 | L107 | 316 | 317 | 0.026 | 250 |
| L48 | 203 | 224 | 0.084 | 220 | L108 | 316 | 319 | 0.023 | 270 |
| L49 | 204 | 209 | 0.104 | 150 | L109 | 317 | 318 | 0.014 | 300 |
| L50 | 205 | 210 | 0.088 | 150 | L110 | 317 | 322 | 0.105 | 250 |
| L51 | 206 | 210 | 0.061 | 125 | L111 | 318 | 321 | 0.026 | 250 |
| L52 | 207 | 208 | 0.061 | 150 | L112 | 318 | 321 | 0.026 | 250 |
| L53 | 208 | 209 | 0.165 | 125 | L113 | 319 | 320 | 0.04 | 250 |
| L54 | 208 | 210 | 0.165 | 125 | L114 | 319 | 320 | 0.04 | 250 |
| L55 | 209 | 211 | 0.084 | 250 | L115 | 320 | 323 | 0.022 | 250 |
| L56 | 209 | 212 | 0.084 | 250 | L116 | 320 | 323 | 0.022 | 250 |
| L57 | 210 | 211 | 0.084 | 250 | L117 | 321 | 322 | 0.068 | 250 |
| L58 | 210 | 212 | 0.084 | 250 | L118 | 325 | 121 | 0.097 | 400 |
| L59 | 211 | 213 | 0.048 | 250 | L119 | 318 | 223 | 0.104 | 400 |
| L60 | 211 | 214 | 0.042 | 250 | L120 | 323 | 325 | 0.009 | 400 |
References
- Alsac, O.; Stott, B. Optimal load flow with steady-state security. IEEE Trans. Power Appar. Syst. 1974, PAS-93, 745–751. [Google Scholar]
- Capitanescu, F.; Martinez Ramos, J.L.; Panciatici, P.; Kirschen, D.; Marano, A.; Platbrood, L.; Wehenkel, L. State-of-the-art, challenges, and future trends in security constrained optimal power flow. Electr. Power Syst. Res. 2011, 81, 1731–1741. [Google Scholar]
- Stott, B.; Alsac, O.; Monticelli, A.J. Security analysis and optimization. IEEE Proc. 1987, 75, 1623–1644. [Google Scholar]
- Monticelli, A.; Pereira, M.V.F.; Granville, S. Security-constrained optimal power flow with post-contingency corrective rescheduling. IEEE Trans. Power Syst. 1987, PWRS-2, 175–180. [Google Scholar]
- Martinez-Crespo, J.; Usaola, J.; Fernandez, J.L. Security-constrained optimal generation scheduling in large-scale power systems. IEEE Trans. Power Syst. 2006, 21, 321–332. [Google Scholar]
- Li, Y.; McCalley, J.D. Decomposed SCOPF for improving efficiency. IEEE Trans. Power Syst. 2009, 24, 494–495. [Google Scholar]
- Capitanescu, F.; Wehenkel, L. A new iterative approach to the corrective security-constrained optimal power flow problem. IEEE Trans. Power Syst. 2008, 23, 1533–1541. [Google Scholar]
- Hug, G. Generation cost and system risk trade-off with corrective power flow Control. Proceedings of the Annual Allerton Conference, Monticello, IL, USA, 1–5 October 2012; pp. 1324–1331.
- Wehenkel, L.; Pavella, M. Preventive vs. Emergency Control of Power Systems. Proceedings of the Power Systems Conference and Exposition, 10–13 October 2004; pp. 1665–1670.
- Maslennikov, S.; Litvinov, E. Adaptive emergency transmission rates in power system and market operation. IEEE Trans. Power Syst. 2009, 24, 923–929. [Google Scholar]
- ISO New England Operating Procedure 19. Transmission Operation. Available online: http://www.iso-ne.com/rules_proceds/operating/isone/op19/index.html (accessed on 1 June 2010).
- Capitanescu, F.; Wehenkel, L. Improving the statement of the corrective security-constrained optimal power flow problem. IEEE Trans. Power Syst. 2007, 22, 887–889. [Google Scholar]
- Capitanescu, F.; Martinez-Ramos, J.L.; Kirschen, D.; Wehenkel, L.; Ortega-Vazquez, M.; Marano, A.; Crisciu, H.; Fliscounakis, S.; Platbrood, L.; Panciatici, P.; et al. Deliverable D3.1: State of the Art and Modelling Requirements for Steady State Optimization of the ETN. Available online: http://www.fp7-pegase.com/pdf/D3.1_part1.pdf (accessed on 14 April 2011).
- California ISO. Contingency Modeling Enhancements. Available online: http://www.caiso.com/Documents/RevisedStrawProposalContingencyModelingEnhancements.pdf (accessed on 5 September 2013).
- Li, Y.; McCalley, J.D. Risk-based Optimal Power Flow and System Operation State. Proceedings of the IEEE Power Engineering Society Meeting, Calgary, AB, Canada, 26–30 July 2009; pp. 1–6.
- Kirschen, D.S. Power system security. J. Power Eng. 2002, 16, 241–248. [Google Scholar]
- Strbac, G.; Ahmed, S.; Kirschen, D.; Allan, R. A method for computing the value of corrective security. IEEE Trans. Power Syst. 1998, 13, 1096–1102. [Google Scholar]
- Roberts, B.P.; Sandberg, C. The role of energy storage in development of smart grids. IEEE Proc. 2011, 99, 1139–1144. [Google Scholar]
- Chen, H.; Cong, T.N.; Yang, W.; Tan, C.; Li, Y.; Ding, Y. Progress in electrical energy storage system: A critical review. Progr. Nat. Sci. 2009, 19, 291–312. [Google Scholar]
- Energy Positioning: Control, and Economics. Available online: http://www.ee.washington.edu/research/real/ep.html (accessed on 1 January 2012).
- Dell Rosso, A.D.; Eckroad, S.W. Energy storage for relief of transmission congestion. IEEE Trans. Smart Grid 2014, 5, 1138–1146. [Google Scholar]
- Wen, Y.F.; Guo, C.X.; Kirschen, D.S. Enhanced security-constrained OPF with distributed battery energy storage. IEEE Trans. Power Syst. in revision.
- FACTS-the Key to Congestion Relief. Available online: http://tdworld.com/site-files/tdworld.com/files/archive/tdworld.com/go-grid-optimization/ABB-257-WPO_Congestion_relief.pdf (accessed on 2 February 2007).
- Kawabe, K.; Yokoyama, A. Minimization of interrupted power by optimal power flow control with UPFCs and batteries. IEEE J. Trans. Power Energy 2009, 129, 1457–1467. [Google Scholar]
- EPRI-DOE Handbook of Energy Storage for Transmission & Distribution Applications. Available online: http://www.sandia.gov/ess/publications/ESHB%201001834%20reduced%20size.pdf (accessed on 1 December 2003).
- Divya, K.C.; Østergaard, J. Battery energy storage technology for power systems—An overview. Electr. Power Syst. Res. 2009, 79, 511–520. [Google Scholar]
- Oudalov, A.; Chartouni, D.; Ohler, C.; Linhofer, G. Value Analysis of Battery Energy Storage Applications in Power Systems. Proceedings of the IEEE Power Systems Conference and Exposition, Atlanta, GA, USA, 29 October–1 November 2006; pp. 2206–2211.
- Outlook of Energy Storage Technologies. Available online: http://www.storiesproject.eu/docs/study_energy_storage_final.pdf (accessed on 30 July 2007).
- Deane, J.P.; Gallachoir, B.P.O.; Mckeogh, E.J. Techno-economic review of existing and new pumped hydro energy storage plant. Renew. Sustain. Energy Rev. 2010, 14, 1293–1302. [Google Scholar]
- Ela, E.; Kirby, B.; Botterud, A.; Milostan, C.; Krad, I.; Koritarov, V. The Role of Pumped Storage Hydro Resources in Electricity Markets and System Operation. Proceedings of the Hydro Vision International, Denver, CO, USA, 23–26 July 2013; pp. 1–10.
- Aoki, K.; Satoh, T.; Itoh, M.; Ichimori, T.; Masegi, K. Unit commitment in a large-scale power system including fuel constrained thermal and pumped-storage hydro. IEEE Trans. Power Syst. 1987, PWRS-2, 1077–1084. [Google Scholar]
- Lu, N.; Chow, J.H.; Desrochers, A. Pumped-storage hydro-turbine bidding strategies in a competitive electricity market. IEEE Trans. Power Syst. 2004, 19, 834–841. [Google Scholar]
- Lung, J.K.; Lu, Y.; Huang, W.L.; Kao, W.S. Modeling and dynamic simulations of doubly fed adjustable-speed pumped storage units. IEEE Trans. Energy Convers. 2007, 22, 250–258. [Google Scholar]
- Khodayar, M.E.; Abreu, L.; Shahidehpour, M. Transmission-constrained intra hour coordination of wind and pumped-storage hydro units. IET Gener. Transm. Distrib. 2013, 7, 755–765. [Google Scholar]
- Sioshansi, R.; Denholm, P.; Jenkin, T.; Weiss, J. Estimating the value of electricity storage in PJM: Arbitrage and some welfare effects. Energy Econ. 2009, 31, 269–277. [Google Scholar]
- Lo, C.H.; Anderson, M.D. Economic dispatch and optimal sizing of battery energy storage systems in utility load-leveling operations. IEEE Trans. Energy Convers. 1999, 14, 824–829. [Google Scholar]
- Geoffrion, A.M. Generalized benders decomposition. J. Optim. Theory Appl. 1972, 10, 237–260. [Google Scholar]
- Conejo, A.J.; Castillo, E.; Minguez, R.; Garcia-Bertrand, R. Decomposition Techniques in Mathematical Programming-Engineering and Science Applications; Springer: Berlin, Germany, 2006; pp. 111–135. [Google Scholar]
- Khodaei, A.; Shahidehpour, M. Transmission switching in security-constrained unit commitment. IEEE Trans. Power Syst. 2010, 25, 1937–1945. [Google Scholar]
- Branch and Cut in CPLEX. Available online: http://pic.dhe.ibm.com/infocenter/cosinfoc/v12r4/index.jsp?topic=%2Filog.odms.ide.help%2Frefcppopl%2Fhtml%2Fbranch.html (accessed on 5 December 2013).
- Billinton, R.; Allan, R.N. Reliability Evaluation of Power Systems, 2nd ed.; Plenum: New York, NY, USA, 1994; pp. 210–213. [Google Scholar]


| ES | Power Capacity | Discharge time | Response time |
|---|---|---|---|
| Battery | less than 50 MW | seconds to hours | microseconds to seconds |
| PHS | 100 MW to 5000 MW | 1 h to more than 24 h | seconds to minitues |
| ID | BUS | PSDmin (MW) | PSDmax (MW) | PSCmin (MW) | PSCmax (MW) |
|---|---|---|---|---|---|
| PHS1 | 217 | 16 | 180 | 20 | 225 |
| PHS2 | 317 | 10 | 200 | 15 | 250 |
| Load level | CG ($) | NSC | NLC | Time (s) |
|---|---|---|---|---|
| 1.0 | 139,987 | 0 | 25 | 4.0 |
| 1.025 | 140,517 | 0 | 26 | 4.1 |
| 1.05 | 141,812 | 0 | 29 | 5.0 |
| 1.075 | Infeasible | |||
| Load level | CG ($) | NSC | NLC | Saving (%) | Time (s) |
|---|---|---|---|---|---|
| 1.0 | 139,610 | 4 | 29 | 0.3 | 6.1 |
| 1.025 | 140,240 | 8 | 33 | 0.2 | 6.9 |
| 1.05 | 141,378 | 9 | 34 | 0.3 | 7.1 |
| 1.075 | Infeasible | ||||
| Load level | CG ($) | NSC | NLC | Saving (%) | Time (s) |
|---|---|---|---|---|---|
| 1.0 | 139,610 | 4 | 29 | 0.3 | 6.2 |
| 1.025 | 140,240 | 8 | 33 | 0.2 | 7.4 |
| 1.05 | 141,378 | 9 | 34 | 0.3 | 7.5 |
| 1.075 | 142,766 | 9 | 37 | — | 8.1 |
| 1.1 | 144,251 | 9 | 38 | — | 8.2 |
| 1.125 | 145,840 | 11 | 39 | — | 9.1 |
| 1.15 | 147,458 | 11 | 43 | — | 9.6 |
| 1.175 | 149,148 | 11 | 49 | — | 10.4 |
| 1.2 | Infeasible | ||||
| Network | Line Number | Total |
|---|---|---|
| Area 1 | L1 to L15, L17, L20, L22, L23, L25, L27 to L32, L40 | 27 |
| Area 2 | L42 to L48, L52, L53, L57, L60, L64 to L71, L79 | 20 |
| Area 3 | L87 to L90, L92, L94, L96, L97, L100, L101, L103 to L105, L107, L109, L110, L113 to L116 | 21 |
| Tie-Lines | L24, L118, L120 | 3 |
| Outage | Buses (from, to) | PS1 (MW) | PS2 (MW) |
|---|---|---|---|
| L27 | 115, 121 | 0 | 230 |
| L28 | 115, 121 | 0 | 230 |
| L41 | 123, 217 | 0 | 54 |
| L66 | 215, 221 | −50.0 | 0 |
| L67 | 215, 221 | −50.0 | 0 |
| L72 | 217, 222 | 0 | −225 |
| L86 | 303, 324 | 0 | −88.7 |
| L103 | 315, 316 | 0 | −40.6 |
| L104 | 315, 321 | 0 | −156.6 |
| L105 | 315, 321 | 0 | −156.6 |
| L106 | 315, 324 | 0 | −88.7 |
| L117 | 321, 322 | 0 | −53.4 |
| Case | Load level | CG ($) | NSC | NLC | Time (s) |
|---|---|---|---|---|---|
| Case 4 | 1.07 | 142,488 | 9 | 35 | 6.7 |
| Case 5 | 1.15 | 147,001 | 11 | 37 | 8.5 |
| Case 6 | 1.2 | 150,266 | 11 | 48 | 12.8 |
| ΔPSmax (MW) | Base case (load = 6,122.2 MW) | Load level | ||
|---|---|---|---|---|
| Cost ($) | EG (MW) | ES (MW) | ||
| −80 | 150,217 | 90.2 | 1.42 | 1.1195 |
| −40 | 150,266 | 89.9 | 1.53 | 1.2 |
| 0 | 150,266 | 89.8 | 3.0 | 1.2 |
| +40 | 150,340.3 | 89.4 | 3.2 | 1.201 |
| +80 | 150,340.3 | 88.8 | 4.8 | 1.201 |
© 2014 by the authors; licensee MDPI, Basel, Switzerland. This article is an open access article distributed under the terms and conditions of the Creative Commons Attribution license( http://creativecommons.org/licenses/by/3.0/).
Share and Cite
Wen, Y.; Guo, C.; Dong, S. Coordinated Control of Distributed and Bulk Energy Storage for Alleviation of Post-Contingency Overloads. Energies 2014, 7, 1599-1620. https://doi.org/10.3390/en7031599
Wen Y, Guo C, Dong S. Coordinated Control of Distributed and Bulk Energy Storage for Alleviation of Post-Contingency Overloads. Energies. 2014; 7(3):1599-1620. https://doi.org/10.3390/en7031599
Chicago/Turabian StyleWen, Yunfeng, Chuangxin Guo, and Shufeng Dong. 2014. "Coordinated Control of Distributed and Bulk Energy Storage for Alleviation of Post-Contingency Overloads" Energies 7, no. 3: 1599-1620. https://doi.org/10.3390/en7031599