Day-Ahead Energy Planning with 100% Electric Vehicle Penetration in the Nordic Region by 2050

Abstract
: This paper presents the day-ahead energy planning of passenger cars with 100% electric vehicle (EV) penetration in the Nordic region by 2050. EVs will play an important role in the future energy systems which can both reduce the greenhouse gas (GHG) emissions from the transport sector and provide the demand side flexibility required by smart grids. On the other hand, the EVs will increase the electricity consumption. In order to quantify the electricity consumption increase due to the 100% EV penetration in the Nordic region to facilitate the power system planning studies, the day-ahead energy planning of EVs has been investigated with different EV charging scenarios. Five EV charging scenarios have been considered in the energy planning analysis which are: uncontrolled charging all day, uncontrolled charging at home, timed charging, spot price based charging all day and spot price based charging at home. The demand profiles of the five charging analysis show that timed charging is the least favorable charging option and the spot priced based EV charging might induce high peak demands. The EV charging demand will have a considerable share of the energy consumption in the future Nordic power system.1. Introduction
The worldwide concern about greenhouse gas (GHG) emissions and independence from fossil fuels has stimulated the development of electric vehicles (EVs) for the past few decades. The electrification of the transport sector is an attractive option to reduce both the GHG emissions and the fossil fuel consumption of society. In the Nordic context, the deployment of EVs has more drivers. The Nordic region including Denmark (DK), Finland (FI), Norway (NO) and Sweden (SE) has the ambition of achieving a sustainable energy system in a time perspective up to 2050 [1–6]. Considered as a type of distributed energy resources (DERs), EVs hold the potential to cope with the intermittency resulting from the further utilization of renewable energy sources (RESs) in the Nordic power grid. Therefore, the study of the electrification of the transportation sector with large-scale deployment of EVs has strong necessity for the four mentioned Nordic countries.
With a large-scale deployment of EVs, the power and energy demand of EVs will have a strong impact on the power system. The study of the impact of EV charging on the power system started in 1970s and a number of studies have been carried out on the topic ever since [7–16]. In most of the studies, either at a national scale or a regional scale, the energy consumption or the charging availability of the vehicles was estimated without considering the actual driving patterns of the vehicles. Such assumptions might lead to inaccurate EV charging analysis results.
Regarding the Nordic area, the charging demand of EVs was studied in different countries. In [17,18] the EV charging demand based on the case of the Danish island of Bornholm was studied. The study in [19] presented the EV fleet integration in Bornholm with the Virtual Power Plant (VPP) concept. The study in [20] built an optimal charging model according to survey data from Western Denmark. The study in [21] gave an estimation of the charging cost of EVs in the Finnish context. The work in [22] studied the stochastic charging load of the plug-in hybrid electric vehicles (PHEVs) in Finland.
However, a comprehensive study of the daily charging demand of EVs based on the actual driving behaviors for the Nordic area is missing at the moment. Such a study of the energy planning of the EV charging is essential to both the day-ahead scheduling and long term planning of the power system if there is to be a large-scale deployment of EVs. The work in [23] studied the driving patterns of Denmark based on the Danish National Travel Survey for the EV charging demand study. Following the work in [23], this paper presents a study of the day-ahead energy planning of passenger cars with 100% EV penetration based on the actual driving behaviors in the Nordic region by 2050. The driving data from the National Travel Surveys of the four mentioned Nordic countries were used to determine the driving patterns of the vehicles. Based on the driving patterns of the vehicles, the daily charging profiles of EVs with different types of charging scenarios are investigated. The electric energy planning of the EV charging demand and its impacts are discussed according to the results of the EV charging analysis.
The paper is arranged as follows: the EV charging analysis method is described in Section 2. The demand profiles of the EV charging in the Nordic area with different charging schemes are presented in Section 3. The impacts of the EV charging demand on the power system are discussed in Section 4. In the end, the conclusions are drawn.
2. Algorithms
2.1. Driving Behavior Analysis
In order to analyze the charging demand of EVs in the Nordic region, it is necessary to study the driving pattern of EVs in the area. Currently, it is difficult to obtain the driving pattern of EVs directly because there are few EVs on the road. However, with a high penetration level of EVs and sufficient support of the charging facility, the driving pattern of EVs will be more or less the same as the one of conventional passenger cars when or if all the driving requirements are fulfilled. Therefore, it is feasible to use the driving pattern of conventional passenger cars in the Nordic area to estimate the driving pattern of EVs.
The driving pattern analysis is based on the data from the National Travel Surveys of Denmark, Finland, Norway and Sweden. The National Travel Surveys of the four countries are the most comprehensive data sources which have enough samples to statistically represent the travel behaviors in the corresponding Nordic country. Information on the driving behavior is extracted from the survey databases including the start and ending time of each trip, the driving destination of each trip as well as the driving distance of each trip. The information is used to form the driving patterns of each vehicle throughout the day and calculate the corresponding energy consumption of the driving activities. The charging availability of the vehicle is generated according to the driving and parking status of the vehicle during the day. The status is known according to each observation of the travelling records from the database. Additionally, the parking place is also considered in the study. The EV charging availability is formed under two different conditions. The first condition assumes that the EVs can be charged whenever they are parked all day, regardless of the parking place. The second condition assumes that the EVs can only be charged when they are parked at home. According to these two different conditions, two different kinds of EV charging availability are obtained: EV charging availability all day and EV charging availability at home. They describe the time percentage that the EV can be charged in the specific time slot of the day.
2.2. EV Charging Schemes
Based on the two different kinds of EV charging availability, five different charging scenarios are considered in this paper, including uncontrolled charging all day, uncontrolled charging at home, timed charging, spot price based charging all day and spot price based charging at home. Uncontrolled charging all day refers to the uncontrolled charging that the EVs can be charged whenever they are parked all day regardless of the parking place. Uncontrolled charging at home refers to the uncontrolled charging that the EVs can only be charged when they are parked at home. Timed charging refers to a scheduled charging at specific time periods when the conventional demand of the power system is low. The EVs are assumed to be charged after 21:00 of the day when they are parked. Spot price based charging all day refer to an optimal charging based on the expected electricity spot prices of the Nord Pool electricity market when the EVs can be charged whenever they are parked all day regardless of the parking place. The objective is to minimize the charging cost with the energy requirement constraints of each individual vehicle fulfilled.
The optimization formulation of the spot price based EV charging is presented as follows:
Objective function:
The objective is to minimize the charging cost in Equation (1) subject to the state of charge (SOC) limit constraint of the batteries in Equation (2), the charging energy limit constraint in Equation (3), the driving requirement constraint in Equation (4) and the energy balance constraint in Equation (5). The pricing parameter Ct in Equation (1) is the predicted spot price in the day-ahead electricity market. In the study of this paper, the historical data of the spot price in the Nordic electricity market (Nord Pool Spot) are used as the predicted spot prices. For the SOC limit constraint in Equation (2), it is assumed that the SOC level of each EV should not be out of the limit of the battery throughout the day. The EV charging demand is constrained between 0 and the charging energy limit at any period t in Equation (3). The time resolution Δt of the EV charging analysis in this paper is one hour. The EV charging availability An,t is dependent on the driving and parking status of the vehicle n at period t as described in Section 2.1. The charging rate setting Pch in the study will be described in Section 2.3. For the driving requirement constraint in Equation (4), the driving energy requirement is corresponding to the driving distance. Dn,t is the detailed driving distance of vehicle n in the time interval t. It is obtained from the driving records in the National Travel Surveys as mentioned in Section 2.1. The energy used per km for a home passenger car is typically between 120 Wh/km and 180 Wh/km [24]. For the charging analysis in this paper, an average rate of 150 Wh/km is used to calculate the energy consumption of the studied vehicles. Spot price based charging at home uses the same algorithm as spot price based charging all day to minimize the charging cost. However, the EV charging availability at home is applied instead of the EV charging availability all day in order to investigate the situation of the home charging.
2.3. Charging Rates
The power rate of the charging may also affect the demand pattern of the EV charging. The EVs can be charged through single phase 230 V AC connection, three phase 400 V AC connection or external charger DC connections for fast charging. The charging rate of EVs can vary from a few kW to tens of kW according to the charging mode and the charging current. In the study of this paper, the charging is based on four typical charging rates including 2.30 kW which corresponds to a 230 V AC single phase 10 A charging; 3.68 kW which corresponds to a 230 V AC single phase 16 A charging; 11.04 kW which corresponds to a 400 V AC three phase 16 A charging and 20.00 kW which corresponds to the fast charging.
3. EV Charging Profiles
The day-ahead energy planning analysis of EVs in the four Nordic countries with a 100% EV penetration scenario was carried out with five different charging patterns, including uncontrolled charging all day, uncontrolled charging at home, timed charging, spot price based charging all day and spot price based charging at home.
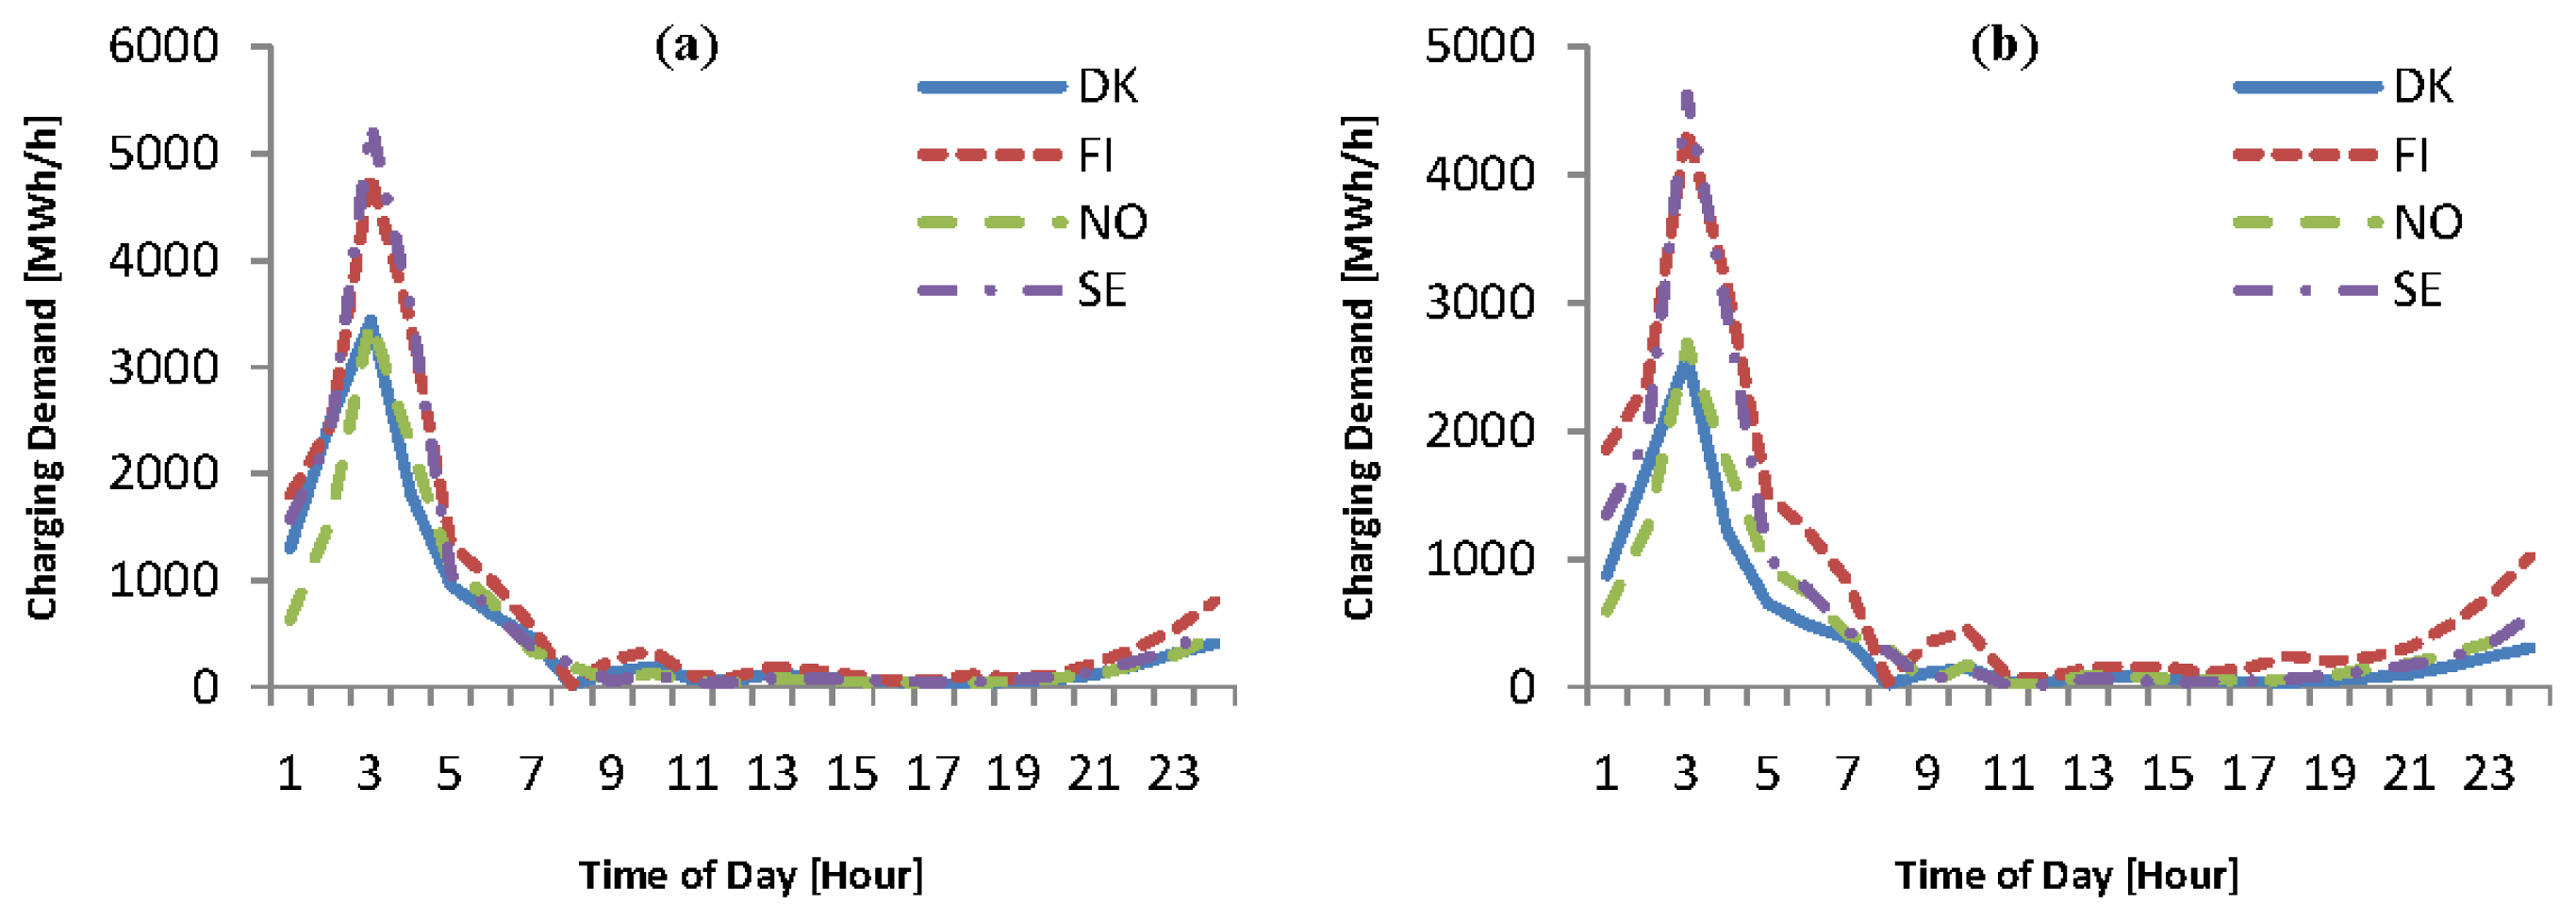
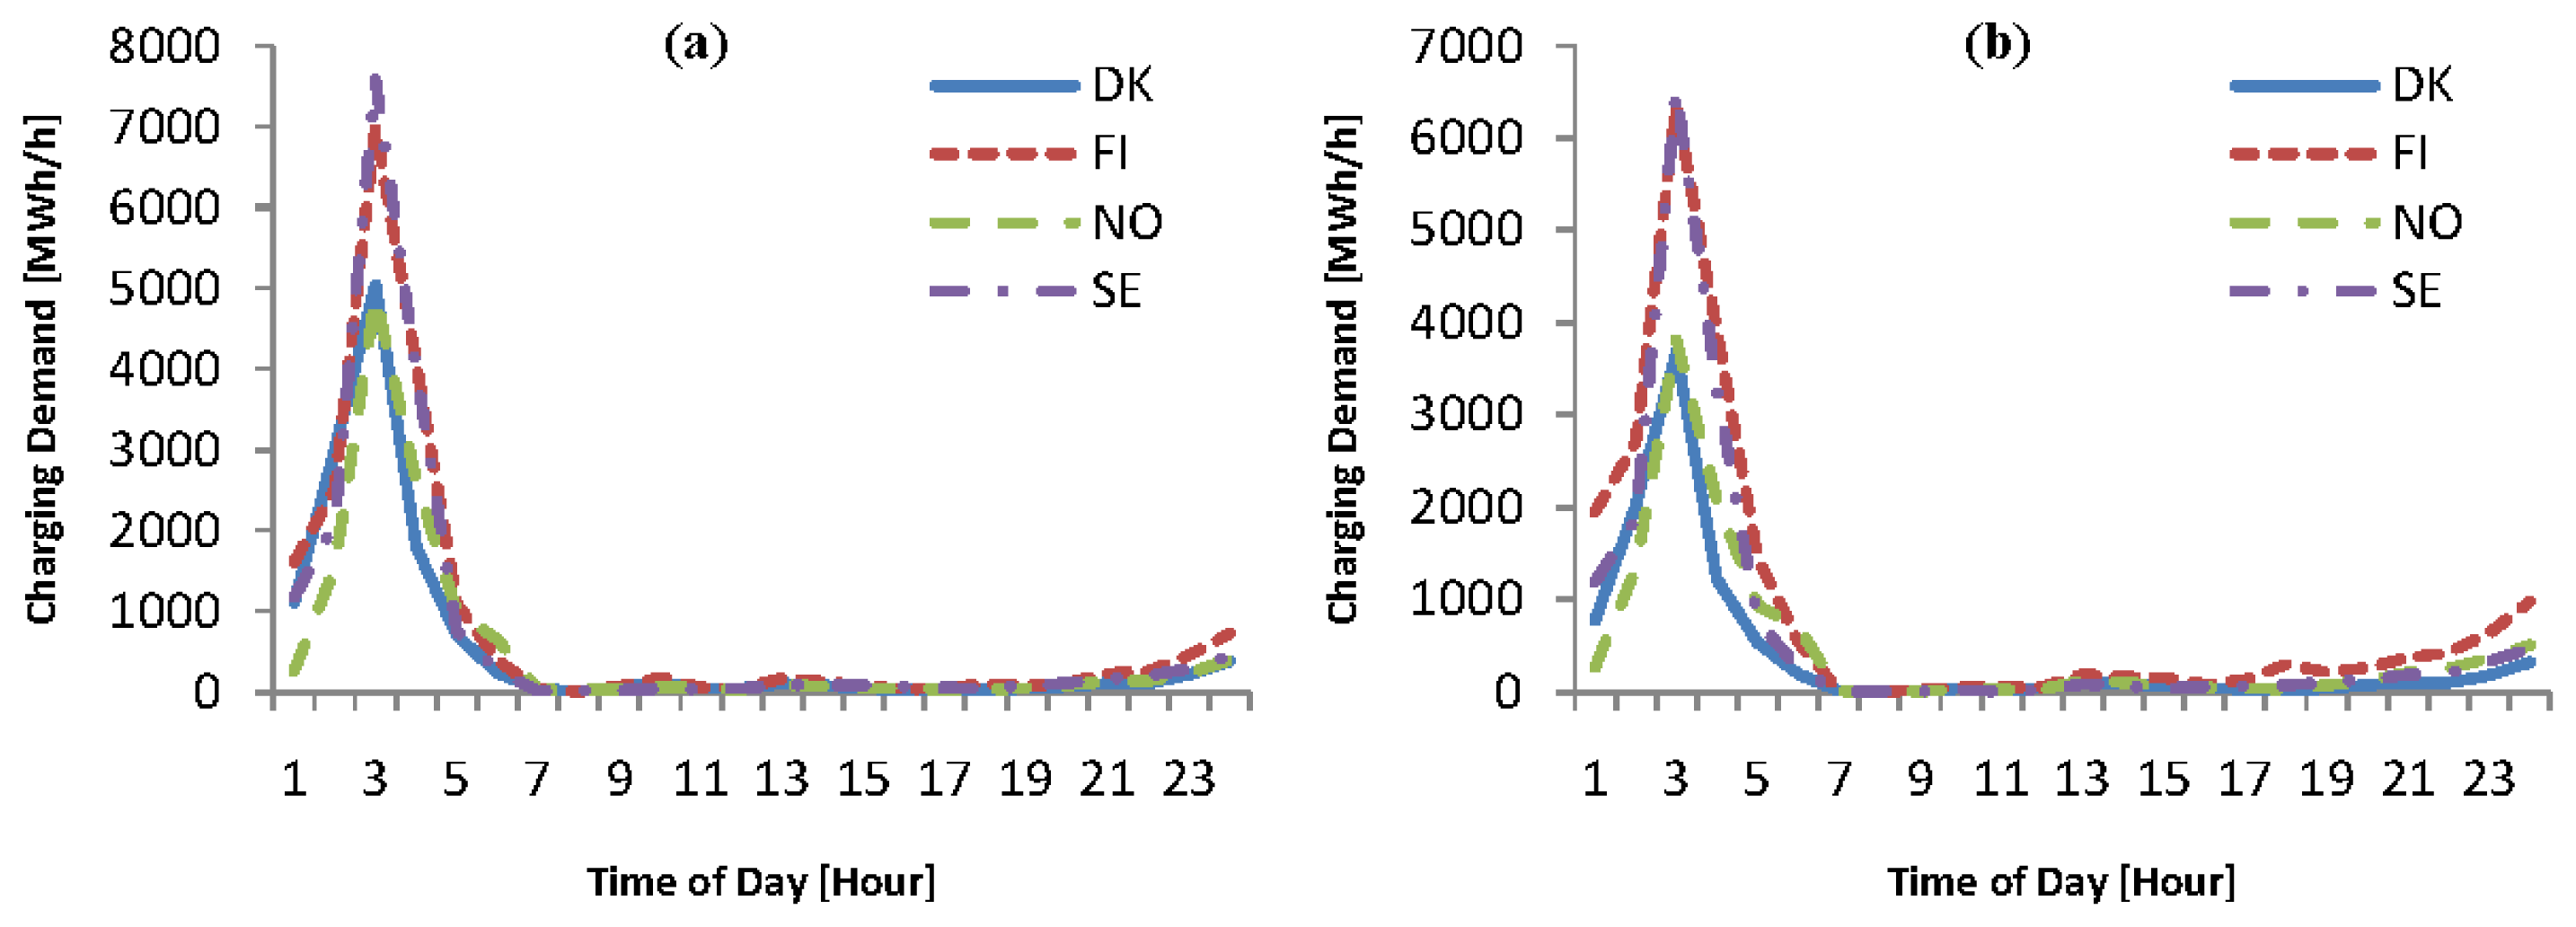
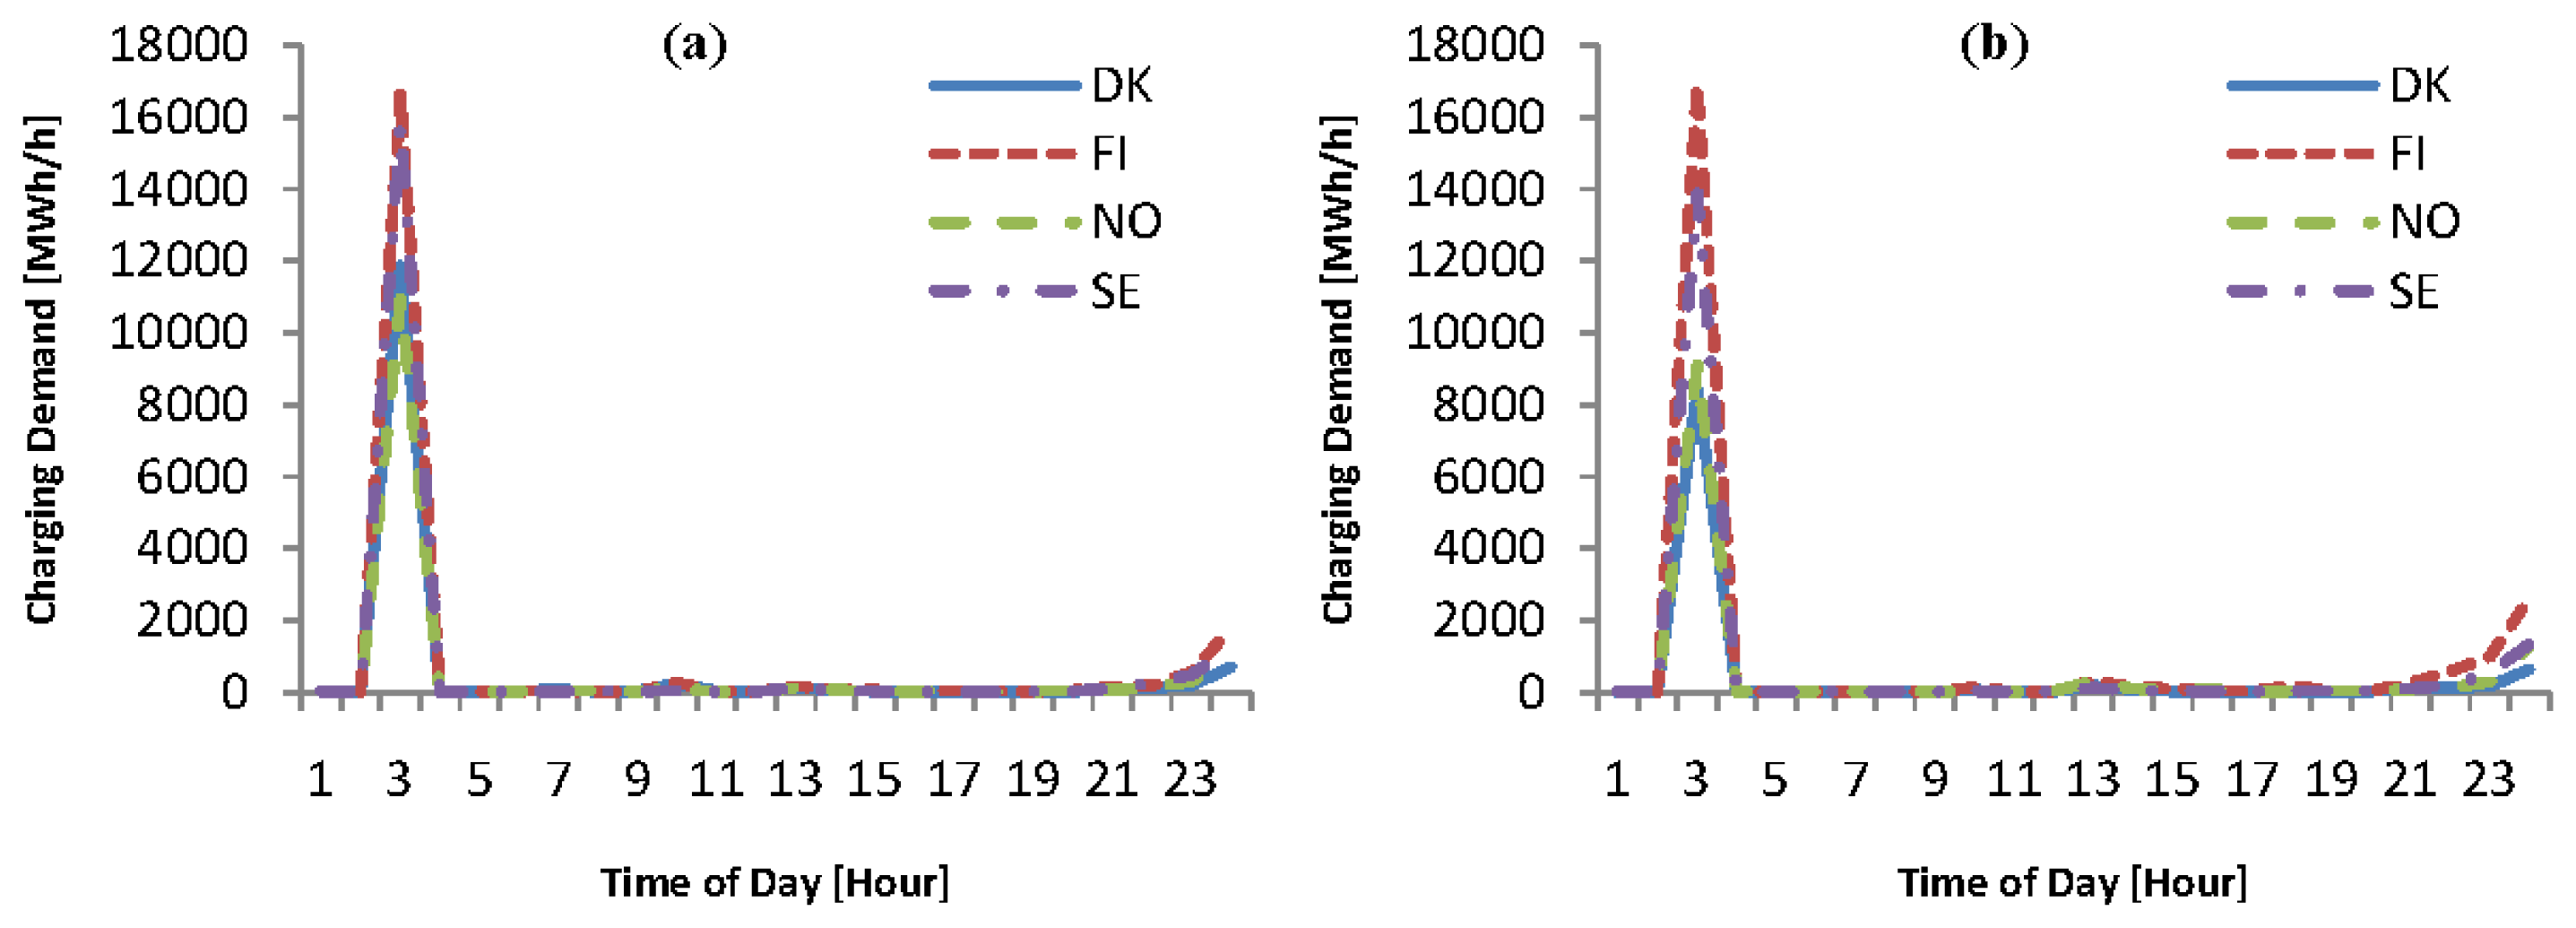
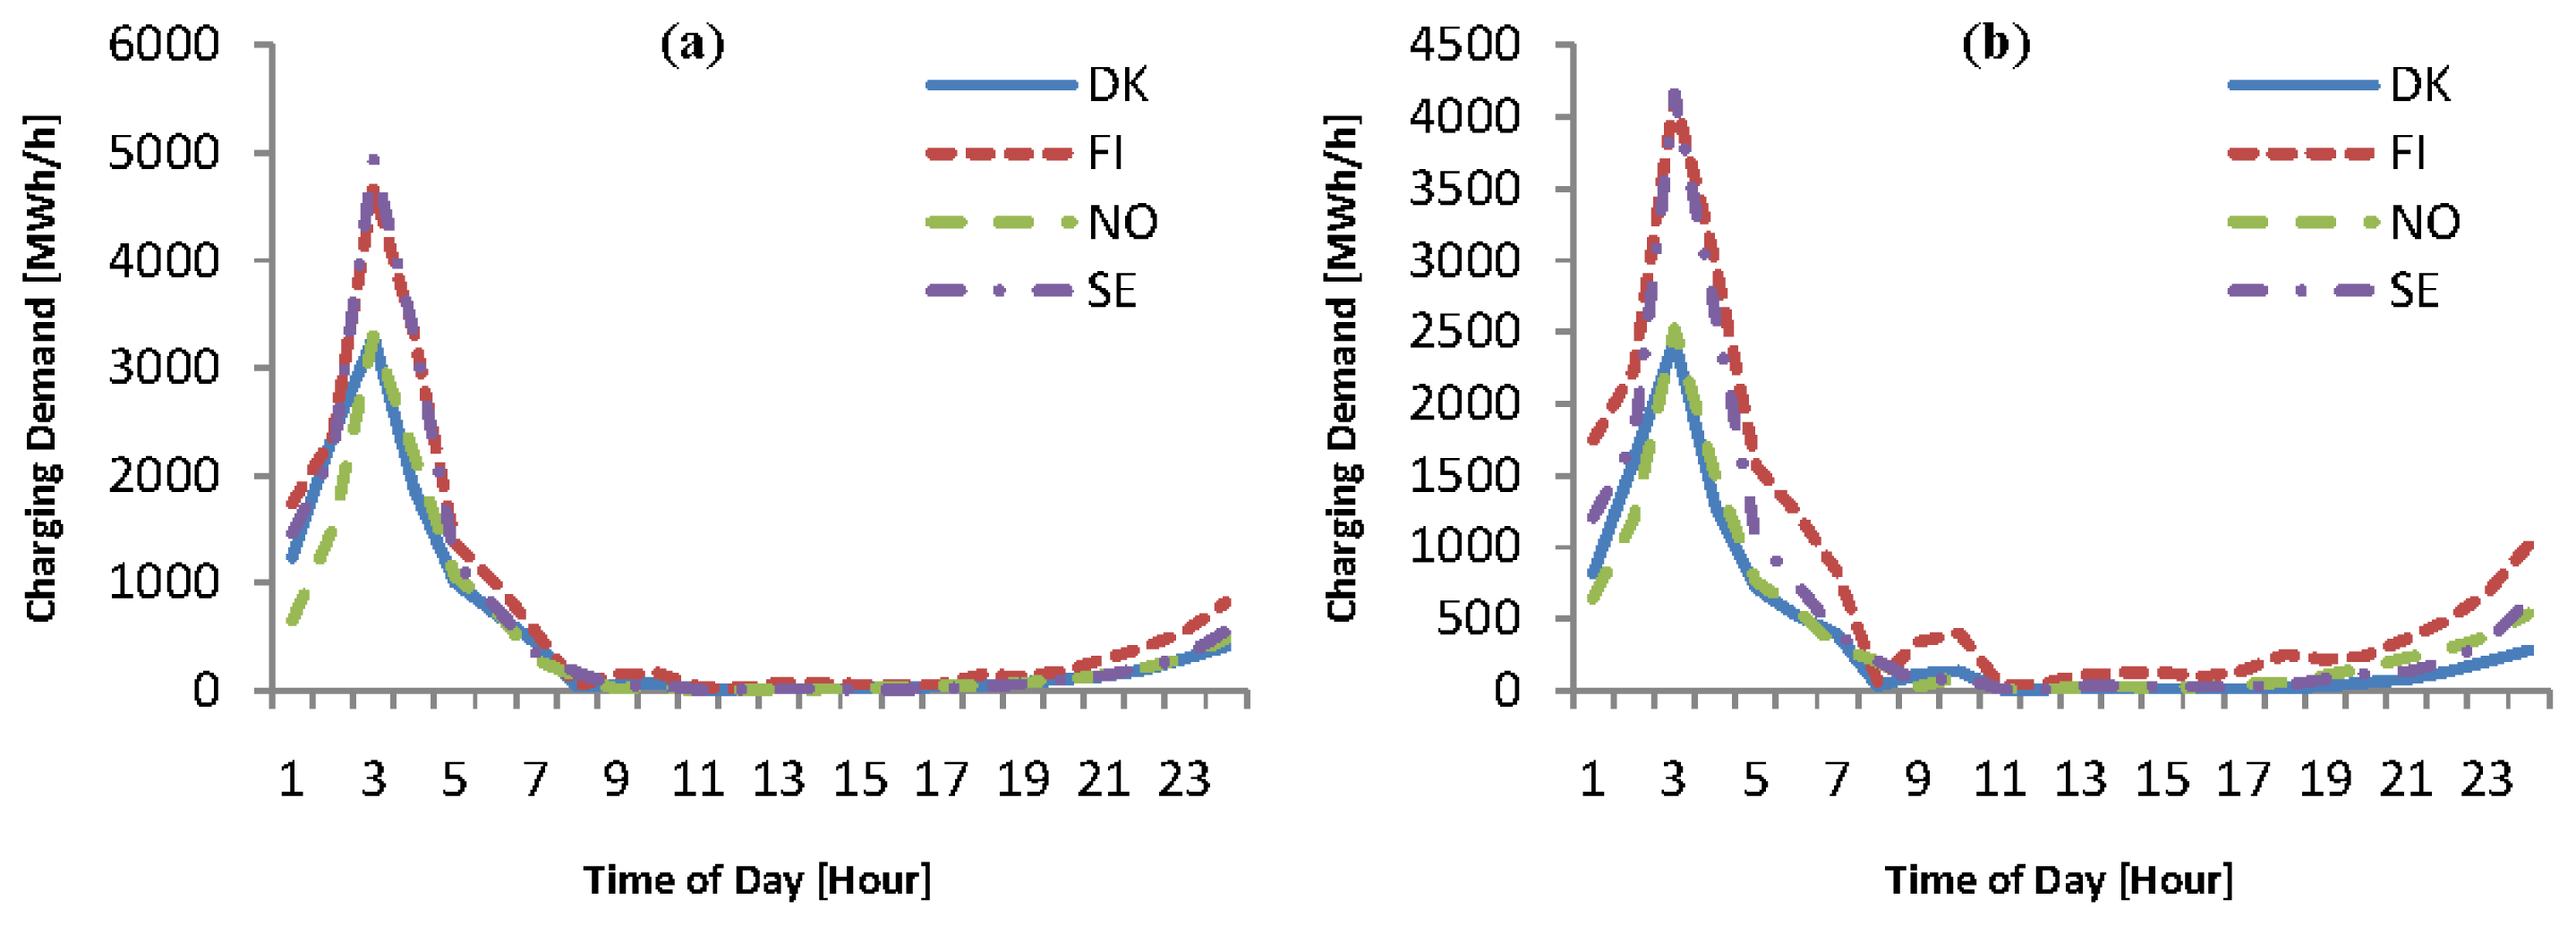
3.1. Uncontrolled Charging All Day
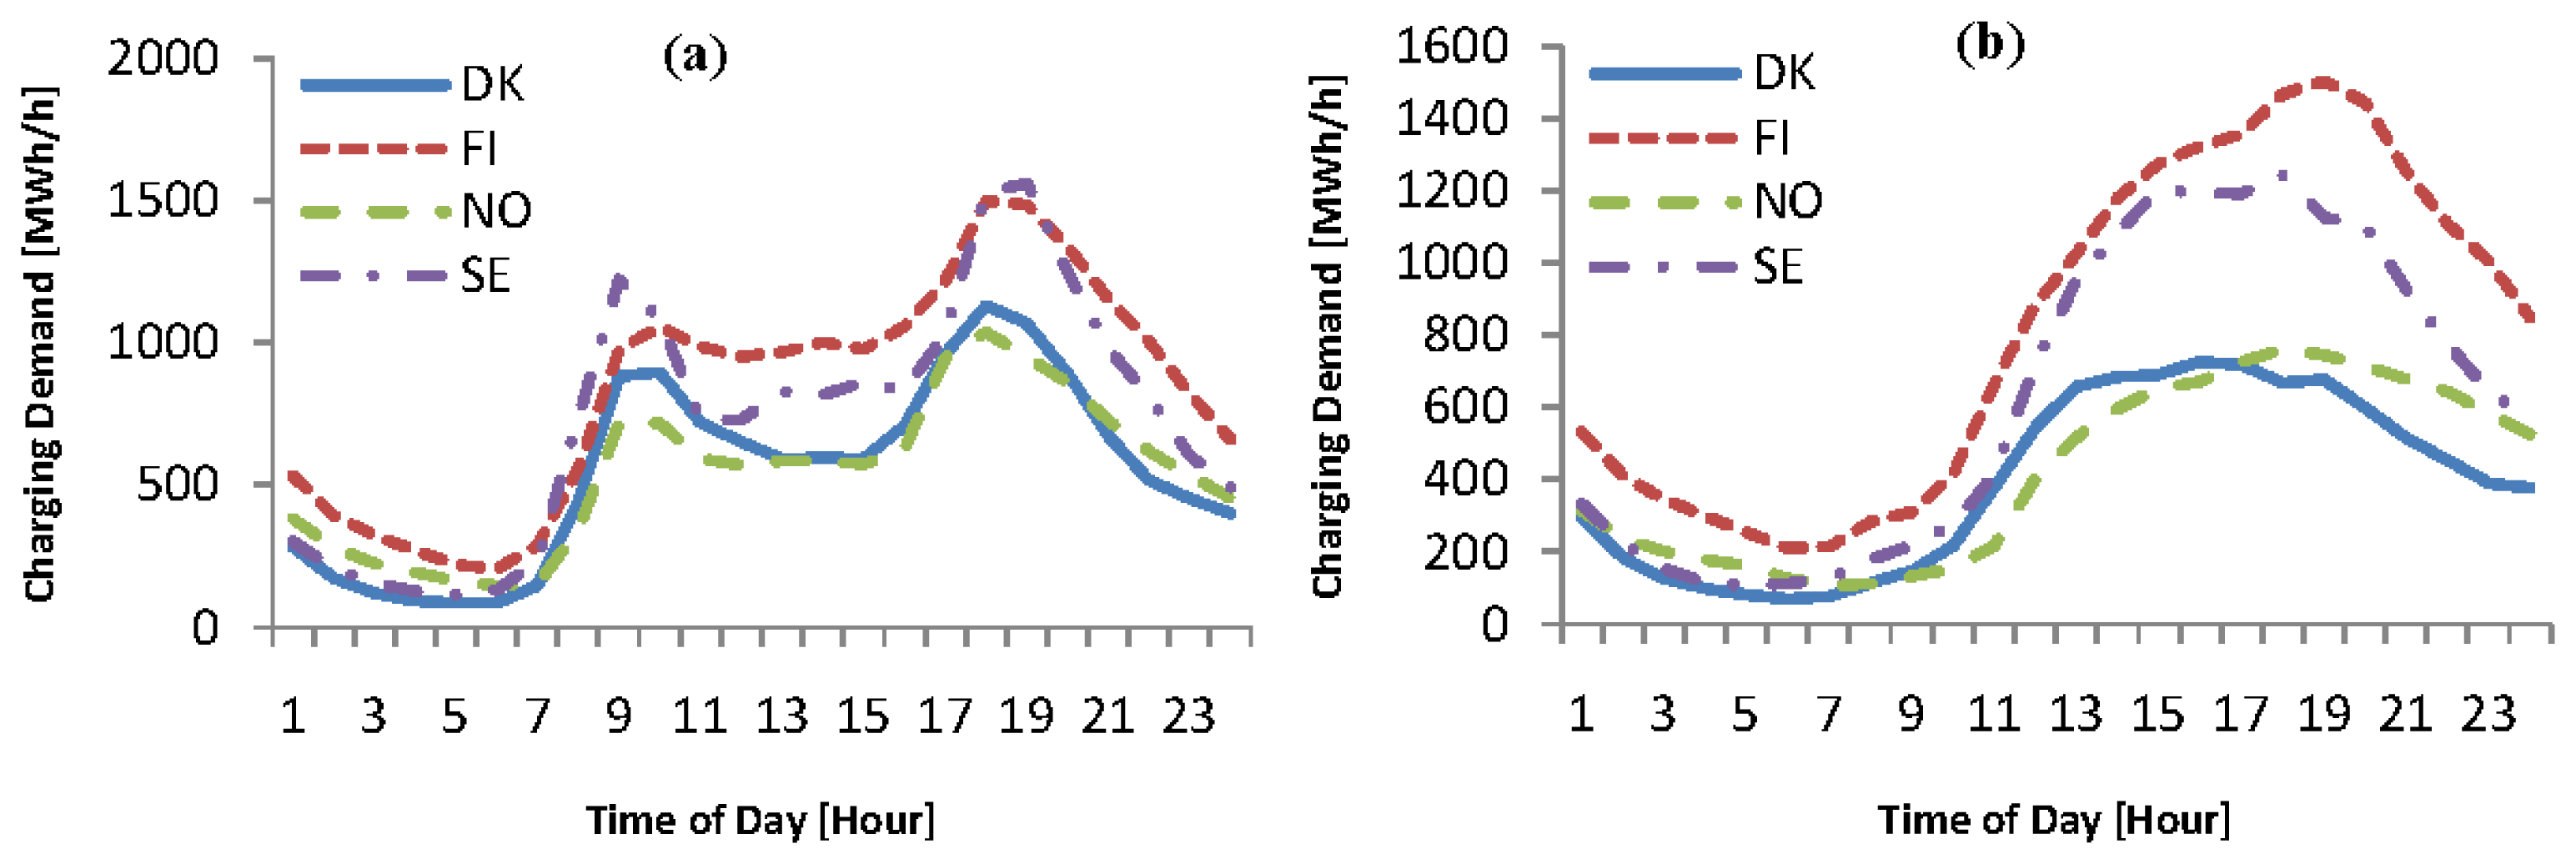
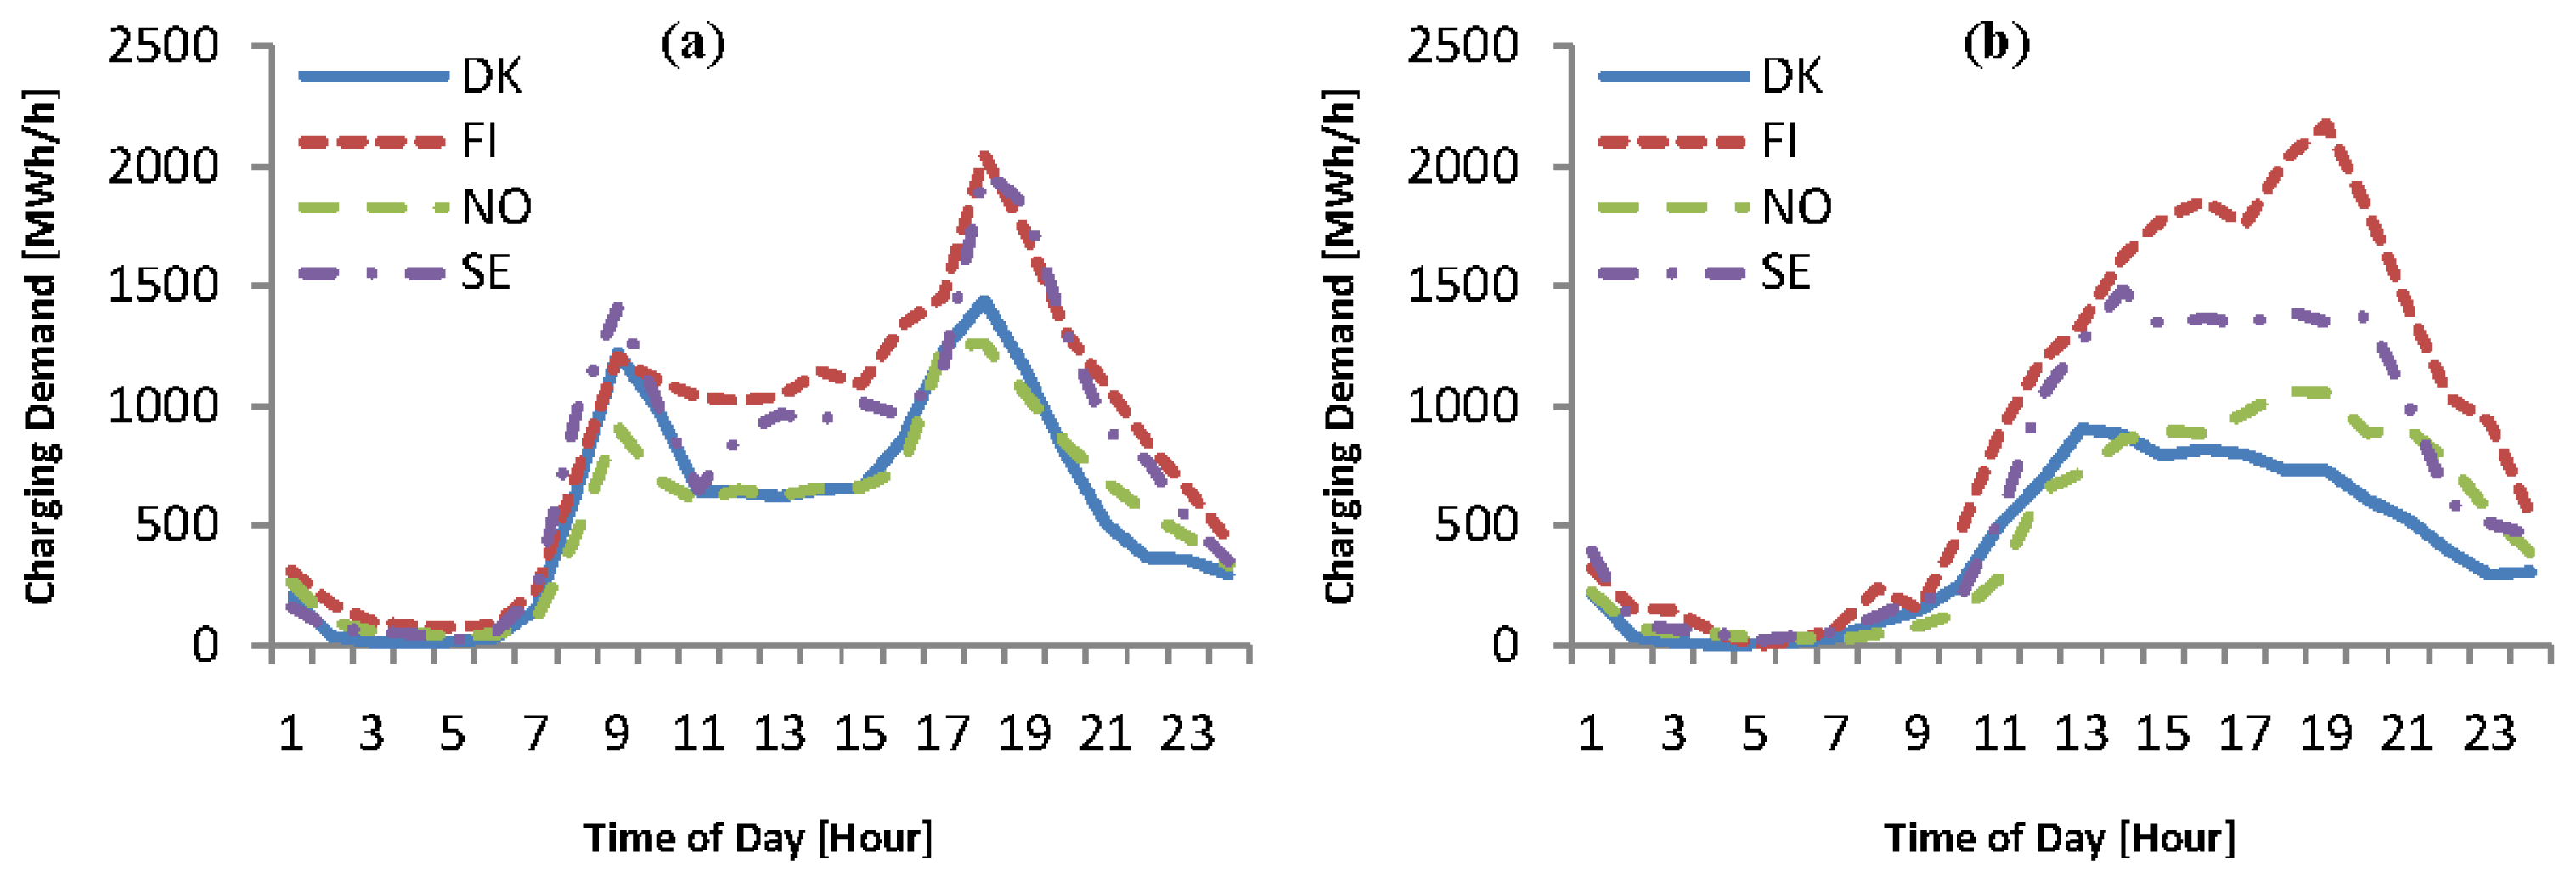
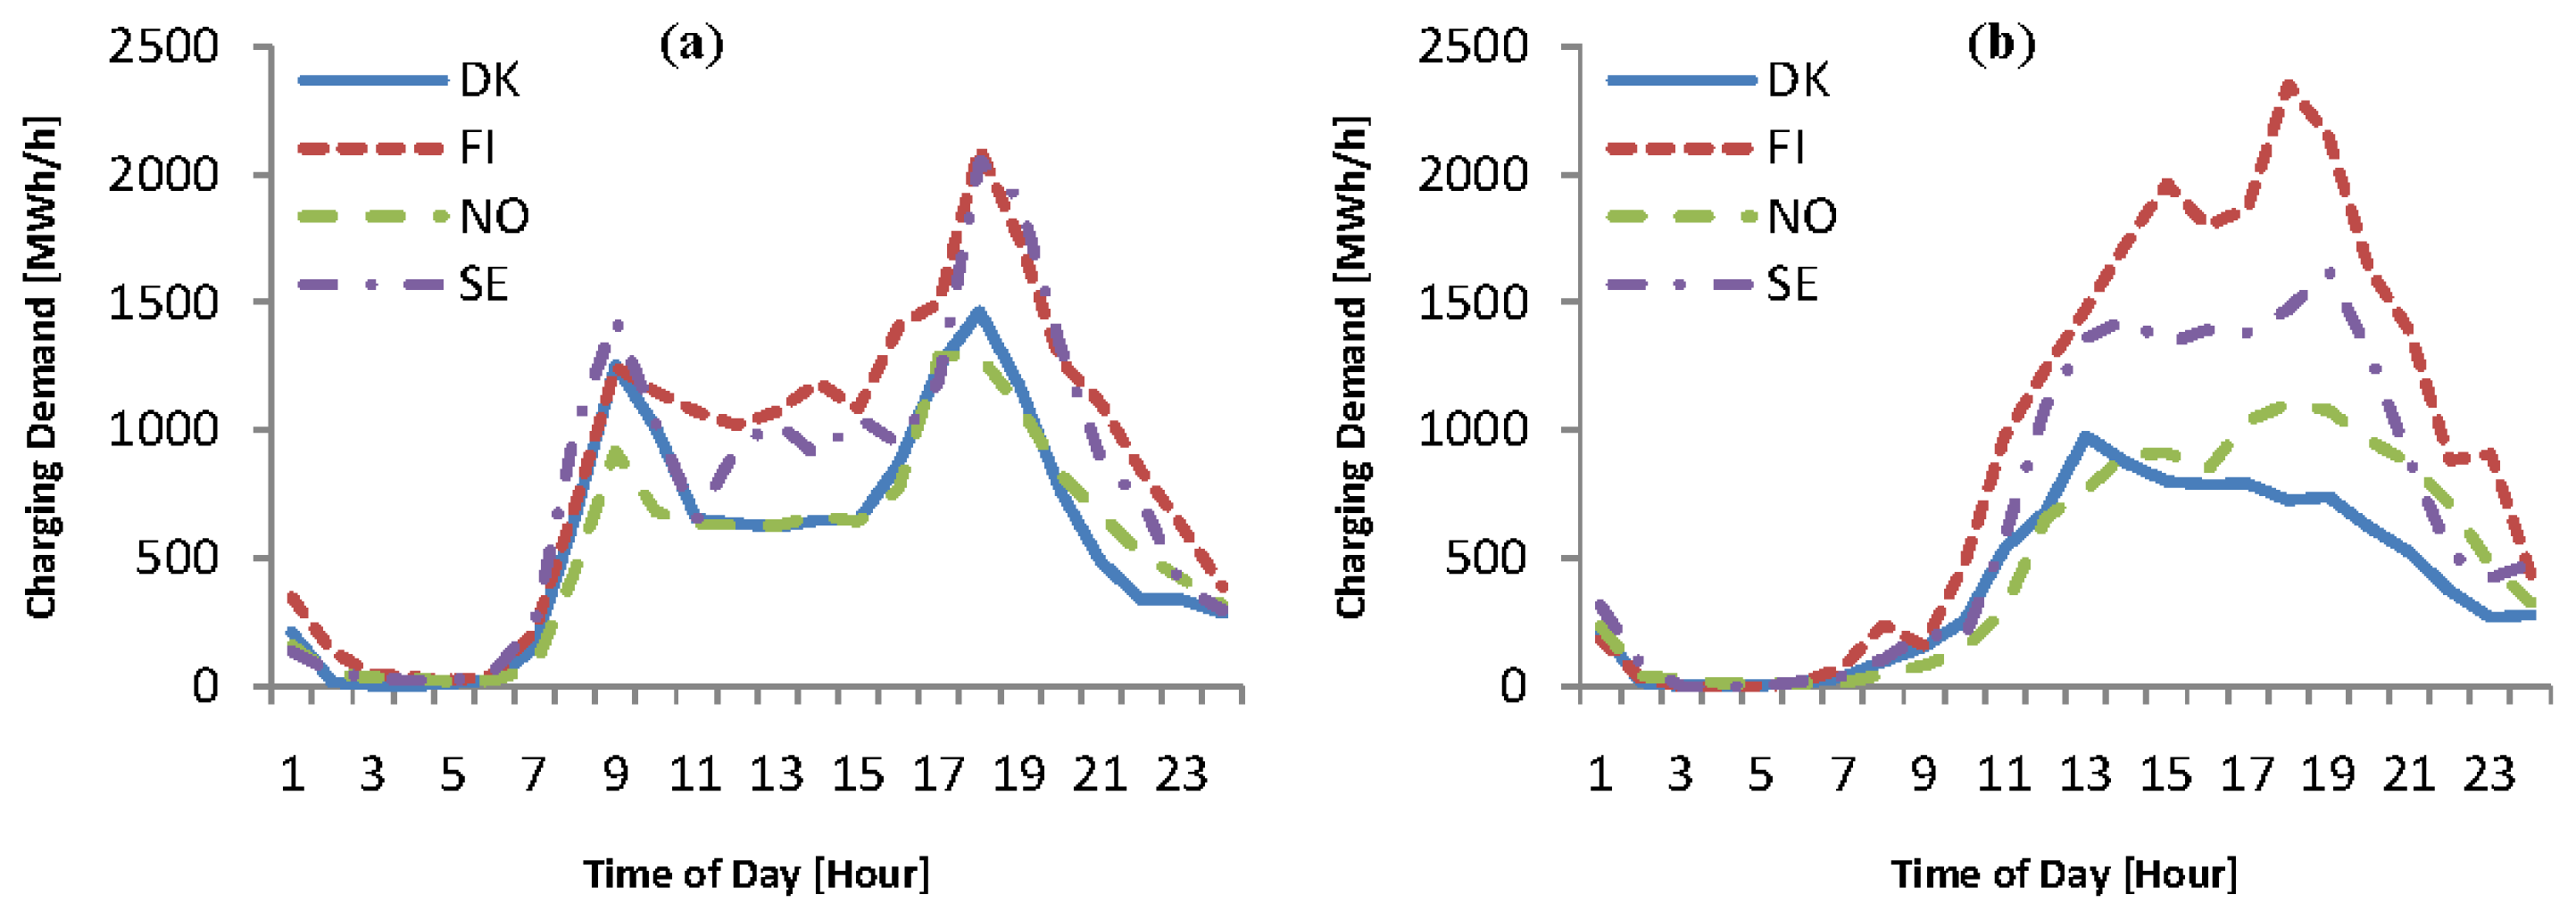
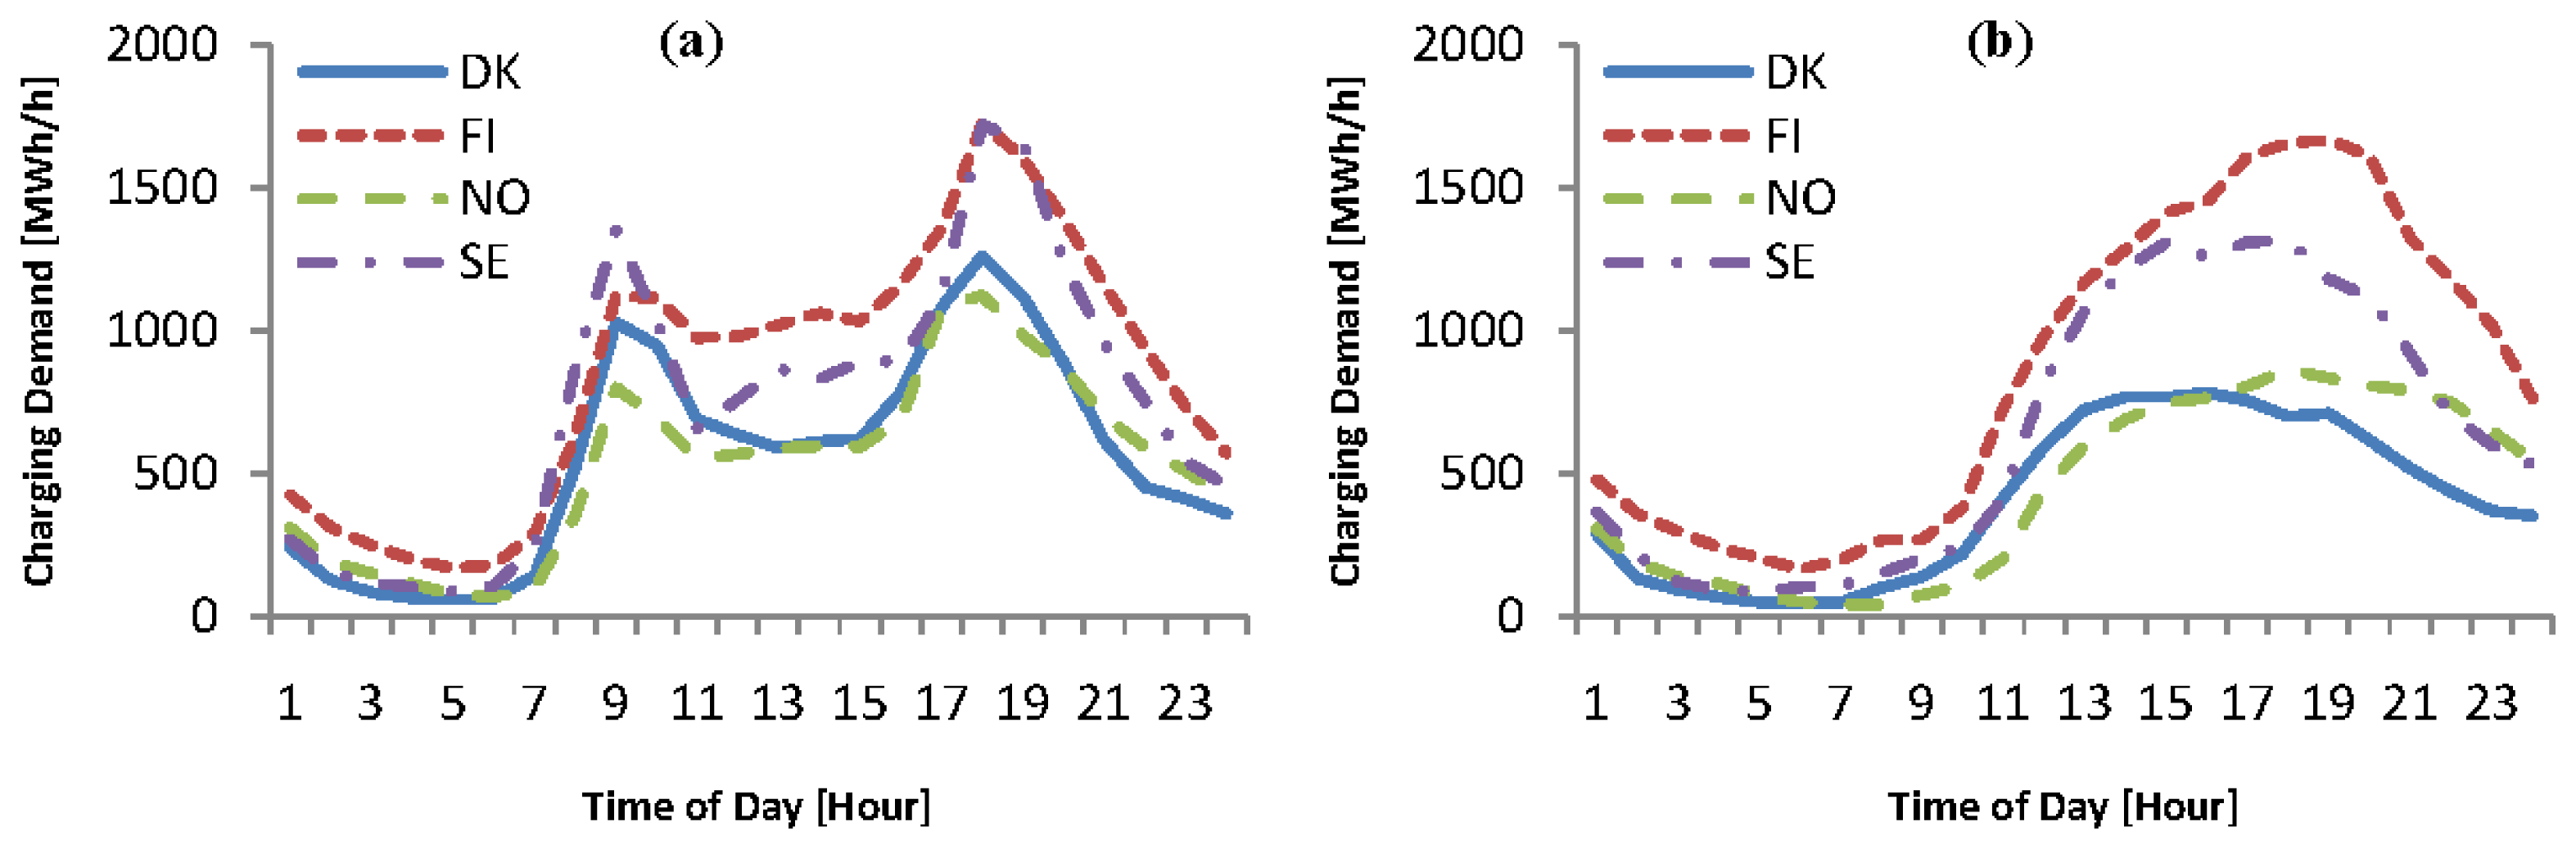
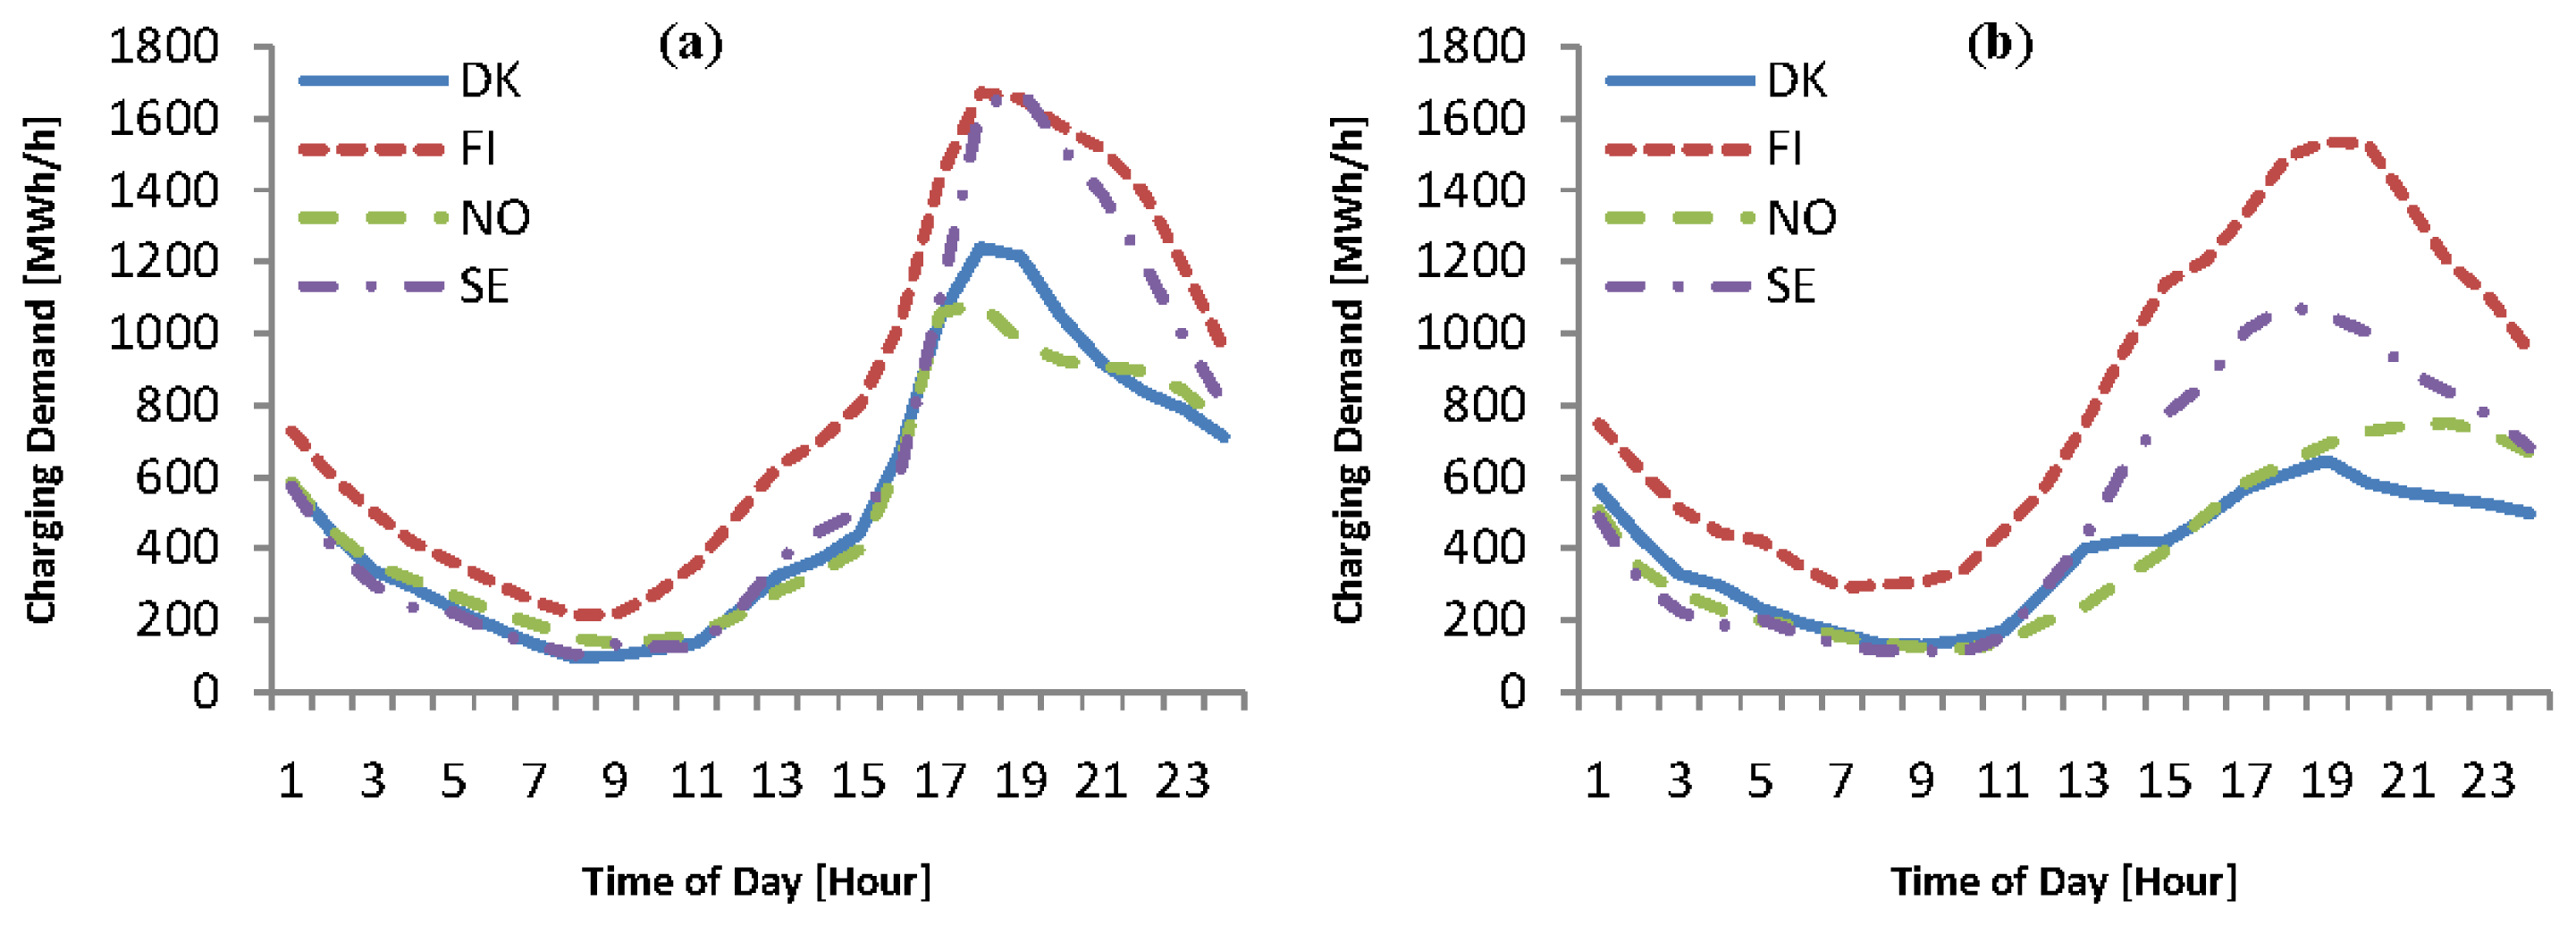
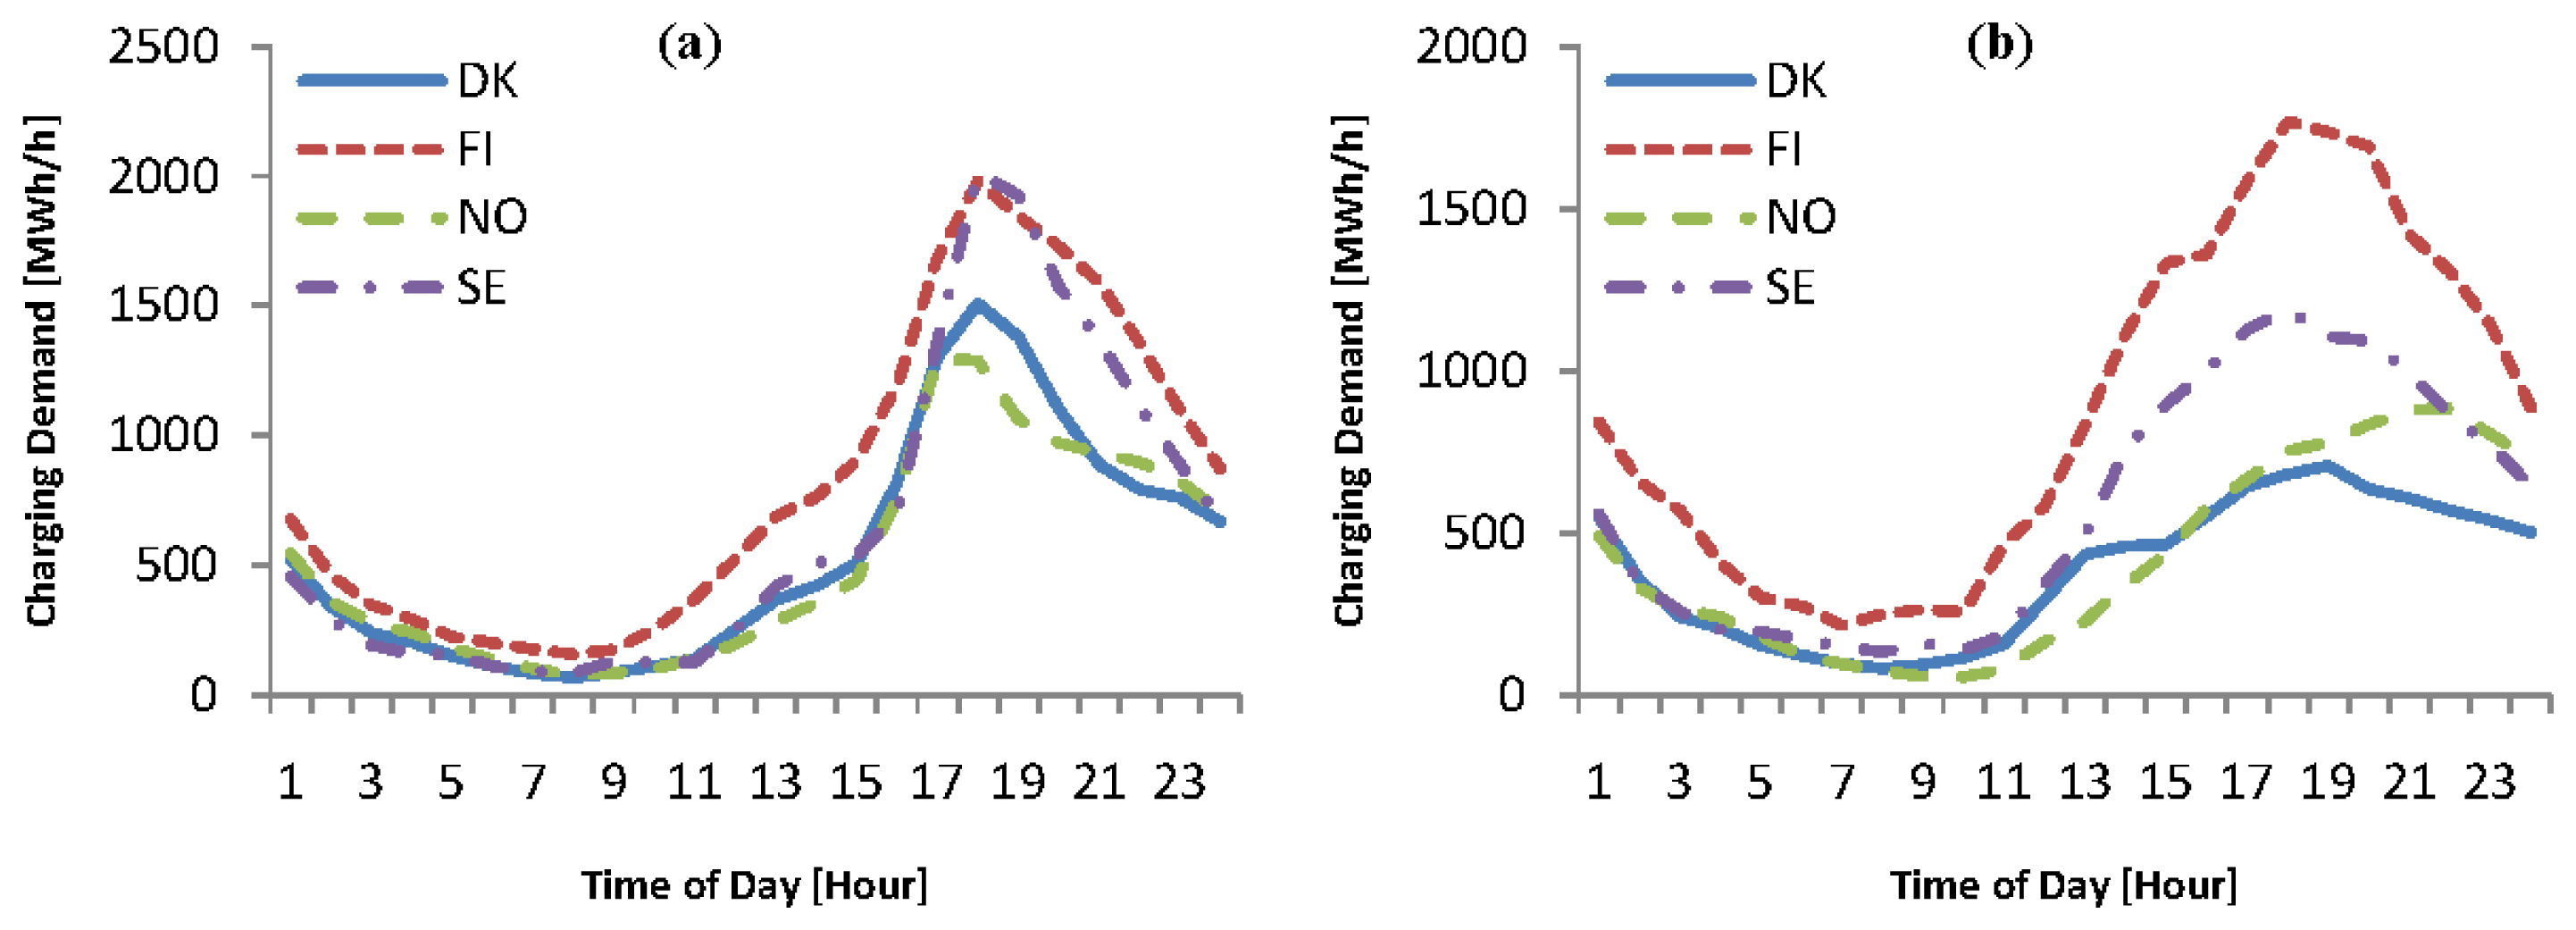
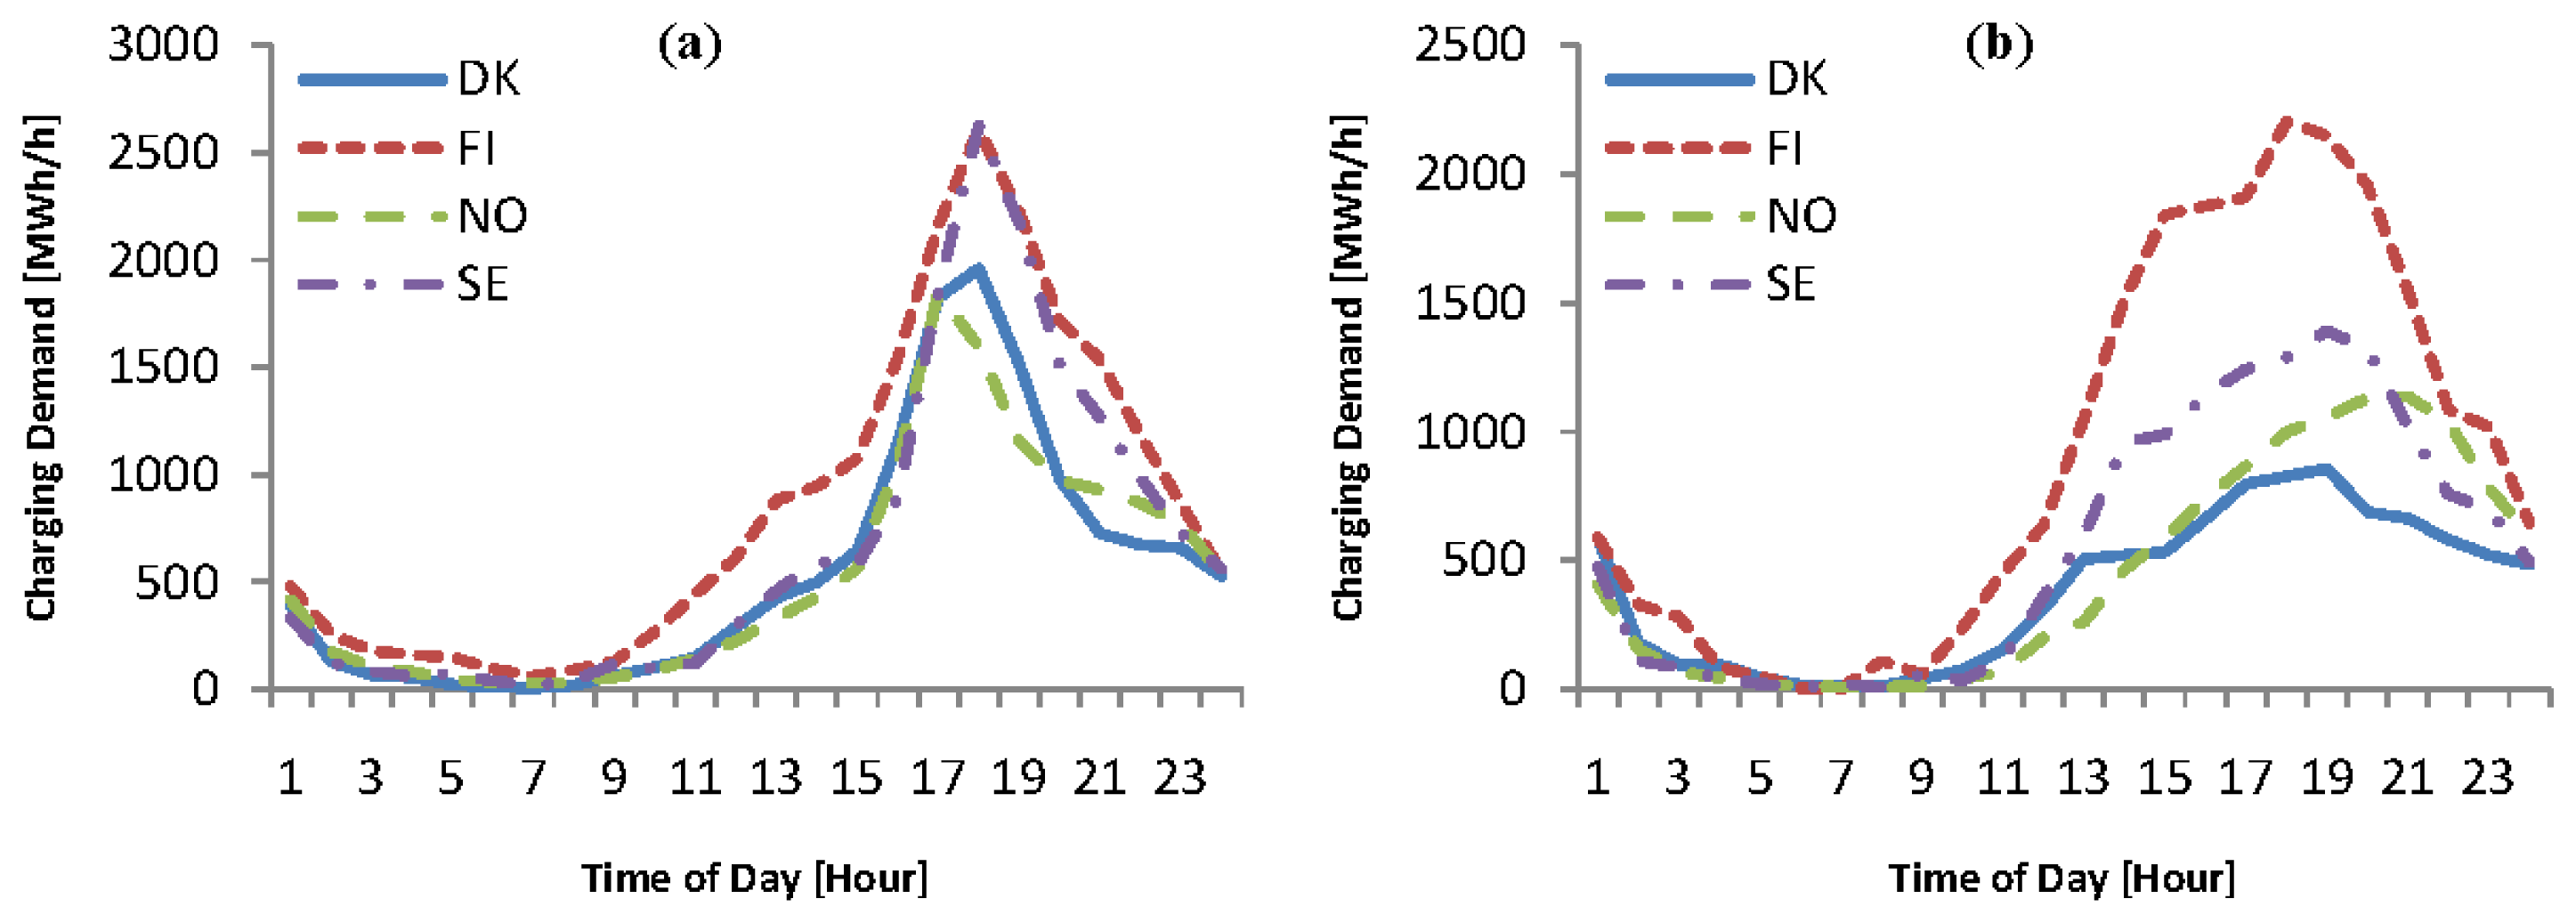
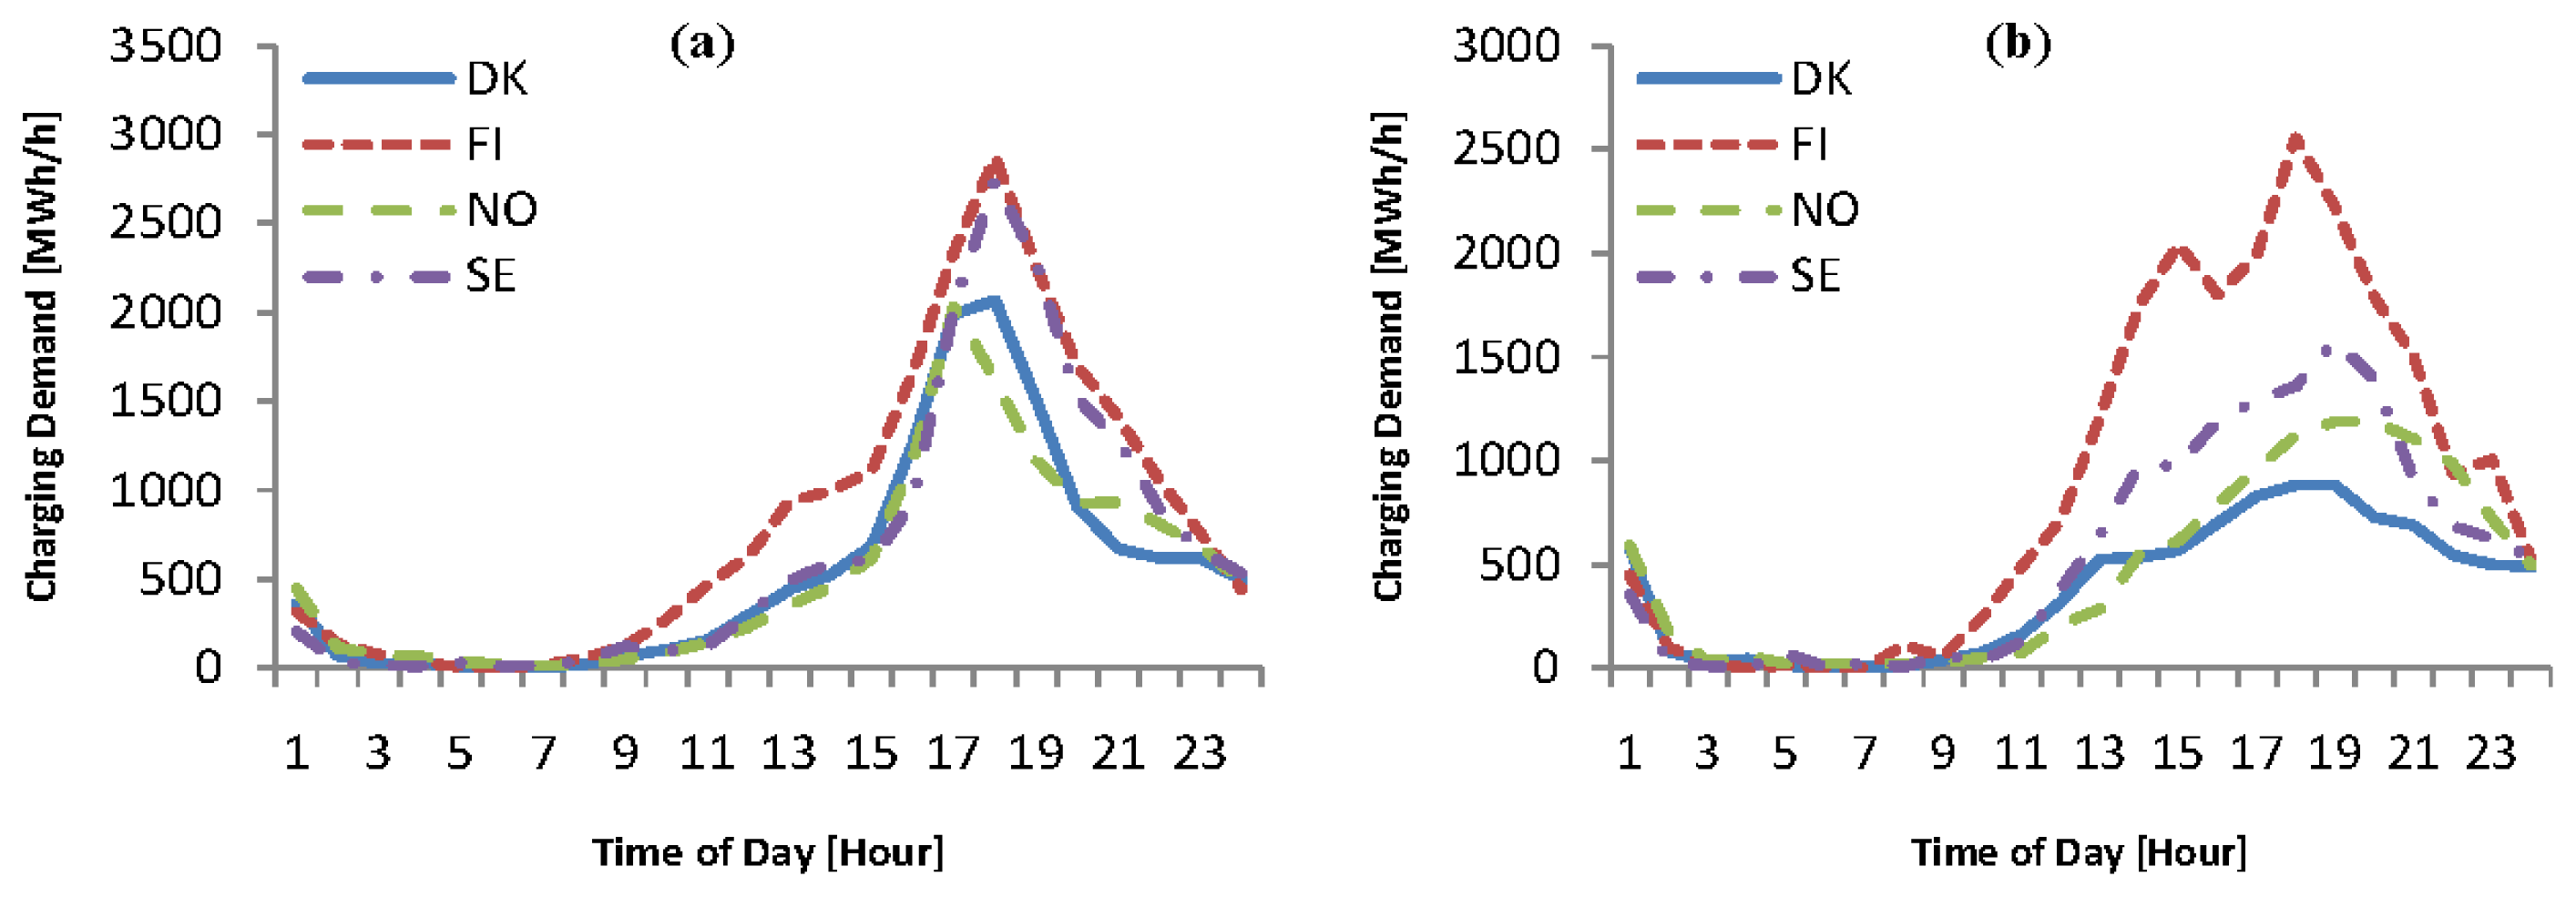
The charging profiles of the uncontrolled charging all day in the Nordic region on weekdays and weekends with different charging rates are shown in Figures 1, Figures 2, Figures 3 and 4. During the weekdays, the charging demands of all the four Nordic countries share a similar trend. With the relatively low charging power rates, the charging load of the EVs is not very high.
There are two peaks in the EV charging load curves of uncontrolled charging, one at 8–10 am in the morning and the other one at 5–8 pm in the evening and the latter one is higher in amplitude. The shape of the load curve is consistent with people's driving requirement between home and workplace. The load curves show obvious differences between the weekdays and the weekends. The charging load on weekends starts to rise rapidly in the late morning and the majority of the charging happens in the afternoon and evening when the people arrive home. For both the scenarios on weekdays and weekends, the charging demand curves are steeper and have higher peak demands with a higher charging power rate.
3.2. Uncontrolled Charging at Home
The charging profiles of the uncontrolled charging at home in the Nordic region on weekdays and weekends with different charging rates are shown in Figures 5, 6, 7 and 8. They show different patterns from the scenarios of the uncontrolled charging all day during the weekdays. The peaks in the morning in the uncontrolled charging all day scenarios disappear. The EV charging demands start to increase in the afternoon and come to the peak in the evening from 5 to 8 pm when people reach home from work. On weekends, the demands of the uncontrolled charging at home have similar patterns with the scenarios of the uncontrolled charging all day. The same as the uncontrolled charging all day, the charging demand curves of the uncontrolled charging at home are steeper and have higher peak demands with a higher charging power rate.
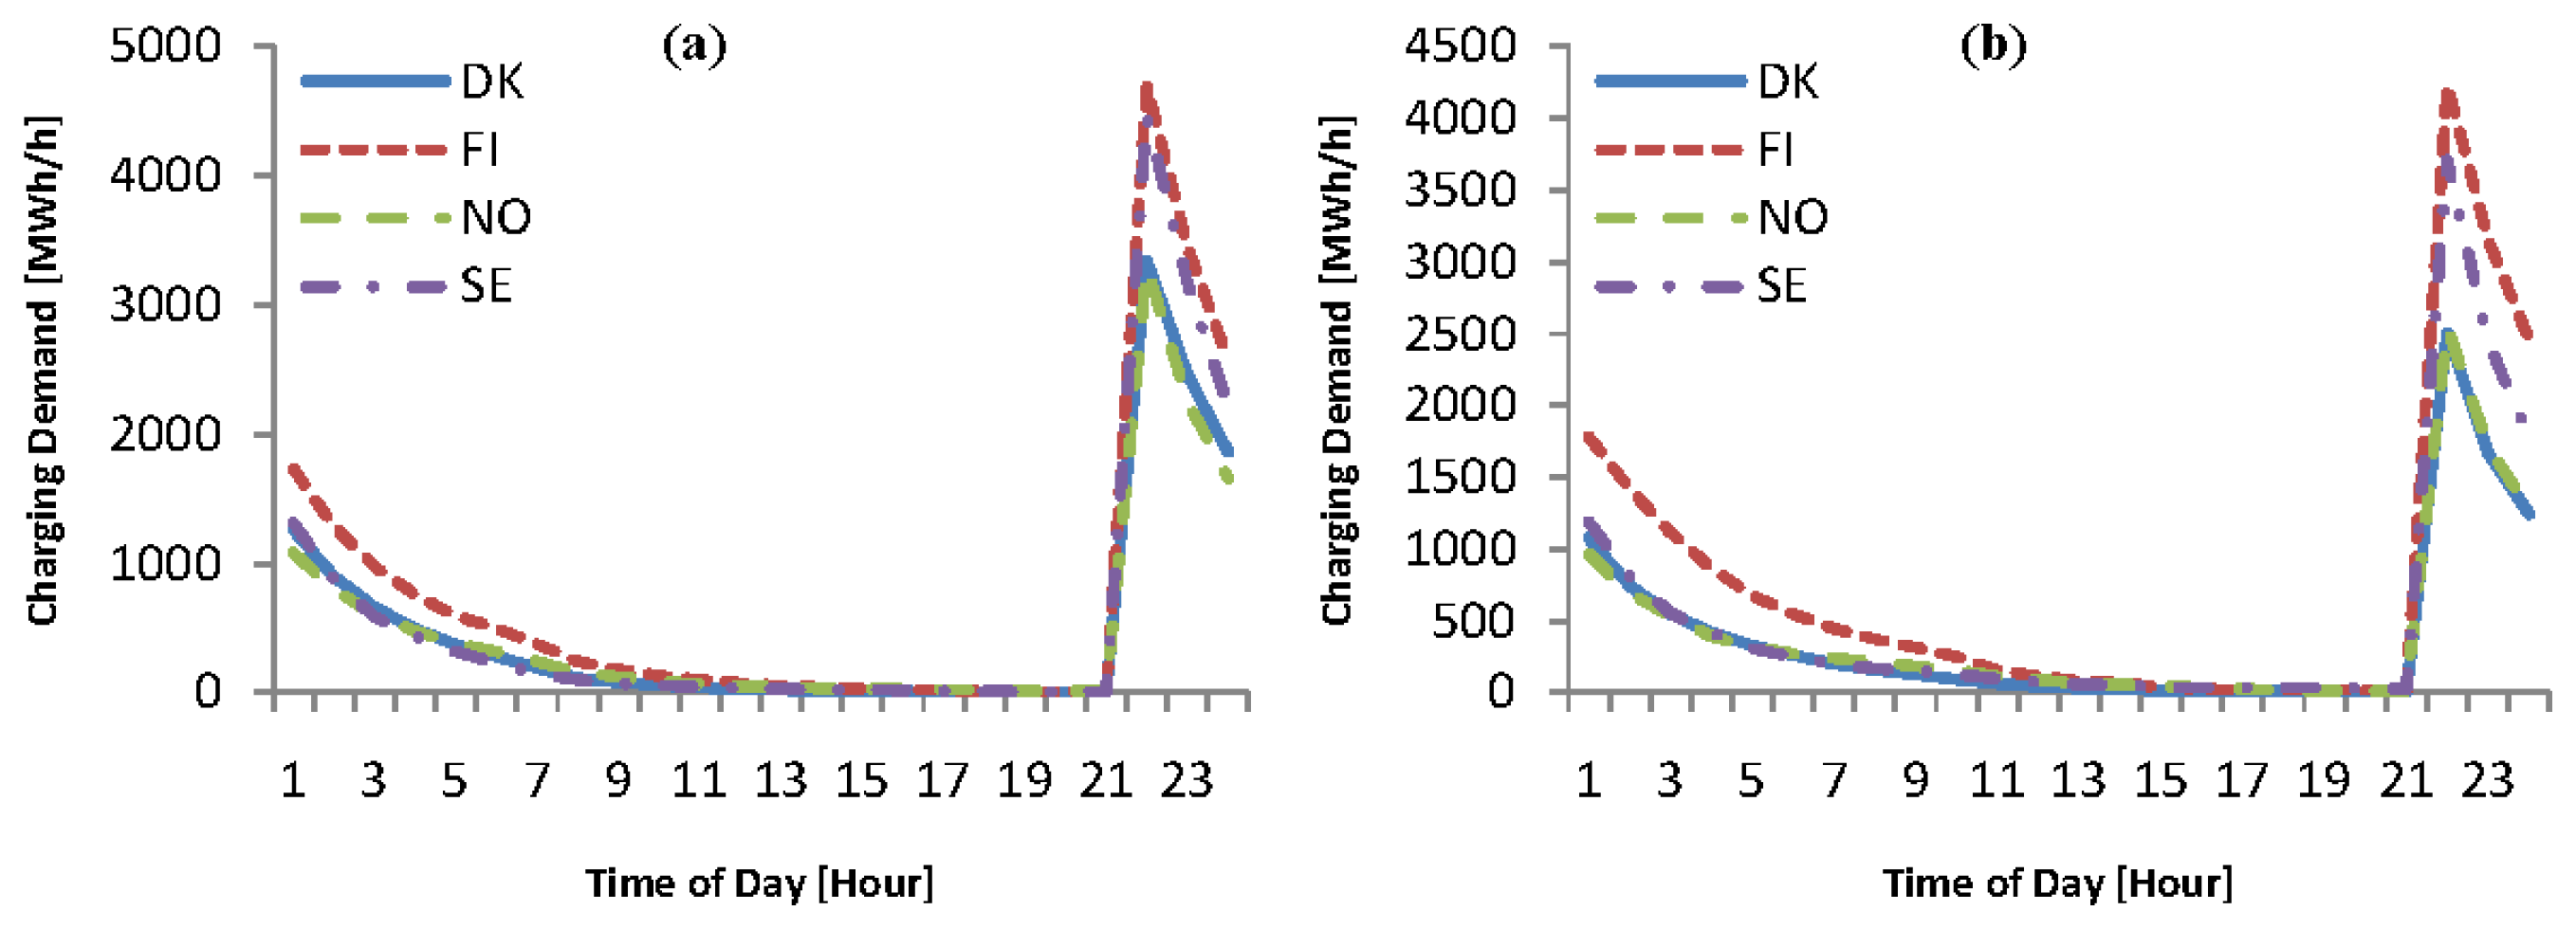
3.3. Timed Charging
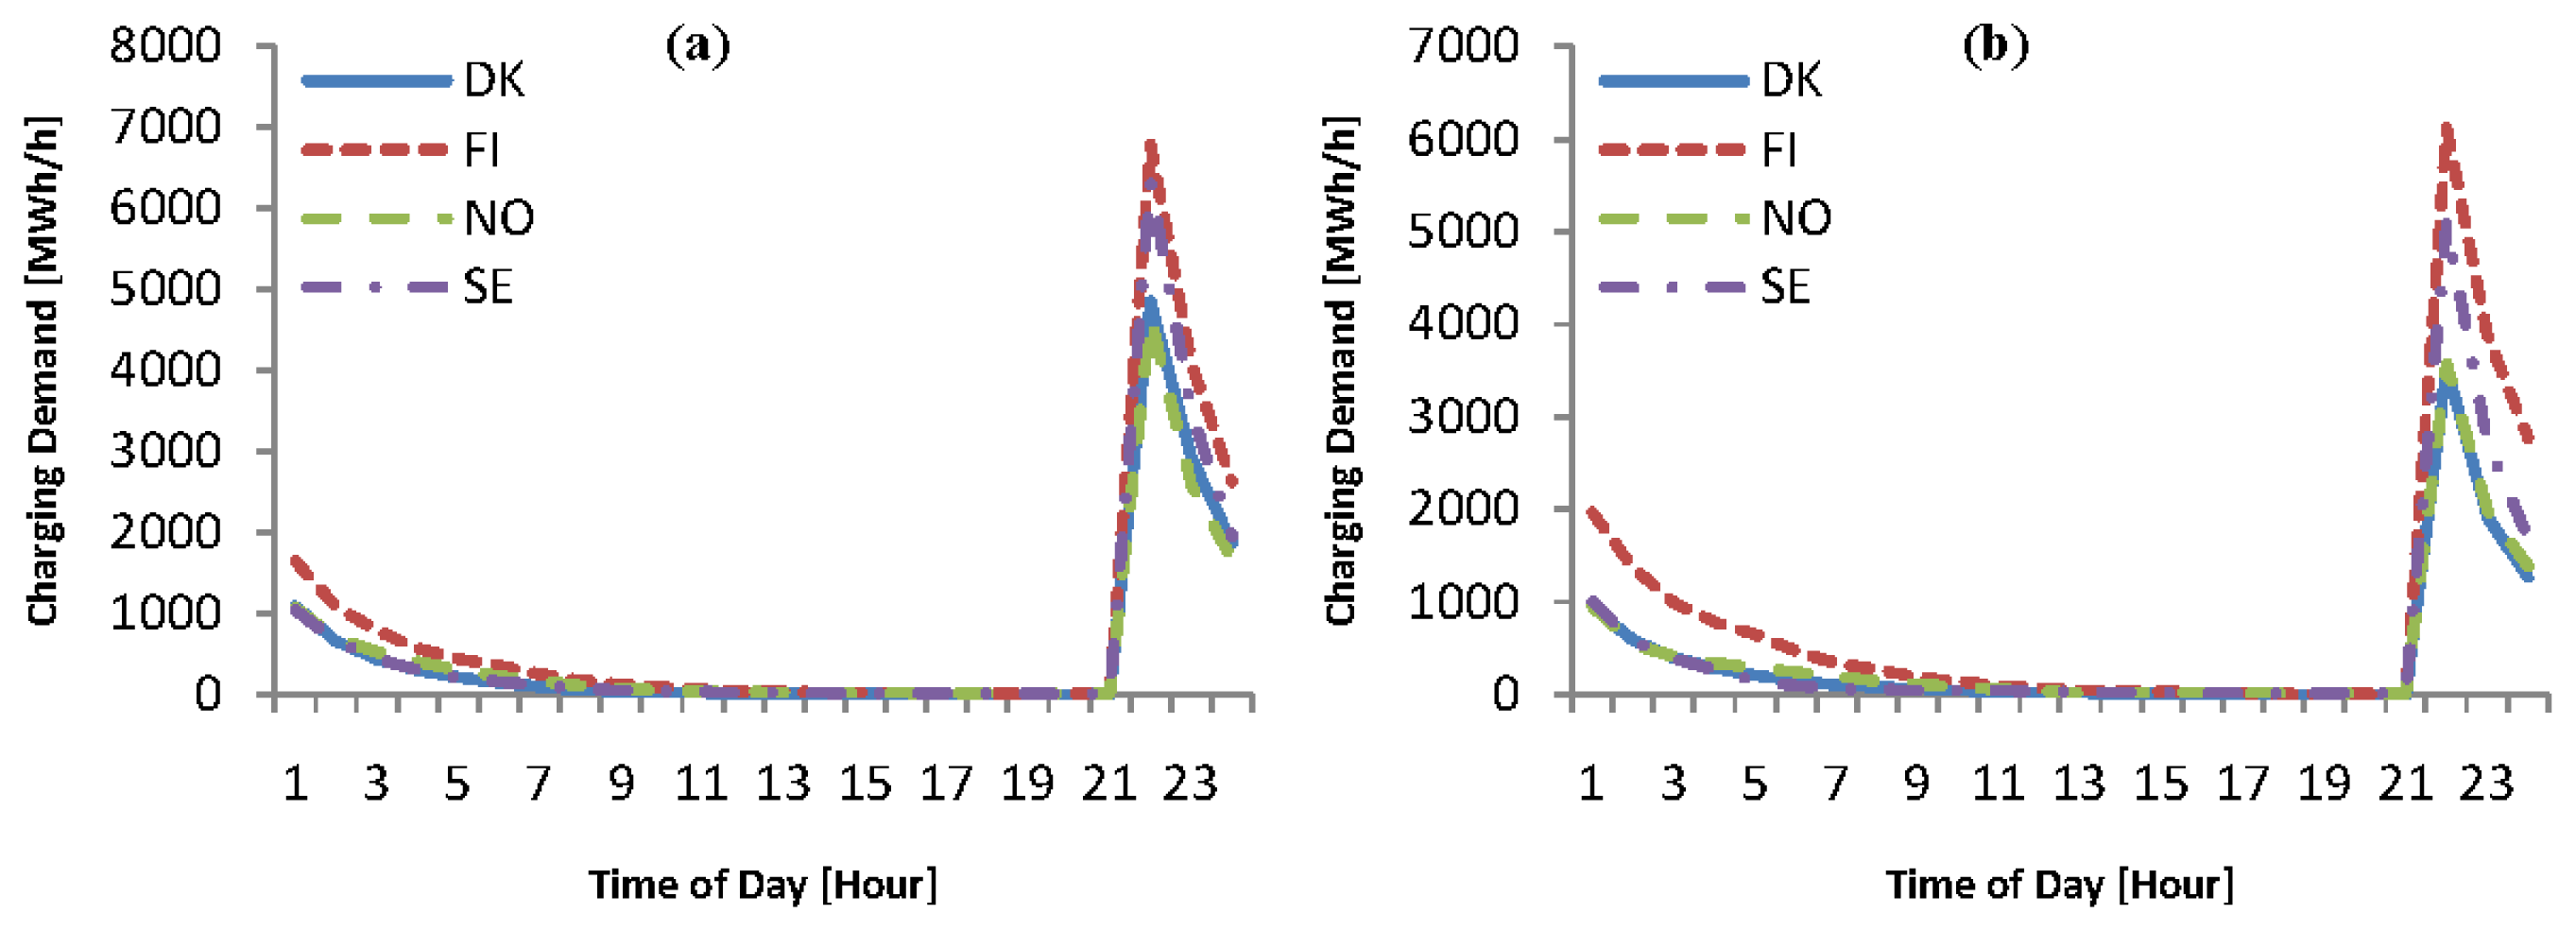
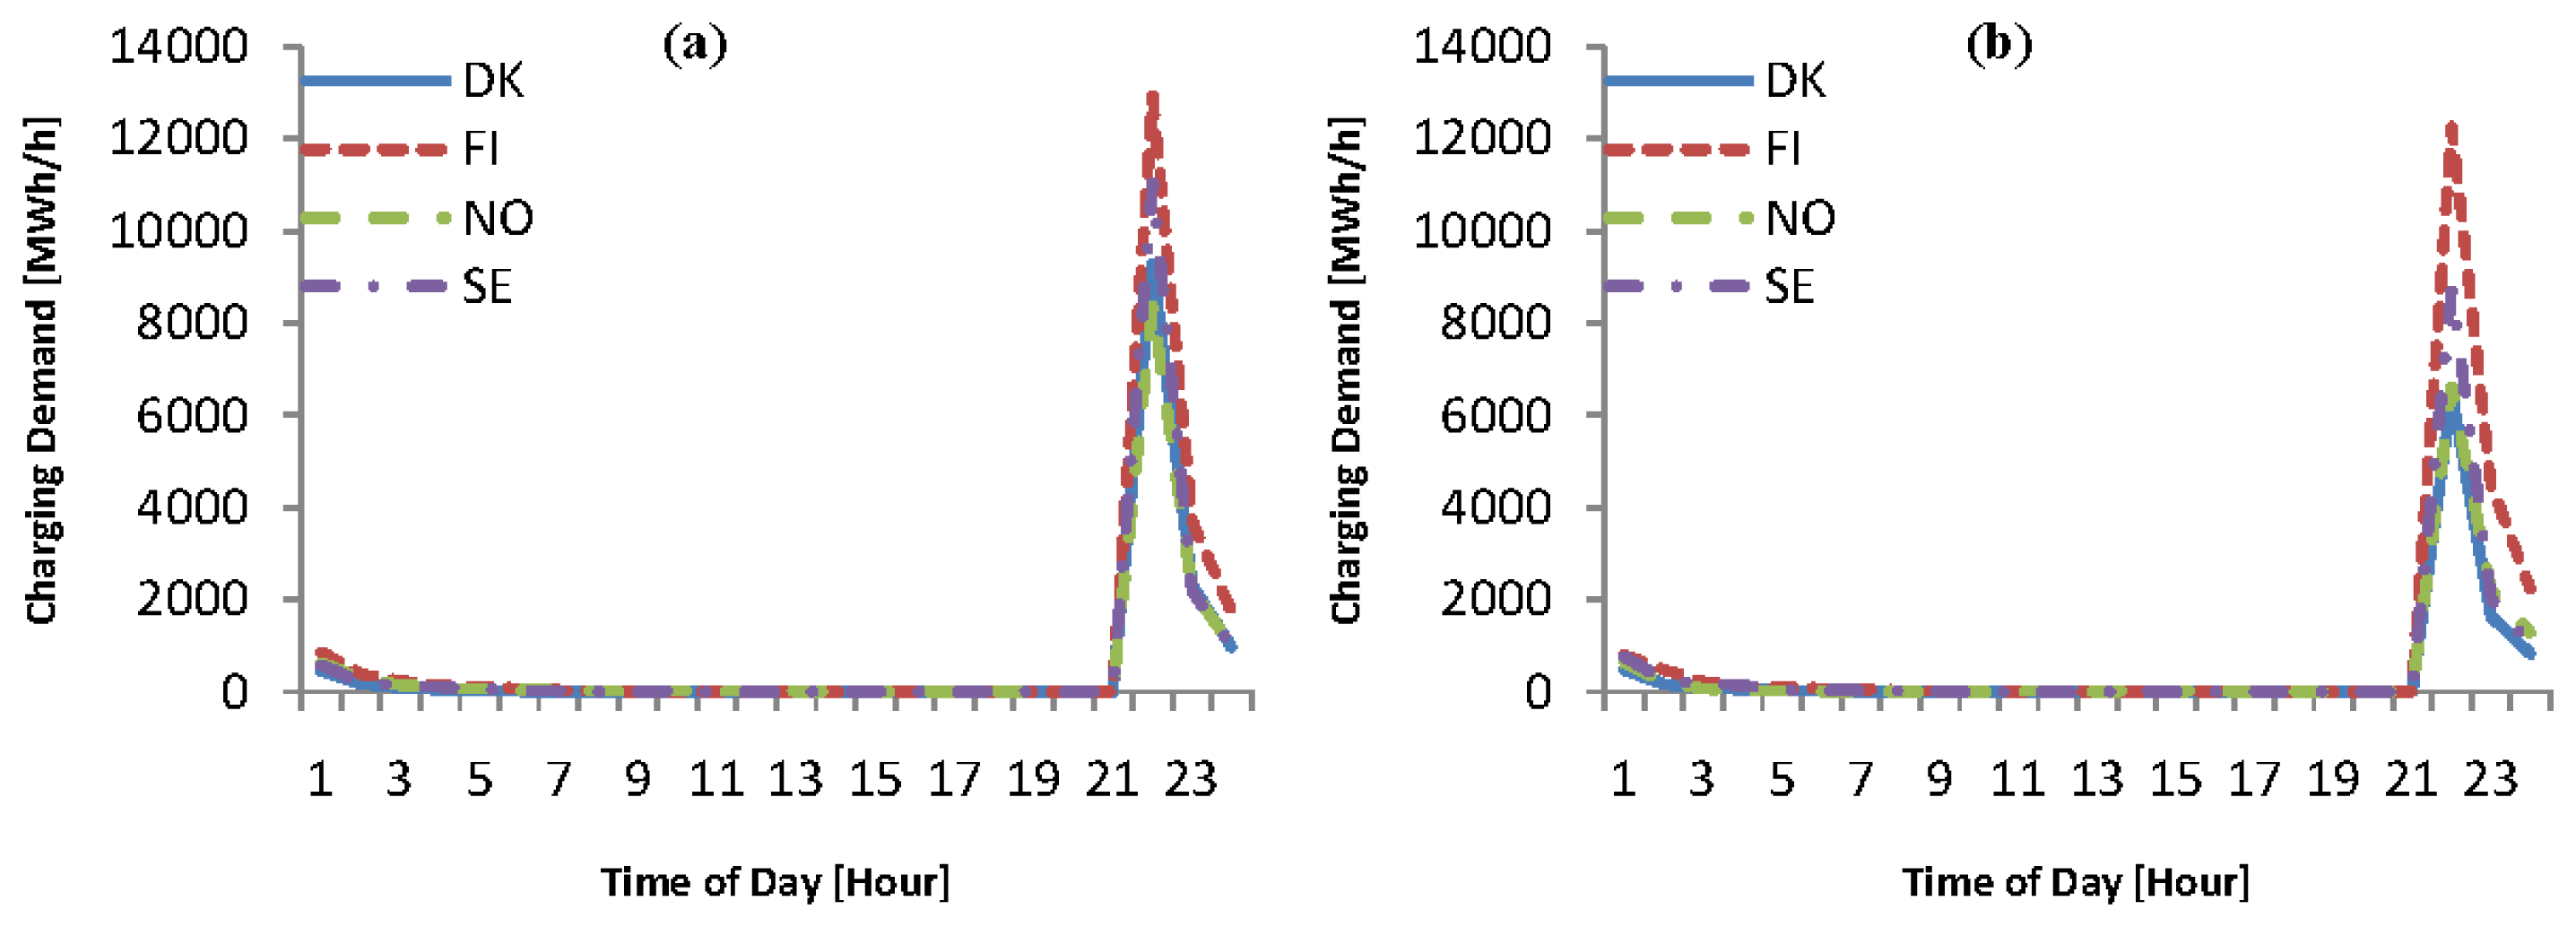
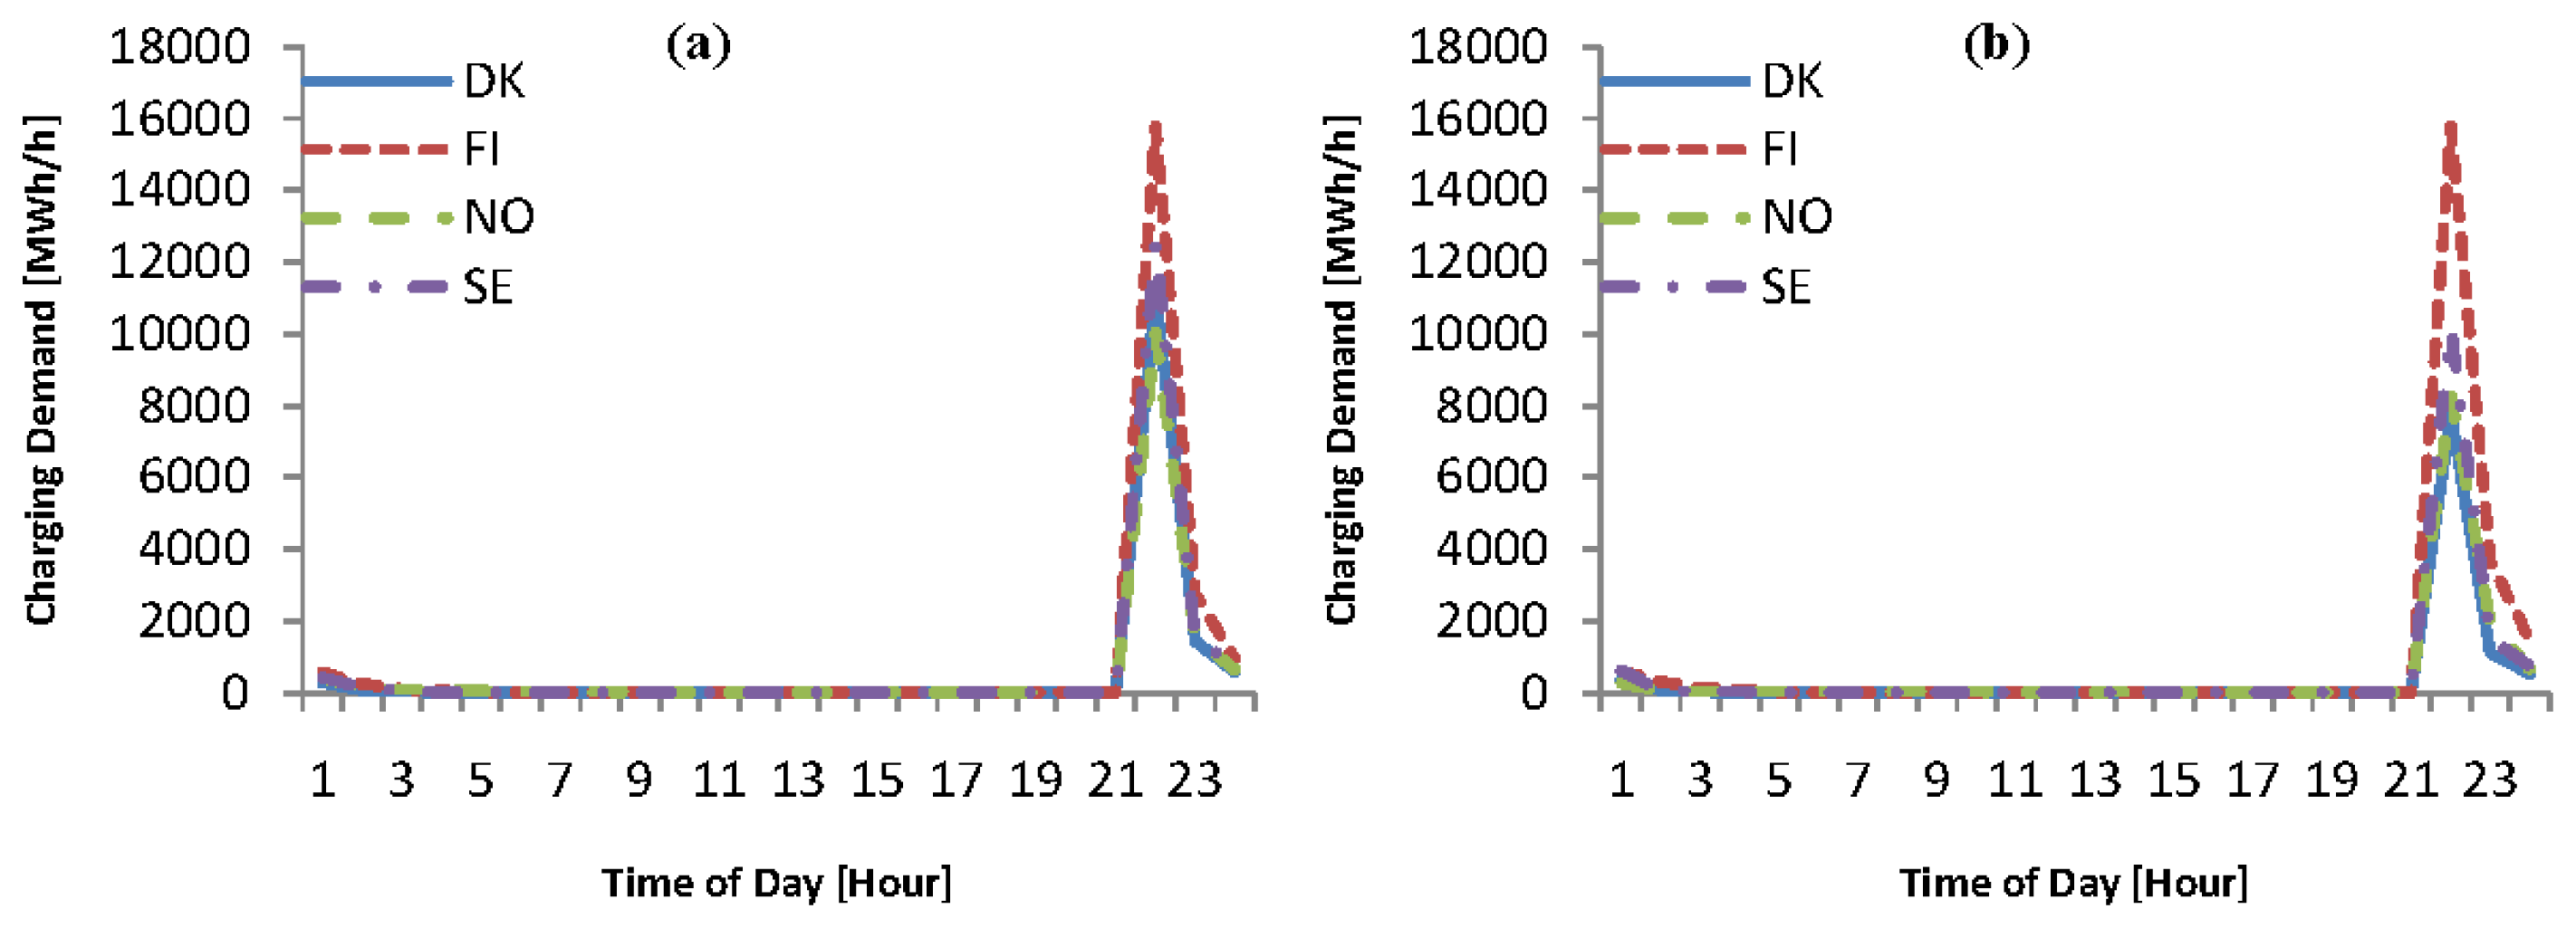
The charging profiles of the timed charging in the Nordic region on weekdays and weekends with different charging rates are shown in Figures 9, 10, 11 and 12. As the vehicles are only charged after 9 pm in the evening, most of the charging demand converges in the short time slot from 9 to 11 pm and consequently form a steep spike in this period. Both the demands of the timed charging on weekdays and weekends have such a load pattern. Similar with the uncontrolled charging scenarios, the timed charging demand curves are steeper and have higher peak demands with a higher charging power rate.
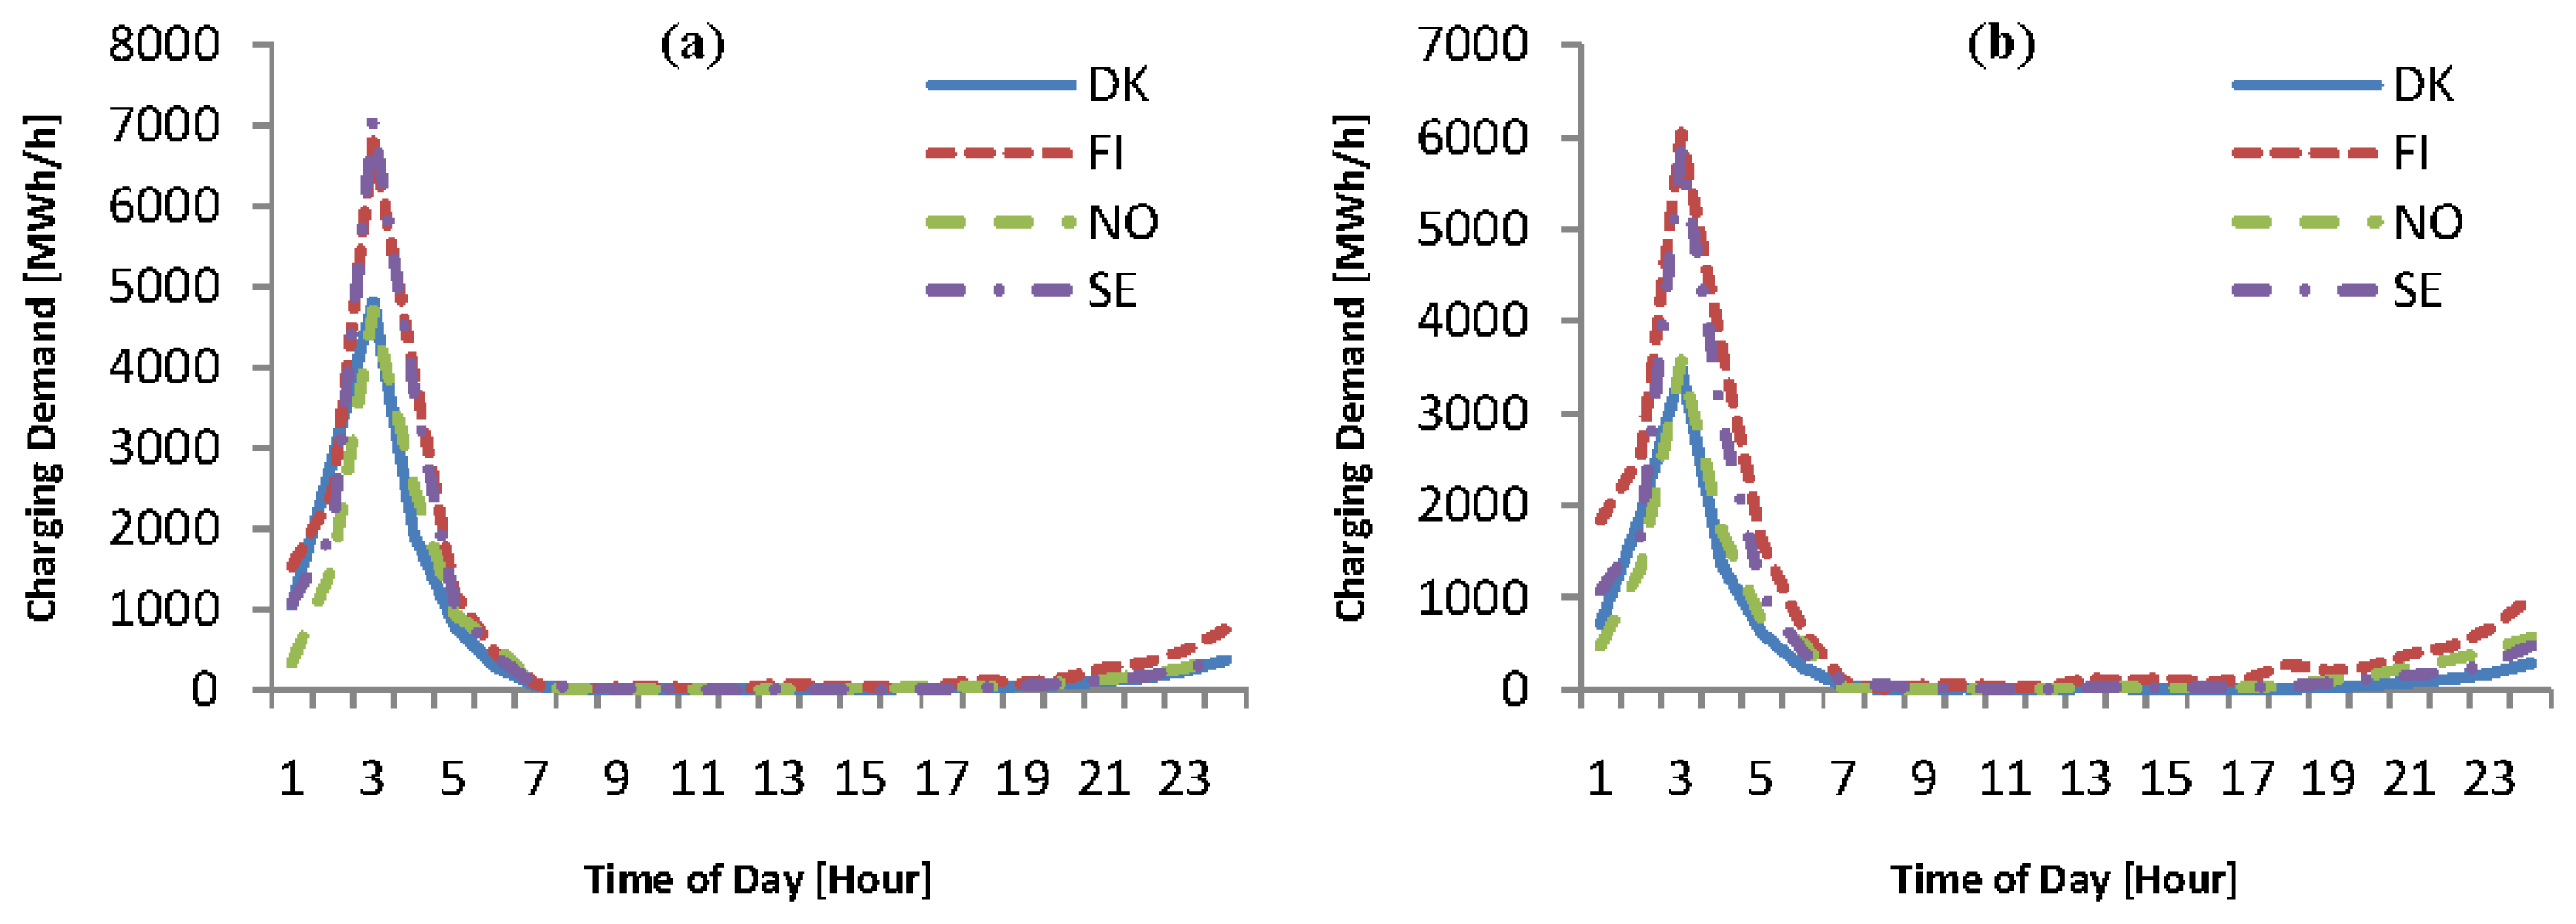
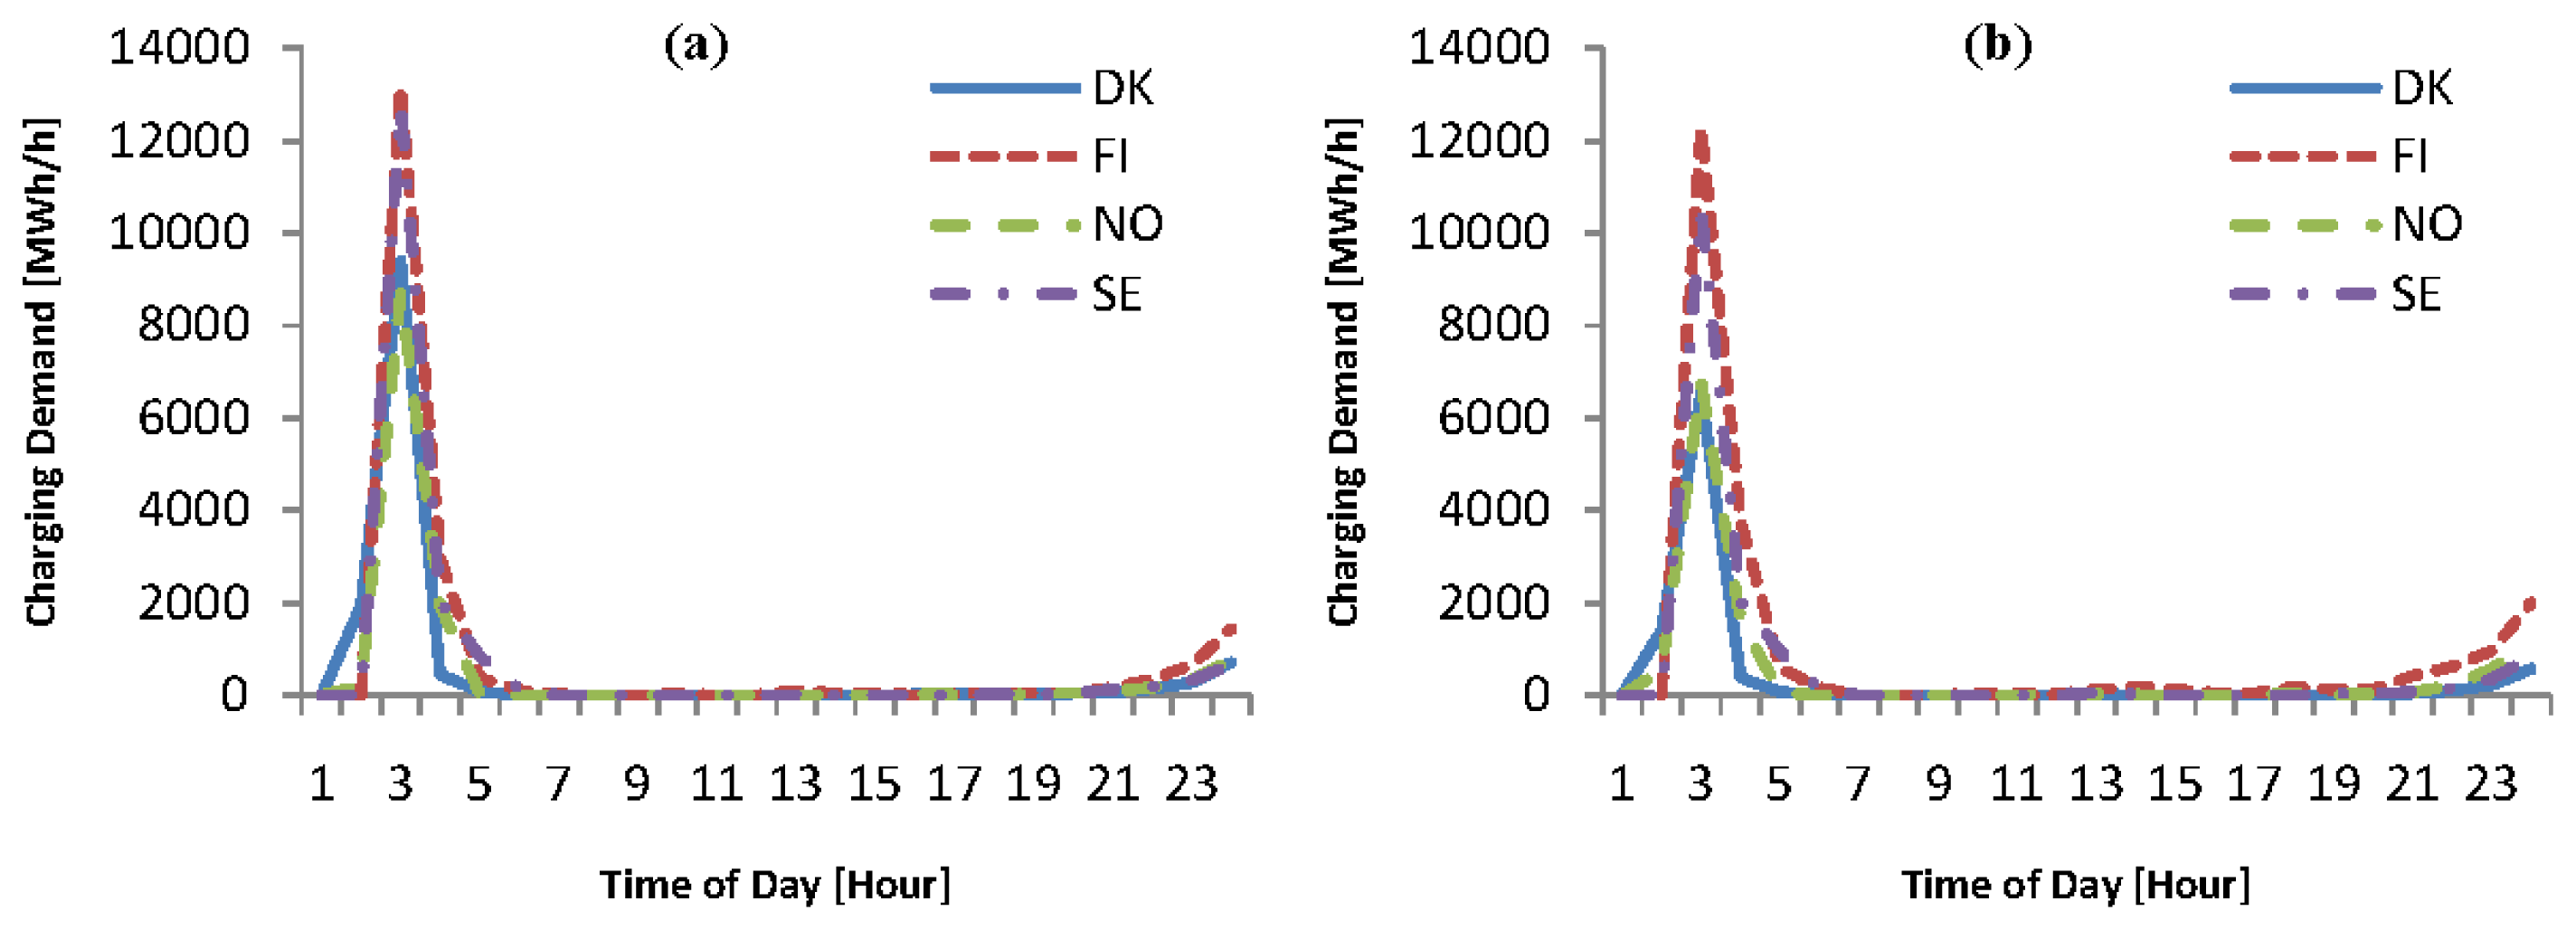
3.4. Spot Price Based Charging All Day
The charging profiles of the spot price based charging all day in the Nordic region on weekdays and weekends with different charging rates are shown in Figures 13, 14, 15 and 16. The demands of the spot price based charging all day have similar load patterns on weekdays and weekends. The objective of the charging is to minimize the charging cost. Therefore, most of the charging happens at night during the hours with the relatively low spot prices and leads to the high charging load in the corresponding time slots.
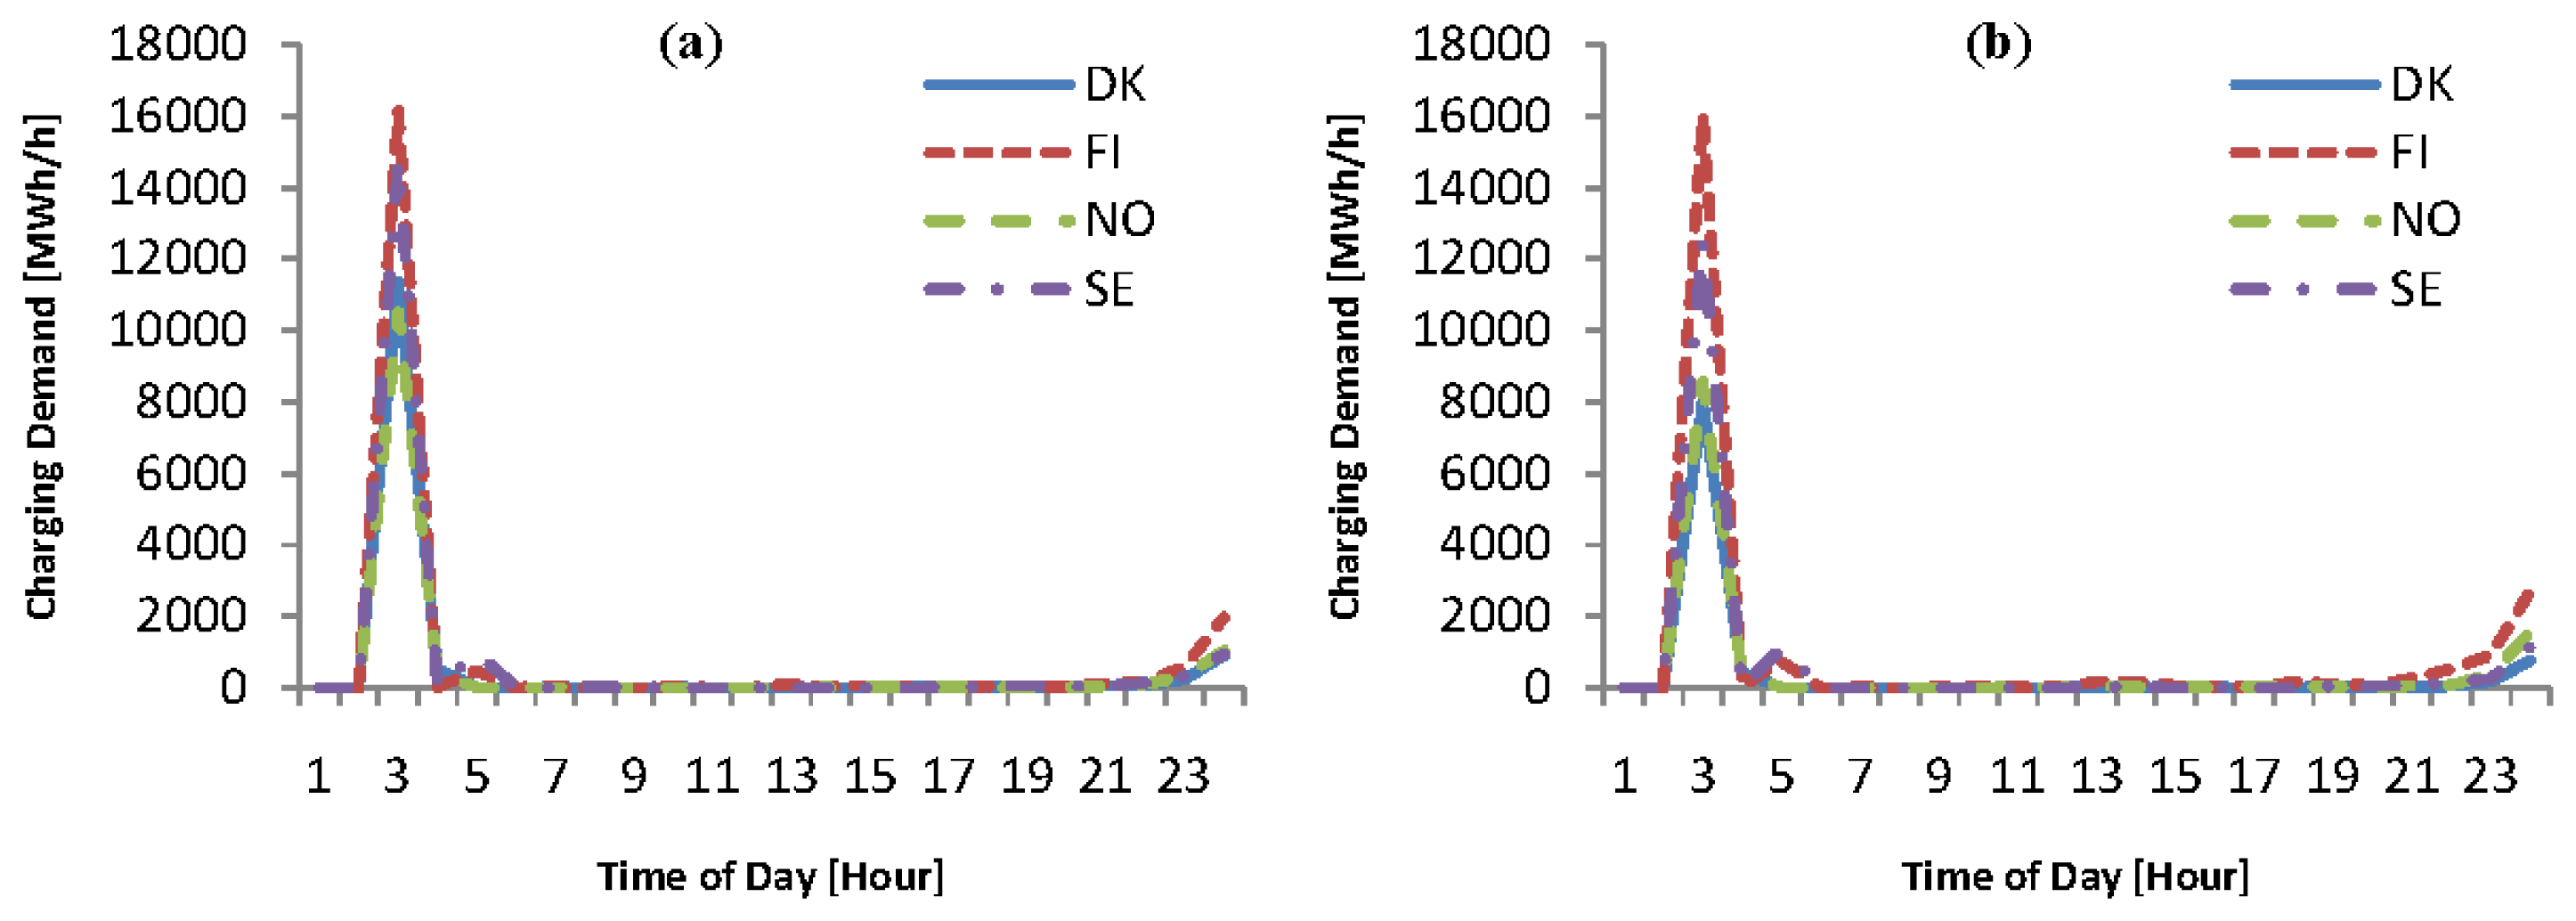
3.5. Spot Price Based Charging at Home
The charging profiles of the spot price based charging at home in the Nordic region on weekdays and weekends with different charging rates are shown in Figures 17, 18, 19 and 20. The charging demand patterns of the spot price based charging at home share similar characteristics with the scenario of spot price based charging all day. It results from the fact that most of the charging in the spot price based charging scenario happens at the low spot price hours at night when most of the vehicles are parked at home.
4. Discussion
The charging demand of EVs is not negligible for the grid when there is a high EV penetration level. If there is a 100% EV penetration of the passenger cars by 2050 in the Nordic region, it will require approximately a 6% increase in the electricity generation in the Nordic power system from the base of year 2012. The percentage of the charging energy of the 100% EV penetration scenarios to the total electricity consumption in Denmark, Finland, Norway and Sweden is 13.7%, 9.2%, 3.6% and 4.6% respectively. The percentages reflect the ratio of the yearly cumulative charging energy in the 100% EV penetration scenario to the total electricity consumption of the corresponding country by 2050. The ratio is highest in Denmark because the Danish system has the smallest scale among the four countries. Therefore, there will be a limited impact to the electric power generation of the Nordic power system from the energy perspective when there is a large-scale deployment of EVs.
A more significant impact of the EV deployment to Nordic power system is on the system capacity. The EV charging load curves of weekdays with a single phase 10 A charging in the Nordic region with the 100% EV penetration scenario are shown in Figure 21.
The EV charging load has different patterns and this results in different influence on the power system with different charging schemes. For the uncontrolled charging cases, the peak charging load overlaps the peak hours of the original electric load in the evening during weekdays, which would further stress the electric power system. However, a worse case happens in the timed charging scenario. Although the charging begins after 9 pm when the original electric load starts to decrease, most of the charging happens at the same time and the spike of the EV charging load from 9 to 11 pm is so steep that it results in a corresponding spike in the total electric load. The spot price based charging, to some extent, shifts the majority of the charging demand to the low demand period of the electric power grid at night. Nevertheless, most of the charging congregates in the hours of low electric spot prices and generates the high electrical load in the corresponding time period as a result.
In order to shorten the charging time, it is more likely to apply a high charging power from the user's point of view. However, the high charging power may further deteriorate the condition of the system capacity due to the EV charging. With higher charging power, the EV charging load tends to congregate in a shorter time slot, forms a steeper demand curve and creates a higher peak load. Such a feature is more obvious with the charging patterns more likely to gather the charging, namely the timed charging and the spot price based charging in this paper. Therefore, it is necessary and important to manage the charging power rating when there is a large-scale deployment of EVs.
5. Conclusions and Future Work
This paper provides the day-ahead EV charging energy planning with a 100% EV penetration level in the Nordic area. Instead of using the normalized driving behaviors of the vehicles, the detailed driving distance and charging availability of the vehicles along the day are obtained through the real driving records from the National Travel Surveys of the Nordic region and applied in the charging analysis in this paper. The results of the study show that the EV charging demand in the Nordic region is shaped together by the charging strategy, the charging power rate as well as the driving patterns of the vehicles. The EV charging loads of Denmark, Finland, Norway and Sweden have similar patterns. The electric energy consumption of EV charging is not very high compared to the total electric generation of the Nordic power system. However, the peak EV charging load is considerable which may cause the capacity problems for the future power system. In the uncontrolled charging scenarios, the peak load of the charging overlaps the peak hours of the original electric load, which will further stress the grid. The difference between the charging demands on weekdays and weekends is notable. In the timed charging and spot price based charging scenarios, the charging load is shifted to the relatively low-demand period to some extent. However, the peak loads are high in these cases as they tend to congregate the charging.
The results presented in this paper provide an overview of the EV charging demand in the Nordic region and illustrate the impact of the several factors on the charging demand. The day-ahead EV charging energy planning profiles can be used for the Nordic transmission system planning studies to identify the potential transmission system bottlenecks and determine the most cost effective expansion. Moreover, the results are also meaningful to the decision making in the regulations of the power system regarding the EV integration. The Nordic power system shows a potential to integrate the EVs in a large scale with a moderate daily driving requirement in the area. However, the charging strategy needs more investigation to further spread out the charging demand in the energy market. The results obtained can be used to as inputs to develop the mechanism to induce more distributed EV charging demands.
In this paper, the stochastic characteristics of the driving behaviors have not been investigated. To have a deeper understanding of the impact of the driving patterns on the EV charging demand, part of the future work is to treat the driving data stochastically. In the spot price based charging scenarios in this paper, the interplay of the EV charging load and the electricity market is not taken into account. Further investigation will be done on this issue in order to achieve better understanding of the impact of the EV charging load on the electric power system.
Acknowledgments
The authors are grateful to the financial support from the Nordic Energy Research (Norden) through the research project “Nordic Power Road Map 2050: Strategic Choices towards Carbon Neutrality” (NORSTRAT).
Conflicts of Interest
The authors declare no conflict of interest.
Nomenclature
| Ct | Electricity spot price during period t (EUR/kWh) |
| En,t | Electrical energy charged to EV n during period t (kWh) |
| SOCmin | Minimum battery state of charge (%) |
| SOCmax | Maximum battery state of charge (%) |
| SOCinit | Initial battery state of charge (%) |
| Ed,n,t | Driving energy requirement of EV n during period t (kWh) |
| Cn | Battery capacity of EV n (kWh) |
| An,t | Charging availability of EV n during period t (%) |
| Pch | Electrical charging rate (kW) |
| Δt | Charging time slot (h) |
| Dn,t | Driving distance of EV n during period t (km) |
| Ed | Driving energy consumption rate of EVs (kWh/km) |
References
- Nordic Energy Research Project: Sustainable Energy Systems 2050. Available online: http://www.nordicenergy.org/programme/sustainable-energy-systems-2050/ (accessed on 30 October 2013).
- Graabak, I. NORSTRAT Decarbonisation of the Nordic Electricity, Transport and Heating Sectors 2050. Available online: http://www.sintef.no/SINTEF-Energi-AS/Xergi/Xergi-2012/Xergi-20121/NORSTRAT-dekarbonisering-av-Nordens-kraft--transport-og-varmesektor-frem-mot-2050/ (accessed on 29 October 2013).
- Swedish Environmental Research Institute. Energy Scenario for Sweden 2050. Available online: http://www.wwf.se/source.php/1409709/Energy%20Scenario%20for%20Sweden%202050_bakgrundsrapport%20IVL_sep%202011.pdf (accessed on 20 December 2013).
- Profu. Scenarier för utvecklingen av el- och energisystemet till 2050. Available online: http://www.svenskenergi.se/Global/Dokument/rapporter/Rapport-fr%C3%A5n-Profu-Scenarier-f%C3%B6r-utvecklingen-av-el-och-energisystemet-till-2050.pdf (accessed on 22 December 2013).
- Prime Minister's Office Finland. Government Foresight Report on Long-term Climate and Energy Policy: Towards a Low-carbon Finland. Available online: http://vnk.fi/julkaisukansio/2009/j28-ilmasto-selonteko-j29-klimat-framtidsredogoerelse-j30-climate_/pdf/en.pdf (accessed on 22 December 2013).
- International Energy Agency. Nordic Energy Technology Perspectives. Available online: http://www.iea.org/media/etp/nordic/NETP.pdf (accessed on 10 November 2013).
- Salihi, J.T. Energy Requirements for Electric Cars and Their Impact on Electric Power Generation and Distribution Systems. IEEE Trans. Ind. Appl. 1973, IA-9, 516–532. [Google Scholar]
- Heydt, G.T. The impact of electric vehicle deployment on load management strategies. IEEE Trans. Power Appar. Syst. 1983, PAS-102, 1253–1259. [Google Scholar]
- Rahman, S.; Shrestha, G.B. An investigation into the impact of electric vehicle load on the electric utility distribution system. IEEE Trans. Power Deliv. 1993, 8, 591–597. [Google Scholar]
- Lopes, J.A.P.; Soares, F.J.; Almeida, P.M.R. Identifying Management Procedures to Deal with Connection of Electric Vehicles in the Grid. Proceedings of the 2009 IEEE Bucharest PowerTech Conference, Bucharest, Romania, 28 June–2 July 2009.
- Ma, Z.; Callaway, D.; Hiskens, I. Decentralized Charging Control for Large Populations of Plug-in Electric Vehicles: Application of the Nash Certainty Equivalence Principle. Proceedings of the 2010 IEEE International Conference on Control Applications (CCA), Yokohama, Japan, 8–10 September 2010.
- Shimizu, K.; Masuta, T.; Ota, Y.; Yokoyama, A. Load Frequency Control in Power System Using Vehicle-to-Grid System Customer Convenience of Electric Vehicles. Proceedings of the IEEE Power System Technology (POWERCON) Conference, Hangzhou, China, 24–28 October 2010.
- Luo, Z.; Song, Y.; Hu, Z.; Xu, Z.; Yang, X.; Zhan, K. Forecasting Charging Load of Plug-in Electric Vehicles in China. Proceedings of the 2011 IEEE Power and Energy Society General Meeting, Detroit, MI, USA, 24–28 July 2011.
- Qian, K.; Zhou, C.; Allan, M.; Yuan, Y. Modeling of Load Demand Due to EV Battery Charging in Distribution Systems. IEEE Trans. Power Syst. 2011, 26, 802–810. [Google Scholar]
- Xu, Z.; Hu, Z.; Song, Y.; Luo, Z.; Zhan, K.; Wu, J. Coordinated Charging Strategy for PEVs Charging Stations. Proceedings of the 2012 IEEE Power and Energy Society General Meeting, San Diego, CA, USA, 22–26 July 2012.
- Wang, Y.; Guo, Q.; Sun, H.; Li, Z. An Investigation into the Impacts of the Crucial Factors on EVs Charging Load. Proceedings of the 2012 IEEE Innovative Smart Grid Technologies-Asia (ISGT Asia) Conference, Tianjin, China, 21–24 May 2012.
- Sundstrom, O.; Binding, C. Planning Electric-Drive Vehicle Charging under Constrained Grid Conditions. Proceedings of the 2010 IEEE Power System Technology (POWERCON) Conference, Hangzhou, China, 24–28 October 2010.
- Sundstrom, O.; Binding, C. Flexible charging optimization for electric vehicles considering distribution grid constraints. IEEE Trans. Smart Grid 2012, 3, 26–37. [Google Scholar]
- Binding, C.; Gantenbein, D.; Jansen, B.; Sundstrom, O.; Andersen, P.B.; Marra, F.; Poulsen, B.; Traeholt, C. Electric Vehicle Fleet Integration in the Danish EDISON Project—A Virtual Power Plant on the Island of Bornholm. Proceedings of the 2010 IEEE Power and Energy Society General Meeting, Minneapolis, MN, USA, 25–29 July 2010.
- Kristoffersen, T.K.; Capion, K.; Meibom, P. Optimal charging of electric drive vehicles in a market environment. Appl. Energy 2011, 88, 1940–1948. [Google Scholar]
- Kiviluoma, J.; Meibom, P. Methodology for modelling plug-in electric vehicles in the power system and cost estimates for a system with either smart or dumb electric vehicles. Energy 2011, 36, 1758–1767. [Google Scholar]
- Rautiainen, A.; Repo, S.; Järventausta, P.; Mutanen, A.; Vuorilehto, K.; Jalkanen, K. Statistical charging load modelling of PHEVs in Electricity Distribution Networks Using National Travel Survey Data. IEEE Trans. Smart Grid 2012, 3, 1650–1659. [Google Scholar]
- Wu, Q.; Nielsen, A.H.; Østergaard, J.; Cha, S.T.; Marra, F.; Chen, Y.; Træholt, C. Driving Pattern Analysis for Electric Vehicle (EV) Grid Integration Study. Proceedings of the 2010 IEEE Innovative Smart Grid Technologies-Europe (ISGT Europe) Conference, Gothenburg, Sweden, 11–13 October 2010.
- Wu, Q.; Nielsen, A.H.; Østergaard, J. Potential Analysis for Electric Vehicle Grid Integration. Available online: http://www.edison-net.dk/Dissemination/Reports/Report_014.aspx (accessed on 31 October 2013).


© 2014 by the authors; licensee MDPI, Basel, Switzerland. This article is an open access article distributed under the terms and conditions of the Creative Commons Attribution license ( http://creativecommons.org/licenses/by/3.0/).
Share and Cite
Liu, Z.; Wu, Q.; Nielsen, A.H.; Wang, Y. Day-Ahead Energy Planning with 100% Electric Vehicle Penetration in the Nordic Region by 2050. Energies 2014, 7, 1733-1749. https://doi.org/10.3390/en7031733
Liu Z, Wu Q, Nielsen AH, Wang Y. Day-Ahead Energy Planning with 100% Electric Vehicle Penetration in the Nordic Region by 2050. Energies. 2014; 7(3):1733-1749. https://doi.org/10.3390/en7031733
Chicago/Turabian StyleLiu, Zhaoxi, Qiuwei Wu, Arne Hejde Nielsen, and Yun Wang. 2014. "Day-Ahead Energy Planning with 100% Electric Vehicle Penetration in the Nordic Region by 2050" Energies 7, no. 3: 1733-1749. https://doi.org/10.3390/en7031733