Sodium Silicate Behavior in Porous Media Applied for In-Depth Profile Modifications

Abstract
: This paper addresses alkaline sodium silicate (Na-silicate) behavior in porous media. One of the advantages of the Na-silicate system is its water-like injectivity during the placement stage. Mixing Na-silicate with saline water results in metal silicate precipitation as well as immediate gelation. This work demonstrated that low salinity water (LSW, sea water diluted 25 times) could be used as a pre-flush in flooding operations. A water override phenomenon was observed during gel formation which is caused by gravity segregation. Dynamic adsorption tests in the sand-packed tubes showed inconsiderable adsorbed silicon density (about 8.5 × 10⁻¹⁰ kg/cm3 for a solution with 33 mg/L silicon content), which is less than the estimated mono-layer adsorption density of 1.4 × 10⁻⁸ kg/cm3. Na-silicate enhanced water sweep efficiency after application in a dual-permeability sand-pack system, without leak off into the oil-bearing low permeability (LP) zone. Field-scale numerical sensitivity studies in a layered reservoir demonstrated that higher permeability and viscosity contrasts and lower vertical/horizontal permeability ratio result in lower Na-silicate leakoff into the matrix. The length of the mixing zone between reservoir water and the injected Na-silicate solution, which is formed by low salinity pre-flush, acts as a buffer zone.1. Introduction
Water channeling through high permeability streaks and thief zones results in poor sweep efficiency and early breakthrough. Minimizing excess water production and enhancing oil recovery in such reservoirs demand water conformance control treatments [1–3].
In general, in-depth conformance control methods are more effective than near wellbore treatments in enhancing oil recovery, especially in reservoirs with continuous high permeability (HP) layers and free cross flow [4,5]. However, since different parameters simultaneously impact the process, in-depth treatment is a challenging process.
The application of effective conformance control treatments has always been an elusive goal in the oil industry since the 1960s, when the necessity to control flow profiles in the producing reservoirs was first recognized [1,6]. Since then, a great variety of chemicals have been proposed for such a purpose. Among different existing chemicals for reservoir profile modification, silica-based gels are relatively inexpensive and environmentally safe [6–8]. The most well-known silica-based gel system is sodium silicate (Na-silicate). It has a water-like viscosity prior to gelation, hence good injectivity for long displacements [8]. It is thermally stable, suitable for high temperature reservoirs [6]. The gelation time of Na-silicate is controllable under reservoir conditions [5,9].
Although Na-silicate gel has been widely applied in many successful near wellbore treatments [10–15], it is not recognized yet as an in-depth profile modifier, despite its remarkable potential for such a purpose [5]. The chemistry of Na-silicate gelation is relatively complicated, and hence is poorly understood, especially under complex reservoir conditions [7]. It is therefore important to study the effect of different reservoir parameters which may influence Na-silicate behavior in porous media during in-depth placements.
The concentration of the injected Na-silicate changes as the solution transports in the reservoir, due to the dispersion in the formation water and adsorption on the rock surfaces. In other words, Na-silicate dispersion and adsorption determine the fraction of the injected solution that reaches the targeted treatment location in the reservoir. Any change in the silicate content greatly affects the Na-silicate gelation kinetics [5,9,16]. Salinity of the formation water is another important factor that affects the Na-silicate gelation kinetics. Formation water salinity accelerates Na-silicate gelation [5,16]. The possibility of precipitation and unwanted plugging in the presence of divalent ions, mainly Ca2+ and Mg2+, is one of the main challenges in deep application of Na-silicate. Low salinity water (LSW) pre-flush is practically used to dilute the ions' concentration in the formation, prior to Na-silicate injection. Reservoir temperature plays an influential role in the gelation kinetics and precipitation. Therefore, the temperature gradient in the reservoir should be taken into account as a controlling factor to reach the targeted treatment zone in the reservoir [17,18].
The viscosity of the injected solution has to be low enough (ideally water-like) during placement, to reach the targeted zone without damaging oil-bearing matrix [18–20]. In addition to the placement, the gel strength has to be high enough to withstand the force imposed by the injected water. Adsorption of injected liquid is also addressed, in order to correctly determine the needed slug of the silicate content. The above mentioned factors to ensure success treatment of reservoir are experimentally and numerically been addressed in this paper.
2. Materials and Methods
In this section, a description of different types of materials and methods used in the experimental works and the applied simulation approaches are presented.
2.1. Materials
The chemical formula of Na-silicate used in this study is (SiO2)3.35:Na2O. It was supplied by BIM Kemi AB, Drammen, Norway. The Na-silicate content in the solution was 35.7 wt%. The content of silicate and sodium oxide was 27.3 wt% and 8.4 wt%, respectively, as specified by the supplier. This solution had a density of 1.368 g/cm3 and a pH of about 11.40 at 20 °C. The pH adjustment was conducted using diluted (2 M) HCl solution. The Na-silicate samples were stored in plastic containers. To clean the gel from equipments and containers, NaOH solutions were used to dissolve the Na-silicate by increasing the solution pH.
Solutions with Na-silicate content between 4 wt% and 6 wt% were prepared by diluting the supplied sample with distilled water (DW). DW was obtained by purifying tap water through a Milli-Q Millipore system (Billerica, MA, USA). Other aqueous phases such as synthetic sea water (SSW) and low salinity water (LSW), which was obtained by 25 times dilution of SSW, were also used. The composition of SSW is given in Table 1.
Normal decane (n-C10) was used as the base oil phase. It was supplied by Chiron AS (Trondheim, Norway) in high performance liquid chromatography (HPLC) grade (purity > 99%). N,N-dimethyldodecylamine (NN-DMDA, purity > 99%, Fluka, St. Gallen, Switzerland) was used as an oil soluble additive with the concentration of 0.01 M in n-C10 to represent natural base in the crude oil [21].
Unconsolidated cores were prepared by packing sand particles, with different grain sizes, in the sand-pack tubes. The chemical composition of the used sand particles, supplied by, is given in Table 2. Oil red O and methylene blue powders, supplied by Sigma Aldrich (St. Louis, MO, USA) were used to dye oil and Na-silicate solution in red and blue colors, respectively. The dyed liquids were used in sand-pack flooding experiments to identify water and gel propagations in porous media.
2.2. Experimental Methods
A S20 Seven Easy™ pH meter (Mettler-Toledo, Columbus, OH, USA) was used for pH measurement. The pH of a Na-silicate solution increases gradually with time, after pH adjustment (addition of HCl acid). In order to maintain the consistency of the reported data, all the pH measurements were carried out no more than 3 min after preparation of the samples.
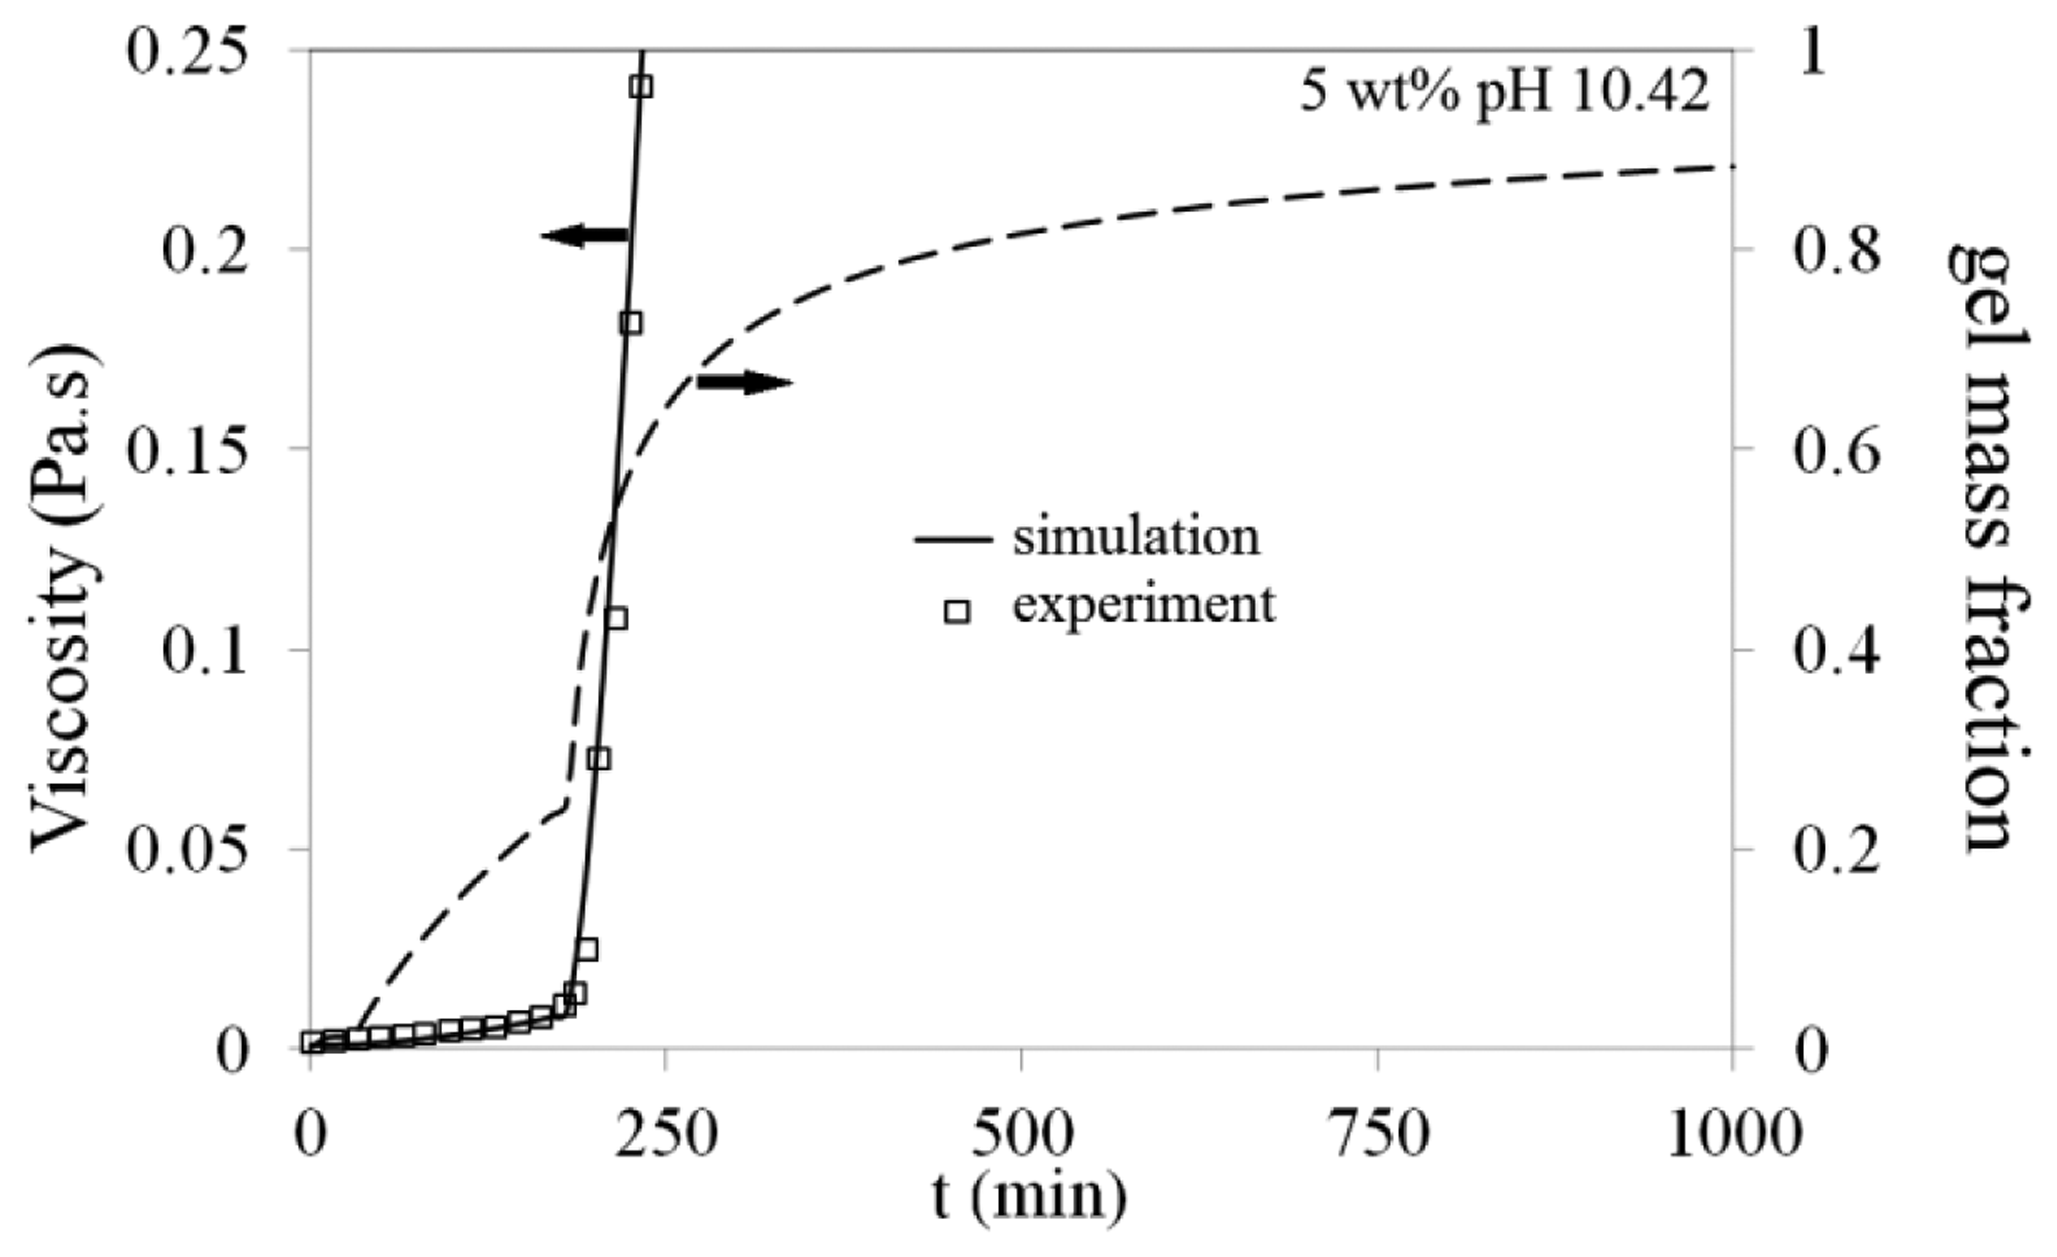
Viscosity of Na-silicate samples were measured with a Paar Physica UDS 200 Universal Dynamic Spectrometer (Anton-Paar GmbH, Graz, Austria) using rotational module with constant shear rate. Most of the measurements were performed at low shear rate of 10 s−1, which is close to the average shear rate in the reservoir far from the injection well. Viscosity of a Na-silicate solution after pH adjustment showed a linear increase at the beginning, then after a certain time, the viscosity deviated from linearity followed by a sharp increase. This deviation point was defined here as gelation time (tg), which is a function of Na-silicate content, pH, temperature and salinity of the tested sample [16].
Flooding experiments were performed using two types of sand-packs (A and B). The properties of the sand-packs are listed in Table 3.
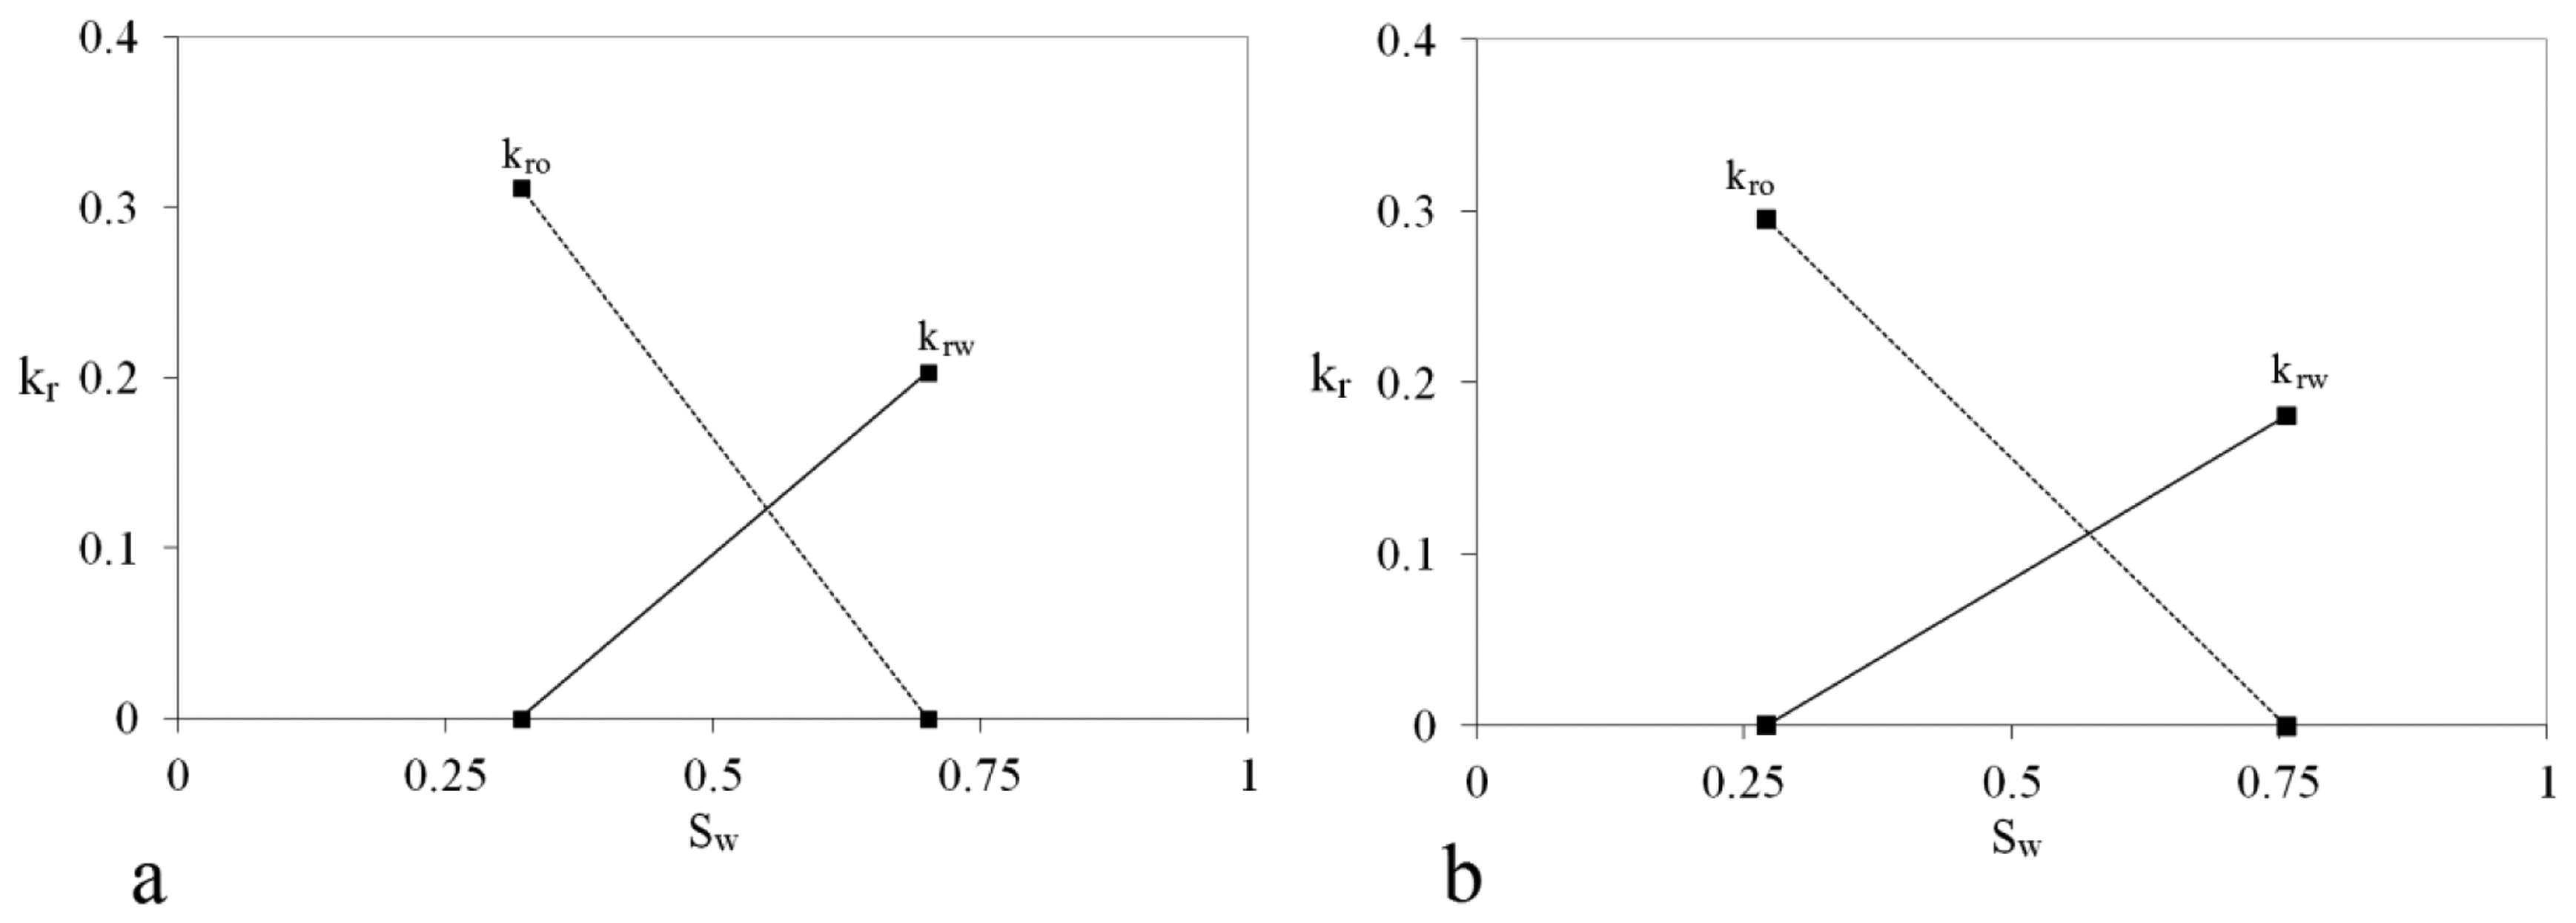
The relative permeability end points of the sand-packs are illustrated in Figure 1. The procedure for obtaining the endpoints is as follows. The sand-packs were saturated with SSW, then flooded by oil with the constant rate of 0.1 mL/min until no more water was produced and the flow was stabilized (irreducible water saturation, swc). Oil relative permeability at irreducible water saturation was obtained by measuring pressure drop during the flooding of the sand-pack with oil at a constant rate. Then sand-packs were flooded with SSW to replace the oil until no more oil was produced and flow was stabilized (residual oil saturation, sor). Water relative permeability at residual oil saturation was obtained by measuring pressure drop during sand-pack flooding with SSW at constant rate. The endpoints were simply connected with lines, which is a good approximation for relatively high permeability of the sand-packs. Sand-pack tubes were made of transparent plexiglass materials, polymethyl methacrylate (PMMA), to observe Na-silicate gel and fluid profiles. The thickness of the tube wall was 0.9 cm, to tolerate pressures up to 80 bar.
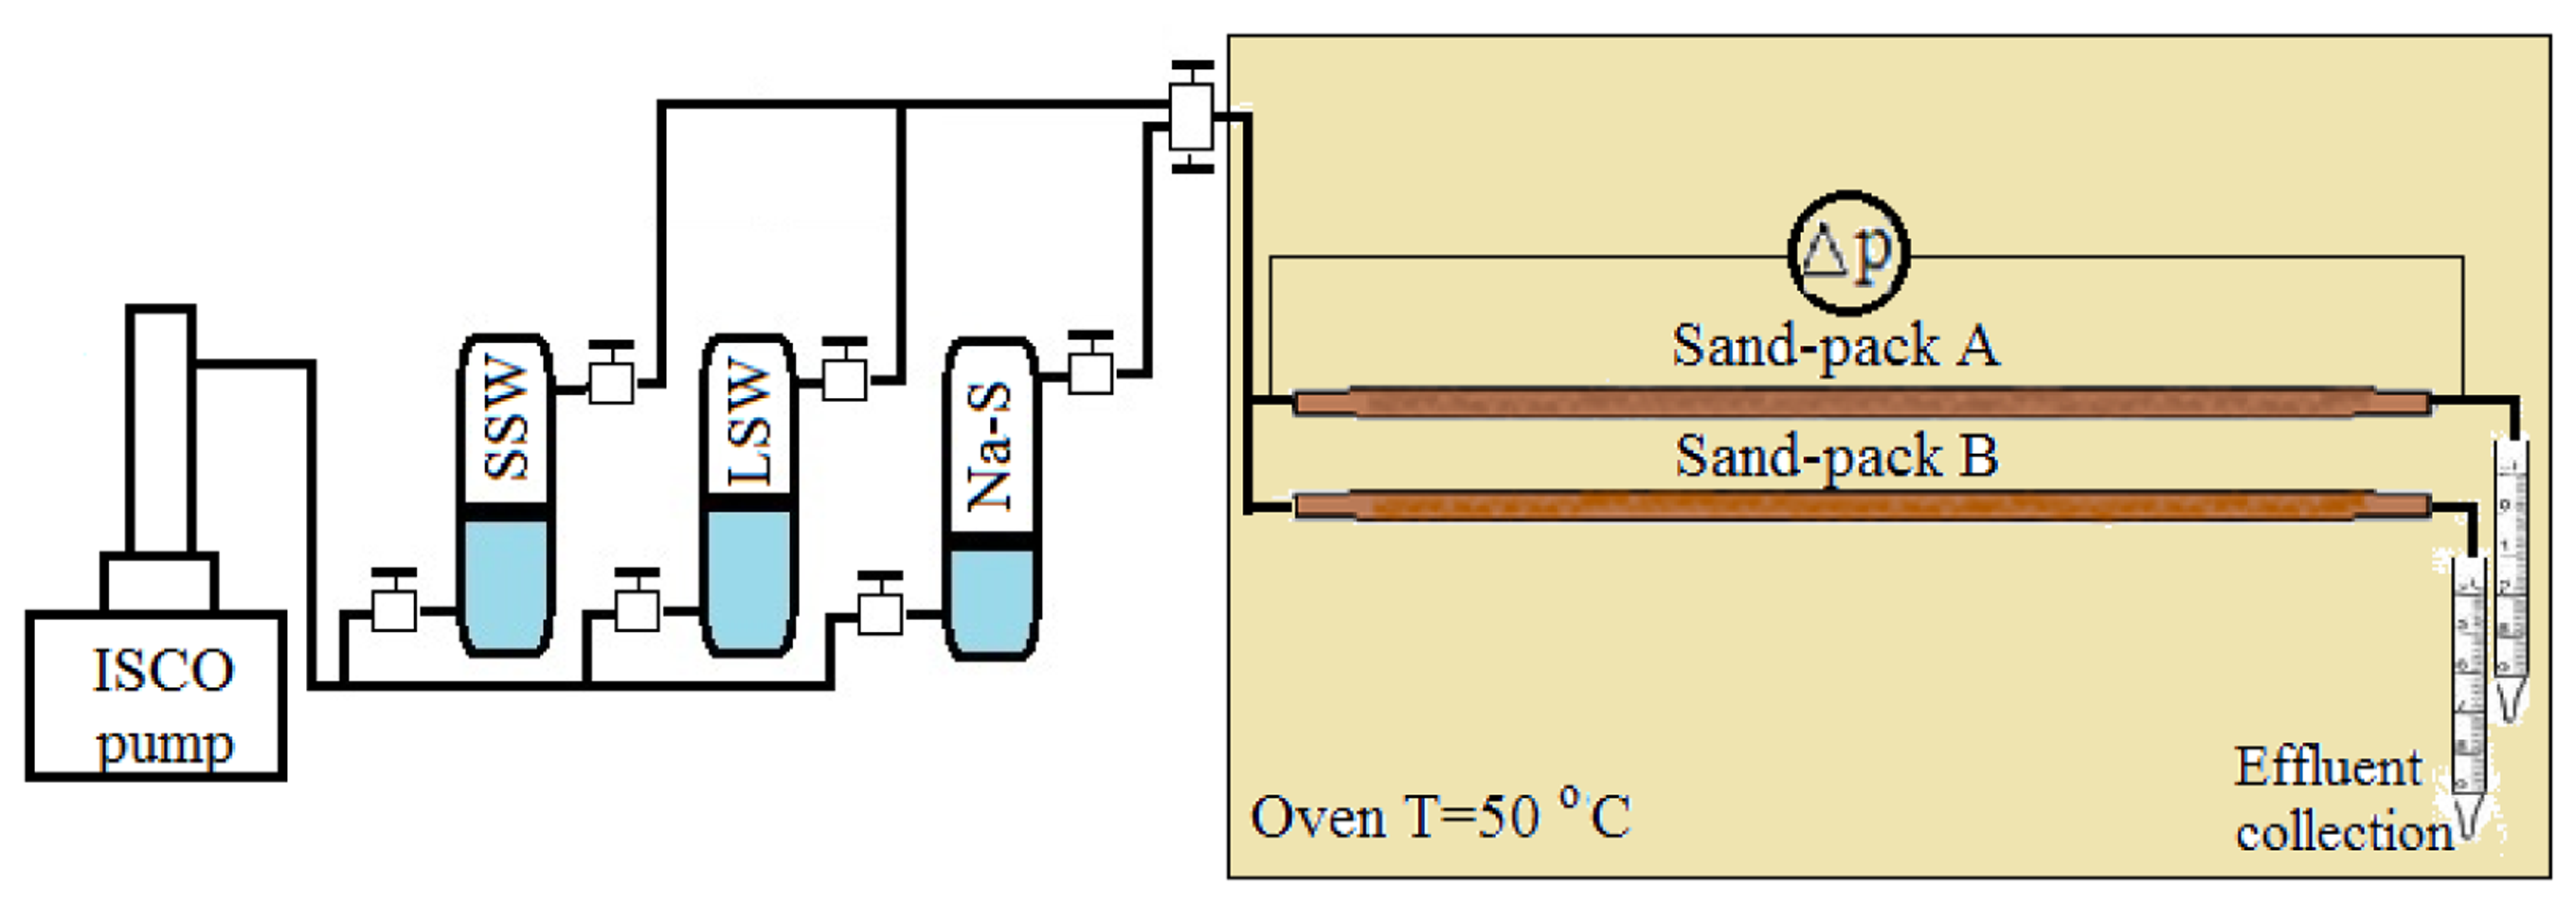
As shown in Figure 2, a parallel configuration of sand-packs A and B is designed to study the performance of Na-silicate in a lab-scale dual-permeability porous medium. Sand-packs were located inside an oven with T = 50 °C. All the fluids were injected using a syringe pump (Teledyne ISCO Model 260D, Lincoln, NE, USA) with constant flow rate of 0.1 mL/min into transparent Teflon lines which were connected to the inlet ports of both sand-packs. The effluents of both sand-packs were separately collected in two vials to record oil and water production from each sand-pack. The pressure drop along both sand-packs was separately measured using two accurate digital pressure transducers (E + H model PMD75) and was recorded using Labview™ 2012 (National Instruments Corporation, Austin, TX, USA).
The two sand-packs were initially saturated with oil (n-C10 and 0.01 M NN-DMDA) and SSW at swc. They were first flooded with SSW up to breakthrough time. Then Na-silicate treatment was performed to enhance water sweep efficiency. More detail about the procedure of dual-permeability sand-pack flooding experiment is given in Section 3.1.3.
To evaluate silicate dynamic adsorption on quartz surface, a slug of Na-silicate solution was injected into the sand-pack A with the rate of 0.1 mL/min, which was initially saturated with DW. The effluents of a sand-pack A were collected and analyzed for silicon (Si) content using an inductively coupled plasma-optical emission spectrometry (ICP-OES) system. The analysis was performed by Intertek West Lab AS, Tananger, Norway. Silicon concentration in the injected Na-silicate slug was low enough (<100 mg/L) to be within the accuracy range of the measurements. More details about the adsorption experiment can be found in Section 3.1.1.
2.3. Numerical Approaches
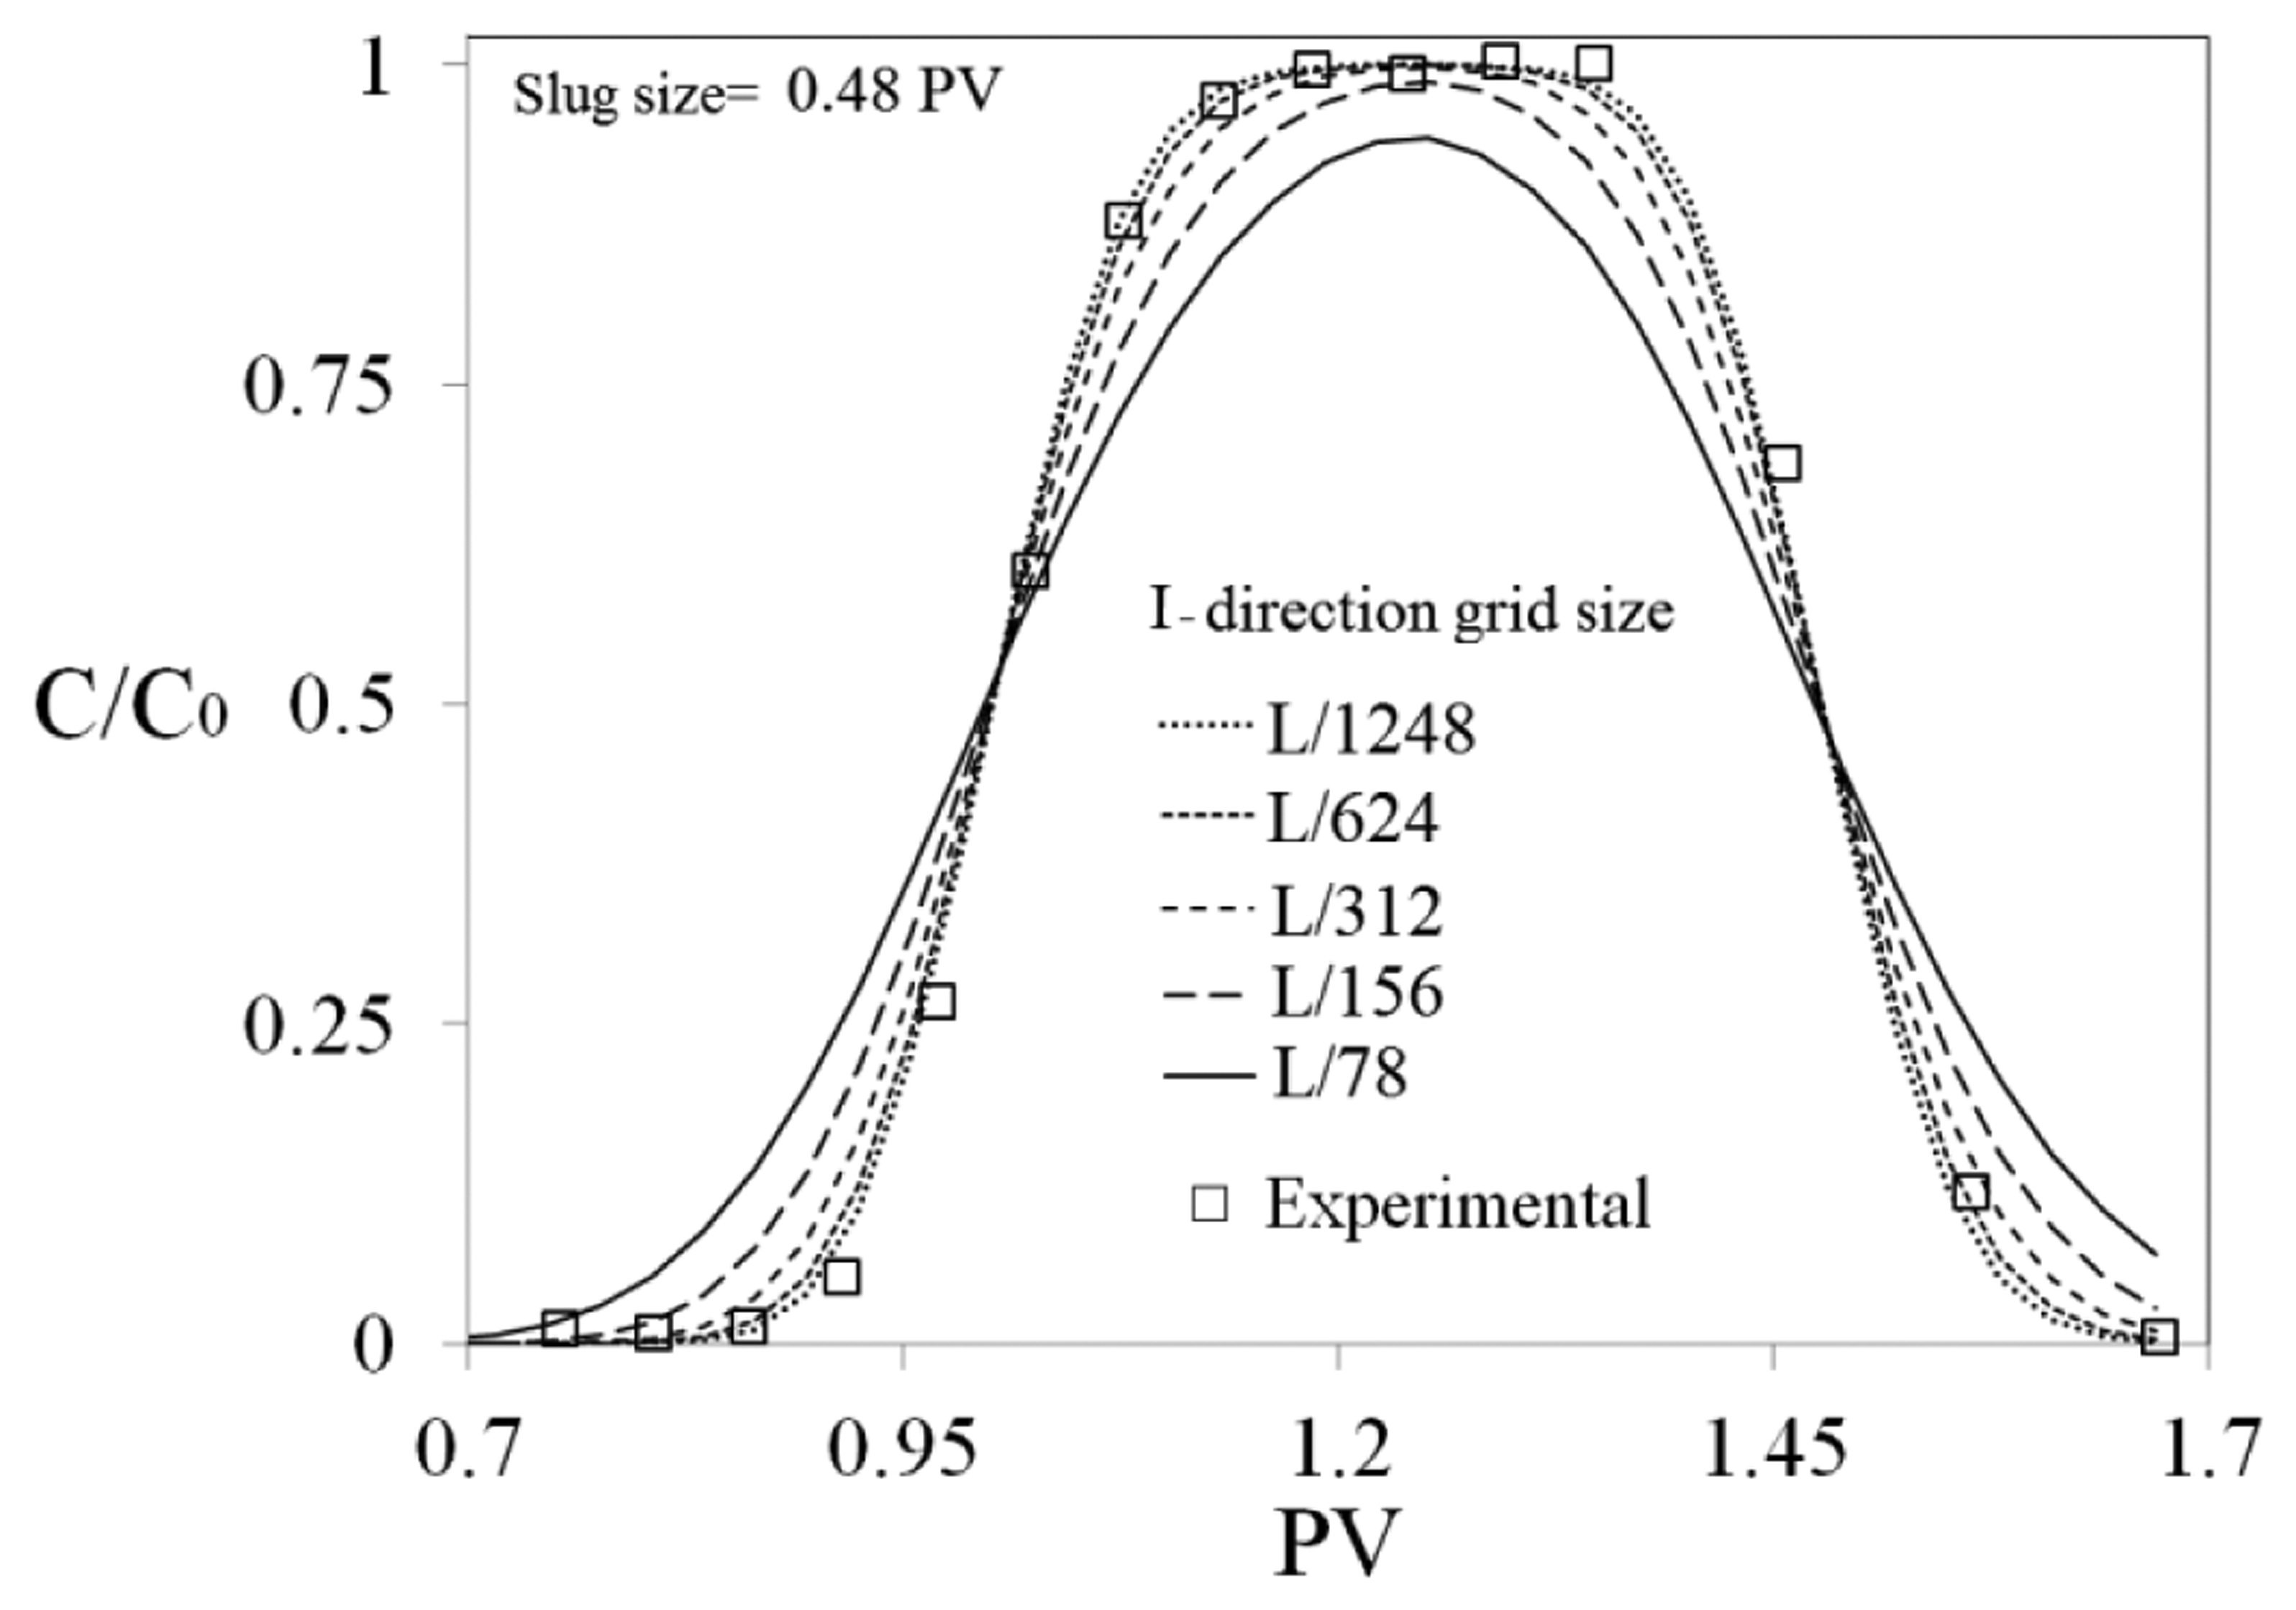
STARS™, an application of CMG (Computer Modelling Group, Calgary, AB, Canada), was used for simulating Na-silicate behavior in porous media at lab and field scales. Two-dimensional (2D) models of sand-packs were built to simulate Na-silicate behavior during flooding experiments. The relative permeabilities, silicate adsorption and Na-silicate viscosity increase due to gelation were incorporated in the simulation method. It was assumed that permeability and porosity are uniformly distributed in the modeled porous media. The simulated models were discretized using five grids in the J direction, and one grid in the K direction. As shown in Figure 3, a sensitivity study was performed on the grid block sizes in I direction, which is the main direction of flow, to find the numerical dispersion impact on the flow profile. The simulation results were compared with the experimental results obtained by analyzing the effluent concentration from the sand-pack during flooding with 0.48 pore volume (PV) non-adsorbing tracer (Cl−). When the grid number in the I direction, main flow direction, increased to ≥312, grid size ≤ L/312, the simulated effluent concentration profile showed good agreement with the experimental results, therefore, the accuracy was deemed good enough at the grid size of L/312, and the later simulations were performed at this grid size.
The simulation of Na-silicate gelation at lab-scale was done based on the viscosity increase. The method is briefly described as follows: water, Na-silicate, acid, gel and dead oil were treated as five components. The former four components were considered as the water phase, while the latter one was regarded as the oil phase. Na-silicate component had the physical properties of supplied sample. The concentration of each component at each grid was calculated from the conservation equations for all components. An adsorption term was used in the conservation equation for Na-silicate component.
Prior to injection of Na-silicate and acid, their concentrations and the gel amount in all grids are set to be zero. As Na-silicate and acid are injected, their concentration gradually increases at each grid. A simplified reaction scheme for gel formation may be presented as:
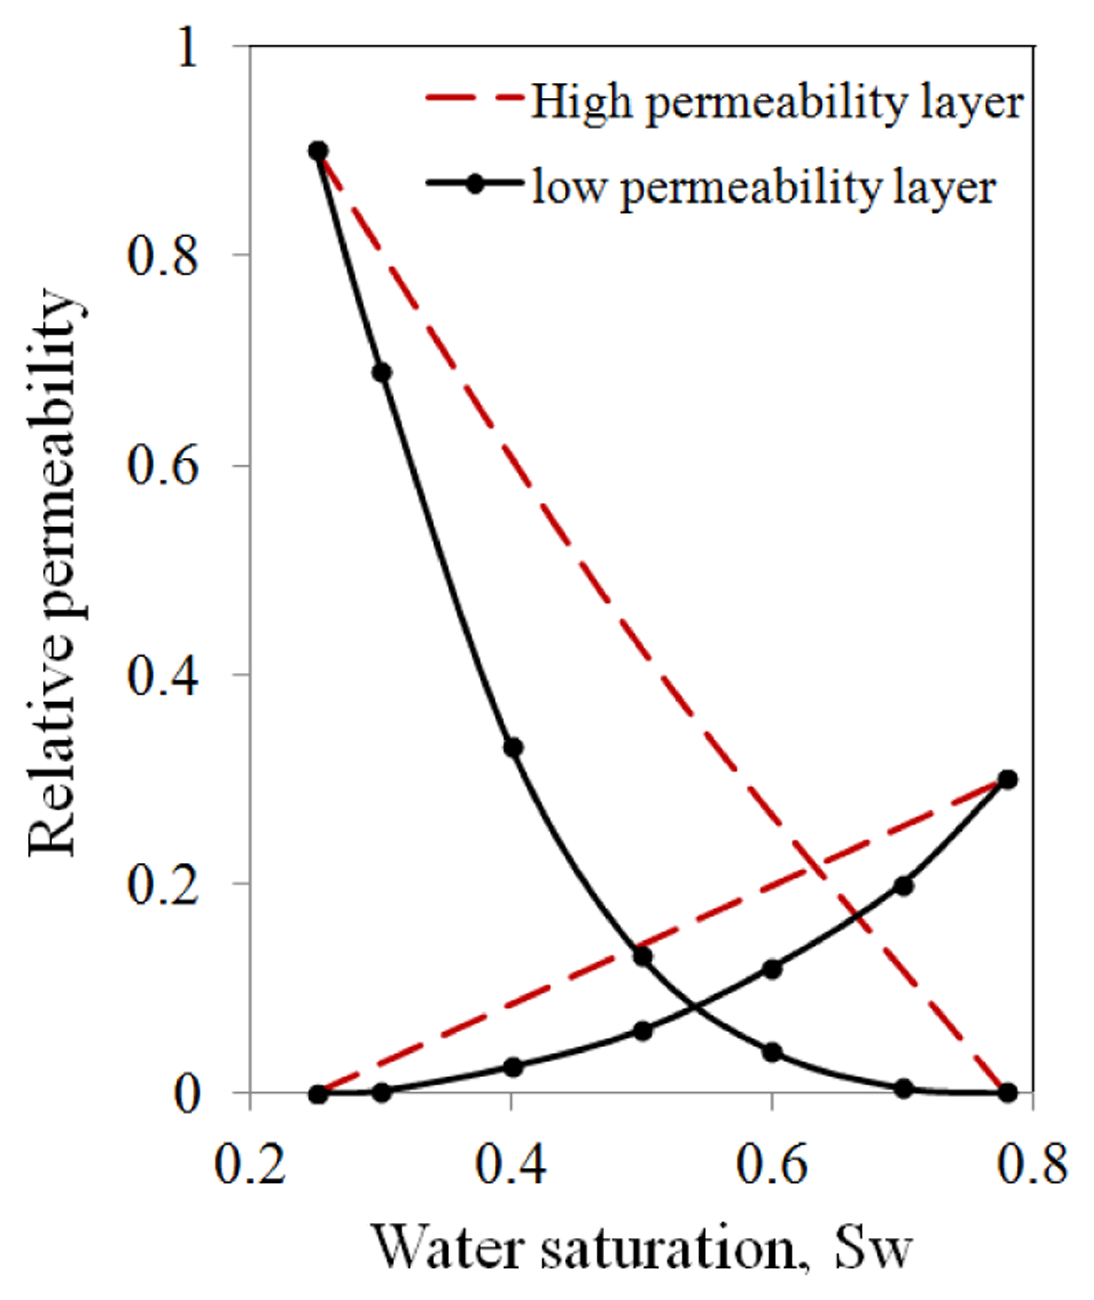
A 2D reservoir model was used to investigate several sensitivities on Na-silicate application in a layered reservoir for in-depth treatment. Table 4 gives the reservoir and fluid characteristics used in the simulations. The reservoir is 1000 ft (305 m) long and 90 ft (27.5 m) thick and has two distinct permeability regions—a low permeability (LP) layer and a high permeability (HP) layer at the bottom. The relative permeabilities for the two reservoir regions are shown in Figure 5. A linear saturation dependence relative permeability is assumed for the HP streak. There is one injector and one producer at the two ends of the simulated model, drilled through the entire reservoir thickness.
In all the calculations, the reservoir was represented by 100 grid blocks in the I direction and 30 grid blocks in the K direction. Calculations on a finer mesh did not show any difference in the accuracy of the results. To study the propagation of the injected gelling material prior to an in-depth placement, an aqueous phase was defined, called pre-gel Na-silicate, with the physical properties listed in Table 4.
3. Results and Discussion
The results of lab-scale and field-scale studies on Na-silicate behavior under dynamic conditions are presented in the coming sections.
3.1. Na-Silicate Behavior in Unconsolidated Sand Cores
Lab-scale studies were experimentally and numerically conducted to address Na-silicate adsorption/retention, injectivity, preferential flow path (possibility of leak off into the matrix), gelation time and gel profile in sand-pack flooding experiments. Reservoir simulation was also employed for better understanding of the physical mechanisms.
3.1.1. Silicate Dynamic Adsorption
Evaluation of Na-silicate adsorption on surface minerals helps to determine the fraction of the injected Na-silicate that reaches the targeted treatment location in the reservoir. Dynamic adsorption was done by injecting a Na-silicate slug with the size of 0.48 PV in sand-pack A (Table 3), which is initially saturated with DW. The slug size was almost similar to what is later used for gel treatments in dual-permeability sand-packs. Two different Na-silicate solutions were studied which had Si concentrations of 33 mg/L and 3.9 mg/L, which correspond to 0.0093 wt% and 0.0011 wt% Na-silicate solutions, respectively. The low Si concentration in the tested solutions was used to precisely estimate the adsorbed amount. The concentration of Si in the effluent was measured using ICP, and the adsorption measurements were performed at room temperature.
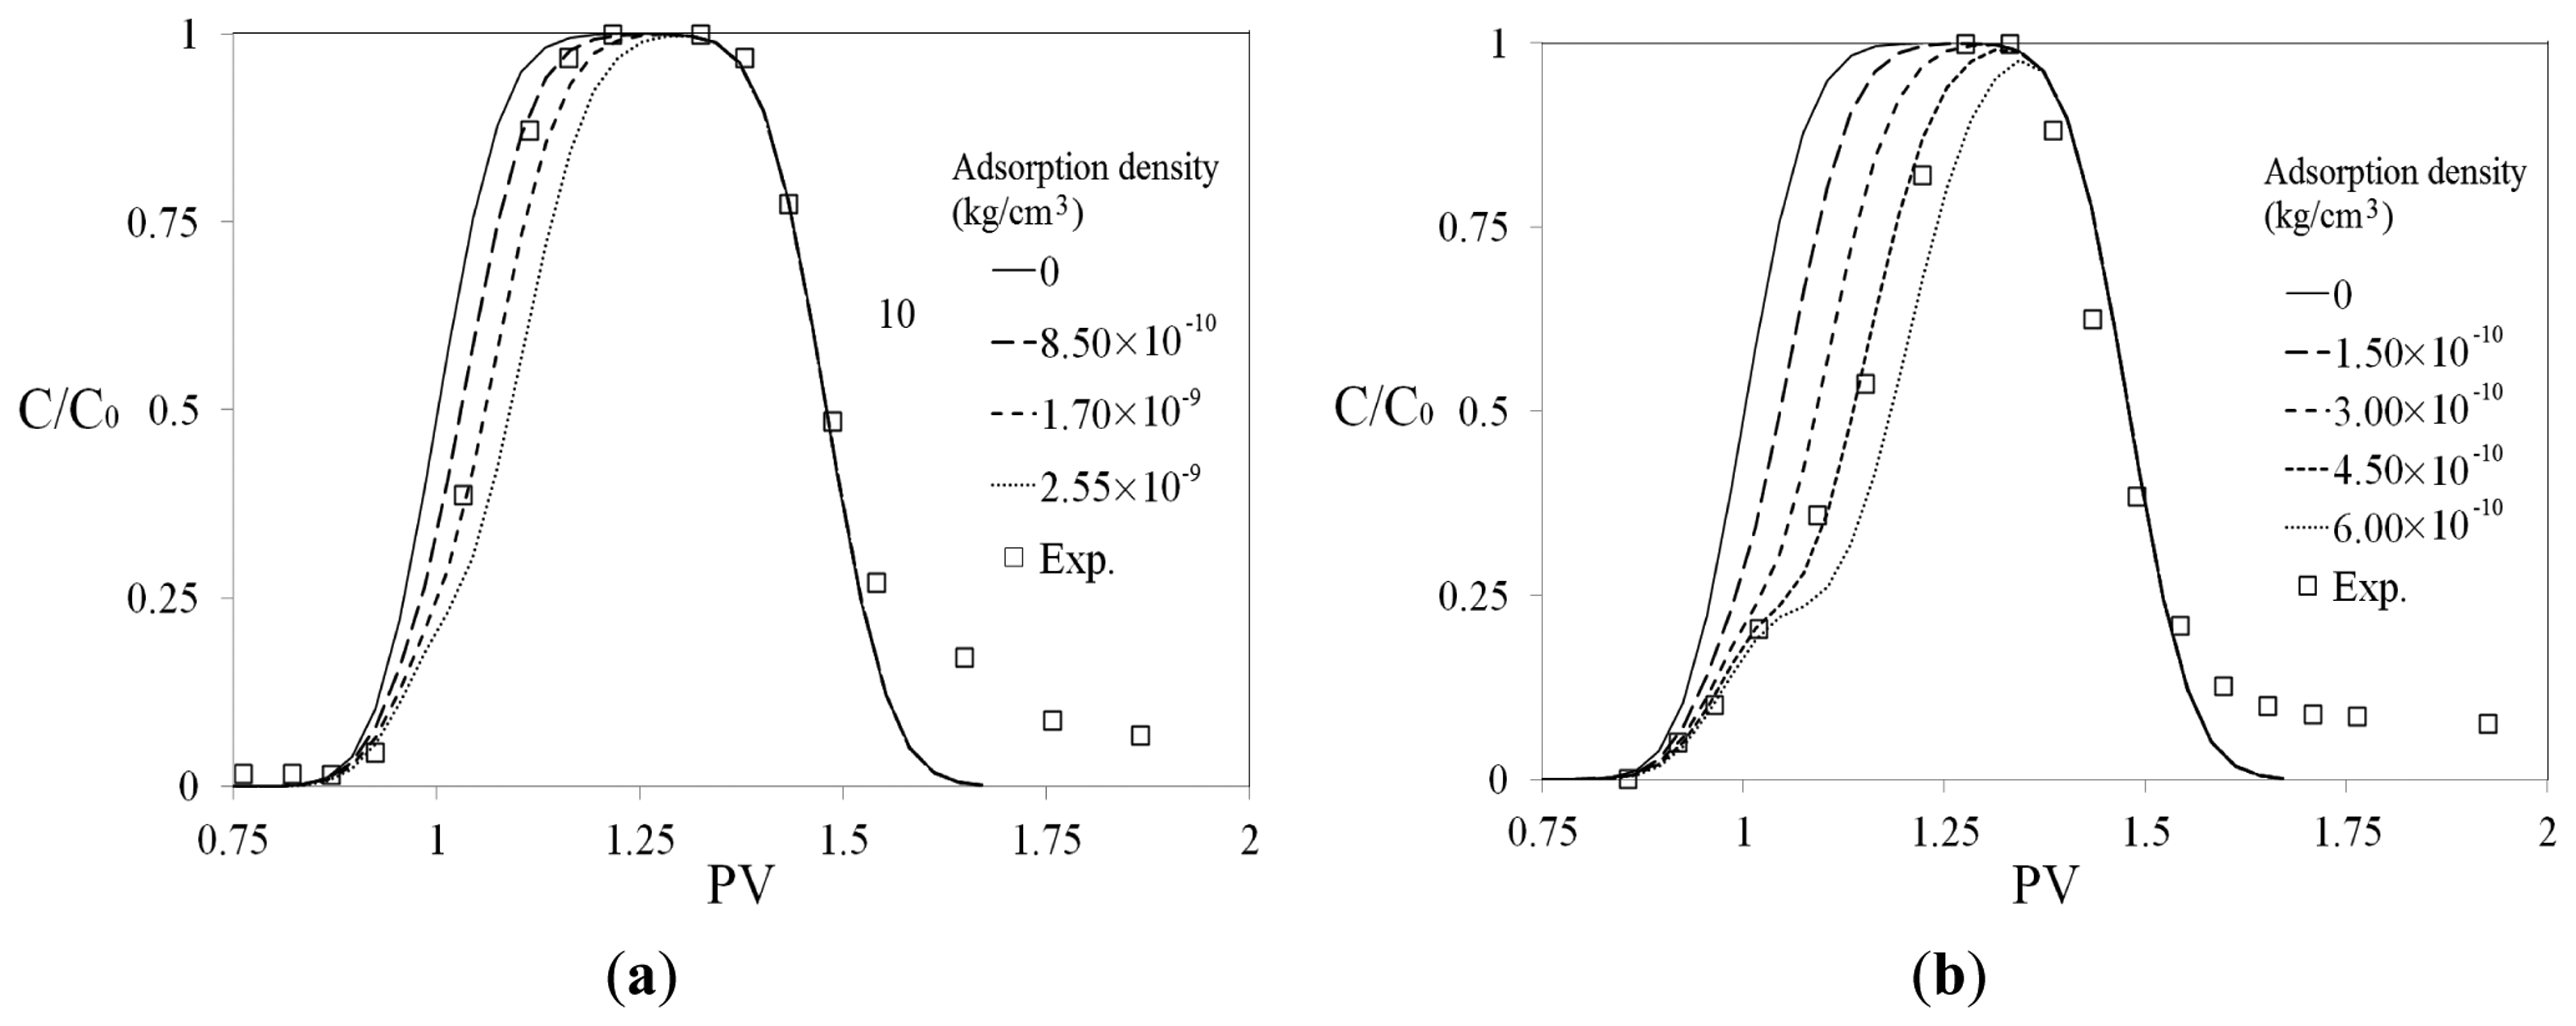
The ratios between Si concentrations in the effluent and the injected concentrations (C/C0) are plotted against the injected PV (Figure 6a,b for the two concentrations of 33 mg/L and 3.9 mg/L, respectively). Numerical simulation was used to match the experimental data. The matching parameter was adsorption density, as shown in Figure 6. The adsorption density was increased from 0 (for non-adsorbing material such as Cl− tracer) to higher values, to match the experimentally obtained concentration curves. The simulation method addresses only the adsorption process and not the desorption process. In both cases, the experimental data were matched numerically only when it was assumed that Si adsorption takes place at (C/C0) higher than 0.25.
The adsorption density was obtained from the numerical matched experimental data as shown in Figure 6. Figure 6a demonstrates that for C0 = 33 mg/L, the best numerical match occurred when adsorption density is about 8.5 × 10⁻¹⁰ kg/cm3. In the case of C0 = 3.9 mg/L (Figure 6b), the obtained adsorption density was about 4.5 × 10⁻¹⁰ kg/cm3. As Si concentration in the injected slug increases from 3.9 mg/L to 33 mg/L (almost 8 times higher), the adsorption density is almost doubled.
Mono-layer adsorption density of Si in sand pack A (with porosity of 0.45) was obtained as 1.4 × 10⁻⁸ kg/cm3 by a simplified estimation. To estimate mono-layer adsorption, it was assumed that the average grain diameter in the sand-pack A is 200 μm. To simplify the calculations, the sand grains were considered to have spherical shape. It was also assumed that Si is adsorbed in the form of silicate molecules (SiO2) with atom radii of 0.16 nm, and the adsorption takes place on the total surface (including the contact area) of all the grains in the sand-pack. The experimentally obtained Si adsorption densities (Figure 6a,b) are more than ten times smaller than the estimated monolayer value. This demonstrates an inconsiderable Si adsorption on sand grain surfaces, especially at high Si concentrations, such as Na-silicate solutions which are used for gel treatments (5 wt% Na-silicate solution has Si concentration of 17,000 mg/L).
Figure 6 shows that Si adsorption is reversible. This is implied from the tails of the concentration profiles, which starts at (C/C0) of about 0.25. It means that the adsorbed Si is desorbed in the post-flush water. The mass balance between the adsorbed and desorbed Si showed that most of the adsorbed mass is desorbed in the following water. For example, in the case of C0 = 3.9 mg/L, the total adsorbed Si amount in the sand-pack is about 0.015 mg. If it is assumed that the desorption starts at 1.5 PV with an average concentration ratio of C/C0 = 0.1 (as shown in Figure 6b), after about 2 PV, approximately 0.0065 mg (almost half) of the adsorbed mass is desorbed.
3.1.2. Na-Silicate Dynamic Gelation in Porous Media
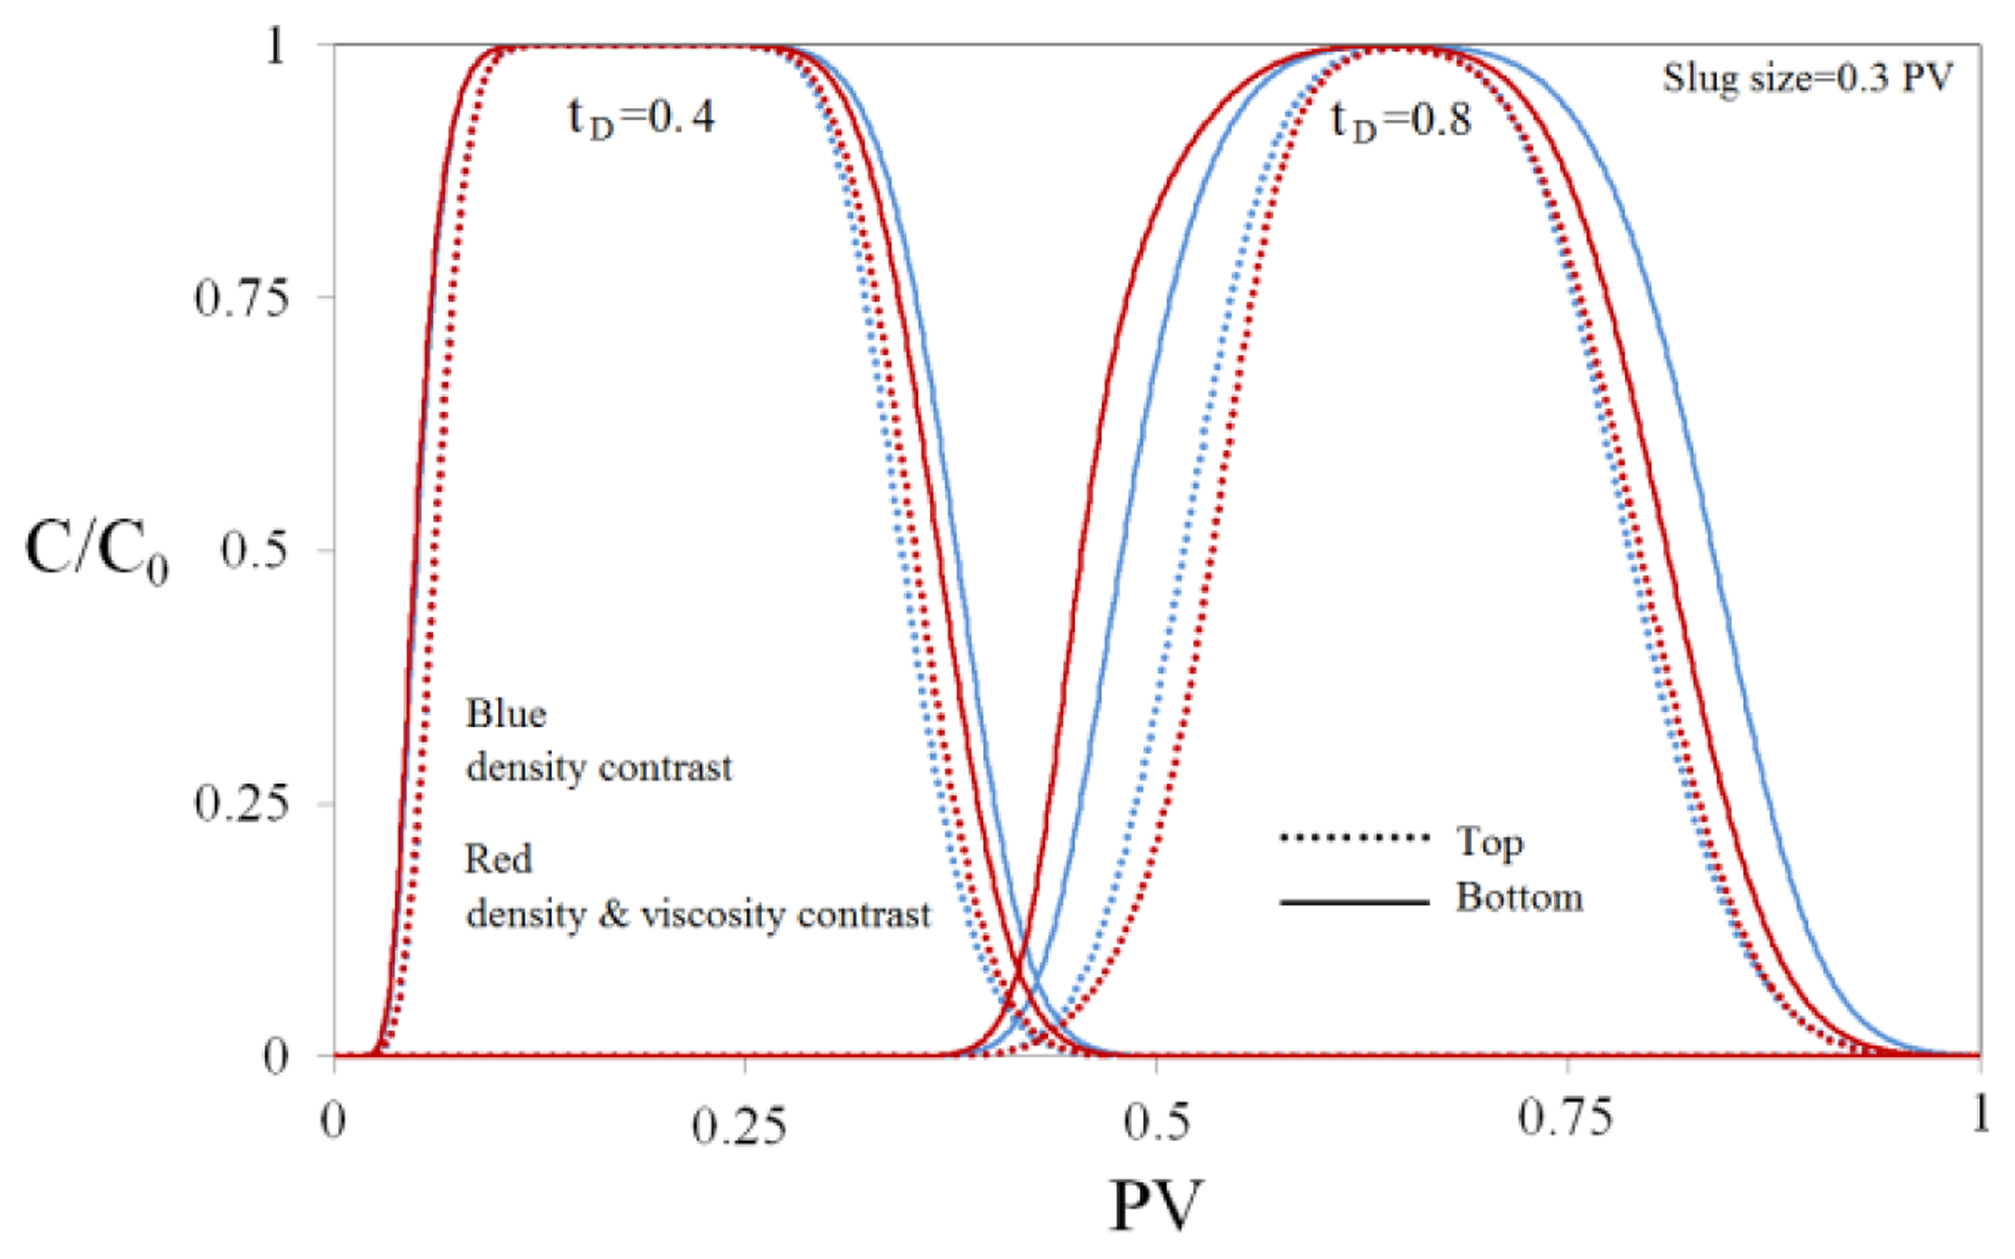
Na-silicate is water soluble; hence it diffuses into the water during the transportation in the porous media. Furthermore, since there is density and viscosity contrasts between Na-silicate solution and fluid (water) in the porous media, the Na-silicate slug propagation is not piston like and the shape of the formed gel is not regular. A numerical sensitivity study was performed on the effects of physical diffusion, density and viscosity contrasts on the slug propagation in porous media. Figure 7 compares the relative concentration (C/C0) profiles of the injected solution slug at two different times and two different heights in the simulated medium, i.e., at the bottom (solid lines) and the top (dashed lines). The results are shown for two different solutions. First one (blue lines) only has density contrast with the water in the medium (density ratio = 1.2), while the other one (red lines) has both density and visosity contrast with the water in the medium (density ratio = 1.2 and viscosity ratio = 1.3). As shown in Figure 7, the injected slugs are diffused in water as they transport in the medium. The effect of numerical diffusion was minimized by small grid sizes. The effect of diffusion has to be considered in the design of in-depth treatments.
For a solution with density contrast of 1, the concentration profiles at the bottom and top of the medium coincide. However, when the solution density ratio increases to 1.2, gravity segregation affects the concentration profile as the slug propagates inside the porous medium (Figure 7, blue lines). The relative concentration profile is thicker at the bottom and thinner at the top. It causes the post-flush water to override the slug at later times. The effects of gravity segregation and water override are more pronounced as the height of the medium increases.
Figure 7 shows that the concentration profiles are also affected by viscosity contrast between the injected solution and the formation water (Red lines). It is observed that the viscosity contrast exacerbates the gravity segregation effect which increases the intensity of the water override. When the slug has a higher viscosity than the formation water, the flow resistance is higher wherever the slug is thicker. Therefore, since the slug is thinner at the top, due to the density contrast, flow resistance is lower there, compared to the bottom of the medium. Hence the flow velocity is faster at the top and water override is accelerated.
The Na-silicate gel profiles and strengths for different injected slug sizes are studied. For all the experimental studies in the coming sections, 5 wt% Na-silicate solutions with different pH values were used. Na-silicate samples with lower contents than 5 wt% did not produce strong enough gels for in-depth applications.
5 wt% Na-silicate at pH = 10.40 were injected with different slug sizes, targeting the middle of the sand-pack A. Sand-pack was initially saturated with DW. The Na-silicate slug was injected at a rate of 0.1 mL/min, which is corresponding to the shear rate of about 10 s−1. Silicate solution was placed almost at the middle of sand-pack with a DW post-flush. The injection rate was then reduced to 0.01 mL/min to monitor the gel formation by measuring the pressure drop between the inlet and the outlet. The results are compared for four different slug sizes of 0.35, 0.4, 0.45 and 0.5 PV. Figure 8 shows the numerically and experimentally obtained profiles of the gel for different Na-silicate slug sizes after the gel placement at the middle of the medium. Figure 8a is a picture taken from the formed gel in the used transparent tubes after removing the sand in other parts using high pressure air. There is a good agreement between the experimental (Figure 8a) and simulated (Figure 8b) results, which shows the ability of the developed numerical method in predicting the gel propagation and profile. The profile of the formed gel is dependent on the Na-silicate slug size. In the case of 0.35 PV slug size, most of the injected Na-silicate was diluted, mostly at the top due to gravity effect; so the formed gel has a small size. As the injected slug size increases, the formed gel sizes increased. For slug sizes ≤ 0.4 PV, water override was clear, while for the larger slug sizes, the gel fully occupies the sand-pack cross section.
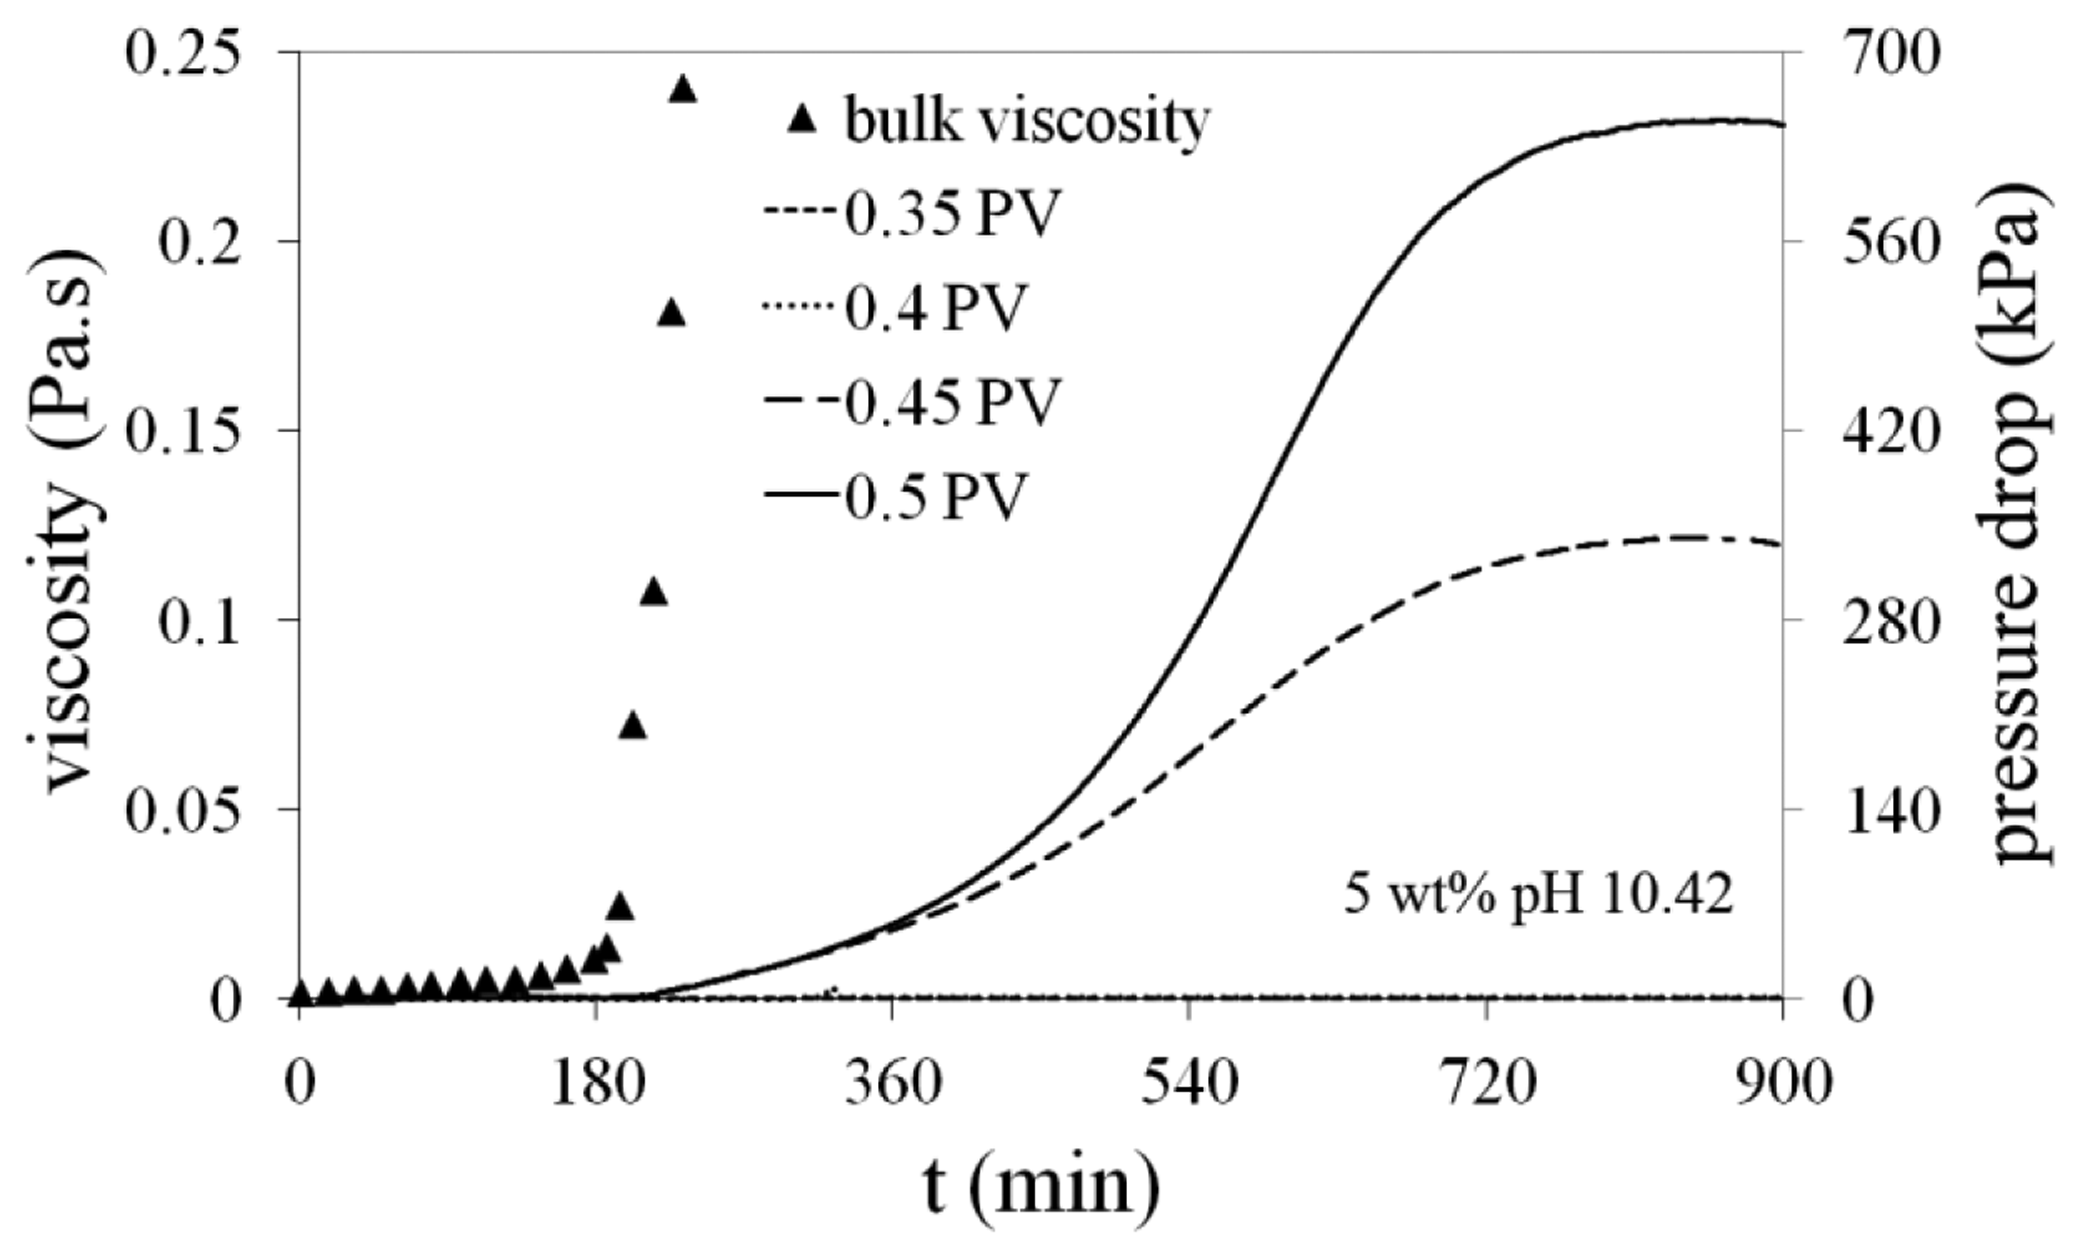
Figure 9 compares the pressure build-up (flow resistance) during gel placements with different slug sizes. The bulk measured viscosity profile of 5 wt% Na-silicate at pH = 10.40 is also presented in Figure 9. No considerable pressure increase is observed prior to Na-silicate gelation As shown in Figure 9, the pressure build-up in the sand-pack for Na-silicate slug sizes of 0.45 and 0.5 happens at about t = 200 min, in a good agreement with bulk measured gel time (tg = 180 min). It takes slightly more time after gelation in sand-pack to be sensed by the pressure gauge at low injection rates. As depicted in Figure 9, Na-silicate slug sizes ≤ 0.4 cannot increase the flow resistance in the sand-pack after the gel placement, because of high water override (Figure 8). In the case of larger slugs of 0.45 PV and 0.5 PV, pressure increases after the gel setting time and then stabilizes at different values, as shown in Figure 9. The pressure stabilization indicates that a water communication path is formed between the two sides of the gel at about t = 800 min, which cannot be detected in Figure 8. By increasing pressure behind the Na-silicate slug, water gradually overcomes the viscous force of the newly formed gel at the top.
As shown in Figure 10, water override happened by displacement of small volume of water at the top of the formed gel through a thin layer. Residual resistivity factor (Frr) for 0.35 PV, 0.4 PV, 0.45 PV and 0.5 PV slug sizes is 1, 1.7, 18.5 and 650, respectively. Frr was determined by the relative pressure drop in the sand-pack after gel placement and before gel treatment.
3.1.3. Gel Application in a Dual-Permeability Sand-Pack
First, a sensitivity study was done on the size of LSW pre-flush in sand-pack A, using numerical simulation. The model was initially saturated with SSW, then a LSW pre-flush was injected followed by 0.48 PV Na-silicate slug with the injection rate of 0.1 mL/min. Figure 11 shows relative water salinity and Na-silicate relative concentration as function of the sand-pack PV for three different LSW pre-flush sizes. The results are shown at the end of Na-silicate slug injection. LSW, which is 25 time diluted SSW, has relative salinity of 0.04. It can be seen that 0.25 PV pre-flush did not make a proper space between SSW and the injected Na-silicate slug, hence there is a possibility of plugging due to precipitation. 0.5 PV LSW pre-flush, however, is adequate to make a safe space between the silicate slug and the brine within the tested sand-pack.
Dual permeability sand-pack flooding experiment was done both experimentally and numerically. The medium (including both sand-packs A and B) was initially saturated with red dyed oil (n-C10 and 0.01 M NN-DMDA) and colorless irreducible SSW. Primary water flooding was done by injecting SSW for 0.5 PV (of both sand-packs) with flow rate of 0.1 mL/min. The measured and simulated pressure drops along the parallel sand-pack system are depicted in Figure 12. At the beginning of water flooding, pressure drop gradually increased to about 1.5 kPa, and then stabilized. The pressure drop was almost constant (around 1.5 kPa) during the whole water injection process, as shown in Figure 12.
Water preferentially swept the oil in the high permeability sand-pack, while low permeability sand-pack remained unswept, except small parts close to the inlet. As shown in Figure 13a, the simulated pressure distributions in both sand-packs are similar during water-flooding period. However, since a given pressure drop results in a higher flow rate in high permeability sand-pack, the major oil production occurs in this sand-pack.
After water breakthrough in sand-pack B, the oil production became negligible, while water production dominated, as shown in Figure 14. Water flooding oil recovery factor was less than 50%.
Na-silicate gel was used to modify the flow profile and to recover the remaining oil in low permeability sand-pack. LSW pre-flush was injected for 0.25 PV (of both sand-packs) to dilute the ions of SSW in the medium. It was then followed by injecting 0.4 PV of 5 wt% Na-silicate solution with pH = 10.70. According to the prediction method presented in our previous study [16], the gel time for this sample (5 wt% at pH = 10.70) at room temperature and zero salinity is tg0 ≈ 30 h. The is high enough to ensure that the gelation of Na-silicate sample would be delayed to place the gel at the middle of sand-pack, while it mixes with LSW and becomes hot under T = 50 °C. The gelation time of the injected sample decreases to about 0.2 when tg0 =6 h at T = 50 °C and in contact with LSW, which is suitable for gel placement at the middle of sand-pack.
As shown in Figure 12, the measured pressure drop during Na-silicate injection was about 1.7 kPa (approximately 13% higher than that of water flooding), indicating good injectivity of Na-silicate prior to gelation. It was also observed that the injected Na-silicate only flows through the high permeability sand-pack, except small amount which penetrates in low permeability sand-pack, mostly due to diffusion. LSW was injected afterward to displace the Na-silicate from the inlet and also to dilute the Na-silicate leakoff into the low permeability sand-pack. Then injection rate was reduced to 0.001 mL/min to set the gel.
Water injection rate was increased to 0.1 mL/min at t = 1200 min. Upon increasing water injection flow rate, pressure increased sharply to a higher level (Figure 12) and the injected water flowed through the low permeability sand-pack (A) and swept the remaining oil, as shown in Figure 14. Figure 13b shows that the pressure drop across both sand-packs remained similar; however with different pressure distributions in porous media. There is a high pressure behind the formed gel in sand-pack B, while there is a pressure gradient in sand-pack A, due to water flow with constant rate. Na-silicate gel treatment enhanced oil recovery factor to more than 80%.
3.2. Field-Scale Numerical Studies
Several numerical experiments are done in this section to address field-scale Na-silicate behavior in porous media, using the two-layered reservoir described in Section 2.3 (see Table 4).
3.2.1. Sensitivity Study on Na-Silicate Slug Propagation
Figure 15 shows the Na-silicate slug size and post-flush water amount to make a 180 ft gel at the middle of the HP layer of the studied reservoir.
The results are compared for five different reservoir models, given in Table 5. Case (a) is considered as a reference case. The Na-silicate solution was injected after 1 PV water flooding. Figure 15 reports the slug sizes as PV of the HP layer. The first columns in Figure 15 demonstrate the calculated Na-silicate and post-flush water slug sizes in the case without dilution or leak off into the LP layer.
Figure 16 illustrates the concentration ratio of the injected Na-silicate for different studied cases at three moments: the end of Na-silicate slug injection, the meanwhile to the target, and at the targeted position. It is supposed that the gel is formed only when the normalized concentration of Na-silicate is higher than 0.7. This is a realistic assumption, since a practical Na-silicate content for field applications is about 5 wt% and Na-silicate never gels if it is diluted to lower than 3 wt%. The color scale in Figure 16 is therefore regulated to demonstrate the portion of the injected Na-silicate that is going to be gelled (C/C0 > 0.7).
In general, as shown in Figure 15, the required Na-silicate slug size for all the studied cases were at least 1.5 times of the one without dilution or leakoff. The profile of the injected solution changed as it propagated in the porous media, depending on the reservoir and fluid properties (Figure 16). The final profile of the formed gel was different for different studied cases; however, it was typically thick at the bottom and thin at the top, as discussed in Section 3.1.2 for gelation in sand-packs, due to the gravity segregation effect. This gel profile results in water override.
When Cases (a) and (b) are compared, it can be seen that the reservoir with permeability ratio of 100 needed considerably lower amount of Na-silicate and post-flush water (Figure 15). At a higher permeability ratio, the proportion of the injected fluid which flows through the HP layer is higher; hence the leakoff into the LP zone is lower, compared to a lower permeability ratio, which is confirmed in Figure 16a,b. However as shown in Figure 16a, most of the leaked off Na-silicate into the LP zone was diluted in the post-flush water. The small remaining gel in the LP zone in Case (a) does not considerably affect the later water flooding.
As viscosity ratio increases from 1 in Case (a) to 10 in Case (c), the required Na-silicate and post-flush slug sizes decreased (Figure 15). These values are relatively close to the Case (b), since both high permeability and viscosity ratios exacerbated the water channeling effect. Therefore, the penetrated Na-silicate into the LP layer was smaller in the Case (c) compared to the Case (a) (Figure 16c).
As shown in Figure 15, Case (d) required the maximum Na-silicate slug size among all the tested cases. Case (d) is a reservoir model which has ten times higher kv/kh compared to the other cases. As vertical permeability increases, the flow contribution of the water channel to the LP layer increases so larger amount of the injected fluids, including Na-silicate, leaks off into the LP layer (Figure 16d). Therefore, it is observed in Figure 16d that the post-flush water could not fully dilute the large amount of the leaked off Na-silicate in the LP zone. However, since the rear of the formed gel in the HP layer outran the front of the Na-silicate in the LP layer, the flooded water could be diverted through this gap into the LP zone and enhance sweep efficiency. The Na-silicate slug deformation due to the gravity segregation was intensified for Case (d), as shown in Figure 16d.
As shown in Figure 15, the required Na-silicate was slightly less for the reservoir without cross flow (Case (e)), compared to Case (a). The water channel expansion which occurred in the case of free cross flow (Case (a)), resulted in a higher Na-silicate penetration into the LP layer, especially close to the HP layer. This phenomenon was not the case in the reservoir without cross flow (Case (e)), as shown in Figure 16e. The gravity segregation effect, which caused gel deformation in all the previous studied Cases (a–d), did not happen in Case (e). Due to absence of flow communication between the HP and the LP layer in Case (e), the gravity of the fluid in the LP layer did not affect the gel profile.
It is important to note that, as observed in the sensitivity study above, the problem of matrix plugging is less pronounced when the injected chemical is water-soluble, such as Na-silicate, compared to the oil-soluble materials. Since the injected aqueous chemical which has been leaked off into the matrix will be dispersed into the post-flush water and diluted. However, due to the same reason, to plug a certain volume of the HP layer, it is always necessary to inject a greater volume of the water-soluble chemical, compared to the oil-soluble ones.
3.2.2. Practical Considerations for Na-Silicate Field Applications
It was assumed that the initial water and the flooded water are sea water in the reservoir Case (a), see Table 5, while the pre-flush is LSW (with 4% relative salinity compared to sea water). Na-silicate solution was injected into the reservoir after 1 PV water flooding. The slug size of the Na-silicate solution was 0.45 PV of the HP layer. Two different pre-flush sizes, Case 1 and 2, were compared in this study. The pre-flush size was 0.09 and 0.18 PV of the HP layer for Cases 1 and 2, respectively. Figure 17 is a dimensionless graph showing concentration ratio of the injected Na-silicate slug and the relative water salinity for the two studied cases at the bottom of the HP layer as a function of dimensionless distance (x/L), where x is distance from the injector and L is the reservoir length. The results are shown at two different intervals: (I) after injecting 0.2 of the Na-silicate total volume (solid lines); and (II) when Na-silicate slug is placed at x = L/2 (dashed lines) in the HP layer. Na-silicate concentration ratio of 0.75 was taken to be the base line concentration, below which no precipitation occurs. It was also assumed that Na-silicate precipitation would not cause permeability reduction (plugging) as long as the relative sea water concentration was below 0.1 [20].
As shown in Figure 17 for Interval I, the relative front water salinity in contact with Na-silicate at C/C0 = 0.75 was 0.06 and 0.02 for the two pre-flush Cases 1 and 2, respectively. This means that the both pre-flush cases did not cause plugging at this stage of Na-silicate injection. At Interval II, the relative front water salinity in contact with Na-silicate at C/C0 = 0.75 increased to 0.12 for pre-flush Case 1, which shows the possibility for plugging due to precipitation in this pre-flush case. Plugging at this time may be desirable, since the gel was almost placed at the middle of the reservoir and precipitation may enhance the residual resistance factor of the treated zone. However, pre-flush Case 2 still prevented precipitation plugging in that interval.
The same study has to be done to estimate the size of LSW post-flush to avoid unwanted plugging behind the Na-silicate slug. In the case of free cross flow between the layers, it is also important to consider the water salinity in the LP layer, which is not diluted with the same rate as the HP layer. It may cause plugging in the contact area between the HP and the LP layers.
Figure 18 shows the reservoir temperature and Na-silicate slug transportation at the bottom of the HP layer as function of the normalized distance, at intervals I and II. The reservoir initial temperature was T = 120 °C, and was cooled during 1 PV water flooding of 18 °C. The major temperature decrease happened through the HP layer, where water flow was maximum. There was a temperature gradient from 18 °C, close to the injector, to about 70 °C, close to the producer, in the HP layer.
The injected slug of Na-silicate was therefore heated up as it transported in the medium. Higher temperatures accelerate the gel setting time [16], so the temperature gradient could be a controlling factor for Na-silicate gelation. When the reservoir was in the shut-in mode after Na-silicate placement, the HP layer was heated up to approximately 5 °C after four months of shut-in, as depicted in Figure 18. The temperature increase during shut-in period may help to accelerate the gelation of the placed Na-silicate.
4. Conclusions
Na-silicate gelation in sand-packs demonstrated gravity segregation by water override phenomenon at the top of the formed gels. This reduces the resistance factor of the formed gel.
Silicate adsorption was considerably lower than the estimated mono-layer adsorption. Moreover, silicate adsorption was reversible, and most of the adsorbed mass was desorbed in the post-flush water.
Na-silicate showed water-like injectivity after pH adjustment and prior to gelation in flooding through sand-packs. Na-silicate enhanced water sweep efficiency in a dual-permeability sand-pack system, by increasing flow resistance in high permeability sand-pack without damaging the productivity of the low permeability sand-pack.
Field-scale numerical experiments showed that the reservoir and fluid parameters—such as permeability ratio, viscosity ratio, vertical permeability and cross flow—affect the injected silicate propagation and leakoff into the matrix prior to placement in the targeted distance. The size of the injected Na-silicate slug and post flush water has to be determined based on these parameters. Higher permeability and viscosity contrasts and lower vertical/horizontal permeability ratio result in lower Na-silicate leakoff into the matrix.
The formed mixing zone between the formation water and the injected Na-silicate solution, which resulted from low salinity pre-flush, together with the reservoir temperature gradient, resulted from long-term cold water flooding, were two important controlling factors for Na-silicate in-depth gelation within the reservoir.
Therefore, a necessary step before Na-silicate field application is to run a tracer test in the sector of the reservoir which is going to be treated. The obtained field data from the tracer test gives an estimation of dispersion coefficient in the studied reservoir sector. Dispersion coefficient is important to determine the rate of Na-silicate dilution with the formation water and the length of mixing zone created by the low salinity pre-flush. A numerical simulation can be employed then to predict the placement of the gel under reservoir conditions.
Acknowledgments
This work was supported by Dong Energy Company, Norway. The authors acknowledge the technical follow up and interest shown by Kelly Tyler, Lars G. Gammelgaard and Oddbjørn Melberg of Dong Energy Company, Norway. We also acknowledge Inger Johanne Munthe-Kaas Olsen, Kim Andre Nesse Vorland and Ola Ketil Siqveland for their helps in acquiring the needed materials and support.
Conflicts of Interest
The authors declare no conflict of interest.
References
- Sydansk, R.D.; Southwell, G.P. More than 12 years' experience with a successful conformance-control polymer-gel technology. SPE Prod. Facil. 2000, 15, 270–278. [Google Scholar]
- Sydansk, R.D. Polymers, Gels, Foams and Resins. In Petroelum Engineering Handbook; Lake, L.W., Ed.; Society of Petroleum Engineers (SPE): Richardson, TX, USA, 2007; Chapter 13; pp. 1149–1260. [Google Scholar]
- Sydansk, R.D.; Romero-Zenom, L. Reservoir Conformance Improvement; Society of Petroleum Engineers (SPE): Richardson, TX, USA, 2011. [Google Scholar]
- Silva, L.F.; Carbide, R.S.; Farouq Ali, S.M. Waterflood Performance in the Presence of Stratification and Formation Plugging. Proceedings of the Fall Meeting of the Society of Petroleum Engineers of AIME, New Orleans, LA, USA, 3–6 October 1971.
- Krumrine, P.H.; Boyce, S.D. Profile Modification and Water Control with Silica Gels-Based Systems. Proceedings of the SPE Oilfield and Geothermal Chemistry Symposium, Phoenix, AZ, USA, 9–11 March 1985.
- Lakatos, I.; Lakatos-Szabo, J. Reservoir Conformance Control in Oilfields Using Silicates: State-of-the-Arts and Perspectives. Proceedings of the SPE Annual Technical Conference and Exhibition, San Antonio, TX, USA, 8–10 October 2012.
- Vinot, B.; Schechter, R.S.; Lake, L.W.J. Formation of water soluble silicate gels by the hydrolysis of a diester. SPE Res. Eng. 1989, 8, 391–397. [Google Scholar]
- Stavland, A.; Jonsbråten, H.; Vikane, O.; Skrettingland, K.; Fischer, H. In-Depth Water Diversion Using Sodium Silicate. Proceedings of the 16th European Symposium on Improved Oil Recovery, Cambridge, UK, 12–14 April 2011.
- Iler, R.K. The Chemistry of Silica, Solubility, Polymerization, Colloid and Surface Properties and Biochemistry; John Wiley-Interscience Publisher: New York, NY, USA, 1979. [Google Scholar]
- Smith, L.R.; Fast, C.R.; Wagner, O.R. Development and field testing of large volume remedial treatments for gross water channelling. J. Pet. Technol. 1969, 21, 1015–1025. [Google Scholar]
- Kristensen, R.; Lund, T.; Titove, V.I.; Akimov, N.I. Laboratory Evaluation and Field Tests of a Silicate Gel System Aimed to be Used under North Sea Conditions. Proceedings of the 7th European IOR Symposium, Moscow, Russia, 26–29 October 1993.
- Lund, T.; Berge, H.I.; Espedal, S.; Kristensen, R.; Rolfsvåg, T.A.; Strømsvik, G. The Technical Performance and Results from a Large Scale Na-Silicate Gel Treatment of a Production Well on the Gullfaks Field. Proceedings of the 8th European Symposium on Improved Oil Recovery (IOR), Vienna, Austria, 15–17 May 1995.
- Rolfsvåg, T.A.; Jakobsen, S.R.; Lund, T.A.T.; Strømsvik, G. Thin Gel Treatment of an Oil Producer at the Gulfaks Field: Results and Evaluation. Proceedings of the European Production Operations Conference and Exhibition, Stavanger, Norway, 16–17 April 1996; pp. 137–149.
- Børeng, R.; Svendsen, O.B. A Successful Water Shutoff. A Case Study from the Statfjord Field. Proceedings of the Society of Petroleum Engineering (SPE) Production Operation Symposium, Oklahoma City, OK, USA, 9–11 March 1997; pp. 603–609.
- Bauer, S.; Gronewald, P.; Hamilton, J.; Laplant, D.; Mansure, A. High-Temperature Plug Formation with Silicates. Proceedings of the SPE International Symposium on Oilfield Chemistry, Houston, TX, USA, 2–4 February 2005.
- Hamouda, A.A.; Akhlaghi Amiri, H.A. Factors affecting alkaline sodium silicate gelation for in-depth reservoir profile modification. Energies 2014, 7, 568–590. [Google Scholar]
- Fletcher, A.J.P.; Flew, S.; Forsdyke, I.N.; Morgan, J.C.; Rogers, C.; Suttles, D. Deep diverting gels for very cost-effective waterflood control. J. Pet. Sci. Eng. 1992, 7, 33–43. [Google Scholar]
- Seright, R.S.; Zhang, G.; Akanni, O.O.; Wang, D. A Comparison of Polymer Flooding with In-Depth Profile Modification. Proceedings of the Canadian Unconventional Resources Conference, Calgary, AB, Canada, 15–17 November 2011.
- Eoff, L.; Dalrymple, D.; Everett, D.; Vasquez, J. Worldwide field applications of a polymeric gel system for conformance applications. SPE Prod. Oper. 2007, 22, 231–235. [Google Scholar]
- Skrettingland, K.; Stavland, A. Snorre In-Depth Water Diversion Using Sodium Silicate—Single Well Injection Pilot. Proceedings of the SPE 18th Improved Oil Recovery Symposium, Tulsa, OK, USA, 14–18 April 2012.
- Hamouda, A.A.; Alipour Tabrizy, V. The effect of light gas on miscible CO2 flooding to enhance oil recovery from sandstone and chalk. J. Pet. Sci. Eng. 2013, 108, 259–266. [Google Scholar]


| Component | Concentration (g/L) | Concentration (M) |
|---|---|---|
| NaCl | 23.38 | 0.4 |
| Na2SO4 | 3.41 | 0.024 |
| NaHCO3 | 0.17 | 0.002 |
| KCl | 0.75 | 0.01 |
| MgCl2 | 4.24 | 0.044 |
| CaCl2 | 1.44 | 0.013 |
| Total | 33.39 | 0.495 |
| Component | SiO2 | Al2O3 | Na2O | K2O | CaO | TiO2 | Fe2O3 |
|---|---|---|---|---|---|---|---|
| Average content (wt%) | 99.70 | 0.07 | 0.03 | 0.02 | 0.006 | 0.001 | 0.01 |
| Minimum content (wt%) | 99.50 | 0.05 | 0.01 | 0.01 | <0.005 | <0.001 | 0.005 |
| Maximum content (wt%) | 99.80 | 0.12 | 0.05 | 0.04 | 0.01 | 0.002 | 0.025 |
| Property | Sand-pack A | Sand-pack B |
|---|---|---|
| Permeability (d) | 12 | 60 |
| Porosity (%) | 43 | 45 |
| Range of grain size (μm) | 90–300 | 300–500 |
| Irreducible water saturation (swc) | 0.31 | 0.27 |
| Residual oil saturation (sor) | 0.29 | 0.25 |
| Length (cm) | 78 | |
| Diameter (cm) | 1.17 | |
| Total volume (cm3) | 83.80 | |
| Reservoir properties | Fluid properties | ||||
|---|---|---|---|---|---|
| Reservoir dimensions (ft) | Length | 1,000 | Fluid viscosities cp | Water μw | 1 |
| Width | 30 | Oil μo | 1–100 | ||
| Thickness | 90 | Fluid densities (lbm/ft3) | Water | 62.4 | |
| Grid definition | NX | 100 | Oil | 44 | |
| NY | 1 | Pre-gel Na-silicate | 70 | ||
| NZ | 30 | Residual saturations | swc | 0.25 | |
| Horizontal permeability kh (md) | LP layer | 50 | sor | 0.22 | |
| HP layer | 250–50,000 | Compressibility | All fluids are considered incompressible | ||
| Vertical permeability kv (md) | kv/kh | 0.001–1 | Thermal conductivity κ (Btu/ftdayF) | κw | 8.6 |
| Porosity | 0.25 | Ko | 2 | ||
| Initial pressure P (psi) | 2,000 | Oil originally in place (ft3) | Total | 675,000 | |
| Initial temperature T (F/°C) | 250 (121) | Movable | 357,750 | ||
| Rock heat capacity Cp (Btu/ft3F) | 35 | - | - | - | |
| Thermal conductivity κ (Btu/ftdayF) | κrock | 30 | - | - | - |
| Case | Permeability ratio | μ0/μw | kv/kh | Cross flow |
|---|---|---|---|---|
| a | 10 | 1 | 0.01 | free |
| b | 100 | 1 | 0.01 | free |
| c | 10 | 10 | 0.01 | free |
| d | 10 | 1 | 0.1 | free |
| e | 10 | 1 | 0.01 | banned |
© 2014 by the authors; licensee MDPI, Basel, Switzerland. This article is an open access article distributed under the terms and conditions of the Creative Commons Attribution license ( http://creativecommons.org/licenses/by/3.0/).
Share and Cite
Akhlaghi Amiri, H.A.; Hamouda, A.A.; Roostaei, A. Sodium Silicate Behavior in Porous Media Applied for In-Depth Profile Modifications. Energies 2014, 7, 2004-2026. https://doi.org/10.3390/en7042004
Akhlaghi Amiri HA, Hamouda AA, Roostaei A. Sodium Silicate Behavior in Porous Media Applied for In-Depth Profile Modifications. Energies. 2014; 7(4):2004-2026. https://doi.org/10.3390/en7042004
Chicago/Turabian StyleAkhlaghi Amiri, Hossein A., Aly A. Hamouda, and Alireza Roostaei. 2014. "Sodium Silicate Behavior in Porous Media Applied for In-Depth Profile Modifications" Energies 7, no. 4: 2004-2026. https://doi.org/10.3390/en7042004