An Experimental Investigation on the Influence of Temperature on the Normal Impact of Fine Particles with a Plane Surface

Abstract
: This study investigated the rebound behavior of SiO2 particles normally impacting a planar surface under different temperature conditions. The system has been characterized for an aerosol inlet temperature range of 20–190 °C, flow velocities of 0–20 ms−1, and an impaction surface temperature range of 20–140 °C. For the first time, while keeping the same temperature gradient from the high- to low-temperature regions, the influences of varying temperature on the rebound behavior of SiO2 particles normally impacting a plane surface were examined. At increased temperatures, the plastic deformation increases and the coefficient of restitution reduces. The critical velocity is between 0.542 and 0.546 m/s under condition 1 (the carrier gas temperature (Tg) and the impaction surface temperature (TW) remain at room temperature of 20 °C), which increases to between 0.829 and 0.847 m/s under condition 4 (Tg and TW remain at temperatures of 190 °C and 140 °C, respectively). The experimental results show that the critical velocity increases with increasing temperature.1. Introduction
The problem of deposition of particles from a high temperature gas-particle flow onto cooled surfaces is of great interest in various engineering applications, such as fouling of power generation equipment, flue gas clean-up, materials synthesis and processing via aerosol routes, and flow characterization techniques based on particle diagnostics [1–3]. For instance, ash deposition is a major problem in pulverized coal that may lead to inefficient operation [4]. Ash deposition may also cause severe corrosion of heat transfer surfaces [5]. The incident particle velocity is one of the main parameters in determining the deposition rate. The objective of this work presented here is to study the interaction between a micron sized particle impacting a plane surface under four temperatures.
Ash deposition characteristics are known to be influenced by coal type, reaction atmosphere, particle temperature, surface temperature of the heat exchanger, material of its surface, flow dynamics and so forth. A number of reviews relating to ash deposition characteristics have already been published. For instance, Srinivasachar et al. [6,7] have studied the formation of the ash intermediates, which consist of gases, liquids and solids. Raask [8] elucidated the initiation of deposit, and Walsh et al. [9,10] studied deposition characteristics and growth. Beer et al. [11] tried to model ash behaviors. Benson et al. [12] summarized the behavior of ash formation and deposition in coal combustion. In addition, drop tubes (DT, thereafter) or entrained flow reactors (EFR, thereafter) have been used in many works on pulverized coal combustion and, in particular, for the investigation of ash deposition phenomena. A few examples of studies of this kind are those of Gibb [13], Haas et al. [14], Helble et al. [15], Hutchings et al. [16] and Manton et al. [17]. DT and EFR might provide very valuable information that could be used to anticipate problems in large boilers or to select the most convenient fuels or operating conditions. An important drawback is, however, the use of EFR facilities for the purpose that still provides macroscopic information about ash deposition, and cannot explain ash deposition mechanism(s) from a microscopic viewpoint.
In the ash deposition processes, one needs to know when and why microparticles stick to or rebound from a surface. Nevertheless, the physical mechanisms underlying various particle impact phenomena at the micro scales and the dependence of the rebound behavior on such factors as interfacial adhesion, surface roughness, particle temperature, planar surface temperature, and material properties remain unclear. To better understand these problems, the impact between a fine particle and a flat surface has been extensively studied. The pioneering work of direct measurement of particle velocity during the impact with a flat surface was conducted by Dahneke [18–20]. However, the accurate measurement of final bouncing velocity near the capture threshold (i.e., the critical velocity), where the adhesion effect plays a predominant role, was not achieved in that work. He proposed a simplified adhesion model to predict the coefficient of restitution (COR) and the critical capture velocity, in which the sphere is assumed to be elastic perfectly. Rogers and Reed measured critical impact velocity for large (15–40 μm) copper microspheres using a high speed camera. They evaluated an elastic-plastic impact model for particle adhesion [21].
However, one of the most comprehensive experimental investigations for small particles impacting surfaces at normal incidence is that of Wall et al. [22]. They measured incoming and rebounding particle velocities to within several particle diameters of the impaction surface with a laser Doppler velocimetry system. At low velocity (<20 m/s), the ratio of rebound to impact velocity was sensitive to target material, decreasing with impact velocity due to the adhesion surface energy, while for higher particle velocities, the ratio of rebound to impact velocity was insensitive to the target material.
Measurements of individual normal and oblique impacts of microspheres with planar surfaces are described and analyzed by Dunn et al. [23]. Their experimental results were similar in behavior to the previous studies using monodisperse spheres. Beek et al. [24] investigated rebound characteristics of 50 μm particles impacting a powdery layer. This was studied by impaction experiments of glass particles on different types of glass layers (powdery vs. glued), under various impact angle conditions (ranging from 0° to 30°) and with different incident velocities (ranging from 0.5 to 1 m/s). Besides, a 2-body collision model was developed to simulate the rebound characteristics. From a comparison between the experimental results and the model, it is shown that the 2-body approach to model the rebound characteristics of particles impacting a powdery layer is valid. Kim and Dunn [25] provided direct imaging results of microparticle collisions, whereby 40 μm diameter Ag-coated glass particles were dispersed and vertically dropped onto a silica target plate. The collisions under standard atmospheric conditions were resolved with a digital high-speed technique using black-light illumination.
Despite the above developments on the impact problems of particles with a substrate, there are still many important issues that remain unsolved. For example, the effects of the temperatures of particle and substrate on the rebound characteristic of particles need to be investigated by either experimental analysis or more detailed theoretical analysis. Therefore, the present work provides a basis for investigating the rebound behavior of fine particles impacting normally on a flat substrate at temperatures within a range. An experimental set-up was developed to study the normal impact of particles with a plane surface and was described in Section 2. The experimental results under four conditions are given in Section 3. The experimental results are compared to the theoretical analysis and discussed in Section 4. Conclusions are given in Section 5.
2. Experimental
2.1. Experimental Set-up
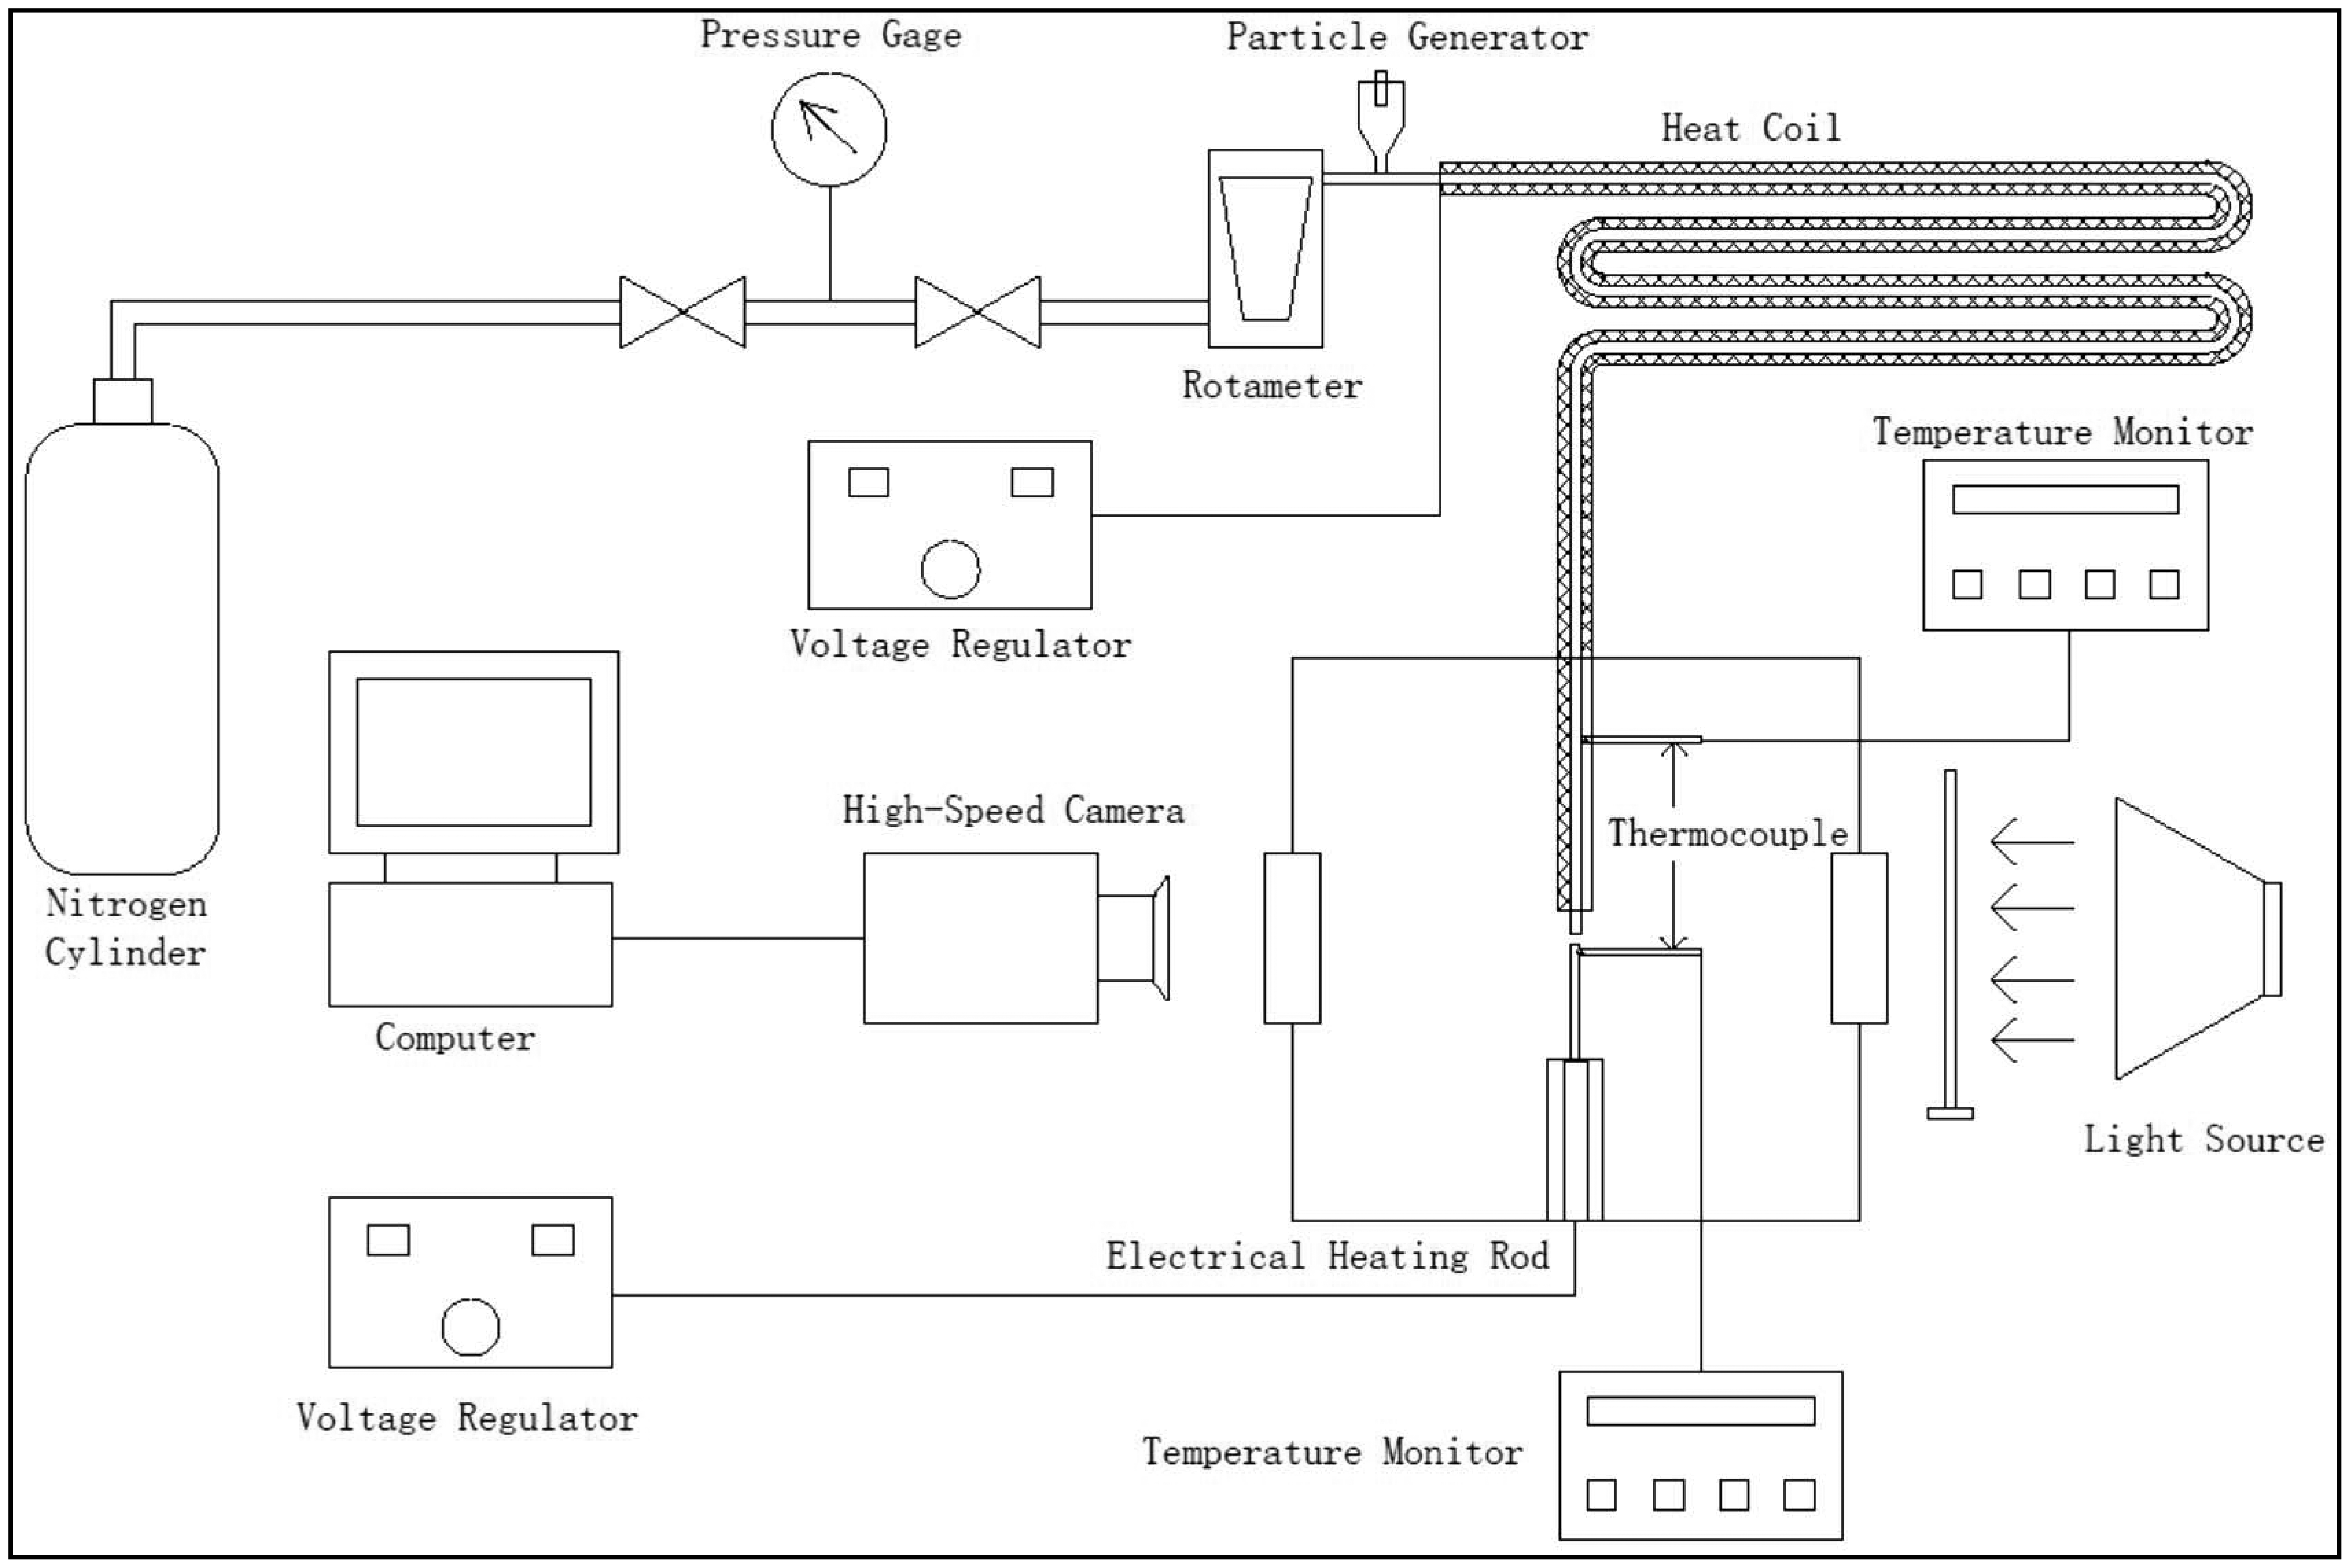
Figure 1 depicts an experimental facility setup of fine particle impaction, which consists of five main parts: (1) a fluidized bed particle generator with chamber, an air distribution plate, bed, feeding systems, etc.; (2) a digital high-speed camera (Phantom V12.1) with optical lens (VS-M0910); (3) a plane surface installed at the bottom of the test column, which can obtain different plate temperature; (4) a heater coil, which can be used to obtain different fine particle temperature. Nitrogen was drawn through a fluidized bed particle generator and carries the SiO2 particles into the test section (the incident velocity of 0–16 ms−1). The structure of the fluidized bed particle generator is the same as the one we used in the previous work [26]. The vertical distance between the outlet of the particle export pipe and the target surface is about 2 mm. The determination of the shooting region is the same as the one we used in the previous work [26]. The incidence and rebound normal velocity components of particles are recorded using a digital high-speed camera (Phantom V12.1). An optical lens (VS-M0910) is attached to the camera to achieve enough magnification to resolve individual particle motion. The camera output is connected to a digitizer and a frame grabber in a personal computer for image analysis. All experiments are conducted at a room temperature of ∼20 °C and a relative humidity of 25% ± 3%.
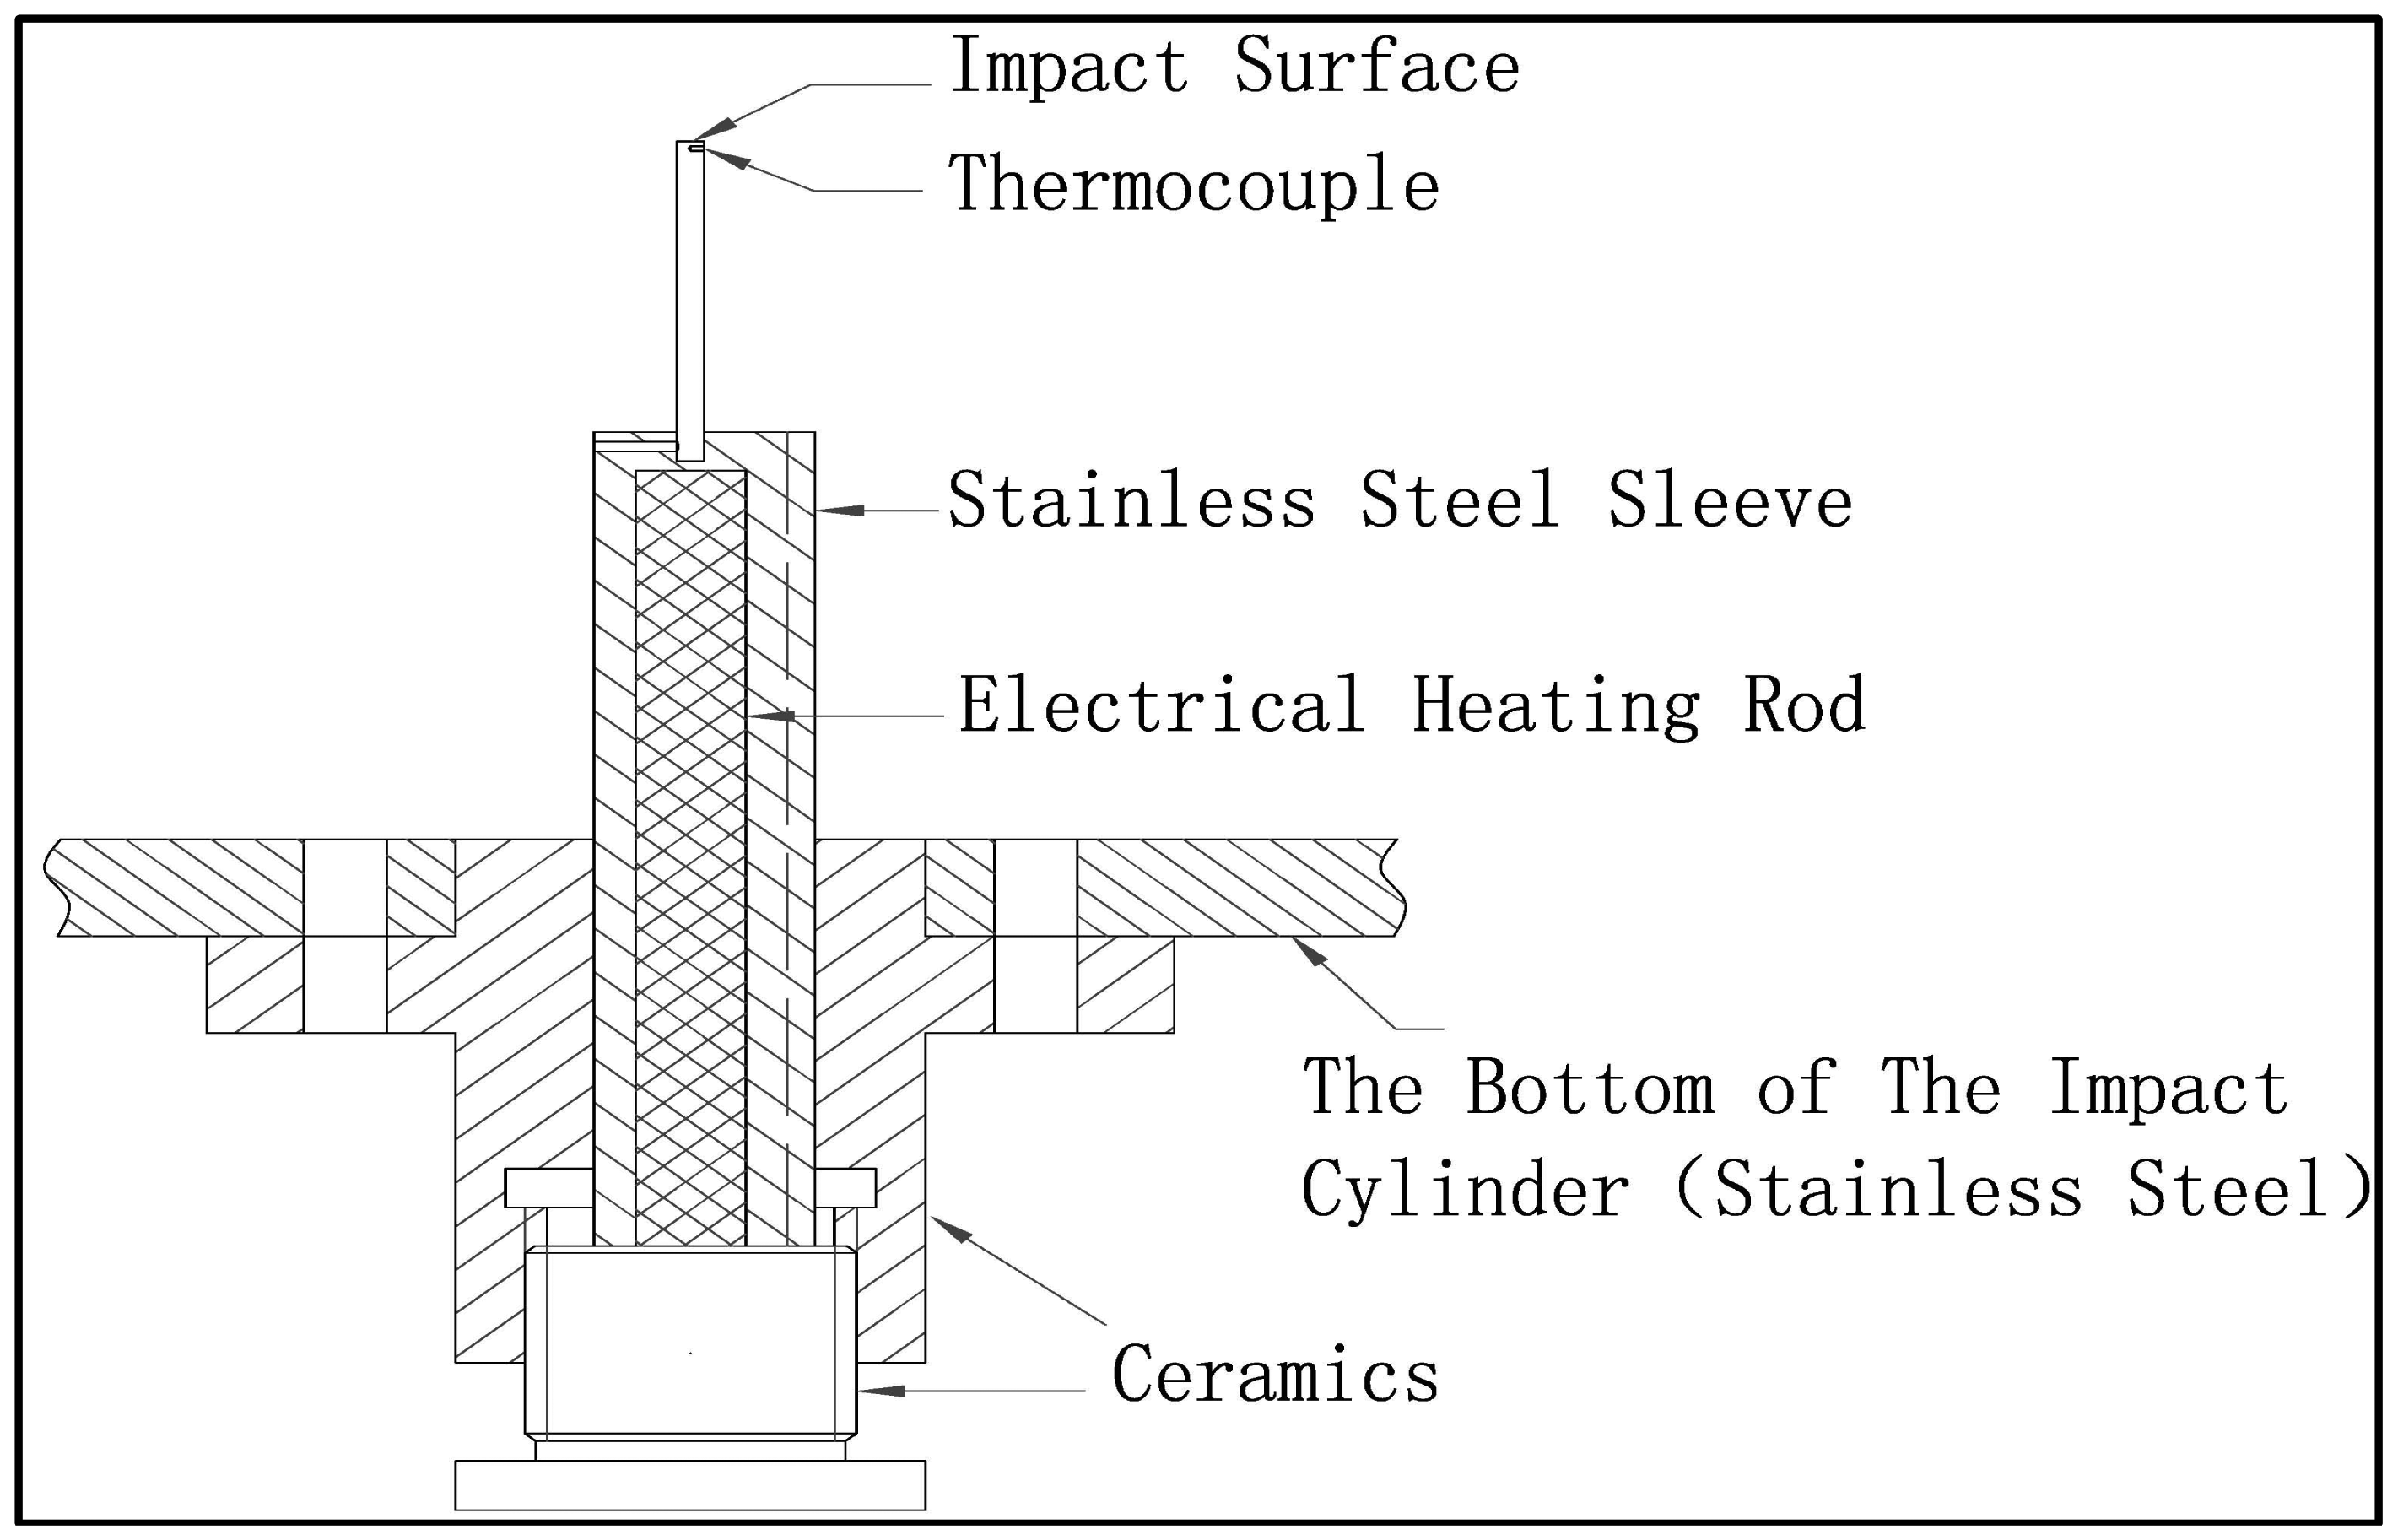
The plane surface is a diameter of 2 mm stainless steel attached to an electric heating rod. The electric heating rod connected with an AC voltage meter is installed in the ceramic insulation material with no dissipated heat. The temperature of the plane surface can be controlled by the AC voltage meter in a wide range. The highest plane surface temperature can reach about 200 °C. The temperature of the plane surface, monitored by a 1-mm type K thermocouple, which was embedded in the position of 1 mm downwards the impaction surface, see Figure 2. Nitrogen-carried fine particles are heated by the heater coil. The temperature of nitrogen outlet can be controlled by the AC voltage meter in a wide range. The highest temperature of nitrogen outlet can reach is about 250 °C. Since the diameter of fine particles is about 20 μm, we regard the temperature of the nitrogen as the particle's.
Before proceeding, the experimental system can show that the impaction phenomenon of particles with heat transfer tube surface in the boiler economizer. Experimental repeatability was assessed by repeating the experiments under the same conditions.
2.2. Particles
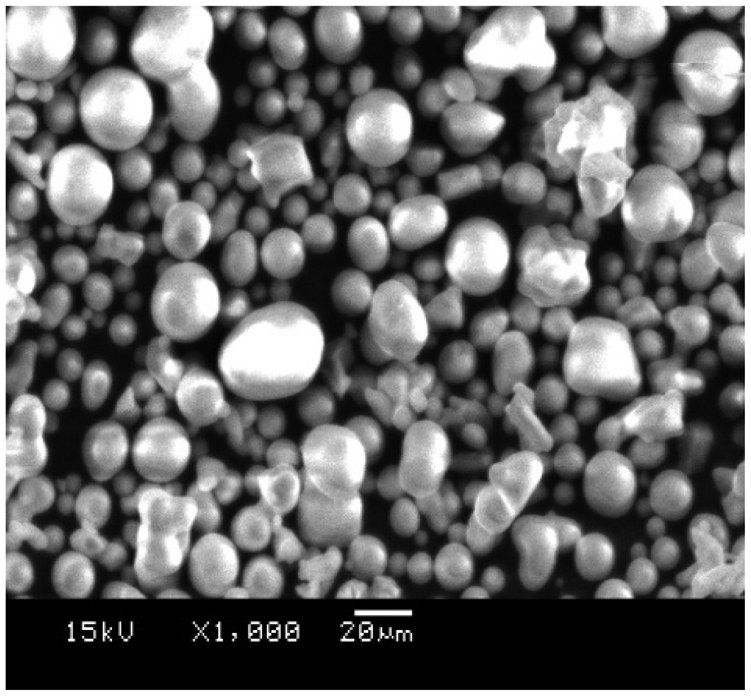
Fly ash is a heterogeneous material. SiO2, Al2O3, Fe2O3 and occasionally CaO are the main chemical components present in fly ashes, as shown in Table 1 [27]. Since the particles solidify rapidly while suspended in the exhaust gases, fly ash particles are generally irregular in shape and range in size from 0.5 μm to 100 μm. Therefore, SiO2 particles were used in the experiments. The microscopic morphology of the particles is obtained by Scanning Electron Microscopy (SEM). The microscopic morphology of the particles is regular spheres, as shown in Figure 3.
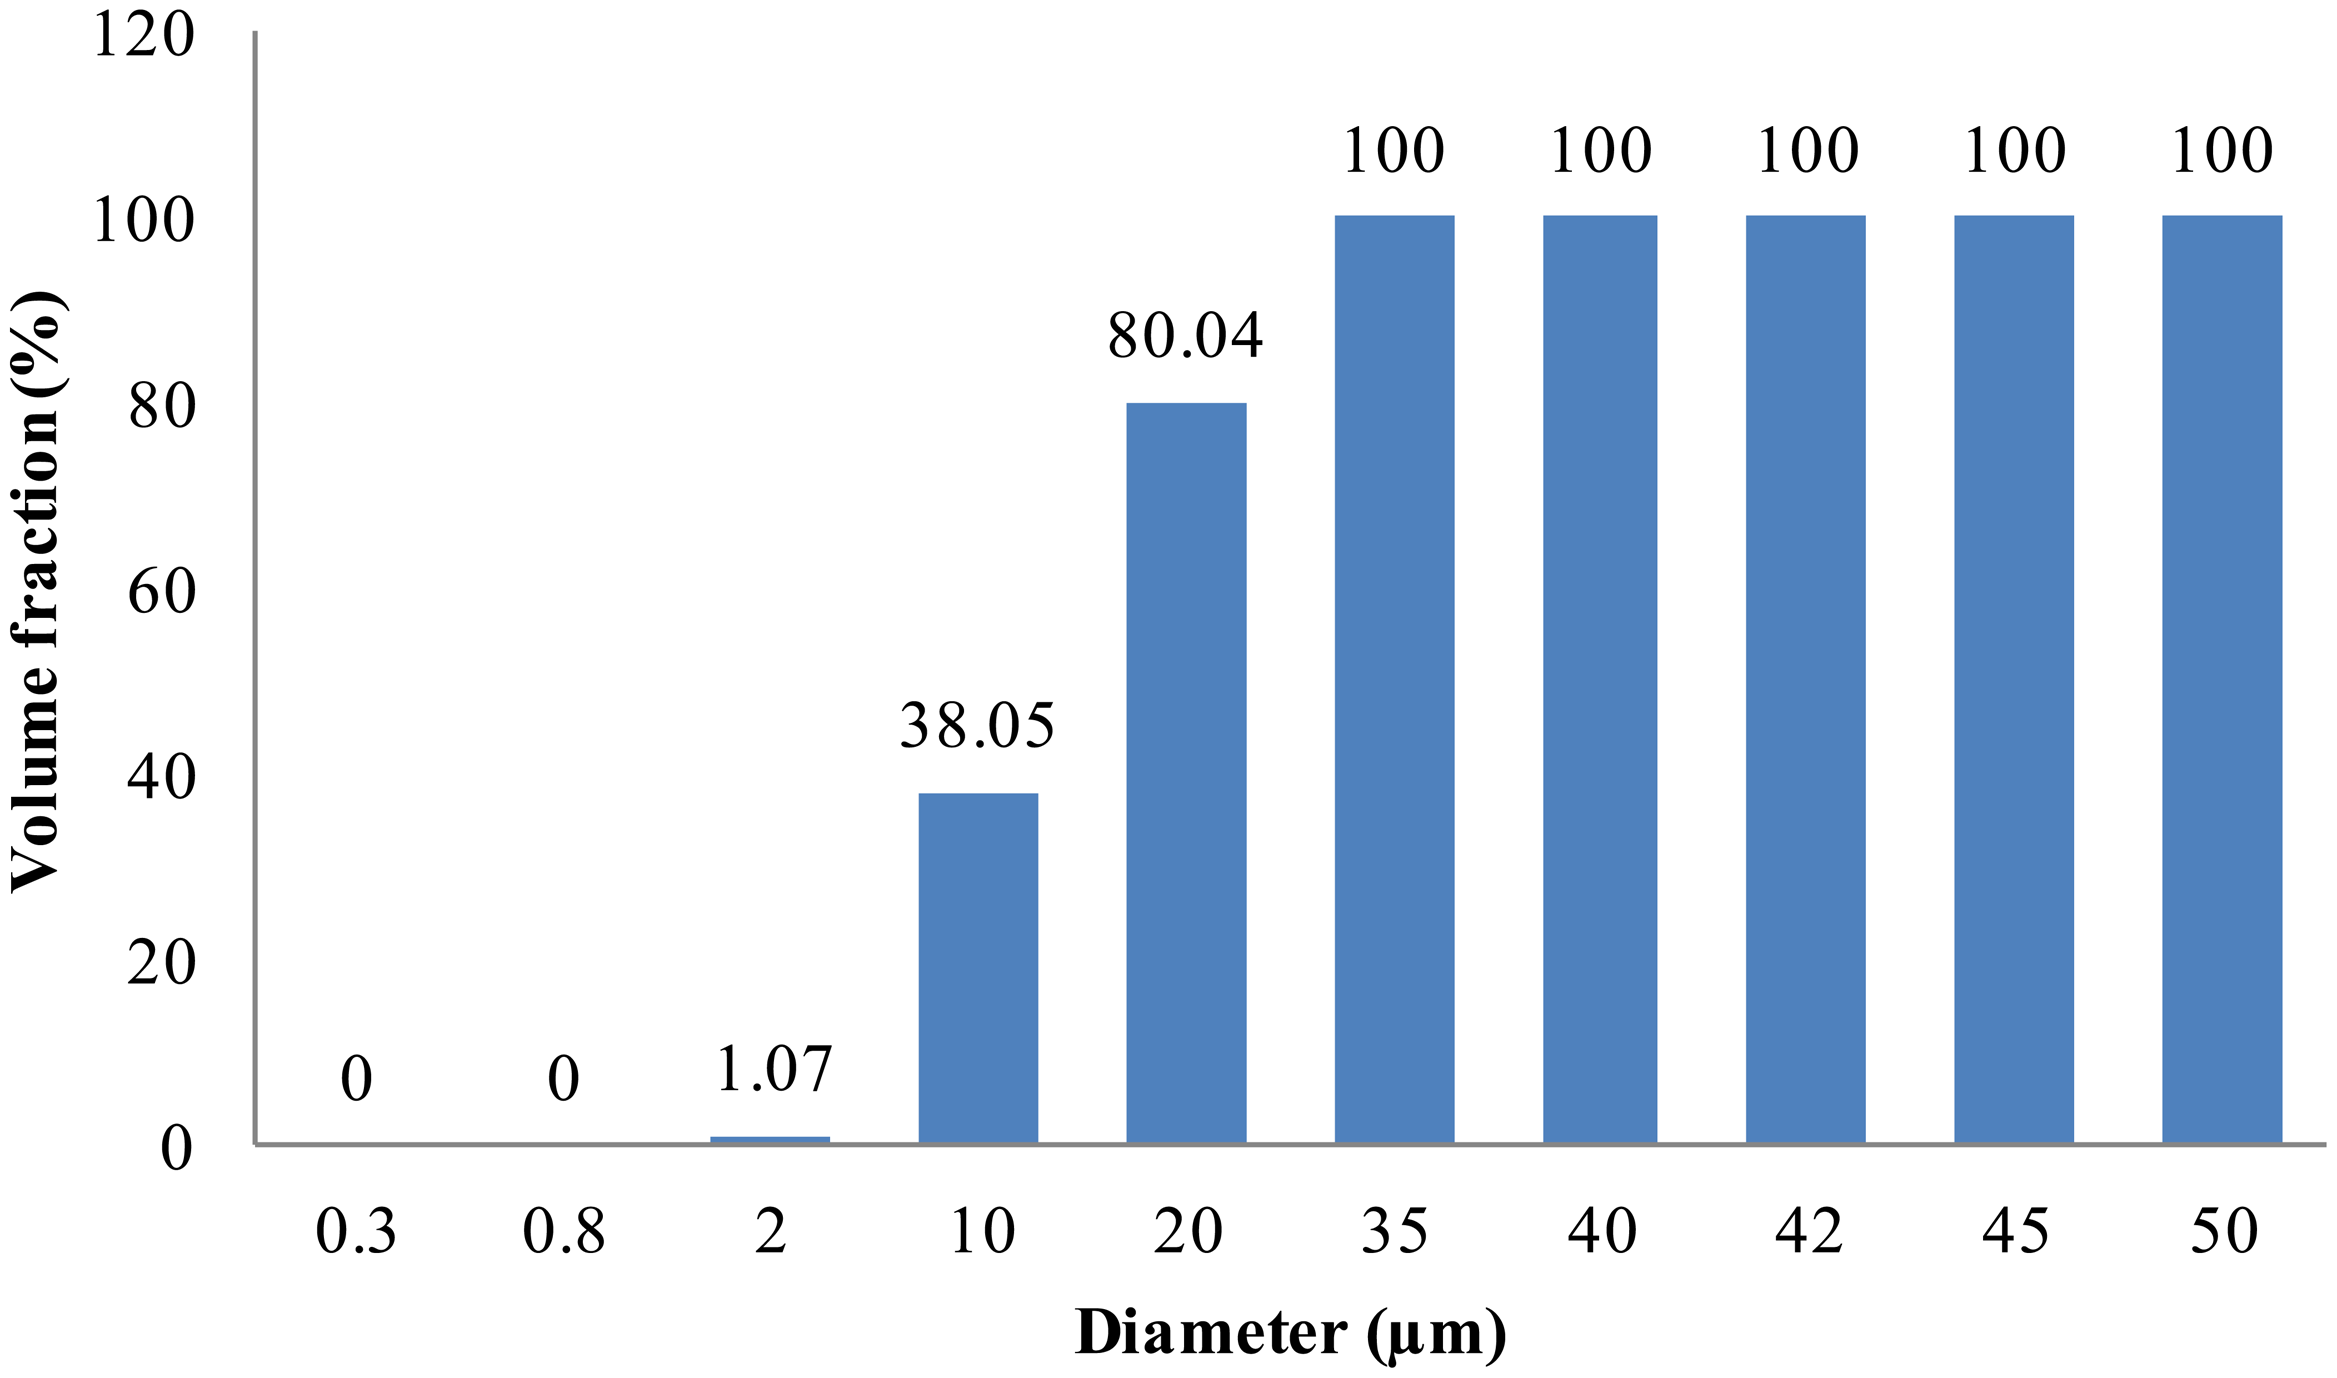
The volume particle diameter distribution is obtained by Laser Particle Size Analyzer (Mastersizer 2000, Malvern Instruments Ltd., Malvern, UK). The volume particle diameter distribution is shown in Figure 4. Thirty-eight percent of the volume particle diameter is smaller than 10 μm, eighty percent is smaller 20 μm, hundred percent is smaller 35 μm. Before carrying out an experiment, the particles were stored in a stove at 80 °C to minimize agglomeration problems.
In previous studies, the influence of particle diameter on the normal restitution coefficient is discussed in detail [26]. We further analyzed the influence of temperature on the normal restitution coefficient in the present paper. So, only the 20-micrometer particles are selected for further analysis.
2.3. Image Analysis
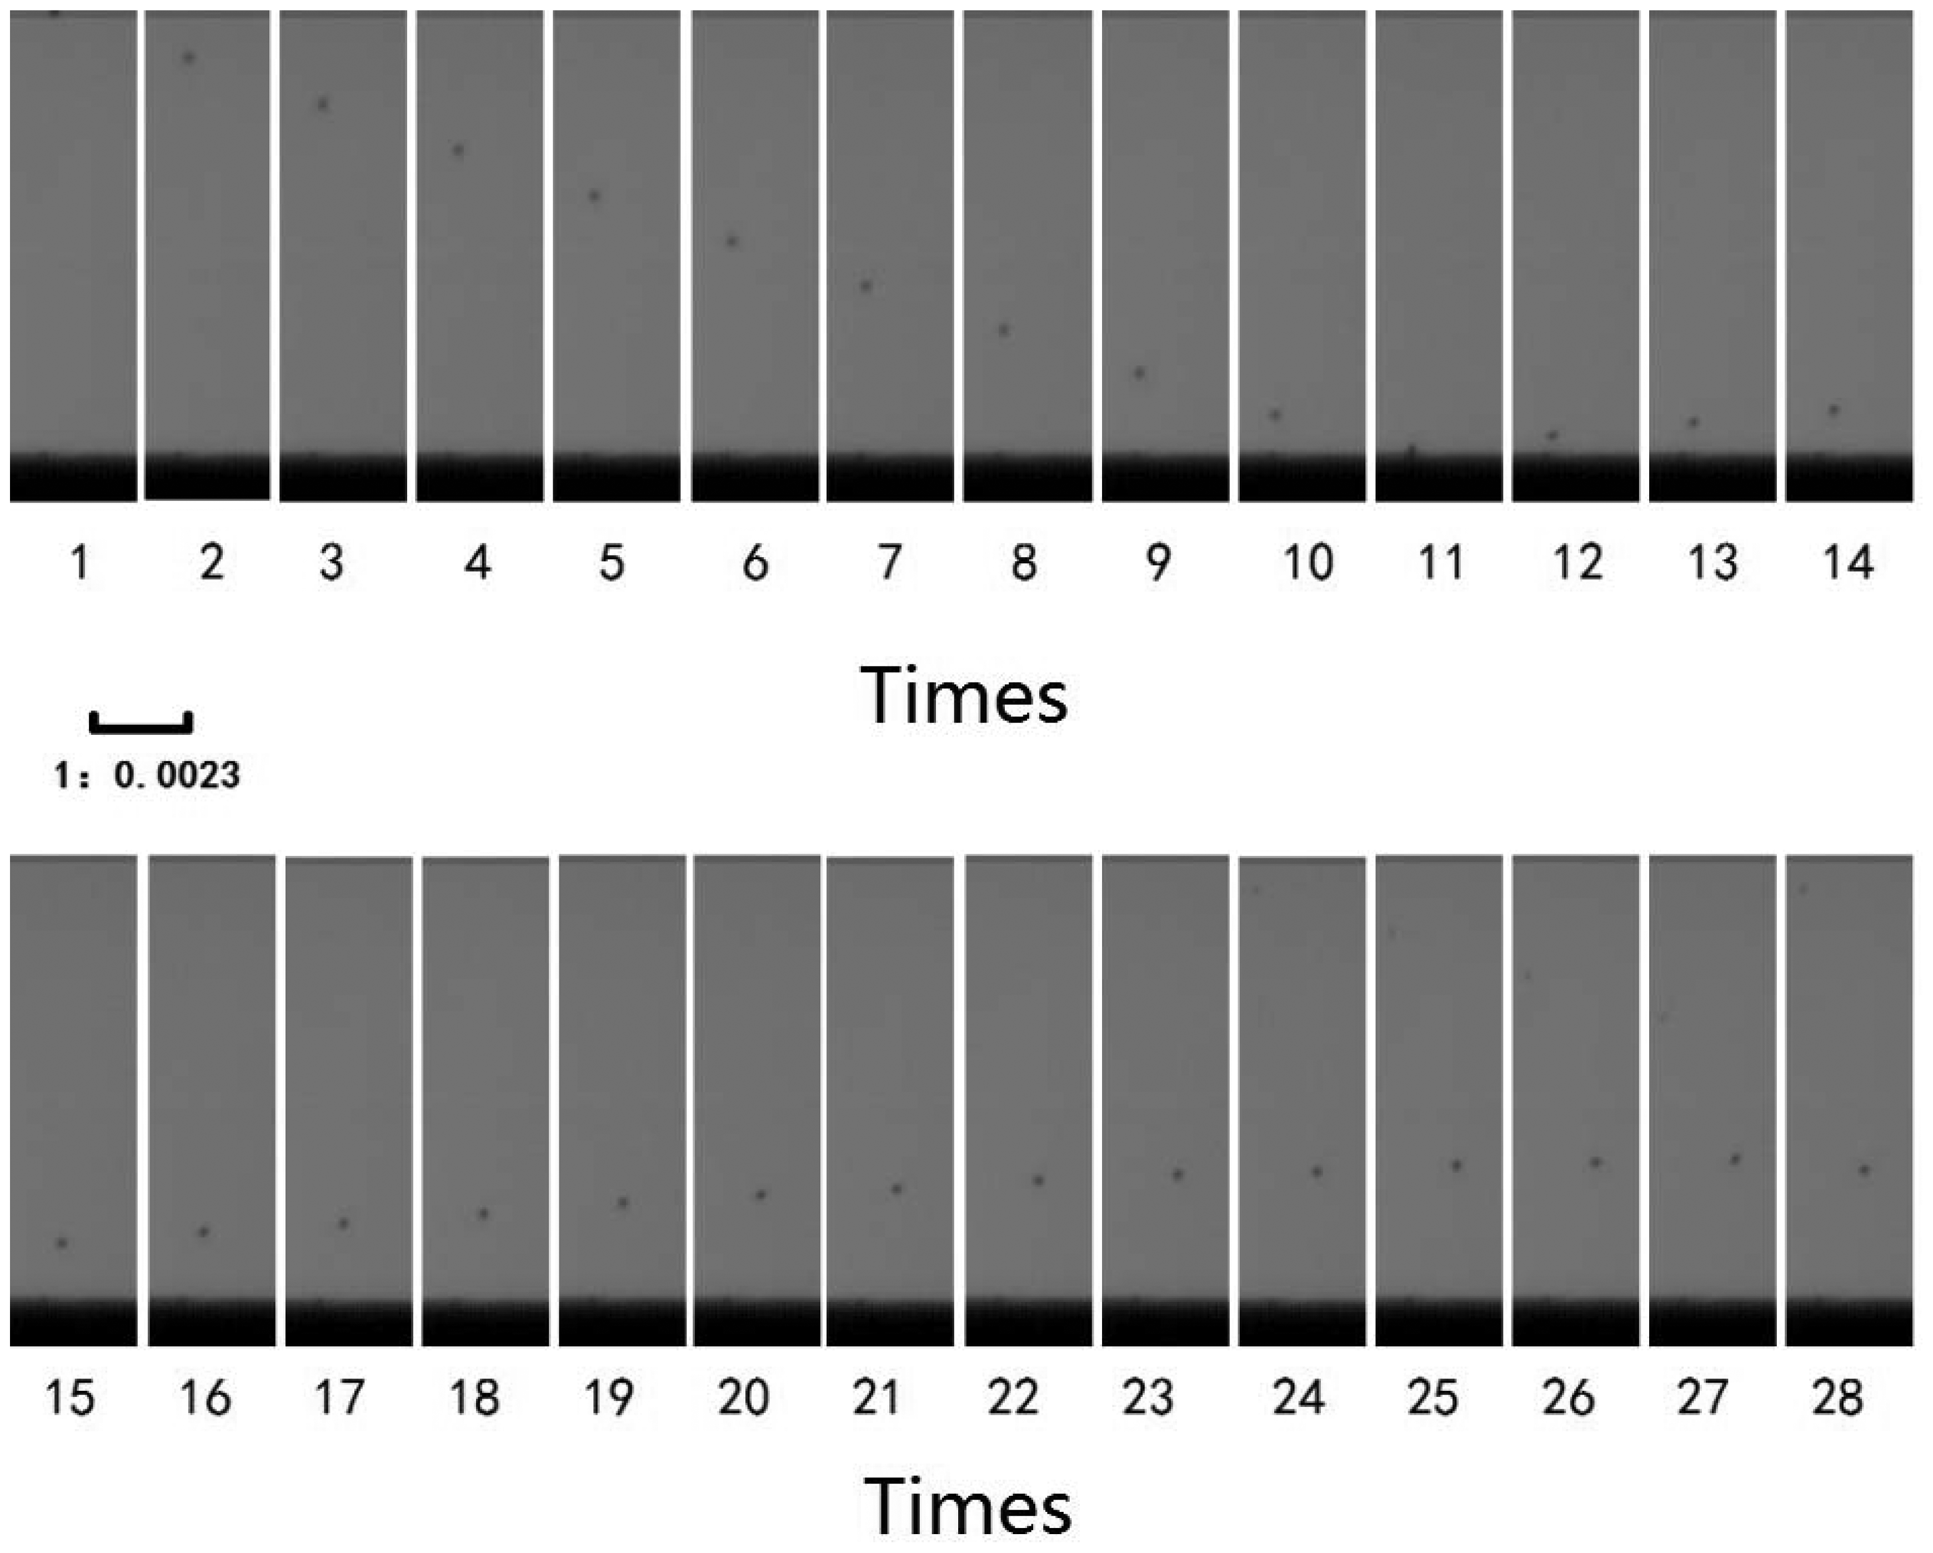
The course of the impact is recorded using a digital high-speed camera (Phantom V12.1). The max frame rate is 150,000 frames/s, corresponding exposure time is 5.93 μs, and corresponding pixel is 256 × 128. The minimum frame rate is 58,000 frames/s, corresponding exposure time is 15.77 μs, and corresponding pixel is 256 × 256. To determine the impact and rebound velocities accurately, the camera is equipped with an optical lens (VS-M0910). To track an incident and a rebound particle passing through this domain, a fiber optic solar light source (XD-300 xenon lamp) was used to backlight the particle impact events. An example of a recorded image with a resolution of 256 × 128 is given in Figure 5. In order to reduce the effect of the particle shape and the fluid drag force on the accuracy of the velocity measurements, incident velocities are determined from the distance of successive blobs 10–11 in Figure 5, and rebound velocities are determined from the distance of successive blobs 11–12 in Figure 5.
Due to the fact that the images of the shot pictures appeared fuzzy after zooming, direct measurement of the particle diameter will cause large errors. In the present paper, the digital image processing imtool function of the MATLAB software is used to obtain the particle diameter. Firstly, the appropriate tolerance is selected to measure the pixel values of target, whose size is known. Then, the value of particle pixel area is measured to obtain the particle diameter by scaling:
3. Experimental Results
3.1. Normal Coefficient of Restitution
Four different carrier gas temperatures and four different impaction surface temperatures were used in the present normal impact experiments, which was performed under four conditions in Table 2 (where Tg is the carrier gas temperature and Tw is the impaction surface temperature).
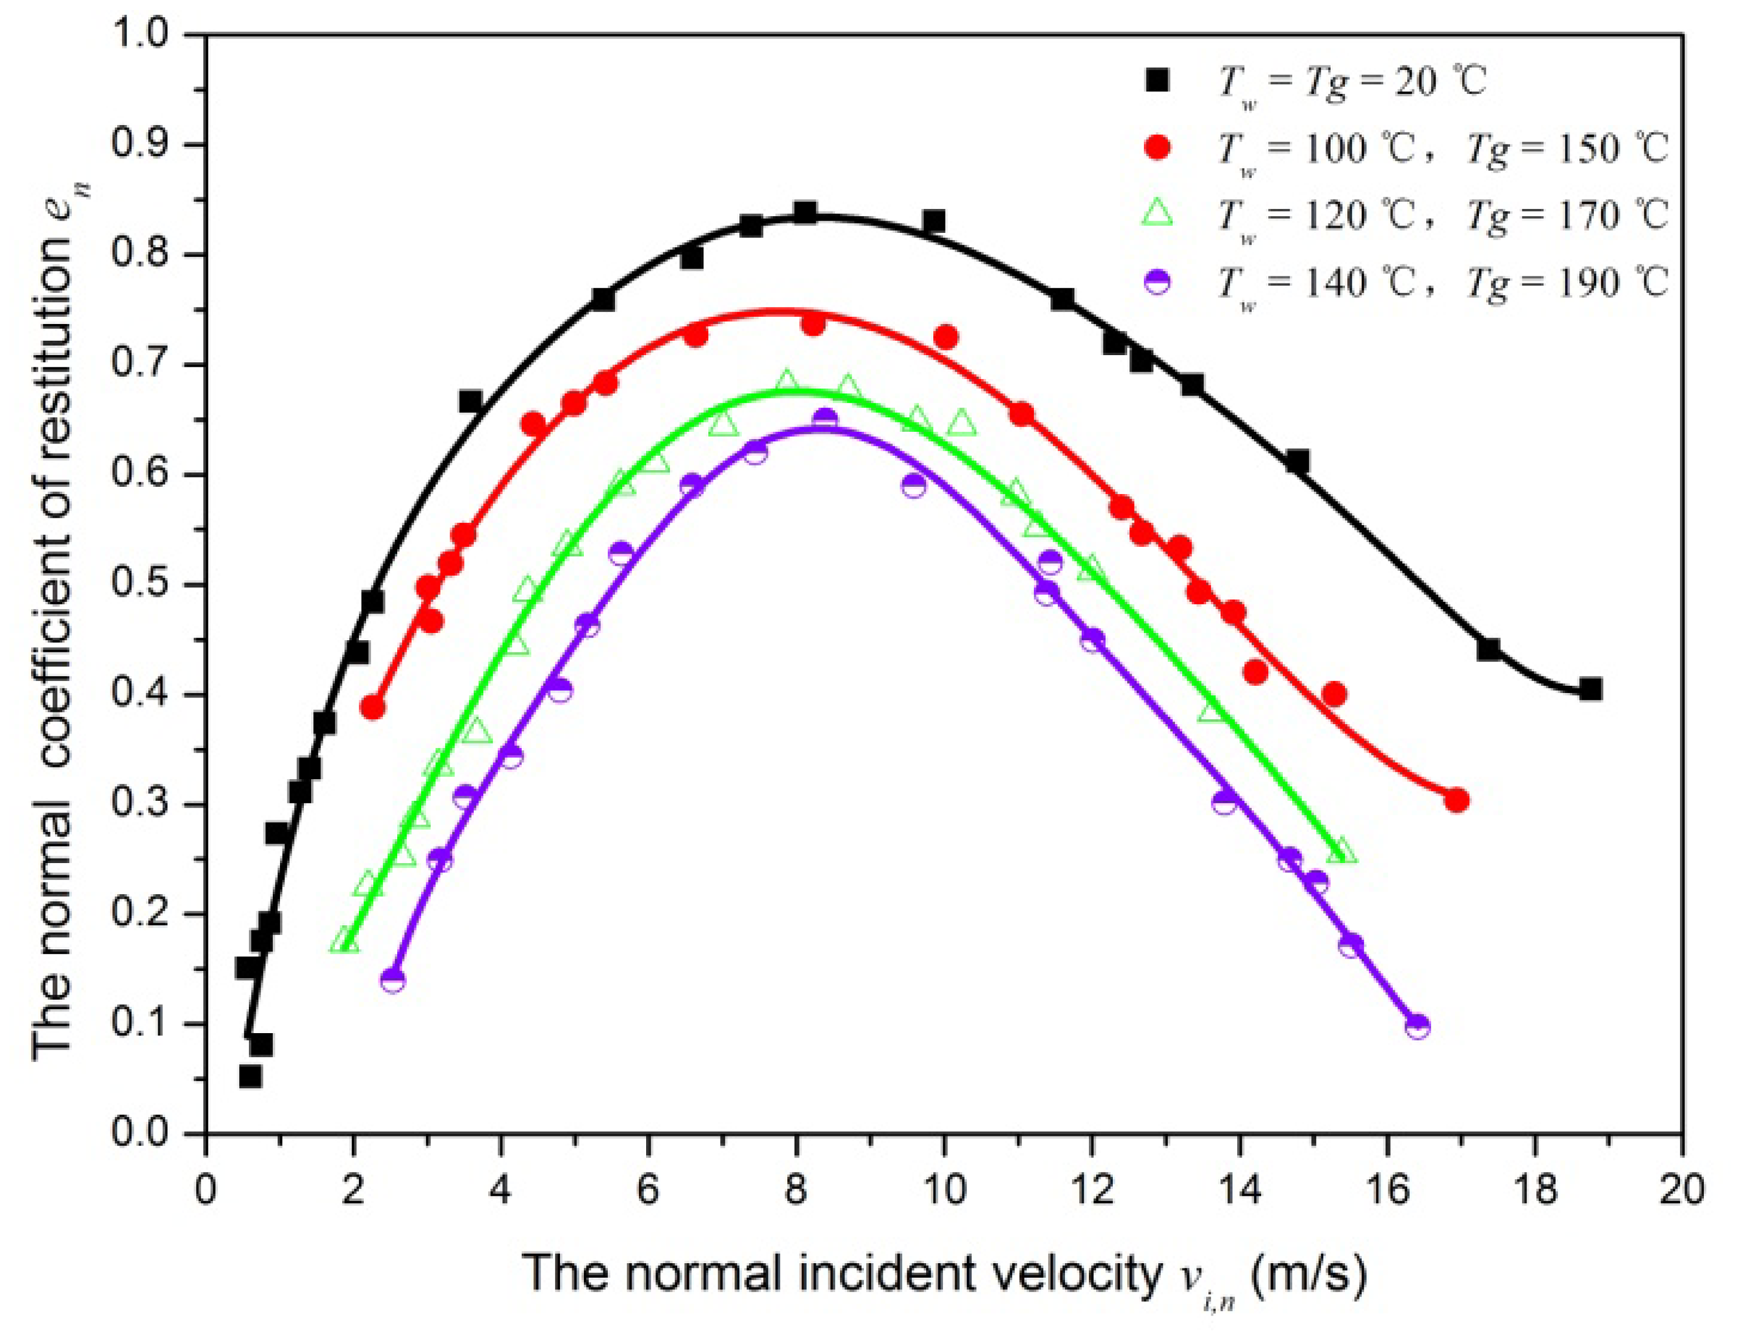
The rebound-to-incident normal velocity component ratio ( νr,n/νi,n ) is denoted as the normal coefficient of restitution (en). Figure 6 shows the normal coefficient of restitution plotted as a function of incident velocity under four conditions. Several observations are immediately apparent. For all conditions, the impact with normal incident velocity lower than the critical capture velocity leads to a final capture (en = 0). For normal incident velocity larger than but close to critical capture velocity, the en ∼ vi,n curves has a steep increase. However, its slope rapidly decreases as normal incident velocity further increases, and the normal coefficient of restitution rapidly decreases with increasing normal incident velocity. This trend is consistent with the results of previous investigation [26]. The normal coefficient of restitution of SiO2 particle shows some difference than that of elastic spheres, especially at higher incident velocities. As can be seen in Figure 6, the maximum normal coefficient of restitution is about 0.85, 0.7, 0.65 and 0.6 for the condition 1, condition 2, condition 3 and condition 4, respectively. In addition, the condition 4 has a lower normal coefficient of restitution value for the same normal incident velocity.
Clearly, carrier gas temperature and impaction surface temperature have greatly influence on collision process with particle and impaction surface. For the experimental result of analysis, the Rogers and Reed model is introduced [21]. For a particle of mass m impacting normally a stationary massive plate with a velocity vi,n, the energy balance is as: . where, QA is the adhesive energy due to the attractive forces between the incoming particle and the surface, Qe is the stored elastic energy, , QA` is the adhesive energy required to separate the particle from the surface, and Qp is the energy loss due to plastic deformation. At increased temperatures, the bond strength in the material decreased. This leads to decreasing the attraction force between molecules and decreasing the surface energy. Furthermore, the particle diameter is 20 μm in present paper, this leads to unchanging incident kinetic energy [28]. In addition, the plastic deformation increases with decreasing the bond strength in the material. Therefore, the condition 4 has a lower rebound kinetic energy and the rebound velocity.
3.2. The Critical Velocity for Particle Capture
The critical velocity vc, is a key parameter for the dynamic impact. Incident velocity below the critical velocity makes the particle be finally captured, leading to particle deposition on walls or formation of particle aggregates. The magnitude of the critical velocity reflects the relative strength of adhesion. The critical velocity increases with increasing adhesion force. Recalling that Figure 6 around the critical velocity has a steep slope, it is shown that the capture occurs for any incident velocity smaller than the critical velocity. However, as incident velocity is slightly larger than critical velocity, this means that a substantial amount of the kinetic energy of the particle is recovered after the rebound. As for the applications such as aerosol filtration and surface deposition, critical velocity is particularly important, since it is usually more concerned whether the particle is captured or not, rather than how much energy is recovered after the impact.
In previous experimental studies on the silver-coated glass particles impacting surfaces with stainless steel, aluminum, Cu and Tedlar was uncertainty increased with decreasing impact velocity and the uncertainty of velocity measurement was about ±10% [23]. In this experiment, the repeated tests were conducted under an incident velocity of less than 1 m/s. However, it is difficult to test experiments with good accuracy in the vicinity of the critical velocity, and only test a range of critical velocity is used. Table 3 shows the variation of the critical velocity under different conditions. “Yes” shows that the particle rebound occurs, and “No” shows that the particle capture occurs in Table 3. The critical velocity is in the range of 0.542–0.546 m/s under condition 1, which increases to a range of 0.829–0.847 m/s under condition 4. The experimental results show that the critical velocity increases with increasing temperature.
4. Theoretical Analysis
In order to explain the experimental results above, a theoretical analysis on the rebound characteristics of SiO2 particles under the four conditions is given in this section. Firstly, the thermophoretic velocity is solved following the thermophoretic force model proposed by Talbot and Cheng [29] and Brock [30]. Secondly, we present the analytical model clarifying the influence of carrier nitrogen temperature and impaction surface temperature on the rebound characteristics of particles.
4.1. Thermophoretic Velocity
Thermophoresis is the term describing the phenomenon wherein small particles, such as soot particles, aerosols or the like, when suspended in a gas in which there exists a temperature gradient ∇T, experience a force in the direction opposite to that of ∇T [29]. The following expression for the thermophoretic force FT on a spherical particle is obtained by Brock [29,30]:
The thermophoretic velocity vt is given by:
With the Knudsen numbers, Kn = λ/R < 1 (the maximum of Kn is 0.104 in this paper), the thermophoretic coefficient Kt can be calculated by the following expression [29,31,32]:
4.2. The Analytical Model of the Coefficient of Restitution
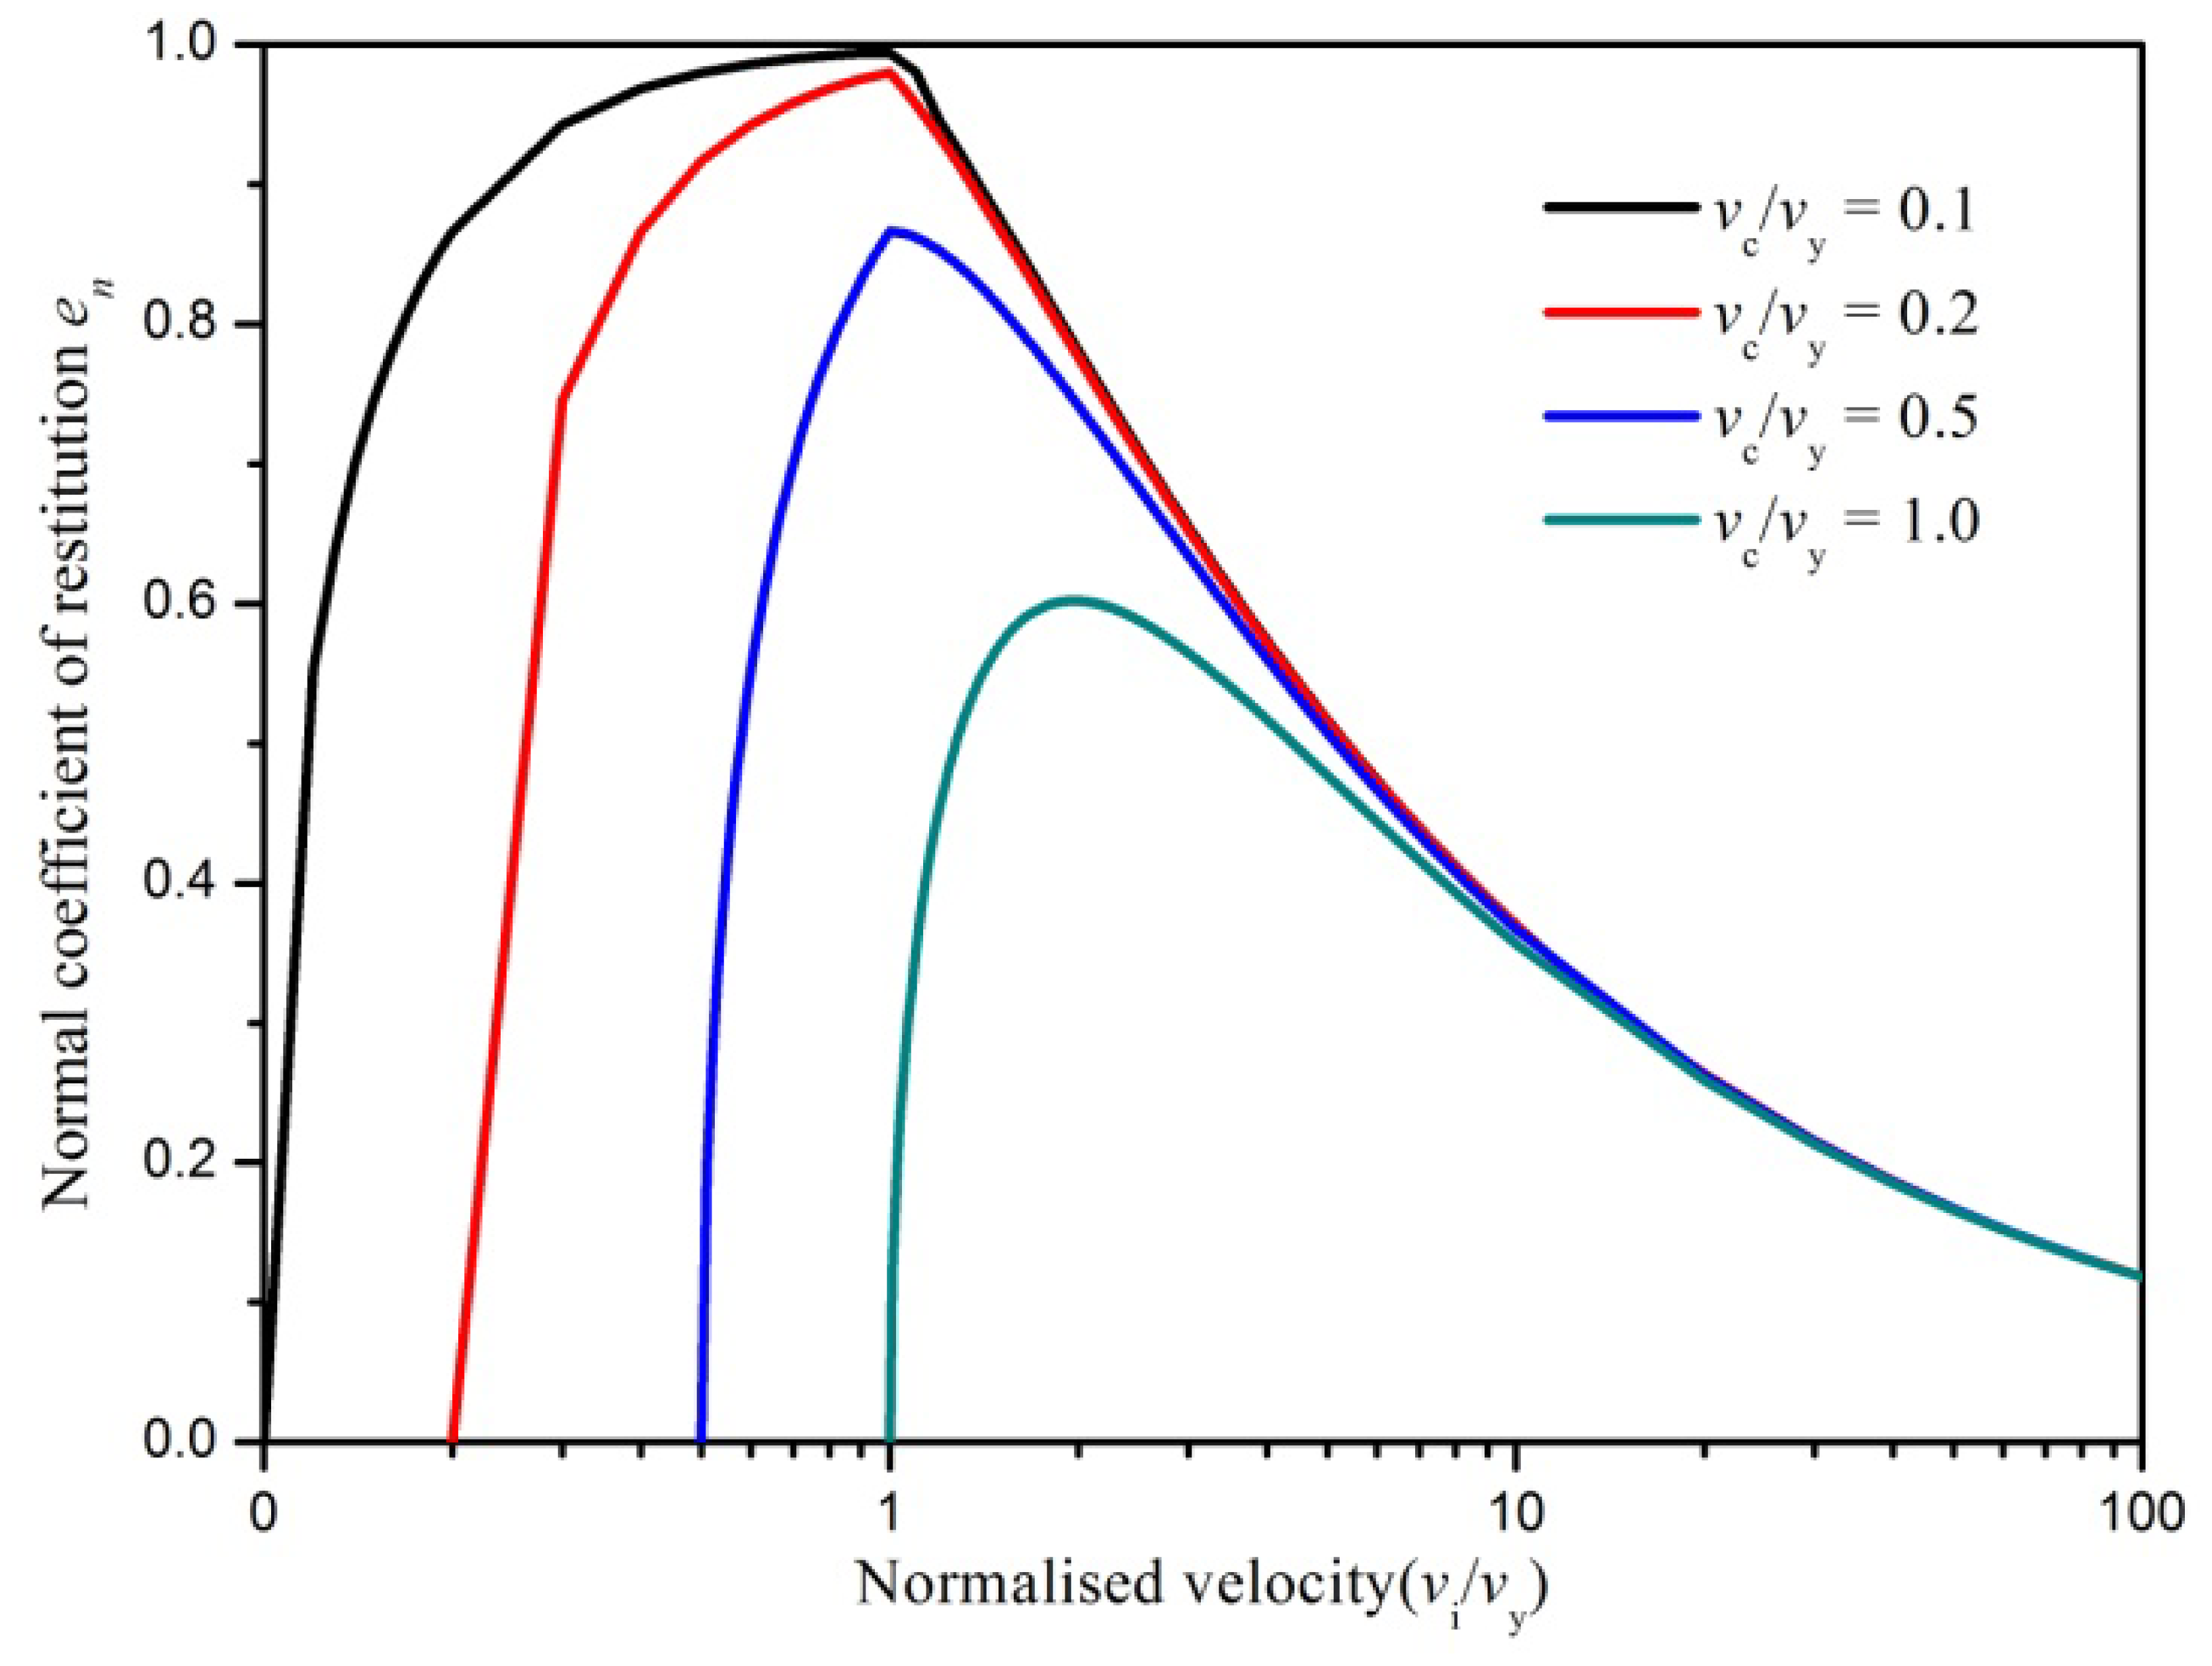
Thomton and Ning [33] derived an analytical model for the coefficient of restitution e which is expressed in terms of the incident particle velocity vi, critical capture velocity vc (here vc = vs) and the yield velocity vy. The model considers the normal impact of elastic-perfectly plastic spheres with interface adhesion. The normal coefficient of restitution en as given by Thornton and Ning is equal to:
The solution to the above equations is illustrated in Figure 7 by plotting the coefficient of restitution against the normalized velocity (vi/vy) for different ratios of (vc/vy). Figure 6 shows that the coefficient of restitution decreases with increasing critical capture velocity for the same material particle. Below the yield velocity, the coefficient of restitution rapidly increases with increasing incident velocity, and above the yield velocity, the coefficient of restitution gradually decreases with increasing incident velocity.
When the SiO2 particles and impaction surface are heated, particle impaction process is affected by elastic-plastic deformation, adhesion force and thermophoretic force. In addition, the difference between carrier nitrogen gas and impaction surface temperature is 50 °C for conditions 2–3, and the thermophoretic force direction always points to the impaction surface regardless of whether an incident or rebound process occurs. Neglecting energy losses due to elastic wave propagation and adhesion force, the only work dissipated in a collision is the work done by the thermophoretic force Wt. Therefore, we may write:
If vi > vt then bounce occurs and we may rewrite Equation (10) as:
Assuming the work dissipated during a collision is the work done in elastic-plastic deformation, adhesion force and thermophoretic force. Therefore, we may write:
When the work dissipated during a collision is the work done in elastic-plastic deformation, adhesion force and thermophoretic force, the critical velocity is:
Substituting ep, ea and et into Equation (13) leads to the following equations in normal experiments: for vi,n ≤ vc:
Equation (15) shows the elastic deformation occurs, adhesion force and thermophoretic force play an important role in vi,n ≤ vc. If the incoming particle's kinetic energy cannot overcome the work done by adhesion force and thermophoretic force, then the particle is adhered.
The vi,n in Equation (16) is partial differential to obtained Equation (18):
Equation (18) is partially differentiated to obtain Equation (19):
Equations (16), (18) and (19) show that the elastic deformation occuring, the adhesion force and the thermophoretic force play an important role in vc < vi,n ≤ vy. The particle's incoming kinetic energy exceeds the work done by the adhesion and thermophoretic force, and the particle rebounds. The coefficient of normal restitution increases with increasing incident velocity. The slope ∂en/∂vi,n tends to infinity for incident velocities near the critical velocity, and the en ∼ vi,n curve has a steep increase. The slope ∂en/∂vi,n rapidly decreases as the normal incident velocity further increases, the en ∼ vi,n curve has a slow increase.
The vt in Equation (16) is partially differentiated to obtain Equation (20):
Equation (17) shows the plastic deformation occurs at the center of the contact surface for the particle impacting surface. The plastic deformation zone at the center of the contact surface gradually expanded with the increasing incident velocity, and the plastic energy loss gradually increases. The plastic deformation plays an important role in vi,n > vy and the en decreases with increasing incident velocity. The Rogers and Reed model was solved for a copper particle of 50 μm diameter hitting a massive steel plate at different impact speeds by Adb-Elhady et al. [25]. The copper particle was chosen to represent the soft fouling particle in gasified biomass and the steel plate to represent the heat exchanger tubes. They analyzed plastic energy loss, the stored elastic energy and the ratio between them at different impact velocities. It can be concluded that the plastic energy loss obviously increases with increasing incident velocity in comparison to the stored elastic energy.
In addition, at increased temperatures, the atoms' vibration amplitude increases, increasing the position between stable atom locations. This leads to decreased bond strength in the material allowing dislocations in the crystal structure to relocate with less force, thus increasing plastic deformation and reducing coefficient of restitution. However, the effect of temperature of materials during a rapid impact is mostly un-documented, especially for micro-particles. The vs in Equation (16) is partial differential to obtained Equation (21):
Based on the foregoing analysis, the critical velocity vc gradually increases with increasing temperature under the four conditions, and the normal coefficient of restitution en decreases with increasing temperature.
5. Conclusions
This paper presented the results from an extensive experimental program to investigate the effect of particle incident velocity, particle temperature and surface impaction temperature on the normal coefficient of restitution, and the ranges of critical velocity under different conditions are predicted. The experimental system was designed to study the normal fine particle impacting with a plane surface at a range from room temperature to 227 °C. The main conclusions are as follows:
The ease of use of the experimental equipment enabled a large number of tests to be conducted.
Experimental results indicate that the impact with normal incident velocity lower than the critical velocity leads to a final capture (en = 0). For normal incident velocity larger than but close to the critical velocity, the en ∼ vi,n curve has a steep increase. However, its slope rapidly decreases as the normal incident velocity increases further, and the normal coefficient of restitution rapidly decreases with increasing normal incident velocity. Clearly, carrier gas temperature and impaction surface temperature have a great influence on the particle-surface collision process.
In this experiment, repeated tests were conducted when the incident velocity is less than 1 m/s. However, it is difficult to test experimentally with a good accuracy in the vicinity of the critical velocity, and only a range of critical velocity was tested. The critical velocity is in the range of 0.542–0.546 m/s under condition 1, which increases to a range of 0.829–0.847 m/s under condition 4. The experimental results show that the critical velocity increases with increasing temperature.
Based on the work of Thomton and Ning [33] who derived an analytical model for the coefficient of restitution e which is expressed in terms of the incident particle velocity vi, critical capture velocity vc and the yield velocity vy, we then present the analytical model clarifying the influence of carrier nitrogen temperature and impaction surface temperature on the rebound properties of particles.
Acknowledgments
The authors acknowledge the support to this work by the National Natural Science Foundation of China (NSFC Grant No. 51006055) and by the Fundamental Research Funds for the Central Universities (No. DUT14QY02).
Ming Dong, Jun Xie, Linying Bai and Sufen Li.
Conflicts of Interest
The authors declare no conflict of interest.
References
- Yong, J.K.; Sang, S.K. Particle size effects on the particle deposition from non-isothermal stagnation point flows. J. Aerosol Sci. 1991, 22, 201–204. [Google Scholar]
- Konstandopoulos, A.G.; Rosner, D.E. Inertial effects on thermophoretic transport of small particles to walls with streamwise curvature-l. Theory. Int. J. Heat Mass Transf. 1995, 38, 2305–2315. [Google Scholar]
- Zhang, Y.Y.; Li, S.Q.; Yan, W.; Yao, Q. Nanoparticle transport and deposition in boundary layer of stagnation-point premixed flames. Powder Technol. 2012, 227, 24–34. [Google Scholar]
- Lokare, S.S.; Dunaway, J.D.; Moulton, D.; Rogers, D.; Tree, D.R.; Baxter, L.L. Investigation of ash deposition rates for a suite of biomass fuels and fuel blends. Energy Fuels 2006, 20, 1008–1014. [Google Scholar]
- Zbogar, A.; Frandsen, F.; Jensen, P.A.; Glarborg, P. Shedding of ash deposition. Prog. Energy Combust. Sci. 2009, 35, 31–56. [Google Scholar]
- Srinivasachar, S.C.; Senior, L.; Helble, J.J.; Moore, J.E. A fundamental approach to the prediction of coal ash deposit formation in combustion systems. Symp. (Int.) Combust. 1992, 24, 1179–1187. [Google Scholar]
- Vuthaluru, H.B.; Wall, T.F. Ash formation and deposition from a Victorian brown coal-modelling and prevention. Fuel Process. Technol. 1998, 53, 215–233. [Google Scholar]
- Raask, E. Mineral Impurities in Coal Combustion; Hemisphere Publishing Company: Washington, DC, USA, 1985; pp. 189–201. [Google Scholar]
- Walsh, P.M.; Sayre, A.N.; Loehden, D.O.; Monroe, L.S.; Beer, J.M.; Sarofim, A.F. Deposition of bituminous coal ash on an isolated heat exchanger tube: Effects of coal properties on deposit growth. Prog. Energy Combust. Sci. 1990, 16, 327–345. [Google Scholar]
- Baxter, L.L. Influence of ash deposit chemistry and structure on physical and transport properties. Fuel Process. Technol. 1998, 56, 81–88. [Google Scholar]
- Beer, J.M.; Sarofim, A.F.; Barta, L.E. Inorganic Transformations and Ash Deposition during Combustion. Proceedings of the Engineering Foundation Conference on Inorganic Transformations and Ash Deposition During Combustion, Palm Coast, FL, USA, 10–15 March 1991; Benson, S.A., Ed.; Published on behalf of the Engineering Foundation by the American Society of Mechanical Engineers: New York, NY, USA, 1992. [Google Scholar]
- Benson, S.A.; Jones, M.L.; Harb, J.N. Fundamentals of Coal Combustion; Smoot, L.D., Ed.; Elsevier Science: New York, NY, USA, 1993; p. 299. [Google Scholar]
- Gibb, W.H. The UK collaborative research programme on slagging pulverized coal-fired boilers: Summary of findings. In Applications of Advanced Technology to Ash-Related Problems in Boilers; Baxter, L., DeSollar, R., Eds.; Plenum Press: New York, NY, USA, 1996; pp. 41–65. [Google Scholar]
- Hass, J.; Tamura, M.; Weber, R. Characterisation of coal blends for pulverized fuel combustion. Fuel 2001, 80, 1317–1323. [Google Scholar]
- Helble, J.J.; Srinivasachar, S.; Boni, A.A. Factors influencing the transformation of mineral matter during pulverized coal combustion. Prog. Energy Combust. Sci. 1990, 4, 267–279. [Google Scholar]
- Hutchings, I.S.; West, S.S.; Williamson, J. An assessment of coal–ash slagging propensity using an entrained flow reactor. In Applications of Advanced Technology to Ash-Related Problems in Boilers; Baxter, L., DeSollar, R., Eds.; Plenum Press: New York, NY, USA, 1996; pp. 201–222. [Google Scholar]
- Manton, N.J.; Williamson, J.; Riley, G.S. Changes in slagging behavior with composition for blended coals. In Impact of Mineral Impurities in Solid Fuel Combustion; Kluwer Academic Publishers: New York, NY, USA, 1999; pp. 297–308. [Google Scholar]
- Dahneke, B. Measurements of the bouncing of small latex spheres. J. Colloid Interface Sci. 1973, 45, 584–590. [Google Scholar]
- Dahneke, B. Further measurements of the bouncing of small latex spheres. J. Colloid Interface Sci. 1975, 51, 58–65. [Google Scholar]
- Dahneke, B. Particle bounce or capture—Search for an adequate theory: I. Conservation-of-energy model for a simple collision process. Aerosol Sci. Technol. 1995, 23, 25–39. [Google Scholar]
- Rogers, L.N.; Reed, J. The adhesion of particles undergoing an elastic-plastic impact with a surface. J. Phys. D Appl. Phys. 1984, 17, 677–689. [Google Scholar]
- Wall, S.; John, W.; Wang, H.-C.; Goren, S.L. Measurements of kinetic energy loss for particles impacting surfaces. Aerosol Sci. Technol. 1990, 12, 926–946. [Google Scholar]
- Dunn, P.F.; Brach, R.M.; Caylor, M.J. Experiments on the low-velocity impact of microspheres with planar surfaces. Aerosol Sci. Technol. 1995, 23, 80–95. [Google Scholar]
- Van Beek, M.C.; Rindt, C.C.M.; Wijers, J.G.; van Steenhoven, A.A. Rebound characteristics for 50-μm particles impacting a powdery deposit. Powder Technol. 2006, 165, 53–64. [Google Scholar]
- Kim, O.V.; Dunn, P.F. Direct visualization and model validation of microsphere impact and surface capture. Aerosol Sci. 2008, 39, 373–375. [Google Scholar]
- Dong, M.; Li, S.F.; Xie, J.; Han, J. Experimental studies on the normal impact of fly ash particles with planar surfaces. Energies 2013, 6, 3245–3262. [Google Scholar]
- Cen, K.F.; Fan, J.R.; Chi, Z.H.; Shen, L.C. Avoiding Principle and Computation of Accumulating Ash, Slagging, Abrasion and Corroding for Boiler and Heat Exchanger; Science Press: Beijing, China, 1994; pp. 1–68. [Google Scholar]
- Singh, P.S.; Narayan, R.L.; Indrani, S.; Hofmann, D.C.; Hofmann, U. Effect of strain rate and temperature on the plastic deformation behavior of a bulk metallic glass composite. Mater. Sci. Eng. A 2012, 534, 476–484. [Google Scholar]
- Talbot, L.; Cheng, R.K.; Schefer, R.W.; Willis, D.R. Thermophoresis of particles in a heated boundary layer. J. Fluid Mech. 1980, 101, 727–758. [Google Scholar]
- Brock, J.R. On the theory of thermal forces acting on aerosol particles. J. Colloid Sci. 1962, 17, 768–780. [Google Scholar]
- Romay, F.J.; Takagaki, S.S.; David, Y.H.; Pui, Y.H.; Liu, Y.H. Thermophoretic deposition of aerosol particles in turbulent pipe flow. J. Aerosol Sci. 1998, 29, 943–959. [Google Scholar]
- Batchelor, G.K.; Shen, C. Thermophoretic deposition of deposition of particles in gas flowing over cold surface. J. Colloid Interface Sci. 1985, 107, 21–37. [Google Scholar]
- Thomton, C.; Ning, Z.M. A theoretical model for the stick bounce behaviour of adhesive, elastic-plastic spheres. Powder Technol. 1998, 99, 154–162. [Google Scholar]
- Johnson, K.L. Theoretical and Applied Mechanics; Koiter, W.T., Ed.; North-Holland: Amsterdam, The Netherlands, 1976; pp. 133–134. [Google Scholar]


| Component | Bituminous | Anthracite | Lignite |
|---|---|---|---|
| SiO2(wt%) | 30–65 | 45–49 | 20–60 |
| Al2O3(wt%) | 15–40 | 20–27 | 10–30 |
| Fe2O3(wt%) | 5–35 | 11–12 | 10–30 |
| CaO(wt%) | 3–20 | 2–8 | 5–40 |
| MgO(wt%) | 0–5 | 1–3 | 0–10 |
| Na2O · K2O(wt%) | 0–5 | 1–6 | 0–15 |
| Condition number | Tg (°C) | TW (°C) |
|---|---|---|
| 1 | 20 | 20 |
| 2 | 150 | 100 |
| 3 | 170 | 120 |
| 4 | 190 | 140 |
| Condition 1 | Condition 2 | Condition 3 | Condition 4 | ||||
|---|---|---|---|---|---|---|---|
| vi,n (m/s) | (Yes/No) | vi,n (m/s) | (Yes/No) | vi,n (m/s) | (Yes/No) | vi,n (m/s) | (Yes/No) |
| 0.487 | No | 0.478 | No | 0.645 | No | 0.671 | No |
| 0.493 | No | 0.668 | No | 0.702 | No | 0.715 | No |
| 0.542 | No | 0.676 | Yes | 0.749 | No | 0.829 | No |
| 0.546 | Yes | 0.715 | Yes | 0.757 | Yes | 0.847 | Yes |
| 0.552 | Yes | 0.809 | Yes | 0.835 | Yes | 0.869 | Yes |
| 0.596 | Yes | 0.89 | Yes | 0.895 | Yes | 0.9 | Yes |
| Condition | Condition 2 | Condition 3 | Condition 4 |
|---|---|---|---|
| Nitrogen temperature °C | 150 | 170 | 190 |
| Impaction surface temperature °C | 100 | 120 | 140 |
| Thermophoreitc velocity vt m/s | 0.0182 | 0.0184 | 0.0187 |
© 2014 by the authors; licensee MDPI, Basel, Switzerland. This article is an open access article distributed under the terms and conditions of the Creative Commons Attribution license ( http://creativecommons.org/licenses/by/3.0/).
Share and Cite
Dong, M.; Xie, J.; Bai, L.; Li, S. An Experimental Investigation on the Influence of Temperature on the Normal Impact of Fine Particles with a Plane Surface. Energies 2014, 7, 2079-2094. https://doi.org/10.3390/en7042079
Dong M, Xie J, Bai L, Li S. An Experimental Investigation on the Influence of Temperature on the Normal Impact of Fine Particles with a Plane Surface. Energies. 2014; 7(4):2079-2094. https://doi.org/10.3390/en7042079
Chicago/Turabian StyleDong, Ming, Jun Xie, Linying Bai, and Sufen Li. 2014. "An Experimental Investigation on the Influence of Temperature on the Normal Impact of Fine Particles with a Plane Surface" Energies 7, no. 4: 2079-2094. https://doi.org/10.3390/en7042079