Window Material Daylighting Performance Assessment Algorithm: Comparing Radiosity and Split-Flux Methods

Abstract
: Windows are the primary aperture to introduce solar radiation to the interior space of a building. This experiment explores the use of EnergyPlus software for analyzing the illuminance level on the floor of a room with reference to its distance from the window. For this experiment, a double clear glass window has been used. The preliminary modelling in EnergyPlus showed a consistent result with the experimentally monitored data in real time. EnergyPlus has two mainly used daylighting algorithms: DElight method employing radiosity technique and Detailed method employing split-flux technique. Further analysis for illuminance using DElight and Detailed methods showed significant difference in the results. Finally, we compared the algorithms of the two analysis methods in EnergyPlus.1. Introduction
1.1. Research Background and Purpose
Energy consumption by buildings accounts for 25% of the energy use in entire Korea, and the ratio is increasing [1]. Accordingly, methods to save energy consumption by buildings are important issues. Since 2002, the Ministry of Construction and Transportation and the Ministry of Environment in Korea have implemented Green Building Certification System and Building Energy Efficiency Rating system as a means to reduce energy consumption by buildings.
Due to the recent increase of the window area ratio in buildings, a great amount of solar radiation is introduced into the interior space of a building. As the time working indoors has also increased, studies are continuously conducted on interior space visual environment and reduction of artificial lighting energy [2]. For a comfortable interior environment, uniform illuminance in the interior space should be ensured, and energy consumption should be reduced through appropriate lighting control. Koshel emphasized the significance of the illumination evaluating technology in the visual comfort of occupants and lighting energy in buildings [3]. Since windows have significant effects on heating, cooling and lighting energy in buildings, the proper prediction of the illuminance levels through window materials can be an essential factor for the building energy saving through windows. Nakamura investigated the estimation method for the discomfort glare assessment through the window over the wide range of different source sizes [4]. Koshel [5] investigated the subjective illumination recognition by the human eye, having significant effects on the item sale and productivity of indoor occupants. It highlighted the significance of the subjective criterion on the development of an illumination system. Dong et al. [6] applied the simulation technique to design the LED lighting with the uniform irradiance for the proper optical design. Audenaert et al. [7] performed the parametric study to assess the impact of important input parameters on the accuracy of the ray tracing simulation results such as the bidirectional reflectance distribution function (BRDF). Luminous intensity distribution (LID) was simulated, which was validated against the measured data with a near-field goniophotometer. Although a good agreement between the measured and simulated LID was found, the luminance distributions only corresponded when the most accurate BRDF model was applied, indicating that more complex models are needed for evaluation of luminance distributions [7].
More importantly, taking advantage of the daylighting for the improved visual comfort and the lighting energy efficiency has received increasing attentions during the past decades. Currently, many interior illuminance analysis software programs are available for the analysis of solar radiation through windows, but they employ different algorithms. The solar radiation analysis algorithms that are most frequently used are the radiosity technique, split-flux technique and ray-tracing method. Since interior illuminance analysis has a great effect on the control of artificial lightings, it may be viewed to be related with the energy consumption of an entire building. Tsangrassoulis et al. [8] performed the comparative study between radiosity and ray-tracing methods in terms of the daylight levels in atria under a variety of conditions. Hviid [9] suggested the combined approach between radiosity and ray-tracing techniques to develop a simple but accurate tool for the proper prediction of indoor daylight level. The coupled approach was compared against the ray-tracing program and showed that the accuracy of the approach was adequate for predicting the energy implications of photo-responsive lighting control. Chan et al. [10] also presented the couple radiosity and ray-tracing methods for the proper daylight analysis in spaces with venetian blind compared to the full radiosity technique. According to the study, it was found that analysis of the number of inter-reflections as a function of profile and slat angles with simultaneous consideration of different reflectances and shining factors is particularly important for providing guidelines and recommendations for venetian blinds optimized design and control. Versage et al. [11] also compared the split-flux and ray-tracing algorithms and found that split-flux method provided illuminance higher than actual as the distance from windows was increased. Other studies also performed the daylight level evaluation based on different algorithms such as radiosity [12], stand-alone model [13] and ray-tracing method [14]. The study [12] performed the interior illuminance evaluation using radiosity method, while the study [13] developed the stand-alone model to predict the daylight performance and validated the model against the experimental data and the simulation results obtained from radiosity and ray-tracing methods. Andersen et al. [14] attempted to validate the ray-tracing algorithm against the experiment in spaces on prismatic glazing. According to the study, ray-tracing and experimental results matched well with each other, indicating that it can promote confidence in both the photogoniometer and in the calculation method.
As shown in the literature review above, there have been a variety of studies related to the different daylight prediction algorithm in buildings. In summary, although ray tracing method has advantages over the other two algorithms in that it can simulate the physical performance of light rays and the material spectral properties for any complicated blind and window systems [11], it requires relatively great amounts of computational time and thus it might be significantly unfeasible to feed the hourly daylight levels into the existing integrated thermal simulation programs capable of calculating energy demand and the indoor environment. On the other hand, split-flux and radiosity methods are mainly adopted in most of the dynamic building energy simulation softwares due to their capabilities to be directly coupled with the dynamic simulation softwares and shorter computational time. Nevertheless, the split-flux and radiosity methods have not been sufficiently compared to each other by the existing studies. In this circumstance, those two illuminance analysis algorithms should be analyzed and compared to each other in detail.
The objective of this study is to investigate the differences in the analytical data between those two algorithms and their causes using EnergyPlus software program, which is under development by the U.S. Department of Energy and considered to be the next-generation building energy analysis simulation software. A sensitivity analysis was also carried out to evaluate the effects of different time periods and blind angles. The description of the full key equations of those two algorithms provided a detailed understanding of the mechanism that takes place around the windows and blinds. The simulation results were also compared against the experimental data.
1.2. Methods and Scope
In this study, modeling was performed with a laboratory in “K” institute, located in Gyeonggi-do, Korea, where experiments are actually carried out, the validity of the modeling was verified through a calibration with the actual building, and two illuminance analysis algorithms within the EnergyPlus software were analyzed to investigate the differences between them and their analytical limitations.
2. Overview of Laboratory Measurement
The laboratory building in this study is located in the K institute, Gyeonggi-do, Korea, and has windows on the southern side. The size of the laboratory is 2.22 m (W) × 4.1 m (D) × 3.18 m (H). Figure 1 shows the measurement overview. The window made of double clear glass in PVC frame is of size 1.87 m × 2.31 m. The clear glass panes in the window are 6 mm each with 12 mm air between the glass panes. Table 1 shows the physical properties of the 6 mm clear glass panel used in the experiment. The U-value of the window is 2.692 W/m2·°C, and the SHGC is 0.801. Both temperature and illuminance levels were used for the validation of the simulation results. For the temperature measurement, a T-type thermocouple (T/C) was used to measure the surface temperature on the inside and outside of the window, the air temperature at the center of the experimented room, and the floor temperature in the center. The error range of the used thermocouple was ±1 K. For the illuminance measurement, six Li-210A sensors from LI-COR company were placed 35 cm progressively away from the window without any blind at window level and illumination was measured at these points. The sensors are marked 1–6, 1 being closest to the window and 6 being furthest. The error factor for the sensor is ±5% [15]. Data logger from the same company LI-1400 was used to record the illuminance data.
3. Overview and Theoretical Background of the Simulation
3.1. Selected Simulation Software
The simulation software chosen for this study is EnergyPlus ver. 6.0 which allows for energy analysis in unsteady state [16]. EnergyPlus was developed by the U.S. Department of Energy by integrating the advantages of two conventional software programs (DOE-2 and BLAST). EnergyPlus adopted the heat balance method recommended by American Society of Heating Refrigerating and Air Conditioning Engineers (ASHRAE) for building load analysis [17]. The illuminance analysis options contained in EnergyPlus are DElight based on the Radiosity technique, and Detailed based on the Split-flux technique [18].
3.2. Simulation Modeling
The EnergyPlus simulation model was constructed to be the same with the laboratory, as noted in Section 2.1, in which experiments were actually carried out. All the physical property inputs were the same with those of the actual laboratory. The overall wall reflectance used is 0.5. No extra air conditioning control is used and there are no obstructions, neither inside nor outside. Since Seoul is located near Gyeonggi-do, the weather data of Seoul generated from Meteonorm software was used for both validation process and further analysis in the later sub-sections [19]. Meteonorm extrapolates hourly data from statistical data for a location. Where statistical data aren't available, Meteonorm interpolates from other nearby sites [19]. Since the solar radiation is critical in this study, global horizontal, direct normal and diffuse horizontal radiations are respectively measured and plugged-in into the weather data. On 9 August 2013 (Figure 2), the global horizontal radiation, direct normal radiation and diffuse radiation were 480 W, 11 W and 469 W, respectively.
3.3. Analysis of the Split-Flux Algorithm
The EnergyPlus “Detailed” method is the illuminance analysis based on the splix-flux algorithm and used by DOE-2.1 software [20,21]. As the software was converted to EnergyPlus, two major modifications were made into the equation. First, the sky conditions were classified into two types, Clear and Overcast, in DOE-2, but they are classified in EnergyPlus into four types which are Clear, Clear turbid, Intermediate, and Overcast. Second, twenty solar positions were preset in DOE-2, but in EnergyPlus the daylight factor is calculated on the basis of the solar position and direction information at each hour provided from the input time-dependent meteorological data [18]. The split-flux algorithm uses the mean of the entire wall brightness with respect to the reflection by the interior walls and other objects [18]. Hence, the walls on both sides of the window should be darkened as the distance from the window increases. However, since the luminance is higher at the point closer to the window, the mean illuminance is increased, and thus the difference from the actual measurements is increased as the point goes farther from the window. The equation to calculate direct solar radiation through a window at the measurement point is as follows. The entire window is divided into fine elements, and the radiation at a point is calculated as the sum of the radiation coming through each of the elements. The equation for the calculation of the direct solar radiation is very elaborate [18,21].
dEh = Horizontal illuminance at reference point from window element;
LW = Luminance of a window element as seen from reference point;
dΩ = Solid angle subtended by window element;
R⃗win = Vector from zone origin to window element;
dx,dy = Size of window element;
R⃗ref = Vector from zone origin to reference point;
D = Distance from reference point to window element;
B = Angle between window element's outward normal and ray from reference point to window element;
R⃗ray = Unit vector from reference point to window element;
γ = Angle between point in the sky and the sun; or angle between vertical and ray from reference point to window element;
Ŵn = Unit vector normal to window element, pointing away from zone;
Ŵ21 = Unit vector along window y-axis;
Ŵ23 = Unit vector along window x-axis.
In the equation, Lw denotes luminance without installed rolled blinds. Luminance with installed rolled blinds, denoted as Lw·sh, is expressed in the same equation [21]:
L = Luminance of sky or obstruction;
τvis = Glass visible transmittance;
Lw·sh = Luminance of window element with shade in place.
Except direct solar radiation, diffused solar radiation coming to the points by being reflected to the interior walls are divided into two types according to the ways the light passes through the window: the radiation passing through the area over the window center and being reflected by the ceiling area and the upper parts of the walls, and the radiation passing through the area under the window center and being reflected by the ground and the lower parts of the walls. The equation for the diffuse radiation reflected by the interior walls is as follows [18,22,23]. ΦCW, ρCW, ΦFW and ρFW in the following equation may be varied depending on the installation of rolled blinds and other parameters, and thus they are mentioned in the overall equation and will be discussed deeply in future studies [18,21]:
F1 = First-reflected flux;
ΦFW = Downgoing luminous flux from a window;
ρFW = Area-weighted reflectance of floor and upper part of walls;
ΦCW = Upgoing luminous flux from a window;
ρCW = Area-weighted reflectance of ceiling and upper part of walls;
A = Total inside surface area of a zone;
Er = Average internally-reflected illuminance;
ρ = Area-weighted average reflectance of zone interior surfaces.
3.4. Analysis of the Radiosity Algorithm
In contrast to the Detailed method, the DElight method provides the illuminance results similar to actual measurements. The equation for the direct solar radiation at the measurement/reference point is very similar to that of the Detailed method [18]. The difference with the Detailed method is in the radiosity algorithm used by the DElight method for calculation of diffuse radiation reflected by interior walls. The DElight method calculates diffuse radiation in three steps. The first step is a pre-calculation of luminance distribution on external surfaces, the second step is the calculation of luminance distribution on internal surfaces and the third step is related with the direct and diffuse solar radiation that reaches the measurement/reference points. The DElight equation for the calculation of direct solar radiation is not discussed in this article because it is very similar to the DElight equation. In the DElight method, fine grids are created in all the areas, and the data from each grid is summed by the following radiosity equation [18,24]:
e(x) = emitted radiosity at x;
b(x) = total radiosity at x;
ρ(x) = diffuse reflectance function;
r = distance between x and x′;
v = visibility function;
Fij = purely geometric coefficients form factor.
Three methods are used to derive Fij in the radiosity method: area-to-area, point-to-point, and area-to-point. The most general method is the area-to-area method. The point-to-point is occasionally used to simplify complicated equations to calculate areas. If two areas are too close to each other in the area-to-area method, the area-to-point method is used [18,24]:
vij = measures the visibility between the two patches;
n̂j = surface normal at that point;
r_ijk = vector from the point of interest on the receiving patch to vertex k of the source patch;
θk,k+1 = angle subtended by vertices k and k + 1 from that point in radians.
4. Validation of the Simulation Model
For the validation of the simulation model, the model was analyzed and compared with the actual measurements. Figure 3 shows the actual measurements and the simulated values of the air temperature at the center of the room over the day for which highest temperature was recorded during the entire experiment period. The mean bias error (MBE) of the actual measurement is 0.21% which is within the 10% error range [25]. The CV (RMSE) was 11.3, which was also within the error rate of 30, indicating that the model was well simulated [25]. Figure 2 shows the actual measurements and the simulated values of the illuminance levels at different points of the interior space over one day. We can see that the illumination level is decreasing as the sensor points move away from the window. It is shown that the result from DElight simulation (radiosity method) is very similar to the experimental data, i.e., there is visible deviation at point 6 only. However, the Detailed analysis (split-flux method) result is much greater than the experimental data. The study shows that at first sensor, sensor #1 at 35 cm away from window, the error between simulation result and real data is only 1% for DElight method and 4% error for Detailed method; whereas at sensor #6 at 210 cm away from the window, the error is much greater. Detailed result shows a much higher error than DElight result as the sensor points move away from the window. We analyzed that this difference is due to the algorithms used for the two methods, which will be discussed in the subsequent sub-sections later in this paper.
5. Simulation Analysis
Figures 4 and 5 compare the variation of the interior illuminance depending on the distance from the window on the summer solstice (22 June 2013) and winter solstice (22 December 2013), respectively, analyzed by using DElight and Detailed. Three different time sets were included: 9 am, 1 pm and 5 pm. Detailed_9, DElight_13 and DElight_17 indicate the results of Detailed method at 9 am, DElight method at 1 pm and DElight method at 5 pm, respectively. 42 reference points are identified in the simulation model which are 5 cm apart, for illuminance calculation. In the case of the summer solstice, all the results by the Detailed method were higher than those by the DElight method. The illuminance value by the Detailed method in the area close to the window was higher than the value by the DElight method by 50∼60 lux. The difference was increased as the distance from the window was increased, and the maximum difference was 124 lux.
The illuminance values on the winter solstice were considerably higher than the summer solstice because the angle of solar incidence was greater in winter than in summer and thus the illuminance introduced to the interior space of the building facing south was greater. In addition, in contrast to the summer solstice, the illuminance difference between the two algorithms on the winter solstice was about 4000 lux in the area close to the window, and it was decreased as the distance from the window was increased. The smallest difference between the two algorithms was 1300 lux on the point farthest from the window.
Regarding the comparison between split-flux and radiosity algorithms in terms of computation of the diffuse solar radiation, fine grids are created on the interior wall and the brightness at each point was computed in case of the DElight algorithm. Therefore, the resulting illuminance pattern is very similar to the actual measurement as can be seen in Figure 2. On the other hand, the Detailed algorithm (split-flux method) calculates the diffuse solar radiation based on the mean value averaged over the entire wall and thus there is no horizontal variations in the diffuse illuminance regardless of the distance from the window. The difference between the values by the Detailed and the DElight algorithms was not great on the summer solstice when the solar altitude angle was large and thus the solar radiation did not enter deep inside the interior space. In the case of winter solstice, the solar altitude angle was small, and thus the solar radiation entered deep inside the interior space, and the entire room became bright. Interestingly, the values by the Detailed algorithm calculating the mean wall brightness were even higher than the values by the DElight algorithm calculating illuminance at each point. Due to this drawback in the split-flux algorithm used in the Detailed method as well as in DElight V1.0, the algorithm was modified to the radiosity algorithm for DElight V2.0 [26].
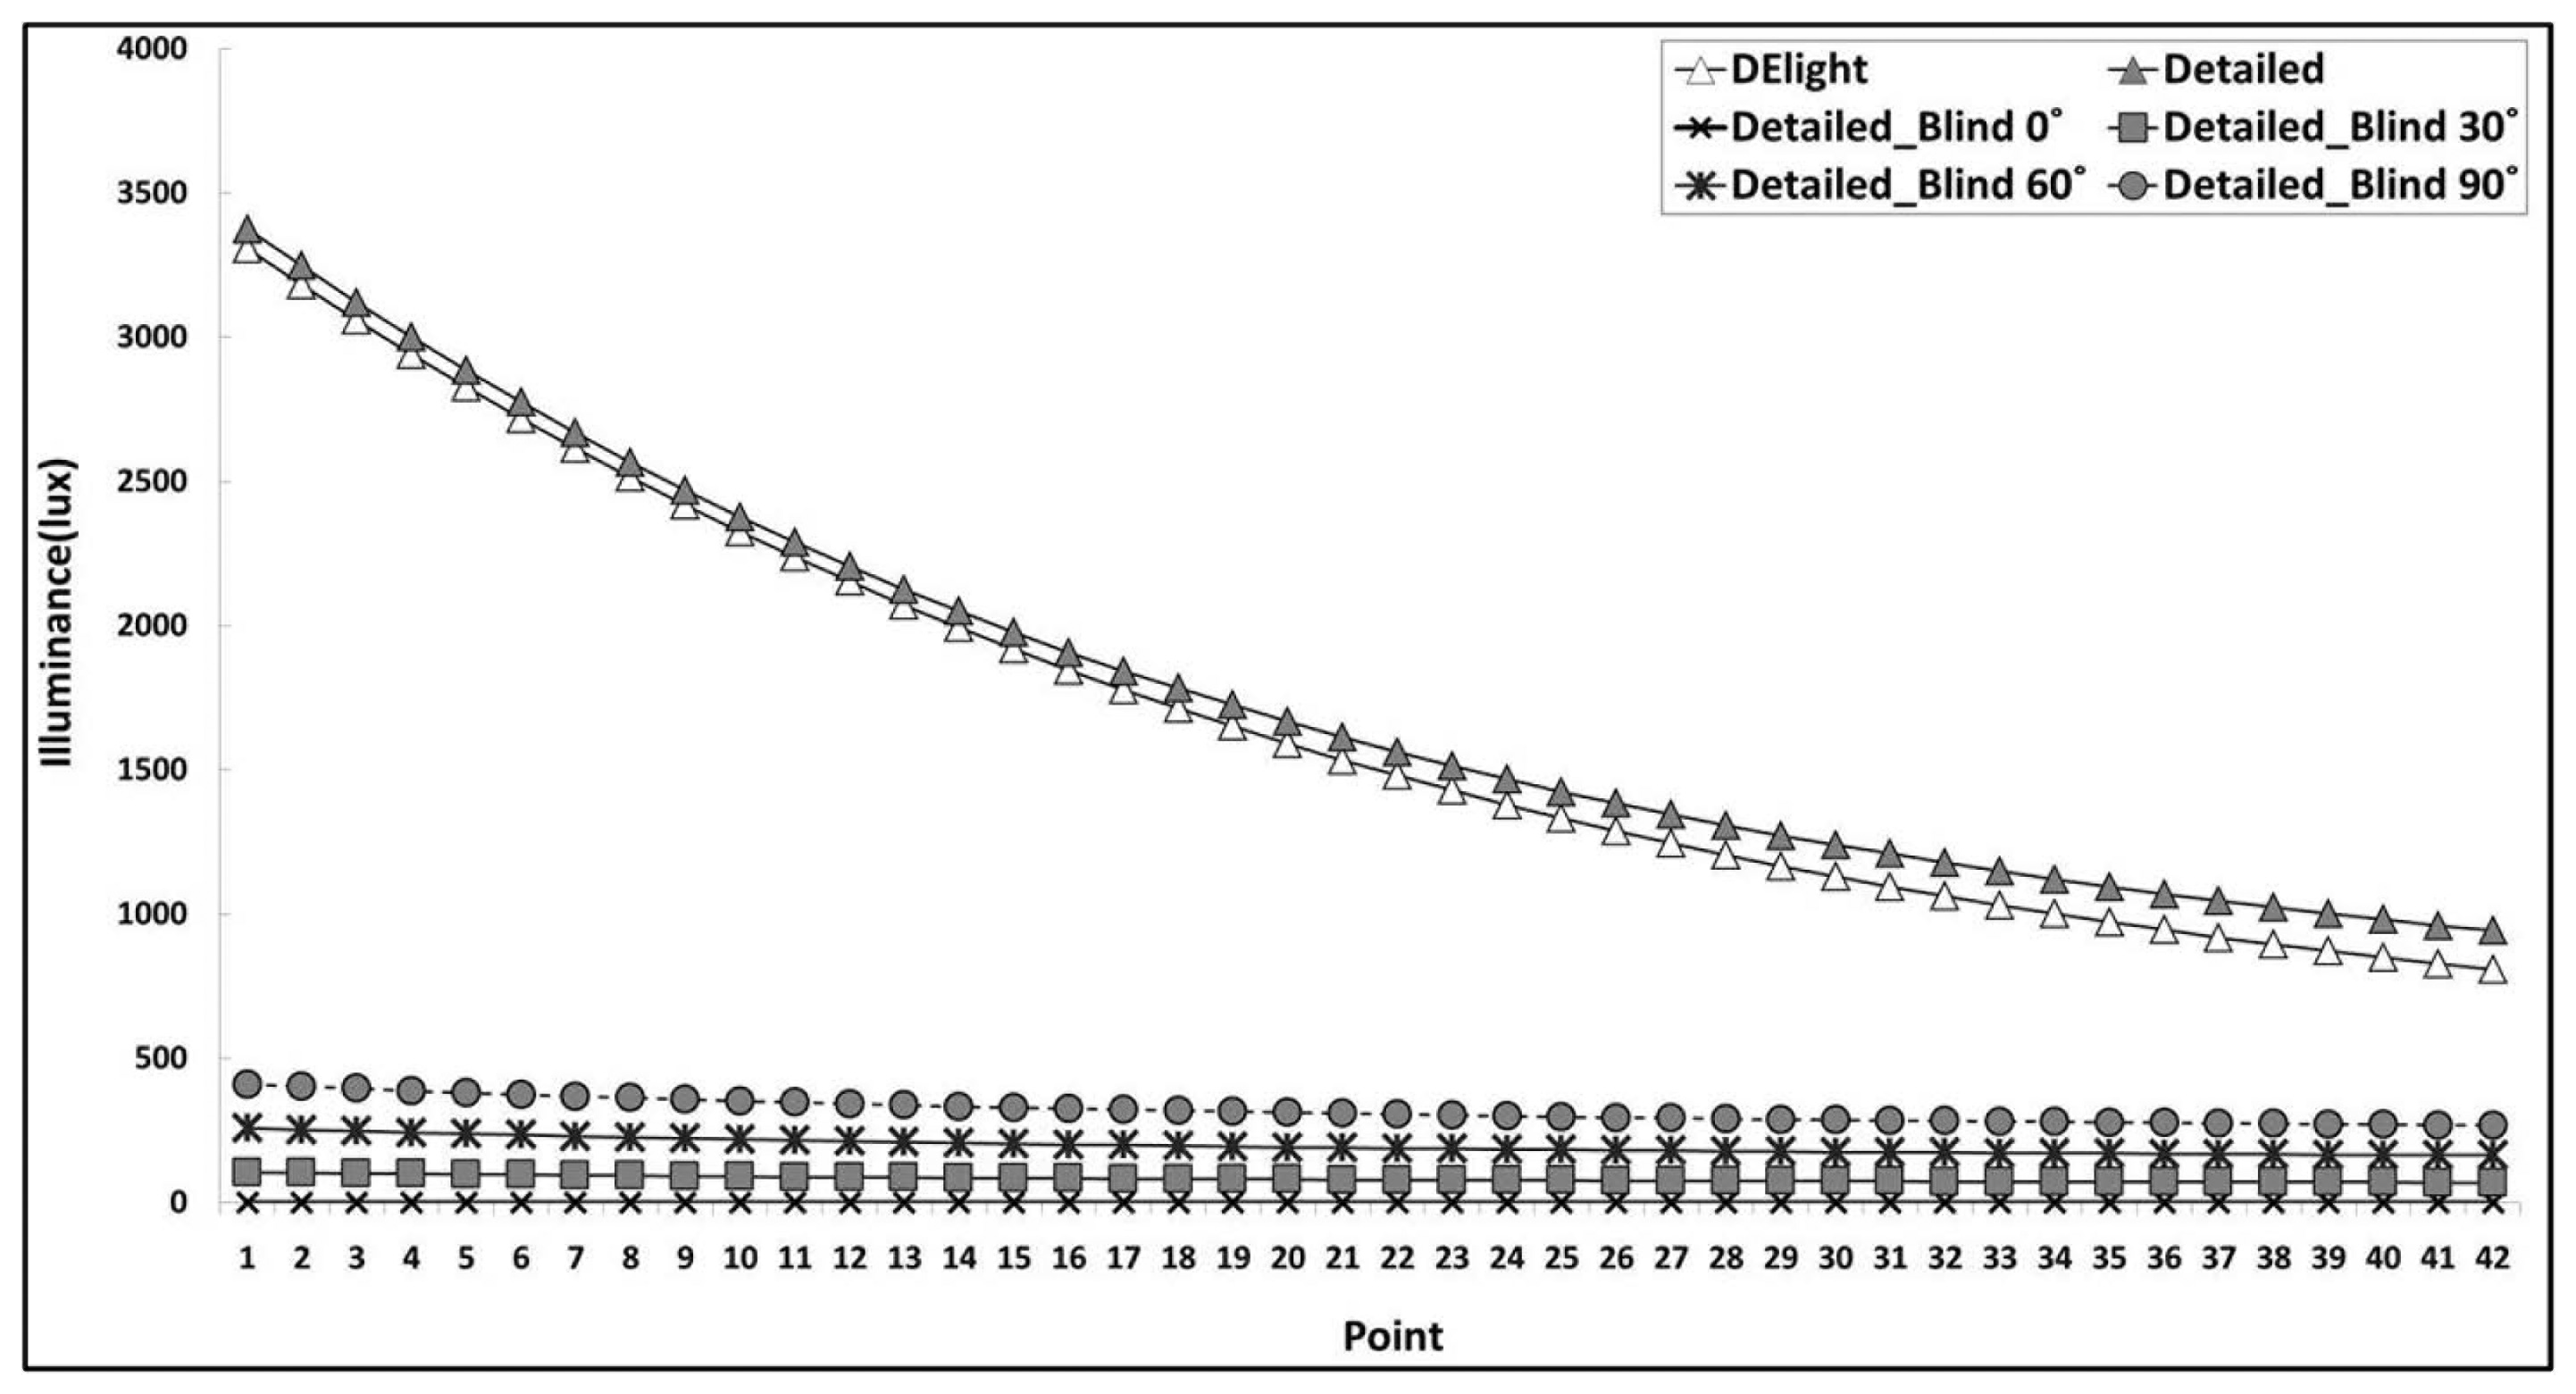
Figures 6 and 7 compares the two algorithms on the representative days in summer and winter depending on angle of installation of roller blinds. The input blind specifications are shown in Table 2. In the case of the Detailed method, on summer solstice, the illuminance difference between the six cases varied between 675 and 2900 lux depending on angle of installation of roller blinds. The variation was between 15,000 and 19,000 lux on winter solstice. The illuminance value without roller blinds was about two times greater than that with installed roller blinds in winter, and was about seven times in summer. In the case of DElight, the variation of the interior illuminance as well as the light energy depending on the installation of roller blinds could not be analyzed because it lacked the function to analyze the dynamic effect of the blinds installation. Although the radiosity algorithm provides the illuminance distribution results very similar to the actual experimental results, it is not useful for comparing the illuminance distribution depending on installation of roller blinds since it does not support dynamic control of roller blinds during subsequent time-step calculations [17,18,20].
6. Conclusions
In this article, a laboratory in which experiments were actually carried out was simulated with the EnergyPlus simulation model, and the two illuminance analysis algorithms contained in EnergyPlus were analyzed and compared. The following conclusions were drawn:
When the illuminance analysis was performed with DElight (Radiosity) and Detailed (Split-flux), the illuminance at the points near to the windows was similar on the summer solstice, but the illuminance value obtained by the Split-flux algorithm was significantly increased as the distance from the window was increased. In contrast to the summer solstice, the difference was great at the points close to the window on the winter solstice, and the difference was decreased as the distance from the window was increased. This might have been because of the difference in the solar altitude angle depending on seasons. Due to the difference in the illuminance analysis techniques, their application to light control may have a significant effect on the light energy consumption. The result indicated that installation of rolled blinds caused difference in the interior illuminance from two to the maximum seven times. No result was obtained from the DElight algorithm which did not allow analysis of installation of rolled blinds, which means that the analysis by the DElight algorithm should be limited to simple windows. In the DElight, neither the rolled blinds installation nor glare can be analyzed, but glare analysis was not included in this study.
The Detailed illuminance analysis method employs the split-flux method. As the software was converted to EnergyPlus software, more detailed analysis could be possible, but the diffuse solar radiation, calculated in the algorithm as the mean value of the entire wall, was different from the actual illuminance value. The Detailed algorithm provides the advantage that it can analyze not only simple windows but also other types of windows, because it includes algorithms for rolled blinds application and glare analysis.
The DElight illuminance analysis algorithm is not different from the Detailed with respect to direct solar radiation, but it applies the radiosity method for the analysis of diffuse solar radiation. In contrast to the Detailed algorithm (Split-flux) that calculates diffuse illuminance through the mean brightness of walls, the DElight (Radiosity) algorithm provides a diffuse illuminance pattern which is very similar to the actual measurement because it creates numerous grids and calculates brightness at each cross point with complex equations. However, due to the complexity of the equations even for simple windows, the DElight algorithm has the limitation that it is unable to perform dynamic analysis of rolled blinds and other shading devices.
In conclusion, the DElight algorithm (Radiosity) should be used for the simple windows without shading devices due to the better accuracy, while Detailed algorithm (Split-flux) is desirable for the windows with blind installations due to its capability to consider complex shading devices. More importantly, an additional analytical algorithm is required combining the best features of those two existing algorithms, which needs be performed in future studies.
Acknowledgments
This research was supported by Basic Science Research Program through the National Research Foundation of Korea (NRF) funded by the Ministry of Science, ICT & Future Planning (2012R1A1A1003730). For the help with data analysis, the authors would like to thank Rashmi Manandhar, Graduate Student Researcher at Hanbat National University.
Conflicts of Interest
The authors declare no conflict of interest.
References
- Energy Statistics Yearbook; Korea Energy Economics Institute: Eiwang, Gyeonggi-do, Korea, 2010.
- Song, K.-D.; Kim, M.-S.; Kim, J.-H. Analyzing Shading Characteristics of Venetian Blinds Using the RADIANCE Program. Proceedings of the Korea Institute of Ecological Architecture and Engineering Conference, Tokyo, Japan, 12–15 September 2005.
- Koshel, R.J. Illumination engineering. Opt. Eng. 2004, 43, 1478–1479. [Google Scholar]
- Nakamura, Y. Method of Discomfort Glare Estimation Applicable to a wide range of source sizes—Glare estimation system based on luminance image. Light Eng. 2008, 16, 84–88. [Google Scholar]
- Koshel, R.J. Lit Appearance Modeling of Illumination Systems. Proceedings of the 5th Conference on Novel Optical Systems Design and Optimization, SPIE 4768, Seattle, WA, USA, 9 July 2002; pp. 65–73.
- Dong, J.-T.; Lu, R.-S.; Shi, Y.-Q.; Xia, R.-X.; Li, Q.; Xu, Y. Optical design of color light-emitting diode ring light for machine vision inspection. Opt. Eng. 2011, 50, 043001:1–043001:11. [Google Scholar]
- Audenaert, J.; Leloup, F.B.; van Giel, B.; Durinck, G.; Deconinck, G.; Hanselaer, P. Impact of the accurateness of bidirectional reflectance distribution function data on the intensity and luminance distributions of a light-emitting diode mixing chamber as obtained by simulations. Opt. Eng. 2013, 52. [Google Scholar] [CrossRef]
- Tsangrassoulis, A.; Bourdakis, V. Comparison of radiosity and ray-tracing techniques with a practical design procedure for the prediction of daylight levels in atria. Renew. Energy 2003, 28, 2157–2162. [Google Scholar]
- Hviid, C.A.; Nielsen, T.R.; Svendsen, S. Simple tool to evaluate the impact of daylight on building energy consumption. Sol. Energy 2008, 82, 787–798. [Google Scholar]
- Chan, Y.C.; Tzempelikos, A. A hybrid ray-tracing and radiosity method for calculating radiation transport and illuminance distribution in spaces with venetian blinds. Sol. Energy 2012, 86, 3109–3124. [Google Scholar]
- Versage, R.; Melo, A.P.; Lamberts, R. Impact of Different Daylighting Simulation Results on the Prediction of Total Energy Consumption. Proceedings of the SimBuild 2010 Conference, New York, NY, USA, 11–13 August 2010; pp. 1–7.
- Robinson, D.; Stone, A. Internal illumination prediction based on a simplified radiosity algorithm. Sol. Energy 2006, 80, 260–267. [Google Scholar]
- Tsangrassoulis, A.; Santamouris, M.; Asimakopoulos, D. Theoretical and experimental analysis of daylight performance for various shading systems. Energy Build. 1996, 24, 223–230. [Google Scholar]
- Andersen, M.; Rubin, M.; Scartezzini, J.L. Comparison between ray-tracing simulations and bi-directional transmission measurements on prismatic glazing. Sol. Energy 2003, 74, 157–173. [Google Scholar]
- Jeong, W.R. Visual Environment Assessment of Office Space Daylighted by Transparent BIPV Window System. Master's Thesis, Hanbat National University, Daejeon, Korea, 2013. [Google Scholar]
- The U. S. DOE. EnergyPlus Input Output Reference: The Encyclopedic Reference to EnergyPlus Input and Output. Available online: http://apps1.eere.energy.gov/buildings/energyplus/pdfs/inputoutputreference.pdf (accessed on 29 October 2013).
- Winkelmann, F. Modeling Windows in EnergyPlus, Building Simulation 2011. Proceedings of the 7th International IBPSA Conference, Rio de Janeiro, Brazil, 13–15 August 2001.
- The U.S. DOE. Energyplus Engineering Reference; Daylighting and Window Calculations. Available online: http://apps1.eere.energy.gov/buildings/energyplus/pdfs/engineeringreference.pdf (accessed on 29 October 2013).
- The U.S. DOE. Tips & Tricks for Using EnergyPlus; Insider Secrets to Using EnergyPlus. Available online: http://apps1.eere.energy.gov/buildings/energyplus/pdfs/tips_and_tricks_using_energyplus.pdf (accessed on 28 February 2014).
- Winkelmann, F.C.; Selkowitz, S. Daylighting simulation in the DOE-2 building energy analysis program. Energy Build. 1985, 8, 271–286. [Google Scholar]
- Winkelmann, F.C. Daylighting Calculation in DOE-2; Lawrence Berkeley Laboratory Report No. LBL-11353; Lawrence Berkeley Laboratory: Berkeley, CA, USA, 1983. [Google Scholar]
- Hopkinson, R.G.; Longmore, J.; Petherbridge, P. An empirical formula for the computation of the indirect component of daylight factors. Trans. Illum. Eng. Soc. 1954, 19, 201–219. [Google Scholar]
- Lynes, J.A. Principles of Natural Lighting; Applied Science Publishers, Ltd.: London, UK, 1968; p. 129. [Google Scholar]
- Willmott, A.J.; Heckbert, P.S. An Empirical Comparison of Radiosity Algorithms; Technical Report CMU-CS-97-115; Carnegie Mellon University: Pittsburgh, PA, USA, 1997; pp. 7–10. [Google Scholar]
- The U.S. DOE. M&V Guidelines, Measurement and Verification for Federal Energy Projects Version 3.0. Available online: https://www1.eere.energy.gov/femp/pdfs/mv_guidelines.pdf (accessed on 28 February 2014).
- Hitchcock, R.J.; Carroll, W.L. DElight: A Daylighting and Electric Lighting Simulation Engine. Proceedings of the 8th International IBPSA Conference, Eindhoven, The Netherlands, 11–14 August 2003; pp. 483–489.


| Input data | 6 mm clear |
|---|---|
| Solar transmittance | 0.765 |
| Front side solar reflectance | 0.073 |
| Back side solar reflectance | 0.073 |
| Visible transmittance | 0.878 |
| Front side visible reflectance | 0.083 |
| Back side visible reflectance | 0.083 |
| Front side infrared hemispherical emissivity | 0.42 |
| Back side infrared hemispherical emissivity | 0.42 |
| Conductivity (W/m K) | 0.9 |
| Dirt correction factor for Solar and visible transmittance | 1 |
| Solar diffusion | No |
| Input data | Blind |
|---|---|
| Slat width | 80 mm |
| Slat separation | 80 mm |
| Slat thickness | 2 mm |
| Slat conductivity | 0.9 |
| Slat beam solar transmittance | 0 |
| Front side slat beam solar reflectance | 0.8 |
| Back side slat beam solar reflectance | 0.8 |
| Slat diffuse solar transmittance | 0 |
| Front side slat diffuse reflectance | 0.1 |
| Back side slat diffuse reflectance | 0.1 |
| Slat beam visible transmittance | 0 |
| Front side slat beam visible reflectance | 0.8 |
| Back side slat beam visible reflectance | 0.8 |
| Slat diffuse visible transmittance | 0 |
| Front side slat diffuse visible reflectance | 0.1 |
| Back side slat diffuse visible reflectance | 0.1 |
| Slat infrared hemispherical transmittance | 0 |
| Front side slat hemispherical emissivity | 0.9 |
| Back side slat hemispherical emissivity | 0.9 |
| Blind to glass distance | 25 cm |
© 2014 by the authors; licensee MDPI, Basel, Switzerland. This article is an open access article distributed under the terms and conditions of the Creative Commons Attribution license ( http://creativecommons.org/licenses/by/3.0/).
Share and Cite
Yoon, Y.B.; Jeong, W.R.; Lee, K.H. Window Material Daylighting Performance Assessment Algorithm: Comparing Radiosity and Split-Flux Methods. Energies 2014, 7, 2362-2376. https://doi.org/10.3390/en7042362
Yoon YB, Jeong WR, Lee KH. Window Material Daylighting Performance Assessment Algorithm: Comparing Radiosity and Split-Flux Methods. Energies. 2014; 7(4):2362-2376. https://doi.org/10.3390/en7042362
Chicago/Turabian StyleYoon, Yeo Beom, Woo Ram Jeong, and Kwang Ho Lee. 2014. "Window Material Daylighting Performance Assessment Algorithm: Comparing Radiosity and Split-Flux Methods" Energies 7, no. 4: 2362-2376. https://doi.org/10.3390/en7042362