Downscaling the Impacts of Large-Scale LUCC on Surface Temperature along with IPCC RCPs: A Global Perspective

Abstract
: This study focuses on the potential impacts of large-scale land use and land cover changes (LUCC) on surface temperature from a global perspective. As important types of LUCC, urbanization, deforestation, cultivated land reclamation, and grassland degradation have effects on the climate, the potential changes of the surface temperature caused by these four types of large-scale LUCC from 2010 to 2050 are downscaled, and this issue analyzed worldwide along with Representative Concentration Pathways (RCPs) of the Intergovernmental Panel on Climate Change (IPCC). The first case study presents some evidence of the effects of future urbanization on surface temperature in the Northeast megalopolis of the United States of America (USA). In order to understand the potential climatological variability caused by future forest deforestation and vulnerability, we chose Brazilian Amazon region as the second case study. The third selected region in India as a typical region of cultivated land reclamation where the possible climatic impacts are explored. In the fourth case study, we simulate the surface temperature changes caused by future grassland degradation in Mongolia. Results show that the temperature in built-up area would increase obviously throughout the four land types. In addition, the effects of all four large-scale LUCC on monthly average temperature change would vary from month to month with obviously spatial heterogeneity.1. Introduction
Land use and cover changes (LUCC) is widely recognized as one of major contributors to global climate changes [1–3]. It has long been known that the land use changes caused by human activities, e.g., afforestation and deforestation, agriculture practices as well as urbanization, can have significant effects on the climate [1–6]. LUCC influences climate by changing the properties of the land surface which is not only the direct heat source of the troposphere, but also one of the main sources of the atmospheric vapor water [7]. In addition, the land use activities all influence the energy budget and Bowen ratio (the ratio of energy fluxes from one state to another by sensible and latent heating respectively) of the land surface, the distribution of the precipitation among the soil water, runoff and evapotranspiration [8–10]. Thereafter, characteristics changes of the land surface would directly influence the land surface-atmosphere interaction, consequently alter the thermodynamic and dynamic characteristics of the atmosphere, and finally bring out different climate processes and patterns.
Urbanization is an extreme way through which human activities alter underlying surface properties and consequently influence the local climate [11–13]. The urban heat island effect due to urbanization is a typical example of the influence of LUCC on the regional climate [14]. The urbanization has contributed to 50% of the increase of land surface temperature in the United States of America (USA) since 1950 [15]. The widespread impervious surface and the roof and wall of buildings, etc. in the cities, all influence the energy flux, circulation of water and other materials [16]. In addition to the research on the small scale, such as a single city, there is evidence that the impacts of urbanization on climate change are significant at a regional scale. These studies have sufficiently and indisputably demonstrated that urbanization affects climate at regional level.
Forests can affect regional and even multi-scale climate by exchanging the planetary energetics, sustaining the hydrologic cycle, containing and releasing the carbon dioxide and through other physical, chemical and morphological processes [4], thus playing an indispensable role in balancing the climate and land surface systems [17]. Tropical forest occupies nearly 20% of total forest land area, accounts for more than 30% of net primary production (NPP) in the terrestrial ecosystem. It contains about 25% of the carbon in the terrestrial biosphere, and can sequester large amounts of carbon on land surface annually [4,18]. Though tropical forest could mitigate surface warming through considerable evaporative cooling effect, the temperature would increase if the surface albedo rose to a large extent. Deforestation would offset the water and energy exchange feedback effects by compared with the reduction of convection and precipitation [8]. Therefore, it is no doubt that tropical forest as a significant component would be taken into account for climate change research.
There were 1140 million hectares (Mha) forests converted into cultivated land during 1700–1992 [19]. The farmland management for adapting to climate changes have arisen public concern about the irrigation, no-till agriculture, and crop rotation, etc. For example, in turn, irrigation significantly increases the regional moisture to the atmosphere, consequently increasing the regional precipitation [20]. On the other hand, irrigation plays a role in reducing the regional temperature and the daily temperature difference [21–24]. Thus, the irrigation area has rapidly increased in the past centuries. According to the history of observation records, the global irrigation area was 8.0 Mha in 1800, and increased to 40 Mha in 1900, then, further increased 2.7 Mha by 2000 [25]. The cultivated land with irrigation mainly distributed in China, India, Pakistan, Thailand, North America and the Aral Sea watershed [25,26]. The cooling effect of irrigation in some regions (e.g., North America, northwest part of India, northeast part of China) is comparable to the warming effect in the magnitude, and consequently plays a role in alleviating the climate warming [25]. Besides, the conversion of natural vegetation and cultivated land can have warming or cooling effects on the climate, depending on the type of natural vegetation as well as the established crops [27]. That is to say, different cultivated land management activities can have different climatic effects, and therefore more researches are needed to identify the climate-related tradeoffs associated with future cultivated land management.
Grassland, as an indispensable natural resource, has received more attention than ever before because it plays a crucially important role in sequestrating carbon [28] and preserving biodiversity [29]. As one of the most widespread vegetation types worldwide, grassland covers 15 million km2 in the tropics (as much as tropical forests) and a further 9 million km2 in temperate regions [30], and it accounts for about 25% of the global land area [31]. On the one hand, as an important land use/cover, it can provide various ecosystem services such as the provision of the forage, milk and meat. Besides, grassland also provides some important ecosystem services to regulate the regional climate, e.g., the mitigation of greenhouse gas (GHG) emissions through soil organic carbon (C) and nitrogen (N) sequestration[32,33]. On the other hand, the grassland degradation has declined production of ecosystem on grassland, increasing the frequency of the extreme weathers and natural disasters, such as droughts and fierce freeze-up. As a consequence, they have seriously affected to the sustainable development of animal husbandry [34].
Since there is great difference in the physical, chemical and biological characteristics of the land surface in different regions on the Earth, the impacts of the LUCC on the regional climate systems also vary greatly. For example, the deforestation may lead to the temperature increase in the tropic zone, while it may lead to the regional temperature decrease in the frigid zone [4]. Different large-scale LUCCs have effect on the characteristics of regional climate system in different ways, especially the changes of temperature and precipitation [9,10,35].
Therefore, in order to completely reflect the relationship between LUCC and the climatic factors, it is necessary to carry out and make comparisons among a series of case studies in different regions and at various spatiotemporal scales and analyze the land surface parameters of the LUCC as well as the climatic response. However, there have been very few relevant researches. Thus, the scientific objective of this study is to estimate and compare the potential impacts of future large scale LUCC on surface temperature from a global perspective. The Weather Research and Forecasting (WRF) model, as the latest-generation numerical weather prediction model [36–38], is used as an important tool to quantitatively analyze and compare the possible impacts of the future land use changes of different regions on the regional climate. Section 2 introduces the study areas, especially the characteristics of the dominant land use/cover and the tendency of LUCC. Section 3 describes the downscaling scheme using WRF-ARW model. The atmospheric forcing dataset and the predicted future land use/cover in our simulation are also introduced in this section. Section 4 shows the result of the model performance and outlines the effects of future dominate land use/cover changes on the surface temperature projected by the high-resolution simulation. Finally, Section 5 consists of the discussion and conclusion.
2. Study Areas
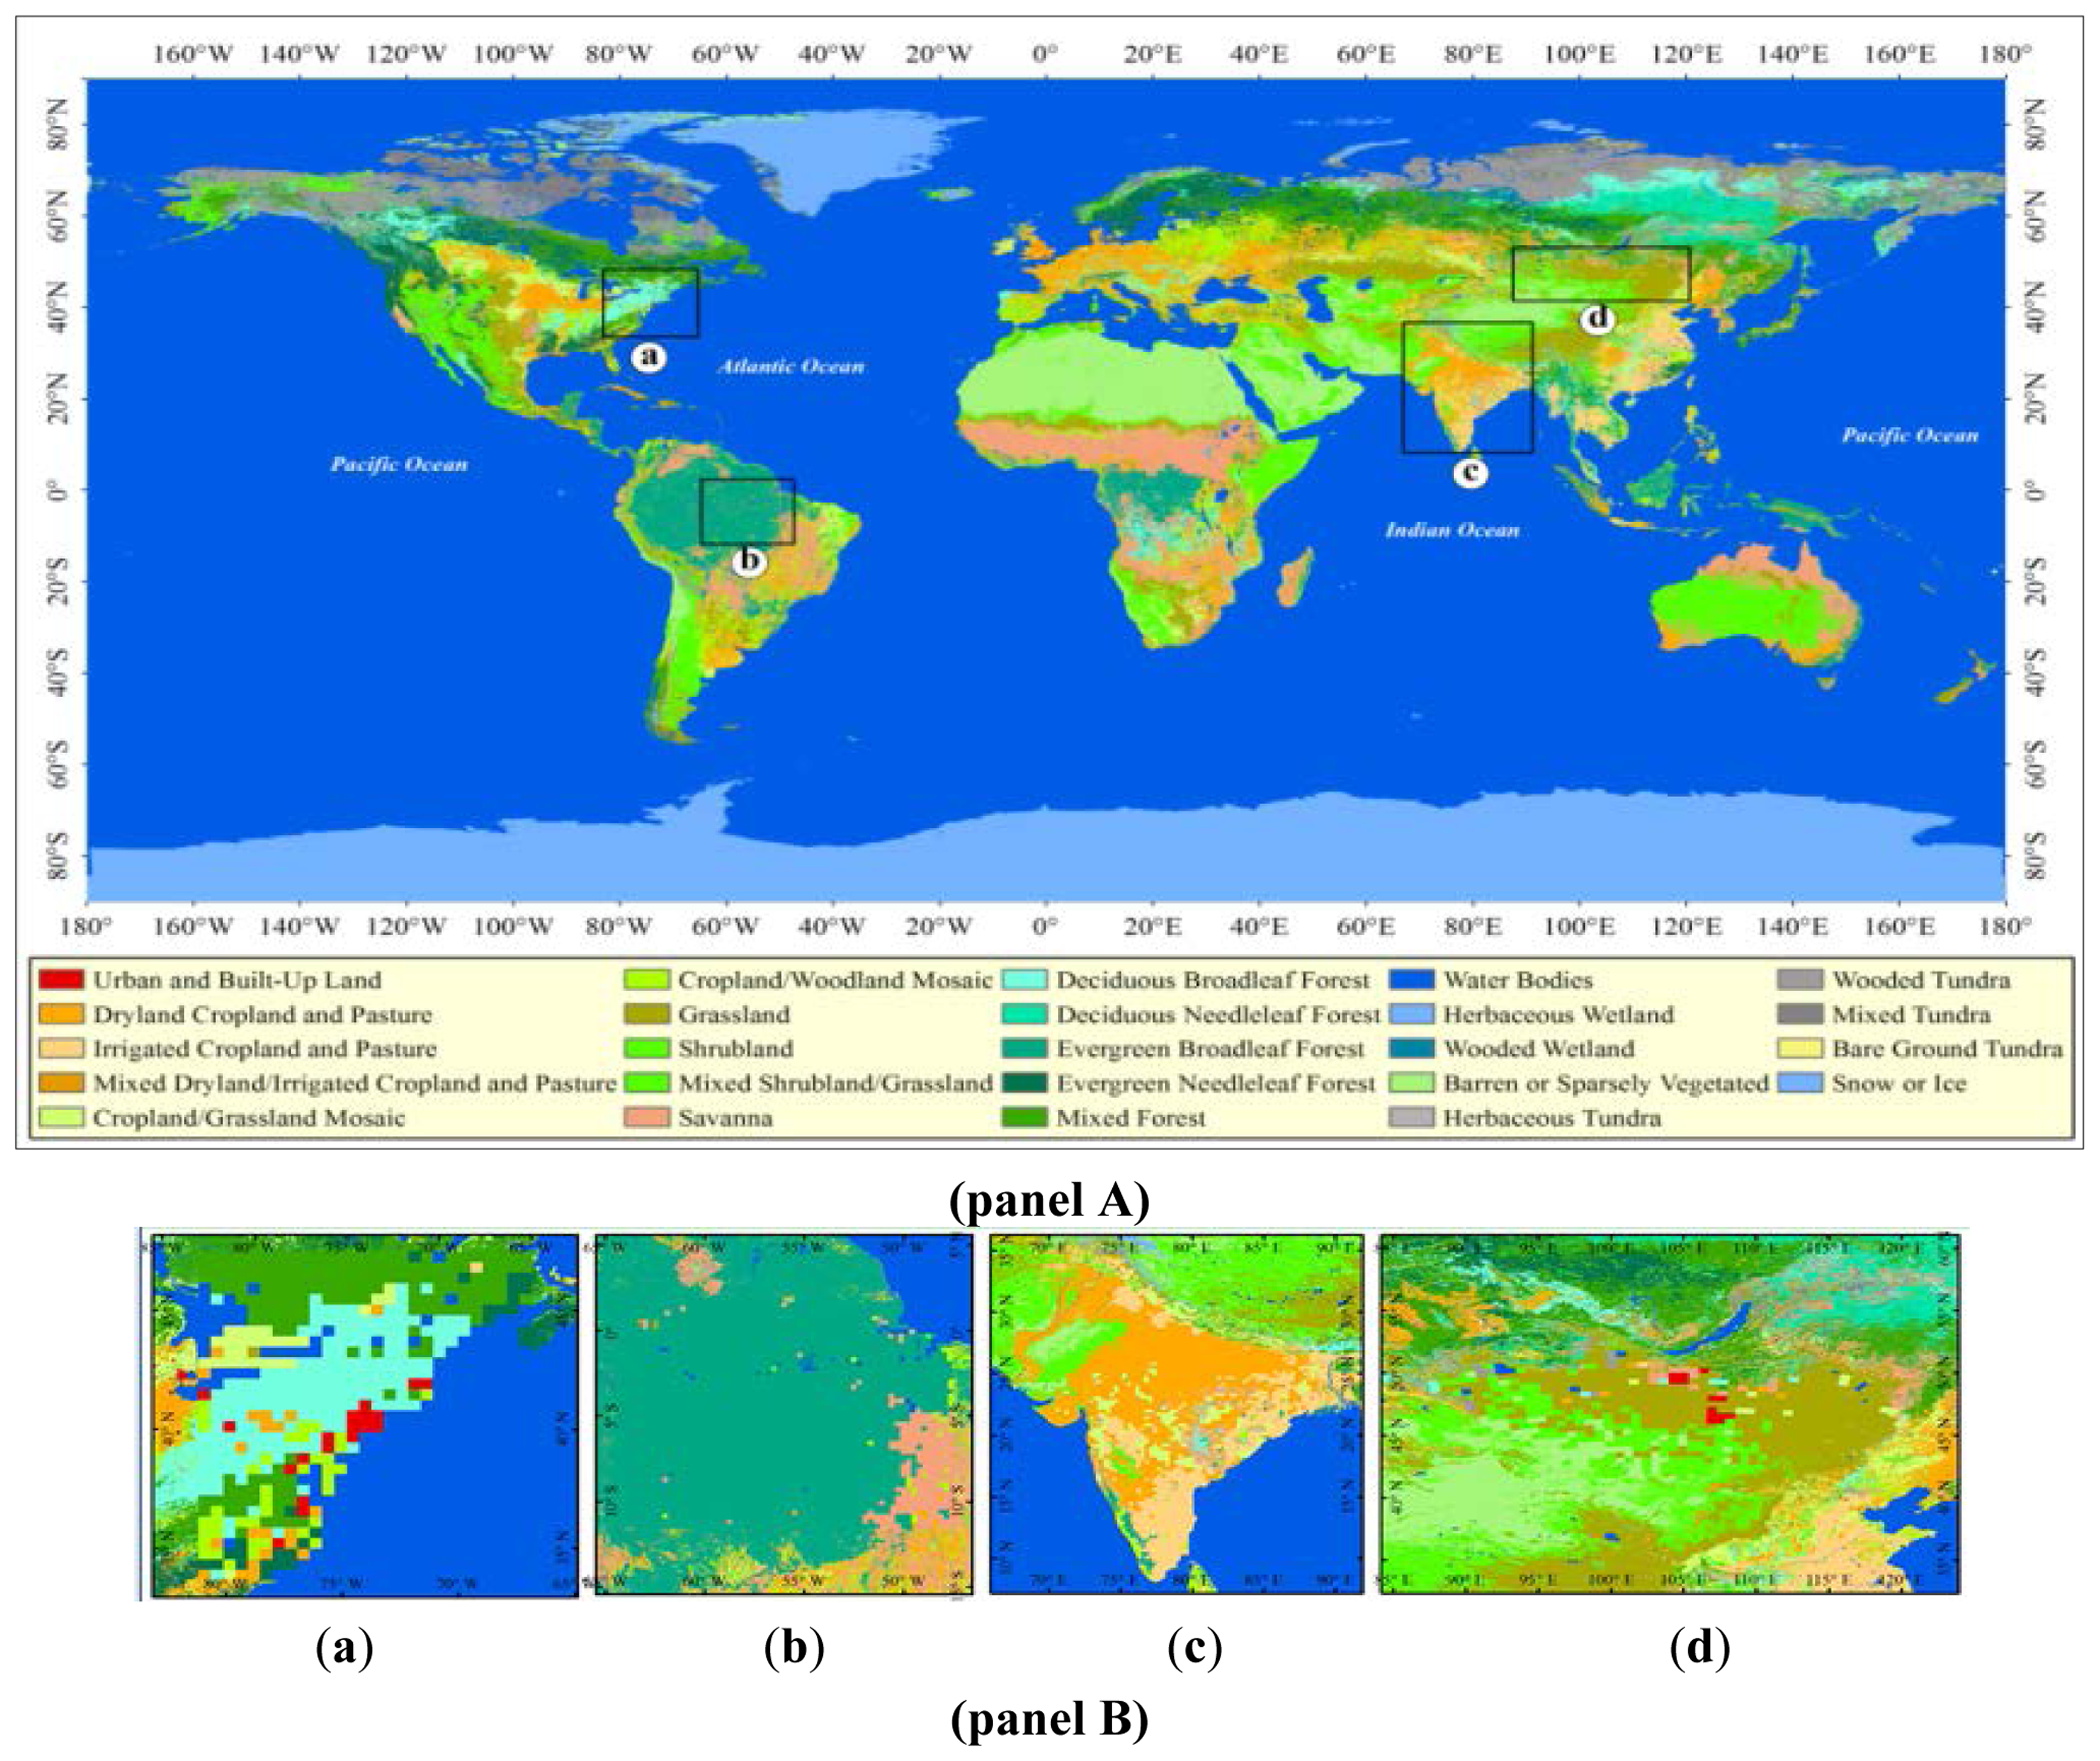
In this paper, four case studies of potential further land use changes as well as their impact on surface temperature are introduced and compared worldwide. In terms of the urbanization impacts in developed megalopolis, the first case study presents some evidences for effects of future urbanization on regional climate based on the simulation of temperature in the Northeast megalopolis of the United States of America (USA) (Figure 1 panel A and Figure 1 panel B (a)). Further, in order to understand the potential climatological variability caused by future forest vulnerability, we chose Brazilian Amazon region as the study area (Figure 1 panel A and Figure 1 panel B (b)). The third one chooses India (Figure 1 panel A and Figure 1 panel B (c)) as a typical region of the land reclamation and the possible impacts of cultivated land reclamation are explored. The possible impacts of the future reclamation of cultivated land are analyzed by forecasting the future cultivated land reclamation and its related changes of temperature. Grassland plays an important role in ecosystem services supply, but studies can be rarely found about the influences of grassland change on climate especially in Mongolia (Figure 1 panel A and Figure 1 panel B (d)). Therefore, in the last case study, we simulate the climatological changes caused by future grassland changes in Mongolia along with Representative Concentration Pathways (RCPs) of Intergovernmental Panel on Climate Change (IPCC) for the years 2010–2050[38,39].
The Northeast megalopolis is the most populous and largely developed area of the USA (Figure 1 panel A and Figure 1 panel B). A number of cities are distributed in this region, including Baltimore, Boston, Harrisburg, Newark, New York City, Philadelphia, Portland, Providence, Richmond, Springfield, Hartford, and Washington, DC [40], and their estimated population could rise up to sixty million by 2025. Thus, this study area is considered as one of the most typical metropolitan area with their economy development and population acceleration to research urbanization effects on climate changes.
Amazonia tropical forest (Figure 1 panel A and Figure 1 panel B) constitutes half of the global remaining tropical forests with 6 million km2, approximately 60% of which is located in the Brazilian Amazon region [41]. The annual average forest clearing rate in Brazil has first increased and then tended to decrease in the past decades. For instance, it increased from approximately 1.3 × 10⁴ km2/year in 1990–1994 to over 2.0 × 10⁴ km2/year in 1995–1996[42], and then decreased slightly to 1.9 × 10⁴ km2/year in 1997–2005 [43]. In addition, it has rapidly decreased to 0.7 × 10⁴ km2/year by 2011 [44]. Moreover, these tropical forests would support the massive ecological services to water provisioning and climate regulation, for instance, the 2500 mm annual average precipitation in Amazon reaches could discharge over a trillion m3 of water into the ocean. In addition, these tropical forests also protect low albedo against radiative forcing effects on keeping lower evapotranspiration rate. Thus, without enough tropical forest, the local residents could not have any settlements with comfortable living conditions in this region [45]. While, anthropogenic activities also damage regional ecological system by annual cutting, which have caused the distributions of global climate changes [46]. Therefore, land surface changes caused by deforestation would destabilize regional climatic and hydrometerological variability [47] and then induce the climate anomalies such as changing in precipitation and temperature [48].
Cultivation in India, typically, depends upon agricultural irrigation (Figure 1 panel A and Figure 1 panel B). The total area of the cultivated land and pasture reaches is around 2.07 million km2, accounting for 73% of the study area. There are mainly four kinds of cultivated land in India which corresponds to the United States Geological Survey (USGS) classification, i.e., the dryland cropland and pasture, irrigated cropland and pasture, cropland/grassland mosaic and cropland/woodland mosaic. The dryland cropland and pasture is mainly allocated in Gangetic Plain in the north part of India, Malwa Plateau in the middle part of India, and the northern part of Deccan Plateau. They occupy near to 1.18 million km2 by 56.76% as the largest proportion of the total cultivated land in the study area. The irrigated cropland and pasture is over 665. Sixty-five thousand km2 distributed in the northern part of Indus plain, eastern part of India Peninsula and the coastal plain in the southern part of India, with ranked the second largest proportion by 32.10%. In this study area, the other two types of cultivated land is relatively less. the cropland/grassland mosaics is only about 203.66 thousand km2 by 9.82% allocated at the northern part of India plain, and the middle part of India Peninsula. The cropland/woodland mosaic is only 27.39 thousand km2 by 1.32% sparsely distributed in the coastal area in the southwest part of India.
Mongolia is located in the middle of Asia (Figure 1 panel A and panel B) and it is the second-largest inland country with total area of 1.56 million km2. Most of the country's area is covered by steppes which accounts for more than 70% of the national area. Because it is an inland country at high latitude, the temperature is relatively low in northern Mongolia, according to the climate data from Mongolia Meteorological Administration from 1960 to 2006, an annual average temperature about −5 °C even much lower in the winter, and in the southern part of the annual average temperature is stable at 4°C [49]. Besides, the average annual precipitation in Mongolia is 200–300 mm from 1980 to 2006 [50–52]. In the past two decades, the average temperature of Mongolia increased from 1.5 °C to 2.5 °C by 2–3 times of the world average difference [50]. Because of its large area of grassland cover, the foremost industry in Mongolia is livestock farming, and approximately 30% of their population is nomadic or semi-nomadic. Thus, grassland resource is crucially important to Mongolia economy. Mongolia grasslands can be mainly divided into four sub-types: Forest Grassland, Typical Grassland, Mountain Grassland, Desert Grassland and Desert. The high quality forage grass has been gradually recessing and replacing by inferior plants (bushes, shrubs, etc.) The high quality forage grass has been gradually recessing or replaced by inferior plants (bushes, shrubs, etc.) [51] that led to many plant species greatly decreasing and then its production gradually being declined as well. For example, the rates of pasture production decline rate in Forest Grassland, Typical Grassland, Mountain Grassland, Desert Grassland and Desert during 1961–2006 are 40%, 52%, 39%, 33% and 39%, respectively [53].
3. Data and Methodology
In order to make contribution to analyze and forecast climate changes in the future with a global perspective, LUCC in the four study areas during the period from 2010 to 2050 will be firstly identified along with IPCC RCPs. In our study, we simulate the influence of climate changes caused by different types of land use changes based on the implement of WRF model with land use/cover data and atmospheric forcing data.
3.1. Downscaling Scheme Using WRF-ARW Model
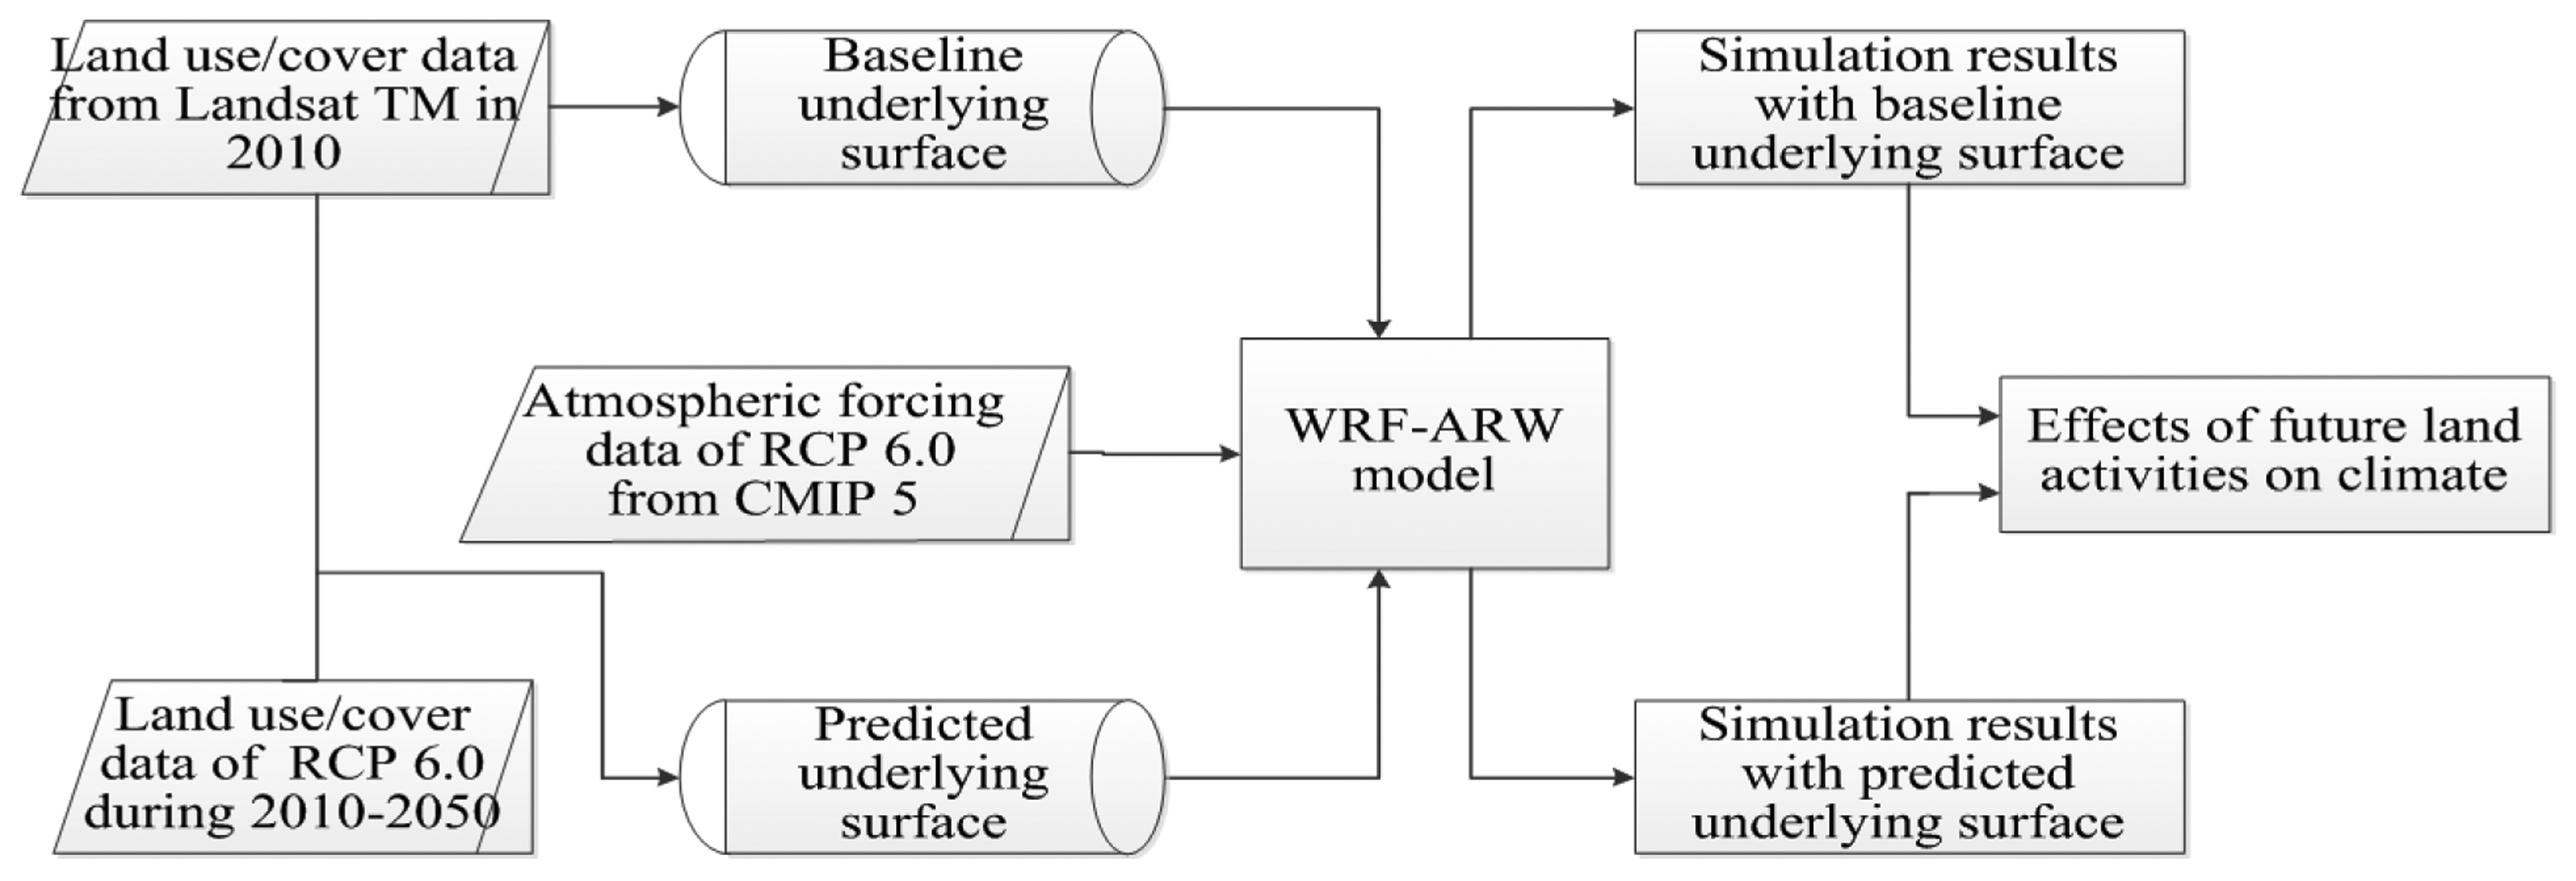
Land use/cover data from Landsat TM in 2010 is used as the baseline underlying surface data in this study, while the predicted land use/cover raster data from 2010 to 2050 are derived from the database of IPCC RCP 6.0 [38,39].This database is developed by the Asia-Pacific Integrated Model (AIM) modeling team at the National Institute for Environmental Studies (NIES), Japan. IPCC RCP 6.0 is selected as the reasonable land use/cover patterns in the future because it is a stabilization scenario and the total radiative forcing is stabilized after decades without overshoot by employment of a range of technologies and strategies for reducing greenhouse gas emissions [39]. In addition, Model output of the latter of IPCC RCP 6.0 such as air temperature, specific humidity, sea level pressure, eastward wind, northward wind, geopotential height from 2010 to 2050 are used as the atmospheric forcing dataset of WRF-ARW model (Figure 2).
WRF is a next-generation, limited-area, non-hydrostatic, mesoscale modeling system developed by a group of scientists in different institutes [54]. It consists of three modes, including pre-processing module of mode (WPS), main module of model (ARW), and assimilation module of mode and post-processing tools of mode data (WRF-VAR). The WRF-ARW (Edition 3.3) is used to simulate the impacts of large-scale LUCC on the temperature in this study.
3.2. The Tendency of the Four Typical Land Use/Cover
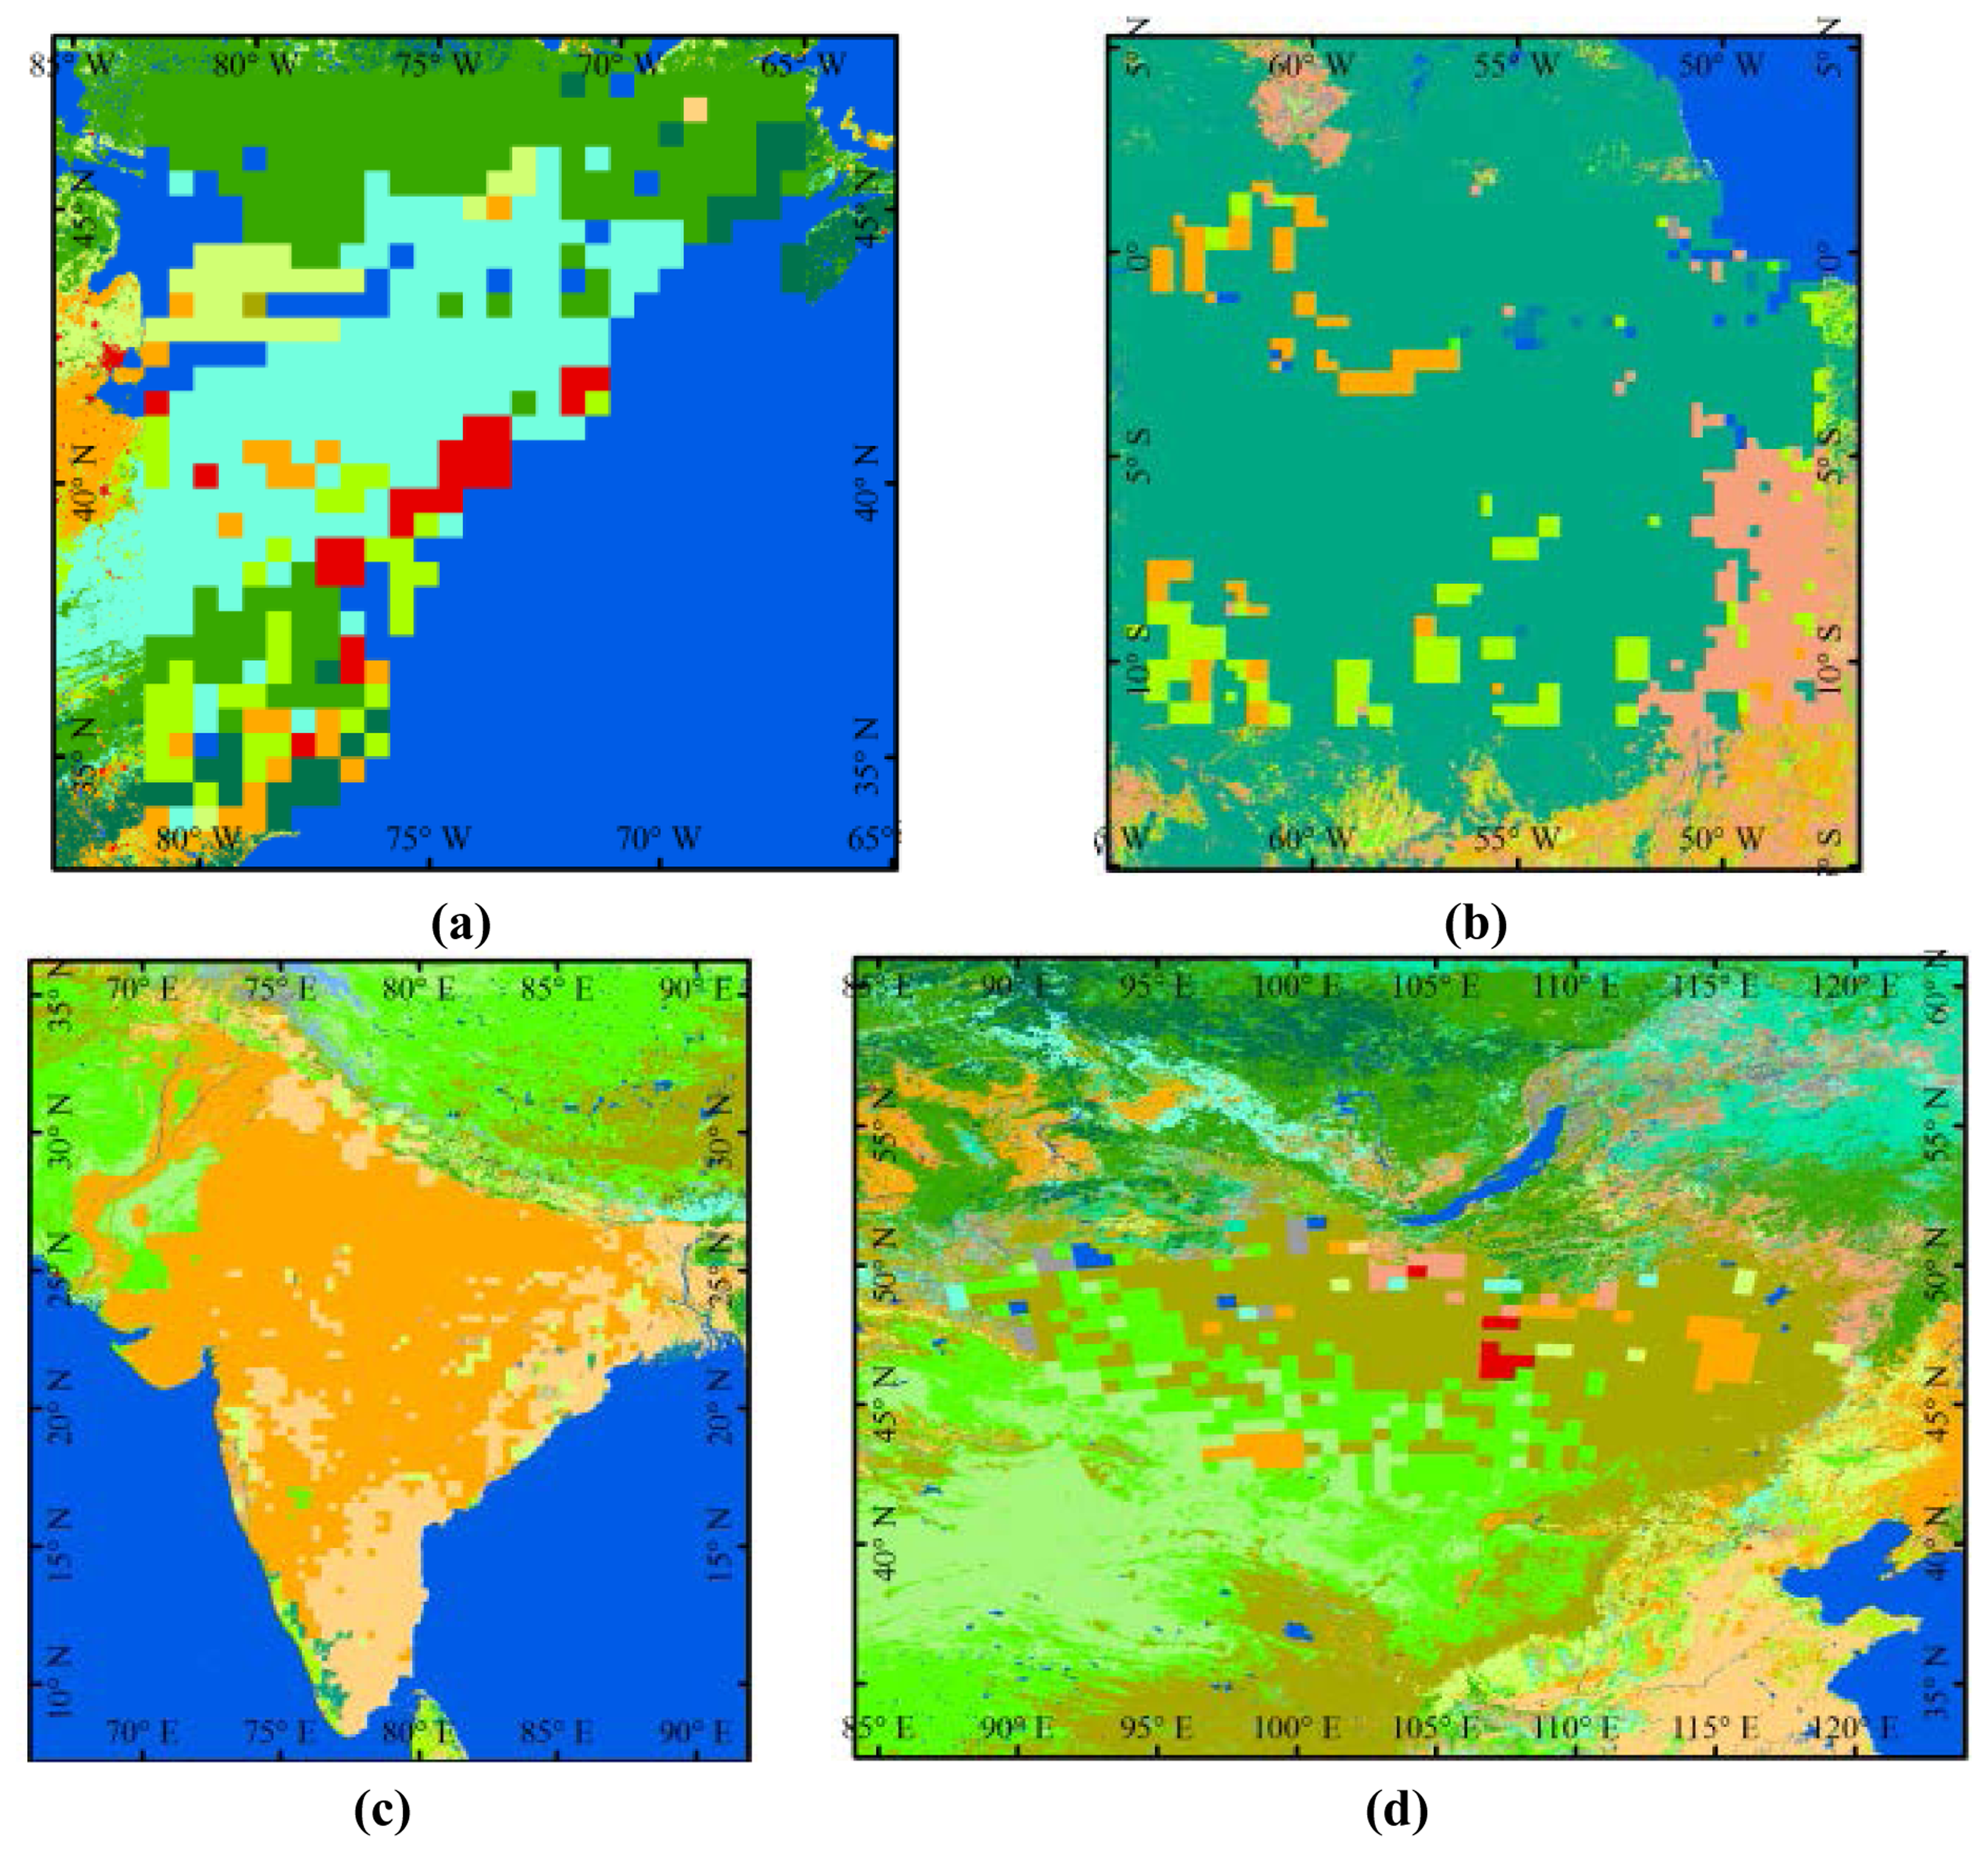
In order to effectively investigate and compare the possible future temperature change of the four typical areas, we only analyze the typical land type in the four areas, even though change patterns of all kinds of land use/cover in 2010 to 2050 are available in the database. The new urbanization region in the eastern of USA, the deforestation region in Amazon, the newly increased cultivated land in India, the grassland region in Mongolia are all extracted and analyzed, separately. All the land use/cover of these four cases area is presented in the form of raster data. Thereafter, the change areas (in the form of raster data) of the four types of large-scale LUCC derived from the database of IPCC RCP 6.0 are overlaid to the baseline underlying surface data, separately. Consequently, two types of major underlying surface data, baseline underlying surface data directly derived from Landsat TM and predicted underlying surface data by overlaying the typical change area to the baseline underlying surface map, are finally obtained (Figure 3).
In the case study of Northeast megalopolis, both the two underlying surface data are transformed to raster data at the resolution of 30 km × 30 km by resampling. From 2010 to 2050, the land cover conversion is dominated by the conversion from Deciduous Broadleaf Forest to Urban and Built-up Land in the middle part of the study area (Figure 3a). The predicted underlying surface data indicates that the urbanization would continue during 2010–2050.
Figure 3b provides the geographical distribution of changed forestry land in Brazilian Amazon. Both the two underlying surface data are resampled at the resolution of 30 km × 30 km. The degraded and transitioned area primarily distribute in the periphery of the entire Amazon, as well as along the rivers. Compared to forestry land patterns in panel B (b) of Figure 1, the area in which forest is converted into cropland are principally distributed in the most disturbed and populated area. In addition, the statistical analysis shows that the projected deforested land occupies 15% of the study area during the period during 2010–2050.
In the case study of India, the predicted land use/cover data in 2050 are obtained by combining the data of the newly increased cultivated land and the former data, and both the two underlying surface data are also resampled at the resolution of 30 km × 30 km (Figure 3c). According to the land conversion data under the AIM performance, the changing area of the cultivated land in the future is around 1.16 million km2. It is mainly caused by the increasing demand for the grain due to the population growth, and the area of this kind of conversion will be up to 560 thousand km2, accounting for 48% of the total conversion area. There has been a large area of dryland cropland in India, and more land will be converted into the irrigated land which is of higher productivity with the improvement of the irrigation conditions, development of irrigation techniques and increase of the grain demand.
Similarly, in the case study of Mongolia, the two underlying land use/cover data in the downscaling scheme showed in the Figure 2 are also transformed to raster data of 50 km × 50 km by resampling. Compared to the land use/cover in panel B (d) of Figure 1, the conversion from Grassland to Mixed Dryland/Irrigated Cropland and Pasture will dominate in the study area by 2050 (Figure 3d). Besides, it also indicates that there is a strong tendency of conversion from Grassland to Savanna in this region in future 40 years.
3.3. Model Validation
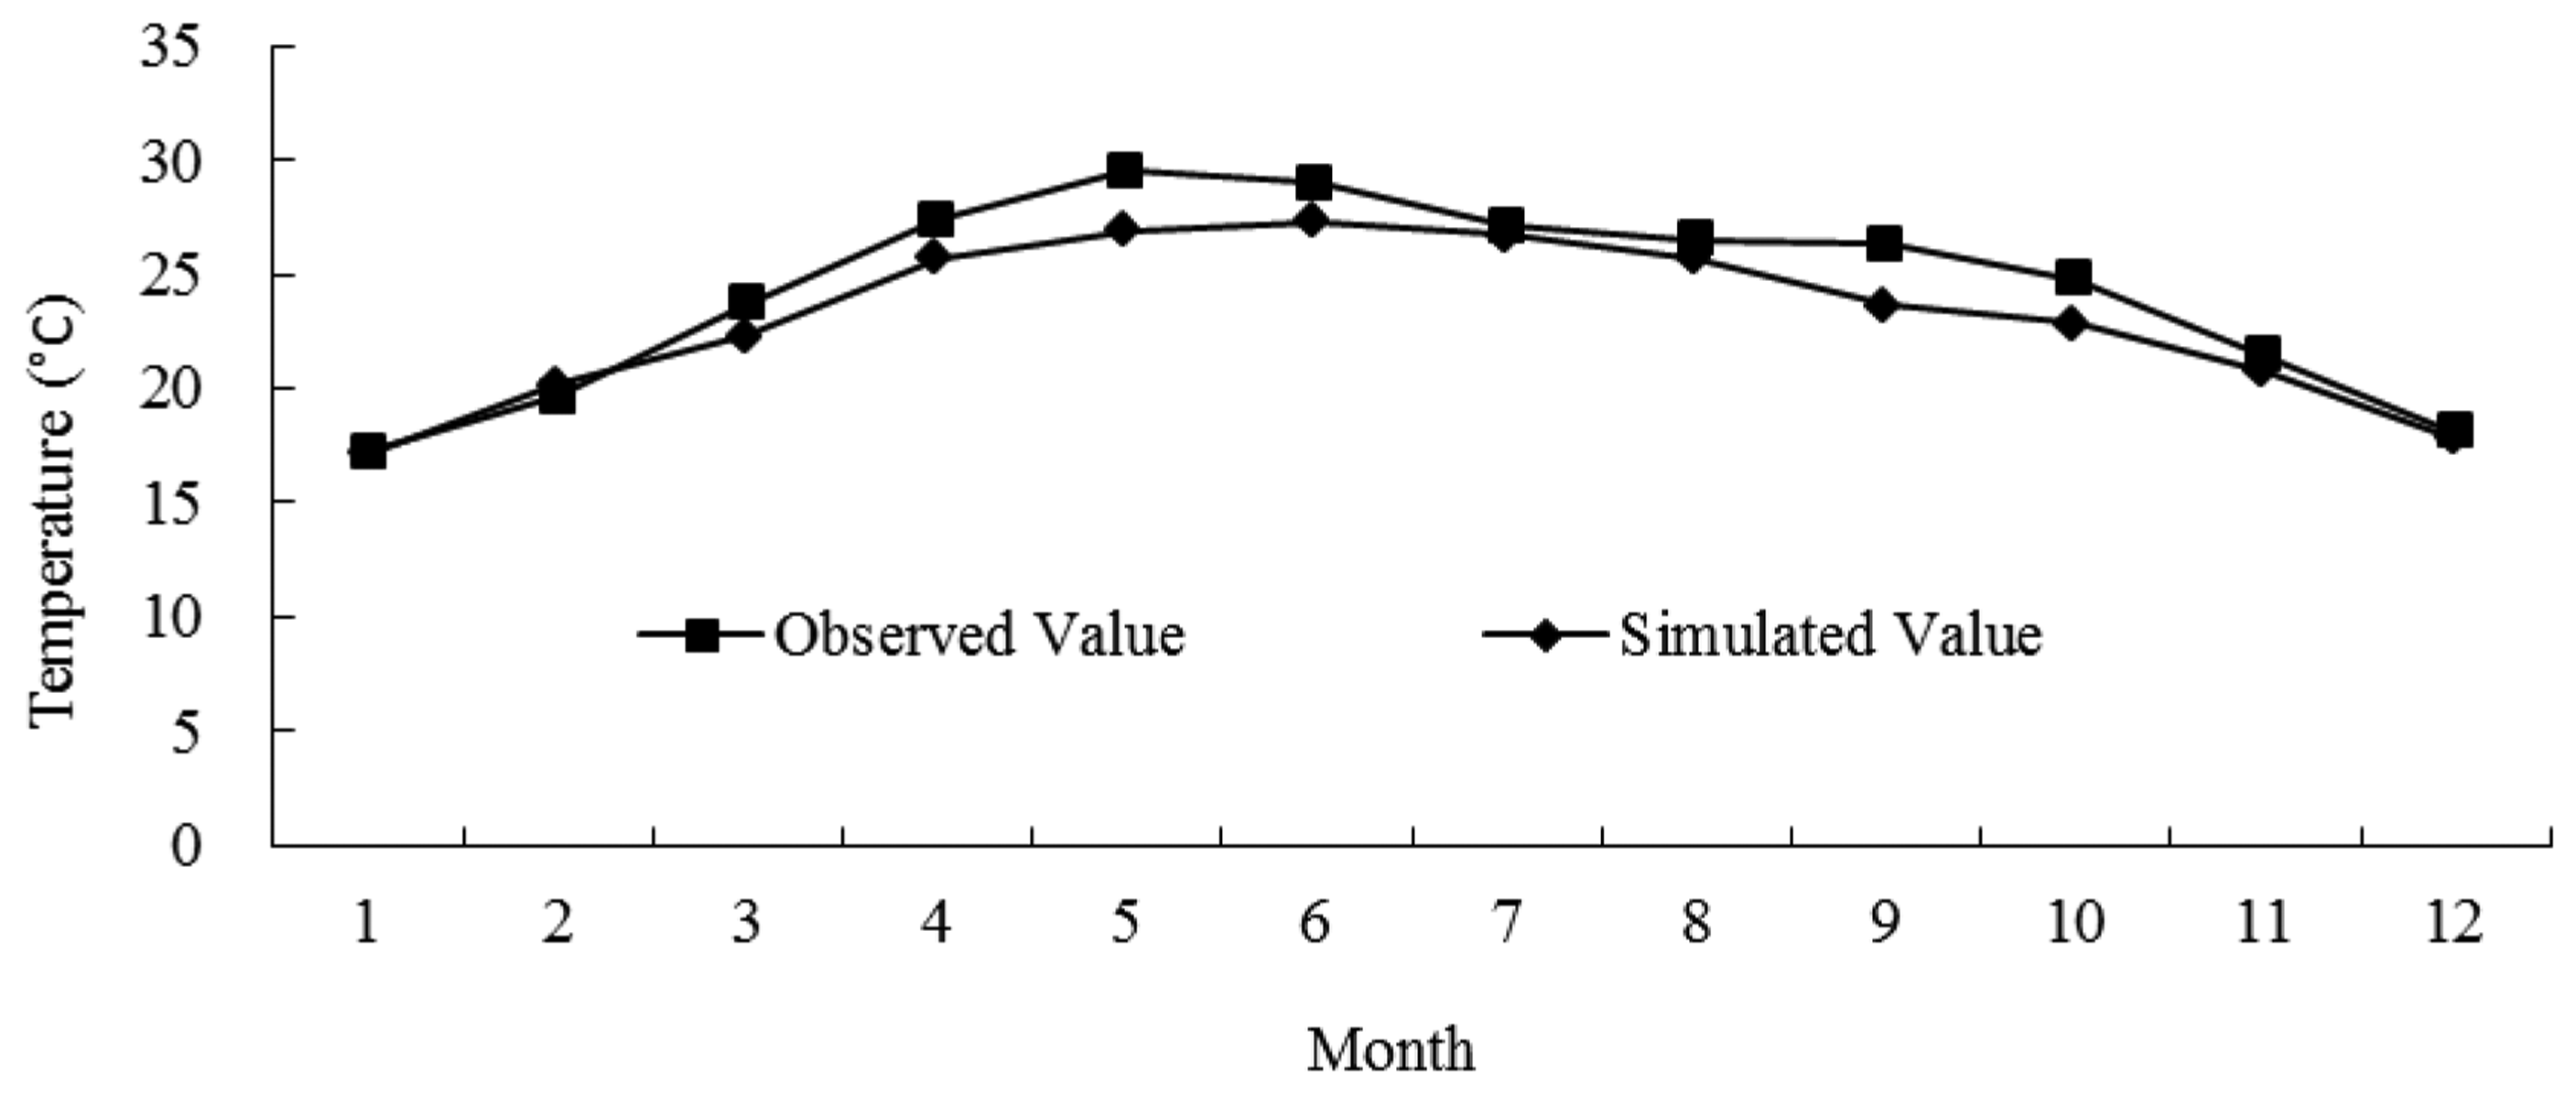
In order to verify the ability of WRF model to simulate the temperature changes in the study areas, we compared the simulation result from WRF model to the observed data of land surface temperature in the case study of India (Figure 4, Figure A1, A2 and A3 in the Appendix). The simulation results of the monthly average temperature are similar to the observations with a relatively lower error rate less than 10%. Thus, the bias is statistically acceptable because the simulated temperature has roughly a small positive bias due to overestimation in March and September respectively. Therefore, the result of the model verification indicates that WRF is well-behaved to simulate the annual temperature changes and its spatial pattern.
4. Simulation Result of the Surface Temperature
The effects of future large scale-LUCC can be measured by the difference of the simulation results with predicted underlying surface and baseline underlying surface (Figure 2):
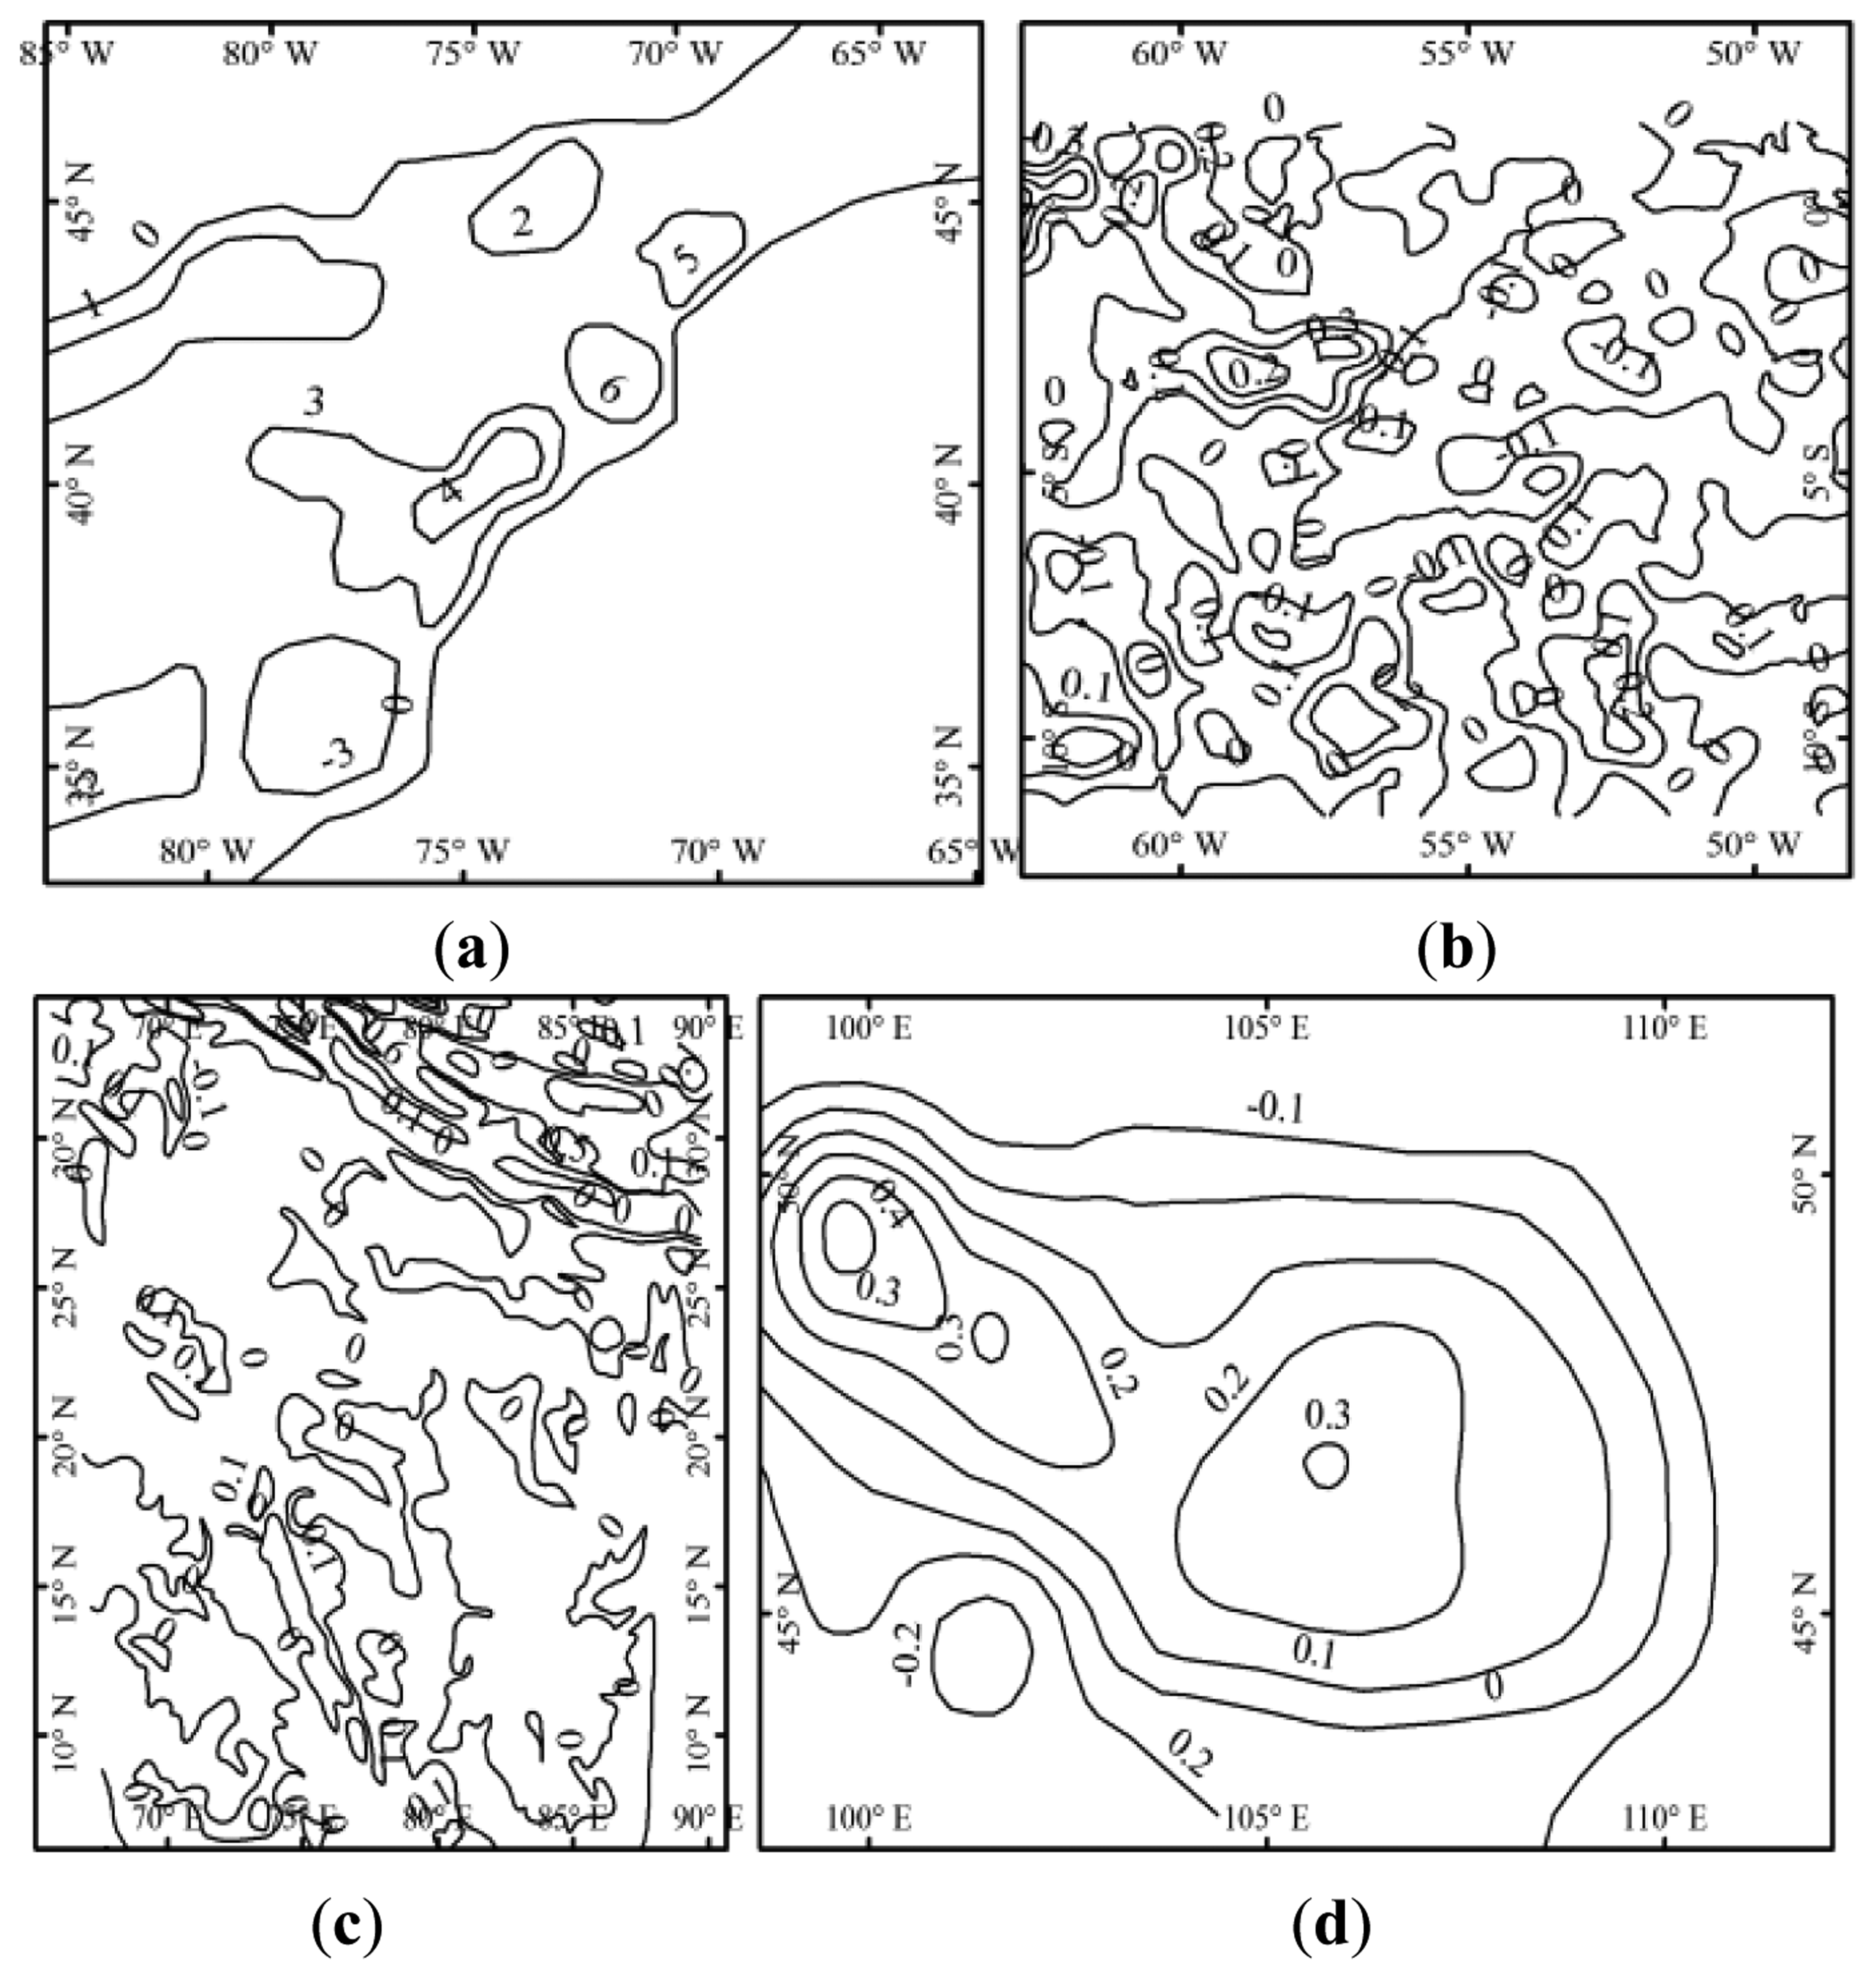
On the whole, the surface temperature shows an increasing tendency in these four study areas to some extent (Figure 5). The urban temperature would increase more obviously among the four land types, and we can see that in USA where the surface temperature would be significantly increased by severely continuous urbanization over time. Moreover, the spatial pattern of average annual temperature indicates that highly significant spatial heterogeneity of the land surface changes impacts on the temperature changes in Brazilian Amazon and India. In addition, in order to reflect effectively on the tendency of the surface temperature change in the future, in the case study of Northeast megalopolis and Mongolia, we project the result with two periods: 2010–2020 and 2040–2050 for further analysis.
4.1. The Effects Urbanization in Northeast Megalopolis
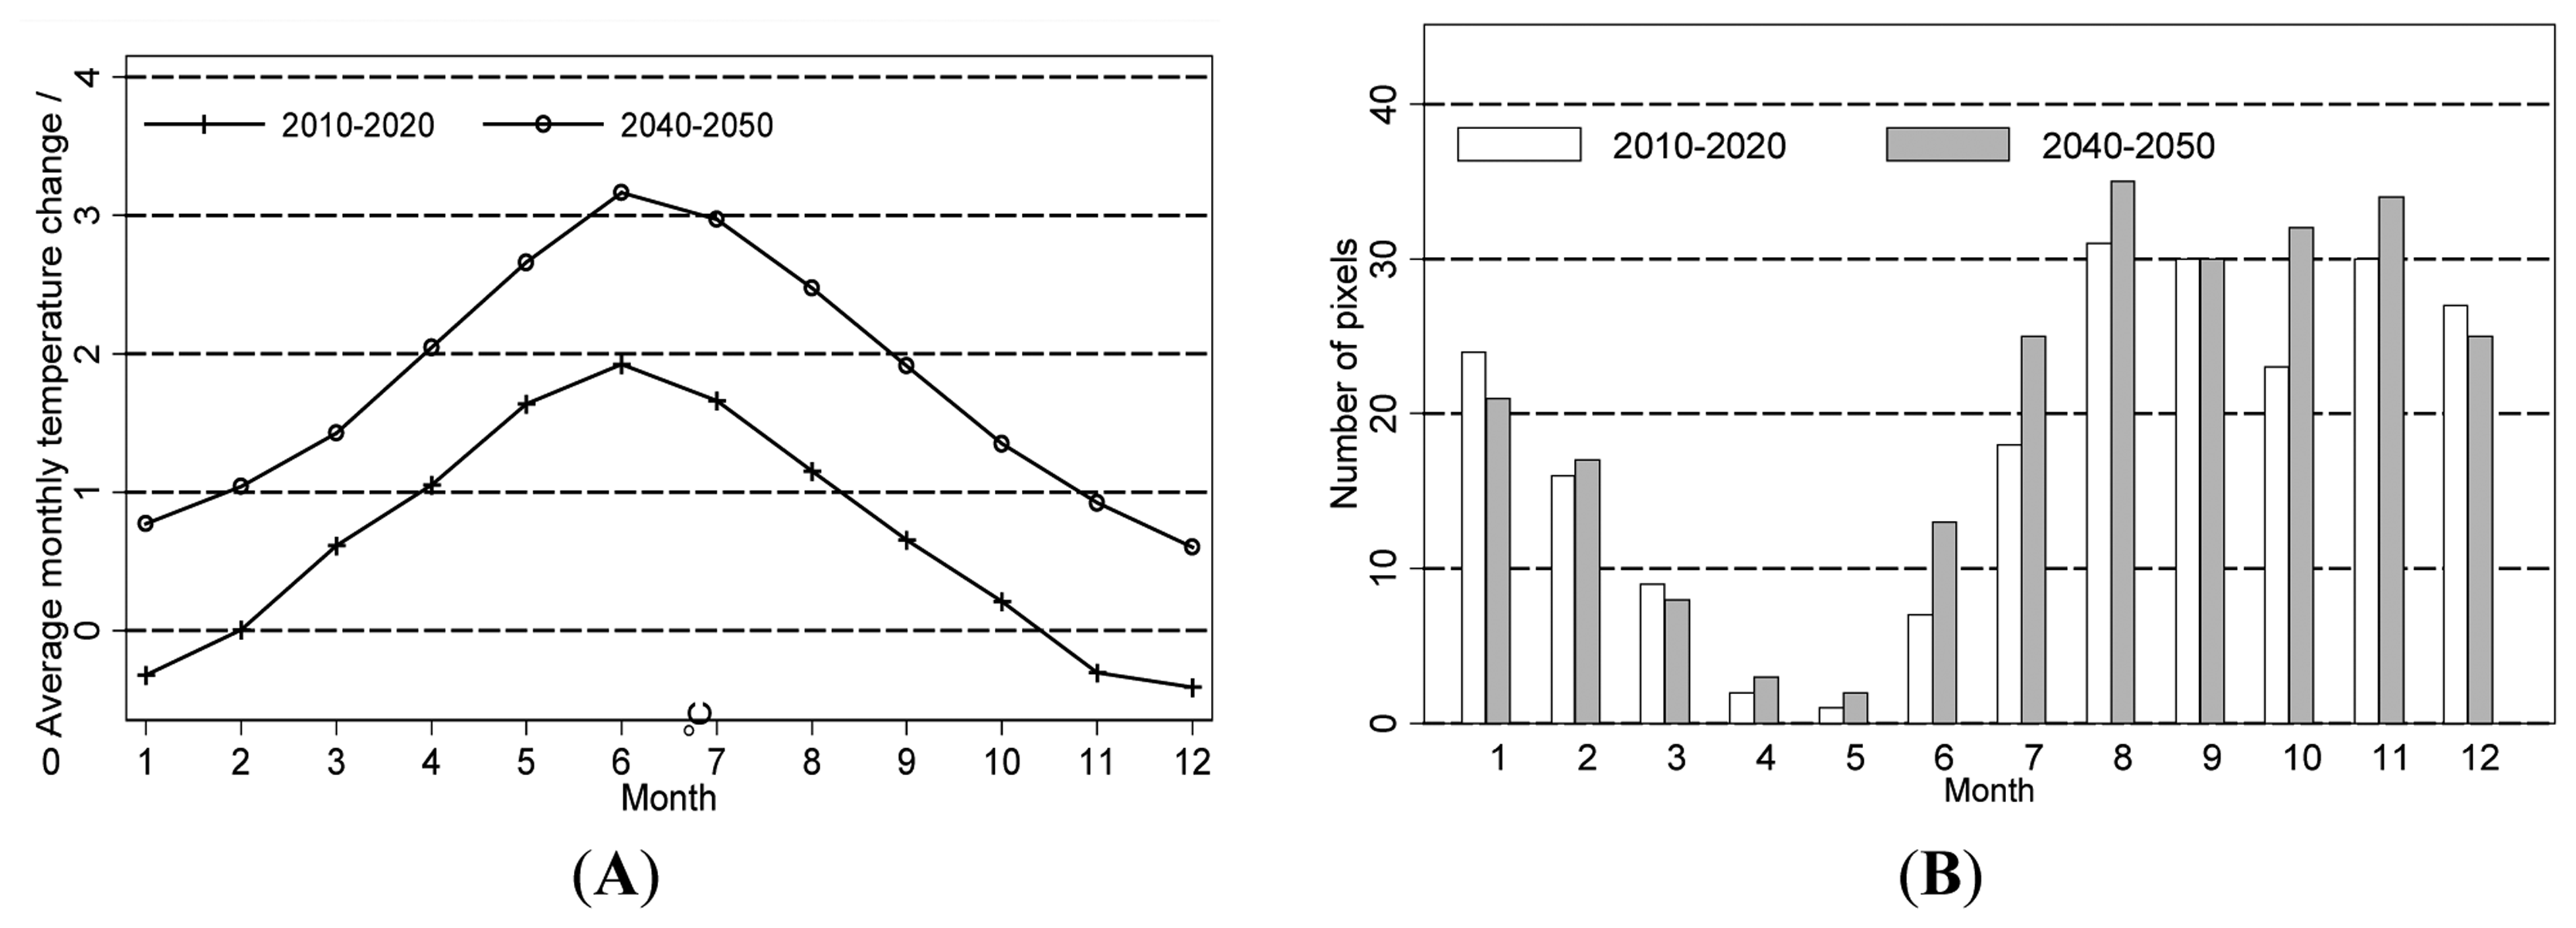
According to the simulation results, the urbanization would have effect on average annual temperature in the future (Figure 5a). On the one hand, the largest change in average annual temperature will occur in the expanded urban area during 2010 to 2050. In some urbanization area, the average annual temperature will even increase by 2 °C to 4 °C On the other hand, the significant average annual temperature decrease will mainly happen in south of the Northeast megalopolis where the forestry area and its cooling effect should not be ignored. Overall, the results clearly reflect the spatial heterogeneity of the temperature rise caused by urbanization. In addition, the warming effect of urbanization is more obvious in these four case studies. Therefore, to predict the possible influenced area by future urbanization on monthly average temperature, we further analysis by calculating the number of pixels (to reflect the area) in nonurban area with average monthly temperature change exceeding 0.5 °C (Figure 6, panel B).
In terms of the monthly average temperature, the differences of simulated monthly average temperature change indicate the warming effect of future urbanization will be more significant in the summer than in the winter in new urbanization area (Figure 6A). For example, the urbanization will lead to an increase of monthly average temperature by 3.15 °C in new urbanization area during 2040–2050. There will be also some cooling effect in new urban area in the winter (November, December and January) during 2010–2020. However, this tendency can be ignored compared the significant monthly average temperature increase during 2040–2050 and the notable monthly average temperature increase in other months during 2010–2020.
In the nonmetropolitan areas, the future urbanization would also drive the monthly average temperature increase because of global climate changes, and a tendency of its variety is simulated by month to month (Figure 6B). Furthermore, the results show that the influenced area by future urbanization on monthly average temperature would be getting larger in the period from July to December. Especially in the period of 2040 to 2050, the area that severely influenced by future urbanization on monthly average temperature is more than 6.25 × 10⁴ km2 from July to December during 2040–2050. Thus, by comparing the number of pixels separately with monthly average temperature change over 0.5 °C during 2010–2020 and 2040–2050, the tendency of urbanization expanding areas could be observed, and more notable urbanization effects on monthly average temperature in the future.
4.2. The Effects of Deforestation in Brazilian Amazon
The spatial distribution of differences in surface temperature during 2010–2050 is significantly influenced by the forestry land changes (Figure 5b). Obviously, the surface temperature increases over the western region and massive deforestation areas experience a significant increase of temperature. In addition, the spatial pattern of the temperature change during winter corresponds to the land cover to some extent. For instance, the temperature increment was relatively higher in the Northwestern and the middle part of the study area, which will mainly experience the land conversion from Evergreen Broadleaf Forest to Mixed Dryland/Irrigated Cropland and Pasture. Similarly, there is a slight change of the average annual temperature in the South part of the study area, where the land cover is Cropland/Woodland Mosaic.
We also calculate the temperature change variability on different land cover types according to the simulation results (Figure 7). Future temperature in the evergreen broadleaf forest will increase of 0.02 °C according to the statistical analysis. As shown in the Figure 1 and Figure 3b, the land cover change in the study area during 2010–2050 is mainly characterized by the conversion from forestry land to pasture and woodland, and it will lead to a slight change of the surface temperature. This insignificant change of the average annual temperature change can be explained by the large area of the tropical forests which cover most of the study area. On the contrary, the Dryland cropland and pasture as well as the Grassland will experience an obvious increment of the average annual temperature change, partly because the relatively small area of the Dryland cropland and pasture as well as the Grassland have more uncertainties of the simulation result.
4.3. The Effects of Irrigation in India
Simulation result indicates that the future reclamation of cultivated land in India will have some effect on the spatial heterogeneity of the annual average temperature (Figure 5c). Compared to the simulation result with the baseline land surface data, the simulated temperature with the predicted land surface data is higher in the southern and western part of the study area. Meanwhile, the temperature change is higher in the mountainous area and lower in the plain at the same latitude. Additionally, the simulated result also indicates that the average annual temperature in the inland would show an obvious increase during 2010–2050. However, this warming tendency cannot be found in coastal area.
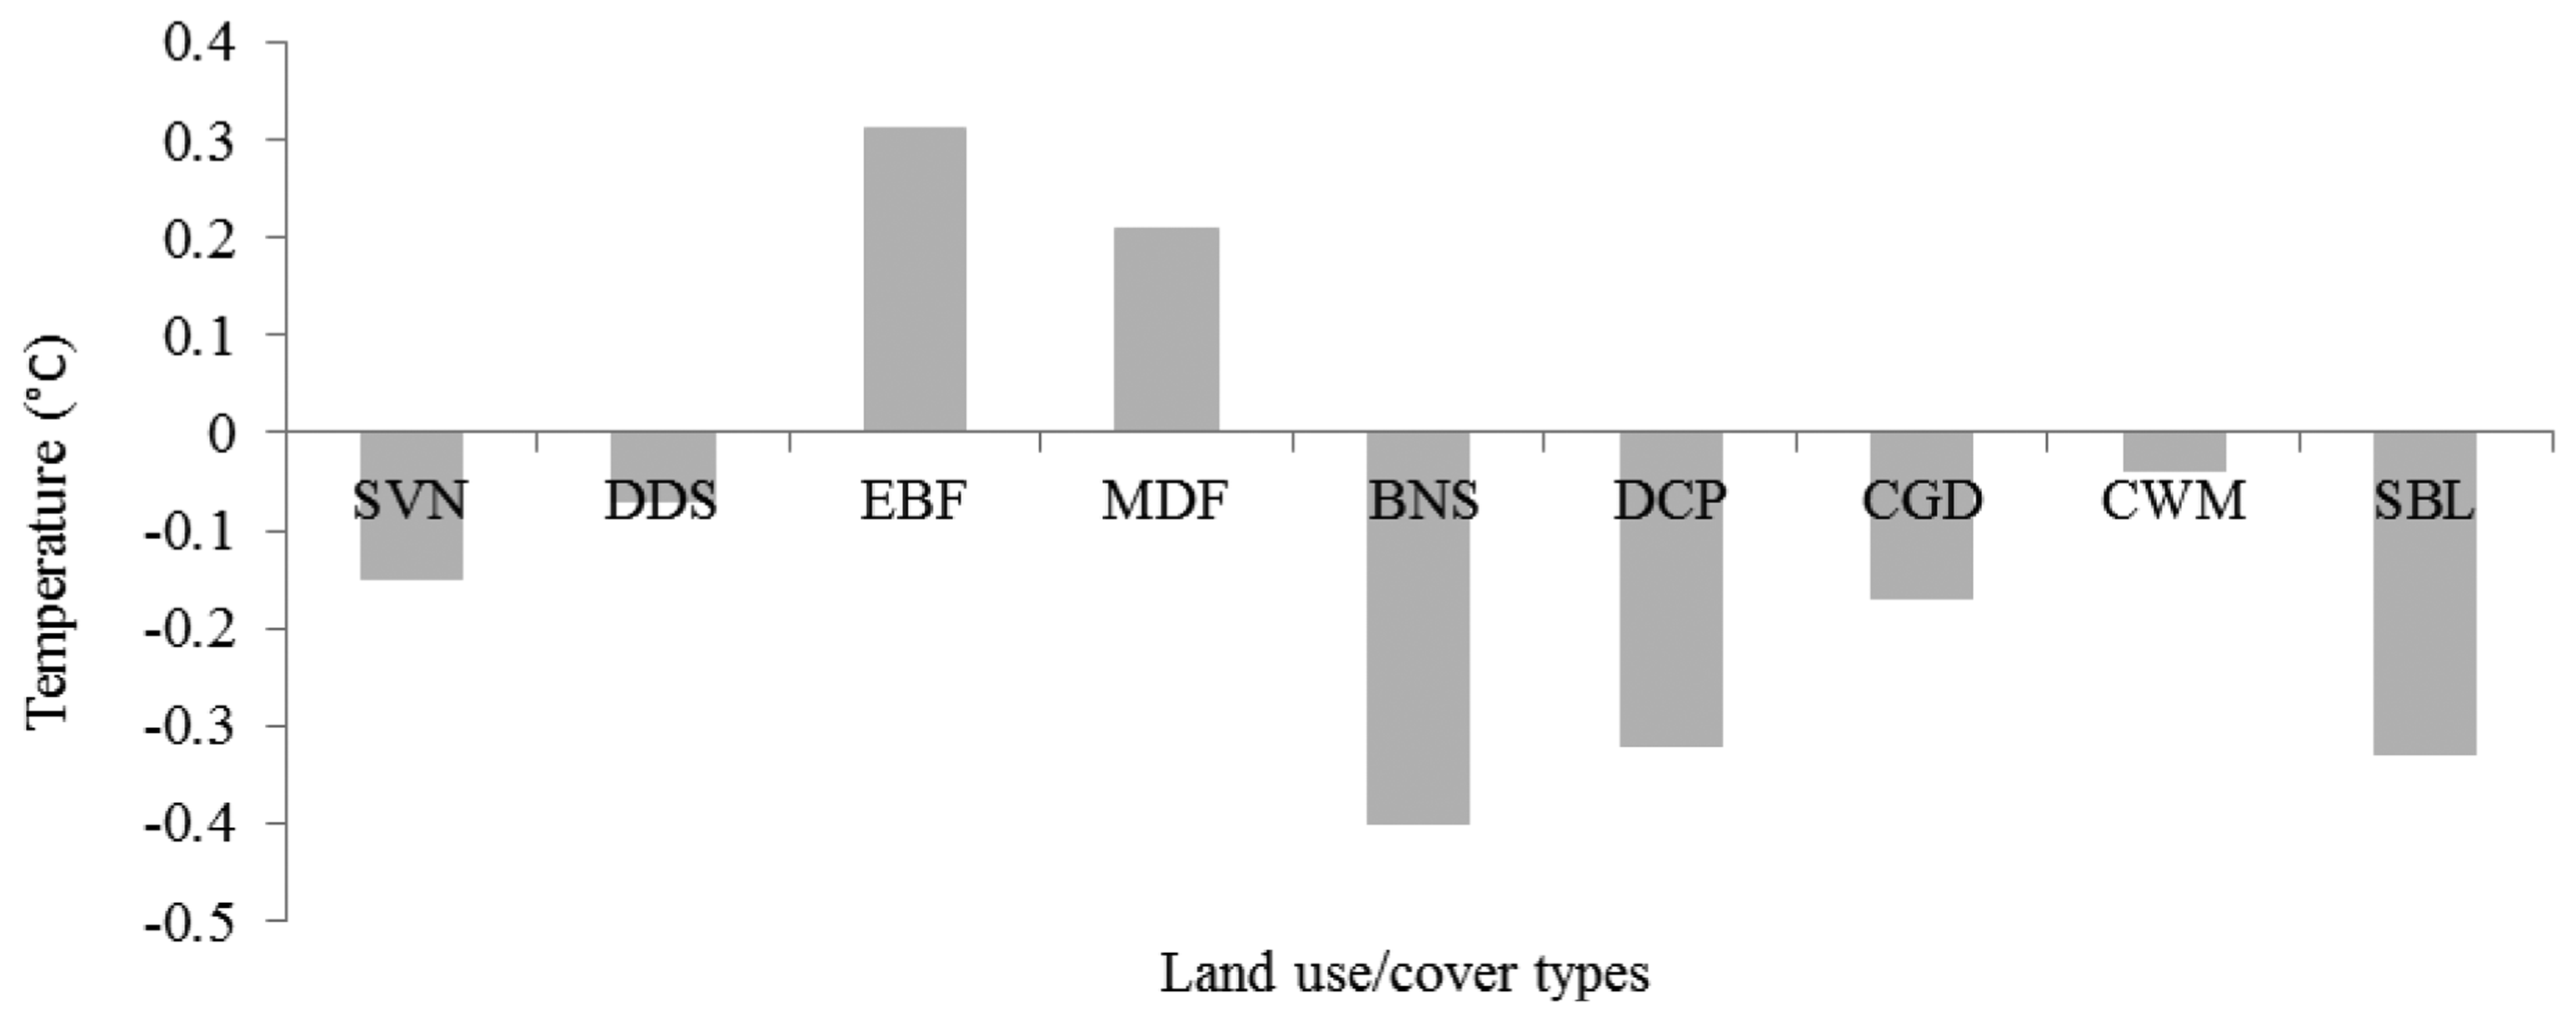
In order to better understand the relationship between future land conversion and the temperature change, we also calculate the monthly average temperature change in the area where other types of land convert to Irrigated Cropland and Pasture in summer (Figure 8). Overall, different types of land conversation have different effects on temperature. Specifically, the conversion from evergreen broadleaf forest to irrigated cropland and pasture would lead to an increment of the average monthly temperature by 0.31 °C. Similarly, the conversion from mixed forest to irrigated cropland and pasture will result in an increment of 0.21 °C of the average monthly temperature.
In contrast to these two types of cultivated land reclamation, other kinds of land irrigation have some cooling effect on the surface temperature in summer. For example, conversion from barren or sparsely vegetated to irrigated cropland and pasture will lead to a significant decrease of the monthly average temperature by 0.40 °C. Also, the climatic effect of the land conversion from Dryland cropland and pasture and Shrubland to Irrigated Cropland and Pasture should not be ignored, with a decrement of 0.32 °C and 0.33 °C, separately. Generally, the different land irrigation activities have different effect on the surface temperature.
4.4. The Effects of Grassland Degradation in Mongolia
Overall, the simulation results indicate that grassland degradation in Mongolia also has some effect on the spatial heterogeneity of the annual average temperature (Figure 5d). There would be a slight increase of the surface temperature on the whole region. As for the spatial variation, this increasing tendency of average annual surface temperature would decrease gradually from west to east. In addition, most of the areas (about 70%) would experience an increase of the annual average temperature, especially the northwestern and central regions of Mongolia, while the increasing tendency can be up to 0.1 °C. Meanwhile, in small part of the southwestern and eastern regions of Mongolia, average annual surface temperature will decrease by about 0.1 °C.
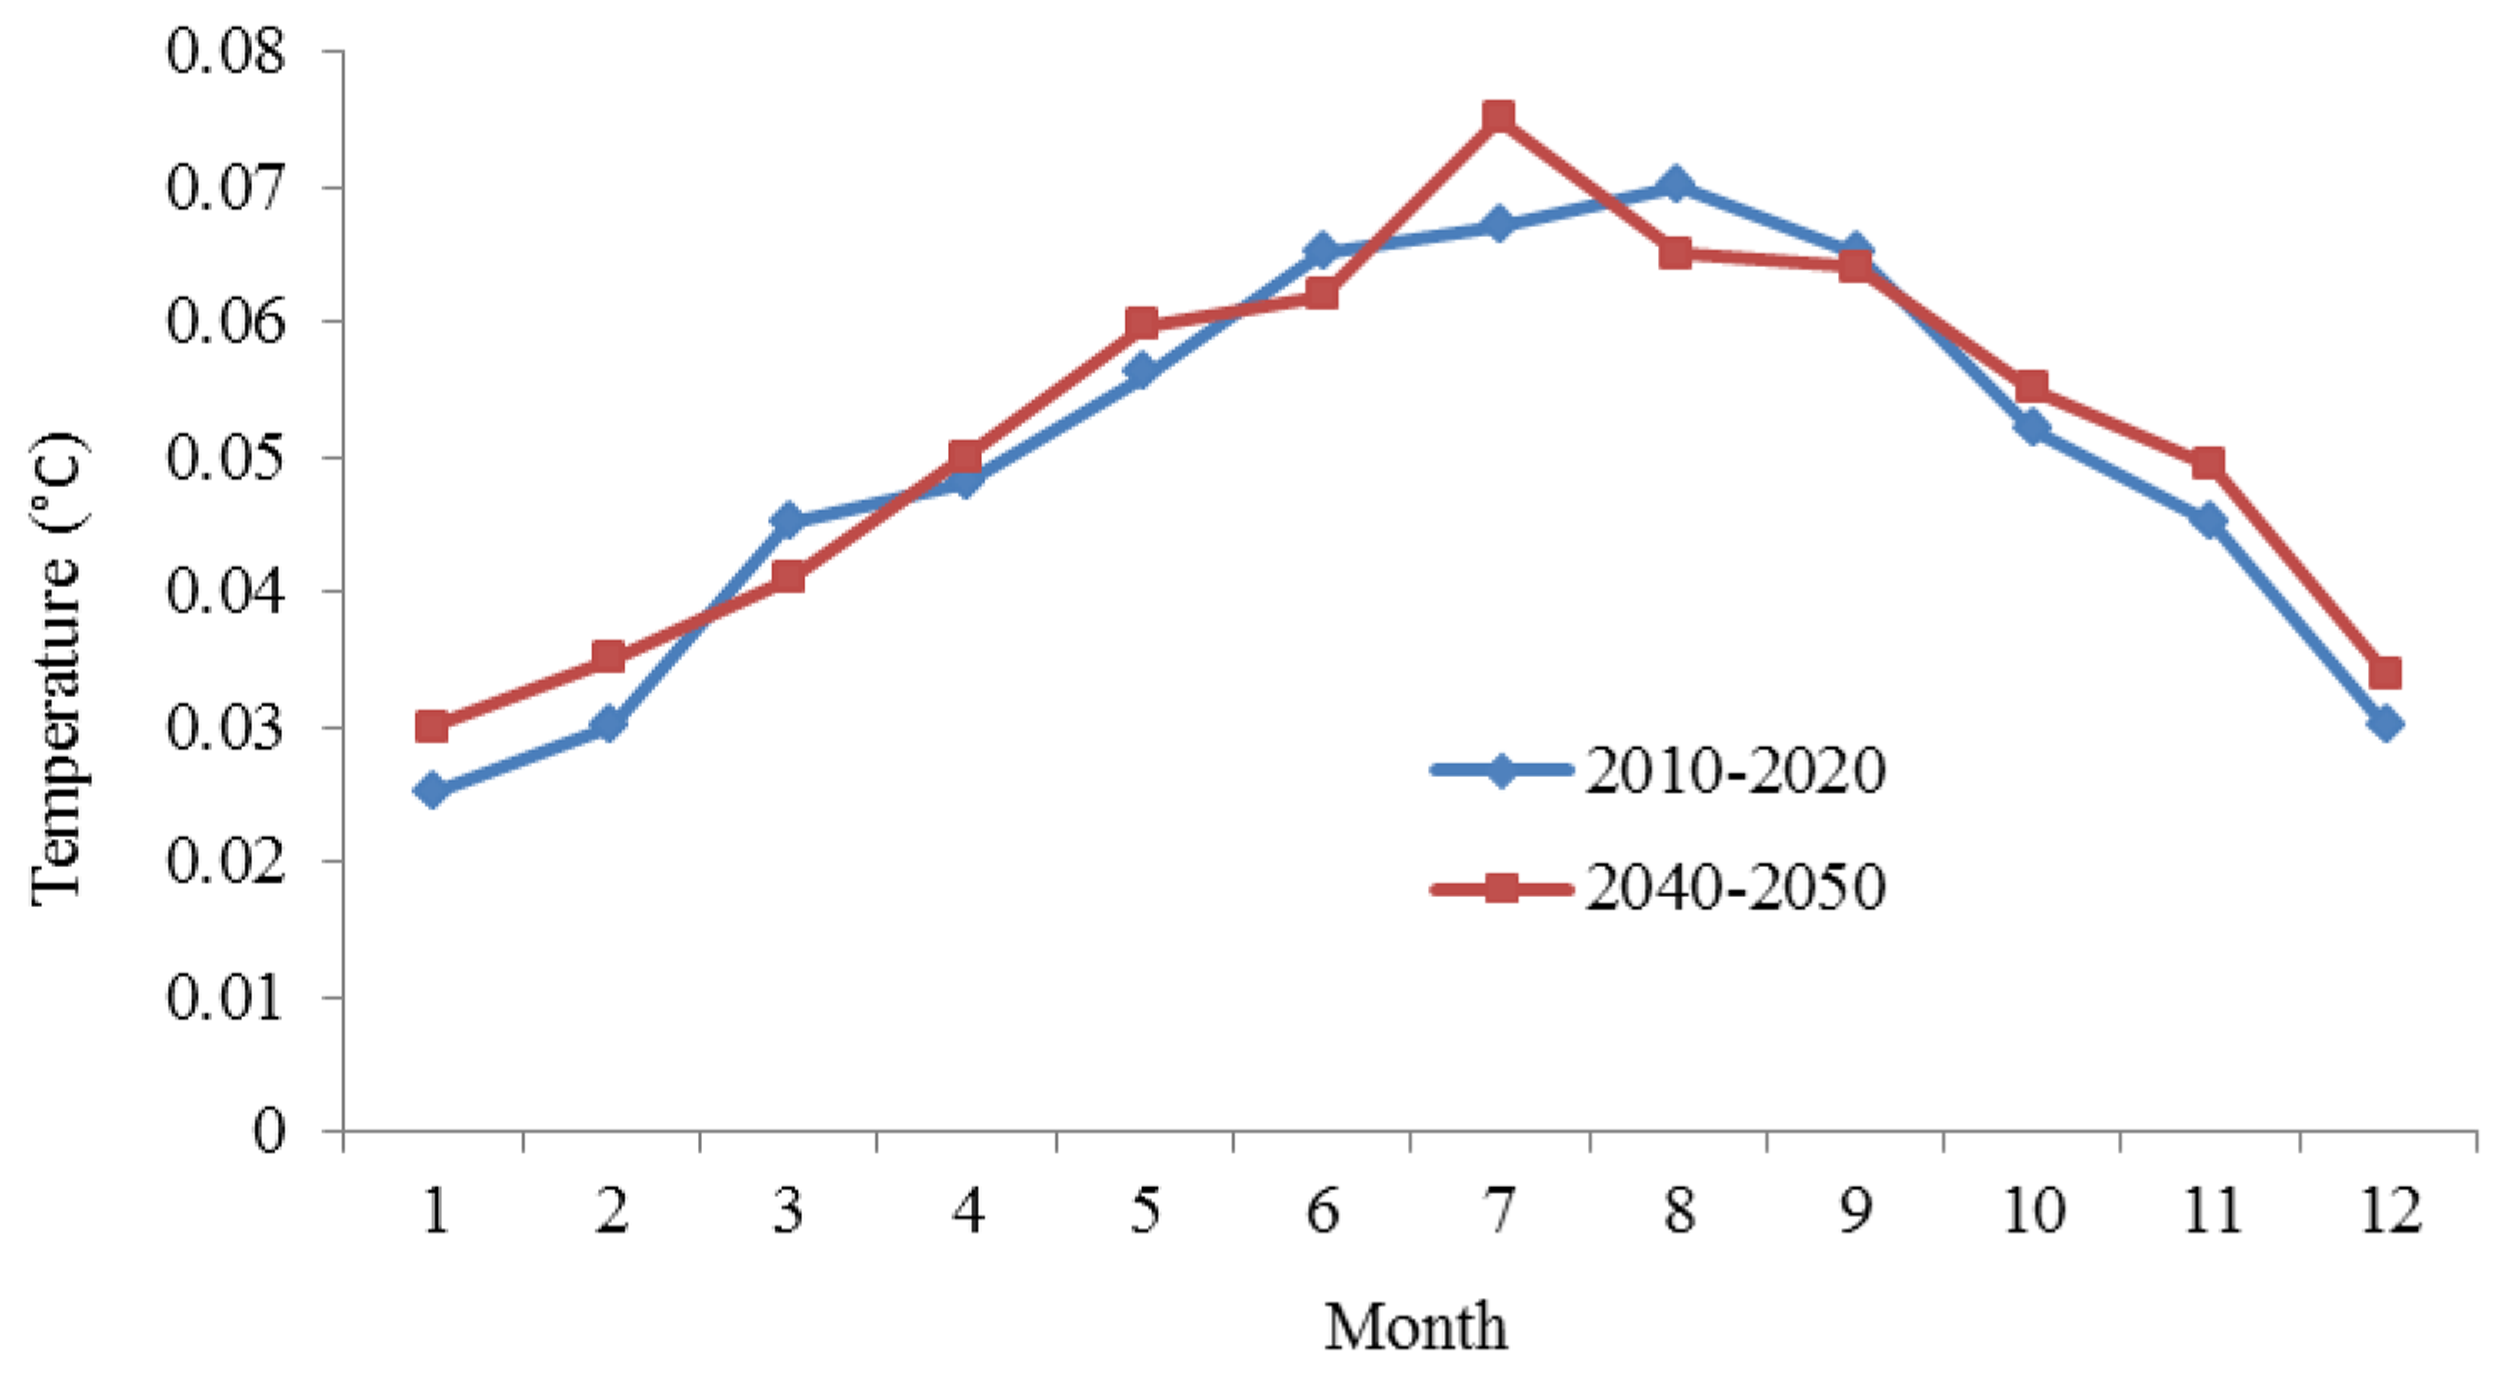
The impact of grassland degradation on surface temperature is more complicated and widespread in the summer than that in the winter, in the time period of 2040–2050 than 2010–2020 (Figure 9). Generally, there will be an increasing tendency trend of annual average temperature with an increment of 0.03 °C–0.07 °C during 2010–2020 and 2040–2050. The simulated result indicates that increase tendency of the monthly average temperature from month to month during 2010–2020 and 2040–2050 are basically the same, with obvious seasonal characteristics.
5. Discussion and Conclusions
In this study, the potential impacts of four types of large-scale LUCC (urbanization, deforestation, cultivated land reclamation, and grassland degradation) on surface temperature are analyzed along with IPCC RCPs. For the case study in urbanization in USA, the land cover change is just characterized by urban expansion, and in the case of grassland degradation in Mongolia, the main land change progress is just the grassland degraded to Barren or Sparsely Vegetated land (one type of land cover in USGS classification which is presented in Figure 1). In contrast to these distinct LUCC, in the case studies of Brazilian Amazon and India, we observed that there are several land types conversion in the case of irrigation in India and deforestation in Brazilian Amazon. Specifically, the deforestation in Brazilian Amazon includes the land conversion among Dryland cropland and pasture, Cropland/woodland mosaic, Grassland, Shrubland, Savanna, Evergreen broadleaf forest as well as Wooded wetland et al. In addition, the land irrigation in India includes different land conversions from other land types (Savanna, Deciduous broadleaf forest, Evergreen broadleaf forest, Barren or sparsely vegetated, Shrubland, etc.) to the Irrigated Cropland and Pastureland types.
Urbanization is a predominant LUCC and it is one of the most important human activities that influence the climate system. As more megacities (more than 10 million people) are developing, the climatic effect of this urban expansion pattern should not be ignored. The average annual and monthly temperature change caused by urbanization during 2010–2050 is presented by taking the Northeast megalopolis, USA as a case study area. The effects of future urbanization on average monthly temperature would vary from month to month and become more and more severe along with urbanization in not only original and new urban area but also nonurban area. The warming effect of future urbanization in original and new urbanization area will be more serious in summer than in winter even if there would be a cooling effect in winter in original urban area. More importantly, the spatial pattern of urban expansion is coordinated with that of the temperature increment; therefore the results of this study can provide some scientific basis for the urban planning. In addition, more megacities (with more than 10 million people) are developing in developing countries. For example, as one of the biggest developing countries in the world, China has crossed the “urban tipping point”, with about 52.57% percent of its population now living in cities. The warming effect of urbanization, which is shown in this study, can serve as an alert for the disordered urban expansion.
For climatic changes in the tropical area, a lot of studies have been conducted to explore the influences of vegetation vulnerability on climate variability in Amazon using various methods such as statistical extrapolation and General Circulation Models (GCMs). However, no debate of reasonable future tropical forest land changes will be complete without taking the Brazilian Amazonia forests as a key component into account in climate researches with high resolution. For the effects of deforestation in the case study of in Brazilian Amazon, the land surface changes are quite different from previous studies. Forests are mainly converted into pasture and woodland, distributed along the edge of the study area and river branches. The simulated climatic results caused by these potential future land surface changes show that expanding deforestation would principally trigger the increase of surface temperature in the deforested area. For the deforestation in other part of the world, such as the boreal forest region, the tendency of the regional annual temperature maybe different because of the some other factors such as the different vegetation cover.
As for the cultivated land reclamation, there is still a trend of reclamation of cultivated land in 2010–2050 form the data base of IPCC RCP 6.0 since the population growth leads the increasing grain demand. The cultivated land reclamation has obvious impacts on the climate in India. Since the different types of reclamation of cultivated land involve different types of LUCC and cropland management modes, there will be some differences in the change of the geophysical parameters such as latent heat flux and sensible heat flux, which will subsequently lead to different effects on the surface temperature in different cultivated reclamation regions. However, with the help of the methodology, the impacts of cropland management practices can be analyzed and emphasized since there will be likely substantial cultivated land change due to the land use management as the society strives to meet growing food demands. For example, China as a large agricultural country plays a very important role in the international grain market and has great demand for grain. As a result, the cultivated land reclamation in Northeast China and Northern China has lasted for many years.
Among the four case studies, the grassland degradation has some slight effect on the regional temperature in the next 40 years in Mongolia and the effects have spatial and temporal heterogeneity. Annual average temperature will change significantly from April to September, and the maximum change is in July. Additionally, results indicate that the WRF model can well simulate the spatial pattern and change of temperature, although the simulated value is a bit lower than the observed value. The results of this study can also provide an alert for other regions with widespread grasslands, e.g., Inner Mongolia of China, which is located to the south of Mongolia. Compared to urban land and cultivated land, the grassland in the world covers a much larger area and is generally more continuously distributed with a large scale. Therefore, the grassland degradation is analyzed with the resolution of 50 km × 50 km in the case studies of the grassland degradation in Mongolia.
Acknowledgments
This research was financially supported by the National Key Programme for Developing Basic Science in China (Grant No. 2010CB950900), the major research plan of the National Natural Science Foundation of China (Grant No. 91325302) and the National Natural Science Funds of China for Distinguished Young Scholar (Grant No. 71225005).
Conflicts of Interest
The authors declare no conflict of interest.
Appendix


References
- Foley, J.A.; DeFries, R.; Asner, G.P.; Barford, C.; Bonan, G.; Carpenter, S.R.; Chapin, F.S.; Coe, M.T.; Daily, G.C.; Gibbs, H.K. Global consequences of land use. Science 2005, 309, 570–574. [Google Scholar]
- Pachauri, R.; Reisinger, A. IPCC Fourth Assessment Report; IPCC: Geneva, Switzerland, 2007. [Google Scholar]
- Feddema, J.J.; Oleson, K.W.; Bonan, G.B.; Mearns, L.O.; Buja, L.E.; Meehl, G.A.; Washington, W.M. The importance of land-cover change in simulating future climates. Science 2005, 310, 1674–1678. [Google Scholar]
- Bonan, G.B. Forests and climate change: Forcings, feedbacks, and the climate benefits of forests. Science 2008, 320, 1444–1449. [Google Scholar]
- Fu, C.; Dong, W.; Wen, G.; Ye, D. Regional response and adapatation to global change. Acta Meteorol. Sinica 2003, 2, 009. [Google Scholar]
- Kueppers, L.M.; Snyder, M.A. Influence of irrigated agriculture on diurnal surface energy and water fluxes, surface climate, and atmospheric circulation in California. Clim. Dyn. 2012, 38, 1017–1029. [Google Scholar]
- Betts, A.K.; Ball, J.H.; Beljaars, A.; Miller, M.J.; Viterbo, P.A. The land surface-atmosphere interaction: A review based on observational and global modeling perspectives. J. Geophys. Res. 1996, 101, 7209–7225. [Google Scholar]
- Phillips, O.L.; Aragão, L.E.; Lewis, S.L.; Fisher, J.B.; Lloyd, J.; López-González, G.; Malhi, Y.; Monteagudo, A.; Peacock, J.; Quesada, C.A. Drought sensitivity of the Amazon rainforest. Science 2009, 323, 1344–1347. [Google Scholar]
- Pielke, R.; Adegoke, J.; Beltran Przekurat, A.; Hiemstra, C.; Lin, J.; Nair, U.; Niyogi, D.; Nobis, T. An overview of regional land use and land cover impacts on rainfall. Tellus B 2007, 59, 587–601. [Google Scholar]
- Arora, V.K.; Montenegro, A. Small temperature benefits provided by realistic afforestation efforts. Nat. Geosci. 2011, 4, 514–518. [Google Scholar]
- Zhan, J.; Huang, J.; Zhao, T.; Geng, X.; Xiong, Y. Modeling the impacts of urbanization on regional climate change: A case study in the Beijing-Tianjin-Tangshan Metropolitan area. Adv. Meteorol. 2013, 2013. [Google Scholar] [CrossRef]
- Li, J.; Song, C.; Cao, L.; Zhu, F.; Meng, X.; Wu, J. Impacts of landscape structure on surface urban heat islands: A case study of Shanghai, China. Remote Sens. Environ. 2011, 115, 3249–3263. [Google Scholar]
- Oleson, K.W.; Bonan, G.B.; Feddema, J.; Vertenstein, M. An Urban Parameterization for a Global Climate Model. Part II: Sensitivity to Input Parameters and the Simulated Urban Heat Island in Offline Simulations. J. Appl. Meteorol. Climatol. 2008, 47. [Google Scholar] [CrossRef]
- Shepherd, J.M. A review of current investigations of urban-induced rainfall and recommendations for the future. Earth Interact. 2005, 9, 1–27. [Google Scholar]
- Stone, B., Jr. Land use as climate change mitigation. Environ. Sci. Technol. 2009, 43, 9052–9056. [Google Scholar]
- Stewart, I.D.; Oke, T.R. Local Climate Zones for Urban Temperature Studies. Bull. Am. Meteorol. Soc. 2012, 93, 1879–1900. [Google Scholar]
- Bathiany, S.; Claussen, M.; Brovkin, V.; Raddatz, T.; Gayler, V. Combined biogeophysical and biogeochemical effects of large-scale forest cover changes in the MPI earth system model. Biogeosci. Discussions 2010, 7, 387–428. [Google Scholar]
- Bonan, G.B. Effects of land use on the climate of the United States. Clim. Chang. 1997, 37, 449–486. [Google Scholar]
- Klein Goldewijk, K.; Beusen, A.; Van Drecht, G.; De Vos, M. The HYDE 3.1 spatially explicit database of human-induced global land-use change over the past 12,000 years. Glob. Ecol. Biogeogr. 2011, 20, 73–86. [Google Scholar]
- Douglas, E.; Beltrán-Przekurat, A.; Niyogi, D.; Pielke Sr, R.; Vörösmarty, C. The impact of agricultural intensification and irrigation on land–atmosphere interactions and Indian monsoon precipitation—A mesoscale modeling perspective. Glob. Planet. Chang. 2009, 67, 117–128. [Google Scholar]
- Oyama, M.D.; Nobre, C.A. Climatic consequences of a large-scale desertification in northeast Brazil: A GCM simulation study. J. Clim. 2004, 17, 3203–3213. [Google Scholar]
- Kueppers, L.M.; Snyder, M.A.; Sloan, L.C.; Cayan, D.; Jin, J.; Kanamaru, H.; Kanamitsu, M.; Miller, N.L.; Tyree, M.; Du, H. Seasonal temperature responses to land-use change in the western United States. Glob. and Planet. Chang. 2008, 60, 250–264. [Google Scholar]
- Douglas, E.M.; Niyogi, D.; Frolking, S.; Yeluripati, J.; Pielke, R.A.; Niyogi, N.; Vörösmarty, C.; Mohanty, U. Changes in moisture and energy fluxes due to agricultural land use and irrigation in the Indian Monsoon Belt. Geophys. Res. Lett. 2006, 33. [Google Scholar] [CrossRef]
- Lobell, D.; Bala, G.; Mirin, A.; Phillips, T.; Maxwell, R.; Rotman, D. Regional differences in the influence of irrigation on climate. J. Clim. 2009, 22, 2248–2255. [Google Scholar]
- Kueppers, L.M.; Snyder, M.A.; Sloan, L.C. Irrigation cooling effect: Regional climate forcing by land-use change. Geophys. Res. Lett. 2007, 34. [Google Scholar] [CrossRef]
- Singh, R. Environmental consequences of agricultural development: A case study from the Green Revolution state of Haryana, India. Agric. Ecosyst. Environ. 2000, 82, 97–103. [Google Scholar]
- Bounoua, L.; DeFries, R.; James Collatz, G.; Sellers, P.; Khan, H. Effects of land cover conversion on surface climate. Clim. Chang. 2002, 52, 29–64. [Google Scholar]
- Conant, R.T.; Paustian, K.; Elliott, E.T. Grassland management and conversion into grassland: effects on soil carbon. Ecol. Appl. 2001, 11, 343–355. [Google Scholar]
- Tilman, D.; May, R.M.; Lehman, C.L.; Nowak, M.A. Habitat destruction and the extinction debt. Nature 1994, 371, 65–66. [Google Scholar]
- Lieth, H.F. Patterns of Primary Production in the Biosphere; Dowden, Hutchinson and Ross Inc.: Stroudsbourg, PA, USA, 1978. [Google Scholar]
- Fernandez-Gimenez, M.E. The role of mongolian nomadic pasoralists/ecological knowledge in rangeland mangement. Ecol. Appl. 2000, 10, 1318–1326. [Google Scholar]
- Fan, J.; Zhong, H.; Harris, W.; Yu, G.; Wang, S.; Hu, Z.; Yue, Y. Carbon storage in the grasslands of China based on field measurements of above-and below-ground biomass. Clim. Chang. 2008, 86, 375–396. [Google Scholar]
- Barthold, F.; Wiesmeier, M.; Breuer, L.; Frede, H.-G.; Wu, J.; Blank, F. Land use and climate control the spatial distribution of soil types in the grasslands of Inner Mongolia. J. Arid Environ. 2013, 88, 194–205. [Google Scholar]
- Deng, X.; Huang, J.; Huang, Q.; Rozelle, S.; Gibson, J. Do roads lead to grassland degradation or restoration? A case study in Inner Mongolia, China. Environ. Dev. Econ. 2011, 16, 751–773. [Google Scholar]
- Degu, A.M.; Hossain, F.; Niyogi, D.; Pielke, R.; Shepherd, J.M.; Voisin, N.; Chronis, T. The influence of large dams on surrounding climate and precipitation patterns. Geophys. Res. Lett. 2011, 38. [Google Scholar] [CrossRef]
- Jin, J.; Miller, N.L.; Schlegel, N. Sensitivity study of four land surface schemes in the WRF model. Adv. Meteorol. 2010, 2010, 167436. [Google Scholar]
- Storm, B.; Dudhia, J.; Basu, S.; Swift, A.; Giammanco, I. Evaluation of the Weather Research and Forecasting Model on Forecasting Low-level Jets: Implications for Wind Energy. Wind Energy 2009, 12, 81–90. [Google Scholar]
- Moss, R.H.; Edmonds, J.A.; Hibbard, K.A.; Manning, M.R.; Rose, S.K.; van Vuuren, D.P.; Carter, T.R.; Emori, S.; Kainuma, M.; Kram, T. The next generation of scenarios for climate change research and assessment. Nature 2010, 463, 747–756. [Google Scholar]
- Fujino, J.; Nair, R.; Kainuma, M.; Masui, T.; Matsuoka, Y. Multi-gas Mitigation Analysis on Stabilization Scenarios Using Aim Global Model. Energy J. 2006, 27, 343–354. [Google Scholar]
- Powers, J.G. Numerical prediction of an antarctic severe wind event with the Weather Research and Forecasting (WRF) model. Mon. Weather Rev. 2007, 135, 3134–3157. [Google Scholar]
- Gottmann, J. Megalopolis: The Urbanized Northeastern Seaboard of the United States; MIT Press: Cambridge, MA, USA, 1964. [Google Scholar]
- Laurance, W.F. A crisis in the making: Responses of Amazonian forests to land use and climate change. Trends Ecol. Evol. 1998, 13, 411–415. [Google Scholar]
- Duchelle, A.E.; Cromberg, M.; Gebara, M.F.; Guerra, R.; Melo, T.; Larson, A.; Cronkleton, P.; Börner, J.; Sills, E.; Wunder, S. Linking Forest Tenure Reform, Environmental Compliance, and Incentives: Lessons from REDD+ Initiatives in the Brazilian Amazon. World Dev. 2014, 55, 53–67. [Google Scholar]
- Davidson, E.A.; de Araújo, A.C.; Artaxo, P.; Balch, J.K.; Brown, I.F.; Bustamante, M.M.; Coe, M.T.; DeFries, R.S.; Keller, M.; Longo, M. The Amazon basin in transition. Nature 2012, 481, 321–328. [Google Scholar]
- Werth, D.; Avissar, R. The local and global effects of Amazon deforestation. J. Geophys. Res. 2002, 107. [Google Scholar] [CrossRef]
- Ramos da Silva, R.; Werth, D.; Avissar, R. Regional impacts of future land-cover changes on the Amazon basin wet-season climate. J. Clim. 2008, 21, 1153–1170. [Google Scholar]
- Baidya Roy, S.; Avissar, R. Impact of land use/land cover change on regional hydrometeorology in Amazonia. J. Geophys. Res. 2002, 107. [Google Scholar] [CrossRef]
- Schneider, N.; Eugster, W.; Schichler, B. The impact of historical land-use changes on the near-surface atmospheric conditions on the Swiss Plateau. Earth Interact. 2004, 8, 1–27. [Google Scholar]
- Zhang, F.; Li, X.; Wang, W.; Ke, X.; Shi, Q. Impacts of future grassland changes on surface climate in Mongolia. Adv. Meteorol. 2013, 2013, 263746. [Google Scholar]
- Yatagai, A.; Yasunari, T. Trends and decadal-scale fluctuations of surface air temperature and precipitation over China and Mongolia during the recent 40 year period (1951–1990). J. Meteor. Soc. Jpn. 1994, 72, 937–957. [Google Scholar]
- Barger, N.N.; Ojima, D.S.; Belnap, J.; Shiping, W.; Yanfen, W.; Chen, Z. Changes in plant functional groups, litter quality, and soil carbon and nitrogen mineralization with sheep grazing in an Inner Mongolian grassland. Rangel. Ecol. Manag. 2004, 57, 613–619. [Google Scholar]
- Zhang, M.A.; Borjigin, E.; Zhang, H. Mongolian nomadic culture and ecological culture: On the ecological reconstruction in the agro-pastoral mosaic zone in Northern China. Ecol. Econ. 2007, 62, 19–26. [Google Scholar]
- Woldemichael, A.T.; Hossain, F.; Pielke, R. , Sr.; Beltrán-Przekurat, A. Understanding the impact of dam-triggered land use/land cover change on the modification of extreme precipitation. Water Resour. Res 2012, 48, W09547. [Google Scholar]
- Hernández-Ceballos, M.; Adame, J.; Bolívar, J.; la Morena, B.D. A mesoscale simulation of coastal circulation in the Guadalquivir valley (southwestern Iberian Peninsula) using the WRF-ARW model. Atmos. Res. 2012, 124, 1–20. [Google Scholar]


© 2014 by the authors; licensee MDPI, Basel, Switzerland. This article is an open access article distributed under the terms and conditions of the Creative Commons Attribution license ( http://creativecommons.org/licenses/by/3.0/).
Share and Cite
Deng, X.; Zhao, C.; Lin, Y.; Zhang, T.; Qu, Y.; Zhang, F.; Wang, Z.; Wu, F. Downscaling the Impacts of Large-Scale LUCC on Surface Temperature along with IPCC RCPs: A Global Perspective. Energies 2014, 7, 2720-2739. https://doi.org/10.3390/en7042720
Deng X, Zhao C, Lin Y, Zhang T, Qu Y, Zhang F, Wang Z, Wu F. Downscaling the Impacts of Large-Scale LUCC on Surface Temperature along with IPCC RCPs: A Global Perspective. Energies. 2014; 7(4):2720-2739. https://doi.org/10.3390/en7042720
Chicago/Turabian StyleDeng, Xiangzheng, Chunhong Zhao, Yingzhi Lin, Tao Zhang, Yi Qu, Fan Zhang, Zhan Wang, and Feng Wu. 2014. "Downscaling the Impacts of Large-Scale LUCC on Surface Temperature along with IPCC RCPs: A Global Perspective" Energies 7, no. 4: 2720-2739. https://doi.org/10.3390/en7042720