An Energy Management System of a Fuel Cell/Battery Hybrid Boat


Abstract
: All-electric ships are now a standard offering for energy/propulsion systems in boats. In this context, integrating fuel cells (FCs) as power sources in hybrid energy systems can be an interesting solution because of their high efficiency and low emission. The energy management strategy for different power sources has a great influence on the fuel consumption, dynamic performance and service life of these power sources. This paper presents a hybrid FC/battery power system for a low power boat. The hybrid system consists of the association of a proton exchange membrane fuel cell (PEMFC) and battery bank. The mathematical models for the components of the hybrid system are presented. These models are implemented in Matlab/Simulink environment. Simulations allow analyzing the dynamic performance and power allocation according to a typical driving cycle. In this system, an efficient energy management system (EMS) based on operation states is proposed. This EMS strategy determines the operating point of each component of the system in order to maximize the system efficiency. Simulation results validate the adequacy of the hybrid power system and the proposed EMS for real ship driving cycles.1. Introduction
Emissions related to ship propulsion (CO2, SOx and NOx) have a significant responsibility for environmental problems such as the greenhouse effect, acid rain and air pollution. It is reported that the CO2 emissions from ships accounts for about 3%–5% of total CO2 emissions in the world and corresponded to about 1 billion tons in 2010. It has been estimated by international maritime organization that, without any countermeasures, the carbon dioxide emission from ships will increase to 2.5 billion tons in 2050. Moreover, SO2 emissions of ship are also a problem. It is estimated that it will increase by 10%–20% in 2012, which corresponds to 5.2% of the total sulphate burden in the world [1].
Although shipping emissions are not covered by the Kyoto Agreement, stricter regulations have been developed in different countries. As an example, European Union (EU) has implemented stricter regulation to control the SO2 emissions in particularly sensitive sea areas, including the Western European Waters and the Baltic Sea areas. In those areas, sulphur content in the fuel used in ship should not exceed 0.1%. However, this content is more than 1% in most marine fuels [1,2]. This is why the development of alternative green energy sources has become a critical issue for ship propulsion. However, the high cost, the relatively low energy and power level and the technical barriers of alternative power systems such as fuel cell (FC) or other renewable energy systems limit their applications in ships.
One of the most promising technologies which can be used in a ship is FC system (FCS). There are several types of FCs [3]: the proton exchange membrane fuel cells (PEMFC), alkaline fuel cells (AFC), phosphoric acid fuel cells (PAFC), molten carbonate fuel cells (MCFC), solid oxide fuel cells (SOFC) and direct methanol fuel cells (DMFC). They can be classified on the basis of operating temperature. The low-temperature FCs, with an operating temperature range of 50–250 °C, include PEMFC, AFC and PAFC. MCFC and SOFC operate in a high temperature range of 650–1000 °C.
Some successful demonstrations have been realized in the past few years for marine applications with FCs [4–7]. Until now, most of exiting FC vessels is powered by low-temperature FCs because of their zero emissions, relatively high power density and quick start up. They are especially suitable for low power ships such as small pleasure or passenger boats, because the pure hydrogen needed for this technology can be relatively easily stored on the vessel and the energetic autonomy of the boat is not a key feature. On the other hand, high-temperature FCs, such as MCFC, SOFC, PEMFC with reformer, are more suitable for large power vessels because those FC can be fed, in this case, with more traditional fuels, such as diesel or gas. Some of feasibility, assessment and design implications are discussed in [8–11].
Although FCSs have good capability to follow the power demand during steady state operating conditions, the dynamic response to transient power demands is relatively poor. The dynamic variations of power demand will impose a serious stress on the FC membrane, thus reducing the lifetime of FCSs [3]. Besides, the FCSs employed for the vessels cannot to meet the instantaneous peak power demands, because of their higher cost compared to traditional internal combustion engine. Thus, the FCS can be hybridized with a battery bank to meet the total power demand. The degree of hybridization is the ratio of FC power to the total power requirements for a hybrid electric vehicle (HEV), and it can be determined according to the role of the energy storage system. Normally the FC should provide the minimum continuous power and the energy storage system covers the peak transient demands or acceleration performance needs. For marine applications, the primary mover of the FC must provide at least the cruising power. Otherwise it leads to dramatically increased energy requirements for the energy storage system. On the other hand, boats can provide larger space for energy storage compared to HEVs, so a battery with larger capacity can be installed on board. A hybrid FC-battery power system with a single DC/DC boost converter is proposed to meet the requirements in [12]. An energy management system (EMS) based on fuzzy logic is employed to a FC/battery/supercapacitor hybrid bus to allocate the power among different sources in [13]. Wang et al. [14] showed a comparison of different energy management strategies for HEVs.
In this paper, we will focus on the use of hybrid power configurations for a low power boat. The aim of the paper is to investigate the performance of such a hybrid system which associates a FC with a battery for the specification of low-power pleasure boat propulsion. For this case study, an efficient optimal EMS based on operation states is proposed. This EMS strategy determines the operating point of each component of the system in order to maximize the system efficiency.
The paper is organized as follows: Section 2 introduces the configuration of the hybrid power system structure for a FC boat; Section 3 presents the modeling of the hybrid power system; Section 4 proposes the EMS-based operating states; the simulations and discussion are presented in Section 5; and final conclusions are summarized in Section 6.
2. Descriptions of the FC Boat
In this paper, we used a common specification which corresponds to a real pleasure boat. These common specifications correspond to the FC boat of “Alsterwasser” and can be found in [15]. This boat has been developed by the Zero Emission Ships (Zemships) project, funded by the EU [6]. The aim of the project, which begun at the end of 2006 and ended in April 2010, was to provide technical solutions that are suitable for surface vessels. The FC boat was launched in August 2008 in Hamburg. The boat is 25.5 m long and 5.20 m wide with a carrying capacity of 100 passengers. The boat is equipped with two PEMFC of 80 kW and buffer battery of 560 V/360 A·h. The boat is fuelled by a total of 50 kg of hydrogen, which is stored onboard at a pressure of 350 bar. The parameters of the boat are shown in Table 1.
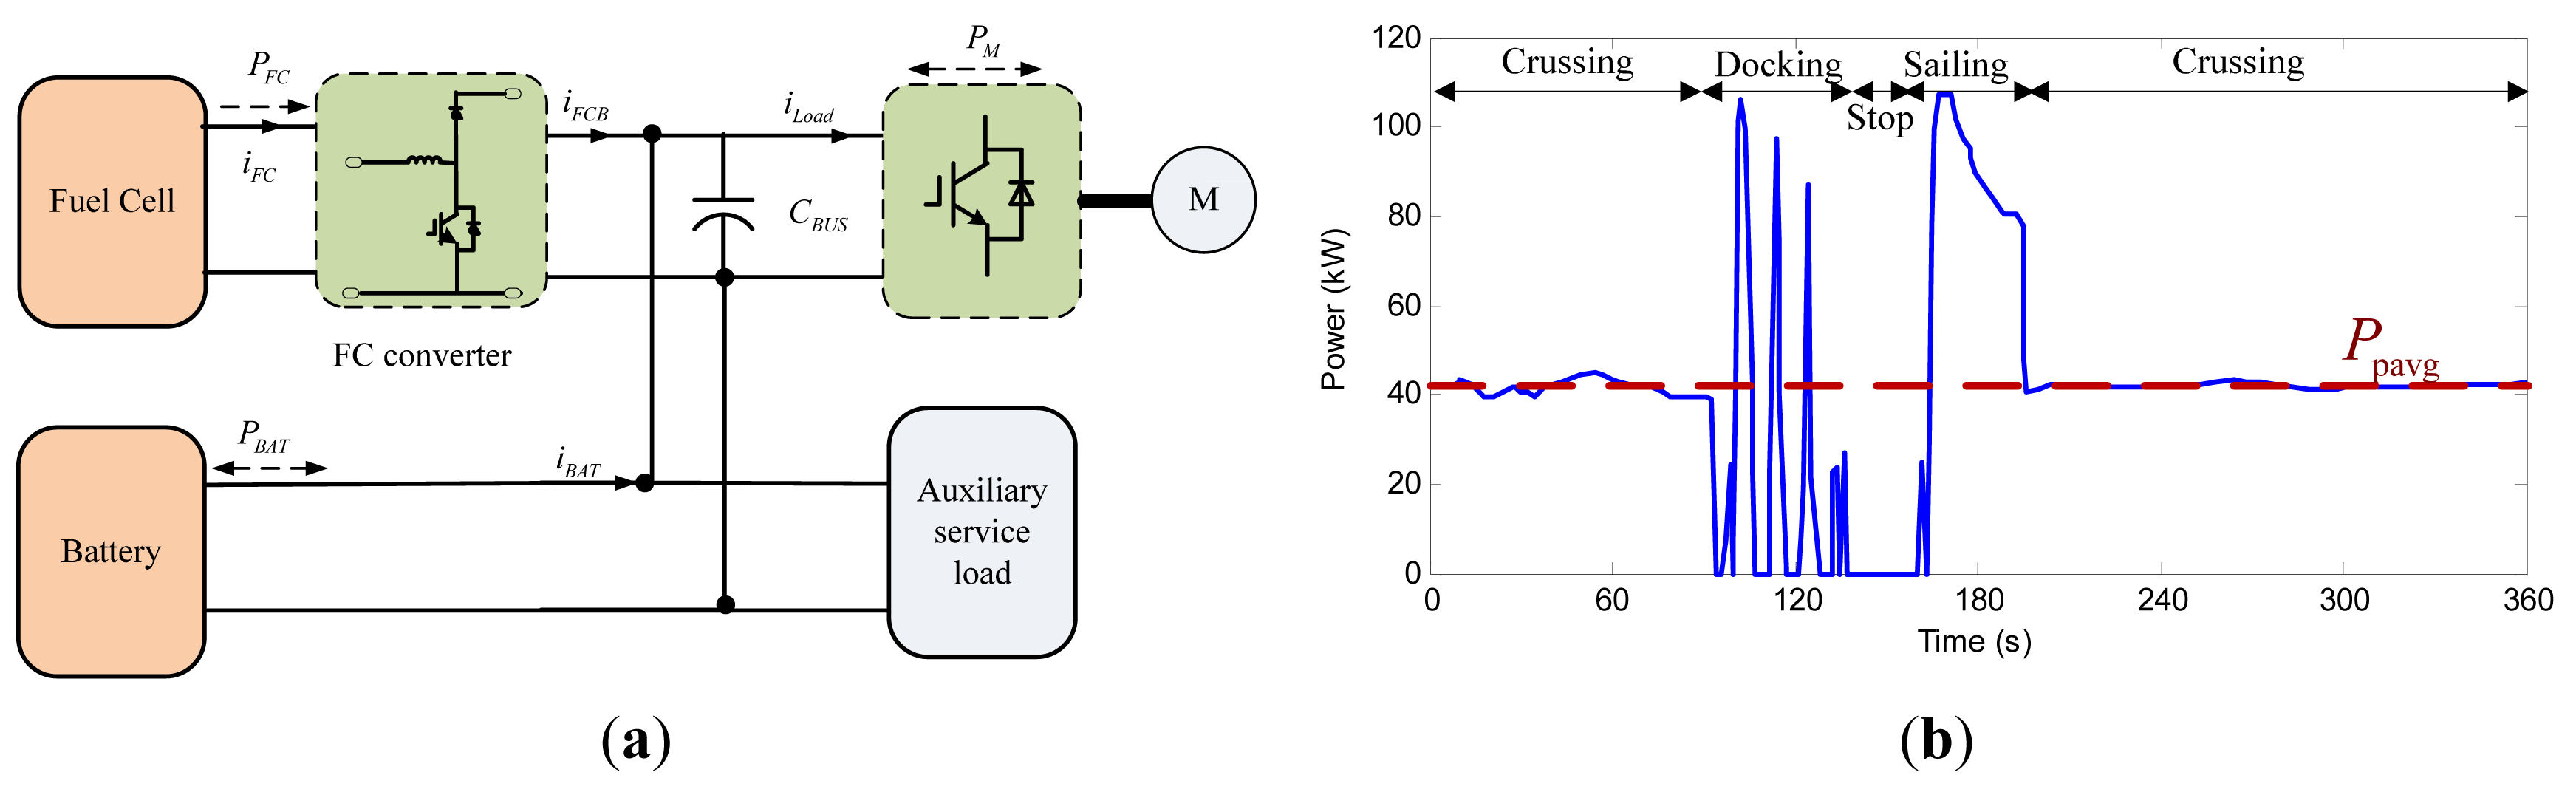
Figure 1a shows the configuration of the hybrid power system for the FC boat. The FCS is connected to the DC bus by a boost converter and battery is connected to the DC bus directly. Figure 1b shows the typical power driving cycle of the boat propulsion motor for docking and sailing [15]. Analyzing this driving cycle the main characteristics of the required power system can be evaluated:
The propulsion peak power is around 110 kW;
The acceleration time is around 32 s (163–195 s);
The cruising power is around 40 kW.
The average power is around 41 kW, without considering auxiliary power during the power cycle.
3. Modeling of the FC/Battery Hybrid Energy System
3.1. PEMFC
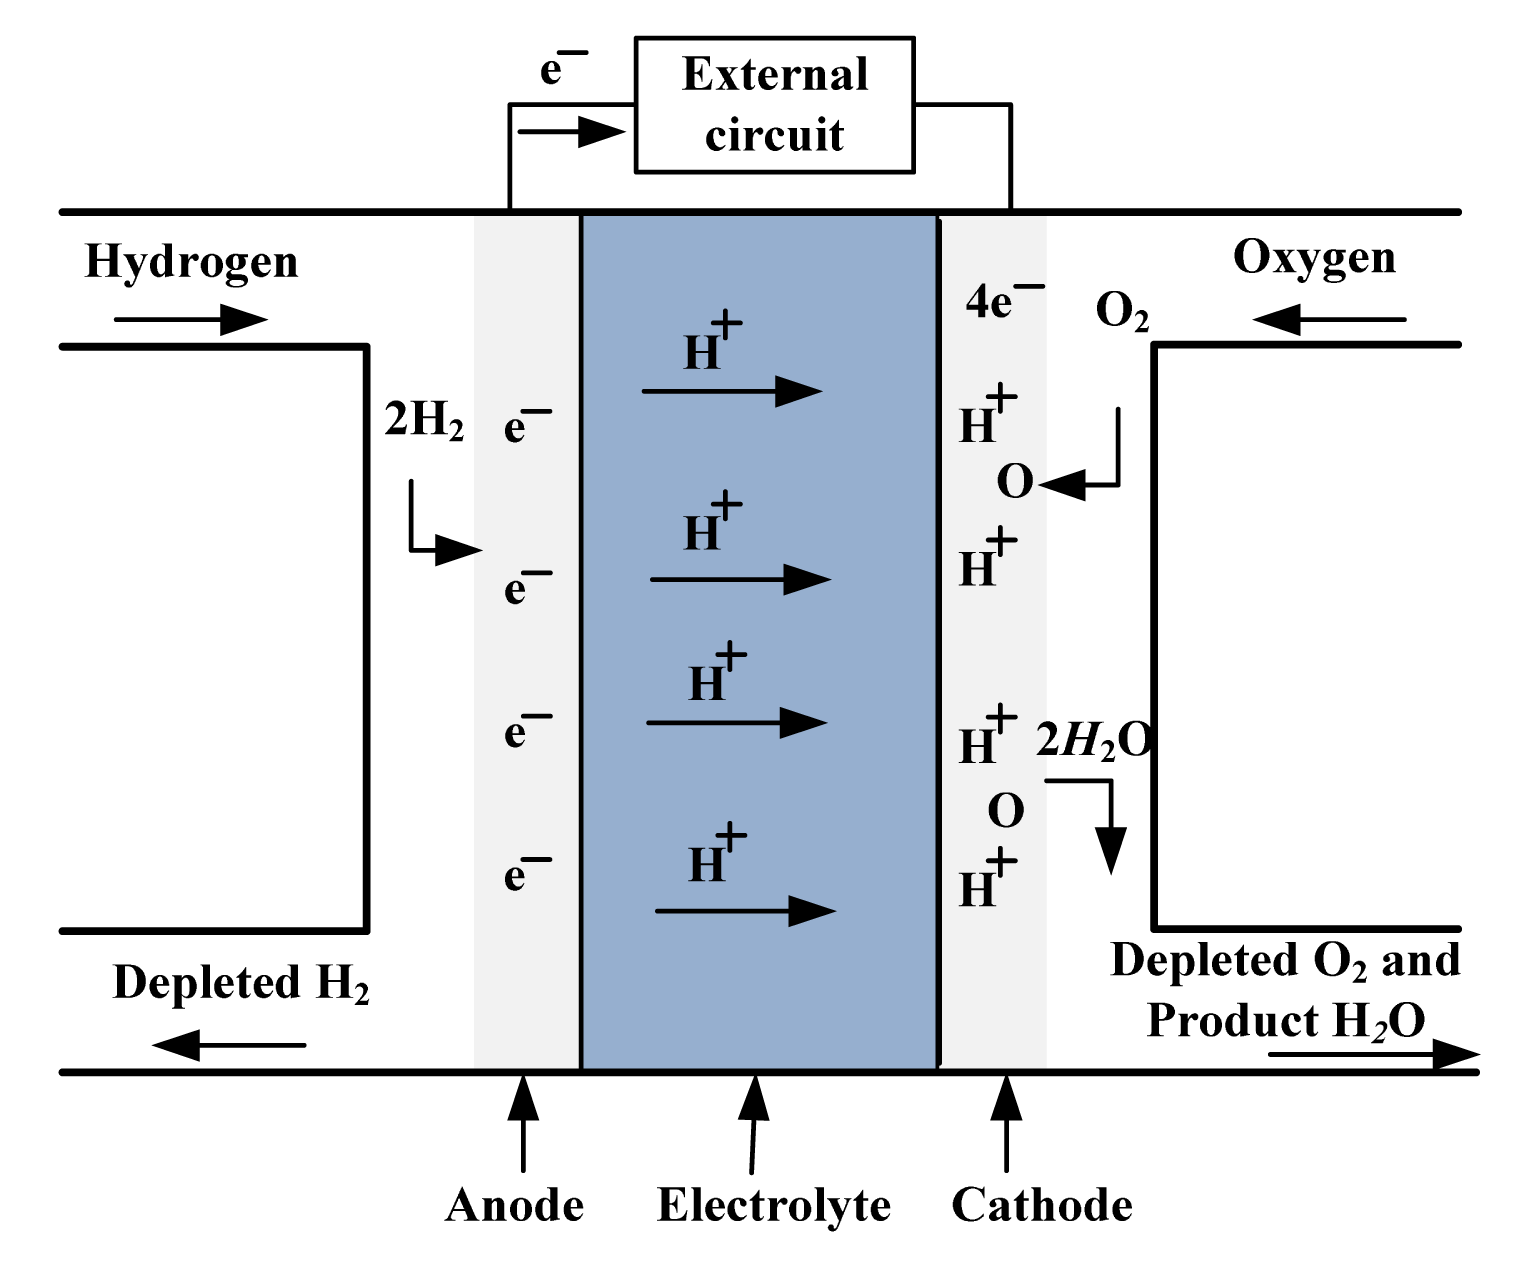
The FCS is an electrochemical device that converts chemical energy directly into electrical energy, which involves a set of physical and chemical reactions. Figure 2 shows the schematic of the FC. The FC is composed of anode, electrolyte and cathode. The electrolyte of PEMFC is a solid phase polymer membrane, which can conduct protons or H+ ions thanks to its excellent selective permeability.
The hydrogen fuel is fed continuously to anode electrode. Oxygen is simultaneously fed to cathode. Protons and ions are produced with an oxidation reaction shown in Equation (1). The positive ions flow from anode to cathode by the electrolyte exchange membrane which does not conduct electrons. If an external circuit is connected electrons can move through this circuit creating a current flow. All the positive or negative ions from anode to cathode combine with oxygen to produce water shown in Equation (2). The overall chemical reaction is shown by Equation (3).
Oxidation half reaction:
Reduction half reaction:
Cell reaction:
In this paper, the following assumptions are considered to obtain a simplified FC model:
The stack is fed with hydrogen and air and the gases are considered to be ideal;
The pressure drops across flow channels are considered to be negligible;
The stack operates at a constant temperature of 65 °C;
The humidity inside the stack is kept constant;
The stack is assumed not to work in the mass transport operating conditions.
The ideal open circuit voltage for a FC can be obtained by the Nernst equation, which is influenced by the partial pressures of reactants and products, temperature, reactant concentrations. Then, the output voltage of an FC is function of the Nernst's voltage, activation voltage, ohmic voltage drop, and concentration voltage [17,18]. Thus, a FC stack can be modeled by a controlled voltage source in series with a constant resistance. The FC voltage value can be defined as follows:
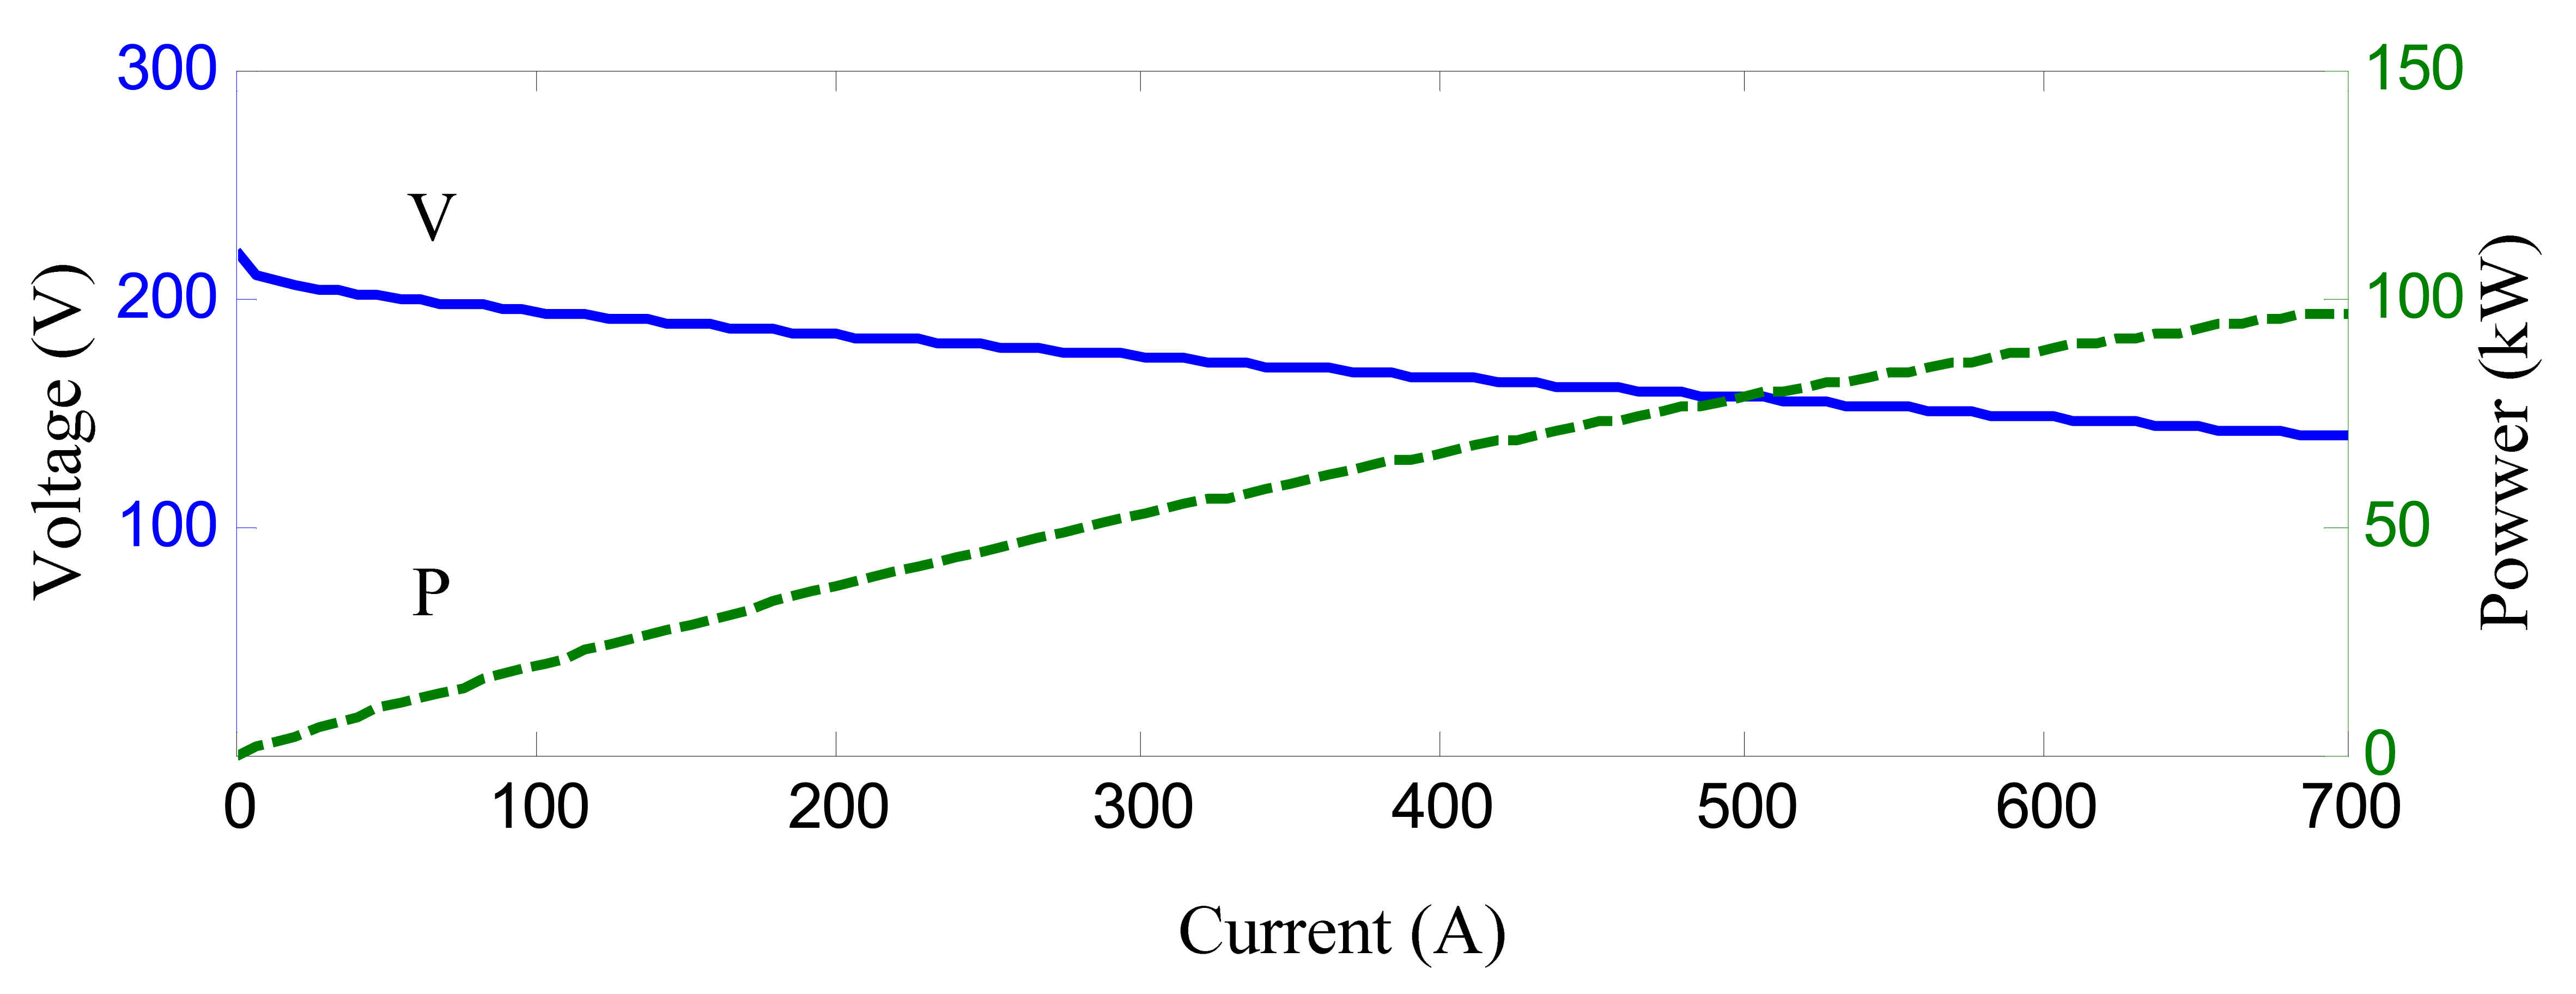
The studied FC is a PEMFC with a rated power of 80 kW. This FCS's parameters are summarized in Table 2.
The characteristics of this studied device (V-I and P-I characteristic curves) are shown in Figure 3.
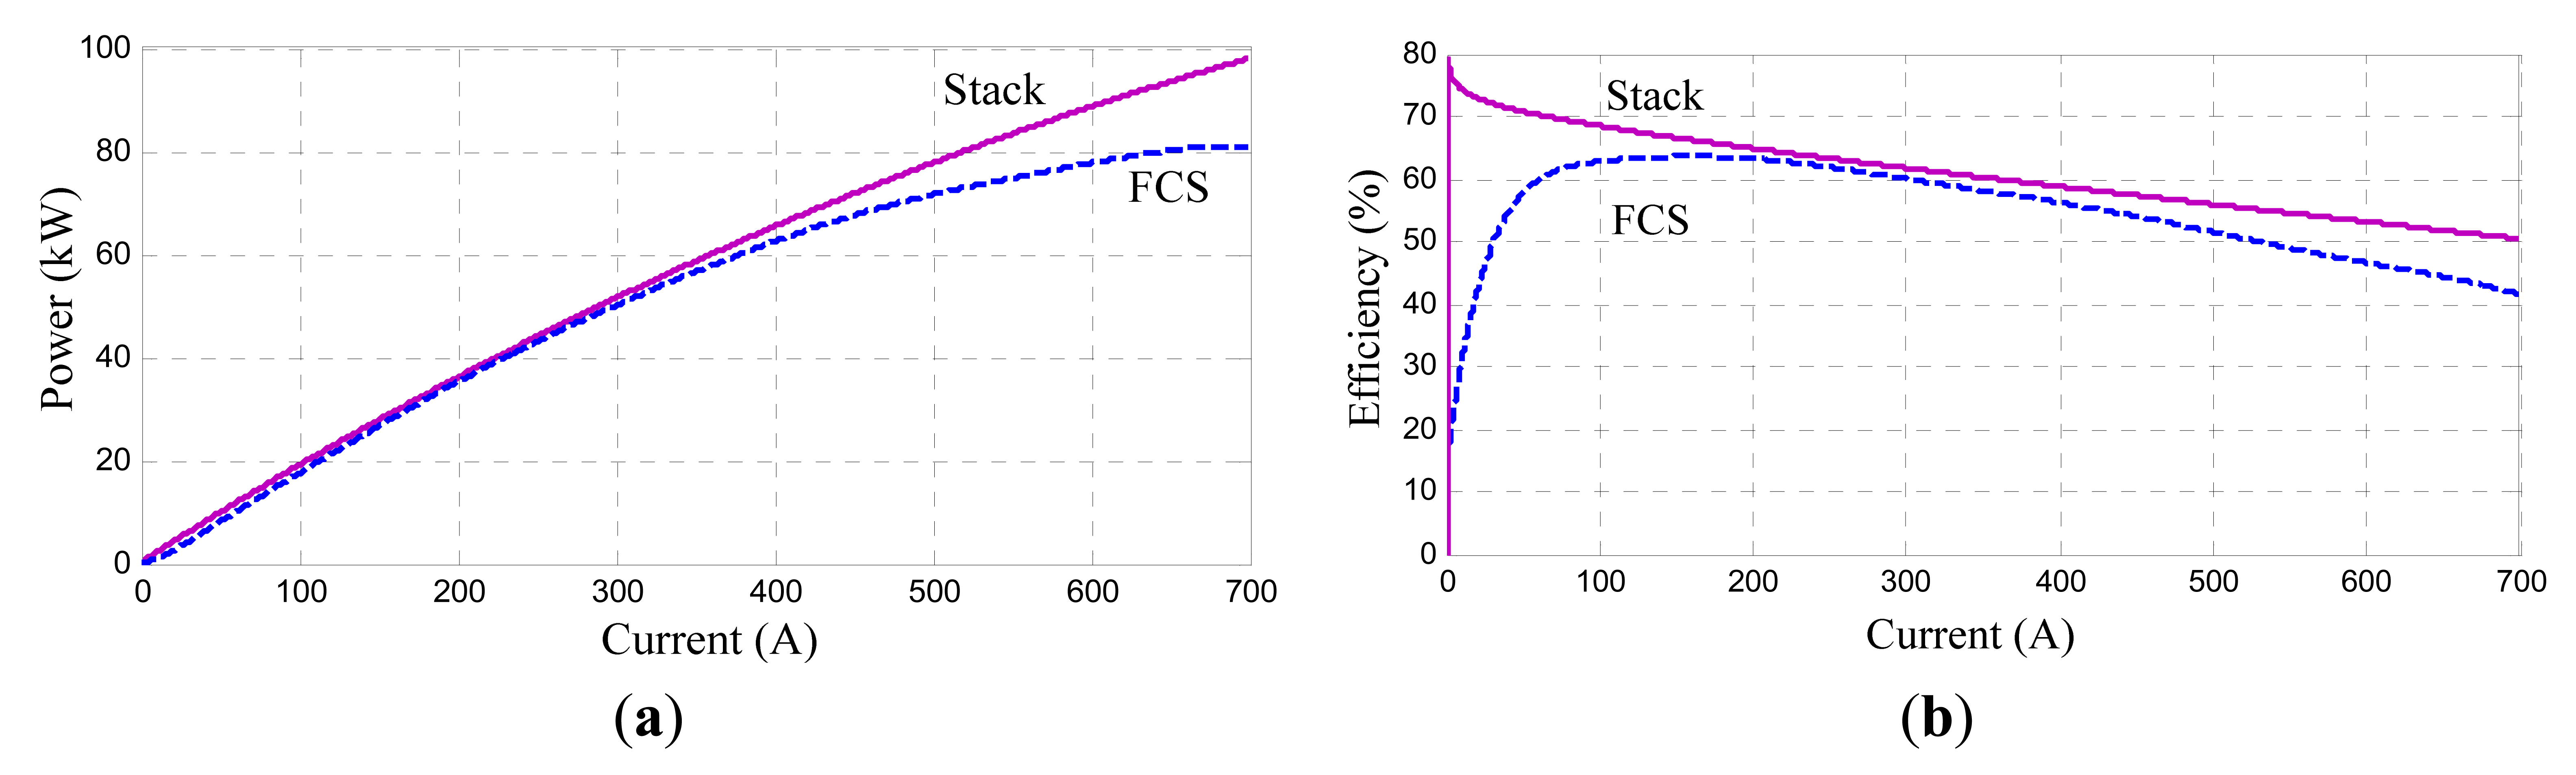
In a FCS, auxiliary power is often necessary because of the auxiliary components, such as compressor and cooling system. The auxiliary power requirement is estimated to be up to 30% of the FC stack power. The compressor consumes the main part (as much as 93.5%) of this auxiliary system power [19]. The typical power curves of the FC stack and FCS are shown in Figure 4a only considering the compressor power consumption. It can be found that the output power is approximately proportional to stack current. The efficiency of the FCS strongly depends on the output power, where the auxiliary power consumption is taken into account in this work, shown in Figure 4b. From Figures 3 and 4, it can be found that the approximate stack efficiency of the FC stack is 50% at the power of 98 kW, but the FCS efficiency is only 42%.
The FC voltage will drop when the output current arises. Therefore it should not to be connected to load directly, and a DC/DC converter is needed to control the output voltage.
3.2. Battery Bank
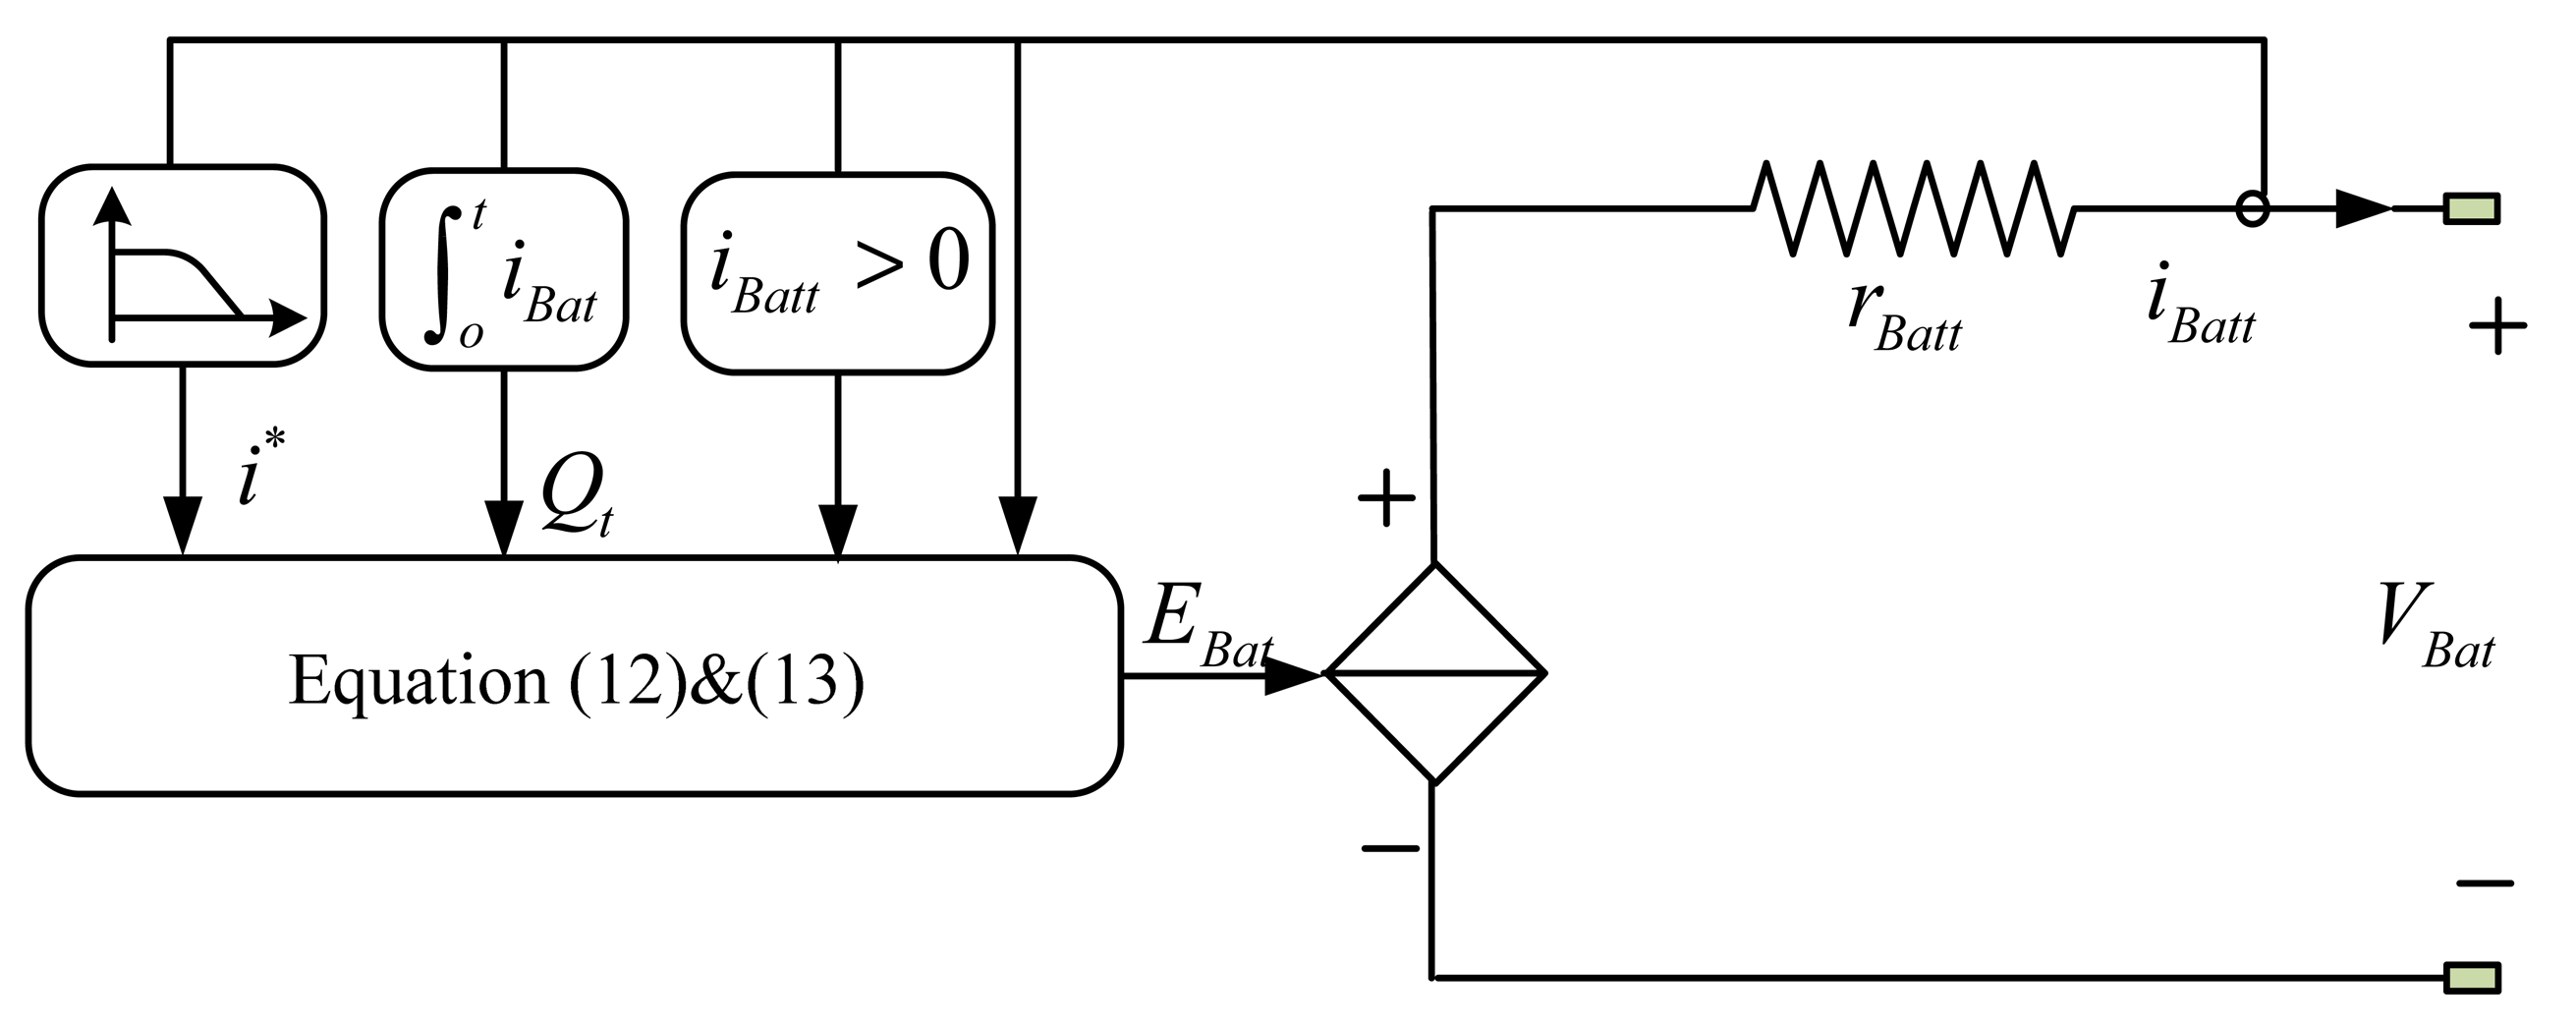
In our study, a lithium-ion battery has been chosen. This kind of battery is an attractive candidate for electric vehicle (EV) applications (bus, truck and boat) due to its high energy density, long cycle life and relatively low self-discharge rate, compared to traditional lead acid batteries. Therefore, in our case, a high energy polymer Li-ion battery bank is used as energy storage device. The battery is modeled classically as a controlled voltage source in series with a resistance as shown in Figure 5.
The battery output voltage (VBat) is derived as follows [19,20]:
The open circuit battery voltage which depends on the battery current, state of charge (SOC) and hysteresis phenomenon of the battery with the temperature ignored is defined as follows. The behavioral model of this battery comprises two parts: a discharge mode model and a charge mode model which are used considering the operating conditions (testing on the value of i*).
The value of battery voltage in the discharge mode (i* > 0) is given by:
The voltage value in charge mode (i* < 0) is given by Equation (13):
In Equations (12) and (13), EBatdis and EBatcha are the open circuit voltage (V); E0 is constant voltage (V); K is polarization constant (V/A h); i* is low frequency current dynamics (A); iBatt is battery current (A); Qt is actual battery charge (A h); Q is Maximum battery capacity (A h); A is exponential voltage (V); and B is exponential capacity (A h).
The SOC of battery is denoted by:
C rate of battery is used to describe its discharging or charging. The C rate is defined as:
The studied 576 V/180 A·h battery bank is composed of three packs in parallel, and every pack is made up of 12 × 48 V/60 A·h modules in series. The parameters are listed in Table 3.
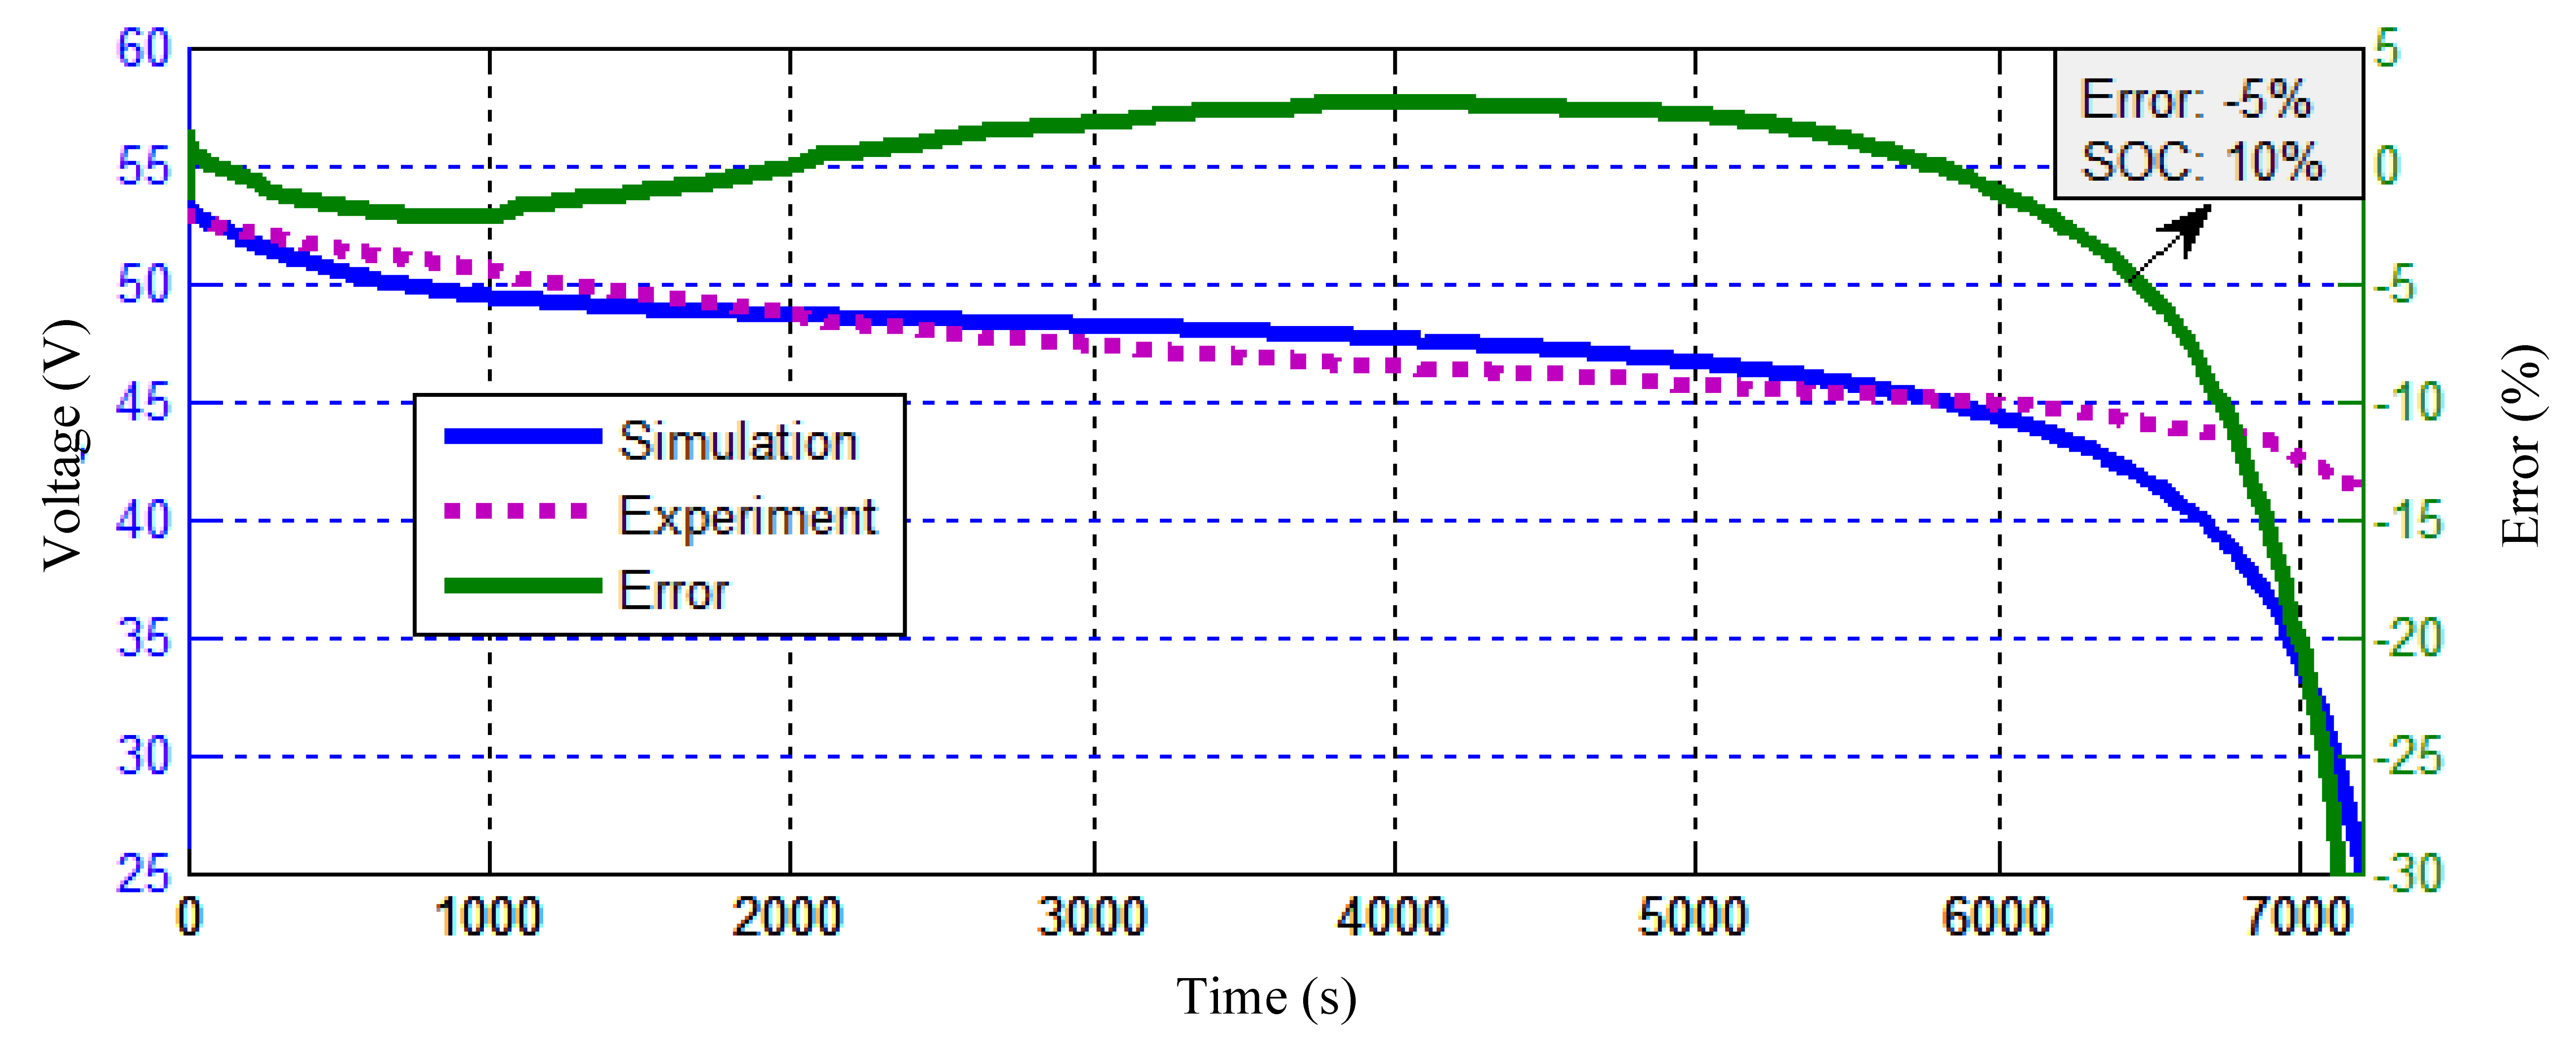
Figure 6 shows the comparison between the experimental and simulated discharge characteristics. From the figure, it can be seen that the battery voltage error is less than 5% when the battery SOC is more than 10%.
3.3. DC/DC Converters
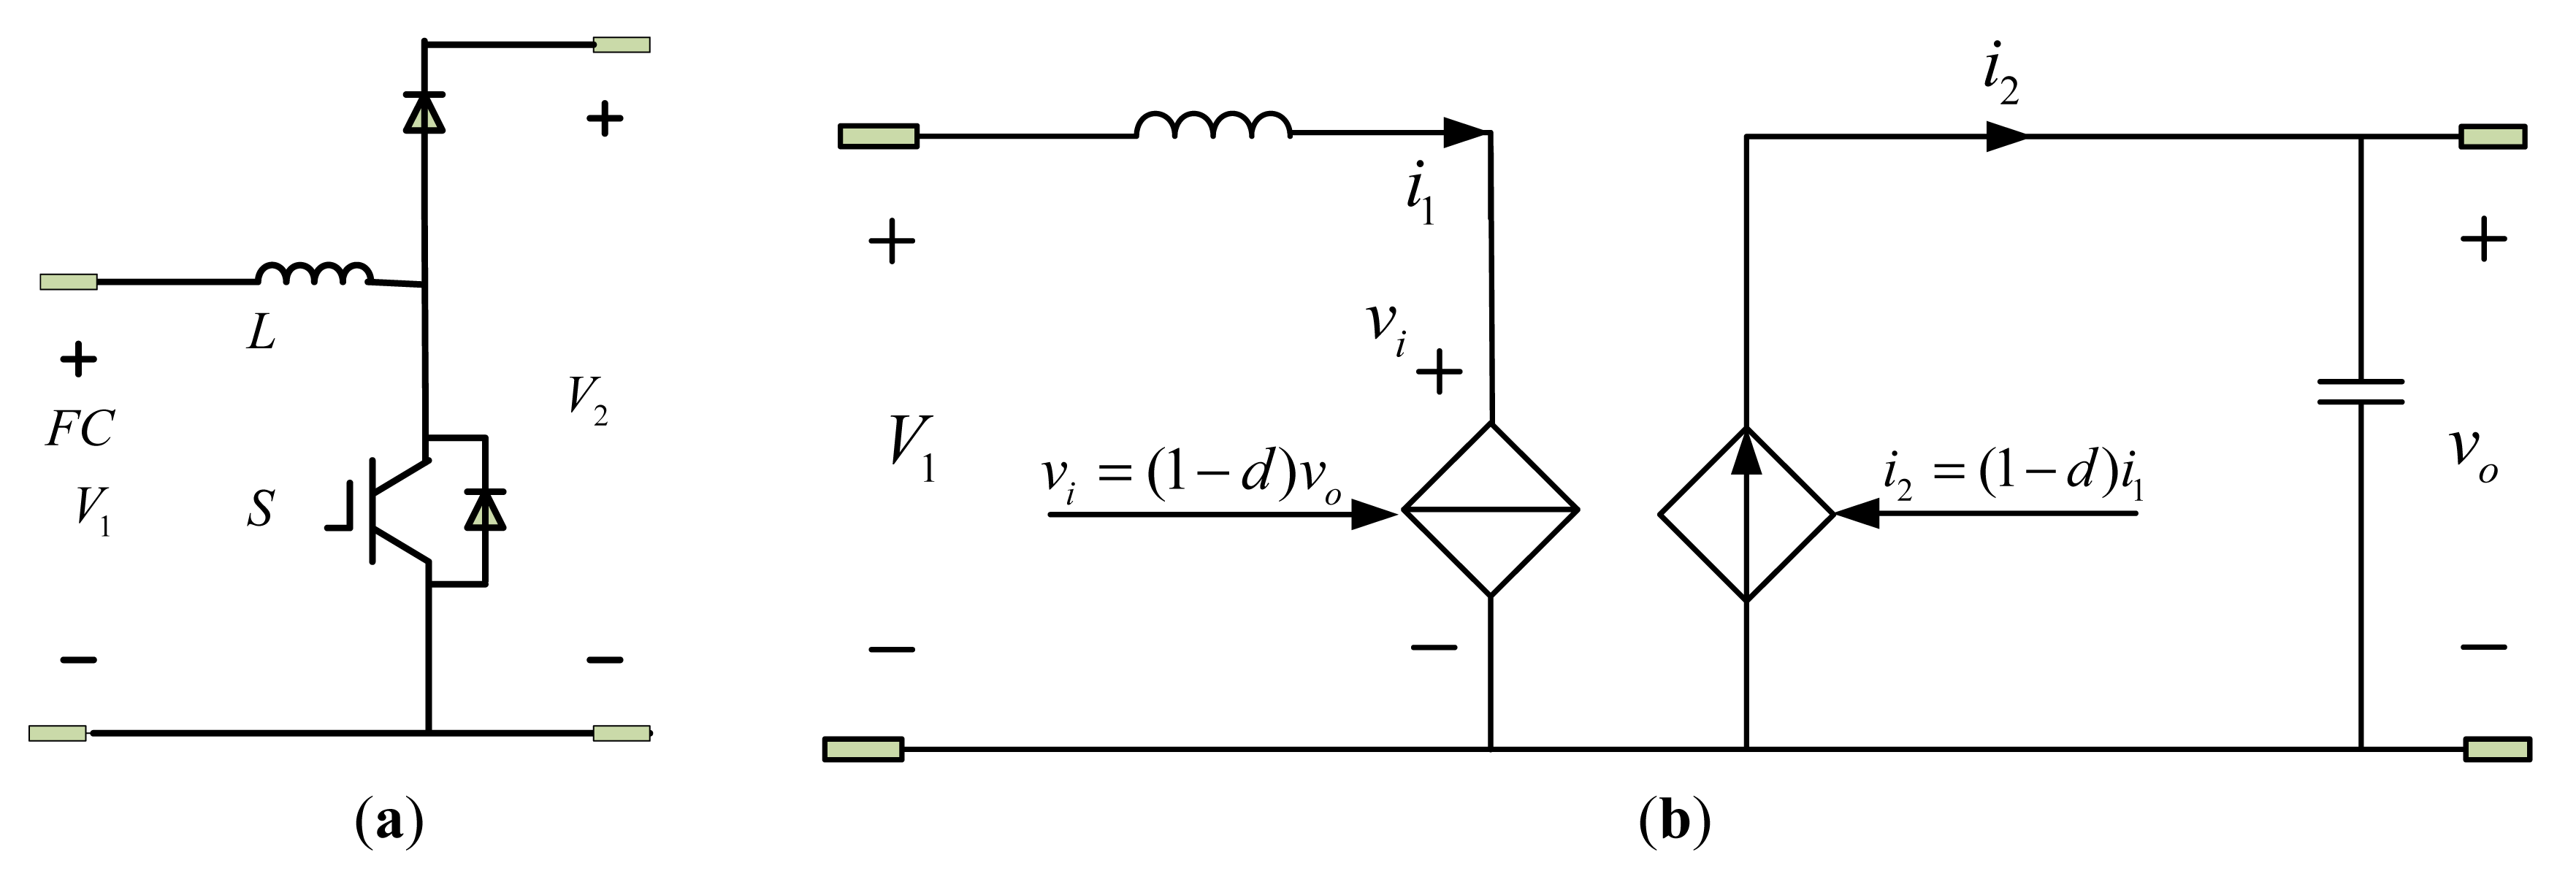
One DC/DC converter is used in this hybrid power system. A boost DC/DC converter is associated with FC and allows control the energy exchange between FC and DC bus. This converter shown in Figure 7a is composed of an inductor L, diode and a switch S.
In this study, this converter is modeled by a classical average state model with ideal components shown in Figure 7b. This basic model comprises a voltage controlled voltage source and a current controlled current source. The values of vi and i2 can be simply identified by d, which is the duty ratio of switch S/S1.
3.4. Auxiliary Services
In this paper, the auxiliary load (light and pump, etc.) is assumed constant (5 kW) and modeled for simplicity as a controlled DC current source connected directly to the DC bus. The current is a function of the power and the DC bus voltage. Then considering the driving cycle of the boat the average power is 46 kW.
4. EMS
There are two power sources in the hybrid power system. The energy management strategy for different power sources has great effect in influencing the fuel economy, dynamic performance and service life of power sources [22–24]. A states-based EMS is proposed in [22], in which the battery is connected to the DC bus by a bidirectional DC/DC convertor. A simplified EMS is proposed for a passive FC/battery hybrid power system in [23]. A cascaded control loop with a decoupling strategy in the frequency domain is proposed for FC/supercapacitor hybrid power system in [24].
The proposed EMS is used to control the energy flow between the FC and the battery, which depends on the operating states considering the optimum power of FC and battery. The operating condition determination is based on the load power, the battery, and the FC states and operating points.
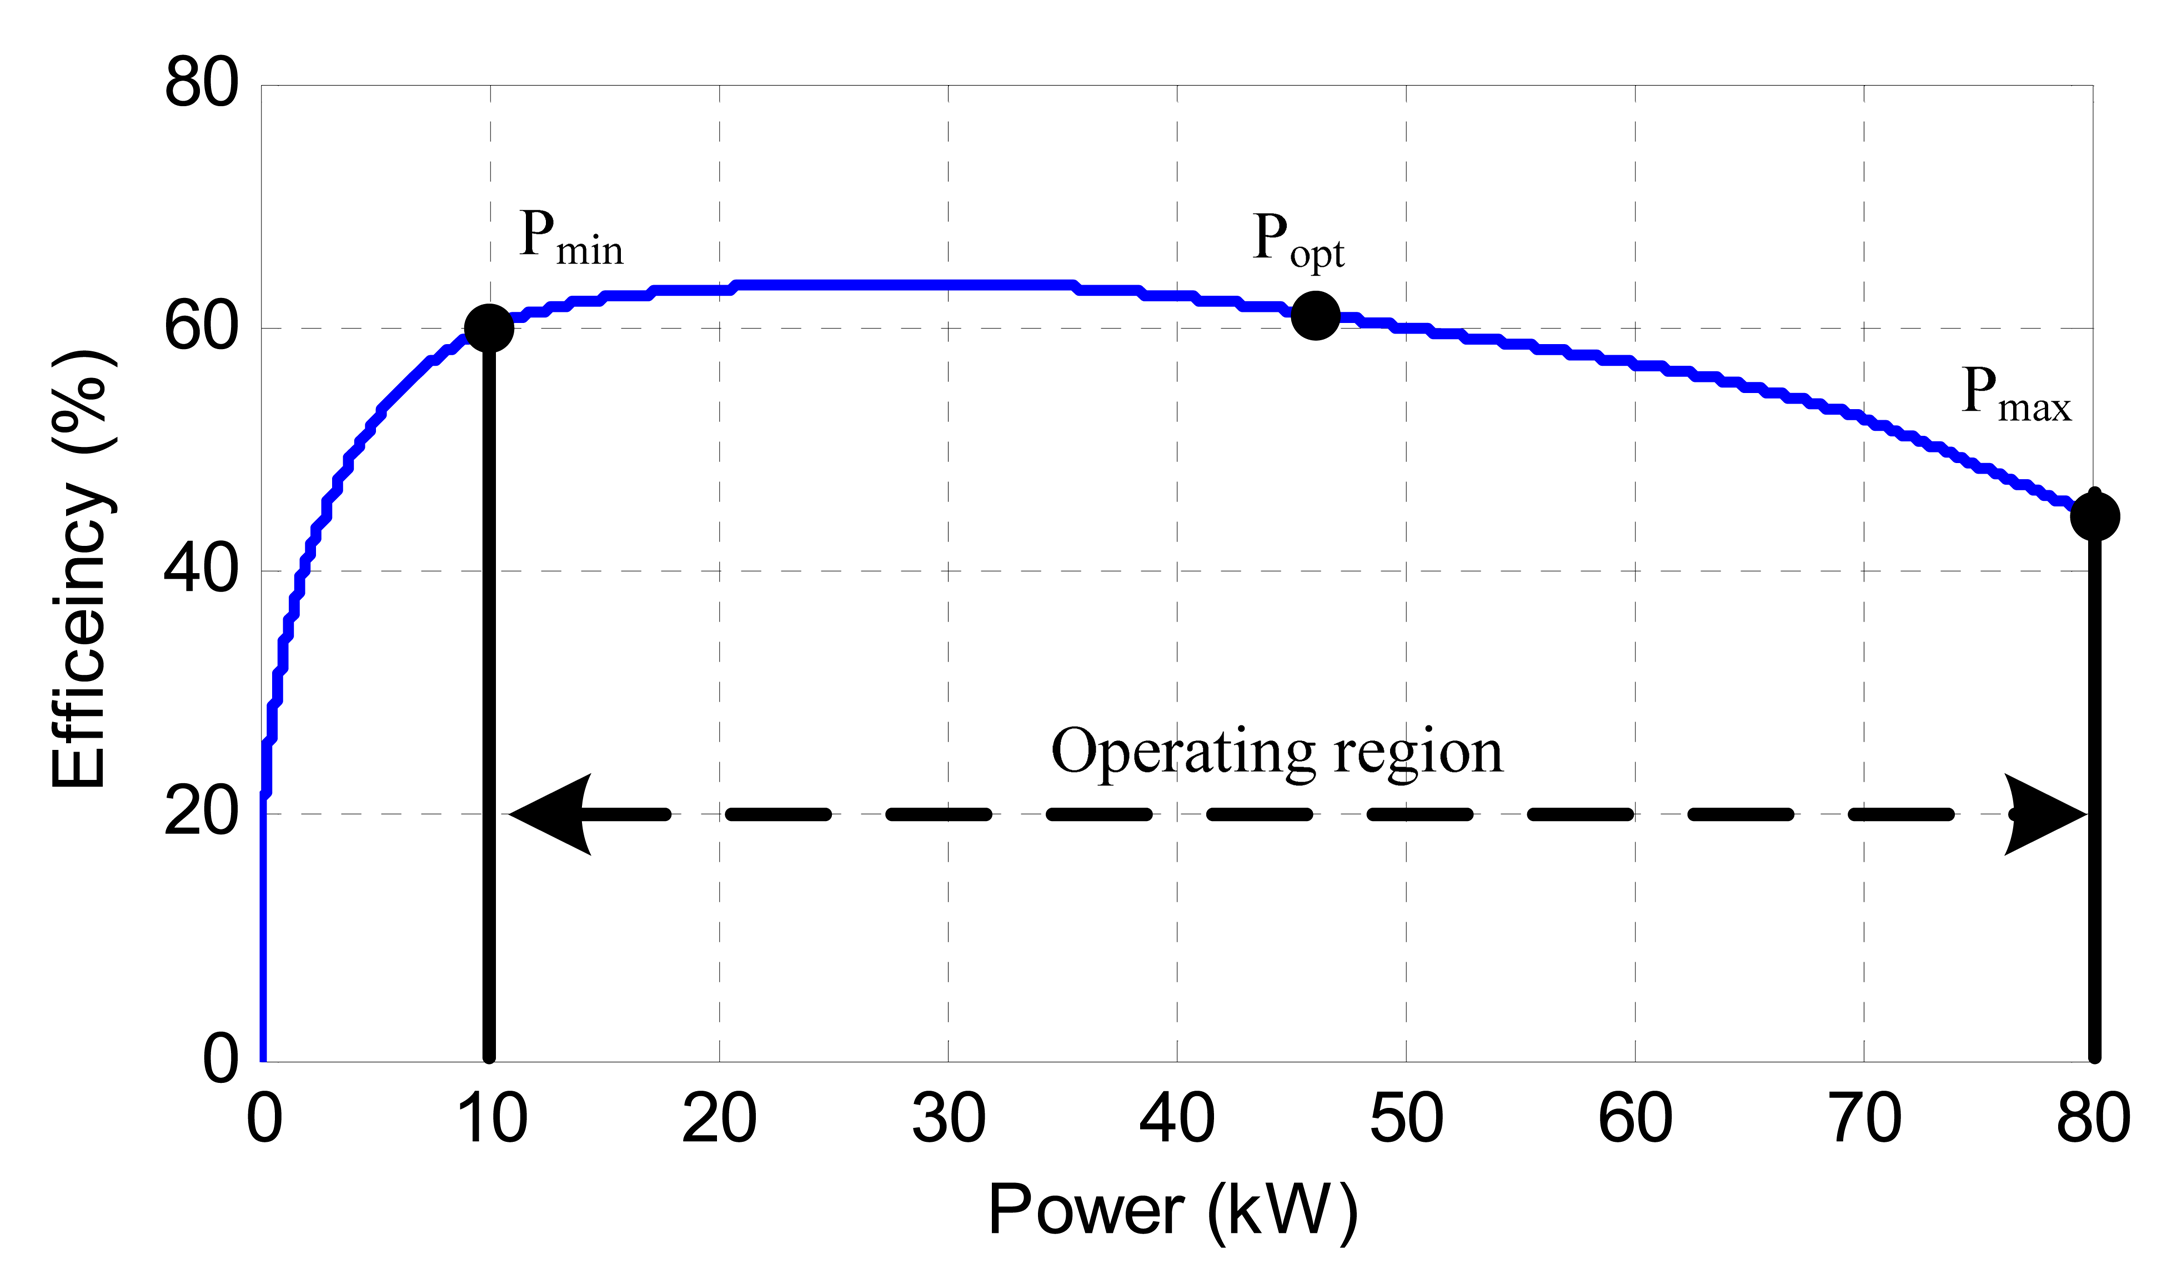
Figure 8 shows the relationship between FCS efficiency and output power. The maximum FCS efficiency is about 64% and the FCS can operate with an efficiency higher than 60% over a large range of powers. When the system operates at a very low output power (less than 3 kW) the FCS efficiency is quite low. To achieve good fuel economy, the FCS should be avoided to operate in poor efficiency regions. Here, the minimum FCS power PFCmin is selected as 10 kW, with an efficiency of about 60%. Considering the average power of boat, the optimum power PFCopt is determined as 46 kW, where the net efficiency is 61%. The maximum net power PFCmax which can be delivered by the FCS is 80 kW.
Because of the battery's current and voltage limits, the following battery limits have been considered: (1) charging, discharging, and optimum power values for battery (Poptchar, Poptdis, and PBATopt), where charging power equals to discharging power with 30% capacity of battery and optimum power value is 20% capacity of the battery; and (2) battery SOC (SOCmax and SOCmin). Three levels for the battery SOC are considered: high SOC (>80%), normal SOC (50%–80%), and low SOC (<50%), which are shown in Table 4.
The power control strategy can be described by 11 possible cases which correspond to several combinations between Pload and battery SOC:
- ‐
State 1: high SOC and PLoad ≤ PFCmin. In this case, the FC operates at its minimum power, then PFCref = PFCmin. The battery power will be PBAT = PFCmin − PLoad, therefore the battery SOC increases. The braking resistance will work if the battery reaches to the SOCmax.
- ‐
State 2: high SOC and PFCmin < PLoad ≤ PFCmin + Poptdis. In this case, the FC operates also at its minimum power. The battery works at PBAT = PLoad − PFCmin. Therefore the battery SOC decreases.
- ‐
State 3: high SOC and PFCmin + Poptdis < PLoad ≤ PFCmax + Poptdis. In this case, the FC power will be fluctuant according the load power at a power of PFC = PLoad − Poptdis. The battery works at its optimum discharging power Poptdis, so that the battery SOC decreases.
- ‐
State 4: high SOC and PFCmax + Poptdis < PLoad. In this case, the FC works at its maximum power PFCmax. And the battery power will be PBAT = PLoad − PFCmax, which means that the discharging current rate will be more than 0.3C. The battery will not keep working in this mode for a long time, because the capacity of FC and battery has been designed appropriately.
- ‐
State 5: normal SOC and PLoad ≤ PFC_min. This is similar to the Case 1. The FC operates at its minimum power, and the battery power will be PBAT = PFCmin − PLoad. Therefore the battery SOC increases slowly.
- ‐
State 6: normal SOC and PFCmin < PLoad ≤ PFCopt − PBATopt. In this case, the FC will work in strategy of load following. The FC reference power will be equal to the commanded load power. As the low response time of FC, the battery will compensate the transient power.
- ‐
State 7: normal SOC and PFCopt − PBATopt < PLoad ≤ PFCopt + PBATopt. In this case, the FC will work in optimum power PFCopt. The FCS power will be constant and the battery will compensate the transient power.
- ‐
State 8: normal SOC and PFCopt + PBATopt < PLoad ≤ PFCmax. This case is similar to the State 6, the FC power is regulated to follow the load power.
- ‐
State 9: normal SOC and PFCmax < PLoad. This state is similar to State 4, where the FC operates at maximum power PFC_max, and the battery power will be PBAT = PLoad − PFCmax, therefore the battery SOC decreases.
- ‐
State 10: low SOC and PLoad ≤ PFCmax − Poptchar. In this state, the FC will provide the power of load and will charge the battery. Therefore the battery SOC will increase with the optimum charging current.
- ‐
State 11: low SOC and PFCmax − Poptchar < PLoad. In this state, the FC power will be limited to the maximum power. And the battery charging power is PFCmax − PLoad if the FC maximum power is more than the load power. Otherwise the battery will discharge to keep the balance of the power. It should be noted that the battery will have to stop working if the battery SOC decrease to the SOCmin.
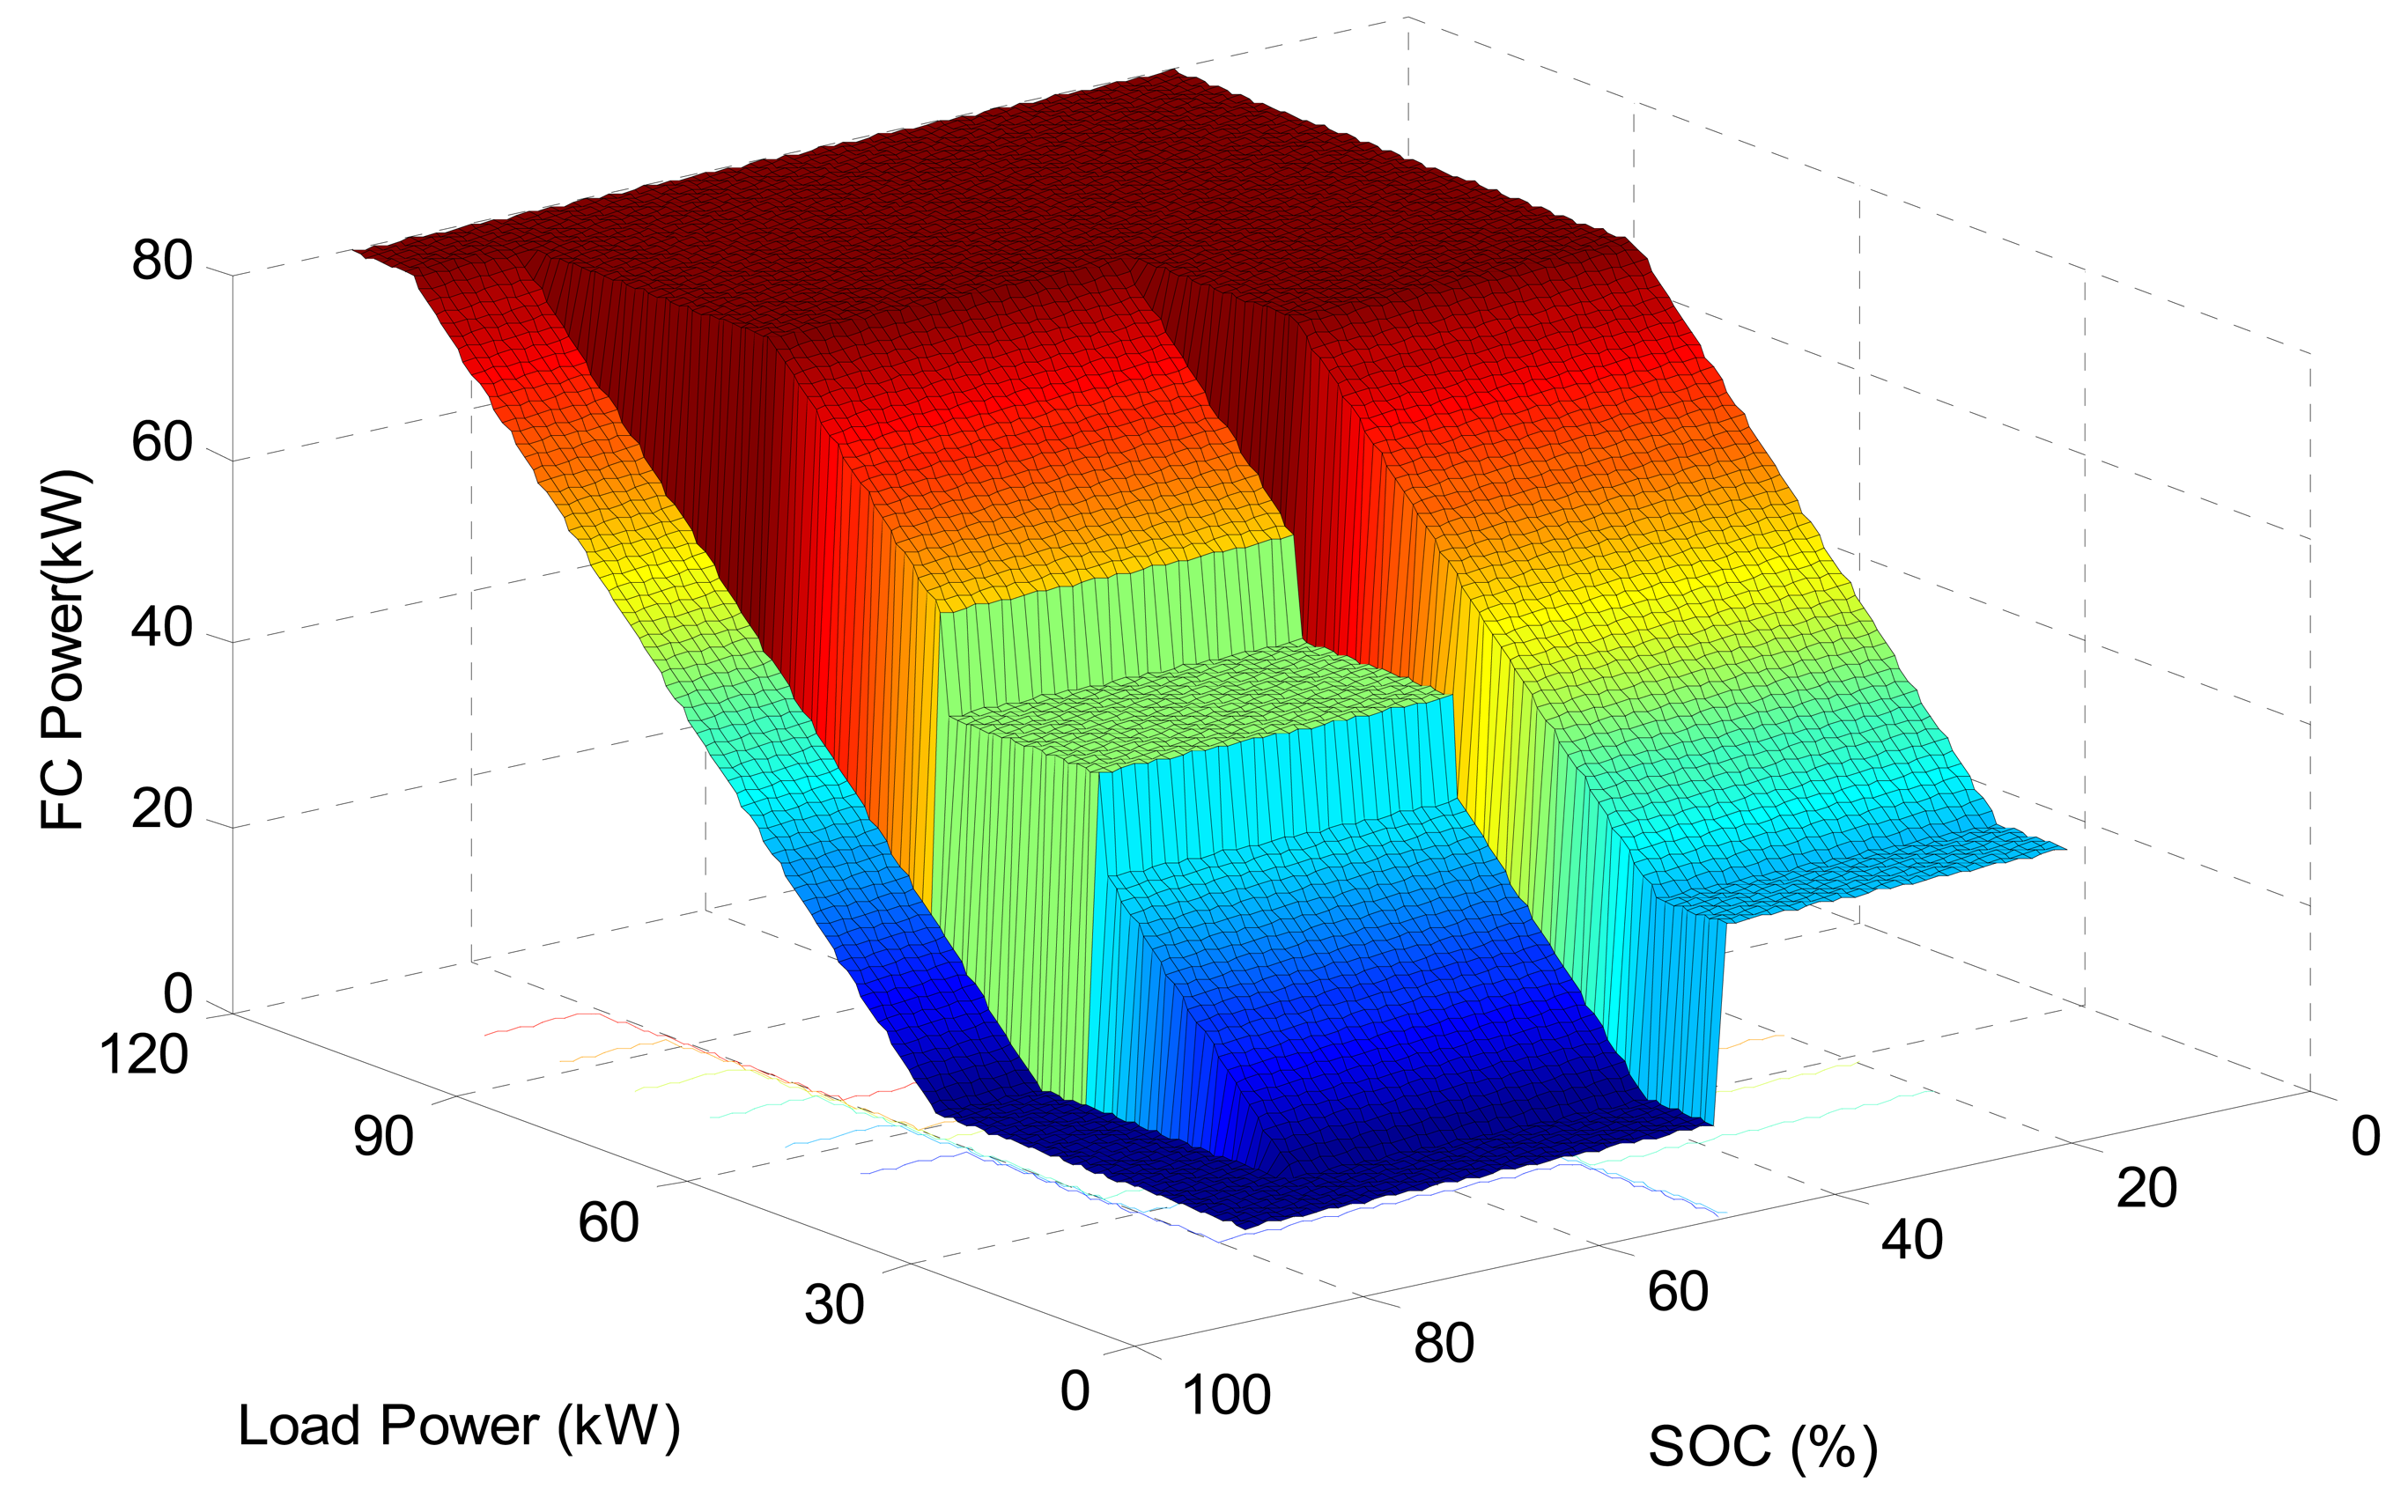
Figure 9 shows the required power of FC depending of the different operating conditions and SOC.
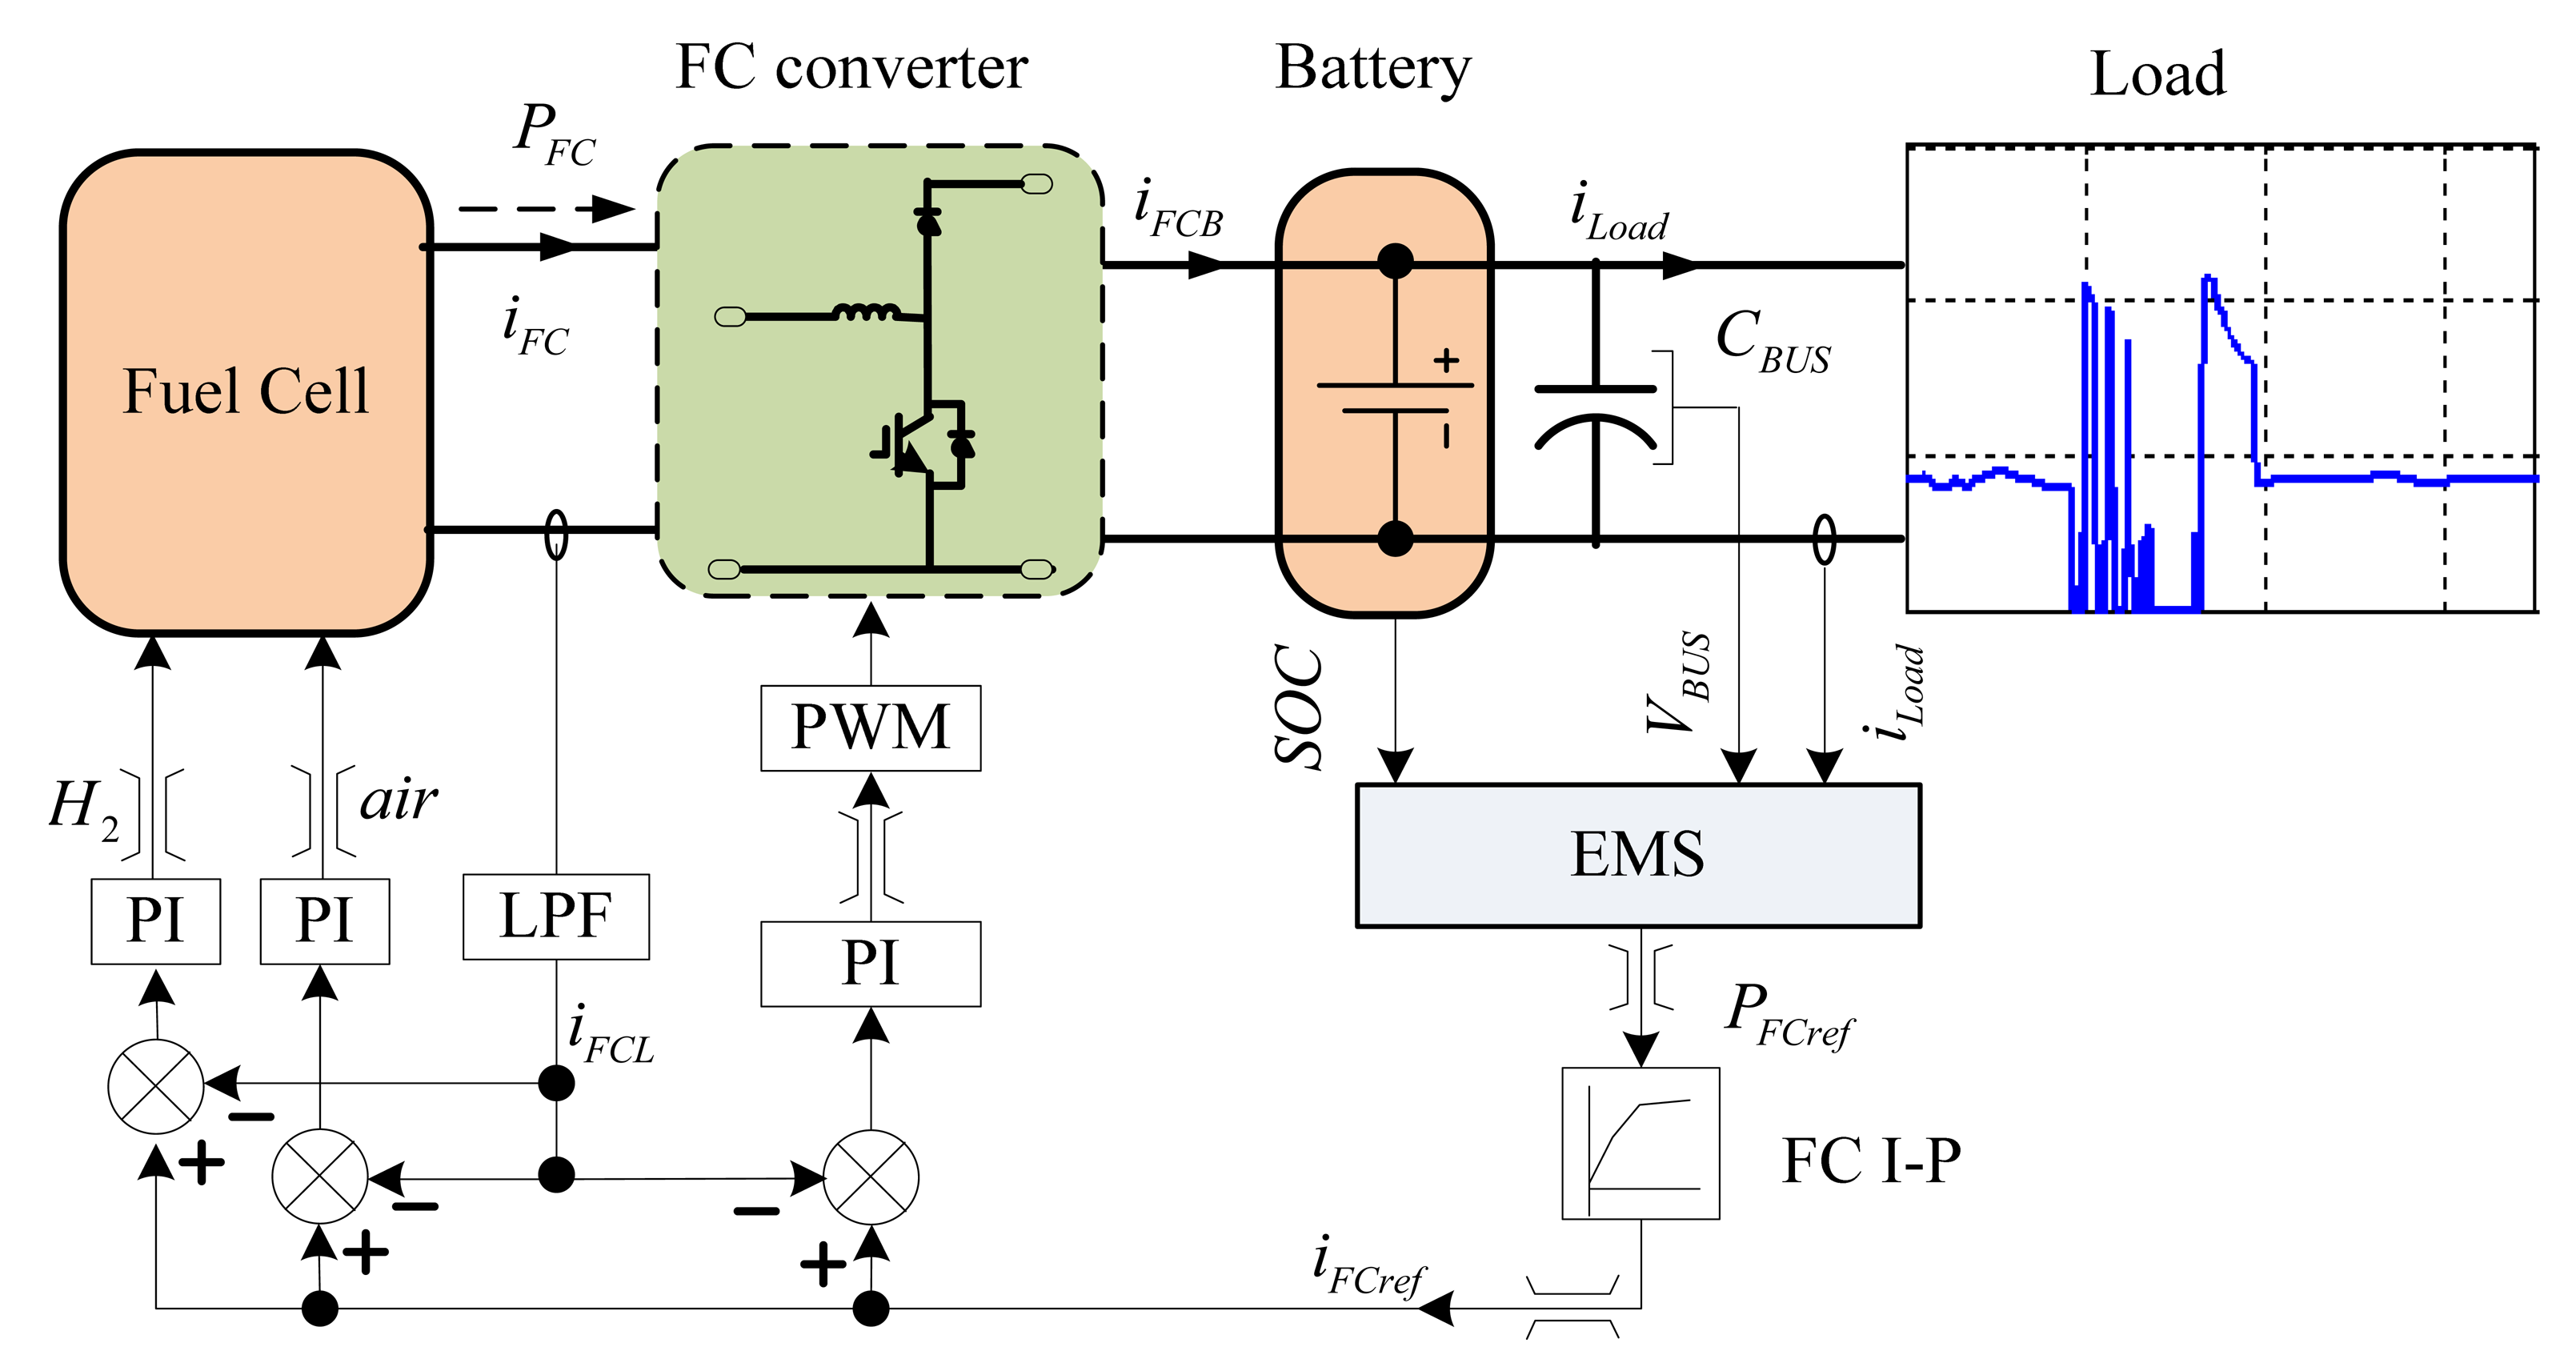
Figure 10 shows the total model of the hybrid power system of the boat. The FC voltage will be fluctuating according to the load, which is why a DC/DC converter is needed to control the output power. A current control loop is used to regulate the FC output current. The FC reference current is determined by the previously exposed power management strategy according to the operating state of the hybrid power system. The proportional-integral (PI) controller determined the duty cycle of the boost convert using the error between the FC reference current and the instantaneous current through a low pass filter.
5. Simulation Results
The hybrid system model is shown in Figure 10 by implementing the detailed mathematical models of the system previously described in a MATLAB/Simulink® environment. Simulation results are obtained based on the typical driving cycle of the studied passenger boat presented in Figure 1b with auxiliary load. A 300 s driving cycle is considered. It includes docking operations, stop time and cruising time. The boat begins first with a cruising period. It docks after 92 s. The duration of the docking operation is about 46 s. Then, the boat stops during approximately 24 s. Finally, it begins another cruising period and reaches cruising speed after a 35 s acceleration time. The simulation results are presented in Figures 11, 12, 13, 14, 15, 16, 17, 18, 19, 20, 21 and 22 considering different initial battery SOC: 45%, 65%, and 85%. Those three cases are designated as Case 1, Case 2 and Case 3 in the following part. The results validate the PMS of the hybrid power system under different states.
5.1. Case 1: Simulations with Initial Battery SOC of 45%
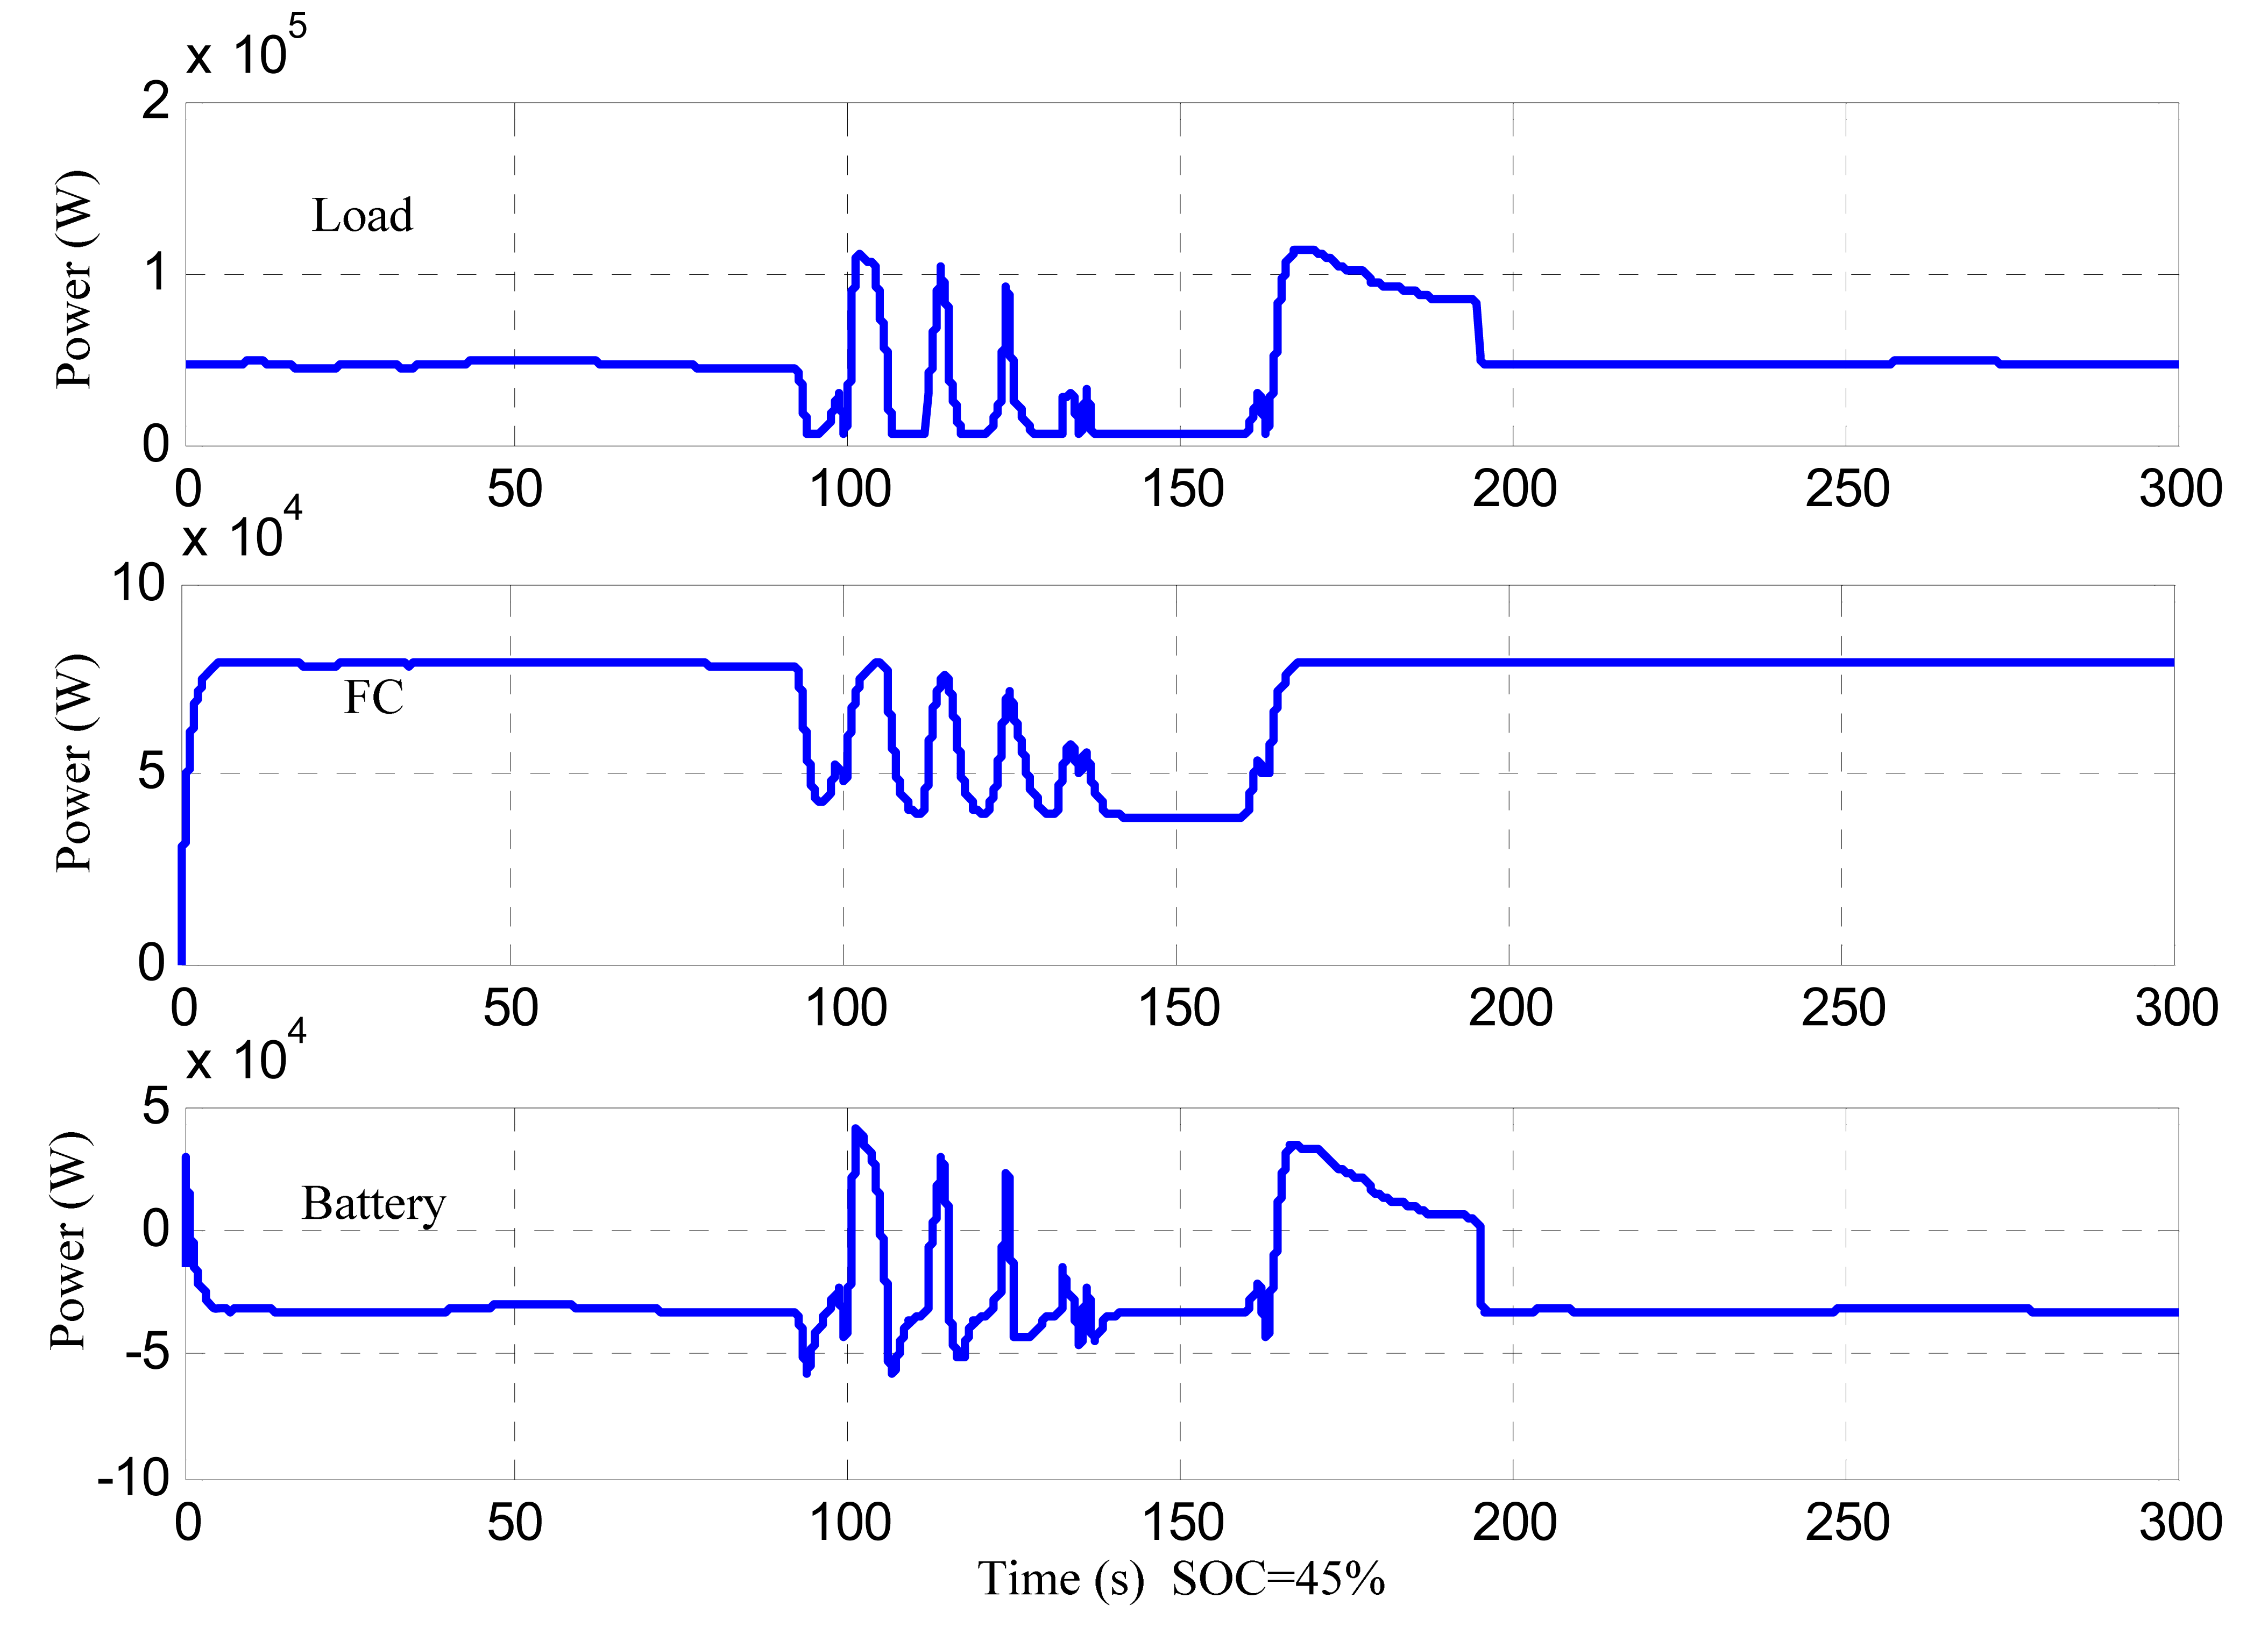
In this case, the initial battery SOC is 45%, so that the battery begins to work with a low SOC. Therefore the FC will try to charge the battery to increase the SOC if the load is not too high. Figure 11 shows the power of the different components of the hybrid power system.
Figure 12 shows the battery current, voltage and SOC. It should be noted that the positive current of battery means that the battery supply the loads and the negative one means that the battery is charged. It can be noticed that, in this case, the bus voltage fluctuates in an acceptable range of 590–640 V.
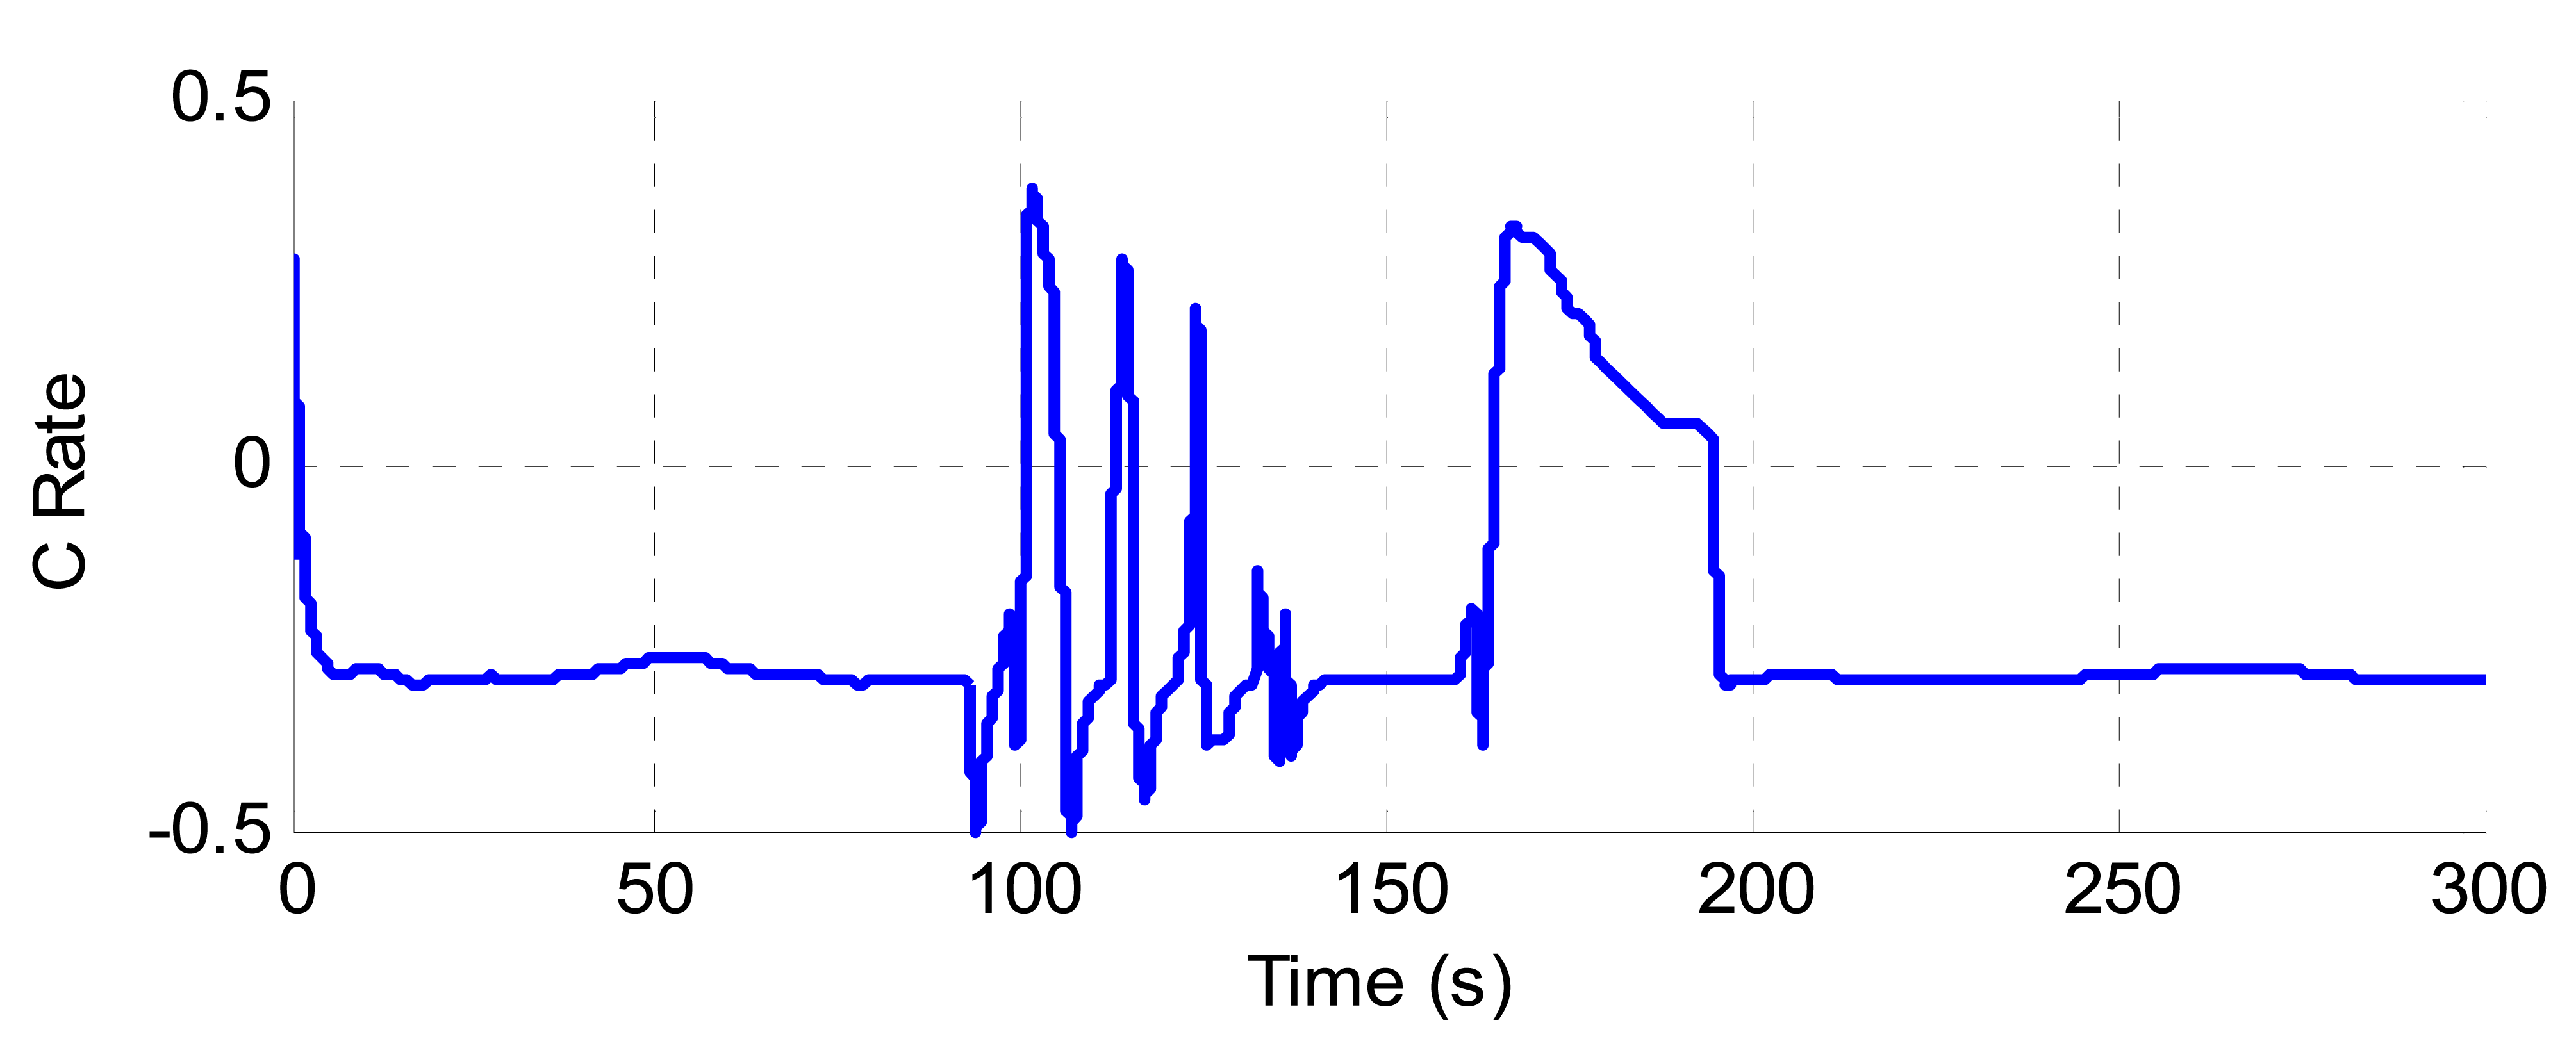
Figure 13 shows the C rate (charging/discharging rate) of the battery. In the figure, it can be found that the maximum discharging/charging rates are 0.36 and 0.5, respectively. The continuous discharging time with C rate greater than 0.3 is less than 4 s.
Figure 14 shows the FC characteristics for Case 1. The FC stack characteristics are shown in blue line. The magenta lines show the net power and efficiency. The FCS efficiency is then more than 45% during all the cycle.
As shown in the Figures 11, 12, 13 and 14, FC tries to charge the battery at the power of Poptchar during the cruising and stop conditions. Then the battery SOC increases slowly, and it reaches to 47% after the full cycle. During docking, the FCS power is less than 50 kW for the long response time. Then, the battery bank compensates the transient load power and absorbs the extra power from the FCS. During the acceleration, FC reaches the maximum output power.
5.2. Case 2: Simulations with Initial Battery SOC of 65%
In this second case, the initial battery SOC is 65%. It means that the battery begins to work with a normal SOC. Therefore the FC will work mostly at the command of load power and sometimes at the optimum power.
Figure 15 shows the power of the different components of the hybrid power system. When the boat cruises, the FC works at the optimum power. The maximum powers of FCS and battery during docking are 76 kW and 62 kW, respectively.
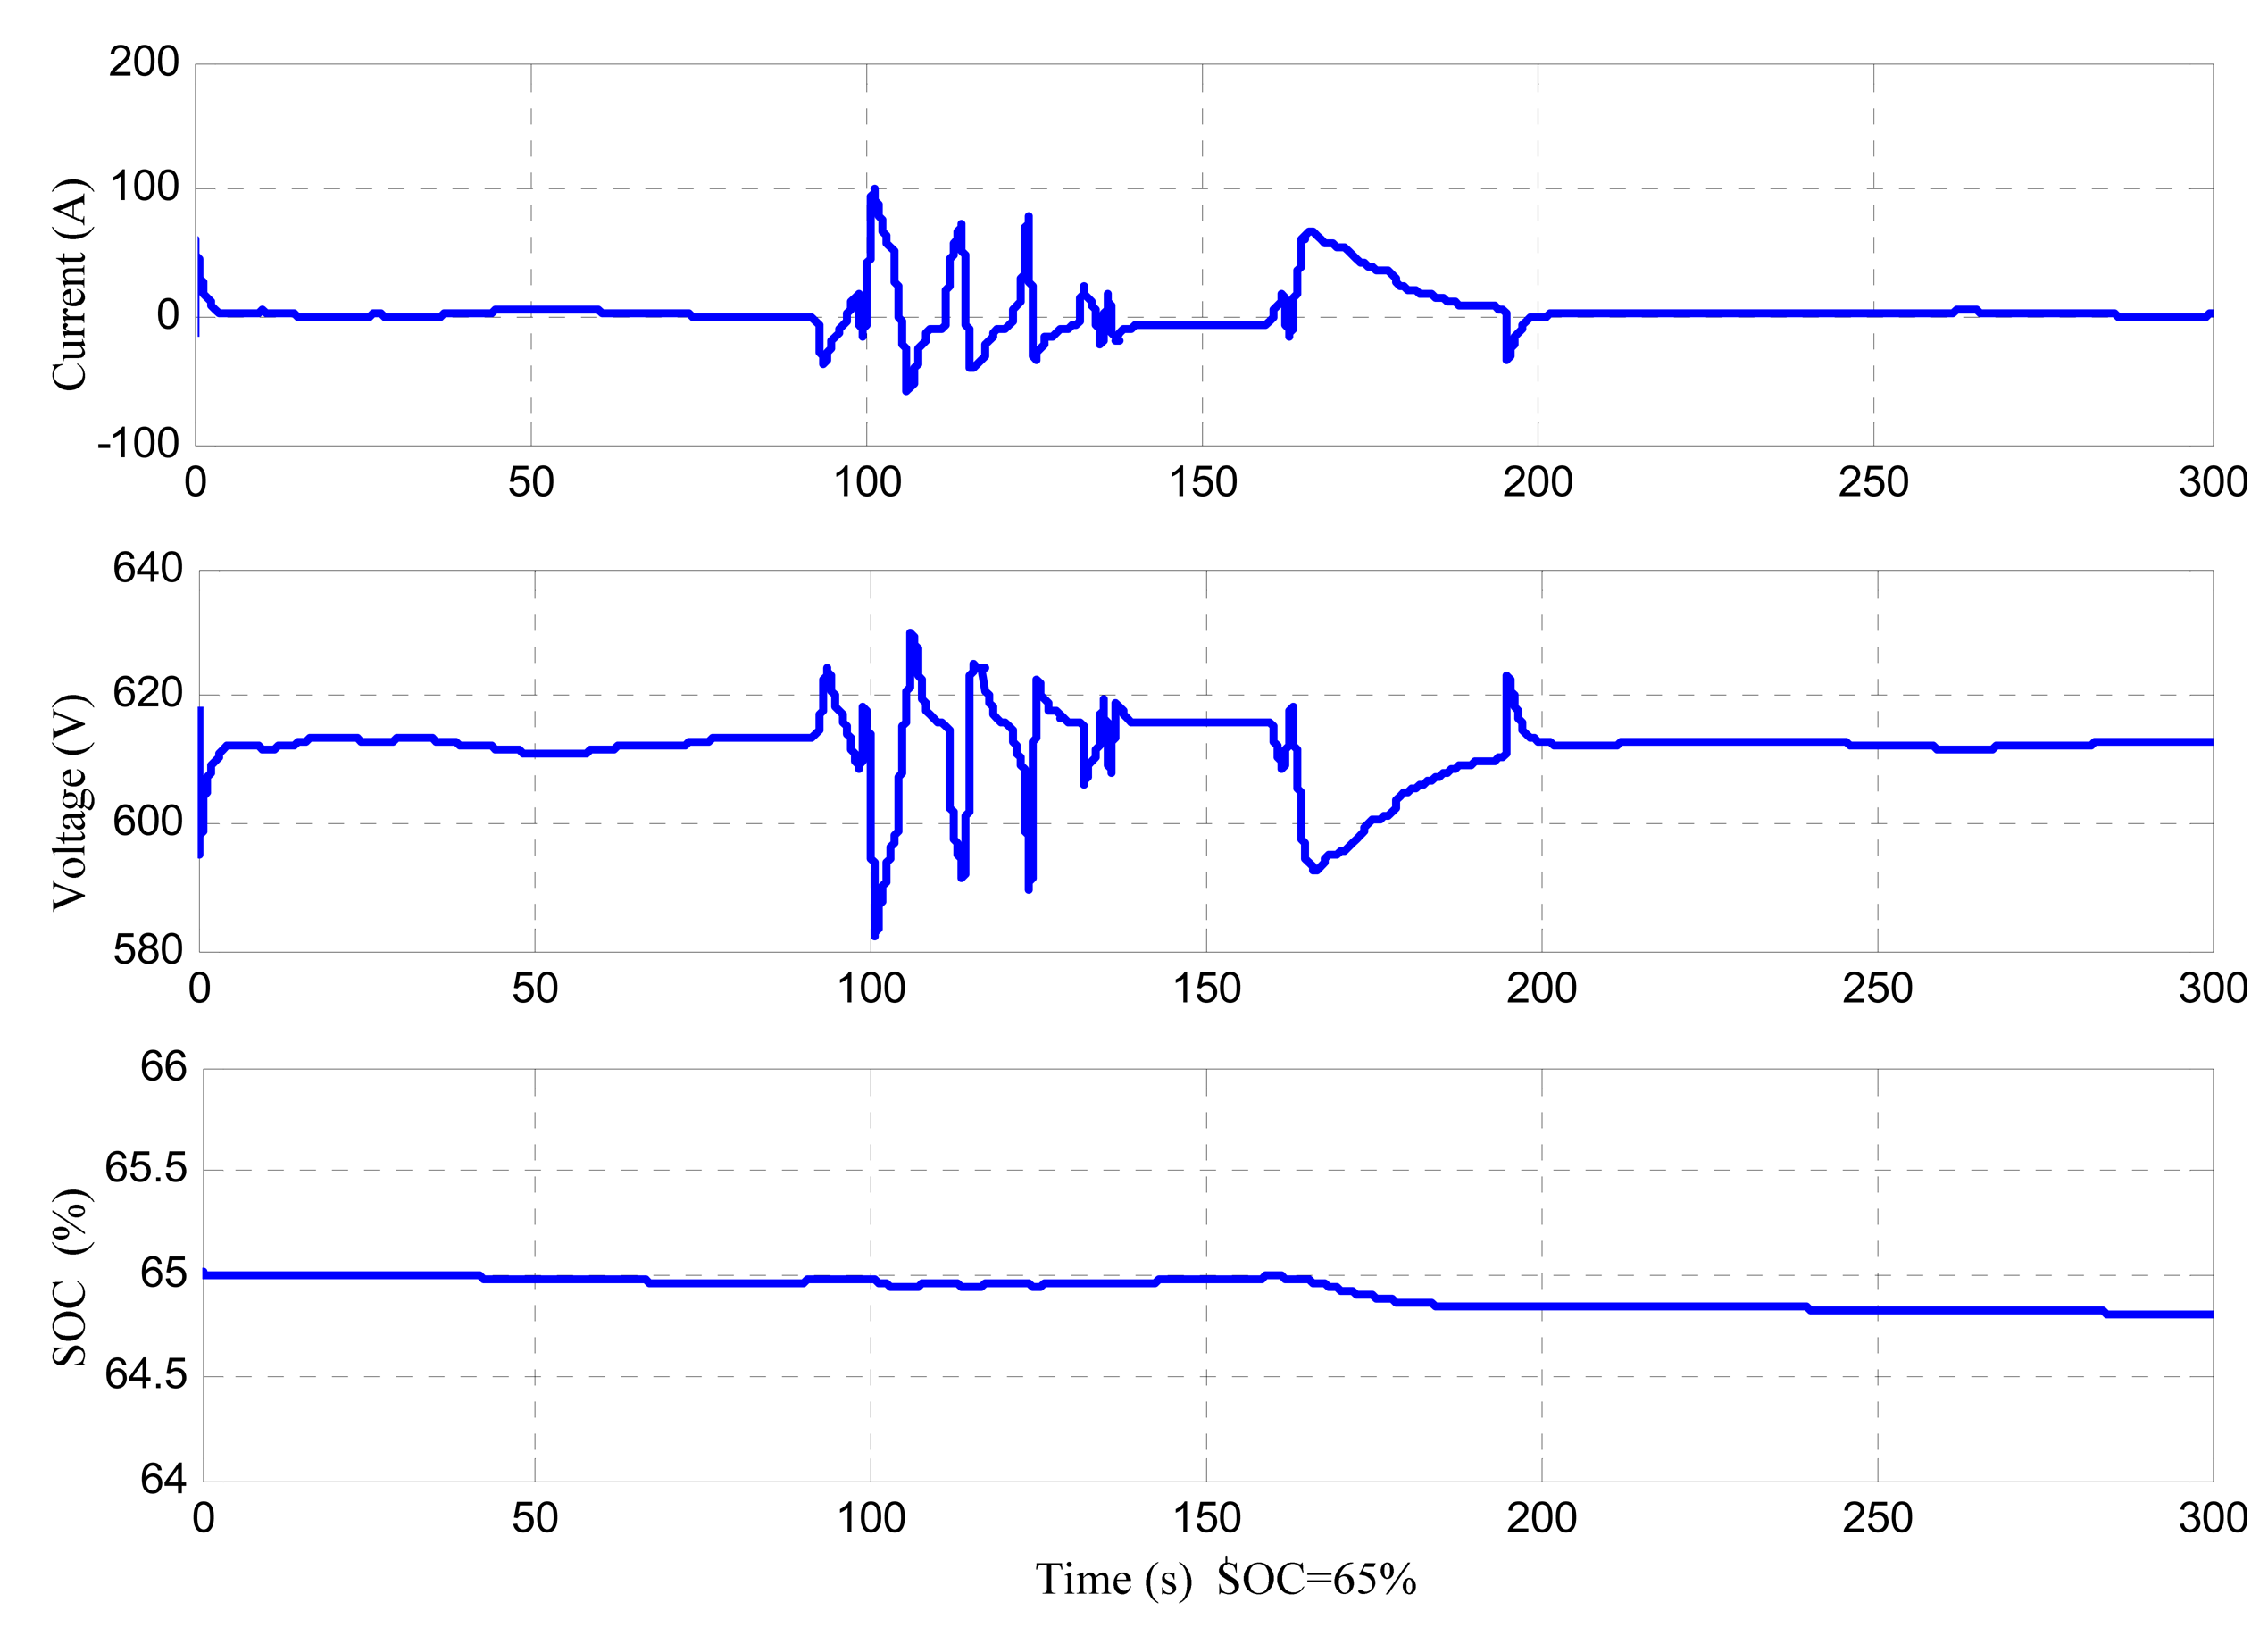
Figure 16 shows the battery current, voltage and SOC for Case 2. The battery SOC is kept constant and the bus voltage also fluctuates in an acceptable range of 580–620 V.
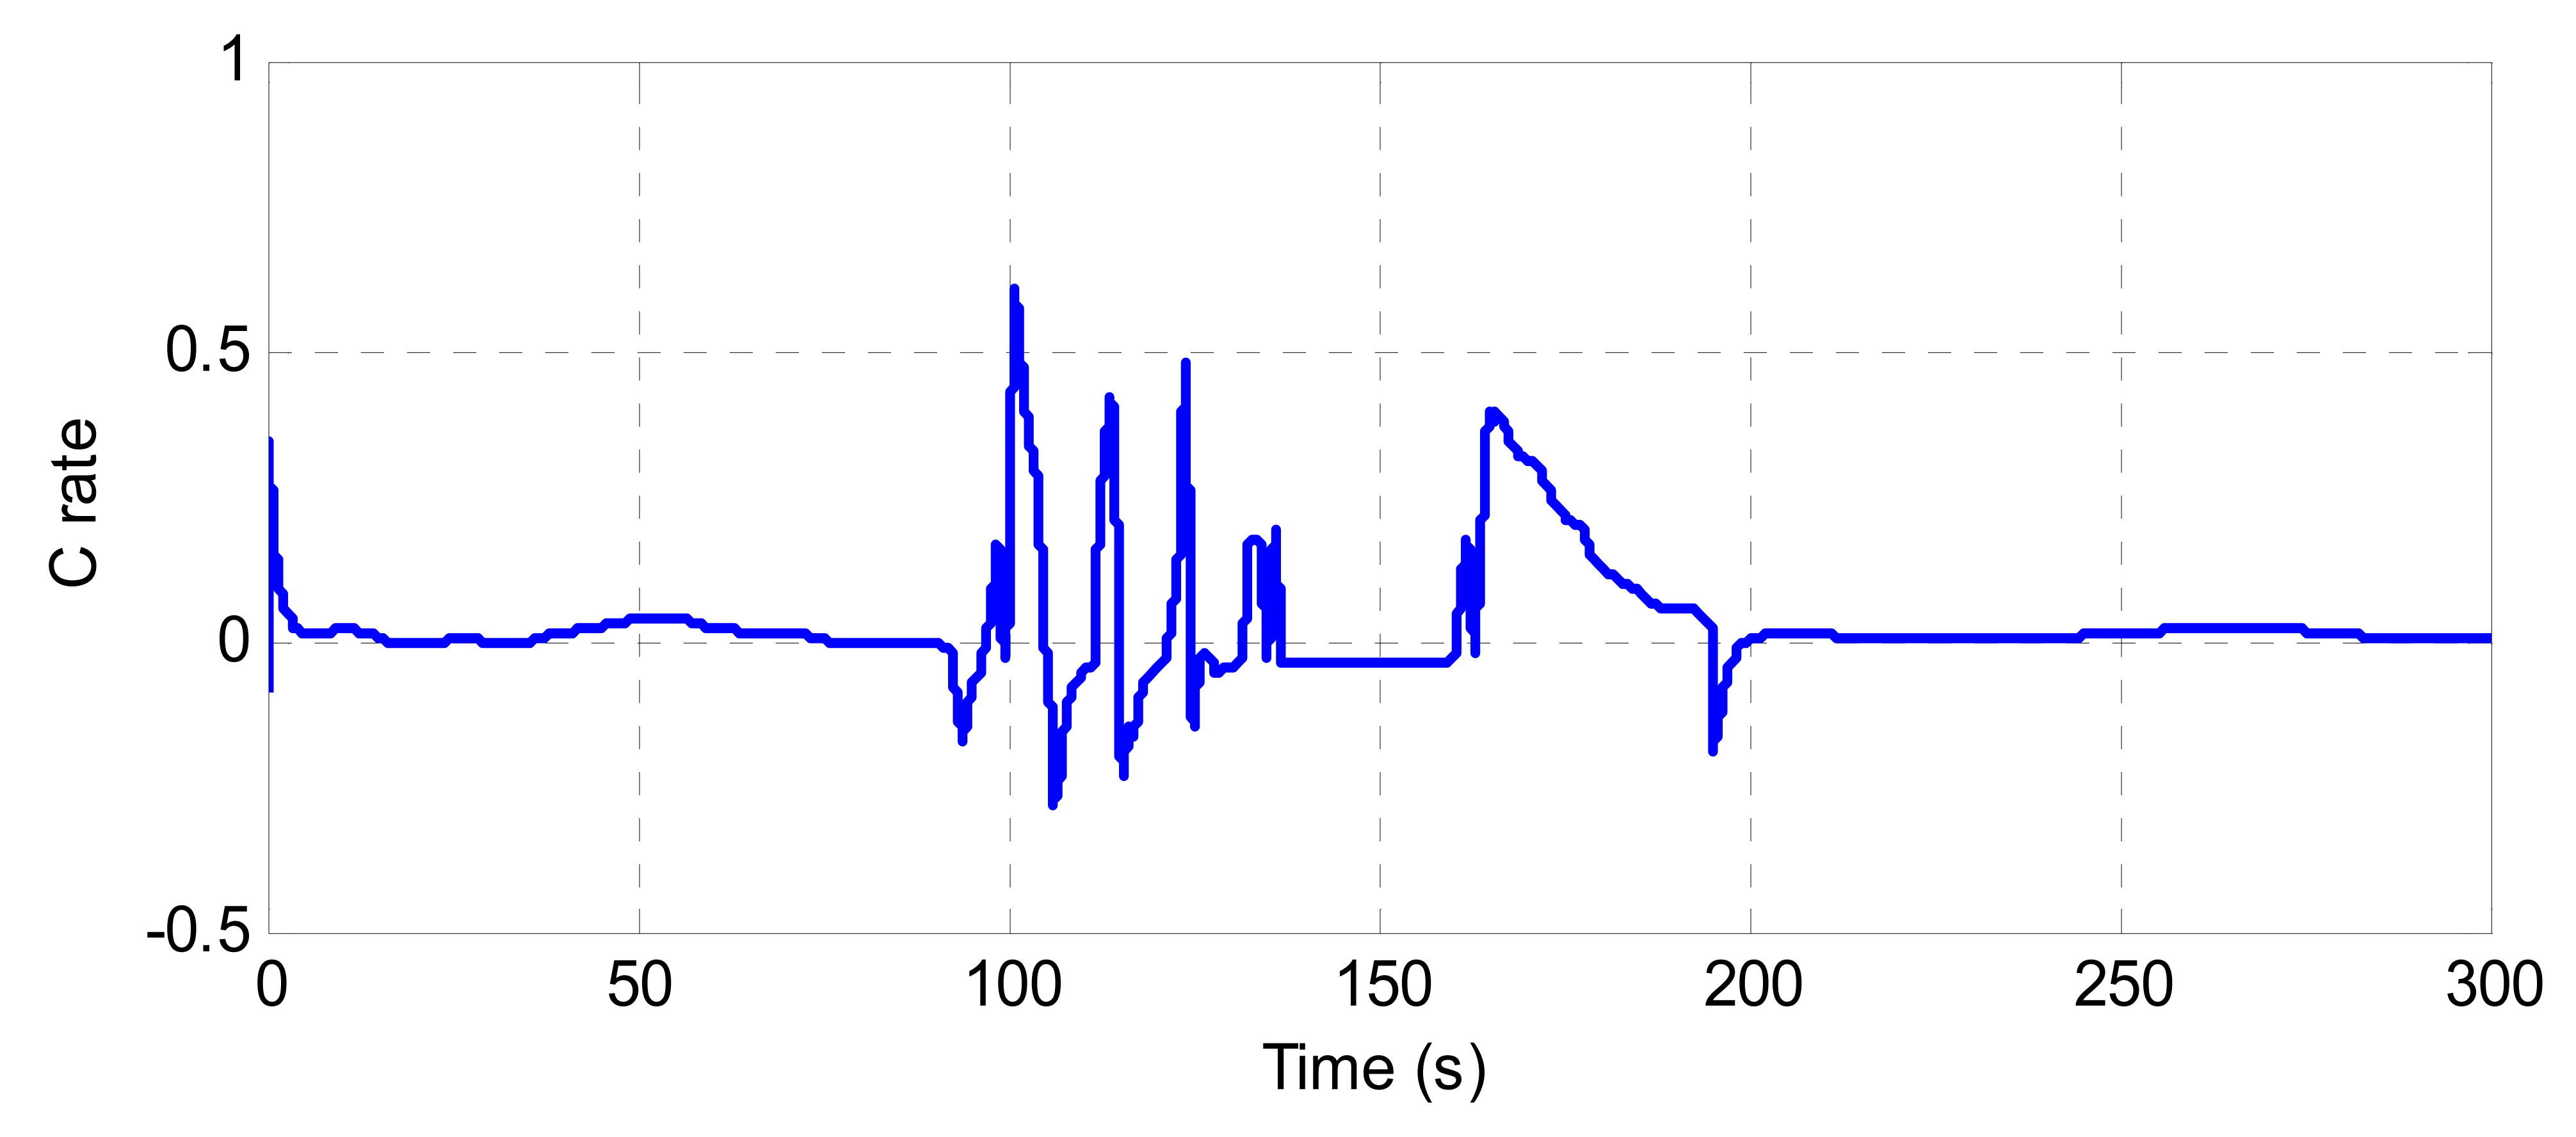
Figure 17 shows the C rate of battery during the cycle. In the figure, the maximum discharging rate is 0.6 at 100 s. The charging rate is less than 0.3 during the cycle.
Figure 18 shows the FC characteristics for Case 2. The FC stack characteristics are shown in blue line. The magenta lines show the net power and efficiency. The FCS efficiency is about 61% mostly, and it is about 45% under acceleration conditions.
5.3. Case 3: Simulations with Initial Battery SOC of 85%
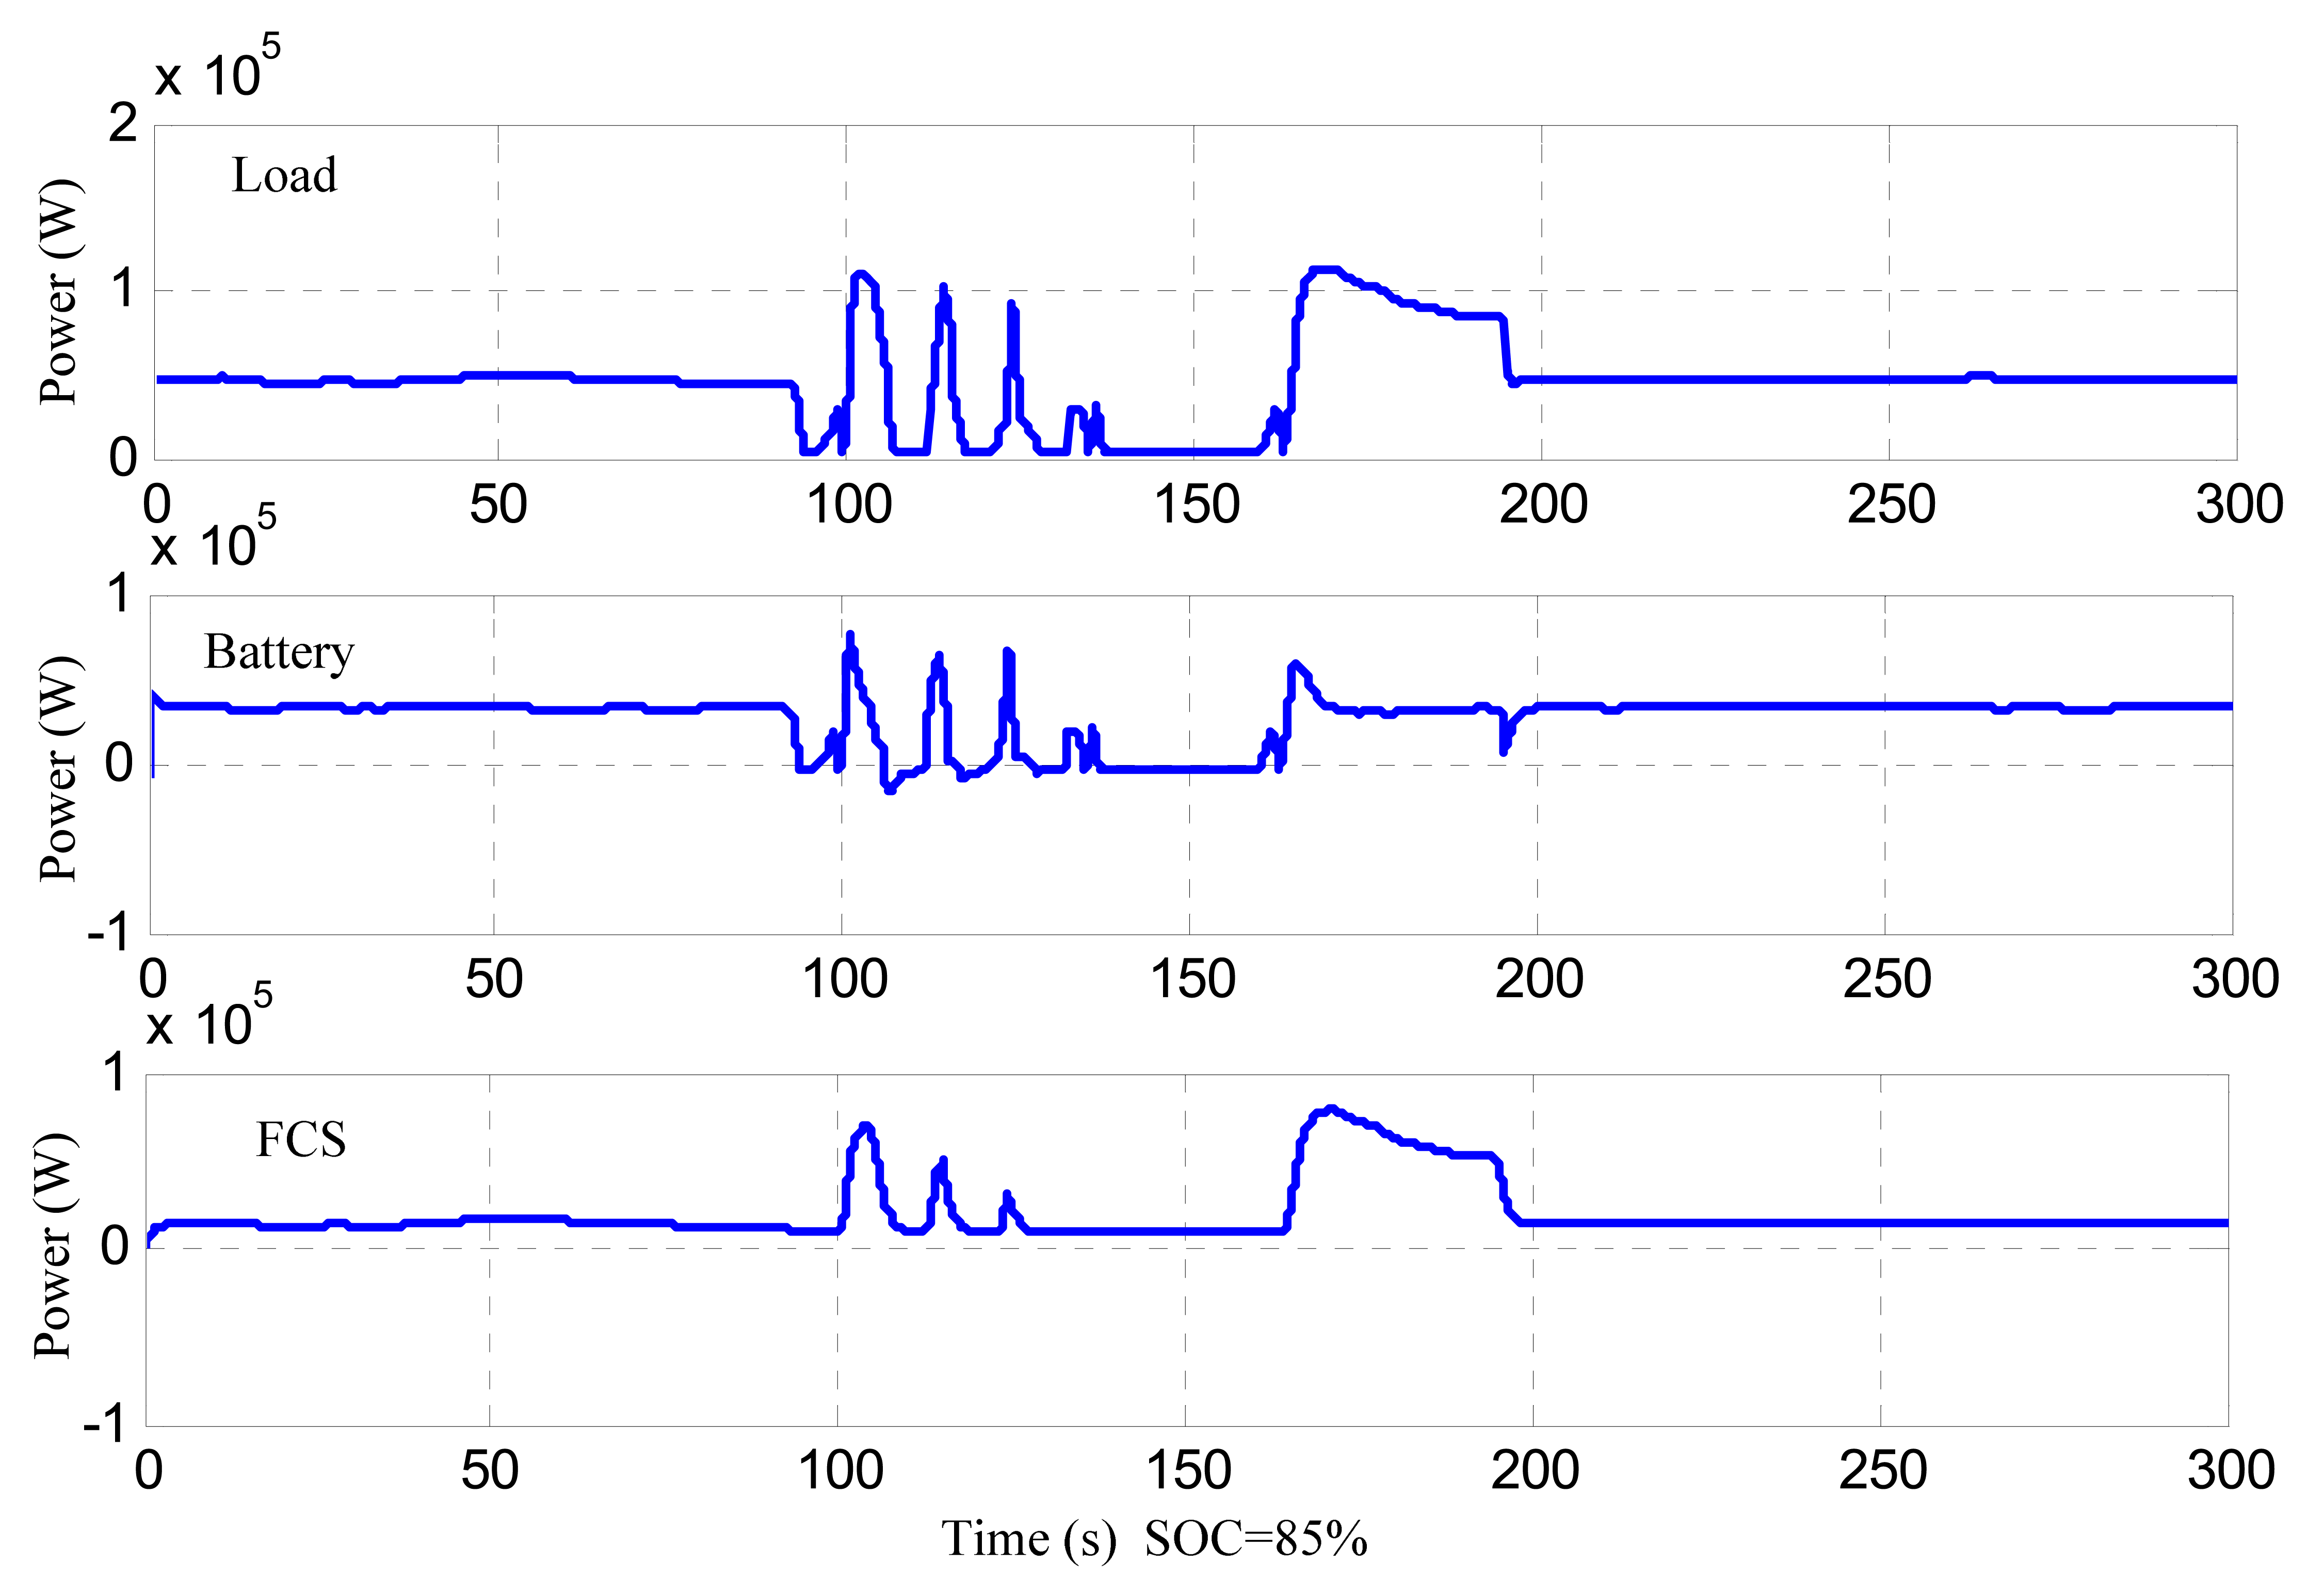
In this case, the initial battery SOC is 85%, therefore, the power management strategy leads to discharge the battery to a reach a normal SOC. Figure 19 shows the power of the different components of the hybrid power system for Case 3. When the boat cruises, the battery discharges at the optimum discharging power for the high SOC. Then FCS works at a low power and its maximum power is 78 kW during acceleration.
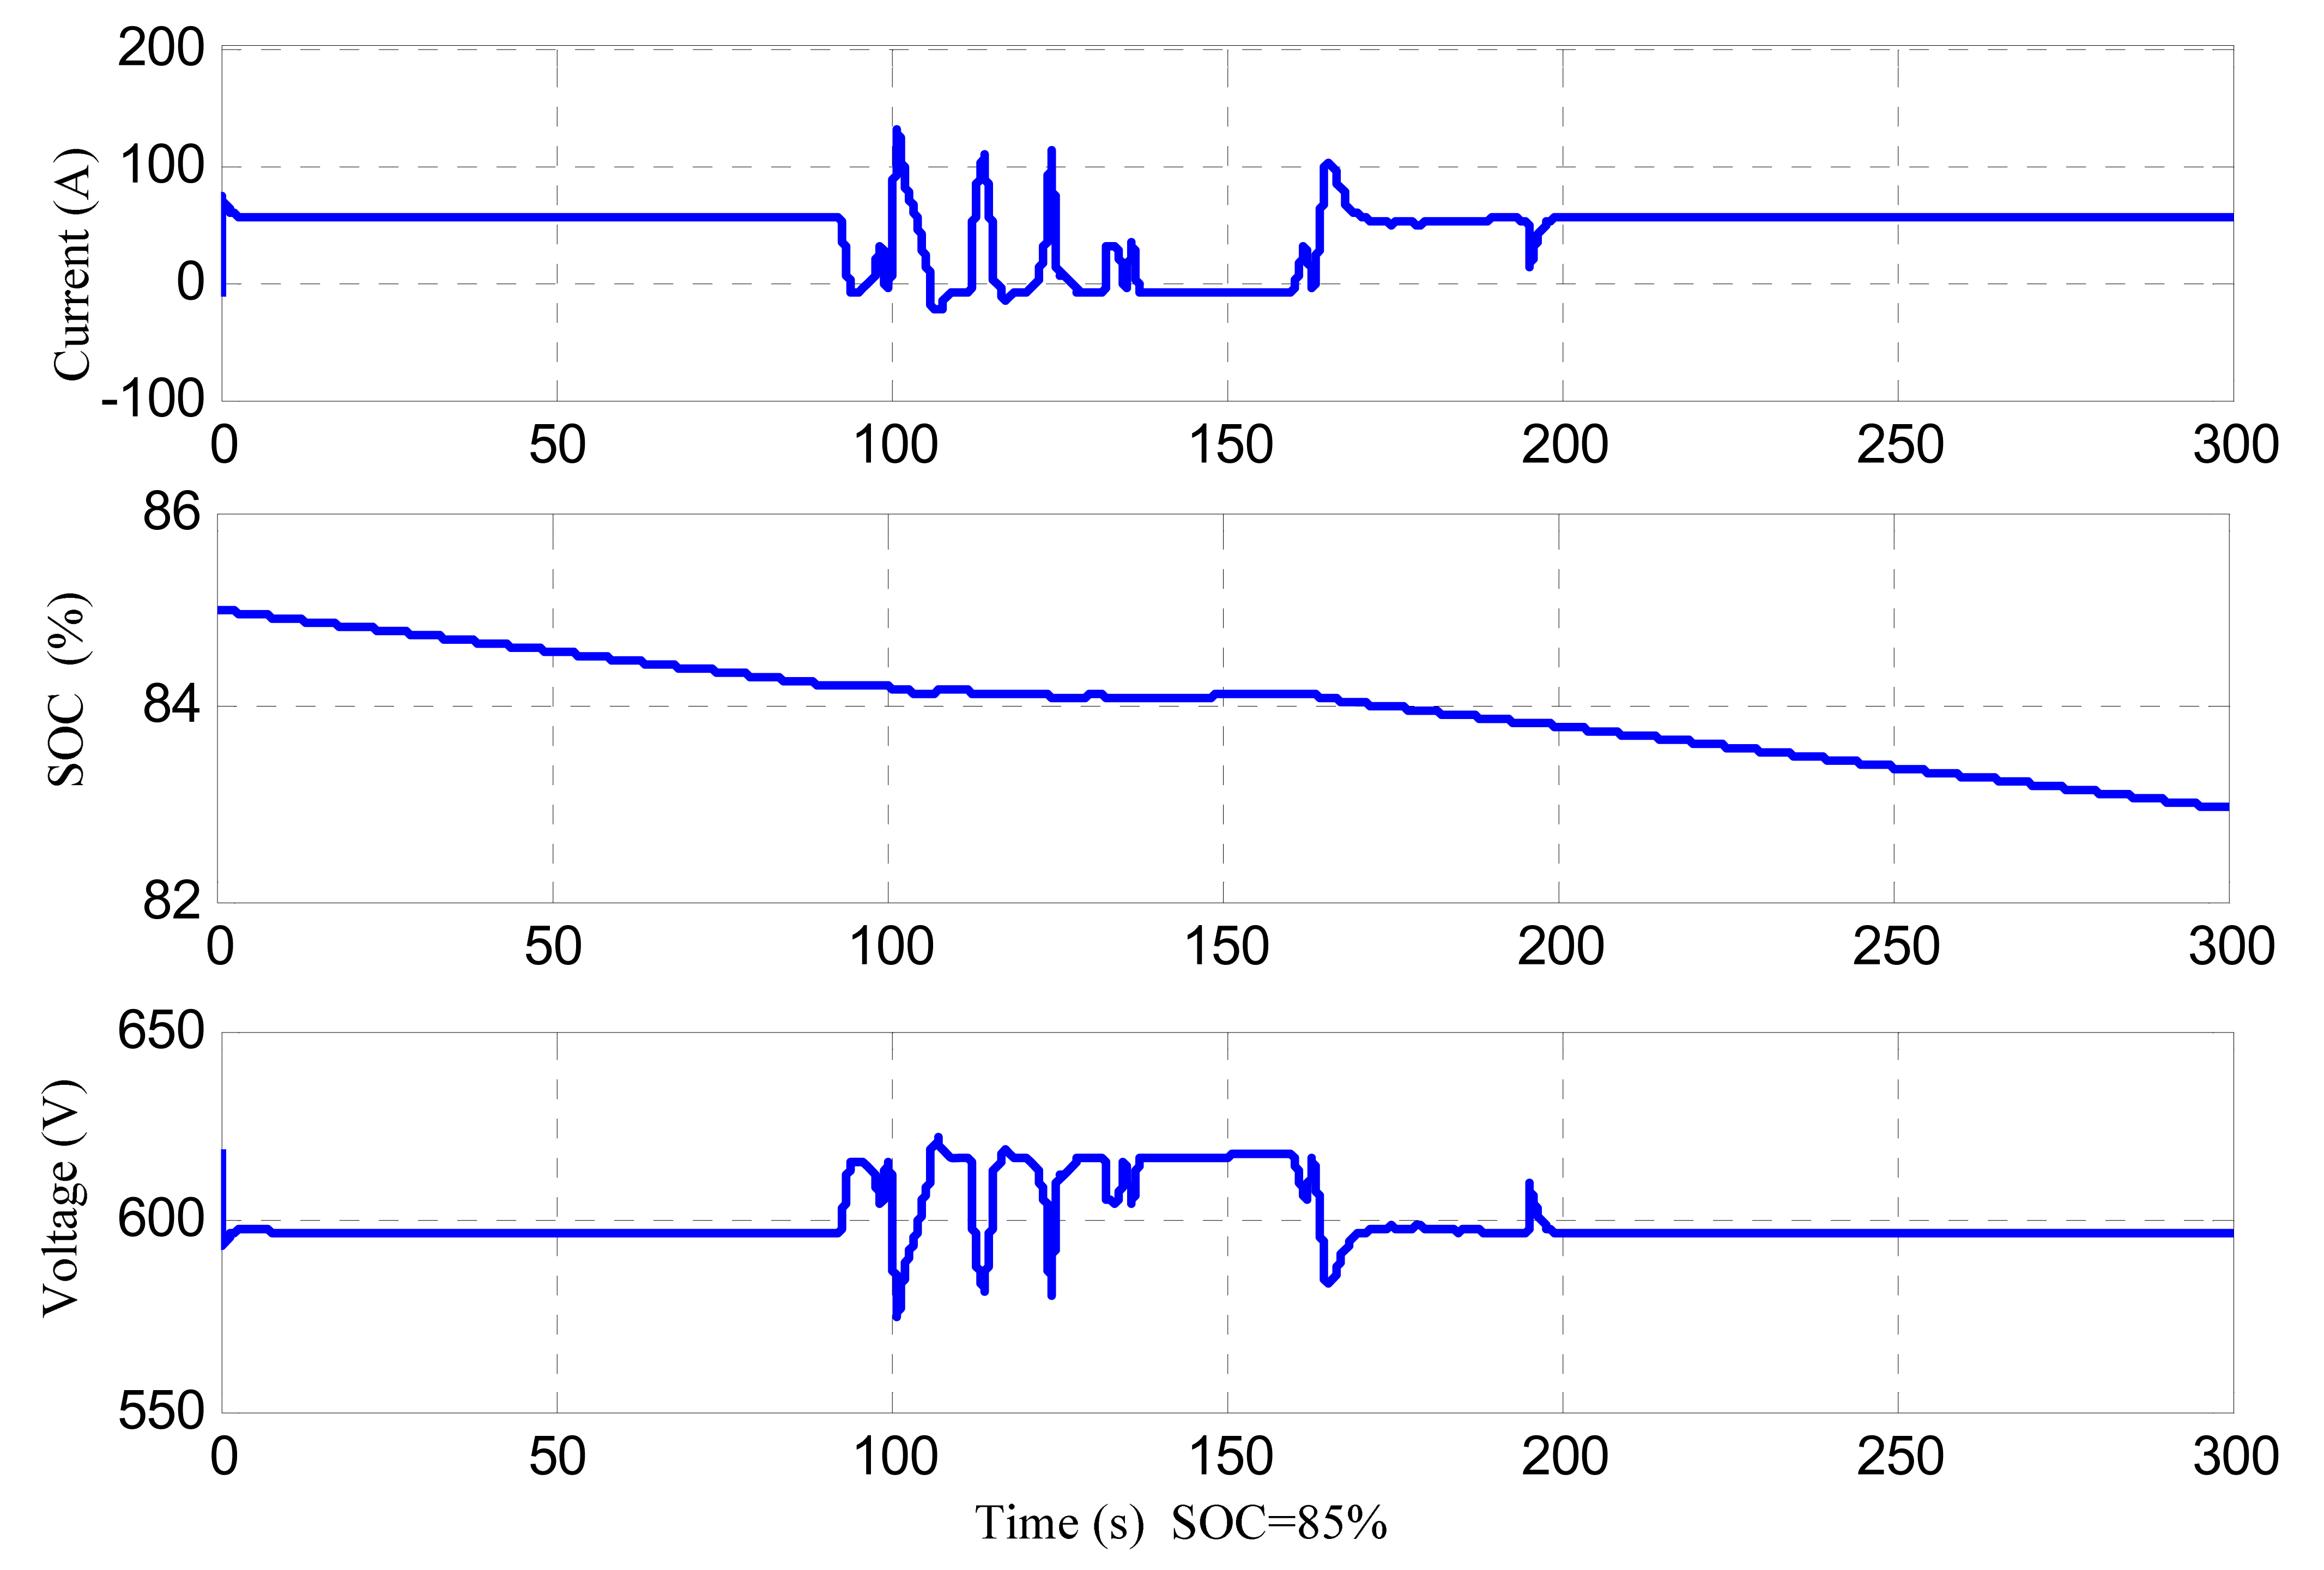
Figure 20 shows the battery characteristics for Case 3. The battery SOC decreases slowly for continuous discharge.
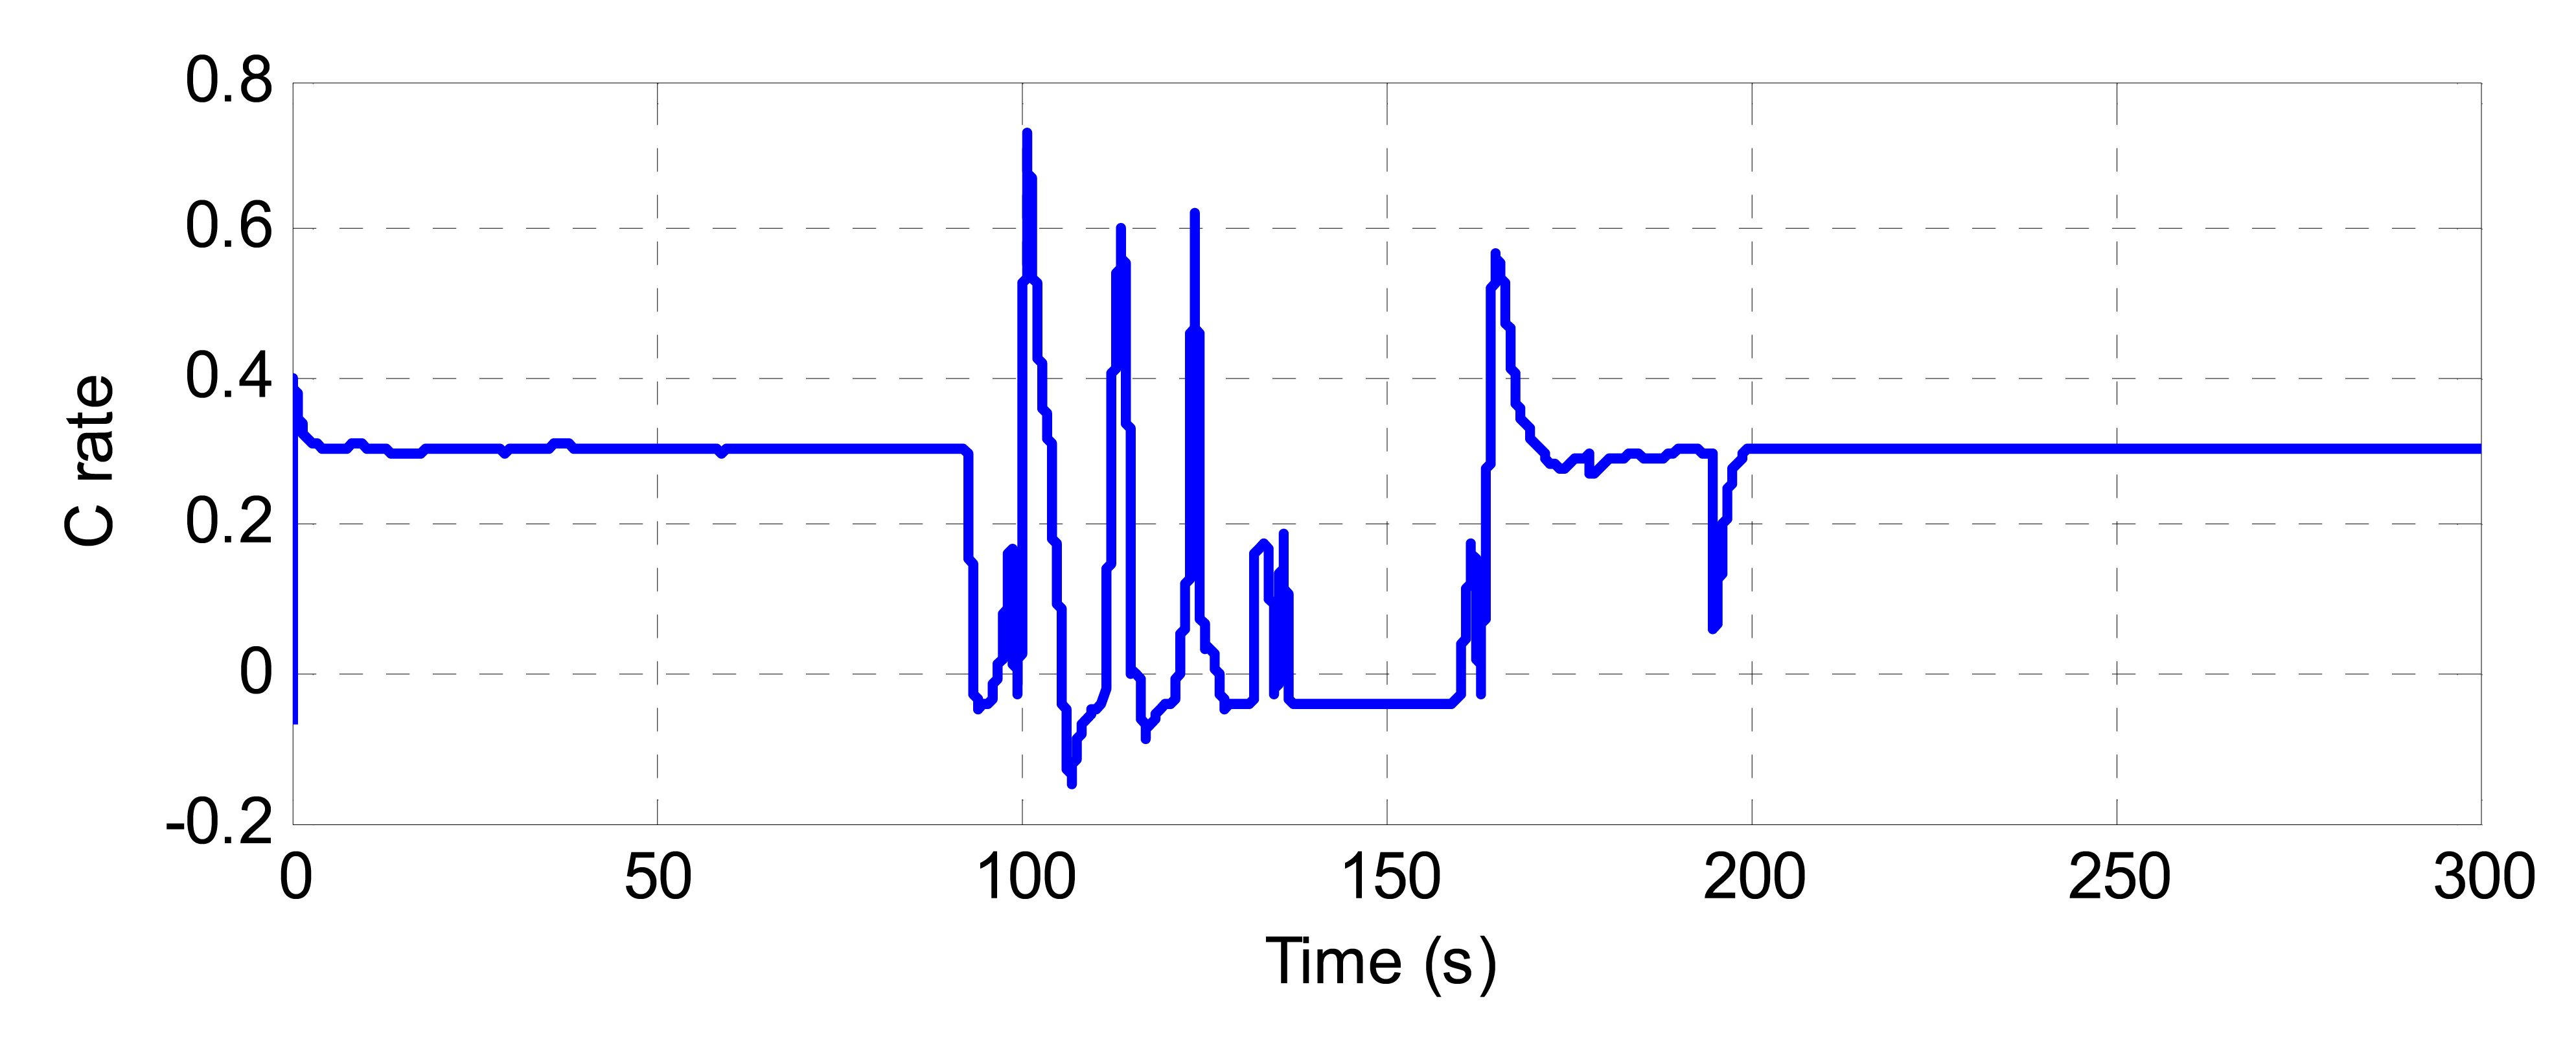
Figure 21 shows the C rate of battery during the cycle. In the figure, the maximum discharging rate is 0.72 at 100 s. The total time is 5.6 s when the C rate is more than 0.5 during the cycle. The charging rate is less than 0.2 during the cycle.
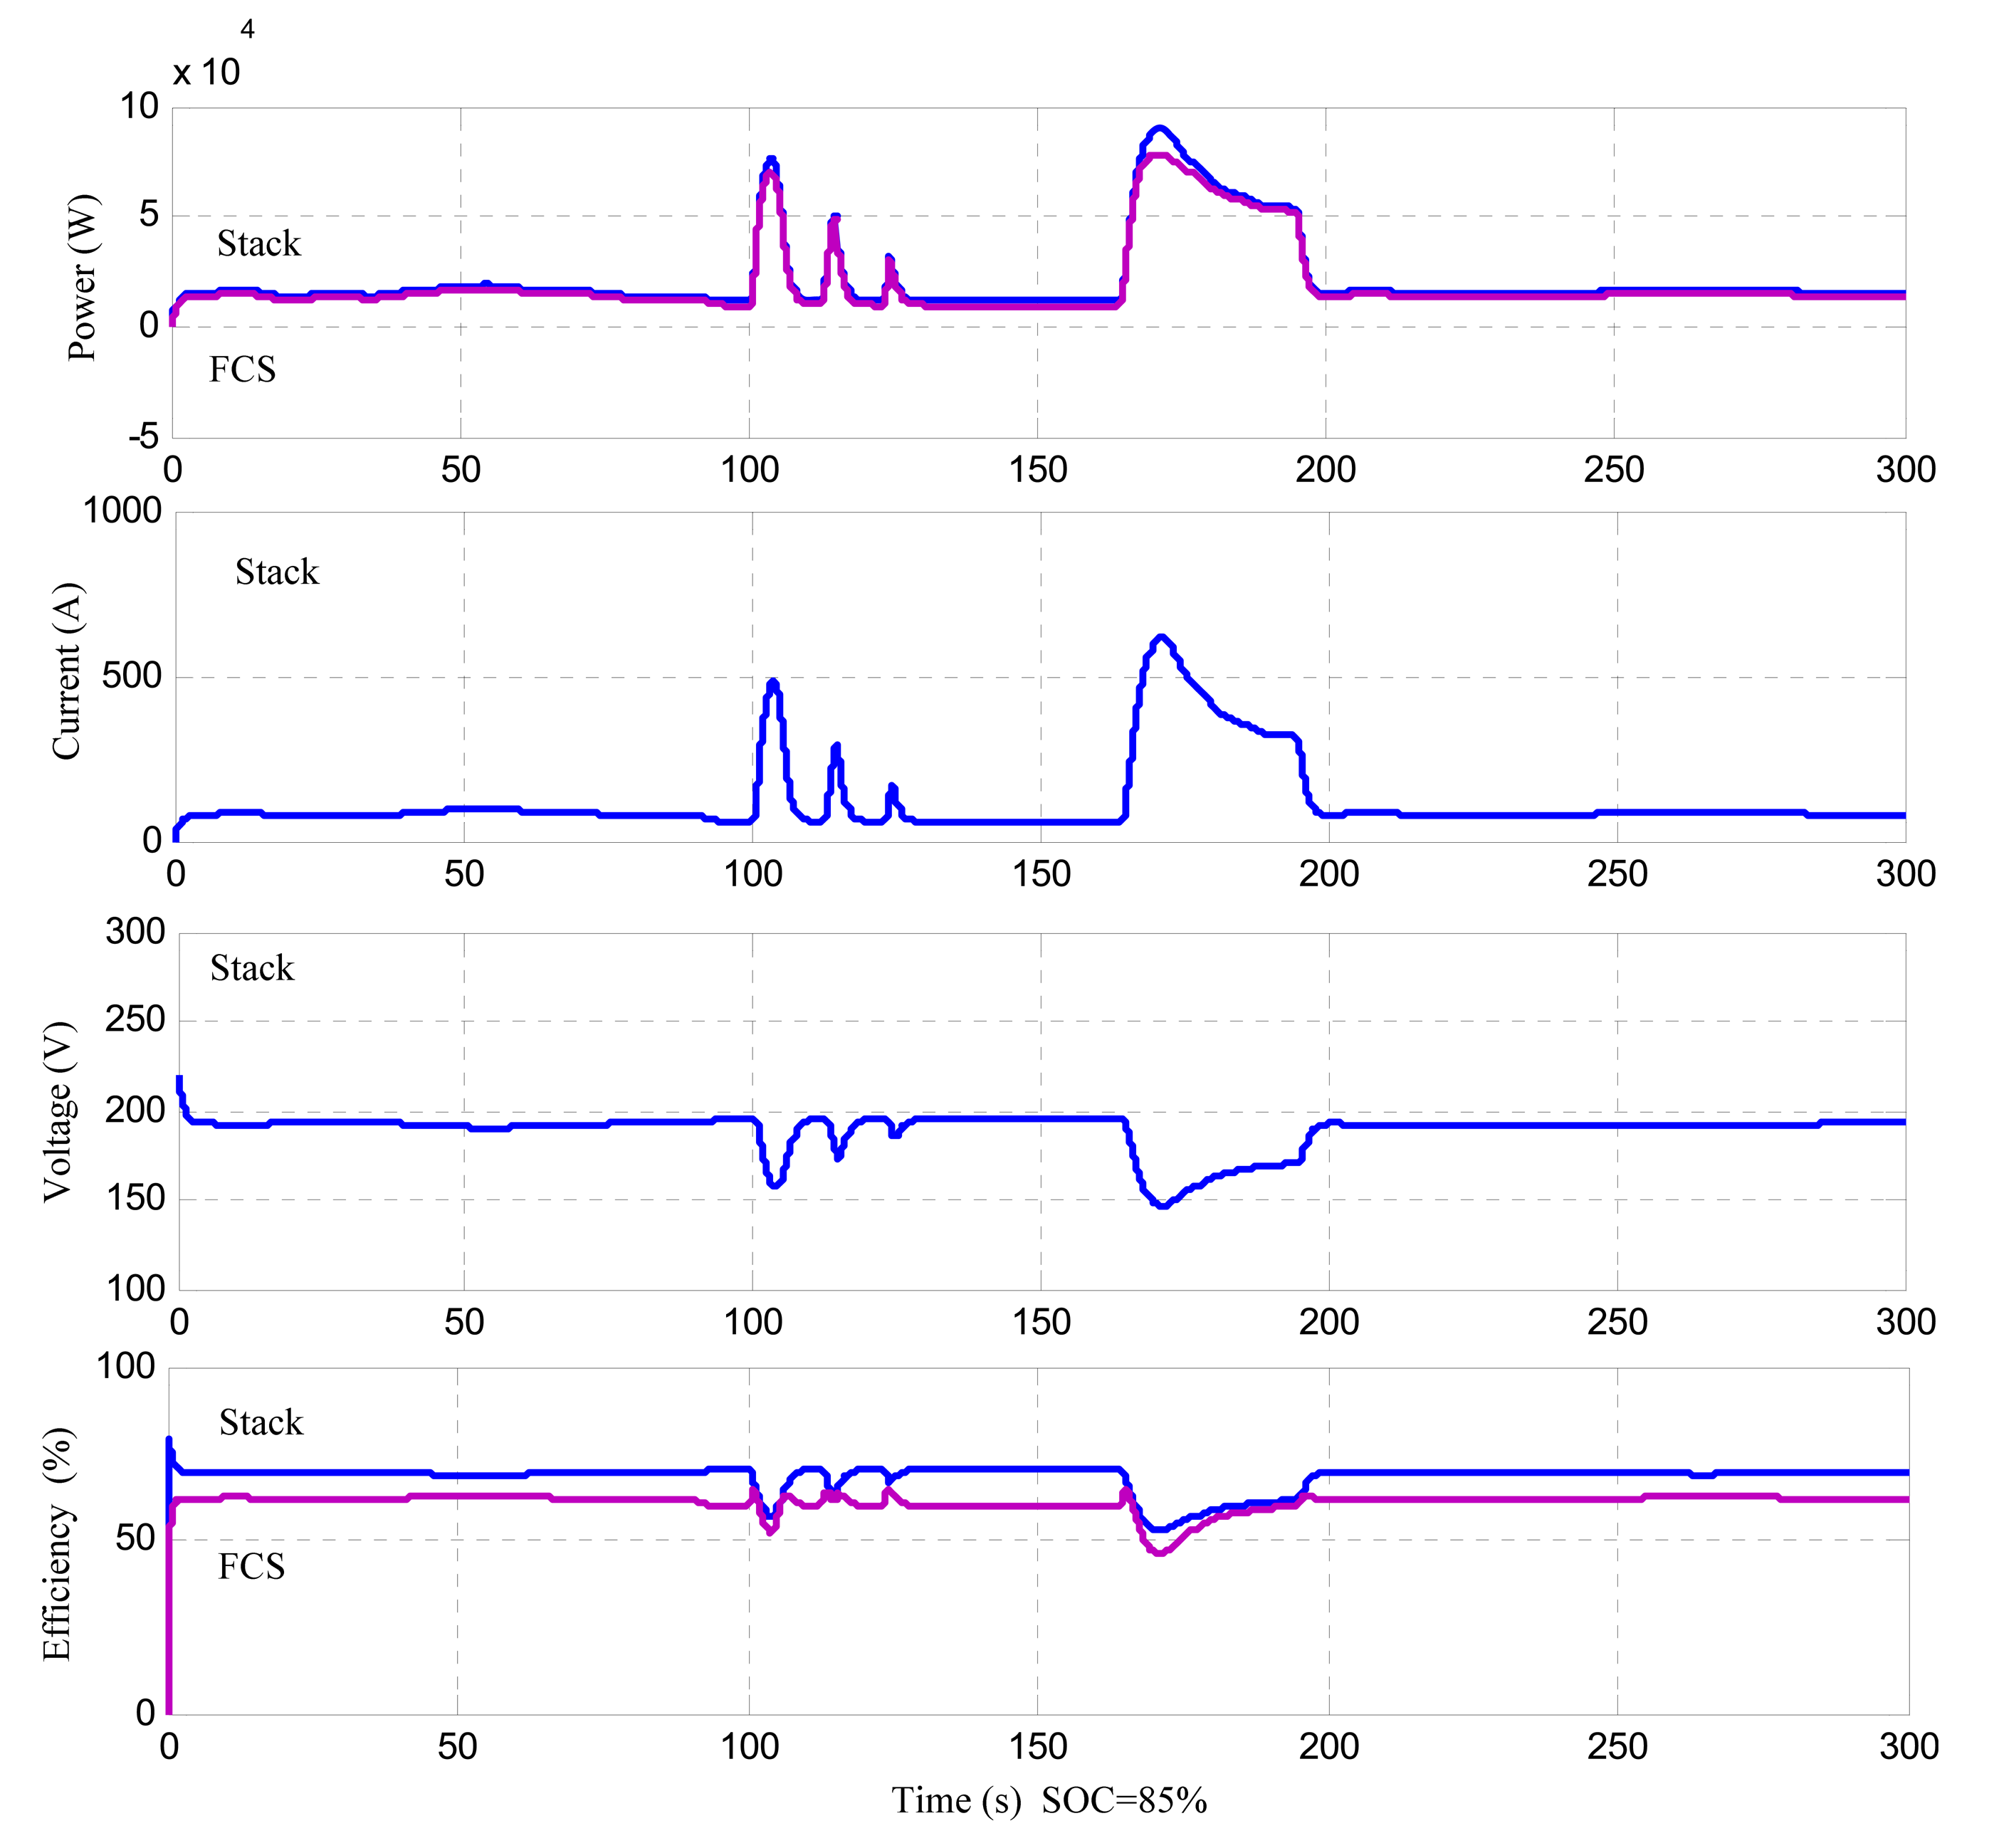
Figure 22 shows the FC characteristics for Case 3. The FCS efficiency is more than 60%, mostly because of the continuous discharge of the battery.
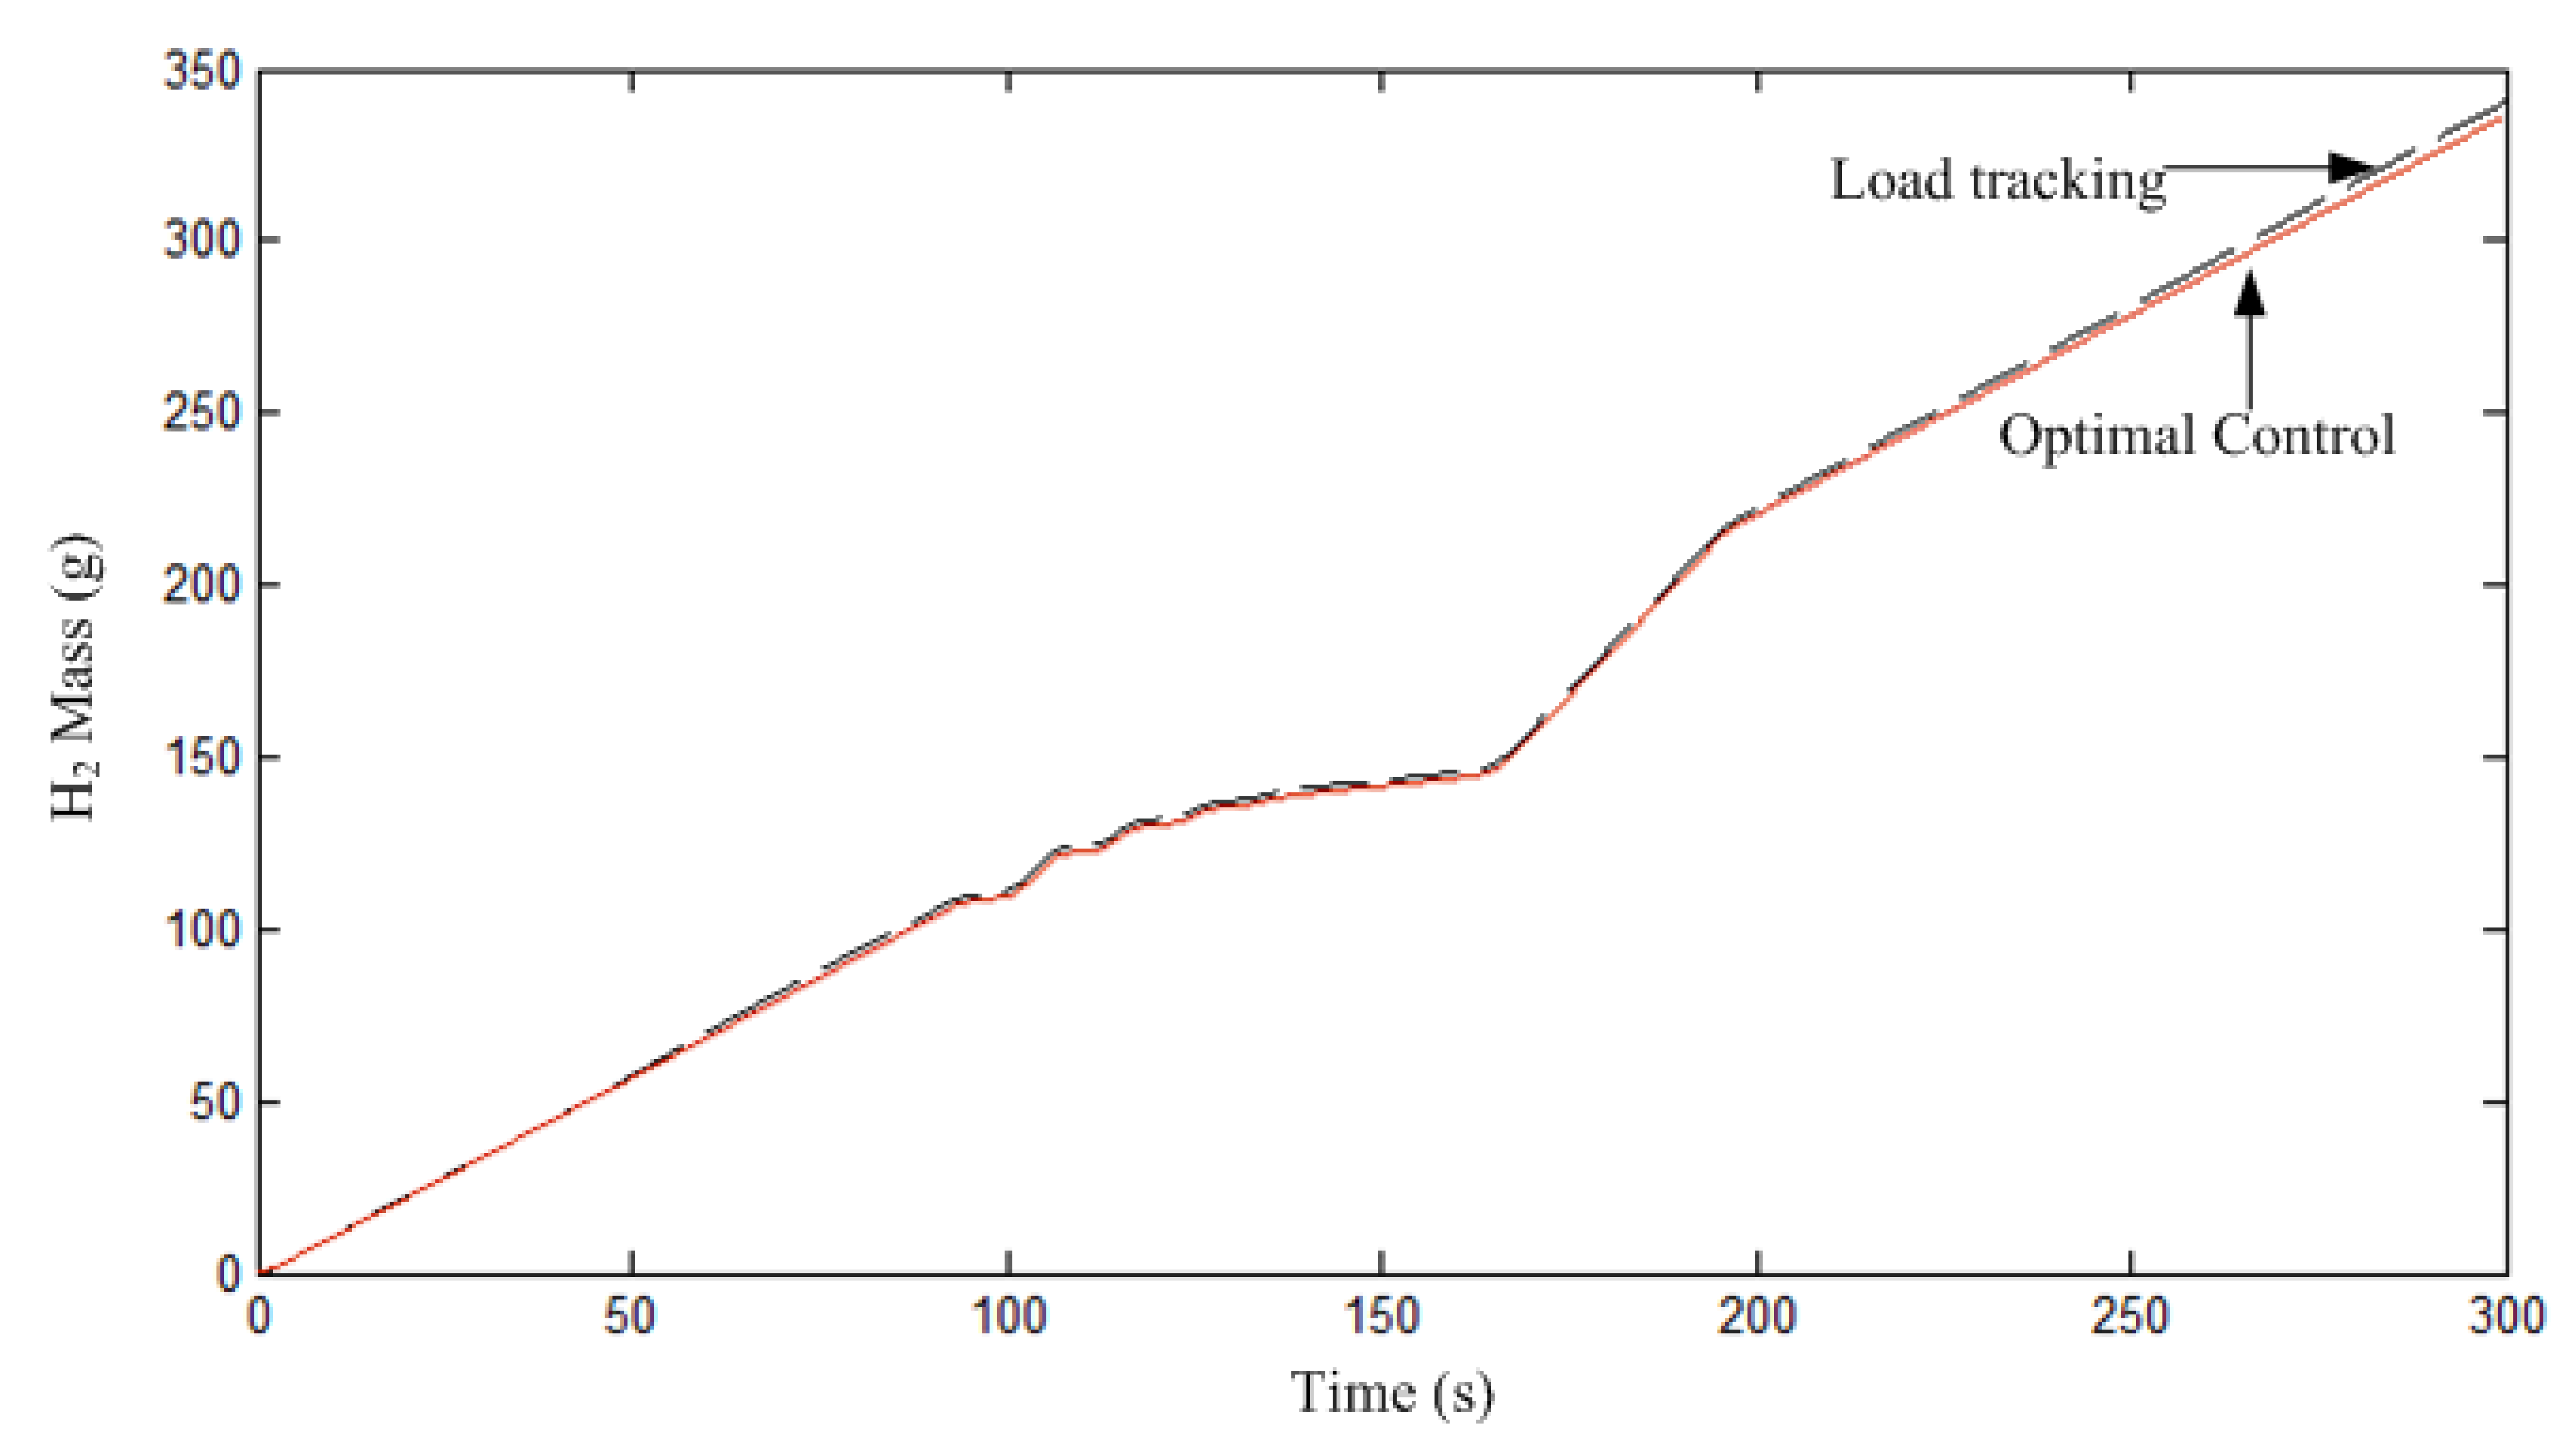
Figure 23 shows the total hydrogen mass consumption of the FCS under Case 2. The system controlled by optimal control has a lower consumption (330 g) than traditional load commands tracking control (342 g). It means that the proposed EMS also achieved better efficiency.
6. Conclusions
There is a focus on all-electric ships powered by FCs because of their high efficiency and low emissions, and there are some R&D projects aiming to develop this technology. This paper presents a hybrid FC/battery power system for a low power boat. The hybrid system consists of PEMFC and a Li-ion battery bank. The FCS is connected to a DC bus by a boost converter, whereas the battery is connected directly to the DC bus. Mathematical models for the components of the hybrid systems are presented, which are implemented in Matlab/Simulink environment. An optimal EMS based on operation states is proposed to determine the operating point of each component of the system and optimize the system efficiency. The hybrid system behavior is then evaluated based on the real driving cycle of a low power FC boat, and the FCS works with optimized efficiency. Simulation results show that the proposed EMS can achieve higher efficiency compared with load commands tracking control, and the discharging and charging rate can be mostly controlled at less than 0.3C.
Acknowledgments
This work was partly supported by the National Natural Science Foundation of China under Grant No. 51007056 and by Brittany Region (France) funds for Post-Doctoral Foreign research stay.
Conflicts of Interest
The authors declare no conflict of interest.
References
- Miola, A.; Ciuffo, B.; Giovine, E.; Marra, M. Regulating Air Emissions from Ships: The State of the Art on Methodologies, Technologies and Policy Options; Publications Office of the European Union: Luxembourg, 2010. Available online: http://ec.europa.eu/dgs/jrc/downloads/jrc_reference_report_2010_11_ships_emissions.pdf (accessed on 10 September 2012).
- Tsea, L.K.C.; Wilkinsa, S.; McGlashana, N.; Urban, B.; Martinez-Botas, R. Solid oxide fuel cell/gas turbine trigeneration system for marine applications. J. Power Sources 2011, 196, 3149–3162. [Google Scholar]
- EG&G Technical Services, Inc. In Fuel Cell Handbook, 7th ed.; US Department of Energy, Office of Fossil Energy, National Energy Technology Laboratory: Morgantown, WV, USA, 2004.
- Tang, T.; Han, J.; Yao, G.; Feng, Y. Development of a PEM Fuel Cell Boat. Proceedings of the 12th International Power Electronics and Motion Control Conference (EPE-PEMC), Portoroz, Slovenia, 30 August–1 September 2006.
- H2Yacht. Available online: http://www.h2yacht.com/ (accessed on 4 September 2012).
- Zemships—Zero Emission Ships. One Hundred Passengers and Zero Emissions: The First Ever Passenger Vessel to Sail Propelled by Fuel Cells. Available online: http://ec.europa.eu/environment/life/project/Projects/index.cfm?fuseaction=home.showFile&rep=file&fil=Zemships_Brochure_EN.pdf (accessed on 9 January 2013).
- Lovers Amsterdam. CO2Zero Canal Cruise. Available online: http://www.lovers.nl/co2zero/ (accessed on 2 December 2012).
- Viking Lady. Available online: http://www.vikinglady.no/ (accessed on 6 March 2013).
- Alkaner, S.; Zhou, P. A comparative study of lice cycle analysis of molten carbon fuel cells and diesel engines for marine application. J. Power Sources 2006, 158, 188–189. [Google Scholar]
- Bensaid, S. MCFC-based marine APU: Comparison between conventional ATR and cracking coupled with SR integrated inside the stack pressurized vessel. Int. J. Hydrog. Energy 2009, 34, 2026–2042. [Google Scholar]
- Wei, J.; Fang, R. Performance Prediction and Dynamic Simulation of Electric Ship Hybrid Power System. Proceedings of the IEEE Electric Ship Technologies Symposium, Philadelphia, PA, USA, 21–23 May 2007.
- Chao, C.-H.; Shieh, J.-J. A new control strategy for hybrid fuel cell-battery power systems with improved efficiency. Int. J. Hydrog. Energy 2012, 37, 13141–13146. [Google Scholar]
- Gao, D.; Jin, Z.; Lu, Q. Energy management strategy based on fuzzy logic for a fuel cell hybrid bus. J. Power Sources 2008, 185, 311–317. [Google Scholar]
- Wang, X.; He, H.; Sun, F.; Sun, X.; Tang, H. Comparative study on different energy management strategies for plug-in hybrid electric vehicles. Energies 2013, 6, 5656–5675. [Google Scholar]
- Mertens, A. The Zemships Propulsion System and Beyond. Proceedings of the Zemships Conference H2Expo, Hamburg, Germany, 22–23 October 2008.
- Han, J.; Charpentier, J.F.; Tang, T. State of the Art of Fuel Cells for Ship Applications. Proceedings of the 2012 IEEE International Symposium on Industrial Electronics, Hangzhou, Zhejiang, China, 28–31 May 2012; pp. 1456–1461.
- Souleman, N.M.; Olivier, T.; Dessaint, L.A. A Generic Fuel Cell Model for the Simulation of Fuel Cell Vehicles. Proceedings of the IEEE Power & Energy Society General Meeting, Calgary, AB, Canada, 26–30 July 2009.
- SimPowerSystems; MathWorks Inc.: Natick, MA, USA, 2010.
- Boettner, D.D.; Paganelli, G.; Guezennec, Y.G.; Rizzoni, G.; Moran, M.J. Proton exchange membrane fuel cell system model for automotive vehicle simulation and control. J. Energy Resour. Technol. 2002, 124, 20–27. [Google Scholar]
- Tremblay, O.; Dessaint, L.-A.; Dekkiche, A.-I. A Generic Battery Model for the Dynamic Simulation of Hybrid Electric Vehicles. Proceedings of the IEEE Vehicle Power and Propulsion Conference, Arlington, VA, USA, 9–12 September 2007.
- TOSUN Energy Inc. Battery Datasheet (48 V–60A h). Available online: http://www.tsebattery.com/china/prod_ups.asp?BigClassID=45 (accessed on 4 May 2013).
- Garcia, P.P.; Fernandez, L.M.; Garcia, C.A.; Jurado, F. Energy management system of fuel-cell-battery hybrid tramway. IEEE Trans. Ind. Electron. 2010, 57, 4013–4023. [Google Scholar]
- Chen, Y.; Lin, S.; Hong, B. Experimental Study on a passive fuel cell/battery hybrid power system. Energies 2013, 6, 6413–6422. [Google Scholar]
- Azib, T.; Bethoux, O.; Remy, G. An innovative control strategy of a single converter for hybrid fuel cell/supercapacitor power source. IEEE Trans. Ind. 2010, 57, 4024–4031. [Google Scholar]


| Parameters | Value | Unit |
|---|---|---|
| Motor peak power | 120 | kW |
| PEMFC rated power | 80 | kW |
| PEMFC voltage | 140–260 | V |
| PEMFC current | 280–520 | A |
| Battery (lead gel) | 560 V/360 | A·h |
| Displacement of water | 72 | t |
| Length | 25.56 | m |
| Width | 5.20 | m |
| Passenger capacity | 100 | - |
| Maximum speed | 15 | km/h |
| Parameters | Value | Unit |
|---|---|---|
| Nominal stack power | 80 | kW |
| Nominal stack efficiency | 54.5% | - |
| FC resistance | 0.070 | Ω |
| Nernst voltage of a cell | 1.1125 | V |
| Exchange current | 0.50886 | A |
| Exchange coefficient | 0.77139 | - |
| Fuel composition | 99.99% | - |
| Oxidant composition | 21% | - |
| Operating temperature | 65 | °C |
| Type | 48 V/60 A h | 576 V/180 A h |
|---|---|---|
| Capacity | 60 A h | 180 A h |
| Output voltage | 36–55 V | 430–660 V |
| Continuous current (0.5C) | 30 A | 90 A |
| Energy | 2.6 kW h | 94.5 kW h |
| Life cycle (0.3C, 80% DOD) | 1500 | 1500 |
| Maximum discharging current (2C in 10 s) | 60 A | 360 A |
| SOC of Battery | State | Power of load | Reference power of FC |
|---|---|---|---|
| SOC > 80% | 1 | Pload ≤ PFCmin | PFCmin/braking |
| 2 | Pload ≤ PFCmin + Poptdis | PFCmin | |
| 3 | PLoad ≤ PFCmax + Poptdis | PFC = PLoad − Poptdis | |
| 4 | PFCmax + Poptdis < PLoad | PFCmax | |
| 50% ≤ SOC ≤ 80% | 5 | Pload ≤ PFCmin | PFCmin |
| 6 | Pload ≤ PFCopt − PBATopt | Pload | |
| 7 | Pload ≤ PFCopt + PBATopt | PFCopt | |
| 8 | Pload ≤ PFCmax | Pload | |
| SOC < 50% | 9 | Pload > PFCmax | PFCmax |
| 10 | PLoad ≤ PFCmax − Poptchar | Pload + Poptchar | |
| 11 | PLoad > PFCmax − Poptchar | PFCmax | |
© 2014 by the authors; licensee MDPI, Basel, Switzerland. This article is an open access article distributed under the terms and conditions of the Creative Commons Attribution license ( http://creativecommons.org/licenses/by/3.0/).
Share and Cite
Han, J.; Charpentier, J.-F.; Tang, T. An Energy Management System of a Fuel Cell/Battery Hybrid Boat. Energies 2014, 7, 2799-2820. https://doi.org/10.3390/en7052799
Han J, Charpentier J-F, Tang T. An Energy Management System of a Fuel Cell/Battery Hybrid Boat. Energies. 2014; 7(5):2799-2820. https://doi.org/10.3390/en7052799
Chicago/Turabian StyleHan, Jingang, Jean-Frederic Charpentier, and Tianhao Tang. 2014. "An Energy Management System of a Fuel Cell/Battery Hybrid Boat" Energies 7, no. 5: 2799-2820. https://doi.org/10.3390/en7052799