Multi-Faceted Assessment of a Wireless Communications Infrastructure for the Green Neighborhoods of the Smart Grid


Abstract
: Reducing electricity consumption and integrating renewable power generation sources represent two of the main drivers of the so-called Smart Grid. Machine-to-Machine (M2M) communications will play a key role on making such a Smart Grid a reality, since they will enable the required bidirectional real-time bulk information exchange. However, communications for the Smart Grid present specific requirements from both technical and economic perspectives, so it is crucial to evaluate how existing communication architectures and technologies meet them before undertaking the important investments needed to deploy this kind of infrastructure on a large scale. The main goal of this paper is to evaluate, from different perspectives, the core M2M communications infrastructure of a platform designed to reduce electricity consumption and integrate renewable generation at residential level. Such a communications infrastructure is fully based on widely deployed wireless communications technologies such as IEEE 802.11 and General Packet Radio Service (GPRS). Notably, the paper assesses the operational costs of using different security solutions in the GPRS segment and the performance of the selected communications technologies based on different metrics (goodput, in the case of IEEE 802.11, and transmission time, in the case of GPRS).1. Introduction
The so-called Smart Grid represents a revolution in the power distribution and customer domains (notably, at the residential level). The electric power industry has traditionally devoted more attention and resources to generation and power transmission networks rather than to power distribution networks, since the former allowed keeping generation and consumption balanced under the traditional assumption that the demand for electricity dictates the generation. As a result, bulk generation plants and power transmission systems have been traditionally monitored using legacy communication networks which allow a certain level of centralized coordination; whereas power distribution grids have been traditionally passive systems with limited communication capabilities.
However, increasing energy efficiency and the penetration of distributed generation based on renewables represent two key issues to reduce Greenhouse Gas (GHG) emissions which especially challenge the power distribution and customer domains of the Smart Grid, since the unpredictable and uncontrollable nature of renewables impose the coordination of generation and consumption points in almost real time (e.g., through the so-called Demand Response (DR) programs) in order to assure system stability.
Machine-to-Machine (M2M) communications allow networked devices to communicate between each other without further human intervention. What in the very beginning seemed to be a tailored solution for telemetry applications, has become a communications paradigm itself, addressing the myriad of applications existing and yet to be devised in the wide context of the Internet of Things. As a matter of fact, M2M communications represent one of the main pillars of the Smart Grid in that they will enable the required bidirectional real-time exchange of information between the consumption and generation facilities to be monitored and controlled, and the information systems where the optimization processes run.
Although there is a plethora of communications technologies available for use in such M2M communication infrastructures for the Smart Grid [1,2], wireless ones are of special interest. As a token of that, the National Institute of Standards and Technologies (NIST) has set up a specific Working Group within the Priority Action Plan 2 (PAP2) to tackle the challenges and opportunities of wireless communications in the Smart Grid [3]. Communications for the Smart Grid present specific requirements from both the technical and economic perspectives, such as [4–6]:
Quality of Service (QoS). The communications infrastructure must provide a given level of QoS that fits the target application. Notably, QoS policies are mainly oriented to traffic prioritization and resource allocation to face congestion situations. Some parameters which are widely used to quantify such QoS level are:
- ○
Latency. It can be defined as the End-to-End (E2E; delay of the data.
- ○
Bandwidth. The communications infrastructure must provide an aggregated data rate high enough to carry the traffic associated to the target application. In general, this will depend on the volume of devices as well as on the size of the exchanged packets and the traffic pattern.
- ○
Reliability. The communications infrastructure must guarantee that it will work correctly during a given percentage of time (e.g., throughout a year;. The more critical the application is, the higher such a percentage needs to be.
Interoperability. The communications infrastructure must allow equipment from different manufacturers to interact seamlessly. In order to achieve this goal, the main functional blocks which compose the communications infrastructure as well as the interfaces among them must be defined and standardized. Standardization is crucial to effectively achieve this goal, which eventually fosters competition and thus yields more reliable products at lower cost.
Scalability. The communications infrastructure must ensure scalability from both the technical and economic perspectives. On the one side, taking into account the huge number of devices this kind of systems involves, the selected communications technologies must minimize the deployment, maintenance and operational costs. On the other side, the communications architecture must be able to incorporate new devices and to accommodate new services.
Security and privacy. Due to the fact that Smart Grid applications handle sensitive data, security (both physical and cyber-security) and privacy represent key factors for their wide deployment and adoption. If privacy is not guaranteed, many users will not embrace many of the new services. If security is not guaranteed, many service providers will not implement or rely on many of such new services. However, since these two features and costs are usually directly proportional, a trade-off is required in order to obtain feasible solutions.
As a result, it is crucial to evaluate how different communication architectures and technologies meet such requirements before undertaking the important investments needed to deploy this kind of infrastructures on a large scale. Simulations represent a powerful, cost-effective and flexible solution to achieve this goal, although the relevance of their results tightly depends on how accurately the model behind such simulations fits real world scenarios. Therefore, a proper characterization of the communications requirements of the target application is of capital importance in order to obtain meaningful results [7,8].
The work presented hereby aims to shed some light on this issue. The main goal of this paper is to evaluate, from different perspectives, the core communication infrastructure of a platform designed to reduce electricity consumption and integrate distributed renewable generation within the so-called green or energy-positive neighborhoods of the Smart Grid, which are neighborhoods where a substantial part of their consumption is produced by local renewable generation. Such a communications infrastructure is fully based on widely deployed wireless communications technologies, such as IEEE 802.11 and General Packet Radio Service (GPRS). This paper assesses the operational costs of using different security solutions in the GPRS segment and the performance of the aforementioned communications technologies based on different metrics (namely, goodput, in the case of 802.11, and transmission time, in the case of GPRS).
The remainder of the paper is structured as follows: Section 2 provides an overview of the most relevant standardization activities related to this work. Section 3 summarizes the already published research that this paper takes as baseline. First, the proposed M2M communications architecture is briefly described and placed in the context of the standardization work reviewed in Section 2. Next, the characterization of the communications requirements and features of the target application is outlined. Taking this model as reference, Section 4 presents the assessment of the communications infrastructure from both economic and technical perspectives. Section 5 discusses the work presented throughout the paper along with other related works. Finally, Section 6 draws conclusions and outlines some future research lines.
2. Overview of Related Standardization Activities
The Smart Grid involves a wide range of technologies and a myriad of standards [9]. Therefore, this section does not aim to be exhaustive, but rather seeks to focus on the most relevant work related to this paper. To effectively look for any other standard, the International Electrotechnical Commission (IEC) has recently created a free Smart Grid Standards Mapping Tool that allows one to easily identify the standards that are needed for any part of the Smart Grid, including not only IEC standards, but also standards from other organizations [10].
2.1. NIST Smart Grid Interoperability Panel
The NIST Smart Grid Interoperability Panel (SGIP) is a private/public partnership, funded in late 2009 by different industry stakeholders in cooperation with the United States (US) Federal Government, which aims at developing a framework for coordinating all Smart Grid stakeholders and accelerating standards harmonization and interoperability. In January 2013, the SGIP entered a new phase becoming a self-sustaining entity with the majority of funding coming from industry stakeholders, despite NIST still maintains an active role.
The SGIP is organized in Technical Committees, PAP teams, and Domain Expert Working Groups (DEWGs). The Technical Committees deal with transversal issues and establish guidelines. More specific tasks are carried out by temporary Working Groups belonging either to the DEWG or to the PAP categories. There are two Technical Committees and a Working Group performing activities in a permanent basis, namely the Smart Grid Architecture Committee (SGAC), the Smart Grid Testing and Certification Committee (SGTCC), and the Cyber Security Working Group (CSWG).
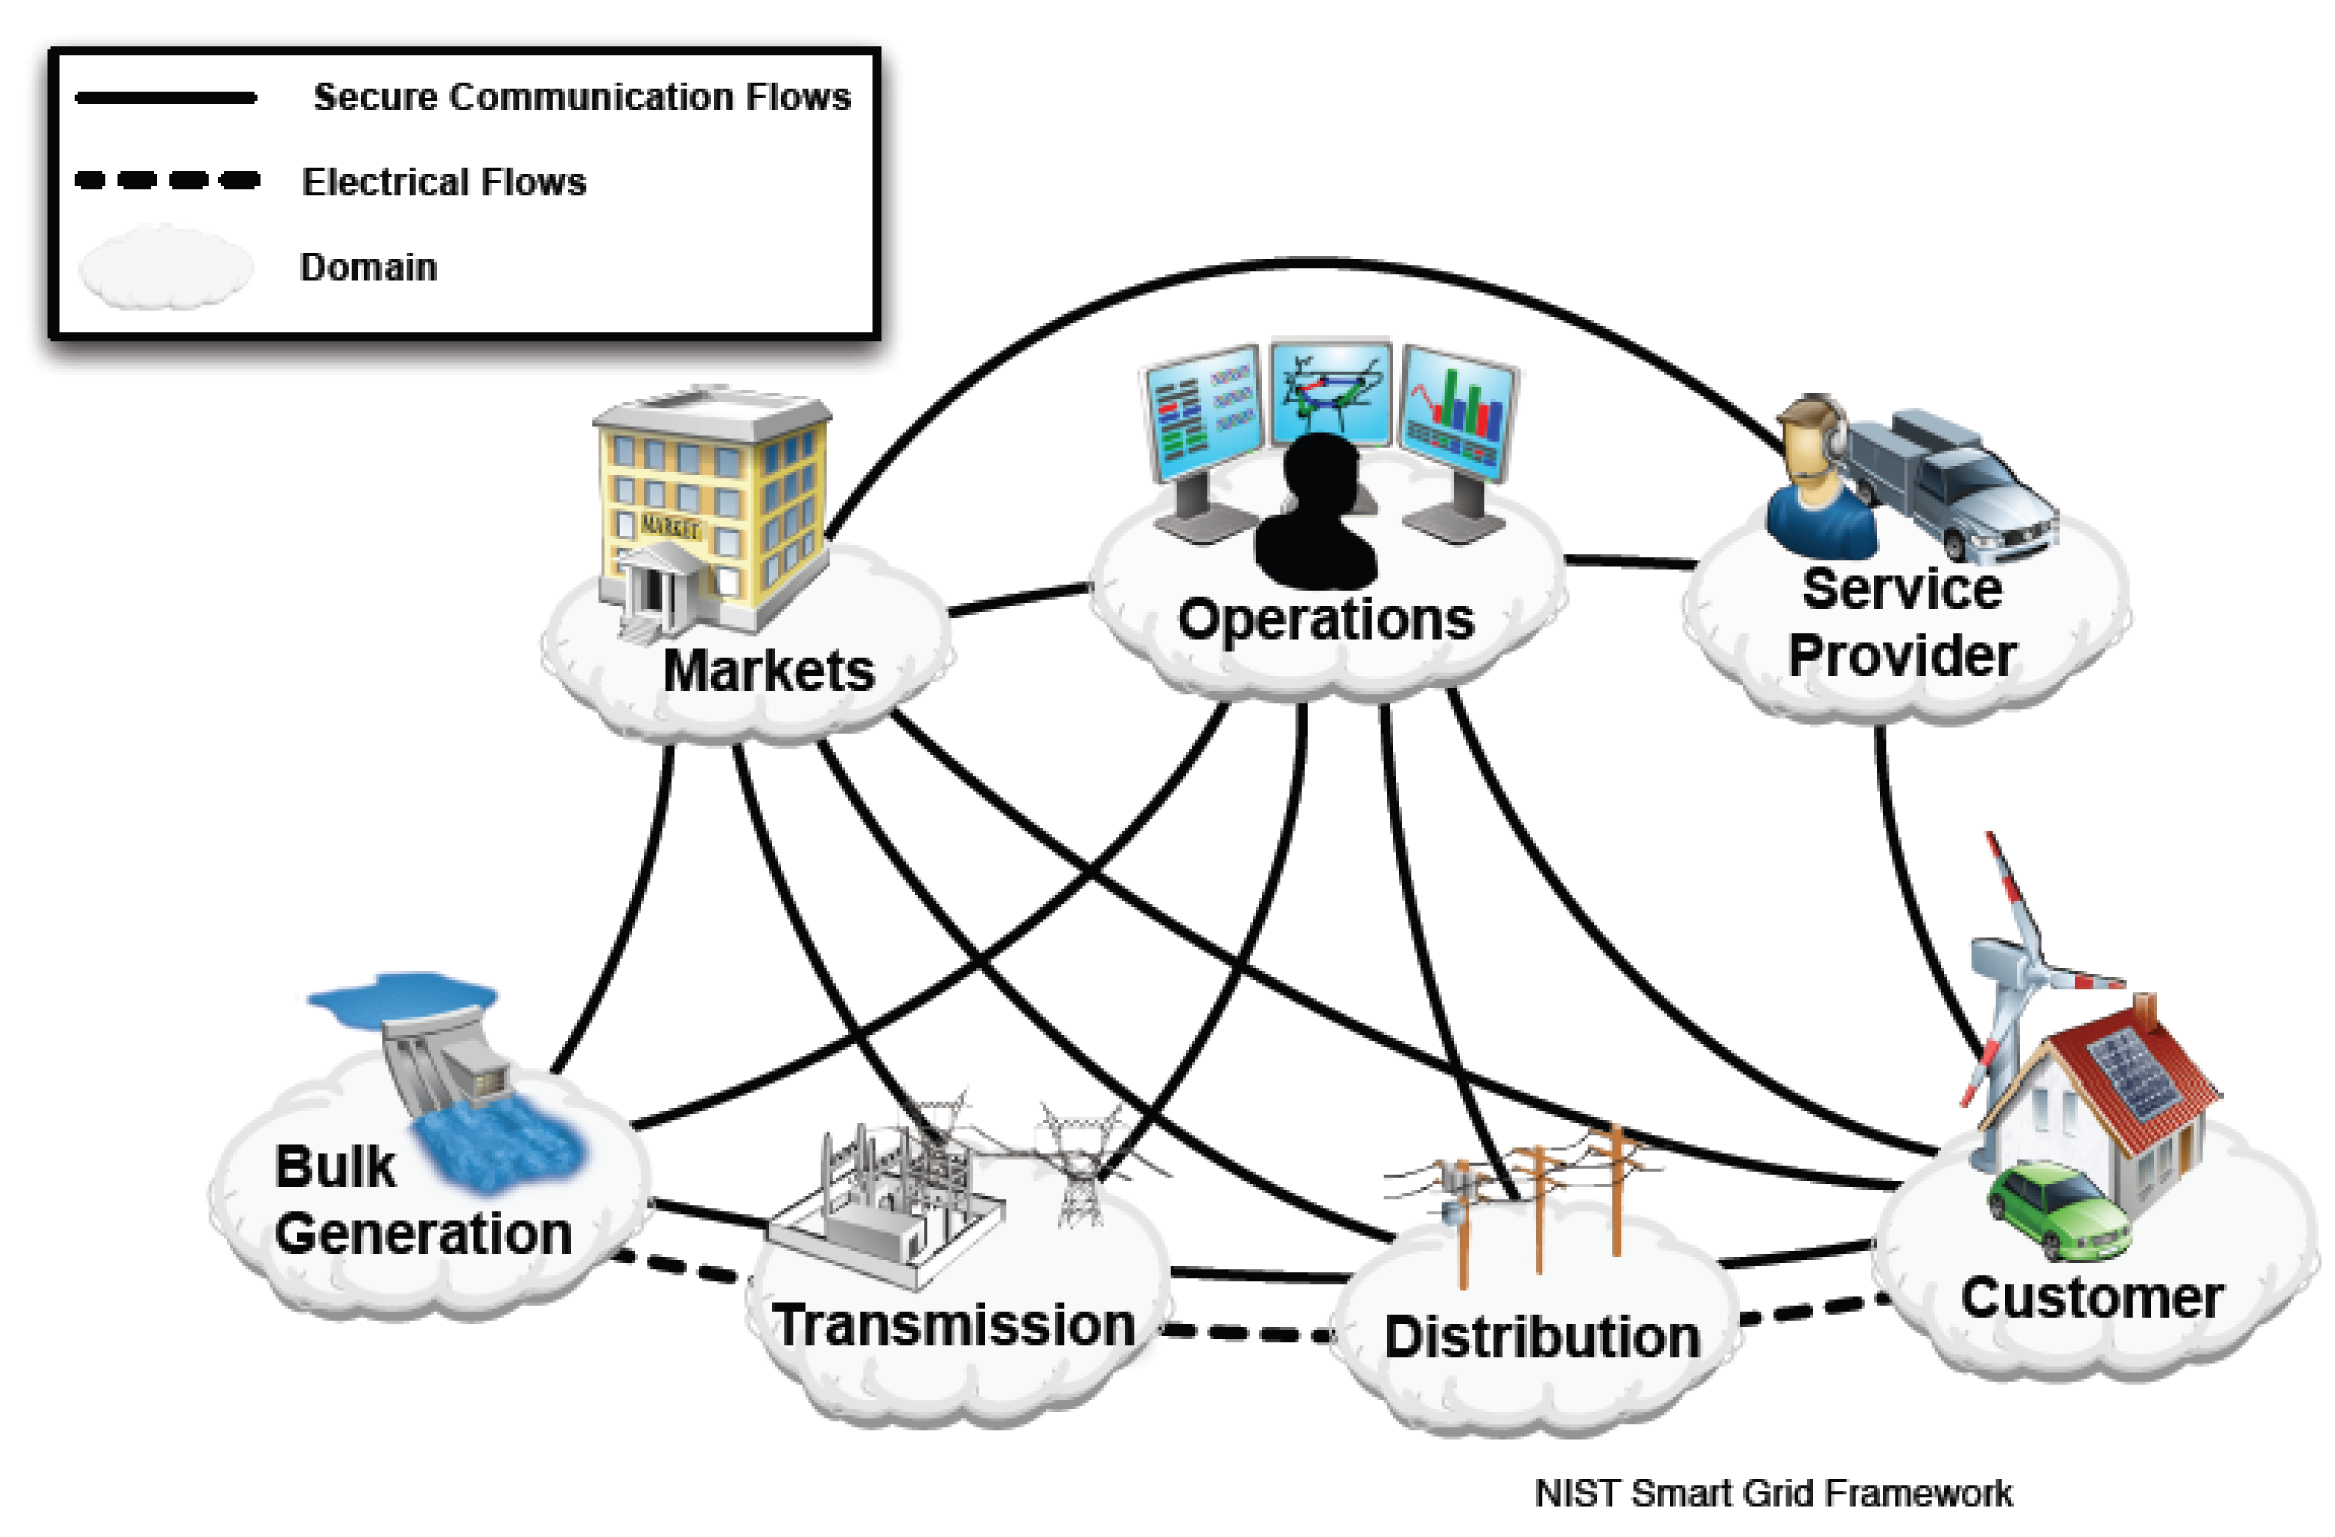
As a first step towards the harmonization of Smart Grid standards to fully support interoperability, the NIST SGIP developed the Smart Grid conceptual model shown in Figure 1. The first version of this conceptual model was published in January 2010 [11] and it was reviewed and updated in February 2012 [12].
As Figure 1 shows graphically, the NIST Smart Grid conceptual model defines seven domains as well as the electrical and communications flows among them. It can be seen that electrical flows involve the traditional subsystems of the electrical grid; whereas communications flows almost create a mesh topology between every domain, which illustrates the outstanding importance of communications in the Smart Grid.
Each domain-and its sub-domains-encompasses Smart Grid actors and applications. Actors include devices, systems, programs, and stakeholders that make decisions and exchange information. Applications are tasks performed by one or more actors within a domain (e.g., home automation). All these pieces can be orchestrated to obtain useful use cases (i.e., select a given domain, a given application, its specific requirements, the actors involve in this application, and describe how they interact). Table 1 summarizes the main actors involved in each domain.
Although other standardization bodies have also defined their own Smart Grid conceptual models, the NIST Smart Grid conceptual model is the most widely accepted and so it is taken as reference in the remainder of this paper.
Beside the Smart Grid conceptual model, one of the main outcomes of the SGIP activity is the elaboration of a compendium of standards, practices, and guidelines that allow the development and deployment of a robust and interoperable Smart Grid. As a result, in May 2011 the SGIP Governing Board established the so-called Catalog of Standards (CoS) and the first six standards of such a CoS were approved by the SGIP Plenary in July 2011. This CoS is available on-line through the NIST Smart Grid Collaboration wiki [13]. As of today, the CoS comprises 20 individual standards and five series of standards that in turn contain 36 additional standards, which accounts for a total of 56 standards.
2.2. IEEE 2030
Once a conceptual model of the Smart Grid is defined, a reference architecture, which works such a conceptual model out by defining functional blocks and interfaces, thus bringing it closer to implementation and so to developers, is required.
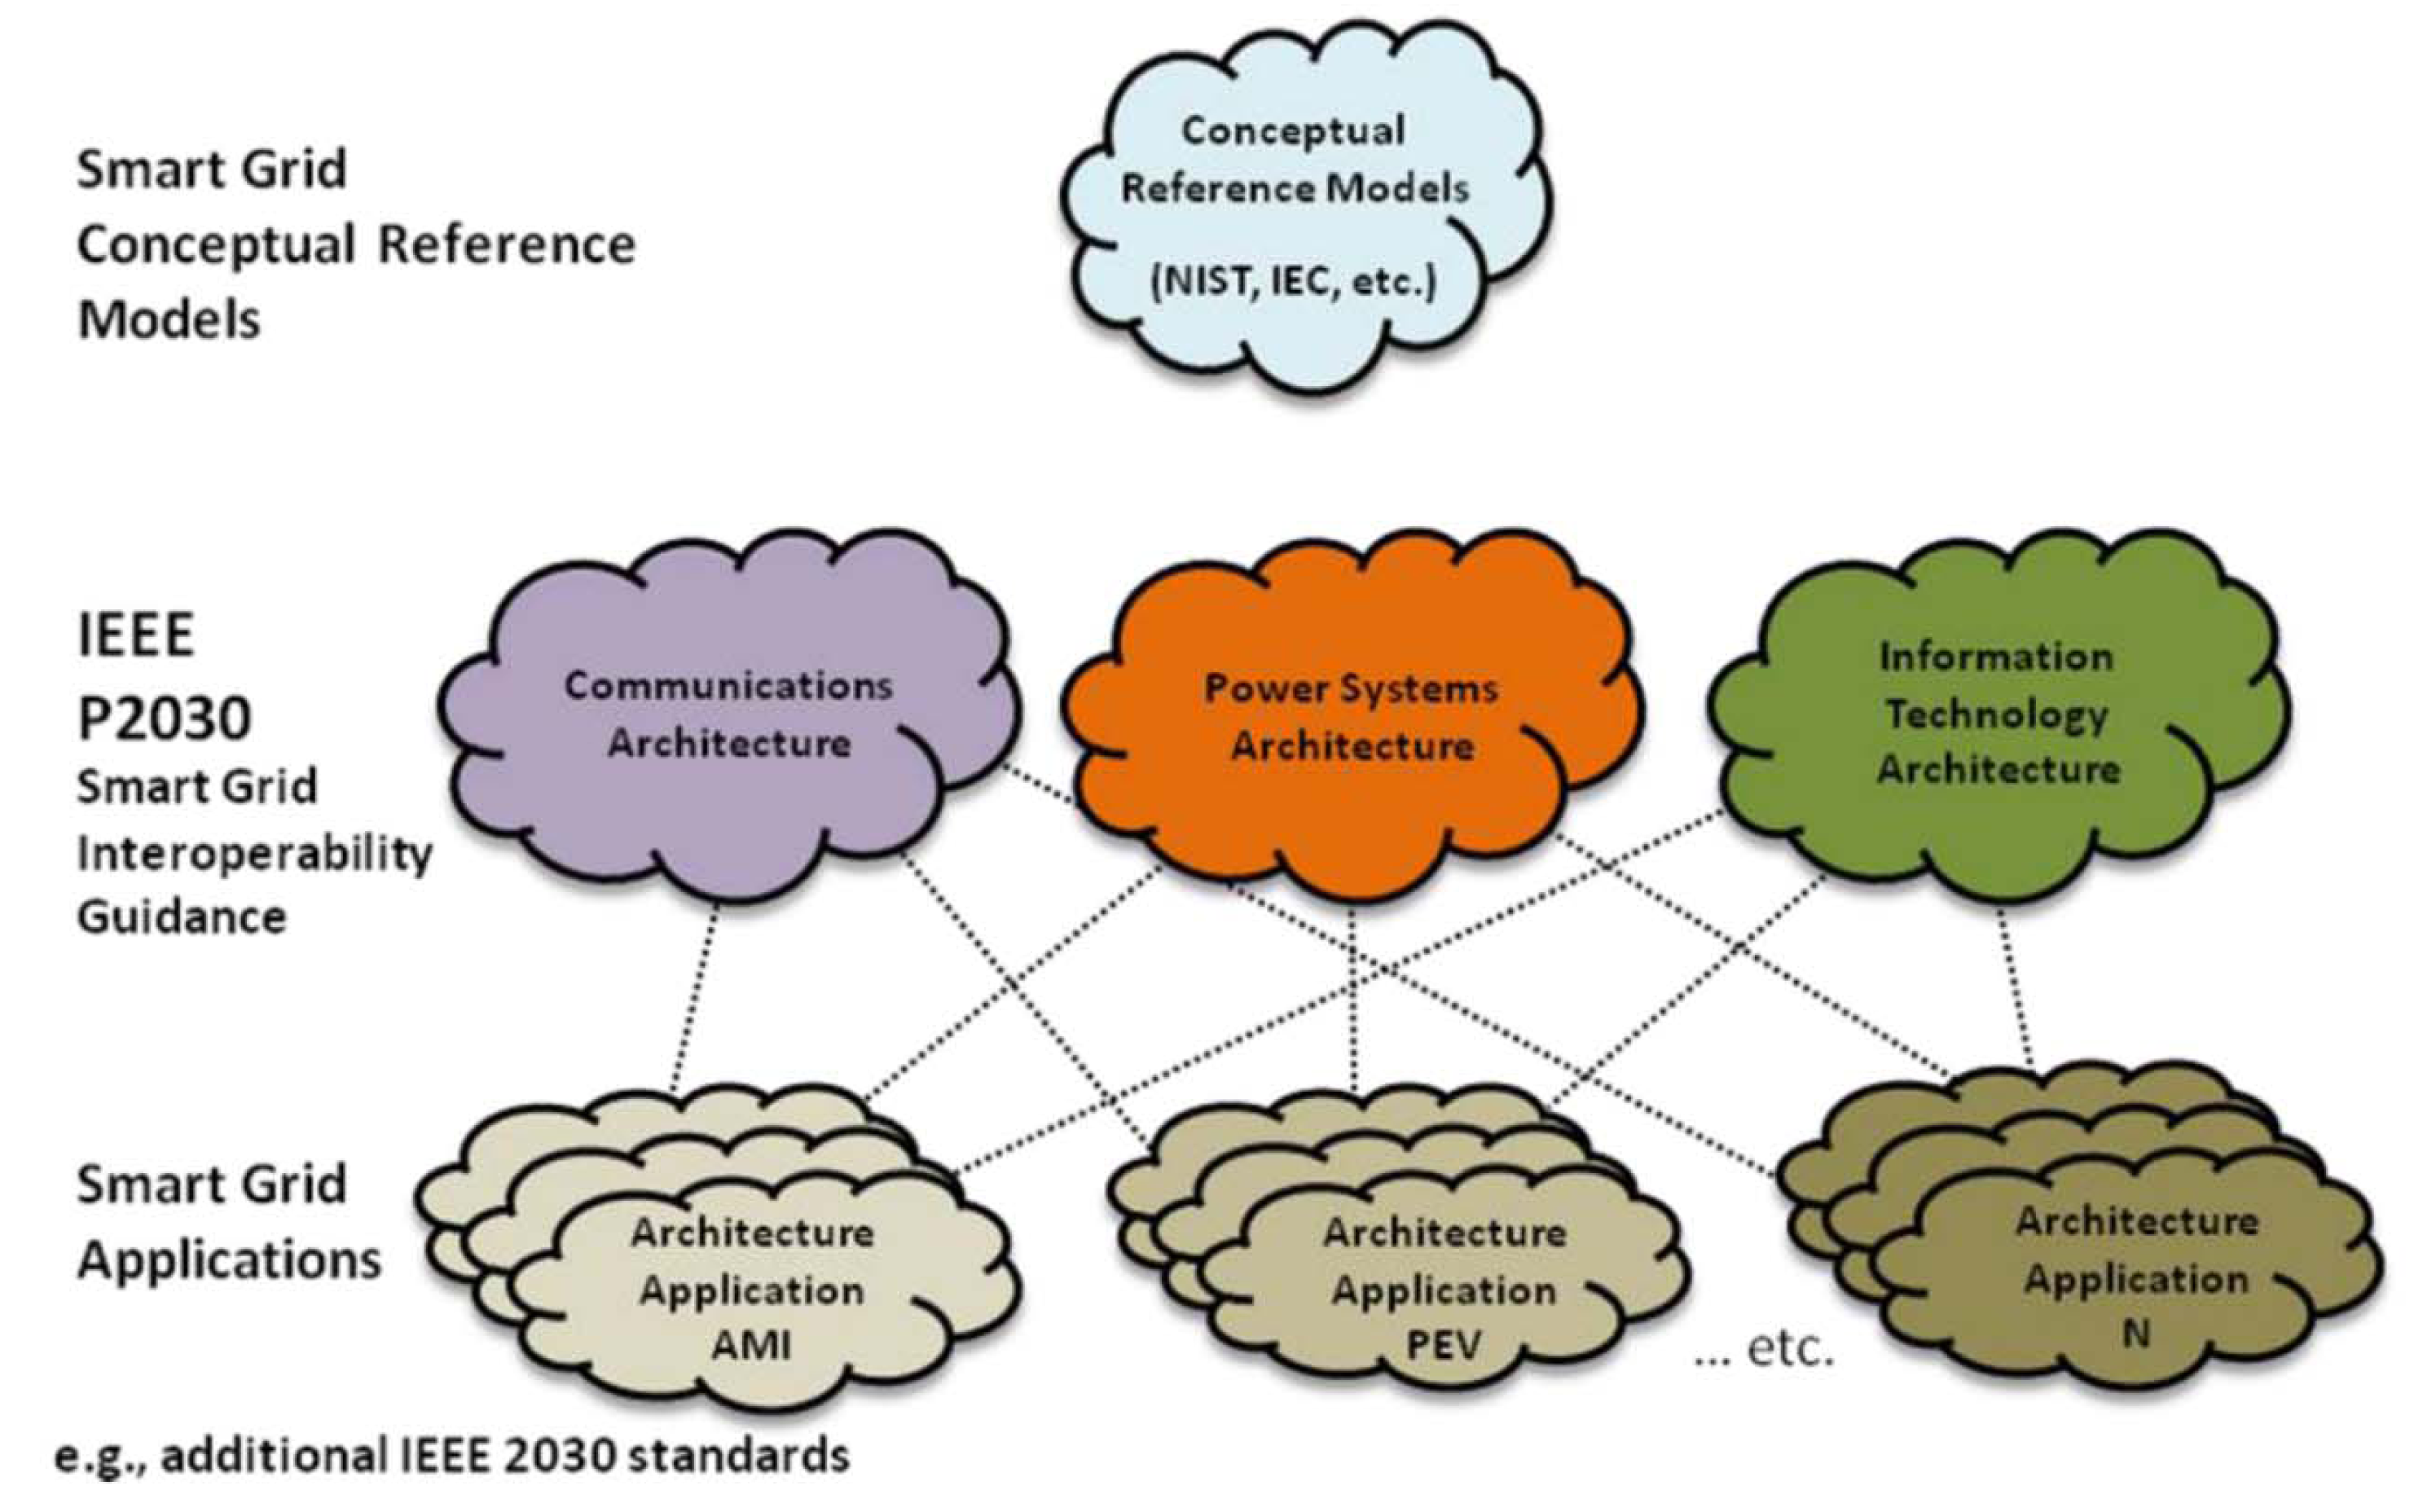
The IEEE project 2030 was a pioneer in developing such a reference architecture, leading to the so-called Smart Grid Interoperability Reference Model (SGIRM). The SGIRM extends the NIST Smart Grid conceptual model and defines three Interoperability Architectural Perspectives (IAPs), which represent the main areas of expertise involved in the Smart Grid, namely Power Systems (PS-IAP), Information Technology (IT-IAP), and Communications Technologies (CT-IAP) [14].
Each IAP defines the main functional blocks required in each domain of the NIST Smart Grid conceptual model from the appropriate perspective, as well as the interfaces between functional blocks (intra-domain interfaces), and the interfaces between domains (inter-domain interfaces). The defined IAPs are further particularized for the most important applications in the Smart Grid area, such as Advanced Metering Infrastructures (AMIs) or Plug-in Electric Vehicles (PEVs). Figure 2 illustrates the IEEE 2030 standardization process and overall reference architecture.
The most relevant IAP to this paper is the CT-IAP. The CT-IAP defines–among other issues-the communications networks that may be used in every domain. Among all the communications segments defined in the CT-IAP [14], Table 2 describes briefly the communications networks defined within distribution and customer domains which are of special interest to this paper.
Based on this reference architecture, the IEEE has sorted their own catalogue of standards and has identified the functional blocks and interfaces where they can be applied, as well as the standardization gaps where new standards are required [15].
2.3. European Standardization Organizations
The three main European Standardization Organizations (ESOs)—namely European Committee for Standardization (CEN), European Committee for Electrotechnical Standardization (CENELEC), and European Telecommunications Standards Institute (ETSI)—are working together on the Smart Grid standardization process. This collaborative work is being driven by the following European Commission (EC) mandates:
Standardization mandate M/441 to develop an open architecture for utility meters involving communications protocols enabling interoperability (March 2009) [16].
Standardization mandate M/468 concerning the charging of EVs (June 2010) [17].
Standardization mandate M/490 to support European Smart Grid deployment (March 2011) [18].
In response to such mandates, three working groups, involving the participation of the three ESOs, have been created:
Smart Metering-Coordination Group (SM-CG) in response to M/441.
Focus Group on European Electro-Mobility in response to M/468.
Smart Grid–Coordination Group (SG-CG) in response to M/490.
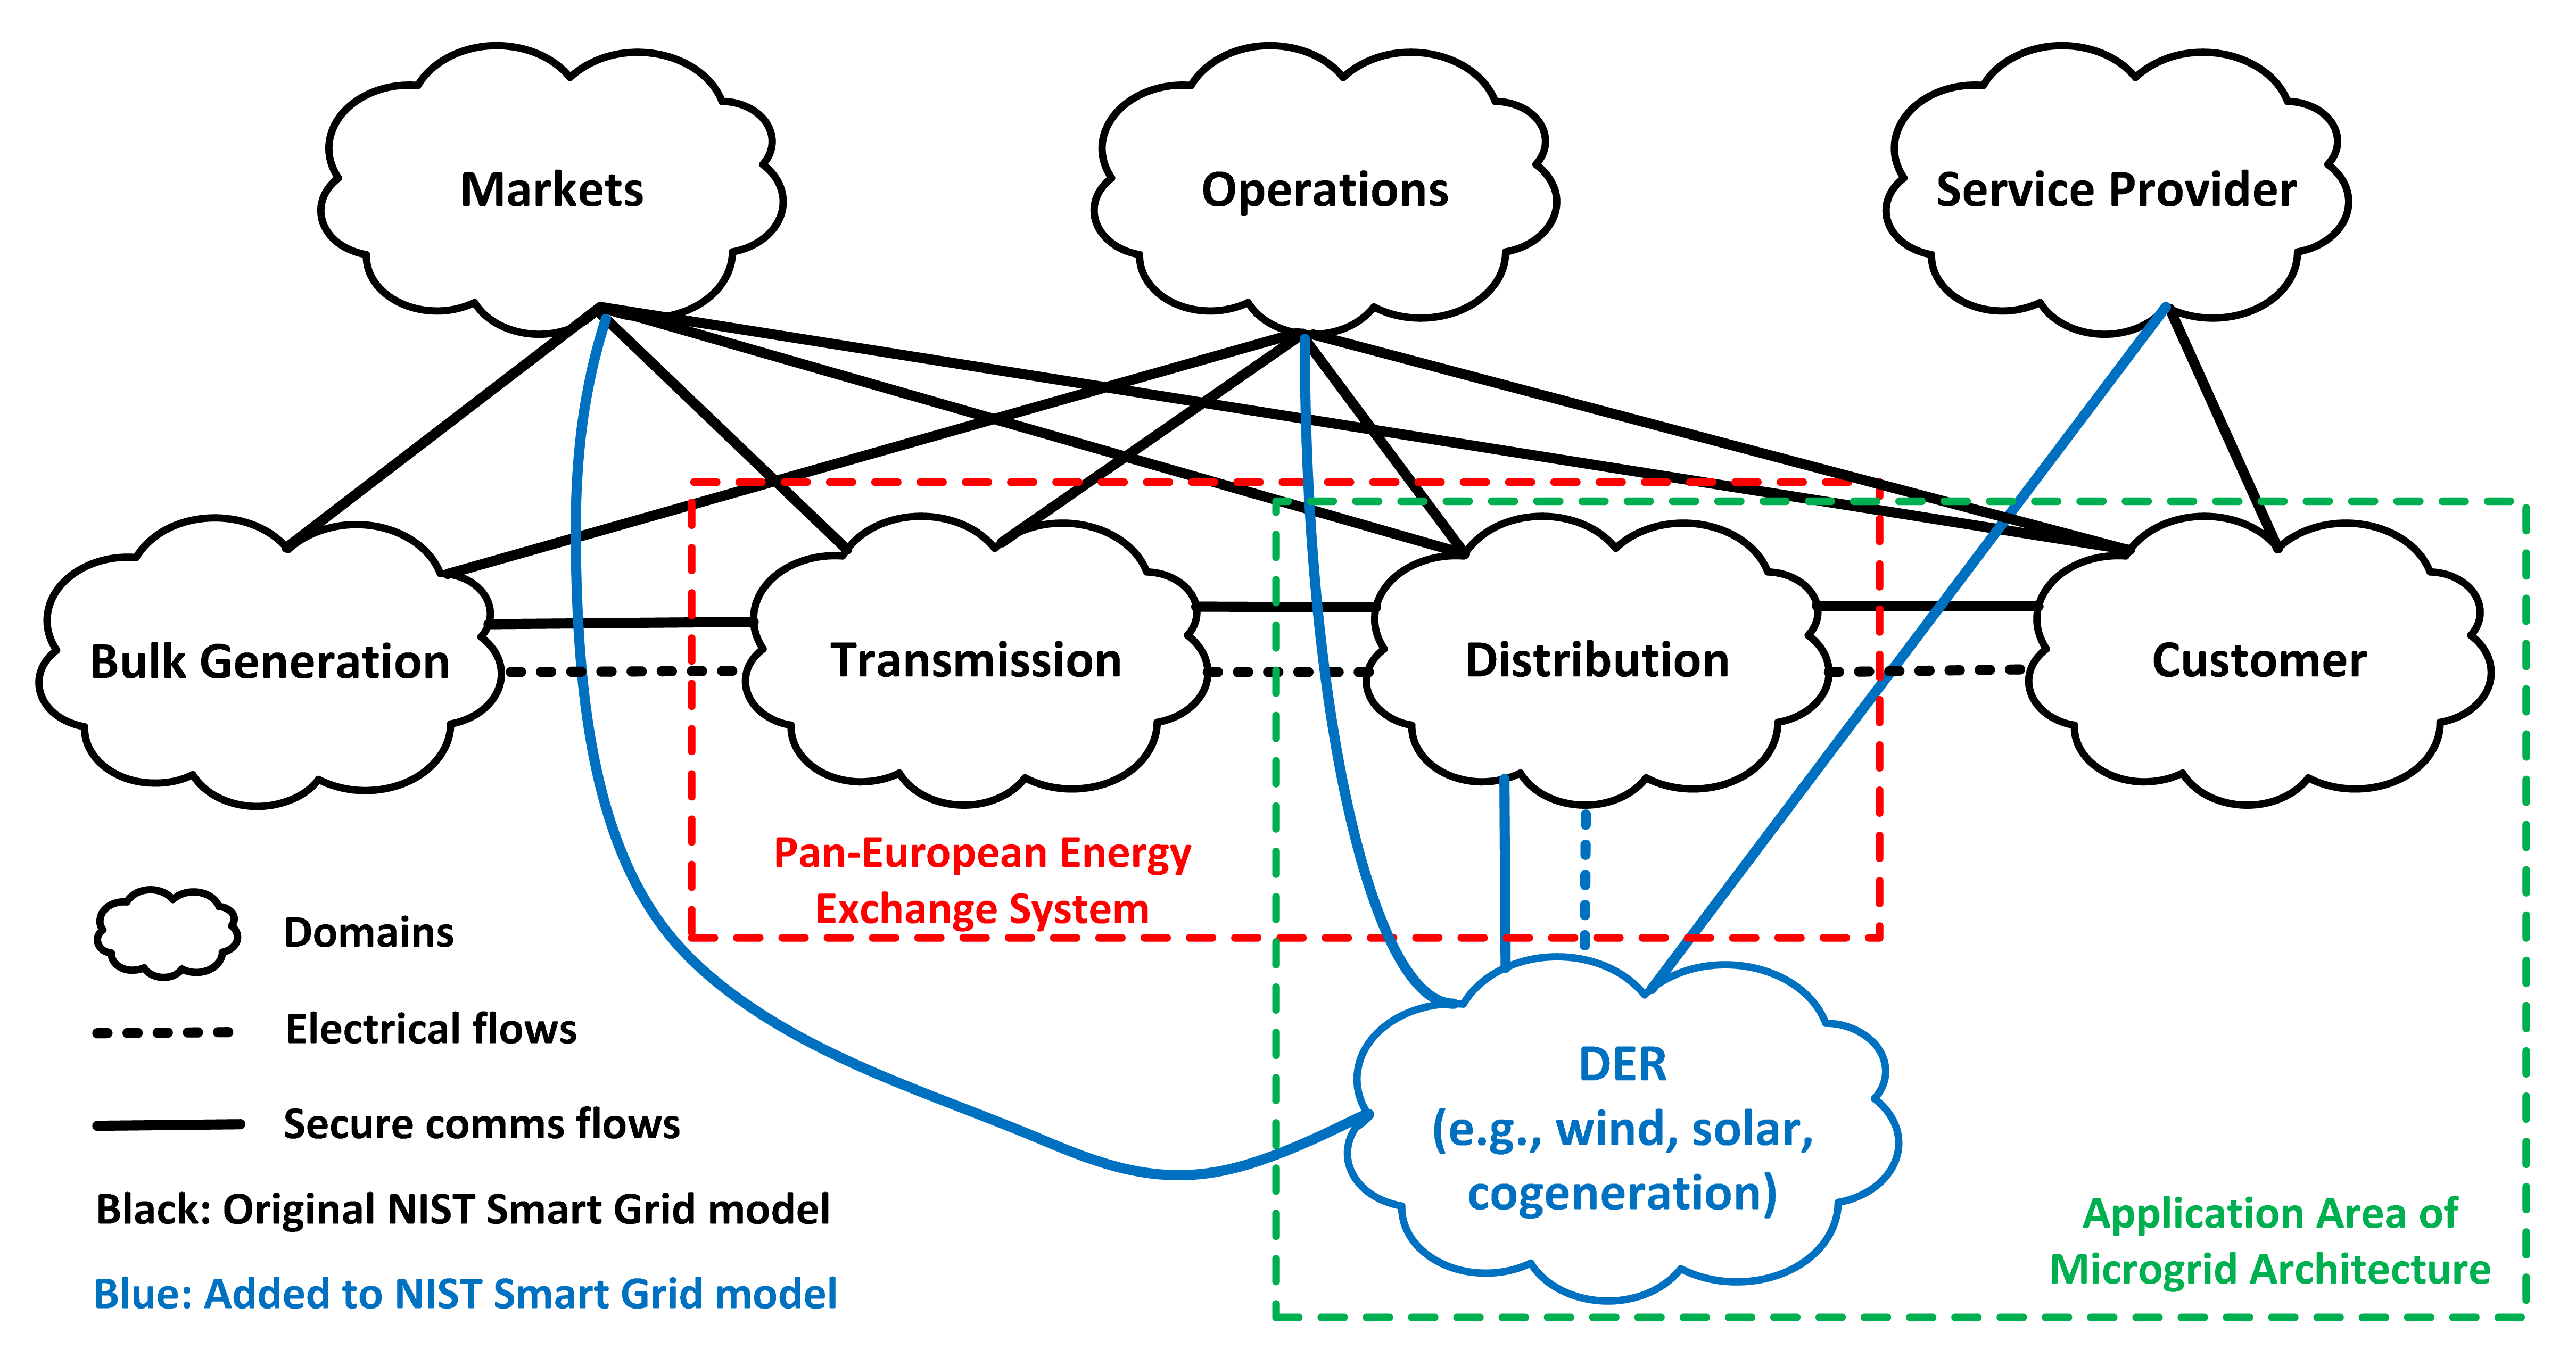
Through the EC standardization mandate M/490 and the corresponding SG-CG, the CEN/ CENELEC/ETSI strategic partnership has further developed the NIST Smart Grid conceptual model, adapting it to the specific requirements of the European electricity grid. As a result, a new domain related to Distributed Energy Resources (DERs) has been added, reflecting the importance and high penetration of renewables generation in European power distribution grids [19]. As Figure 3 shows, the CEN/CENELEC/ETSI Smart Grid conceptual model considers that DERs are electrically connected to the power distribution network and communicate with it, as well as with the Markets, Operations and Service Provider domains. Nevertheless, it should be noted that the Customer domain encompasses both Distributed Generation (DG) and small scale energy storage.
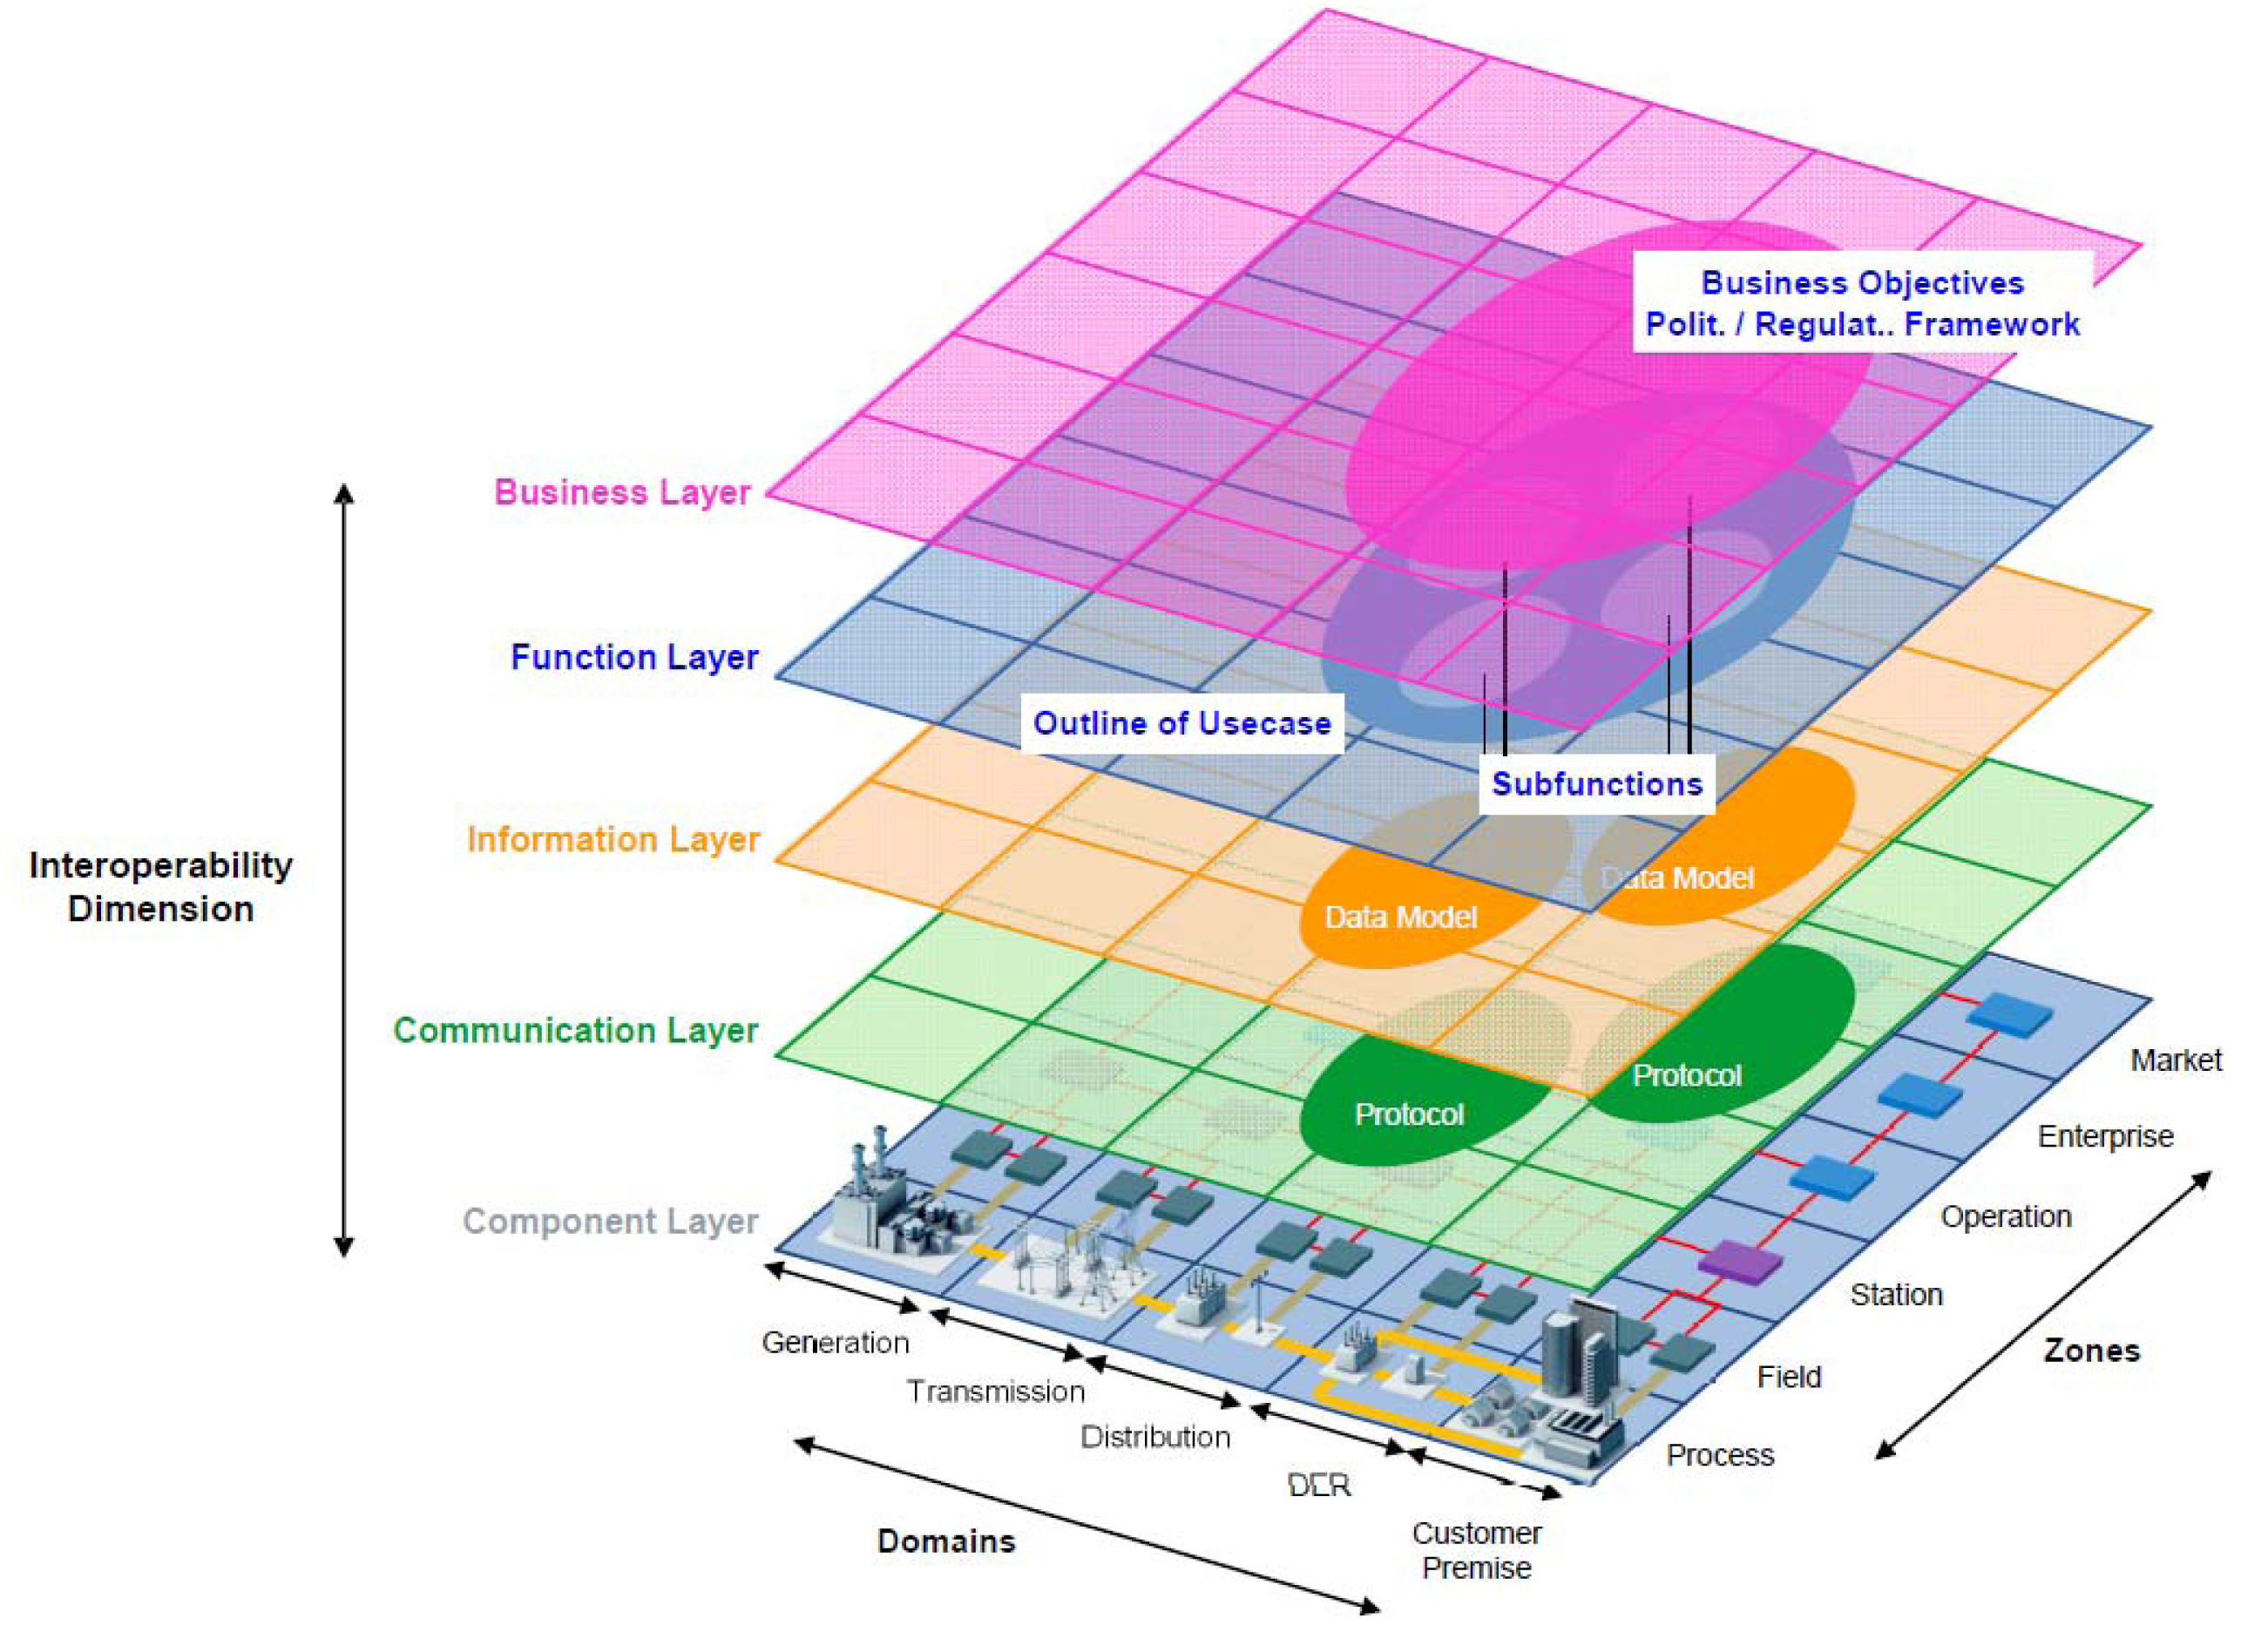
The SG-CG has also developed the so-called Smart Grid Architecture Model (SGAM) tailored to the requirements of the European electricity grid. As a result, the three-dimensional architectural model comprising the domains, zones, and layers shown in Figure 4, has been defined [19]. The SGAM allows a technologically neutral representation of all the interoperability cases of the Smart Grid. The five defined layers represent–top to bottom-the business objectives and processes, the functions, information exchange and data models, communications technologies and protocols, and the physical and logical components. As a token of the volume and importance of the Communication Layer, it is developed in a separate document [20], which defines the communications networks and their deployment at the Component Layer and maps the identified communications technologies and protocols onto the defined communications networks. This paper addresses such a Communications Layer.
In addition, another outstanding outcome of the work developed by the SG-CG is the elaboration and classification of a first set of standards for the Smart Grid and the identification of standardization gaps where standards are required [21].
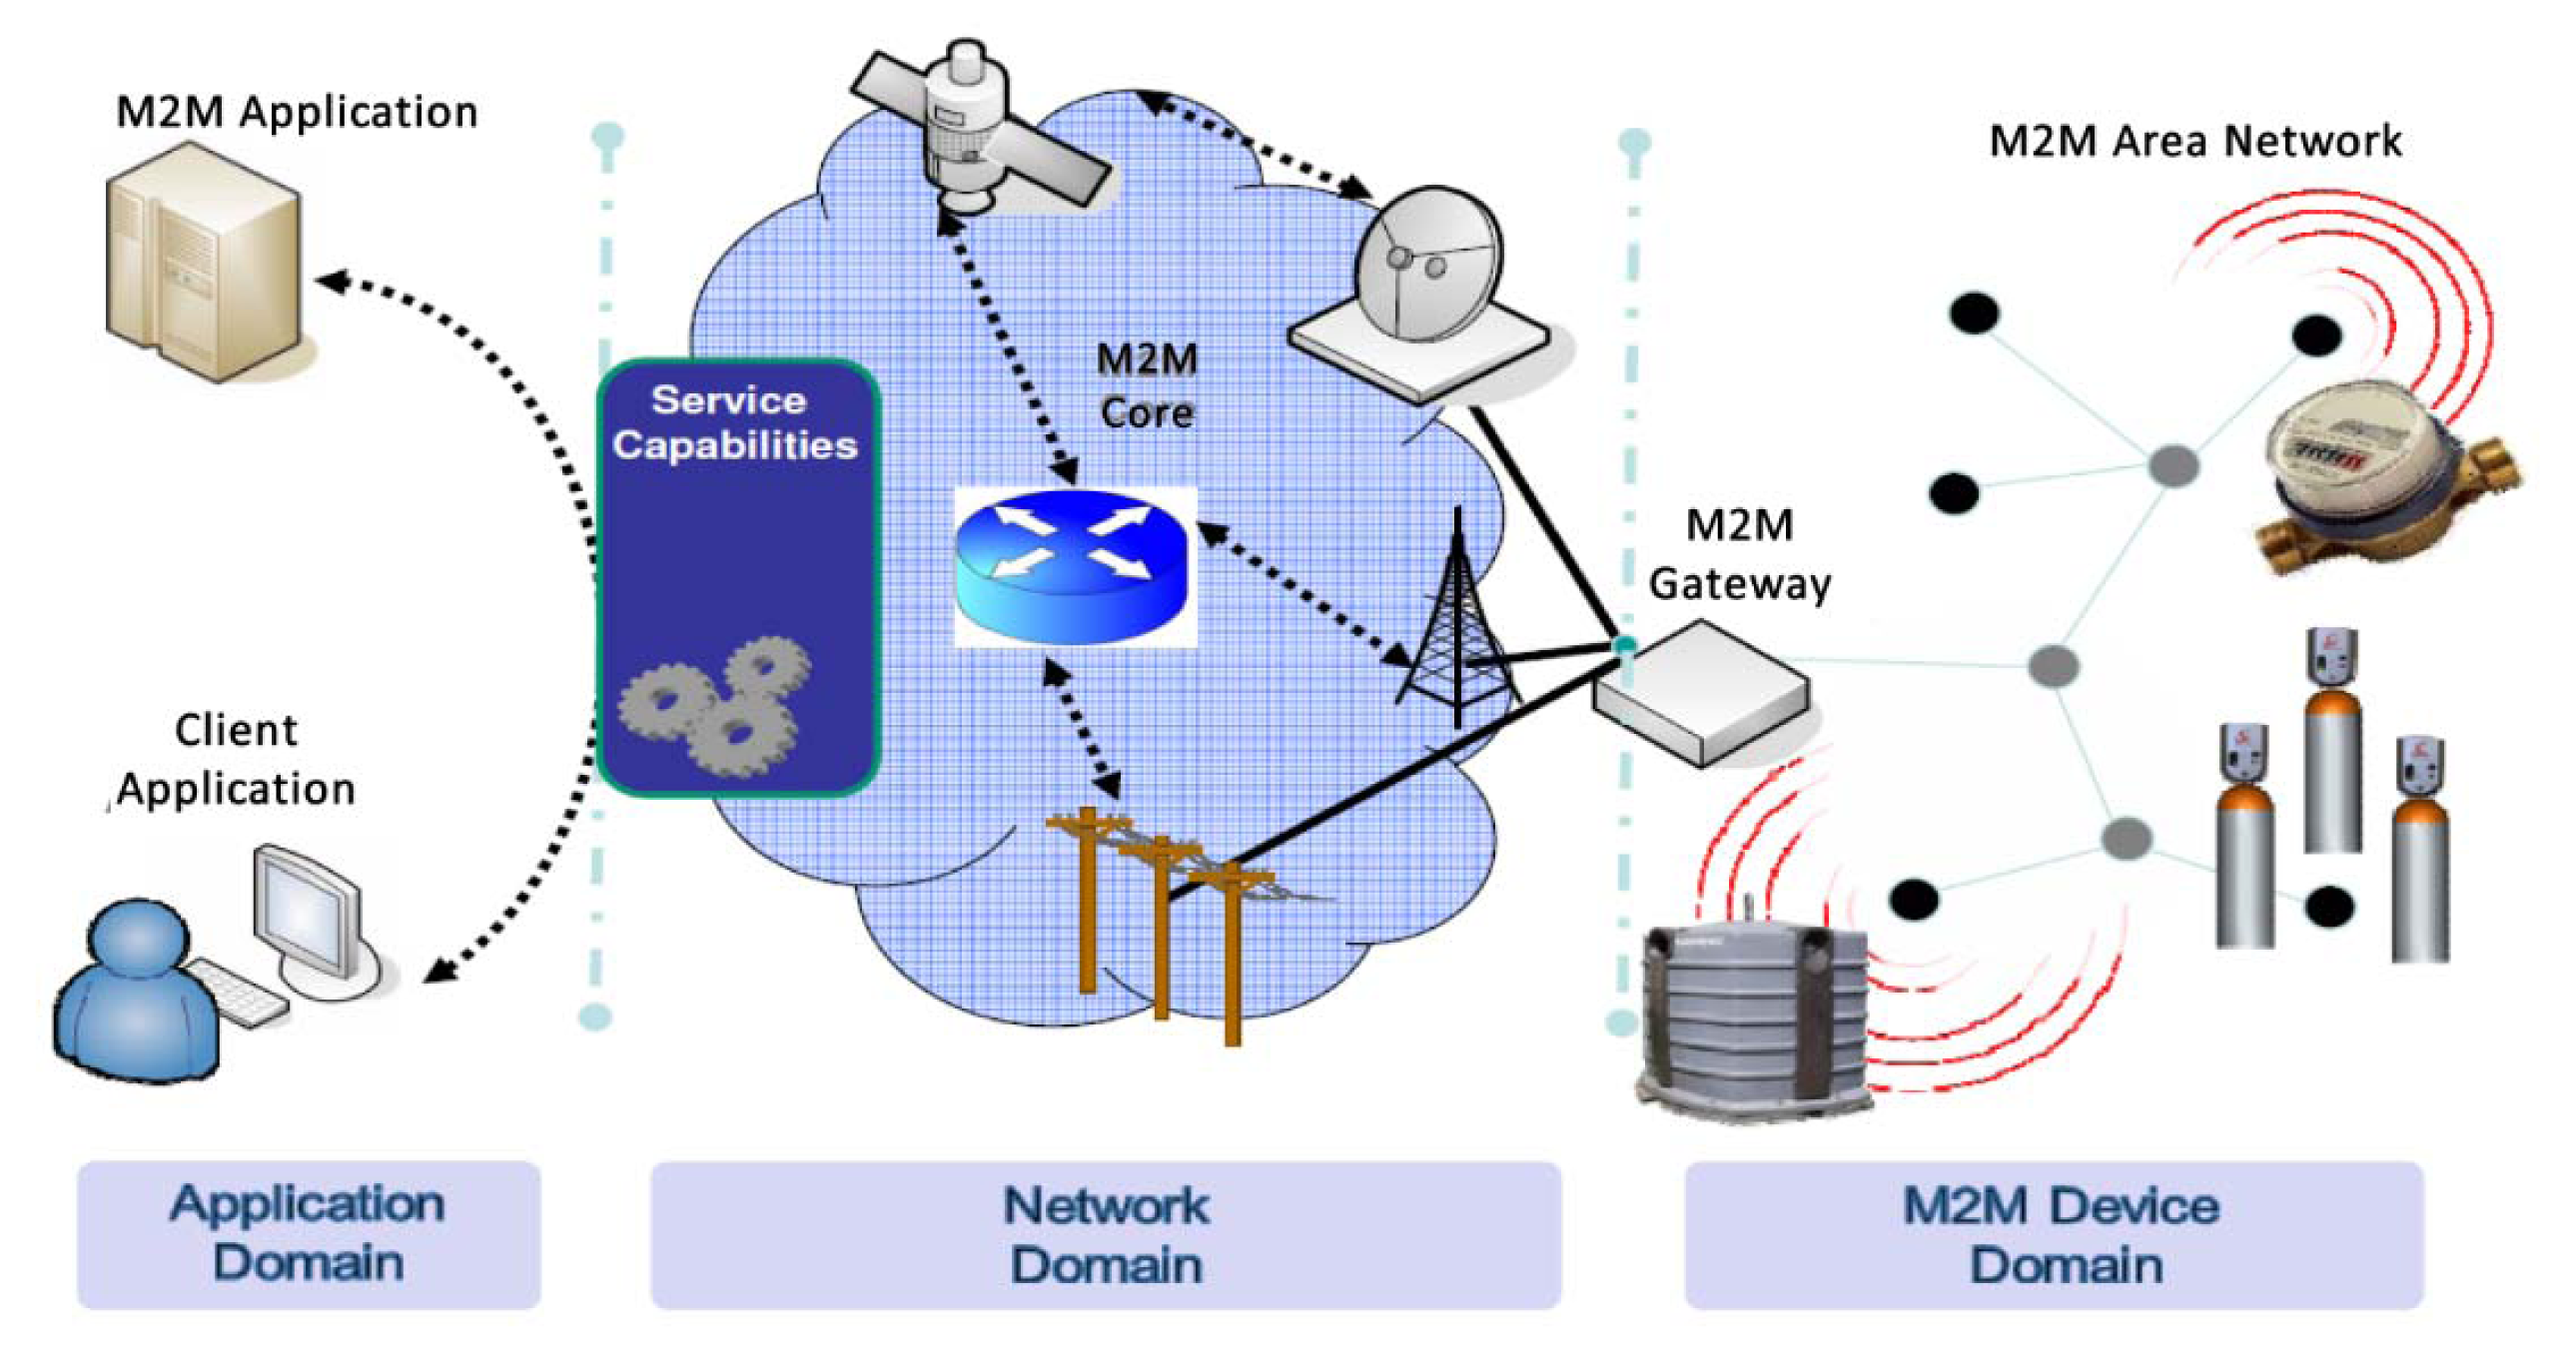
It is also worthwhile to remark upon the work developed by ETSI on the standardization of M2M communications, which has been recently transferred to the partnership project OneM2M [22]. As a result of this work, a complete reference architecture has been defined, including functional blocks and interfaces. Figure 5 shows the main domains of the ETSI M2M reference architecture. The M2M Device Domain encompasses the so-called capillary networks (in ETSI terminology), i.e., the Sensor and Actuator Networks (SANs). The Network Domain represents the core of the M2M infrastructure and provides bidirectional bulk data exchange over long distances. Finally, the Application Domain encompasses the services which are delivered on top of the M2M infrastructure.
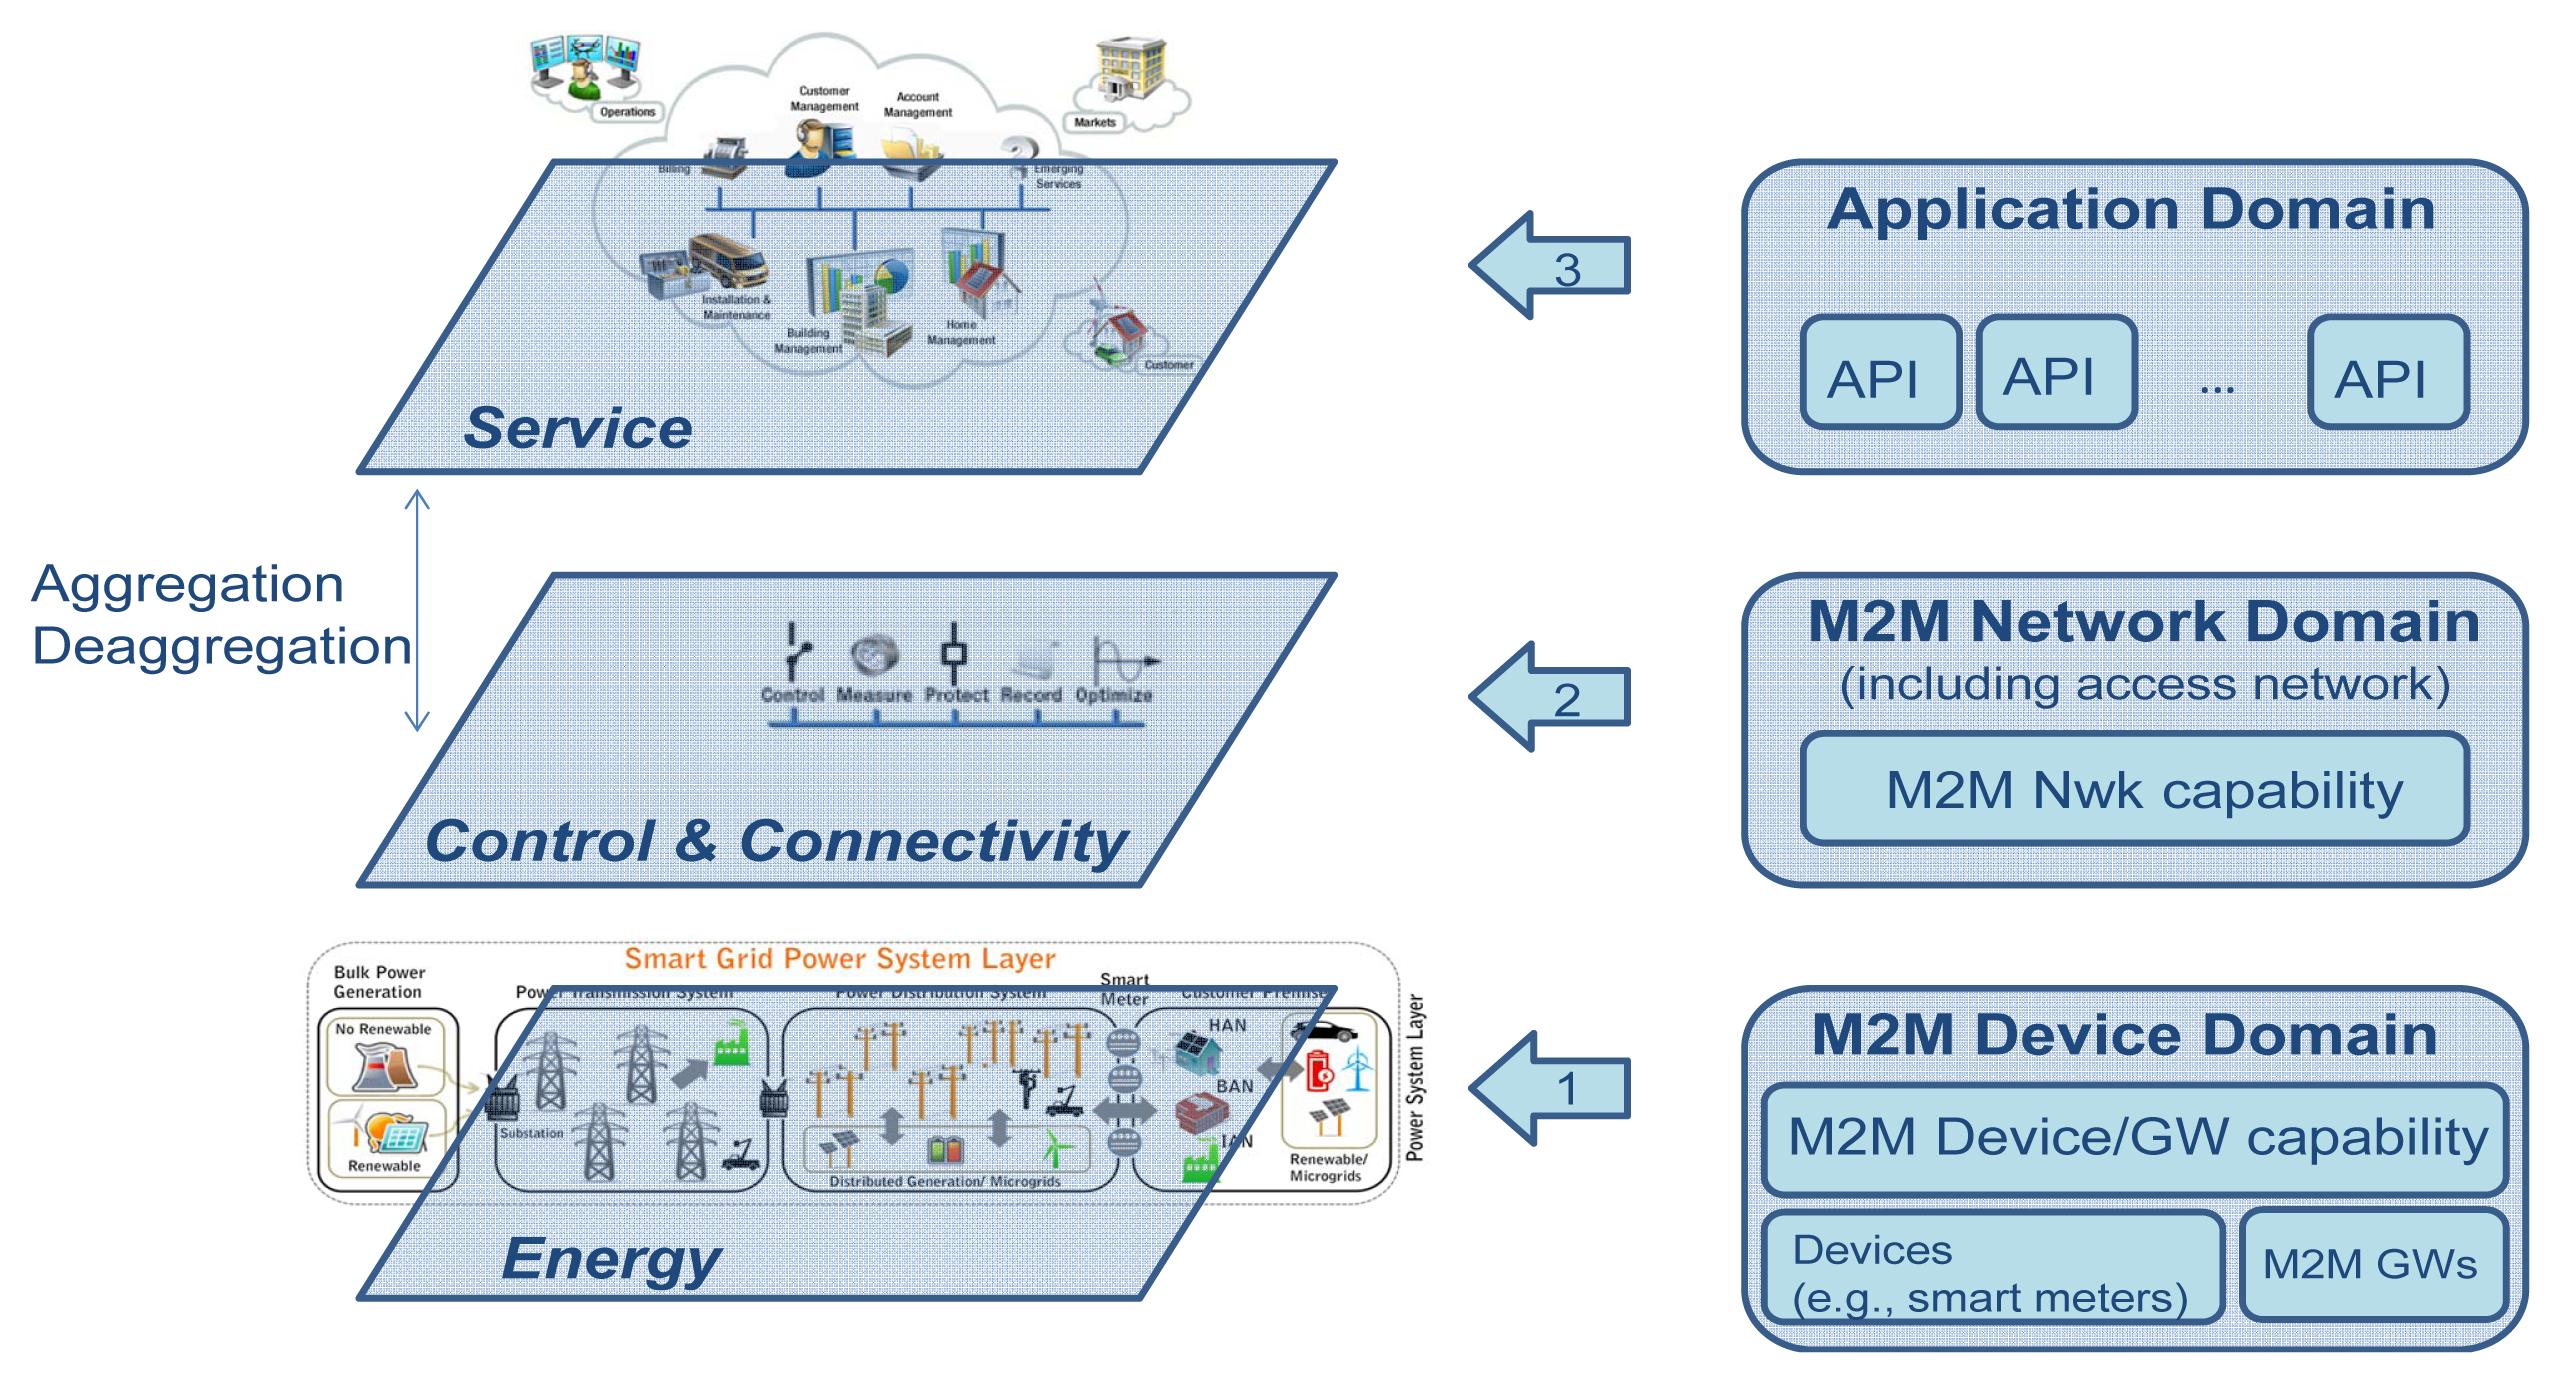
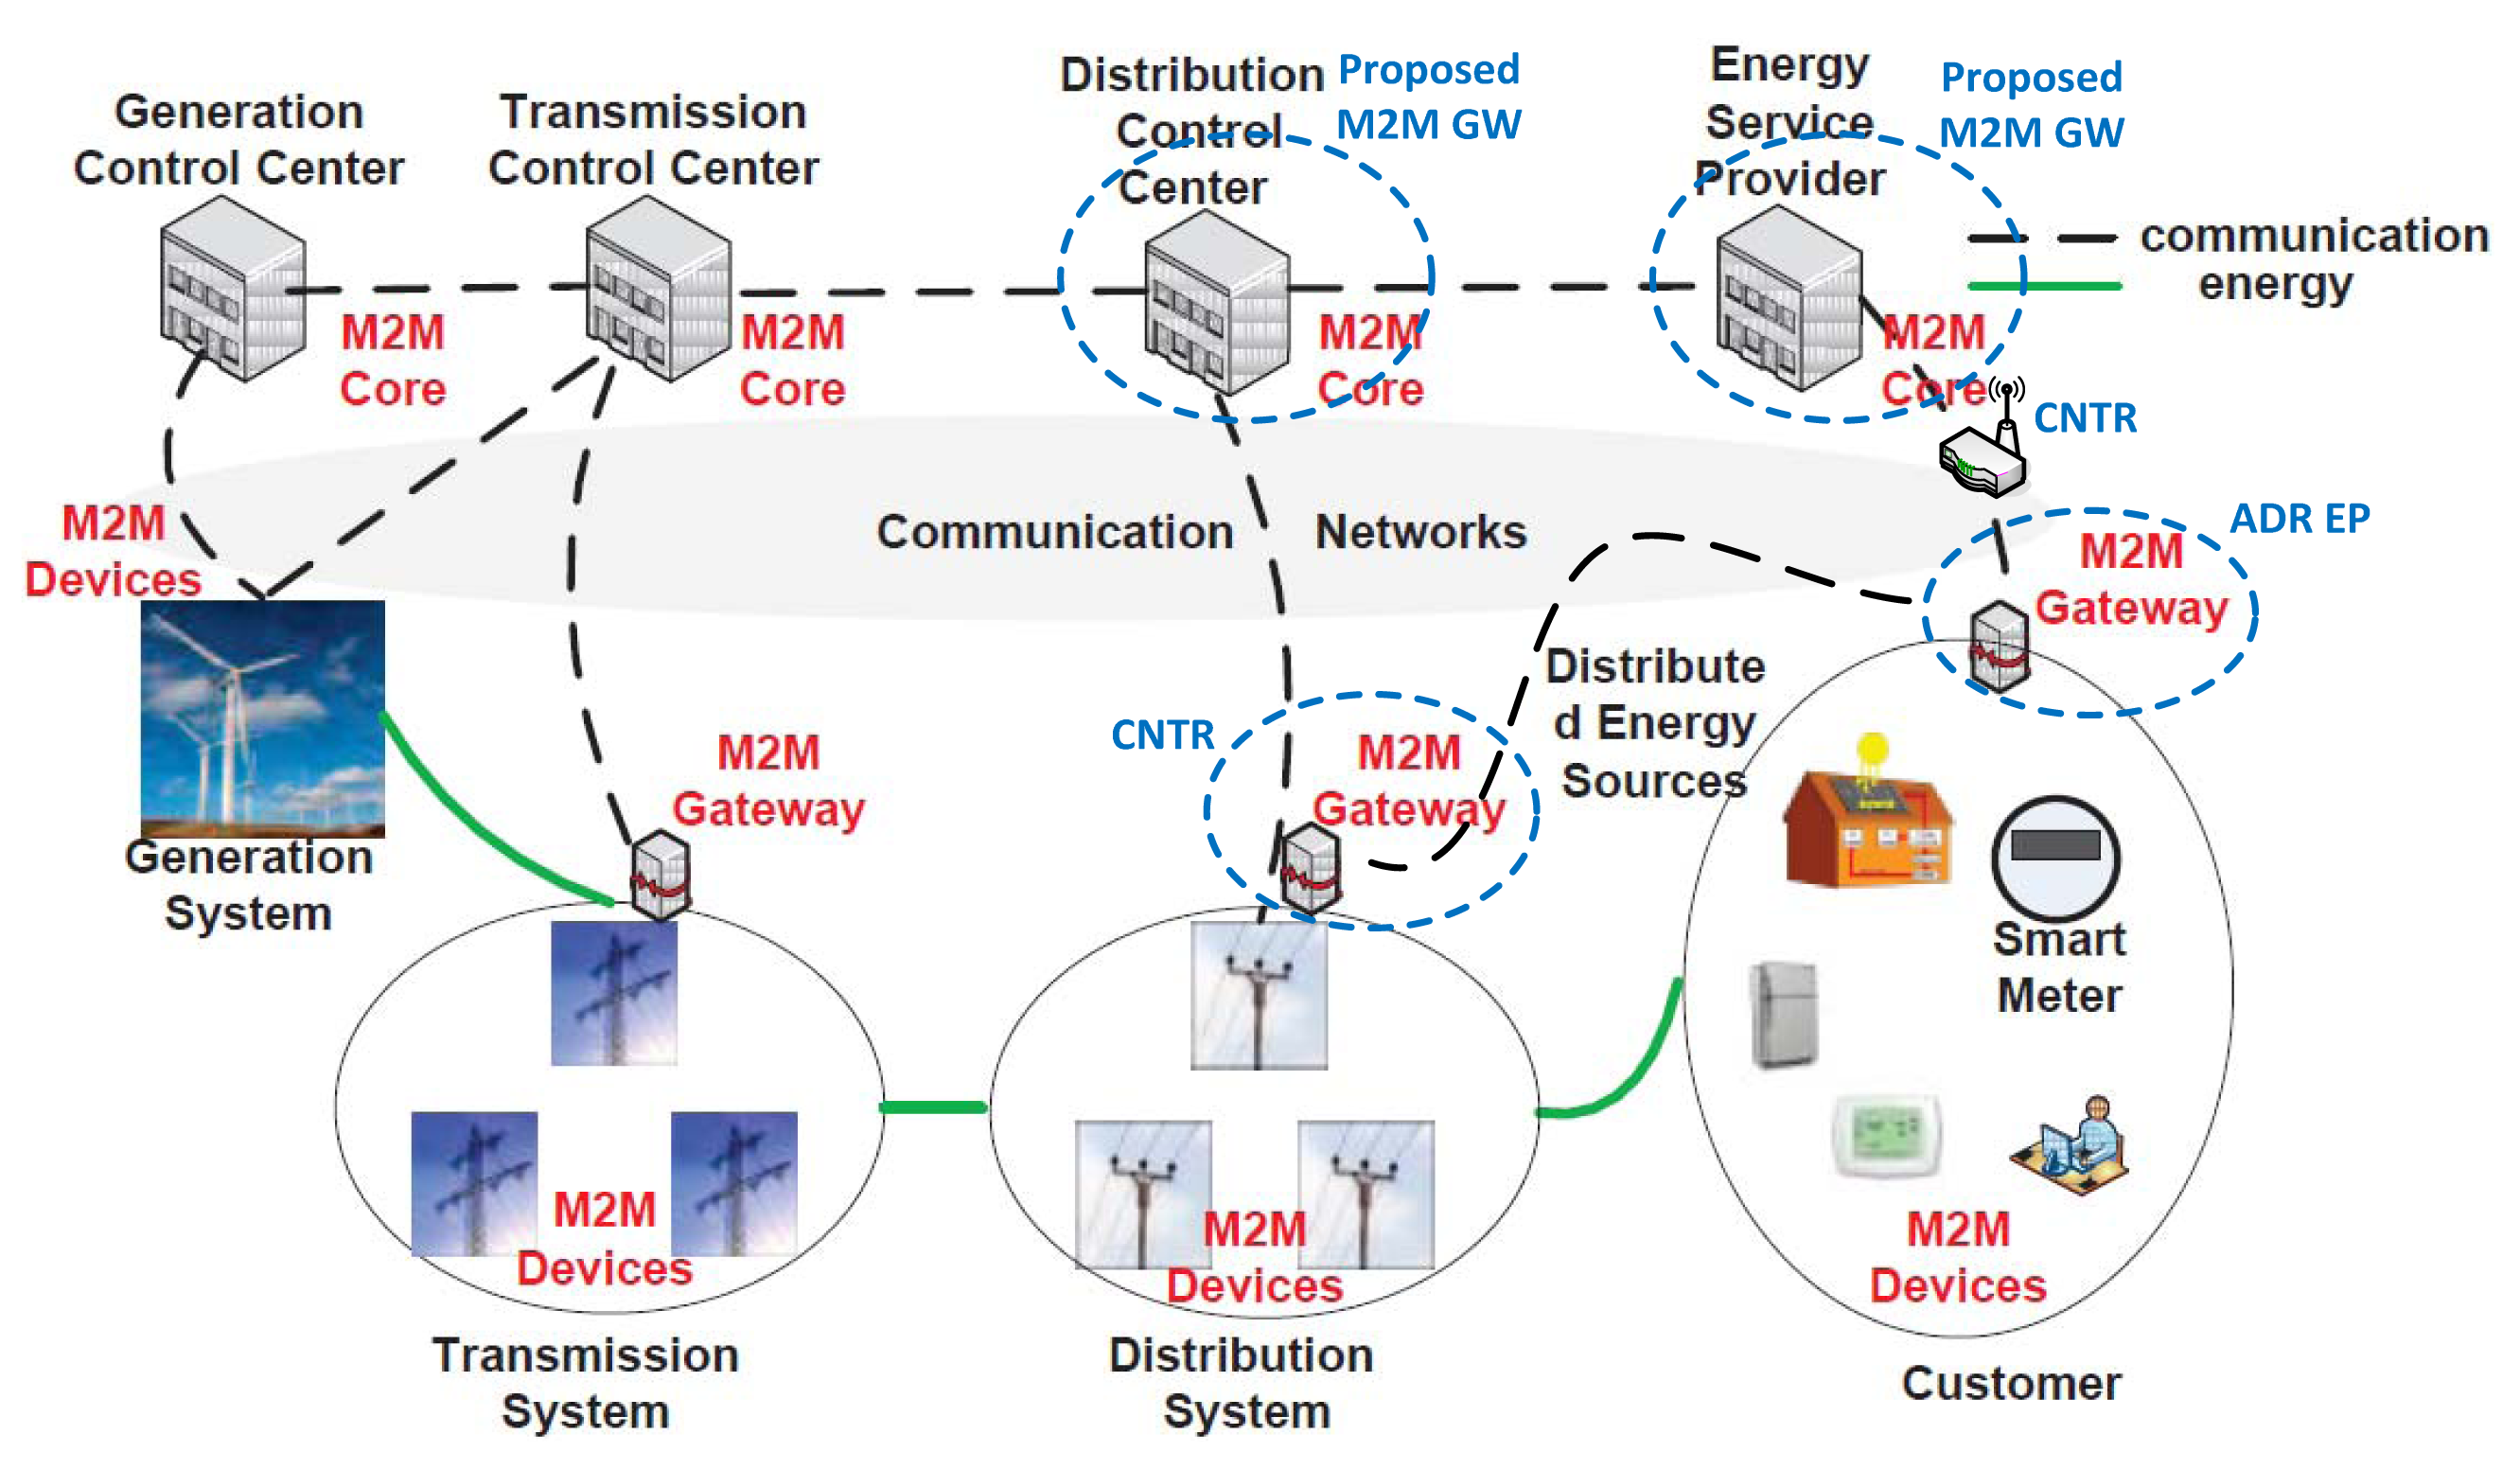
Figure 6 provides a graphical overview of how these three domains can be mapped onto the Smart Grid [24]. Reference [25] also elaborates on how the ETSI M2M communications architecture can be applied to Smart Grid scenarios.
3. Background
This section summarizes the already published research work which is taken as baseline in this paper, thus being essential to properly understand it.
3.1. Proposed M2M Communications Architecture
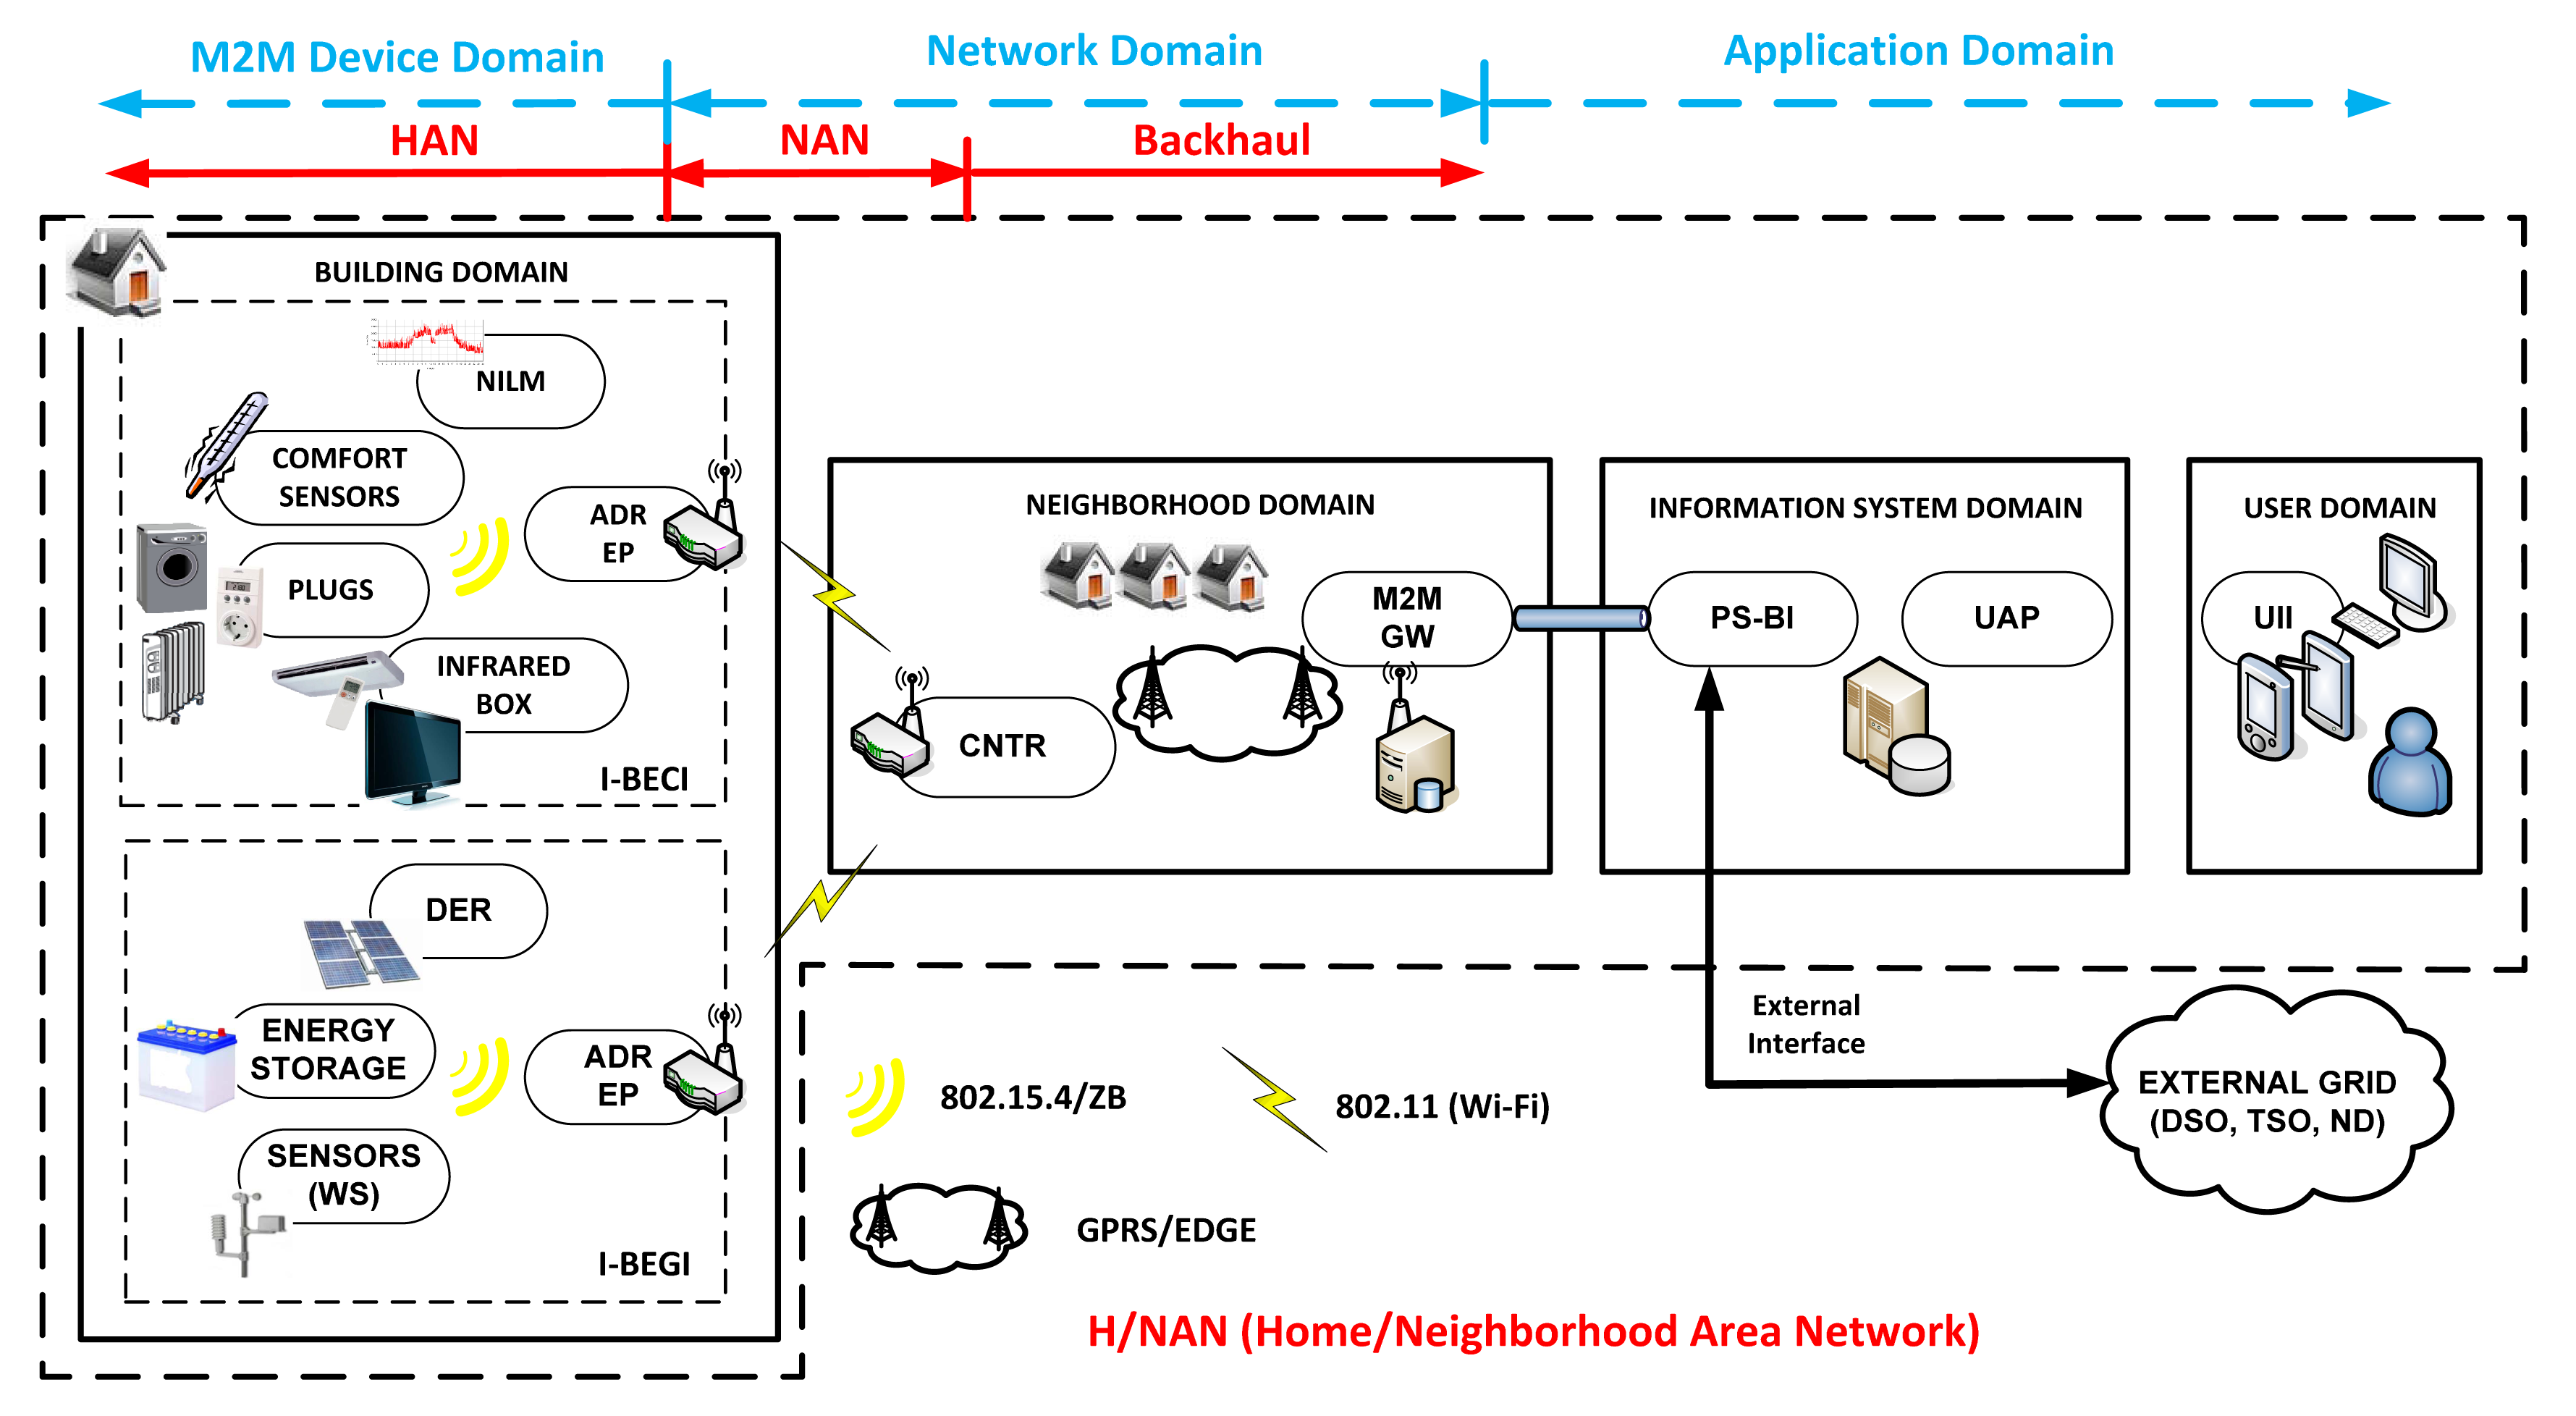
Figure 7 shows the overall system architecture of the Information and Communications Technologies (ICT) platform developed under the scope of the EU FP7 project ENERsip [26] to enable electricity consumption and energy costs savings and proper integration of DERs at neighborhood level.
It can be seen that the system is divided into four domains, which represents its main pillars from the ICT perspective. The Building Domain comprises the physical infrastructures owned by the customers of the power distribution grids, including consumption and generation equipment and the SANs to monitor and control them.
The User Domain encompasses the means through which the users and the system interact. It is worthwhile mentioning at this point that energy efficiency can be achieved both through automated actions (e.g., DR event) and by influencing users' behaviors. This is why is so important the way in which the information is presented to the user, so that it is easily understandable, as well as the tools that are provided to the users for them to make decisions, which should be as human-friendly as possible. The available applications may run in smartphones or tablets or even in Smart TVs, since this technology is gaining significance and represents a great mean to reach people massively. In addition, it is also important that such applications are somehow connected to social networks in order to encourage the users to follow the recommendations proposed by the system [27].
The Information System Domain represents the “brain” of the system from the energy perspective, comprising the logic that allows the optimal use of the available resources at neighborhood level at any time. Gathering the consumption and generation data of the same district at a given moment of time and processing them all together allows reaching global optimizations at neighborhood level, instead of just local optimizations at household level, as it is the case in state-of-the-art Home Energy Management Systems (HEMSs). Additionally, since the customers are still allowed to configure a set of parameters and thresholds and they are taken into account when running the optimization algorithms, local optimizations can be also reached, whereas this is impossible the other way around.
The Neighborhood domain represents the “workforce” of the system and encompasses the core communications infrastructure that carried data and command back and forward, allowing that everything work correctly.
Thus, the Information System Domain and the User Domain are related with IT (Information Technology); whereas the Building Domain and the Neighborhood Domain are tightly related with communications. As a matter of fact, the M2M communications architecture addressed in this paper is spread across the latter domains, as shown in Figure 7.
The consumption and generation infrastructures are named as In-Building Energy Consumption Infrastructures (I-BECIs) [28] and In-Building Energy Generation Infrastructures (I-BEGIs) [29], respectively. I-BECIs and I-BEGIs can be combined or not, giving rise to different profiles of customers:
Consumers: customers whose households or buildings are only composed of I-BECIs.
Producers: customers whose infrastructures comprise only I-BEGIs connected to the grid.
Prosumers: customers that own the so-called energy-positive households or buildings which integrate both I-BECIs and I-BEGIs.
Every I-BECI and I-BEGI is equipped with the so-called Automatic Demand Response End Point (ADR EP). The ADR EPs work as communications gateways, aggregating and sending consumption or generation data and routing commands to the appropriate device(s). The ADR EPs communicate directly with their associated Concentrator (CNTR). A given CNTR manages a group of ADR EPs, forwarding the data coming from them and routing commands to the appropriate ADR EP(s). Last, the M2M GW (Gateway) has the global picture of the M2M communications infrastructure and works as Operation Support System (OSS), performing tasks such as network inventory, network components configuration, fault management, or service provisioning, as well as communications gateway to the Information System [30].
As Figure 7 also illustrates, the communication within I-BECIs and I-BEGIs is based on IEEE 802.15.4/Zigbee; the communication between ADR EPs and CNTRs is based on User Datagram Protocol/Internet Protocol (UDP/IP) on top of IEEE 802.11; and the communication between the CNTRs and the M2M GW is based on Transmission Control Protocol (TCP/IP) on top of GPRS. Reference [30] explains why these communications technologies are chosen.
Taking into account the main goals and functionalities of the system explained throughout this section and the summary of the domains defined in the NIST Smart Grid conceptual model shown in Table 1, the scope of the proposed system is bounded to the Customer, Distribution, Service Provider, and Operations domains.
The proposed M2M communications architecture can be mapped onto the CT-IAP of the overall IEEE 2030 SGIRM as shown in Figure 7 in a continuous red line. The I-BECIs and the I-BEGIs represent the HANs, the ADR EP providing the functionality of ESI; the communications segment comprising the ADR EPs and the CNTRs represents the NAN; and the communications segment composed by the CNTRs and the M2M GW represents the Backhaul. This terminology will be used in the remainder of the paper.
Regarding the standardization work carried out by the ESOs, the comparison is focused on the work developed by ETSI on M2M, since the conceptual model and the SGAM defined by the SG-CG take into account and present many similarities to the NIST and IEEE work. Figure 7 also shows in a dashed blue line the relationship between the M2M domains defined by ETSI and the domains presented in this section. The proposed M2M communications architecture can be also mapped onto the ETSI M2M architecture applied to the Smart Grid presented in [25] as follows. The SANs within the I-BECI and I-BEGI can be seen as capillary networks at the Customer Domain. Regarding the remainder of the M2M communications architecture, there are two possible options, as shown in blue in Figure 8:
If the proposed platform were run by a third party that does not own the power distribution infrastructure (e.g., an aggregator), an additional M2M GW would be missing in the ETSI M2M architecture proposed in [25] to represent the CNTR.
However, if the proposed platform were run by a DSO, the Customer Domain would be embedded into the Distribution Domain, following the hierarchy of the electricity infrastructure itself. Thus, the ADR EPs and CNTRs could be considered as ETSI M2M GWs at Customer and Distribution Domains respectively, and our M2M GW could be seen as the ETSI M2M Core of the Distribution Domain. This option will be assumed in the remainder of the paper.
3.2. Application Requirements and Traffic Characterization
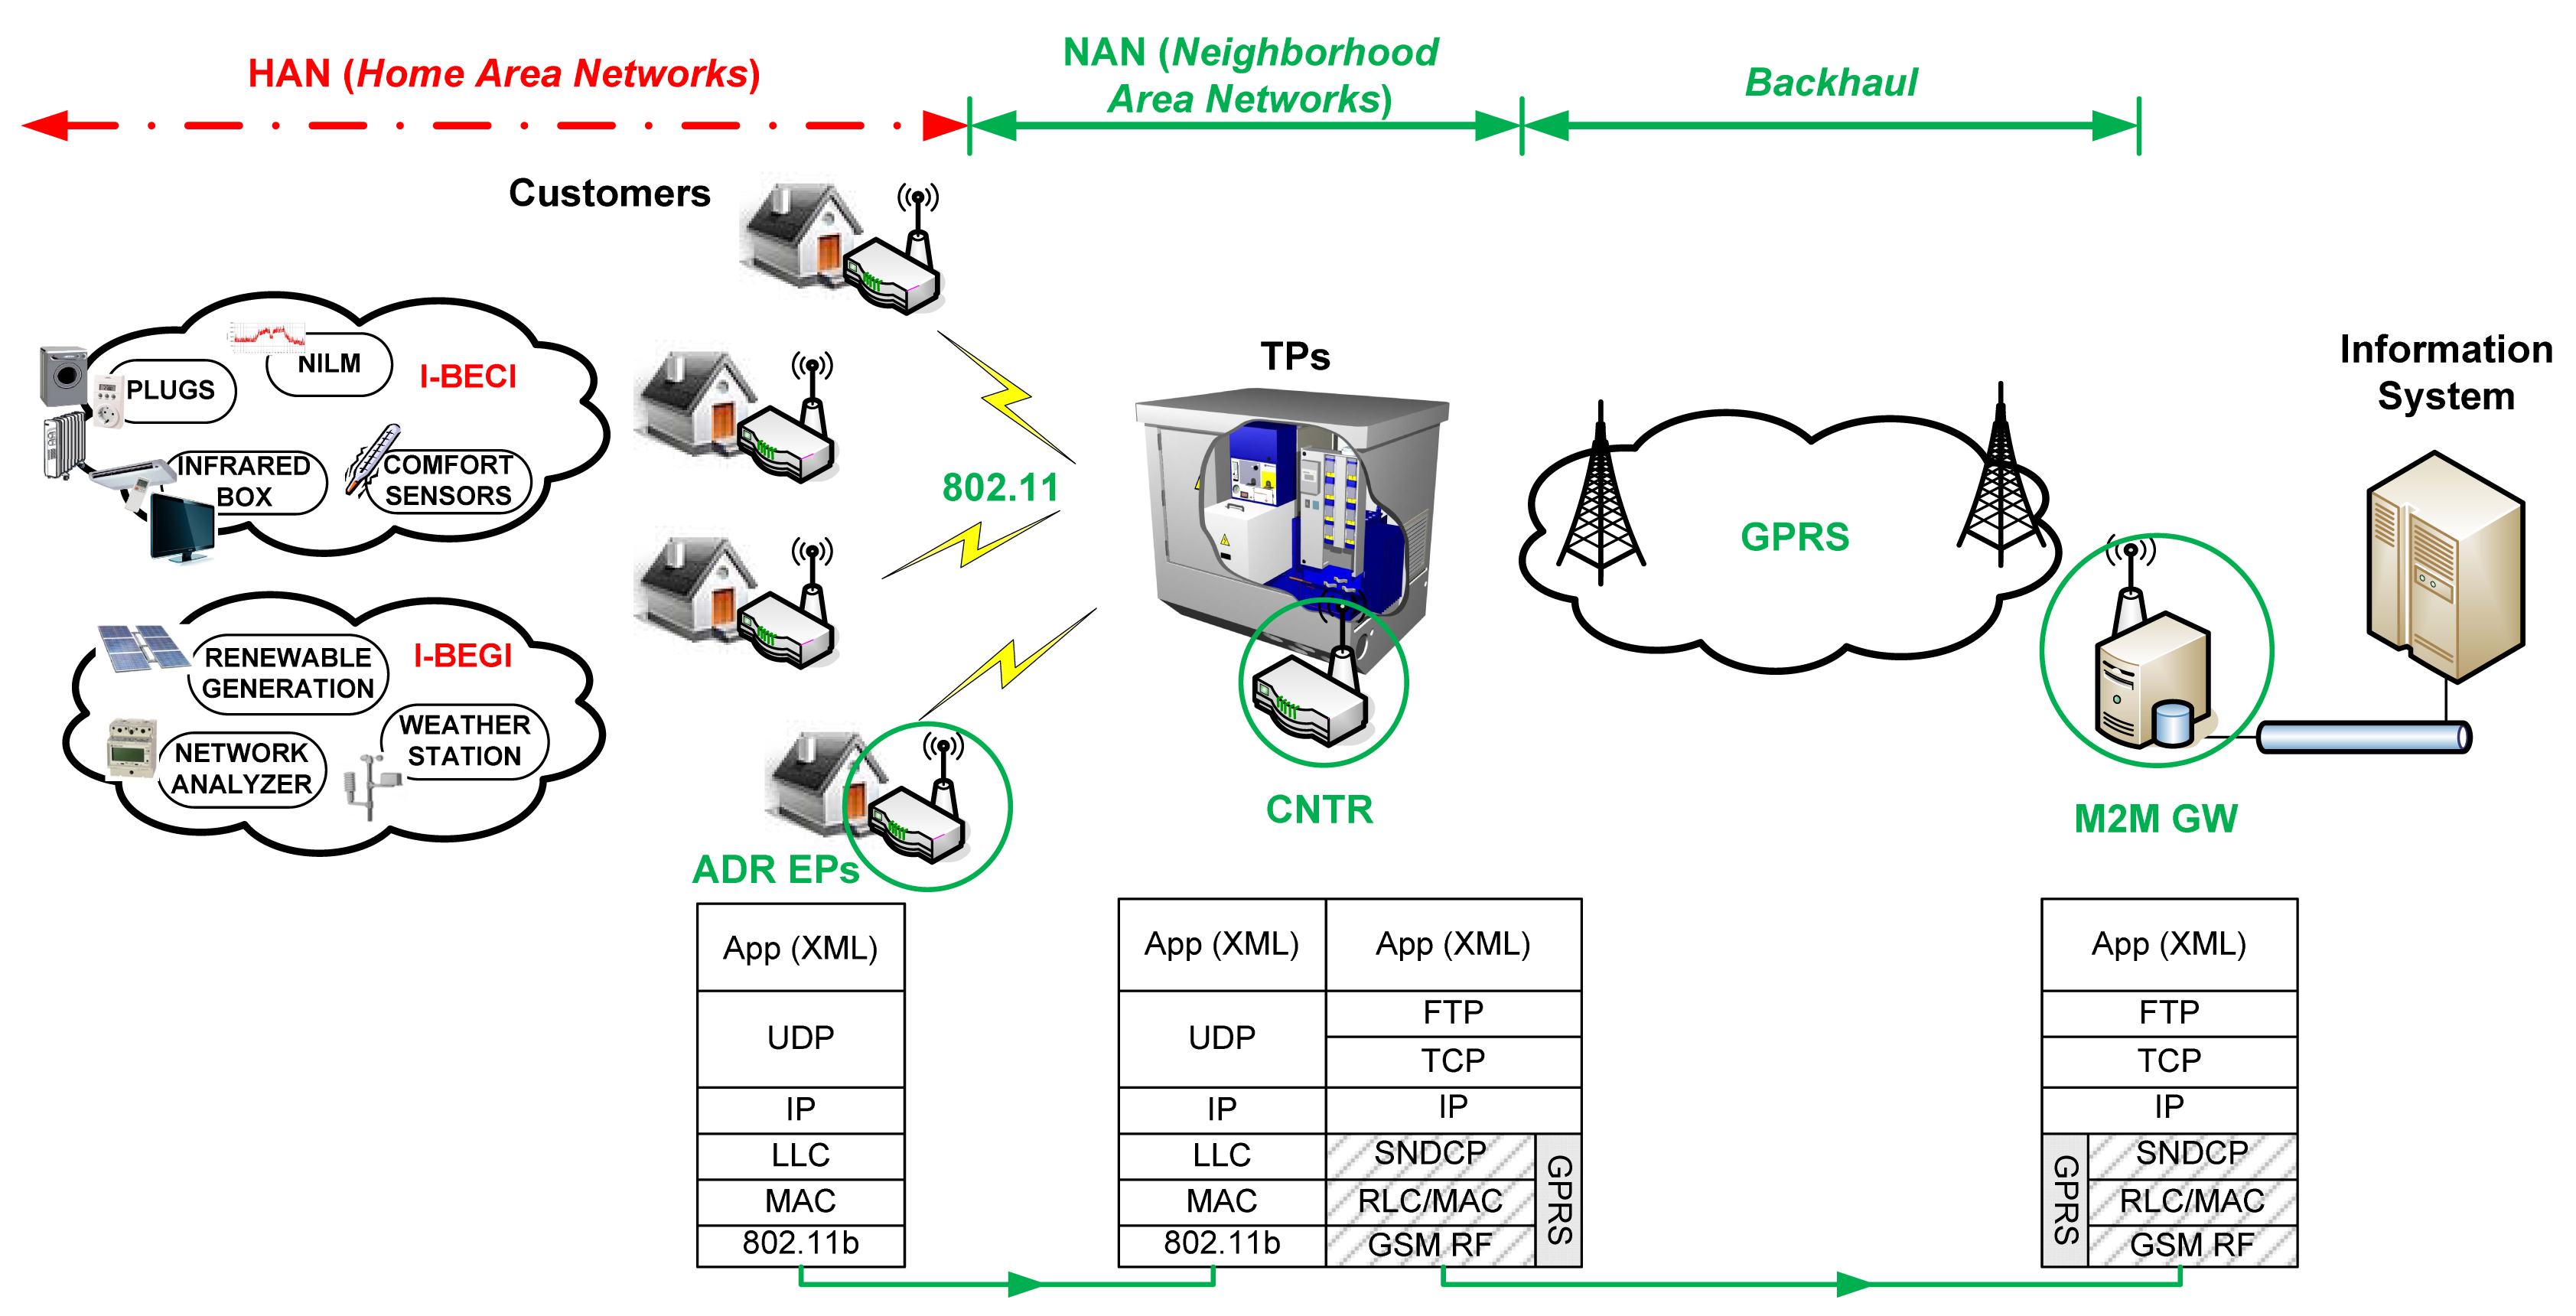
Figure 9 shows the mapping of the proposed M2M communications architecture onto the power distribution infrastructure. Thus, the ADR EPs are associated to the Customers and the CNTRs are associated to the Transformation Points (TPs) or Feeders. The M2M GW is logically associated to the Substation that manages the target neighborhood. However, using GPRS as backhaul technology allows the M2M GW to be physically located at the Substation or wherever else the data centers of the entity operating the platform (e.g., DSO, retail electric provider, aggregator) are.
Based on this mapping, on data from actual power distribution infrastructures, and on data related to the implementation of the ENERsip platform, [7] models the traffic of such a platform in different scenarios. The main goal of this work is to set the foundations to evaluate the designed communications infrastructure on large-scale real World scenarios. As a result, the assessment that represents the main contribution of this paper takes [7] as baseline, focusing on the NAN and the backhaul network, as it is highlighted in continuous green line in Figure 9.
Reference [7] distinguishes, based on the data from actual electricity distribution infrastructures, between Urban (U) and Rural (R) scenarios (the considered Rural scenarios do not mean isolated houses with farms, in this case there would not be a neighborhood, so the system would not make sense), but villages or small cities in rural areas., since the number of customers/TP, the number of TPs/Substation and the maximum acceptable distance between customers and TPs vary remarkably between both.
In addition, [7] considers not only current or short-term (ST) scenarios but also medium to long-term (LT) scenarios, so that the conclusions from works based on it are valid for a longer period of time and can be used to take the appropriate decisions in advance. The main differences between short-term (ST) and long-term (LT) scenarios have to do with:
The periodicity which ADR EPs send data with (T) and the size of such data (S). T will be lower in the long-term, thus being closer to an almost real-time situation. S will be higher in the long-term, since more devices with communications capabilities are assumed both in the I-BECI and in the I-BEGI. In addition, S is also different for I-BECIs and I-BEGIs (SC and SG), since the SANs within them are composed of different devices.
The penetration of micro-generation. This parameter will be always higher in the rural scenarios than in the urban ones due to the type of dwellings (e.g., houses where photovoltaic panels can be installed in the roof are more common in the former; whereas buildings of flats are more common in the latter). Furthermore, it will be also higher in the long-term than in the short-term scenarios, since the penetration of micro-generation and self-consumption is foreseen to increase in the forthcoming years. It should be noted that throughout this paper independent communications gateways for the I-BECI (ADR EP-C) and for the I-BEGI (ADR EP-G) are assumed. Thus, the number of ADR EP-C (AC) is equal to the number of customers/TP; whereas the number of ADR EP-G (AG) is computed by multiplying AC by the estimation of the micro-generation penetration (assumed always < 1) [7].
Table 3 summarizes the values of the aforementioned parameters in the four considered scenarios, where C refers to the number of TPs/Substation and D refers to the maximum acceptable distance between customers and TPs.
4. Communications Infrastructure Assessment
This section presents the evaluation of the core of the proposed M2M communications architecture from both economic and technical points of view, which represents the main contribution of the paper.
4.1. Evaluation of End-to-End Security Protocols
The main goal of this sub-section is to assess the impact of using security protocols which support Virtual Private Networks (VPNs) on the operational costs of the platform. Thus, secure communications channels are to be established between pairs of entities of the communications architecture.
Therefore, bearing in mind that the paper is focused on the core of the already mentioned communications architecture, such secure channels can be established from the ADR EPs directly to the M2M GW or from the CNTRs to the M2M GW, as Figure 10a,b illustrate.
If the secure tunnels were established from the ADR EPs straight to the M2M GW, the CNTRs would not be able to aggregate data, which would affect negatively the scalability and operational costs of the platform. Thus, this case is actually divided into establishing secure tunnels from the ADR EPs to the CNTR and from the CNTRs to the M2M GW, which implies the highest numbers of tunnels and so the most complex scenario to manage, as Figure 10c also shows.
Regarding the secure tunnels from the ADR EPs to the CNTRs, it might be interesting to evaluate the impact of the overhead introduced by the security protocol on the performance of the wireless link. This overhead will not increase the operational costs though, since in principle it is assumed that the operator of the platform will be responsible for this network segment. Hence, the operator itself will be also responsible for configuring the basic security mechanisms within this network segment (e.g., WPA2—Wi-Fi Protected Access 2).
Regarding the secure tunnels from the CNTRs to the M2M GW, the overhead introduced by the security protocol does have an impact on the operational costs, since the backhaul connectivity is assumed to be a service offered by a third party (e.g., a telecom operator). Therefore, in this case the operators of this kind of platforms must use such security mechanisms at higher layers, since the basic security mechanisms are out of their scope and they cannot rely solely on the security provided by such third parties. As a result, this section is focused on the case of establishing VPNs from the CNTRs to the M2M GW. Two scenarios are in turn considered within this specific case:
Fast Forwarding (FF): the CNTRs forward the packets coming from the ADR EPs to the M2M GW on a per-packet basis, using a Transport Control Protocol (TCP) connection for this purpose.
Aggregation (Aggr): the CNTRs store all the packets received from the ADR EPs throughout a given period and send them all together using a File Transfer Protocol (FTP) connection.
Regarding the security protocols themselves, there are many mechanisms to provide E2E (End-to-End) security at the different layers of the protocol stack [31,32]. VPN can be implemented at the link layer using Layer 2 Tunneling Protocol (L2TP). Internet Protocol Security (IPSec) represents the most widely deployed solution to do so at the network layer. Transport Layer Security/Secure Socket Layer (TLS/SSL) is the most widely used protocol for this purpose at the transport layer. Secure Shell (SSH) is widely used at the application layer for secure remote access. Notably, this section is focused on IPSec and TLS/SSL.
4.1.1. Technical Comparison
Table 4 summarizes and compares some relevant technical features of IPSec and TLS/SSL. It can be seen that both IPSec and TLS/SSL provides the basic security features required by the considered platform (i.e., authentication, integrity, and confidentiality). The main drawbacks of IPSec are the complexity of configuration and the Network Address Translation (NAT) incompatibility; whereas one of the main drawbacks of TLS/SSL is the complexity of using Public Key Infrastructure (PKI). Regarding the fact that TLS/SSL only supports some TCP applications, there is no problem in our case, since FTP is one of the TCP applications supported by TLS/SSL. As result, it is concluded that, from a technical point of view, there is no compelling reason to rule one of these protocols out.
4.1.2. Economic Comparison
This sub-section is notably focused on assessing the impact of using IPSec or TLS/SSL on the operational costs of the platform. In order to do so, first the Maximum Segment Size (MSS) of TCP needs to be determined, since this influences the number of packets sent through the GPRS link and the ratio of data vs. control headers (i.e., the overhead). There are quite a few papers on the use of TCP over GPRS. Initially, the trend was to use low MSS (e.g., 512 bytes [33] and 413 bytes [34]). However, although low MSS may be appropriate for interactive applications, [35] proves that using high MSS (1400–1600 bytes) maximizes the goodput (i.e., throughput at application layer) in applications of massive data exchange, as it is the case of this paper.
Taking this range of TCP MSS as reference, the MSS used in this paper is computed by subtracting from the 1482 bytes pointed out in [36] as optimum Maximum Transmission Unit (MTU) of the Sub Network Dependent Convergence Protocol (SNDCP) layer of GPRS, the size of the headers up to the transport layer. Table 5 summarizes the overhead introduced by IPSec and TLS/SSL [37]. The worst case is always considered in the analysis carried out in this section, i.e., 44 bytes for IPSec (plus the 20 bytes of the additional header introduced in the tunnel mode) and 25 bytes for TLS/SSL.
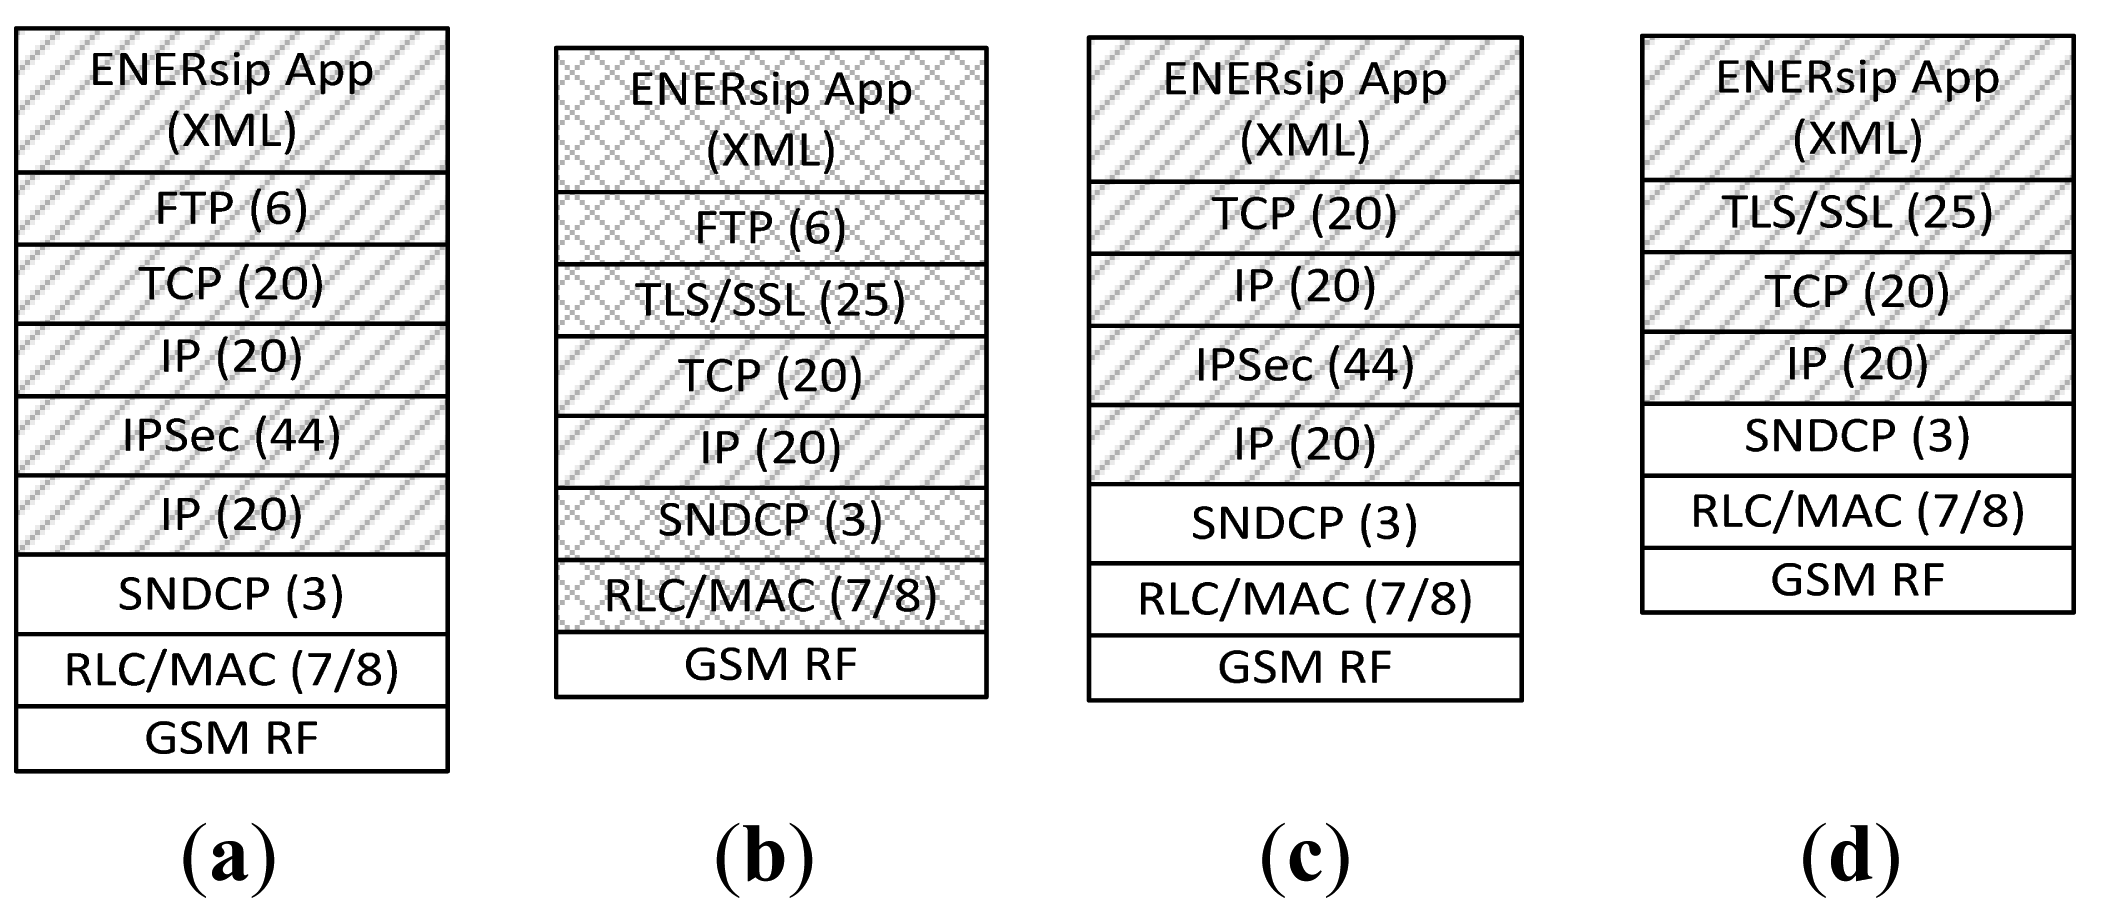
Figure 11 shows the protocol stack that implements both the CNTRs and the M2M GW in each of the considered cases, specifying the size of the headers in Bytes. The layers considered in this section to compute the number of bytes carried by GPRS are marked in Figure 11 with forward slash. In order to translate the volume of traffic onto cost, two commercial Spanish M2M tariffs are used, namely: (1) 100 MB/10 €/month; and (2) 20 MB/3 €/month.
Thus, the impact of IPSec and TLS/SSL on the operational cost is evaluated as follows: (1) the volume of bytes carried by GPRS is computed per a single CNTR and per month for each scenario; (2) the obtained bytes are translated onto cost using the aforementioned M2M tariffs; (3) the cost per neighborhood and per year is computed by multiplying the cost per CNTR and per month by C (cf. Table 3) and by 12.
Table 6 details the results of the analysis for each of the considered scenarios. VNS represents the volume of traffic (in MB) carried by the GPRS network in one month without using any security protocol. VS represents the volume of traffic (in MB) carried by the GPRS network in one month using the corresponding security protocol. RNS represents the ratio between the application-layer data and VNS (in%). RS represents the ratio between the application-layer data and VS (in%). OS is computed as the difference between VS and VNS, so it represents the overhead introduced by the security protocol (in%). CNS represents the monthly cost of carrying VNS (in €). CS represents the monthly cost of carrying VS (in €). Finally, DC is computed as the difference between CS and CNS, so it represents the cost of using the corresponding security solution in a given scenario.
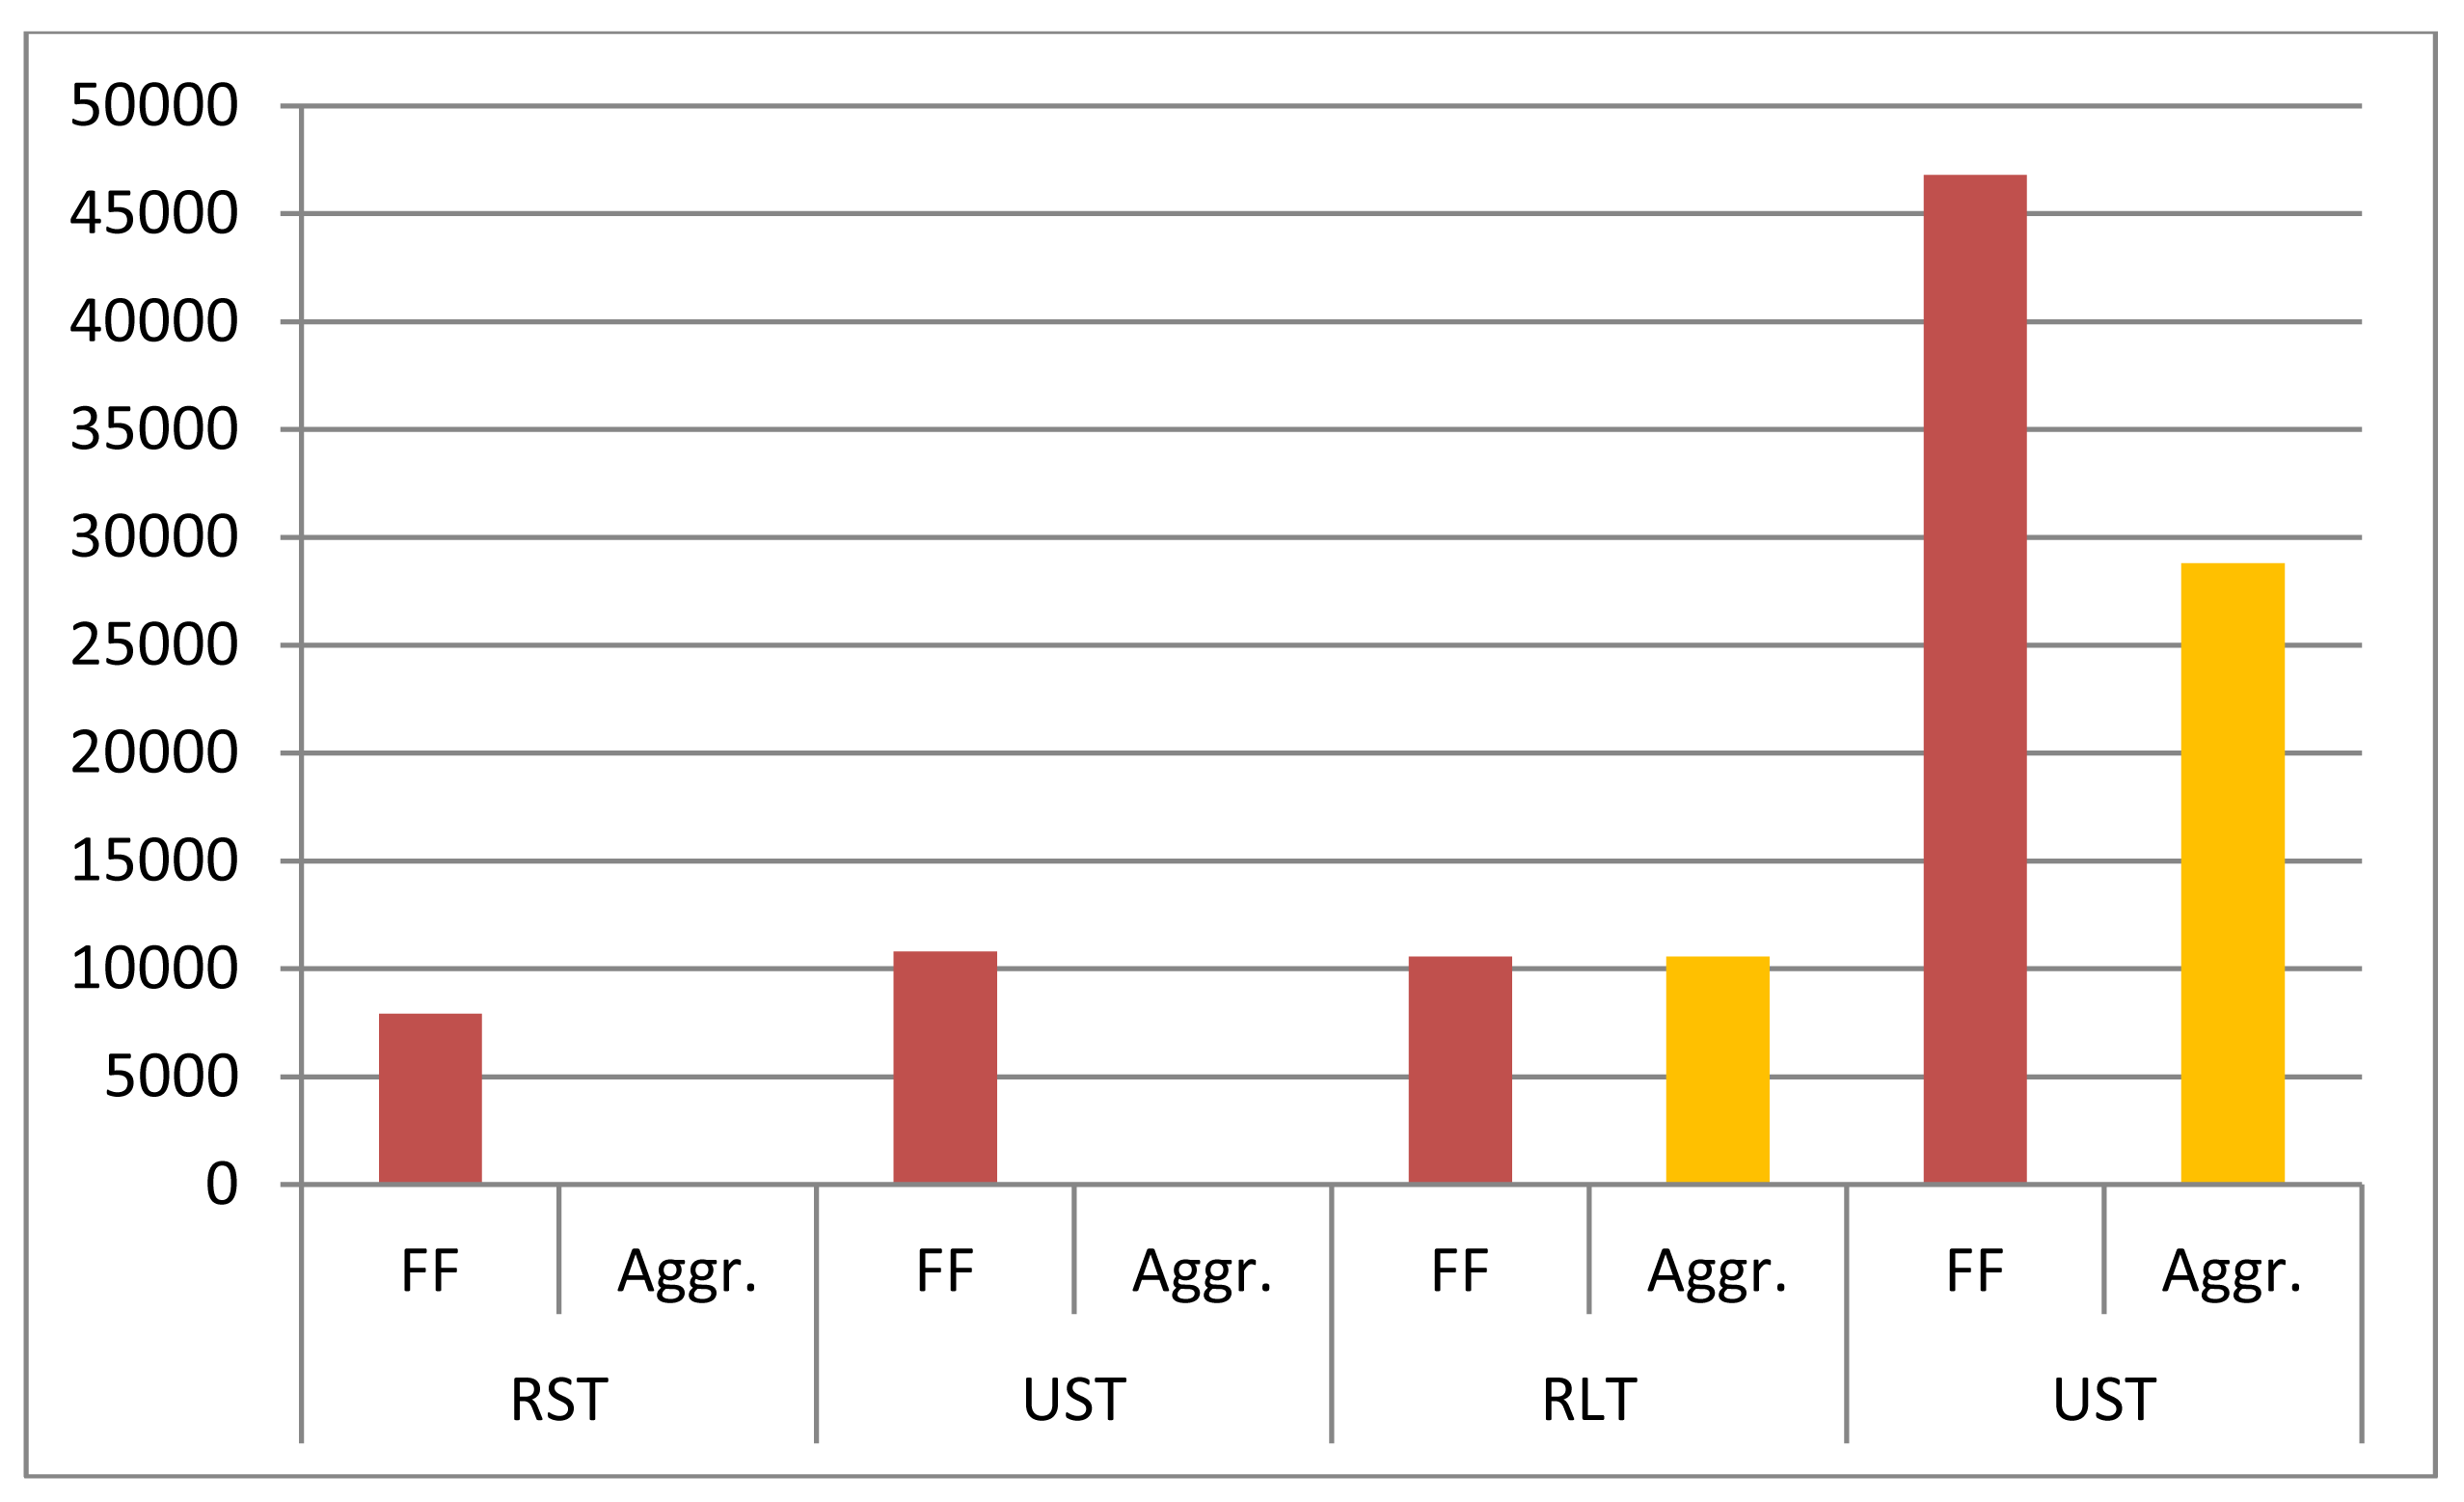
Table 7 shows the difference between the annual cost of using Fast Forwarding and the annual cost of using Aggregation (CS|FF–CS|Aggr) in each scenario for a single CNTR. Table 7 also shows this difference in each scenario for the whole district/neighborhood (it should be noted that District is used to refer to the whole power infrastructure managed by a given Substations, where the consumption-generation optimization algorithms run).
In order to facilitate the understanding of the impact of using Fast Forwarding or Aggregation on the operational costs of the platform, Figure 12 shows graphically the difference between the annual cost of using Fast Forwarding and the annual cost of using Aggregation in each scenario for a whole district. It can be seen that the difference of cost–although almost negligible for a single CNTR-can be appreciable at neighborhood level, especially in urban and long-term scenarios. In addition, it can be also checked that the difference is always higher when using IPSec, since it introduces higher overhead than TLS/SSL. In conclusion, Figure 12 illustrates the savings that can be achieved by using Aggregation. Nevertheless, it is worth remarking that the results obtained in this analysis represent a lower bound of the savings that using Aggregation could bring compared to using Fast Forwarding, since data is aggregated during only one period. However, aggregating data throughout several periods increases latency, which may not be acceptable, e.g., to operate DR events.
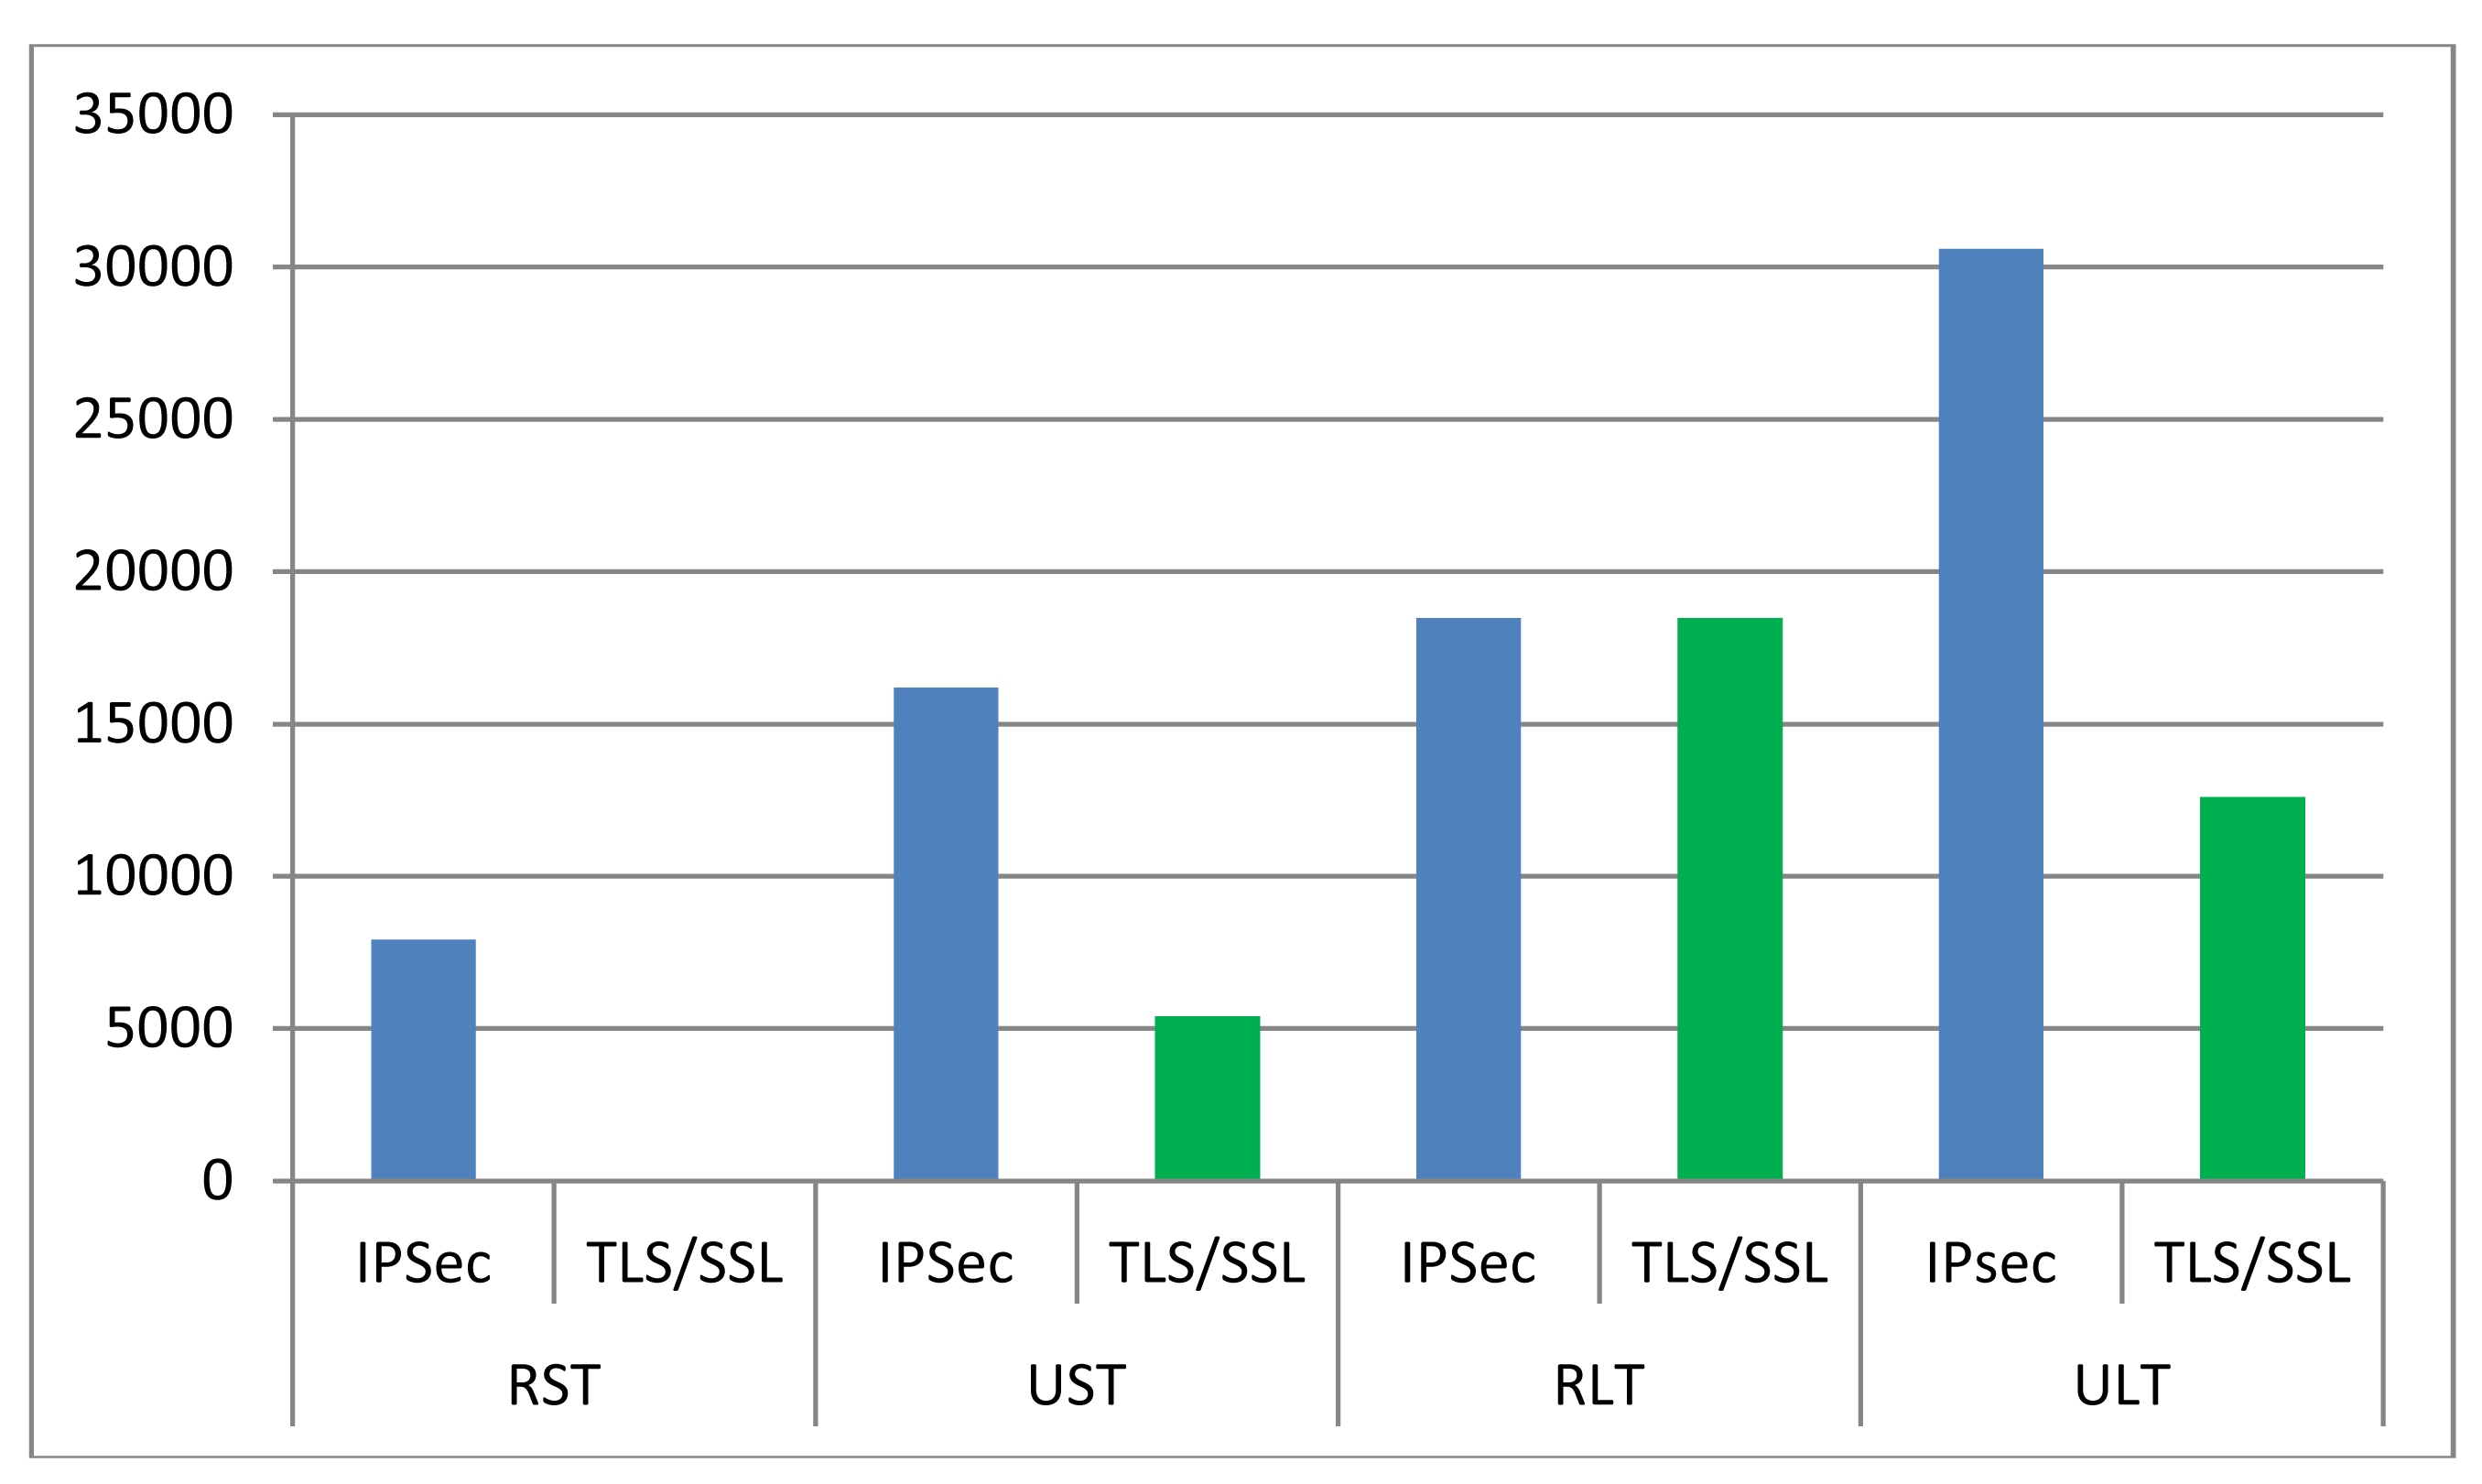
Table 8 shows the difference between the annual cost of using IPSec and the annual cost of using TLS/SSL (CS|IPSec–CS|TLS/SSL) in each scenario for both a single CNTR and the whole district/neighborhood.
Again, to aid understanding the impact of using IPSec or TLS/SSL on the operational costs, Figure 13 shows graphically this difference in each scenario for a whole district. It can be checked that the difference of costs between using IPSec or TLS/SSL is always higher when using Fast Forwarding, since data sending is very inefficient in this situation, so the difference between the overhead introduced by IPSec and by TLS/SSL is even higher. It can be also checked that, in the case of using Aggregation, the potential savings of using TLS/SSL instead of IPSec are especially relevant in long-term scenarios.
Therefore, it can be concluded that Aggregation and TLS/SSL as VPN technology is the best combination in order to minimize the operational costs of the platform. Hence, such a combination will be assumed in the next section.
Nevertheless, it should be noticed that the overhead–and so the costs-can be lower by implementing compression mechanisms (in the case of TLS/SSL, only OpenSSL supports it) and that the volume of data sent through the GPRS network–and so the costs–can be lower if only the data that change compared to the previous period are sent, which can be implemented, e.g., using JavaScript Object Notation (JSON).
4.2. Evaluation of the M2M Communications Infrastructure Performance
This sub-section evaluates the performance of IEEE 802.11 and GPRS using goodput and transmission time as metrics, respectively.
4.2.1. Simulation Setup
The simulations were run using OMNeT++ 4.2.2 as network simulation framework [38]. Notably, the models and network components available in the INET framework 4 were used and modified when needed. The simulations were run in a laptop equipped with a microprocessor Intel Core 2 Duo T7250 at 2 GHz, 1 Gb of Random Access Memory (RAM), and 2 Mb of cache memory, using Ubuntu 10.04 as Operating System (OS). The simulation time was set to 1 hour after checking that simulations converge after one period (i.e., 15 min in short-term scenarios and 5 min in long-term scenarios). Each scenario was simulated 100 times for both the NAN and the backhaul network in order to get statistically meaningful results. The sample mean x_bar_i and the sample variance v_i of the output parameter (i.e., goodput or transmission time) was recorded for each of the simulated scenarios. So each simulation run was modeled as a random variable with mean x_bar_i and variance v_i and the resulting random variables were assumed to be independent. Therefore, based on the central limit theorem, the random variable resulting from the 100 random variables obtained in the simulation runs of each scenario was considered to fit a Gaussian distribution with mean μ = sumi(x_bar_i)/n and standard deviation σ = sqrt(sumi(v_i)/(n − 1)), n being 100. Consequently, Equation (1) can be used to compute 95% confidence intervals of the mean of the output of the simulations for each of the considered scenarios. Octave 3.2 was used to process the data:
The main modules that were used to simulate the NAN are:
channelcontrol: this module manages the PHYsical (PHY) and Media Access Control (MAC) layer of IEEE 802.11.
flatNetworkConfigurator: this module assigns IP addresses within the same network segment.
MobileHost: this module is taken as reference to implement the functionalities of ADR EP-Cs, ADR EP-Gs, and CNTR. This module implements from an IEEE 802.11 interface in ad-hoc mode up to a set of UDP applications. From such a set of UDP applications, UDPBasicApp is used to implement the ADR EPs, since UDPBasicApp allows fixing the sending periodicity and length of the messages; whereas a passive UDP socket (UDPSink) is used to implement the CNTR. In addition, a DatarateChannel was included between the UDP layer and the application layer in the upper direction in order to measure the aggregate throughput at the application layer in the CNTR (i.e., the goodput).
The wireless router Linksys WRT160NL [39] from Cisco is taken as reference for configuring the PHY and MAC parameters of the 802.11 link, since this device was actually used to implement the prototype of the ADR EP in the ENERsip project. The family of standards 802.11 encompasses many protocols [40]. The Linksys WRT160NL, in particular, supports 802.11b/g/n. In this work, we focus on 802.11b and g. Table 9 summarizes the most relevant parameters of IEEE 802.11b and 802.11g in the Linksys WRT160NL.
In order to check whether all these protocols provide the range required by our target application (D in Table 3) or not, the well-known Friis Equation (2) with α = 2 is applied, since Free-Space is used as propagation model in OMNeT++ [41]:
Table 10 summarizes the minimum transmission power (powerSend) required to reach D with a received power equals to the sensitivity. Thus, if powerSend is higher than the maximum EIRP (Effective Isotropic Radiated Power), the protocol under question cannot be used in our target application, as it is the case of 802.11 g at 54 Mb.
Finally, IEEE 802.11b at 11 Mb was selected for the simulations presented in this paper. Table 11 shows the configuration of the PHY and MAC parameters of IEEE 802.11b used in such simulations.
Regarding the backhaul network, when developing the simulations, it was observed that in practice there cannot be interferences in the GPRS links, since GPRS uses dedicated channels, instead of shared medium. As a result, the parameter C from Table 3 is not needed in these simulations. This reduces the complexity of them, since instead of having to simulate C GPRS connections; it is enough to simulate just one.
The main modules used to simulate the Backhaul network segment are the already explained flatNetworkConfigurator and the WirelessHostSimplified. The WirelessHostSimplified is taken as reference to implement the functionalities of the CNTRs and the M2M GW. The WirelessHostSimplified implements three different PHY/MAC layers, namely wlan (i.e., IEEE 802.11 in infrastructure mode), eth (i.e., Ethernet), and ppp (i.e., Point-to-Point). The ppp module is selected to model the GPRS link. At the application layer, the WirelessHostSimplified implements a set of TCP applications. TCPBasicClientApp and TCPGenericSrvApp are the most suitable applications to implement an FTP application. TCPBasicClientApp allows specifying the time gap between requests (i.e., sending periodicity) and the size of the reply (i.e., size of data). Thus, once a TCPGenericSrvApp receives a request, it just replies a message with the size specified in that request.
As a result, despite the fact that in practice the M2M GW works as FTP server and the CNTRs work as FTP clients, in these simulations the TCPBasicClientApp was used to implement the M2M GW and the TCPGenericSrvApp was used to implement the CNTR. Thus, the time that the CNTR needs to send the data to the M2M GW can be computed as the difference between the time when they are received at the M2M GW and the time when the request is received at the CNTR (since the parameter ReplyDelay of TCPGenericSrvApp is set to 0). A DatarateChannel was included between the TCP layer and the application layer in the upper direction indeed to measure the bytes received at the application layer in the M2M GW and in the CNTR.
The GPRS link itself is modeled as a DatarateChannel with the following features, which are also summarized in Table 11:
Delay = 1 μs.
Data rate = 26.8 kbps. This parameter is set based on the uplink data rate of an actual GPRS network reported in [42]. A dedicated infrastructure is assumed, i.e., the GPRS link only carries data associated to our application.
Probability of error = 0.001, based on the theoretical availability of the channel [43].
4.2.2. Simulation Results
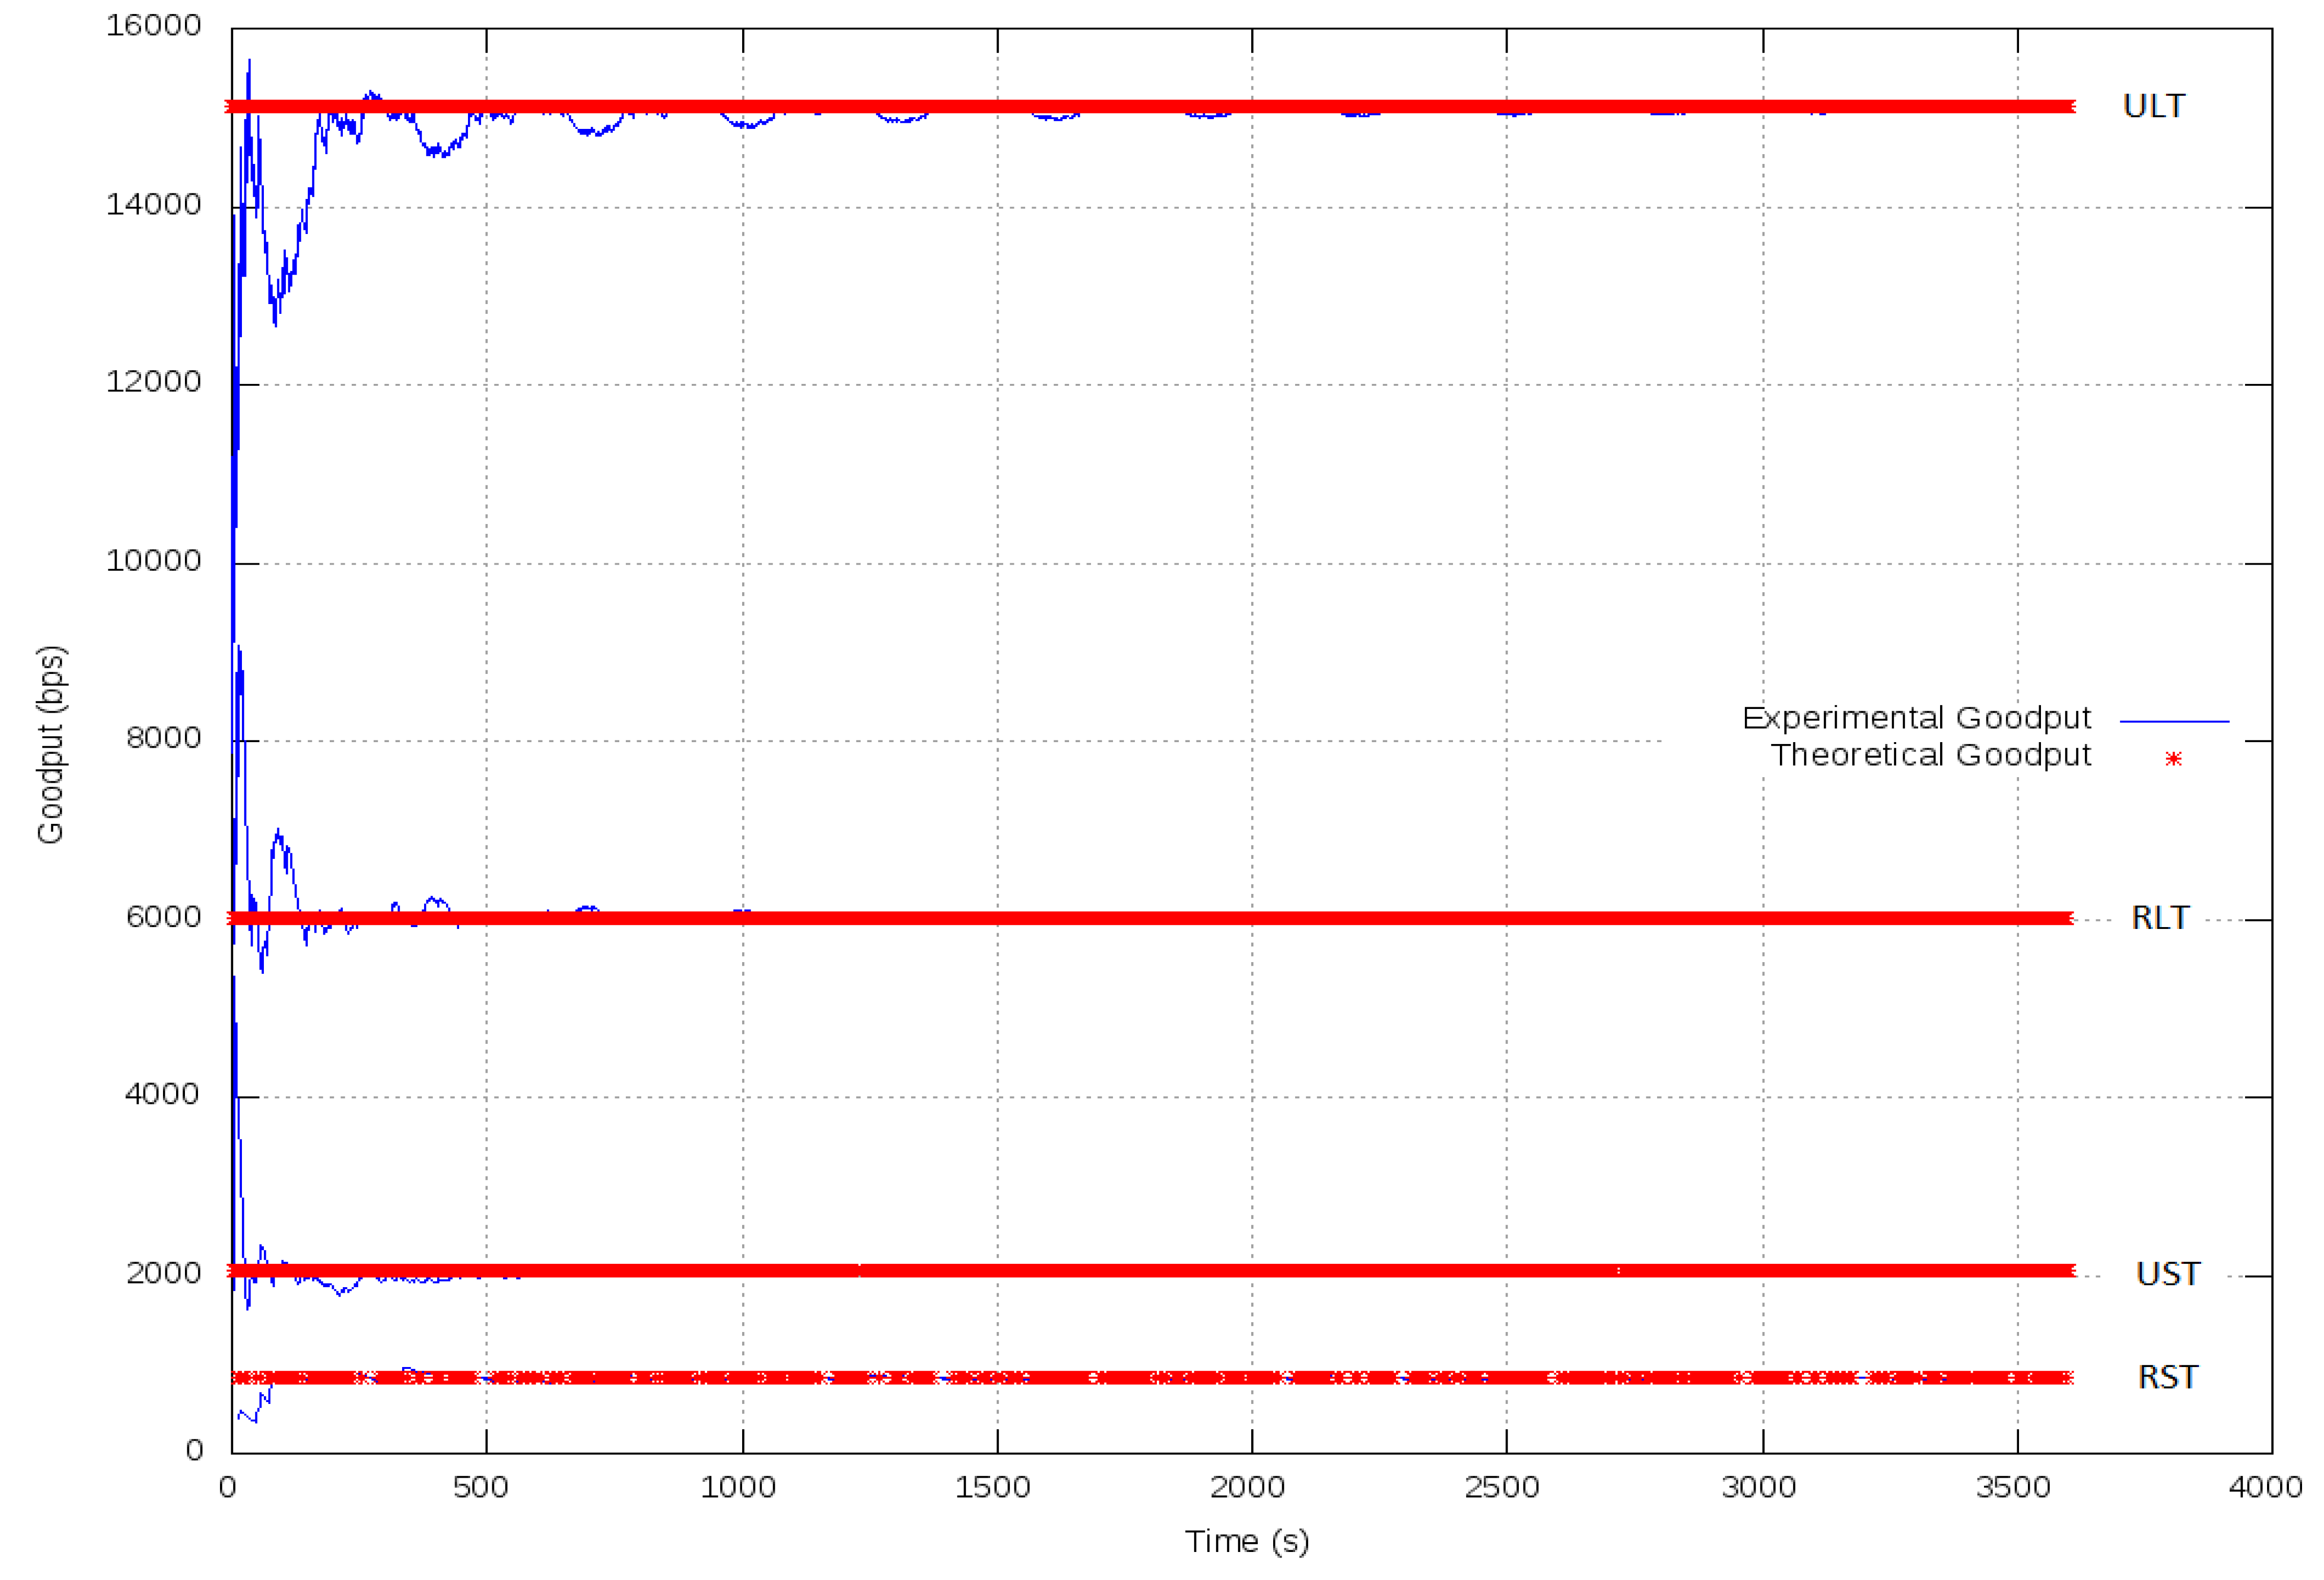
Table 12 summarizes the goodput measured at the CNTR in the four simulated scenarios and compares it with the theoretical approximation computed using Equation (3):
It can be checked that the obtained results fit the expected results in every scenario (in order to avoid simulation problems in the worst case scenario (i.e., ULT), explicit memory deallocation at MAC layer was needed).
Figure 14 shows the goodput for just one simulation run in every scenario. It can be observed that the simulated goodput converges to a value which is close to the theoretical one in each scenario. As a result, it can be concluded that the protocol IEEE802.11b at 11 Mb meets the requirements (in terms of goodput) of the NAN in all the considered scenarios. Due to the fact that the maximum goodput is in the order of tens of kb, IEEE 802.11b at 1 Mb or IEEE802.11 g at 6 Mb are also candidate technologies.
Table 13 summarizes the time that the CNTR spends to transfer the data to the M2M GW (TCNTR) in the four simulated scenarios and compares them with the time computed theoretically using the fragmentation criteria reported in [36] and the bytes of the layers marked in Figure 11 with back slash.
It can be checked that the simulated TCNTR is always slightly higher than the theoretical value, mainly due to the probability of error and to slightly different fragmentation policies. Likewise, TCNTR is always lower than the sending period, which means that GPRS meets the requirements (in terms of bandwidth) of the backhaul network in all the considered scenarios.
5. Discussion
ICT and M2M communications represent the key enablers of the Smart Grid in the distribution and customer domains. When it comes to the required communications infrastructure, the first question that needs to be answered is which is the most appropriate communications architecture. However, there is not a single answer to this question, since this decision depends on multiple factors (e.g., target application, specific features and constraints of the underlying power infrastructure, regulation, etc.).
Thus, [44] analyses the advantages and drawbacks of two communications architectures based on wireless 4G technologies for AMI applications. First, direct communication between the smart meters and the so-called Metering Data Management System (MDMS) is considered, focusing on the main issues that this approach presents from the communications point of view. In this regard, the paper highlights the inefficiencies of performing connection establishment and authentication procedures in a per-smart-meter-basis and remarks upon some resultant problems that network operators would have to face in this scenario, such as the required improvement of the Radio Access Network (RAN) to avoid problems related to lack of bandwidth or coverage arising from the huge number of smart meters. To solve these problems, the paper proposes a hierarchical architecture comprising two network segments, where the intermediate device between the smart meters and the MDMS is called Aggregation Point (AP). For the communications between the smart meters and the APs, short range communications technologies (e.g., IEEE 802.15.4/Zigbee or IEEE 802.11) are proposed; whereas wireless 4G technologies are still used for the communications between the APs and the MDMS.
Reference [45] proposes deploying an entirely new cellular network based on Code Division Multiple Access at 450 MHz (CDMA-450) exclusively devoted to the Smart Grid applications provided by a given DSO. In this case, the DSO would be the owner of the communications infrastructure, but a telecom operator would be responsible for operating it. The paper claims that this is a suitable solution from both technical and economic perspectives for the specific boundary conditions of the Netherlands. However, this would not be the case in other countries where the license to operate in this frequency band is too expensive or where this frequency band is already allocated for any other use.
In general, hierarchical heterogeneous communications architectures comprising several network segments and combining different communications technologies present higher flexibility, so they fit a wider range of Smart Grid applications with their specific requirements and constraints [46,47]. This is the approach followed to design the M2M communications architecture assessed in this paper, which is also aligned with the solution proposed in [44]. Thus, this M2M communications architecture is hierarchical in that it comprises specific network segments for households, buildings or group of households, and neighborhoods, aiming at being flexible, adaptive, and scalable. In addition, the proposed M2M communications architecture is also heterogeneous in that it involves different communications technologies in order to meet the specific communications requirements of each network segment.
Regarding the study on the impact of using different VPN technologies on the operational costs, to the authors' best knowledge, it represents a pioneer piece of research in the state of the art. This analysis shows that, in general, such costs are quite low for a single CNTR, but they start being relevant when looking at a whole neighborhood during one year. In order to minimize such costs, data aggregation at CNTRs and TLS/SSL are recommended. The aggregation period, however, needs to be chosen carefully. Higher aggregation periods will yield lower operational costs at the expense of increasing the latency, which may be unacceptable when operating mechanisms or services such as DR. The operational costs related to using such VPN technologies to provide E2E security can be also lowered by using compression techniques or application protocols that only transmit the data that change from one sampling period to another, such as JSON.
Regarding the evaluation of the performance of the core of the proposed M2M communications architecture, the first conclusion is along the line that IEEE 802.11b meets the requirements in terms of goodput of the NAN, which is of special interest to the Smart Grid community taking into account the low cost and wide adoption of this technology. Furthermore, the data rate demanded by the application is much lower than the data rate provided by IEEE 802.11, which leaves room to use such IEEE 802.11 infrastructure either to offer additional services (e.g., multimedia connectivity using IEEE 802.11e) or to operate more challenging applications such as DR. However, the performance of IEEE 802.11 in these scenarios still needs to be checked on a large scale in the field (in the ENERsip project, the IEEE 802.11 network segment was evaluated in the field with successful results, but only for few devices), since the simulations do not take into account the effects of interferences, which are usually high in the Industrial, Scientific and Medical (ISM) band at 2.4 GHz, nor complex propagation models.
In addition, in order to avoid potential problems related to the coverage of IEEE 802.11, sub-GHz Wi-Fi (IEEE 802.11AH) [48] may be also considered in the future for the NAN in rural scenarios, where distances are higher, but data rates are lower. In such rural scenarios, it is also worth considering White Spaces [49].
The second conclusion of such simulations is that GPRS meets the requirements in terms of bandwidth of the backhaul network, thus confirming that it represents an attractive technology considering that it is the most mature and widely deployed cellular technology in Europe. However, the relevance of the obtained results can be improved by using a more accurate model for the GPRS link (considering either OMNeT++ [50] or other network simulator, such as OPNET Modeler [51], for this purpose) or by testing the considered scenarios in a real GPRS network.
Regarding the model taken as reference in this paper, although it is tailored to the Portuguese power distribution grid (since it is based on actual data provided by Energias de Portugal–EDP) and to the ENERsip specifications, it can be easily adapted to other scenarios by suitably tuning the appropriate parameters. Anyway, power distribution grids are quite similar throughout Europe. Hence, the typical values of customers/TP, TP/substation, and D of the Portuguese power distribution grids are representative for the rest of Europe. However, they are not representative in North America.
First, European transformers are larger and there are more customers/TP and TP/substation. As a result, AC and C would be lower in North America than the values considered in this paper. Second, North American secondary power distribution networks are single-phase and are standardized on 120/240 V; whereas European secondary power distribution grids are three-phase and are standardized on 220, 230, or 240 V, which represent twice the North American standard. With twice the voltage, a circuit feeding the same load can reach four times the distance. Furthermore, taking into account that three-phase secondary can reach over twice the length of a single-phase secondary, a European secondary can reach up to eight times the length of a North American secondary for a given load and voltage drop [52]. Therefore, D could be up to eight times lower in North America than the value considered in this paper, so the situation in North America is even more advantageous for using IEEE 802.11 in this network segment.
Regarding micro-generation and self-consumption, the situation in term of total installed capacity is not the same in all the countries of the EU. Regarding residential PV in particular [53], the top five European markets in term of overall installed capacity are Italy, Germany, Belgium, UK, and Denmark. However, the model presented in [7] and summarized in this paper considers the penetration rate of these technologies as a percentage of the overall number of households/buildings with the aim that the estimated values are as representative as possible. Nevertheless, countries like Belgium, Denmark or the Netherlands still stand out when talking about penetration rates of residential PV. In the US, the differences are also remarkable, standing out states like California.
6. Conclusions
This paper evaluates some features of such widely used wireless communications technologies as IEEE 802.11 and GPRS in a Smart Grid application which consists of gathering and processing consumption and generation data periodically to reduce electricity consumption and energy costs and to maximize consumption-generation matching at neighborhood level. This assessment is carried out analytically and by means of simulations considering realistic large-scale scenarios, so the obtained results are valid to be taken into account as guidelines for potential deployments.
This paper analyses the impact of using IPSec and TLS/SSL as VPN technologies on the operational costs of the platform. The main conclusions of such analysis are: (1) that TLS/SSL minimizes the operational costs, the difference being especially remarkable in long-term scenarios; and (2) that using aggregation at the CNTR also allows reducing the operational costs of the platform at neighborhood level.
The main outcome of the simulations with regards to the NAN is that IEEE 802.11b meets the requirements in terms of goodput of this network segment in all the considered scenarios. This conclusion is of special interest to the Smart Grid community taking into account the low cost and wide adoption of IEEE 802.11b.
The main outcome of the simulations regarding the backhaul network is that GPRS meets the requirements in terms of bandwidth of this network segment in all the considered scenarios. As a result, GPRS represents an attractive technology considering that it is the most mature and widely deployed cellular technology in Europe.
As for the future work, other communications technologies (e.g., PRIME, in the last mile, or UMTS, LTE and WiMAX, in the backhaul network) and configurations (e.g., other application scenarios) can be implemented and evaluated using the same methodology followed in the work presented hereby.
Acknowledgments
The research leading to these results has been partly funded by the European Commission through the Seventh Framework Programme FP7/2007–2013, under the project ENERsip (247624), and by the Spanish Ministry of Economy and Competitiveness through the INNPACTO Programme, under the project PRICE-GEN (IPT-2011-1507-920000). This work at ISR-UC has been framed under the Energy for Sustainability Initiative of the University of Coimbra and supported by the FEDER/PORC FCT Grant CENTRO-07-0224-FEDER-002004 (EMSURE–Energy and Mobility for Sustainable Regions).
The authors would like to thank José Pablo Salvador (IMDEA Networks), Francisco José Herrera, Víctor Custodio, El bachir El achab, and Andrés García (UC3M), and Claudio Lima (member of the CEN/CENELEC/ETSI Smart Grid Architecture WG and of the NIST Smart Grid Architecture Council), for their support and valuable comments.
Conflicts of Interest
The authors declare no conflict of interest.
References
- Güngör, V.C.; Sahin, D.; Kocak, T.; Ergüt, S.; Buccella, C.; Cecati, C.; Hancke, G.P. Smart grid technologies: Communication technologies and standards. IEEE Trans. Ind. Inf. 2011, 7, 529–539. [Google Scholar]
- Usman, A.; Shami, S. Evolution of communication technologies for smart grid applications. Renew. Sustain. Energy Rev. 2013, 19, 191–199. [Google Scholar]
- NIST. Guidelines for Assessing Wireless Standards for Smart Grid Applications; National Institute of Standards and Technology, Priority Action Plan 2: Gaithersburg, MD, USA, 2011. [Google Scholar]
- Yan, Y.; Quian, Y.; Sharif, H.; Tipper, D. A survey on smart grid communication infrastructures: Motivations, requirements and challenges. IEEE Commun. Surv. Tutor. 2013, 15, 5–20. [Google Scholar]
- Güngör, V.C.; Sahin, D.; Kocak, T.; Ergüt, S.; Buccella, C.; Cecati, C.; Hancke, G.P. A survey on smart grid potential applications and communication requirements. IEEE Trans. Ind. Inf. 2013, 9, 28–42. [Google Scholar]
- Liu, J.; Xiao, Y.; Li, S.; Liang, W.; Chen, C.L. Cyber security and privacy issues in smart grids. IEEE Commun. Surv. Tutor. 2012, 14, 981–997. [Google Scholar]
- López, G.; Moura, P.; Custodio, V.; Moreno, J.I. Modeling the neighborhood area networks of the smart grid. Proceedings of the IEEE ICC, Ottawa, ON, Canada, 10–15 June 2012; pp. 3357–3361.
- Khan, R.; Khan, J. A comprehensive review of the application characteristics and traffic requirements of a smart grid communications network. Comput. Netw. 2013, 57(3), 825–845. [Google Scholar]
- Ardito, L.; Procaccianti, G.; Menga, G.; Morisio, M. Smart grid technologies in Europe: An overview. Energies 2013, 6, 251–281. [Google Scholar]
- IEC Smart Grid Standards Mapping Tool Official Web Site. Available online: http://smartgridstandardsmap.com/ (accessed on 5 January 2014).
- NIST. NIST Framework and Roadmap for Smart Grid Interoperability Standards Release 1. 0; National Institute of Standards and Technology, Special Publication 1108: Gaithersburg, MD, USA, 2010. [Google Scholar]
- NIST. NIST Framework and Roadmap for Smart Grid Interoperability Standards Release 2. 0; National Institute of Standards and Technology, Special Publication 1108R2: Gaithersburg, MD, USA, 2012. [Google Scholar]
- NIST Smart Grid Collaboration Wiki for Smart Grid Interoperability Standards. Available online: http://collaborate.nist.gov/twiki-sggrid/bin/view/SmartGrid/SGIPCatalogOfStandards (accessed on 5 January 2014).
- IEEE Std. 2030. IEEE 2030 Guide for Smart Grid Interoperability of Energy Technology and Information Technology Operation with the Electric Power System (EPS), and End-Use Applications and Loads; IEEE: New York, NY, USA, 2011. [Google Scholar]
- Approved & Proposed IEEE Smart Grid Standards. Available online: http://smartgrid.ieee.org/standards/ieee-approved-proposed-standards-related-to-smart-grid (accessed on 5 January 2014).
- EC. Standardisation Mandate to CEN, CENELEC and ETSI in the Field of Measuring Instruments for the Development of an Open Architecture for Utility Meters Involving Communications Protocols Enabling Interoperability; Standardization Mandate M/441; European Commission: Brussels, Belgium, 2009. [Google Scholar]
- EC. Standardisation Mandate to CEN, CENELEC and ETSI Concerning the Charging of Electric Vehicle; Standardization mandate M/468; European Commission: Brussels, Belgium, 2010. [Google Scholar]
- EC. Standardization Mandate to European Standardisation Organisations (ESOs) to Support European Smart Grid deployment; Standardization Mandate M/490; European Commission: Brussels, Belgium, 2011. [Google Scholar]
- CEN, CENELEC, ETSI. Smart Grid Reference Architecture; European Commission: Brussels, Belgium, 2012. [Google Scholar]
- CEN, CENELEC, ETSI. Smart Grid Reference Architecture—Annex F: Communication Architecture; European Commission: Brussels, Belgium, 2012. [Google Scholar]
- CEN, CENELEC, ETSI. First Set of Standards; European Commission, SG-GC: Brussels, Belgium, 2012. [Google Scholar]
- OneM2M2014 OneM2M Official Website. Available online: http://www.onem2m.org/ (accessed on 5 January 2014).
- Dohler, M.; Boswarthick, D.; Alonso-Zárate, J. Machine-to-machine in smart cities & smart grids. Proceedings of the IEEE Global Communications Conference Tutorial, Anaheim, CA, USA, 3–7 December 2012.
- ETSI. Machine-to-Machine Communications (M2M); Applicability of M2M Architecture to Smart Grid Networks; Impact of Smart Grids on M2M Platform; European Telecommunications Standards Institute, Technical Report 102 935: Sophia-Antipolis, France, 2012. [Google Scholar]
- Lu, G.; Seed, D.; Starsinic, M.; Chonggang, W.; Russell, P. Enabling smart grid with ETSI M2M standards. Proceedings of the IEEE Wireless Communications and Networking Conference Workshops, Paris, France, 1–4 April 2012; pp. 148–153.
- López, G.; Moura, P.; Kantsepolsky, B.; Sikora, M.; Moreno, J.I.; de Almeida, A. European FP7 project ENERsip: Bringing ICT and energy together. Glob. Commun. Newsl. 2012, 15, 2–4. [Google Scholar]
- Anderson, K.; Lee, S.; Menassa, C. Effect of social network type on building occupant energy use. Proceedings of the BuildSys 2012: Fourth ACM Workshop on Embedded Sensing Systems for Energy-Efficiency in Buildings, Toronto, ON, Canada, 6 November 2012; pp. 17–24.
- Carreiro, A.; López, G.; Moura, P.; Moreno, J.I.; de Almeida, A.; Malaquias, J. In-house monitoring and control network for the Smart Grid of the future. Proceedings of the IEEE PES International Conference and Exhibition on Innovative Smart Grid Technologies, Manchester, UK, 5–7 December 2011; pp. 1–7.
- López, G.; Moura, P.; Moreno, J.I.; de Almeida, A.; Perez, M.; Blanco, L. Monitoring system for the local distributed generation infrastructures of the smart grid. Proceedings of the CIRED 2013: 22nd European Conference and Exhibition on Electricity Distribution, Stockholm, Sweden, 10–13 June 2013.
- López, G.; Moura, P.; Moreno, J.I.; de Almeida, A. ENERsip: M2M-based platform to enable energy efficiency within energy-positive neighborhoods. Proceedings of the IEEE INFOCOM 2011 Workshop on M2M Communications and Networking, Shanghai, China, 10–15 April 2011; pp. 217–222.
- Khanvilkar, S.; Khokhar, A. Virtual private networks: An overview with performance evaluation. IEEE Commun. Mag. 2004, 42, 146–154. [Google Scholar]
- Berger, T. Analysis of current VPN technologies. Proceedings of the IEEE ARES 2006: 1st International Conference on Availability, Reliability and Security, Vienna, Austria, 20–22 April 2006.
- Meyer, M. TCP Performance over GPRS. Proceedings of the IEEE WCNC 1999, New Orleans, LA, USA, 21–24 September 1999; pp. 1248–1252.
- Rendon, J.; Casadevall, F.; Serarols, D. Snoop TCP performance over GPRS. Proceedings of the IEEE VTC Spring 2001, Rhodes, Greece, 6–9 May 2001; pp. 2013–2107.
- Benko, P.; Malicsko, G.; Veres, A. A Large-scale, passive analysis of end-to-end TCP performance over GPRS. Proceedings of the IEEE INFOCOM 2004, Hong-Kong, China, 7–11 March 2004; pp. 1882–1892.
- Aschenbruck, N.; Frank, M.; Hansmann, W.; Martini, P.; Scholz, C.; Tölle, J. Integration of 3G Protocols into the Linux Kernel to Enable the Use of Generic Bearers. In High Speed Networks and Multimedia Communications; Mammeri, Z., Lorenz, P., Eds.; Springer: Berlin, Germany, 2004; pp. 533–544. [Google Scholar]
- Alshamsi, A.; Saito, T. A technical comparison of IPsec and SSL. Proceedings of the AINA 2005: 19th International Conference on Advanced Information Networking and Application, Tamkang, Taiwan, 28–30 March 2005; pp. 395–398.
- Varga, A.; Hornig, R. An overview of the OMNeT++ simulation environment. Proceedings of the Simutools '08 1st International Conference on Simulation tools and Techniques for Communications, Networks and Systems & Workshops, Brussels, Belgium, 3–7 March 2008; pp. 1–10.
- CISCO. Cisco Linsys WRT160NL Datasheet; CISCO: San Jose, CA, USA, 2009. [Google Scholar]
- Hiertz, G.; Denteneer, D.; Stibor, L.; Zang, Y.; Pérez-Costa, X.; Walke, B. The 802.11 Universe. IEEE Commun. Mag. 2010, 48, 62–70. [Google Scholar]
- Khosroshahy, M.; Turletti, T.; Obraczka, K. Snapshot of MAC, PHY and Propagation Models for IEEE 802.11 in Open-Source Network Simulators; INRIA: Sophia-Antipolis, France, 2007. [Google Scholar]
- Shrestha, G.M.; Jasperneite, J. Performance Evaluation of Cellular Communication Systems for M2M Communication in Smart Grid Applications. In Computer Networks; Kwiecień, A., Gaj, P., Stera, P., Eds.; Springer: Berlin, Germany, 2012; pp. 352–359. [Google Scholar]
- NIST. Wireless Functionality and Characteristics Matrix for the Identification of Smart Grid Domain Application; National Institute of Standards and Technology: Gaithersburg, MD, USA, 2010. [Google Scholar]
- Mao, R.; Julka, V. Wireless broadband architecture supporting advanced metering infrastructure. Proceedings of the IEEE Vehicular Technology Conference Spring, Budapest, Hungary, 15–18 May 2011; pp. 1–13.
- Robichon, G. CDMA-450: A new approach for DSO's in Europe. Proceedings of the 4th ETSI M2M Workshop, Mandelieu-la-Napoule, France, 5–7 November 2013.
- Fadlullah, Z.; Fouda, M.; Kato, N.; Takeuchi, A.; Iwasaki, N.; Nozaki, Y. Towards intelligent machine-to-machine communications in smart grid. IEEE Commun. Mag. 2011, 49, 60–65. [Google Scholar]
- Zaballos, A.; Vallejo, A.; Selga, J.M. Heterogeneous communication architecture for the smart grid. IEEE Netw. 2011, 25, 30–37. [Google Scholar]
- Aust, S.; Prasad, R.; Niemegeers, I. IEEE 802.11ah: Advantages in standards and further challenges for sub 1 GHz Wi-Fi. Proceedings of the IEEE International Conference on Communications, Ottawa, ON, Canada, 10–15 June 2012; pp. 6885–6889.
- Brew, M.; Darbari, F.; Crockett, L.; Waddell, M.; Fitch, M.; Weiss, S.; Stewart, R. UHF white space network for rural smart grid communications. Proceedings of the IEEE International Conference on Smart Grid Communications, Brussels, Belgium, 17–20 October 2011; pp. 138–142.
- Todinca, D.; Pescaru, D.; Vitalariu, M. OMNeT++ models for resource allocation in wireless networks. Proceedings of the Simutools08 1st International Conference on Simulation tools and Techniques for Communications, Networks and Systems & Workshops, Brussels, Belgium, 3–7 March 2008.
- Abdul Salam, S.; Mahmud, S.; Khan, G.; Al-Raweshidy, H. M2M communication in Smart Grids: Implementation scenarios and performance analysis. Proceedings of the IEEE Wireless Communications and Networking Conference Workshops, Paris, France, 1 April 2012; pp. 142–147.
- Short, T. Electric Power Distribution Equipment and Systems; CRC Press: Boca Raton, FL, USA, 2005. [Google Scholar]
- EPIA. Global Market Outlook for Photovoltaics 2013–2017; European Photovoltaic Industry Association: Brussels, Belgium, 2013. [Google Scholar]


| Domain | Actor |
|---|---|
| Bulk Generation | Generators of electricity in bulk quantities |
| Transmission | Carriers of bulk electricity over long distances (the so-called TSOs–Transmission System Operators) |
| Distribution | Distributors of electricity to and from customers (the so-called DSOs-Distribution System Operators) |
| Customers | End users of electricity. They may also generate, store, and manage the use of energy. Traditionally, three customer types are considered: home, commercial/building, and industrial |
| Operations | Managers of the power flow |
| Markets | Operators and participants in the electricity market |
| Service Providers | Organizations providing services to electrical customers and utilities (e.g., aggregators, retailers, ESCOs–Energy Services Companies) |
| Communications network | Description |
|---|---|
| xAN/ESIs | xAN represents Home Area Network (HAN), Building Area Network (BAN), and Industrial Area Network (IAN), which encompass all the Intelligent Electronic Devices (IEDs) that allow monitoring and controlling energy status and patterns within each context. Energy Services Interfaces (ESIs) represent logical gateways |
| NAN | Neighborhood Area Network (NAN) is a last mile communications network that connects ESIs and smart meters, as well as Distributed Energy Resources (DERs) and microgrids to the utility control and operation center through the backhaul network |
| Backhaul | Backhaul network provides connectivity between the utility control and operation center and any communications network within the distribution and customer domains |
| Scenarios | Short-term (ST) | Long-term (LT) |
|---|---|---|
| Urban (U) | AC/AG = 360/36 | AC/AG = 360/144 |
| SC/SG = 540B/1030B | SC/SG = 895B/1700B | |
| T/D/C = 15′/500 m/150 | T/D/C = 5′/500 m/150 | |
| Rural (R) | AC/AG = 100/ 40 | AC/AG = 100/80 |
| SC/SG = 540B/ 1030B | SC/SG = 895B/1700 B | |
| T/D/C = 15′/700 m/220 | T/D/C = 5′/700 m/220 | |
| Feature | IPsec | TLS/SSL |
|---|---|---|
| Authentication | Yes | Yes |
| Integrity | Yes | Yes (More robust, since the HMAC is longer) |
| Confidentiality | Yes (if ESP) | Yes |
| Configuration | Complex | Straightforward |
| Interoperability problems | Yes (NAT) | No |
| TCP apps support | All | Some |
| UDP support | Yes | Only DTLS |
| PKI | No | Yes |
| Compression | Yes | Only OpenSSL |
| Client-specific software | Yes | No |
| Multi-environment support | Some times | Yes |
| Apps filter | No | Yes (VPN support to specific apps) |
| Protocol | Mode | Size (bytes) |
|---|---|---|
| IPSec tunnel mode | ESP | 32 |
| ESP & AH | 44 | |
| IPSec transport mode | ESP | 36 |
| ESP & AH | 48 | |
| TLS/SSL | HMAC-MD5 | 21 |
| HMAC-SHA-1 | 25 | |
| Short-term (SL) | Long-term (LT) | ||||
|---|---|---|---|---|---|
| IPSec | SSL/TLS | IPSec | SSL/TLS | ||
| Urban (U) | Aggr | VNS = 656.25 | VNS = 656.25 | VNS = 4821.65 | VNS = 4821.65 |
| VS = 686.74 | VS = 667.96 | VS = 5047.17 | VS = 4907.11 | ||
| RNS = 96.88% | RNS = 96.88% | RNS = 96.895% | RNS = 96.895% | ||
| RS = 92.58% | RS = 95.18% | RS = 92.56% | RS = 95.207% | ||
| OS = 4.3% | OS = 1.7% | OS = 4.335% | OS = 1.688% | ||
| CNS = 69 | CNS = 69 | CNS = 486 | CNS = 486 | ||
| CS = 70 | CS = 70 | CS = 509 | CS = 493 | ||
| DC = 1 | DC = 1 | DC = 23 | DC = 7 | ||
| FF | VNS = 679.28 | VNS = 679.28 | VNS = 4885.51 | VNS = 4885.51 | |
| VS = 748.89 | VS = 706.48 | VS = 5227.23 | VS = 5018.99 | ||
| RNS = 93.6% | RNS = 93.6% | RNS = 95.628% | RNS = 95.628% | ||
| RS = 84.89% | RS = 90% | RS = 89.38% | RS = 93.085% | ||
| OS = 8.71% | OS = 3.6% | OS = 6.248% | OS = 2.543% | ||
| CNS = 70 | CNS = 70 | CNS = 490 | CNS = 490 | ||
| CS = 79 | CS = 73 | CS = 526 | CS = 500 | ||
| DC = 9 | DC = 3 | DC = 36 | DC = 10 | ||
| Rural (R) | Aggr | VNS = 269.94 | VNS = 269.94 | VNS = 1917.95 | VNS = 1917.95 |
| VS = 282.62 | VS = 274.74 | VS = 2007.61 | VS = 1951.67 | ||
| RNS = 96.86% | RNS = 96.86% | RNS = 96.877% | RNS = 96.877% | ||
| RS = 92.5% | RS = 95.17% | RS = 92.55% | RS = 95.2% | ||
| OS = 4.36% | OS = 1.69% | OS = 4.327% | OS = 1.67% | ||
| CNS = 30 | CNS = 30 | CNS = 193 | CNS = 193 | ||
| CS = 30 | CS = 30 | CS = 203 | CS = 199 | ||
| DC = 0 | DC = 0 | DC = 10 | DC = 6 | ||
| FF | VNS = 276.86 | VNS = 276.86 | VNS = 1943.76 | VNS = 1943.76 | |
| VS = 301.46 | VS = 286.47 | VS = 2080.87 | VS = 2021.04 | ||
| RNS = 94.4% | RNS = 94.4% | RNS = 95.59% | RNS = 95.59% | ||
| RS = 86.7% | RS = 91.27% | RS = 89.29% | RS = 91.9% | ||
| OS = 7.7% | OS = 3.6% | OS = 6.3% | OS = 3.69% | ||
| CNS = 30 | CNS = 30 | CNS = 199 | CNS = 199 | ||
| CS = 33 | CS = 30 | CS = 210 | CS = 206 | ||
| DC = 3 | DC = 0 | DC = 11 | DC = 7 | ||
| Short-term (ST) | Long-term (LT) | |||
|---|---|---|---|---|
| IPSec | TLS/SSL | IPSec | TLS/SSL | |
| Urban (U) | 9 × 12 = 108 | 3 × 12 = 36 | 17 × 12 = 204 | 7 × 12 = 84 |
| 108 × 150 = 16,200 | 36 × 150 = 5400 | 204 × 150 = 30,600 | 84 × 150 = 12,600 | |
| Rural (R) | 3 × 12 = 36 | 0 | 7 × 12 = 84 | 7 × 12 = 84 |
| 36 × 220 = 7920 | 84 × 220 = 18,480 | 84 × 220 = 18,480 | ||
| Short-term (ST) | Long-term (LT) | |||
|---|---|---|---|---|
| Aggr | FF | Aggr | FF | |
| Urban (U) | 0 | 6 × 12 = 72 | 16 × 12 = 192 | 26 × 12 = 312 |
| 72 × 150 = 10,800 | 192 × 150 = 28,800 | 312 × 150 = 46,800 | ||
| Rural (R) | 0 | 3 × 12 = 36 | 4 × 12 = 48 | 4 × 12 = 48 |
| 36 × 220 = 7920 | 48 × 220 = 10,560 | 48 × 220 = 10,560 | ||
| 802.11b | 802.11g | |||
|---|---|---|---|---|
| 1 Mb | 11 Mb | 6 Mb | 54 Mb | |
| EIRP | 19 ± 1.5 dBm | 15 ± 1.5 dBm | ||
| Min = 56.2 mW | Min = 22.387 mW | |||
| Max = 112.2 mW | Max = 44.67 mW | |||
| Sensitivity | −92 dBm | −86 dBm | −84 dBm | −74 dBm |
| Scenarios | Distance (m) | powerSend (mW) | |||
|---|---|---|---|---|---|
| 802.11b 1 Mb | 802.11b 11 Mb | 802.11g 6 Mb | 802.11g 54 Mb | ||
| Urban (U) | 500 | 1.59 < EIRP | 6.35 < EIRP | 10.056 < EIRP | 100.56 > EIRP |
| Rural (R) | 700 | 3.125 < EIRP | 12.44 < EIRP | 19.71 < EIRP | 197.1 > EIRP |
| Parameter | Value | ||
|---|---|---|---|
| GPRS | Delay | 1 μs | |
| Uplink data rate | 26.8 kbps | ||
| Probability of error | 0.001 | ||
| 802.11b | PHY | Carrier frequency | 2.4 GHz |
| Transmitter power | 79.43 mW | ||
| Path loss (α) | 2 | ||
| Sensitivity | −86 dBm | ||
| Bit rate | 11 Mbps | ||
| MAC | Retry limit | 7 | |
| Contention window | 32 | ||
| Short-term (ST) | Long-term (LT) | ||
|---|---|---|---|
| Urban (U) | Theoretical | 2057.6 | 15120 |
| Simulated | (2043.94, 2048.05) | (15070.09, 15077.91) | |
| Rural (R) | Theoretical | 846.22 | 6013.3 |
| Simulated | (843.54, 845.79) | (6011.81, 6012.32) | |
| Short-term (ST) | Long-term (LT) | ||
|---|---|---|---|
| Urban (U) | Theoretical | TCNTR = 73.477 < 900 | TCNTR = 179.93 < 300 |
| Simulated | (77.41, 78.93) | (190.18, 191.28) | |
| Rural (R) | Theoretical | TCNTR = 30.224 < 900 | TCNTR = 71.564 < 300 |
| Simulated | (31.67, 32.37) | (75.47, 76.12) | |
© 2014 by the authors; licensee MDPI, Basel, Switzerland. This article is an open access article distributed under the terms and conditions of the Creative Commons Attribution license ( http://creativecommons.org/licenses/by/3.0/).
Share and Cite
López, G.; Moura, P.; Moreno, J.I.; Camacho, J.M. Multi-Faceted Assessment of a Wireless Communications Infrastructure for the Green Neighborhoods of the Smart Grid. Energies 2014, 7, 3453-3483. https://doi.org/10.3390/en7053453
López G, Moura P, Moreno JI, Camacho JM. Multi-Faceted Assessment of a Wireless Communications Infrastructure for the Green Neighborhoods of the Smart Grid. Energies. 2014; 7(5):3453-3483. https://doi.org/10.3390/en7053453
Chicago/Turabian StyleLópez, Gregorio, Pedro Moura, José Ignacio Moreno, and José Manuel Camacho. 2014. "Multi-Faceted Assessment of a Wireless Communications Infrastructure for the Green Neighborhoods of the Smart Grid" Energies 7, no. 5: 3453-3483. https://doi.org/10.3390/en7053453