Proof-of-Concept of a Zinc-Silver Battery for the Extraction of Energy from a Concentration Difference

Abstract
: The conversion of heat into current can be obtained by a process with two stages. In the first one, the heat is used for distilling a solution and obtaining two flows with different concentrations. In the second stage, the two flows are sent to an electrochemical cell that produces current by consuming the concentration difference. In this paper, we propose such an electrochemical cell, working with water solutions of zinc chloride. The cell contains two electrodes, made respectively of zinc and silver covered by silver chloride. The operation of the cell is analogous to that of the capacitive mixing and of the “mixing entropy battery”: the electrodes are charged while dipped in the concentrated solution and discharged when dipped in the diluted solution. The cyclic operation allows us to extract a surplus of energy, at the expense of the free energy of the concentration difference. We evaluate the feasibility of such a cell for practical applications and find that a power up to 2 W per m2 of the surface of the electrodes can be achieved.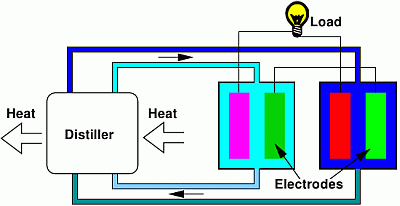
1. Introduction
Salinity gradient power (SGP) is the production of renewable and clean power from naturally available water reservoirs with different salinity [1–3], e.g., river and sea water. SGP techniques can also be applied to solutions of salts, different from sodium chloride, whose concentration difference is produced by means of distillation [4,5]. In the present paper, we focus on zinc chloride solutions.
The two most mature SGP techniques [6] are “pressure-retarded osmosis” (PRO) [7–10], based on semi-permeable membranes, and “reverse electrodialysis” (RED) [11–13], based on ion-exchange membranes. Other techniques, such as the “vapor pressure” method [14], have been proposed.
A new, promising family of electrochemical techniques has been recently introduced. The “capacitive mixing” (CAPMIX) technique [15] makes use of activated carbon electrodes, either directly dipped into the solution [16–18] or covered by perm-selective membranes [19–23]. Battery electrodes undergoing redox reactions are used in the “mixing entropy battery” [4,24] and in the concentration cell proposed in [25]. Since capacitors and batteries are collectively called accumulators, this family of techniques will be called “accumulator mixing” (AccMix). The device described in the present paper (see Section 2) belongs to this family, being based on zinc and silver/silver chloride electrodes dipped into a zinc chloride solution, already described as a secondary battery [26]. The zinc electrodes are widely used in secondary batteries, e.g., in silver oxide-zinc cells [27] and in zinc-bromine flow batteries [28]. Silver/silver chloride electrodes are generally used in association with magnesium electrodes [29].
The application of SGP techniques to artificially produced concentration differences has been limited, up to now, by the recovery of by-products of other processes [30,31] or even wastes, such as CO2 [32]. Recently, it has also been proposed to use an SGP device in a closed cycle in which the concentration difference is obtained by means of distillation [4,5]; see Figure 1. The whole process is actually a heat-to-current converter working in a closed cycle with respect to the solutions.
Such a thermoelectric conversion can be used for producing electrical energy from low- and medium-temperature heat sources, for example, solar concentrators working with so-called non-imaging optics [33,34], co-generation [35] and the recovery of waste heat from industrial processes. The proposed technique thus contributes to renewable and clean energy production.
Thermoelectric conversion is usually performed by means of heat engines, e.g., Stirling motors [36,37] or organic Rankine cycle [38] turbines, or by means of solid-state modules based on the Seebeck effect [39–41]. However, the thermoelectric energy production from low- and medium-temperature sources is an active research field, in which innovative solutions are studied (see, for example [42]).
Figure 1 shows a sketch of the whole device. The first stage is aimed at the regeneration of the salinity difference, by means of a distiller. The second stage is constituted by the electrochemical cell that uses the salinity difference for producing energy; this will constitute the subject of the present paper. The description of the first stage of the process is not in the scope of the present paper and was already discussed in [5]; here, we briefly summarize the relevant results. We have shown that the use of solutions with a high boiling point elevation leads to a high overall efficiency of the energy conversion. For example, by making use of sodium hydroxide, the efficiency of the global process was theoretically estimated, on general thermodynamical grounds, to be of the order of 15%. The present paper focuses on another promising electrolyte, i.e., zinc chloride. Indeed, in such a case, on the one hand, the solute presents a high solubility and gives a high boiling point elevation (see Section 3.1); on the other hand, the conversion of the salinity difference into electrical energy can be achieved by means of the efficient zinc-silver AccMix cell that is described in the present paper.
Another relevant feature of a heat-to-current converter working with zinc chloride solution is that it can easily work with low-temperature heat sources, i.e., in the range 80–130 °C, as will be shown in Section 2. Therefore, this technique can become a promising one, with a wide range of applications, including solar energy production with thermal collectors [33,34,43], the recovery of waste heat from industrial processes and the cogeneration of electrical current and heat for domestic uses [44,45]. Such techniques are particularly appealing for small-scale applications and can become competitive with the state-of-the art solutions. It is worth noting that a two-stage heat-to-current converter, involving the distillation of an ammonia/CO2 solution and a pressure-retarded osmosis device, has been proposed [46].
The objective of the present study is to present a proof-of-concept of the zinc-silver AccMix cell, aimed at the evaluation of the feasibility and of the actual performances in terms of energy efficiency and power production. The AccMix cell is described in Section 2. The boiling point and its relation with the overall efficiency and the specific free energy of the solution, is discussed in Section 3.1. The equilibrium cell voltage is discussed in Section 3.2. The discussion of the kinetics and the measurement of the power production is presented in Section 3.3. In Section 3.4, we report some unwanted effects, leading to a reduction of the power production, which have been observed in some cases, but which can be avoided by operating the cell in a suitable regime.
2. Experimental Section
In this section, we describe the implementation of an unusual SGP cell working with a zinc chloride solution, a good candidate for the closed-cycle heat-to-current converter based on SGP technology. The cell is operated with AccMix cycles and is inspired by the electrodes used in the batteries with the highest power density, such as the silver oxide-zinc [27] and zinc-bromine [28] secondary batteries and magnesium-silver/silver chloride primary batteries [29].
Figure 1 shows a couple of AccMix cells, one for each of the two flows at different concentrations. The voltages of the two cells are different, due to the different chemical potentials of the ions in the two solutions. For this reason, a current will flow through the load. This current cannot flow indefinitely, because the electrodes in the cell at a lower concentration will be continuously consumed, and simultaneously, the ions will deposit on the electrodes in the higher concentration cell. For this reason, the flows must be cyclically exchanged.
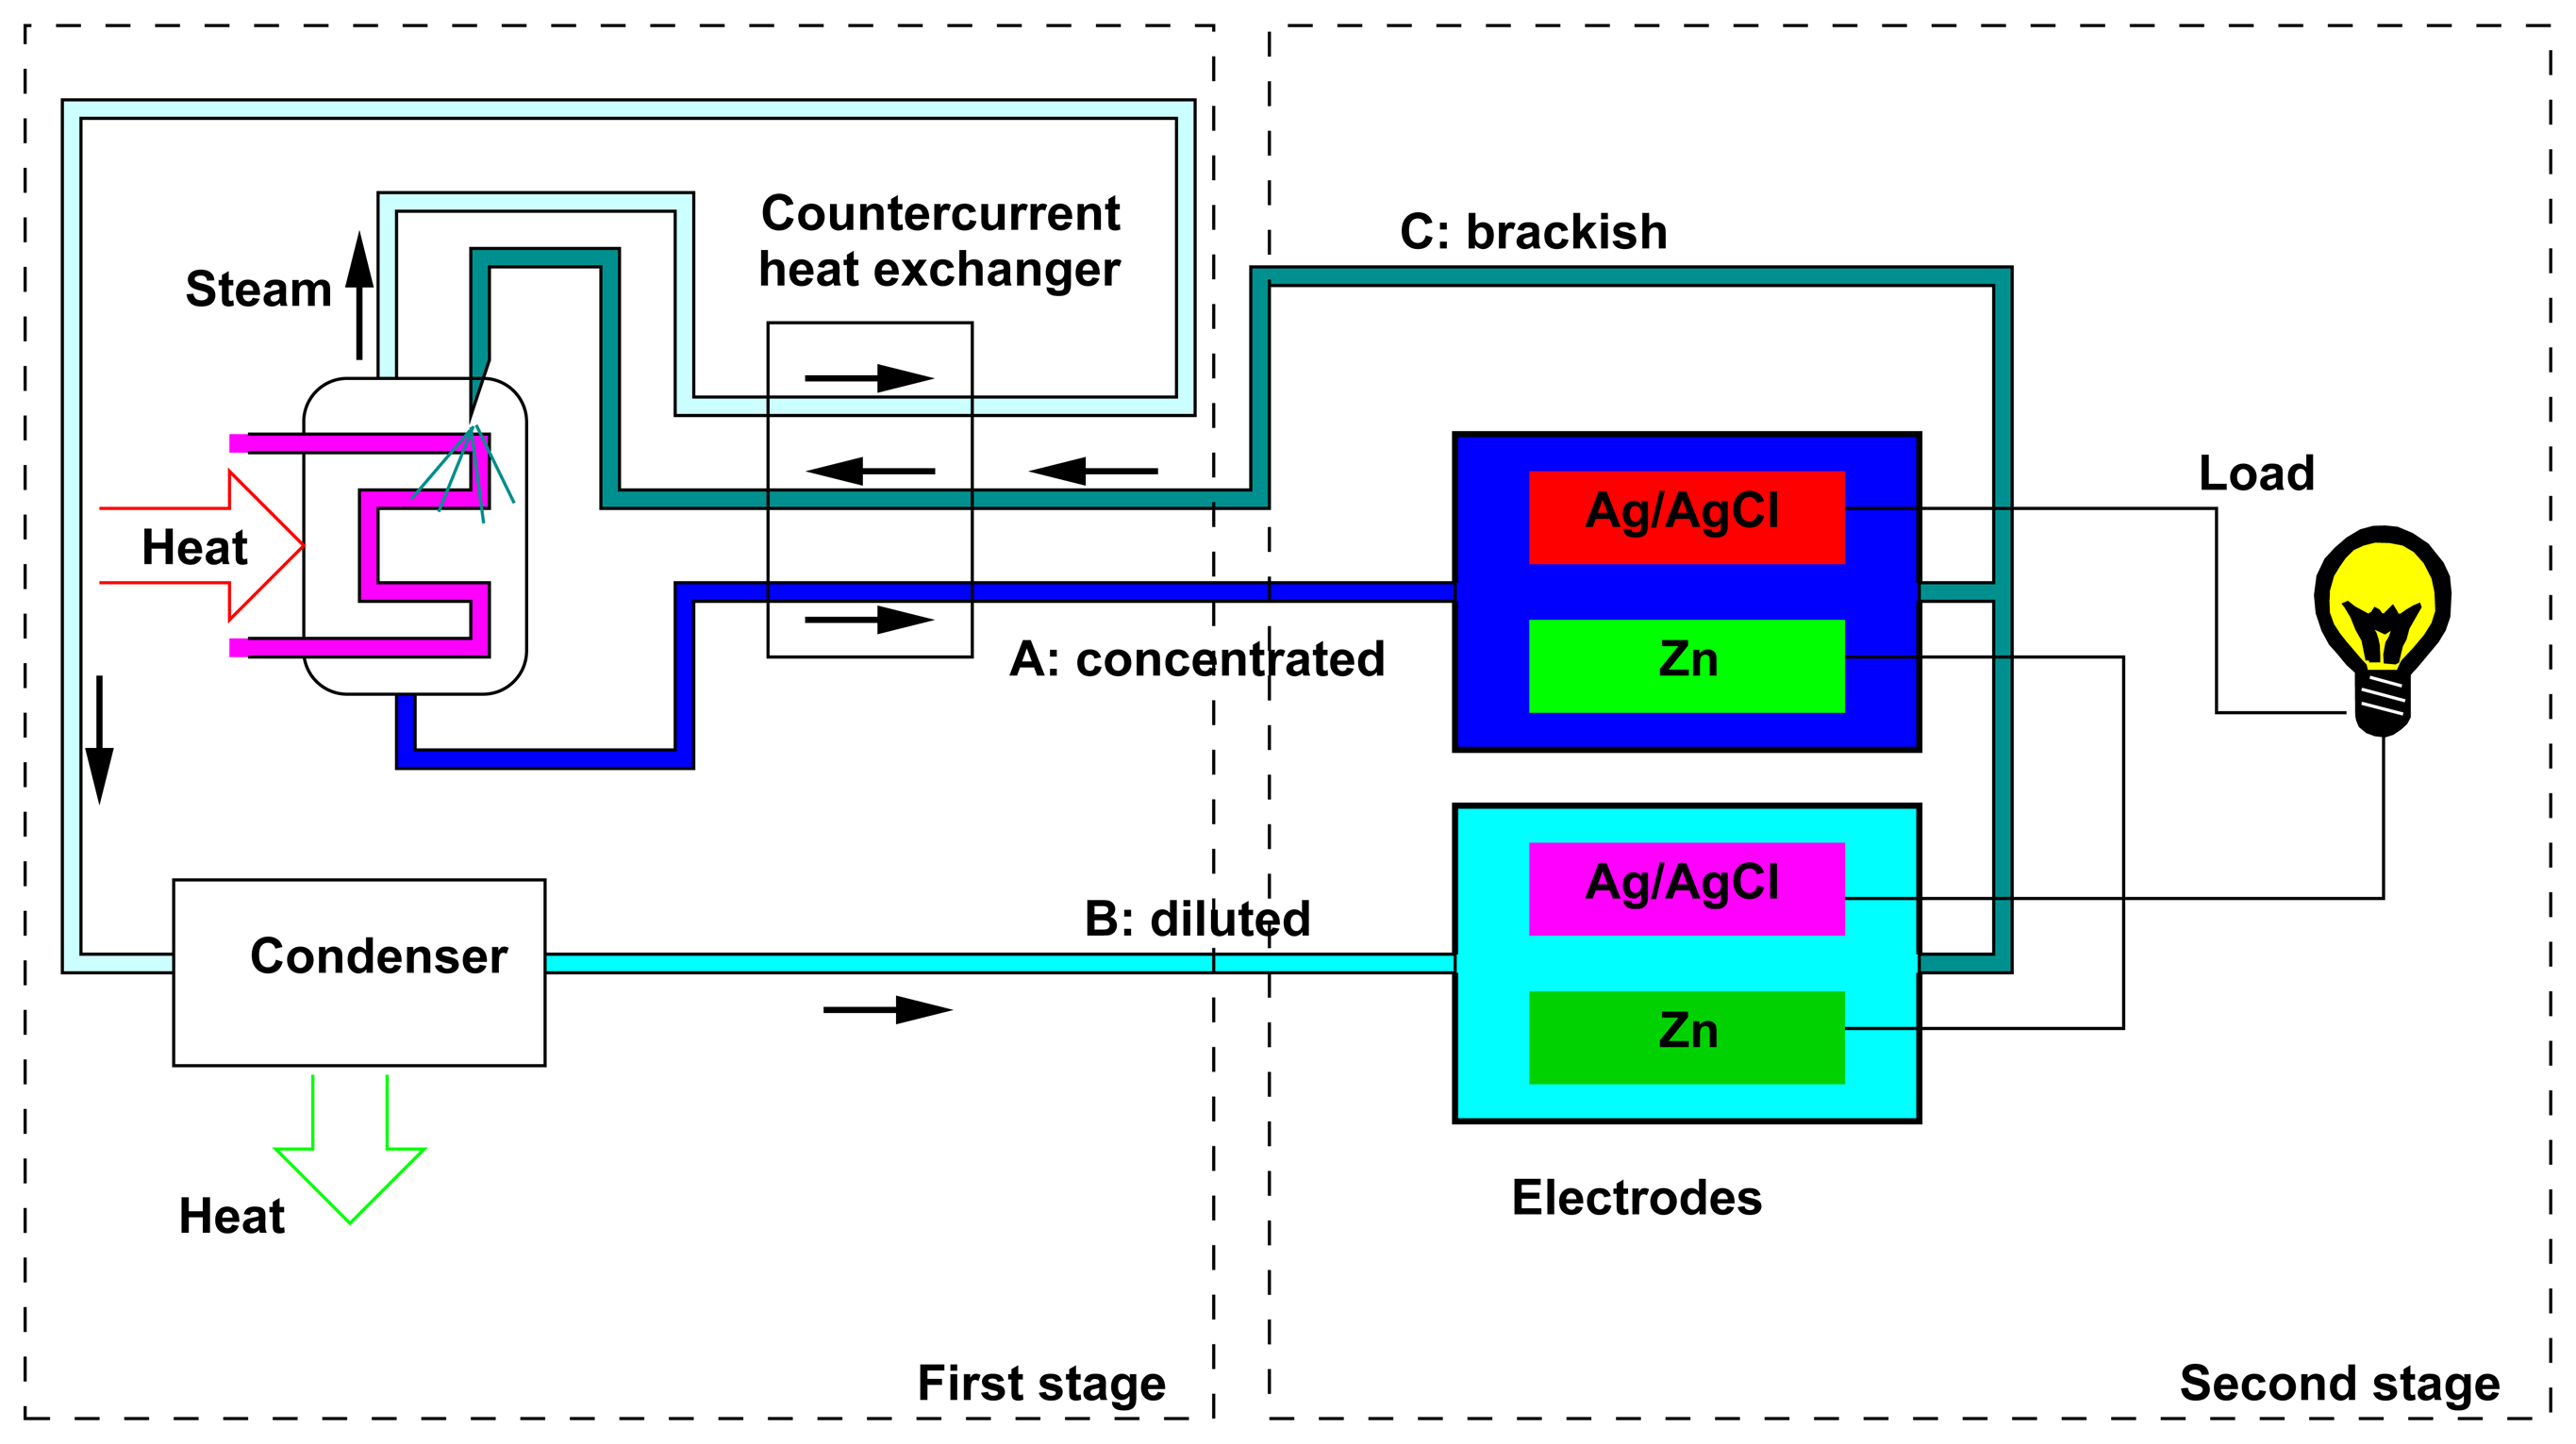
Focusing on one of the cells, the cycle is shown in Figure 2. Each cell will thus undergo an AccMix cycle, analogous to the cycles seen in CAPMIX and in the “entropy mixing batteries”.
The energy comes from the voltage rise that takes place when the solution concentration is changed, which is given by Nernst equation: the charge is put into the cell at a lower voltage than that at which it is then extracted. We have shown that the voltage is connected with the adsorption of the solute during the step of the cycle in concentrated solution and its release in the diluted solution [47]: the mixing is actually mediated by the temporary adsorption of the ions inside the electrodes. The energy is extracted at the expense of the concentration difference.
The AccMix cell is basically an accumulator, i.e., a battery or a supercapacitor, because it must accumulate the charge during Step A and give it back during Phase C. However, not all of the battery electrodes feature a voltage rise, i.e., a change of voltage upon concentration changes or, equivalently [47], an adsorption of ions during the charge or discharge step. For example, in a usual lithium ion battery, the lithium ions are released by one electrode and adsorbed by the other, both in the charge and discharge steps, and thus, the current flow does not induce a net release or adsorption of ions in the electrodes. For this reason, in the case of the AccMix cell that has been proposed for lithium chloride solutions, the manganese oxide (a typical positive electrode for lithium-ion batteries) has been coupled to a silver/silver chloride electrode, which interacts with chlorine ions [4]. During the charge, sodium and chlorine ions are adsorbed into the electrodes, and they are later released during the discharge.
It is worth noting that the cell voltage, i.e., the potential difference between the electrodes, has no relevance in AccMix cycles. Indeed, there would be a technological advantage in having a cell voltage close to zero or even that the cell voltage changes polarity upon the concentration change [48].
In order to find good electrodes for the zinc chloride solution, we can profit from the wide literature about rechargeable batteries. However, the requisites of our electrochemical cell are different from the requisites of a usual rechargeable battery. The energy that is extracted in each cycle is of the order of Q ΔV, where Q is the charge that is exchanged in each cycle, and the voltage rise ΔV is quite small (of the order of a fraction of one V). For this reason, the losses must be extremely small. Some of the requirements are:
- (1)
The electrical charge efficiency of the charge/discharge cycles must be excellent: low self-discharge, i.e., low electrical charge leakage (it is an issue mainly for the supercapacitors electrodes based on activated carbon in the “capacitive double layer expansion” (CDLE) technique).
- (2)
The energy efficiency of the charge/discharge cycles must be extremely high: low overvoltage.
- (3)
An extremely high number of cycles.
For reaching these parameters, we must use charge and discharge currents that are much less than the currents usually applied in rechargeable batteries and apply them for much shorter times. It is thus necessary to study the behavior of the cells under very unusual conditions and such information is often lacking in the literature.
In the AccMix cell presented in this paper, one of the electrodes is a zinc foil and the other is a silver foil or felt covered with silver chloride. The electrolyte is a water solution of zinc chloride, concentrated and diluted as necessary in Steps A and C.
The interest in such an electrochemical cell stems from the fact that a cell with similar electrodes is used as a primary battery, with an excellent power density. A second reason of interest is that zinc chloride has an extremely high solubility in water and leads to a very high boiling point elevation. This property is connected with the high efficiency of the whole energy conversion cycle [5].
The electrodes are 0.1 mm-thick 1 × 1 cm foils (Alfa Aesar). The silver electrode is covered by silver chloride by means of anodization [49], which is performed at 3 mA in a 3 M sodium chloride solution for 1 hour. As an alternative, silver wool, made of 100 μm wires, is employed; before the anodization, it is shaped as a 1 × 1 cm felt, around 1 mm thick.
The electrodes are kept at a distance of 0.6 mm, spaced by means of two nylon wires, and clamped between two current collectors made of graphite slabs 1 mm thick.
The solutions are obtained by dissolving zinc chloride (Alfa Aesar) in deionized water. We observed that different solutions, obtained with less pure salts from various producers, have different pH, probably due to the strong effect of impurities. In order to simplify the comparison, we decided to adjust the pH of the solution, by adding 0.37% in mass of HCl. In the case of the salt from Alfa Aesar, the pH of the 68% solution decreases from about 2 to 1. The addition of HCl also has the side effect of decreasing the turbidity of the solutions, which is observed at concentrations between 10% and 60% of ZnCl2.
The flow of solutions is obtained by means of two peristaltic pumps, connected with the high- and low-concentration solution reservoirs. The outlets of the pumps are connected together just before the cell input; the flow of the solution takes place parallel to the wires used as spacers. The pumps are activated sequentially during the cycle, in order to deliver the high- and low-concentration solutions during the different phases. The flow is continuous, at 0.5 cm3/s, during the whole phase. In the present experiment, the output flow is discarded: this actually represents a simplification of the experimental setup with respect to a real device, in which a recirculation of the solutions must take place.
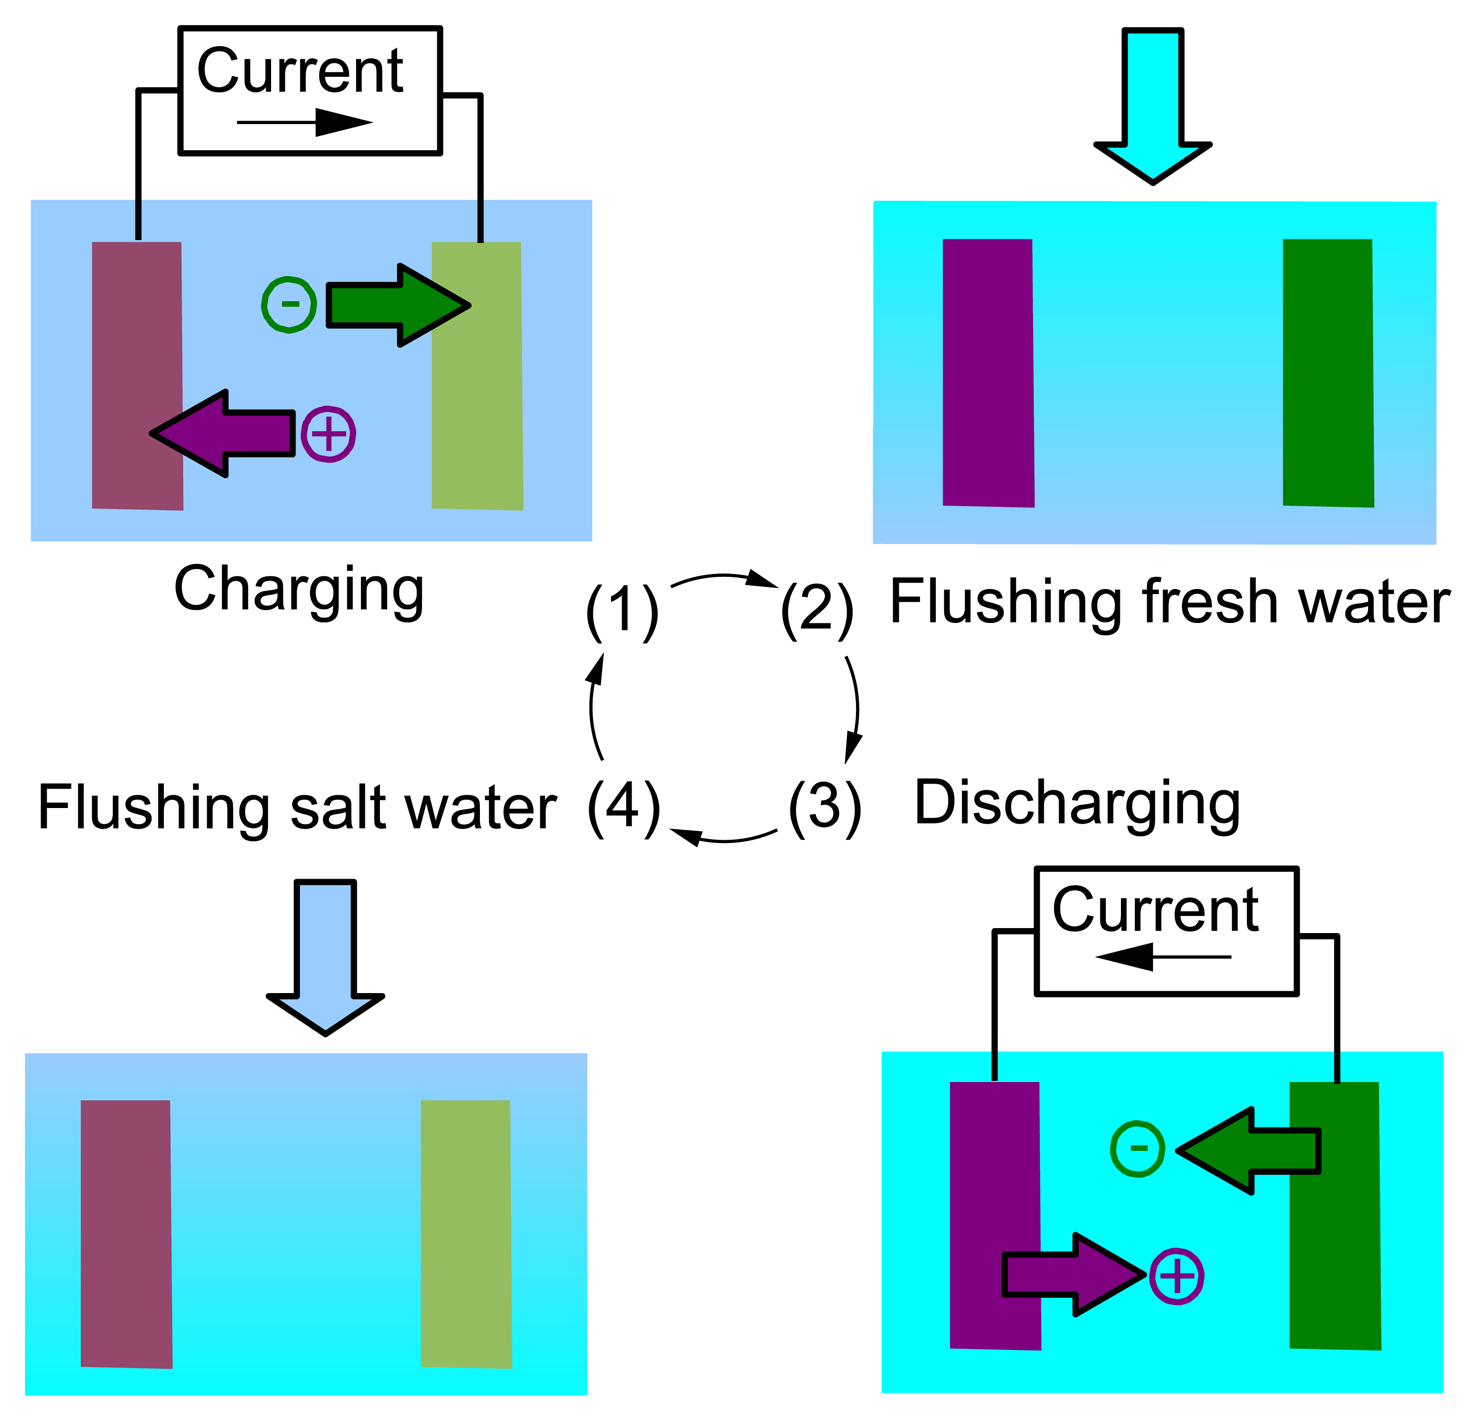
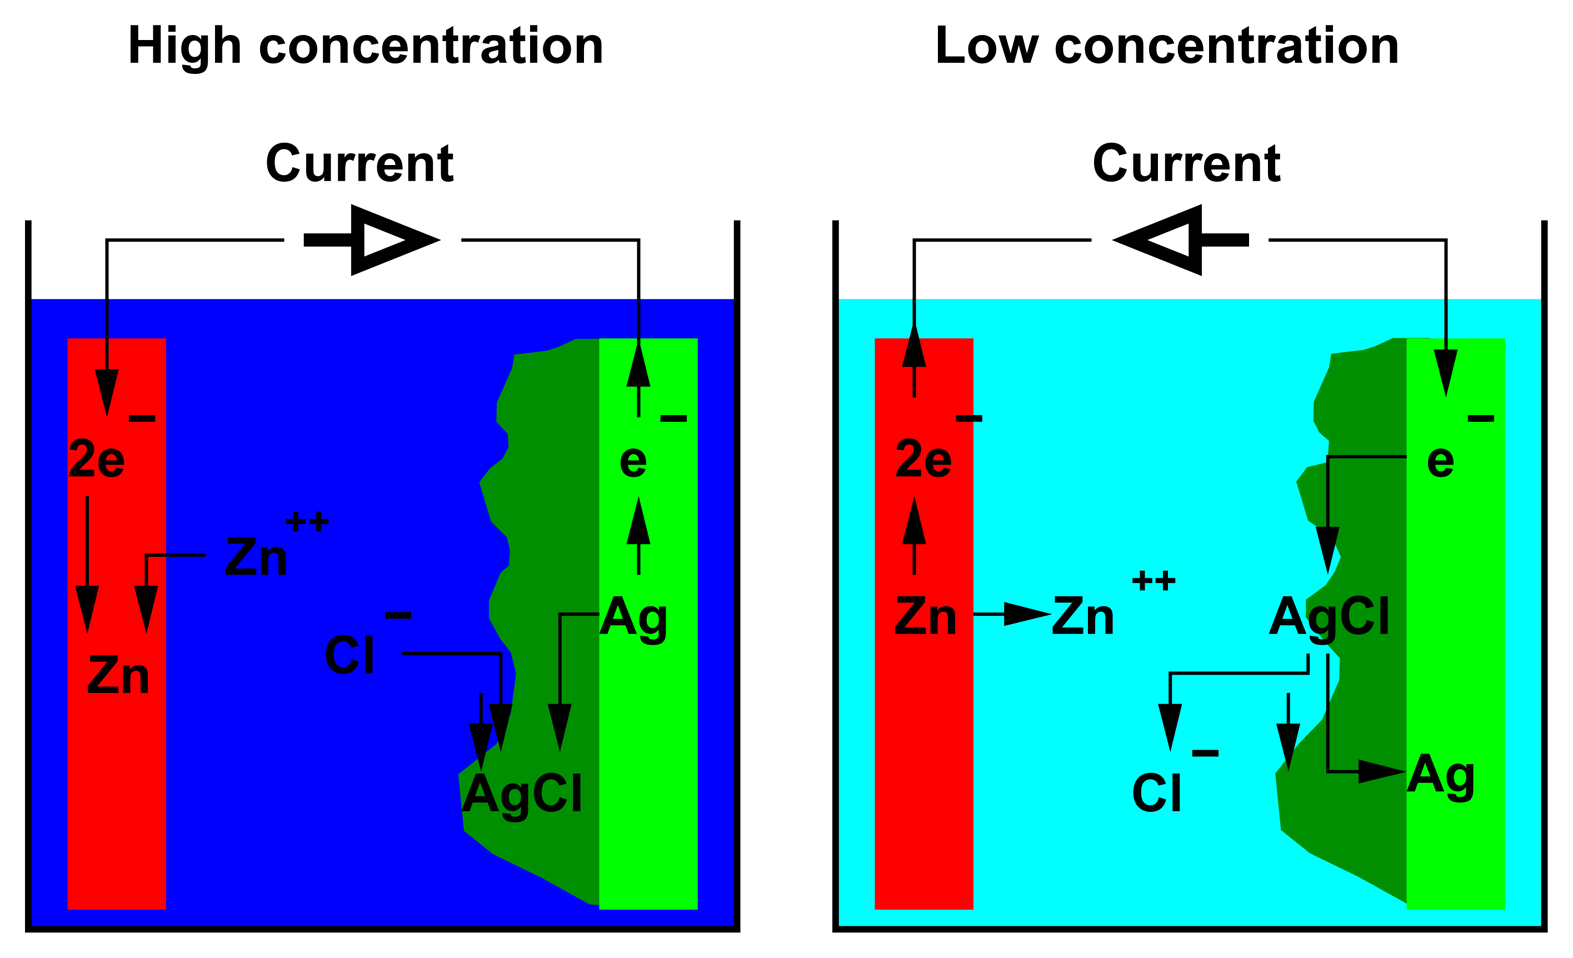
The reactions taking place in the cell during the AccMix cycle are shown in Figure 3. The charging step (passive phase) takes place when the cell is filled with the more concentrated solution. The current flows from the zinc electrode to the silver electrode. On the zinc electrode, zinc ions from the solution are reduced to metallic zinc. The silver electrode is oxidized, releasing silver ions that immediately precipitate, forming a silver chloride porous film on the surface of the electrode. The discharging step (active phase) takes place when the cell is filled with the less concentrated solution. The current flows from the silver electrode to the zinc electrode. The zinc electrode is oxidized, and the zinc ions are released into the solution. The silver chloride on the surface of the silver electrode is reduced, giving metallic silver and releasing chloride ions into the solution.
It is evident that zinc chloride is temporarily stored in the electrodes during the step in a higher concentration and is later released into the less concentrated solution: we are actually performing an accumulator-mediated mixing, i.e., an AccMix cycle. This implies [47] that the cell, along the cycle, produces energy.
The traditional scheme of the AccMix cell [4,16] refers to a single cell, which is filled in different phases with the two solutions at different concentrations. In a real working prototype, it will be useful to use a couple of cells, performing cycles at 180°, as shown in Figure 1. In this way, one of the cells produces energy, part of which is consumed by the other. However, since the electrodes undergo accumulation or dissolution, the solution flows must be periodically exchanged, in order to invert the accumulation and dissolution; it is thus clear that the energy production is actually obtained, also in this case, by an AccMix cycle. In other words, the couple of cells is analogous to a mechanical engine with two cylinders and pistons: the active phase of one section of the engine drives the passive phases of the other section, but the energy production can be, however, evaluated by studying a single cylinder and piston. Indeed, this is what we show in Figure 3; in the present paper, we make experiments on a single cell.
3. Results and Discussion
3.1. Boiling Point Elevation
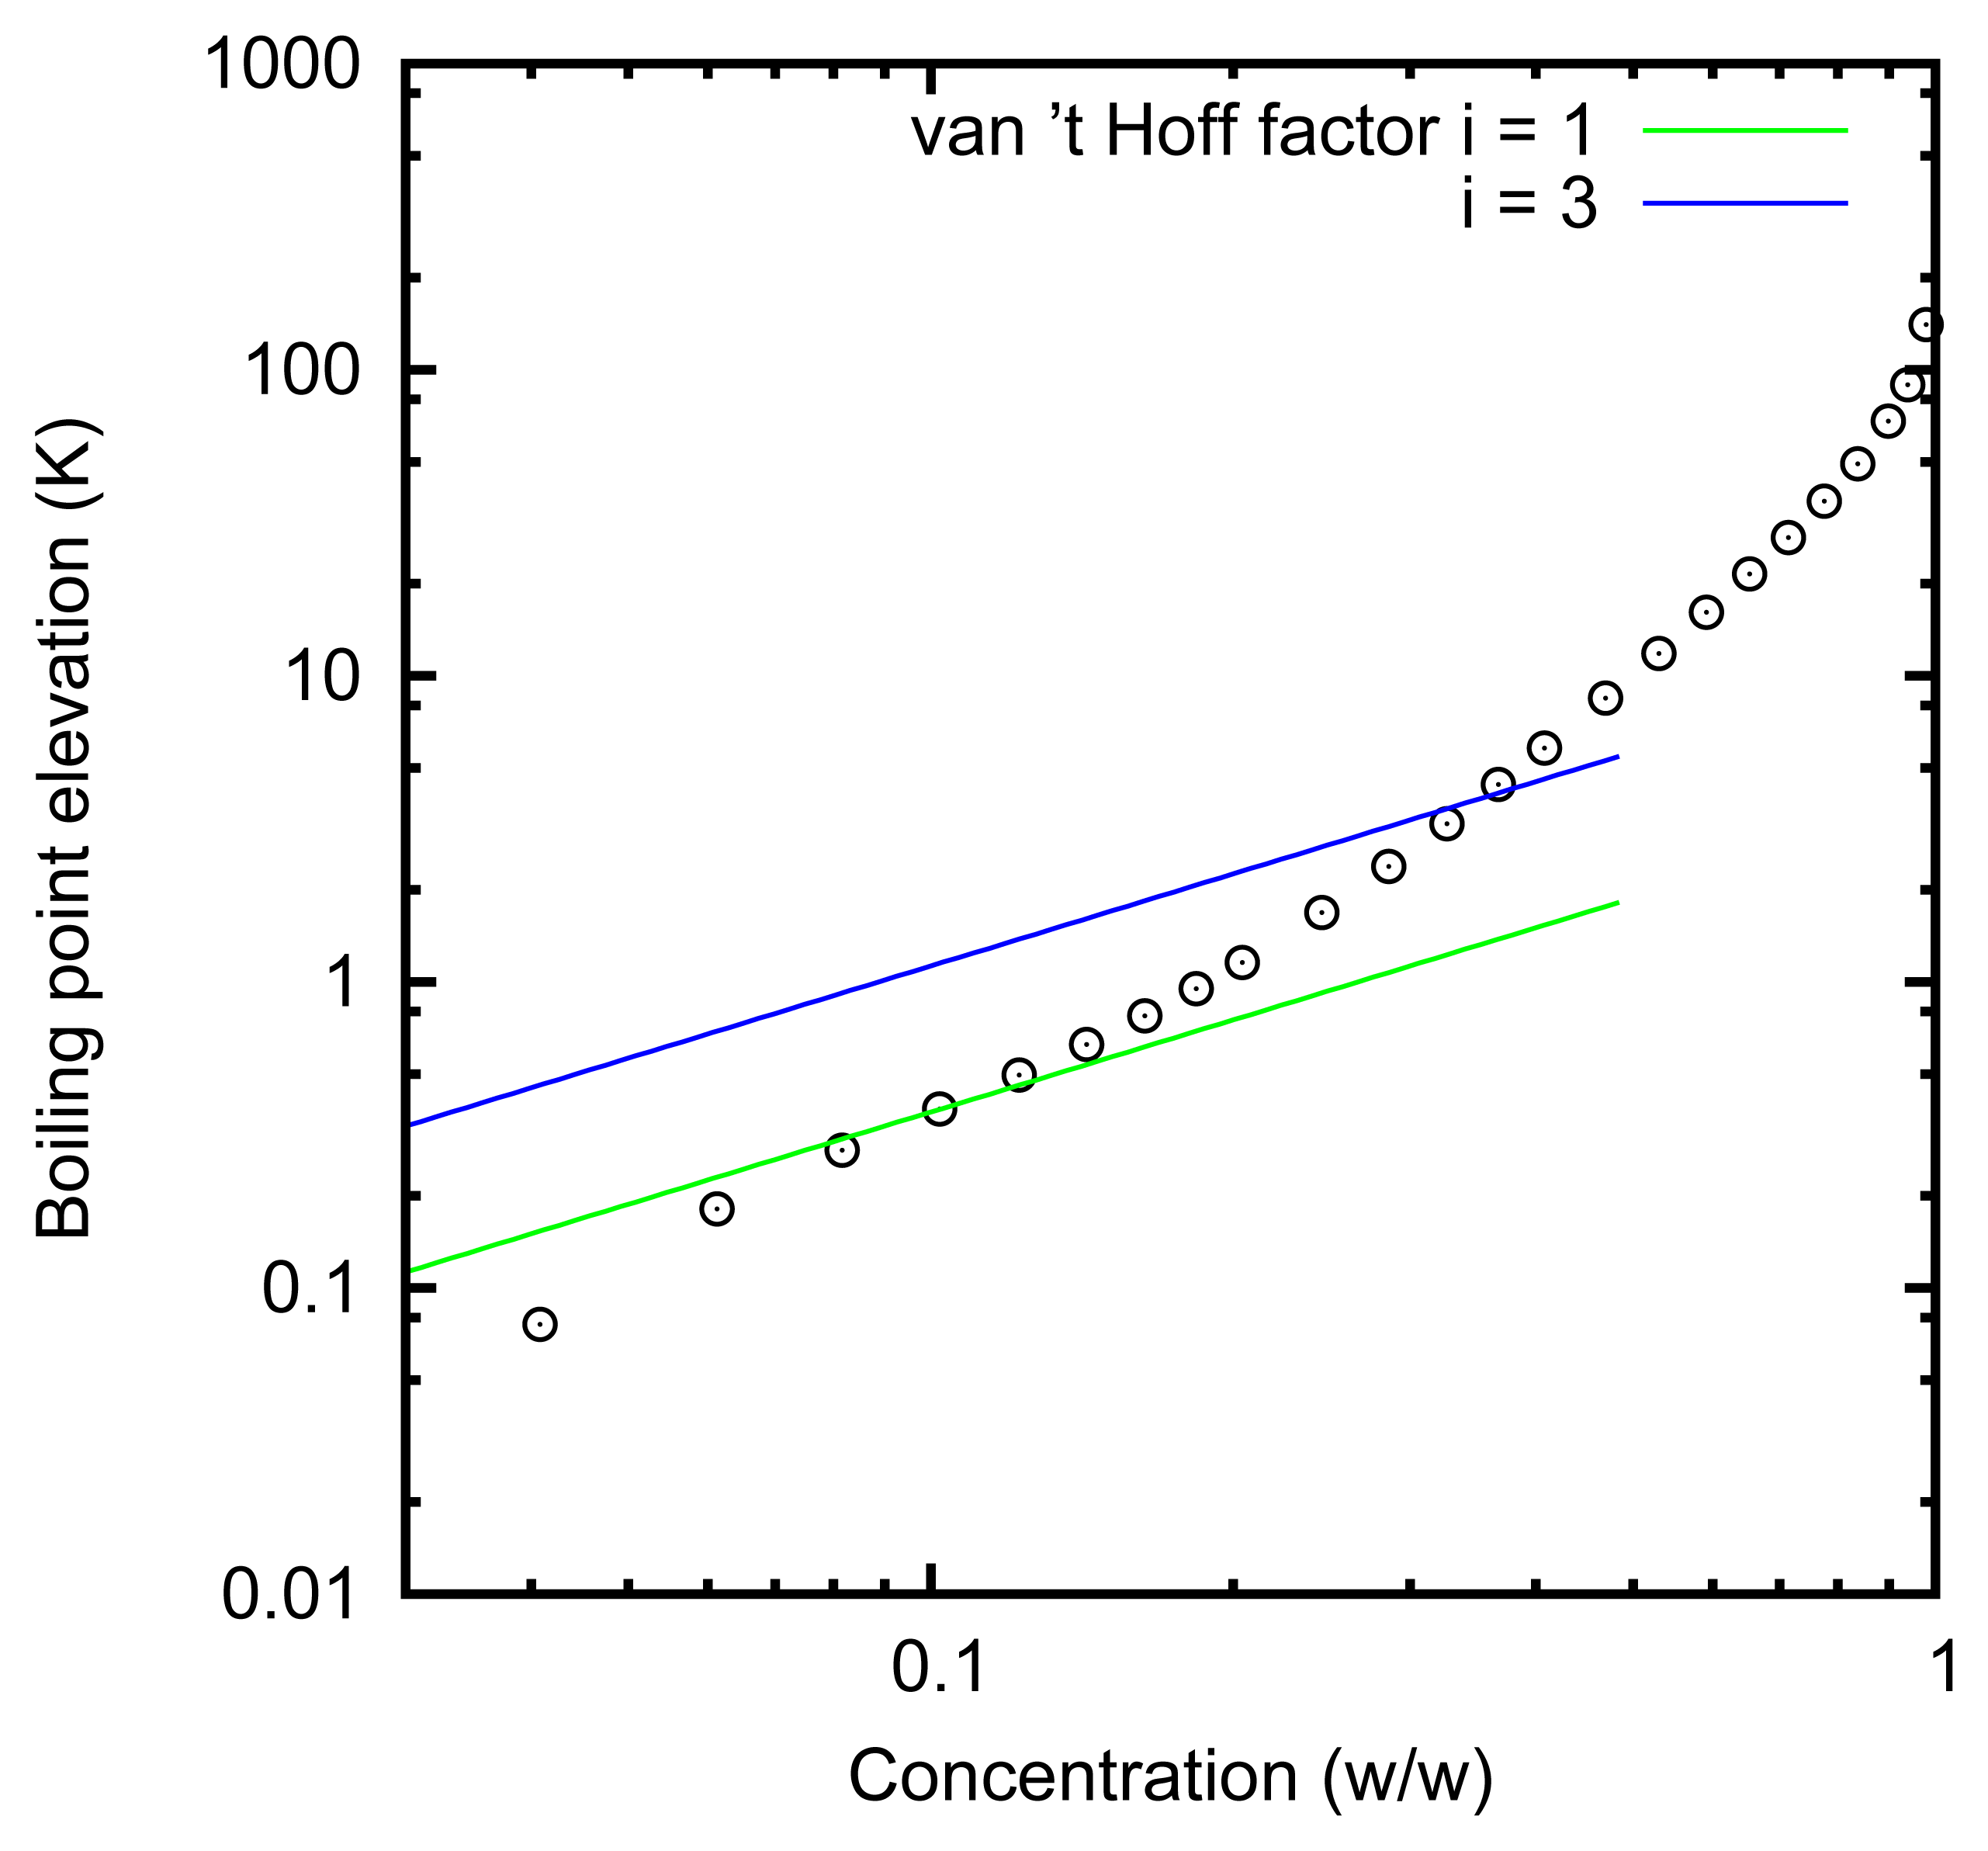
The choice of the solution, i.e., zinc chloride in water, is based on the evaluation of the overall efficiency of the conversion of heat into current. Indeed, as already recalled, in [5], it was shown that, in order to increase the efficiency, a solute with a high boiling point elevation should be preferred [5]. The elevation of the boiling temperature of solutions of zinc chloride in water is reported in Figure 4 (data provided by Italshell [50]). In this graph, and throughout this paper, the concentration is reported as the ratio between the mass of zinc chloride with respect to the total mass of the solution. The boiling point elevation that can be obtained is quite high, and thus, this solution is promising. For ideal solutions, the boiling point elevation is expected to be Kbbsolutei, where Kb is the ebullioscopic constant (0.512 K kg/mol) for water, bsolute is the molality of the solute and i is the van’t Hoff factor. This formula predicts the linear dependence of the boiling point elevation at low concentrations. Instead, the actual boiling point elevation increases much more than linearly. This effect can be explained by assuming activity coefficients significantly different from one and considering that the zinc chloride forms complexes.
Working with solutions at about 0% and 80%, we expect a theoretical efficiency of 10% with a single-effect distiller [5]. Working at atmospheric pressure, the solution evaporates at 140 °C and condenses at 100 °C. However, the pressure can be reduced, as usual in distillation plants, so that the two temperatures become, respectively, around 80 and 45 °C. An actual thermal device, reaching the above-mentioned efficiency, has been designed by Italschell [50].
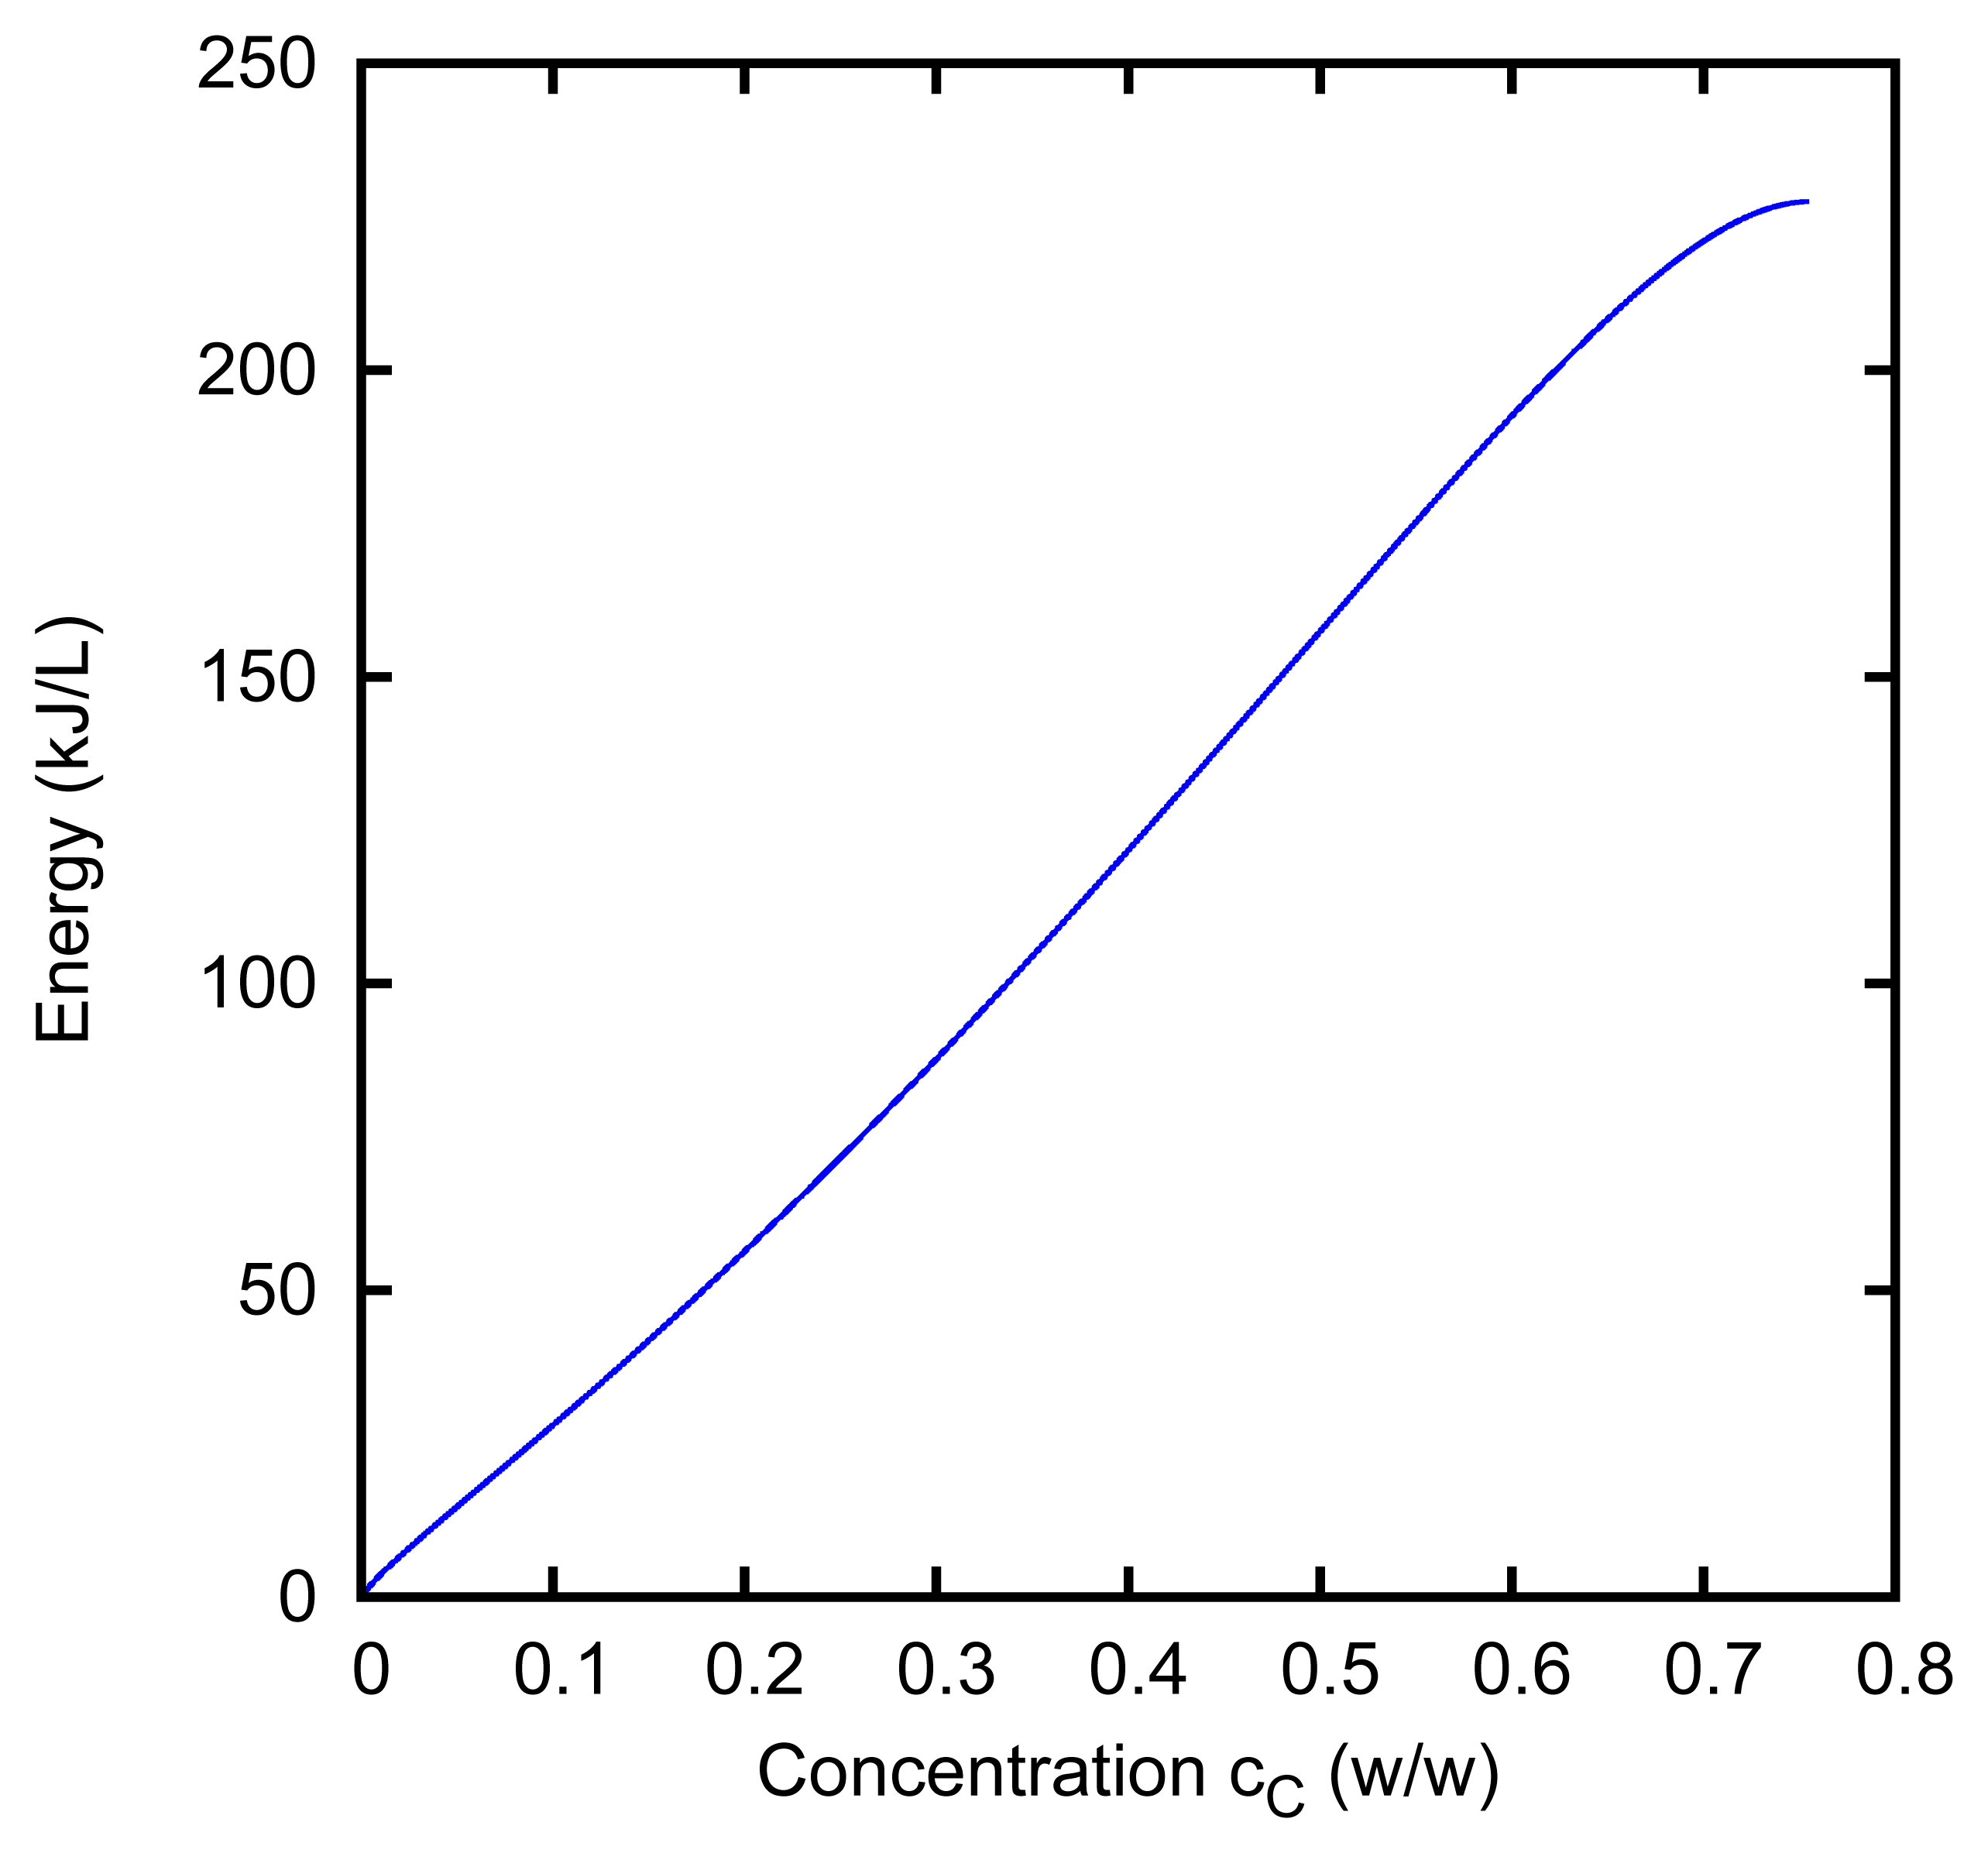
The boiling temperature as a function of the concentration allows us to evaluate the free energy of the solution [5]. The free energy that is lost by the solutions, during the AccMix cycle, is converted into electrical current. An ideal way to operate the cell, for which the efficiency of this conversion could reach the maximum theoretical value, is the following. The flow rate of the concentrated solution, at concentration cA, is so high, that its concentration does not change significantly during its passage through the cell, so that cD ≈ cA. The other flow from the distiller is pure water, cB = 0, and the solution exits from the cell at concentration cC. The reduction of free energy, corresponding to the electrical energy that could be extracted by means of such an ideal cycle per liter of solvent in the diluted solution, is shown in Figure 5 as a function of cC, for cA = cD = 75.5%.
3.2. Cell Voltage and Voltage Rise
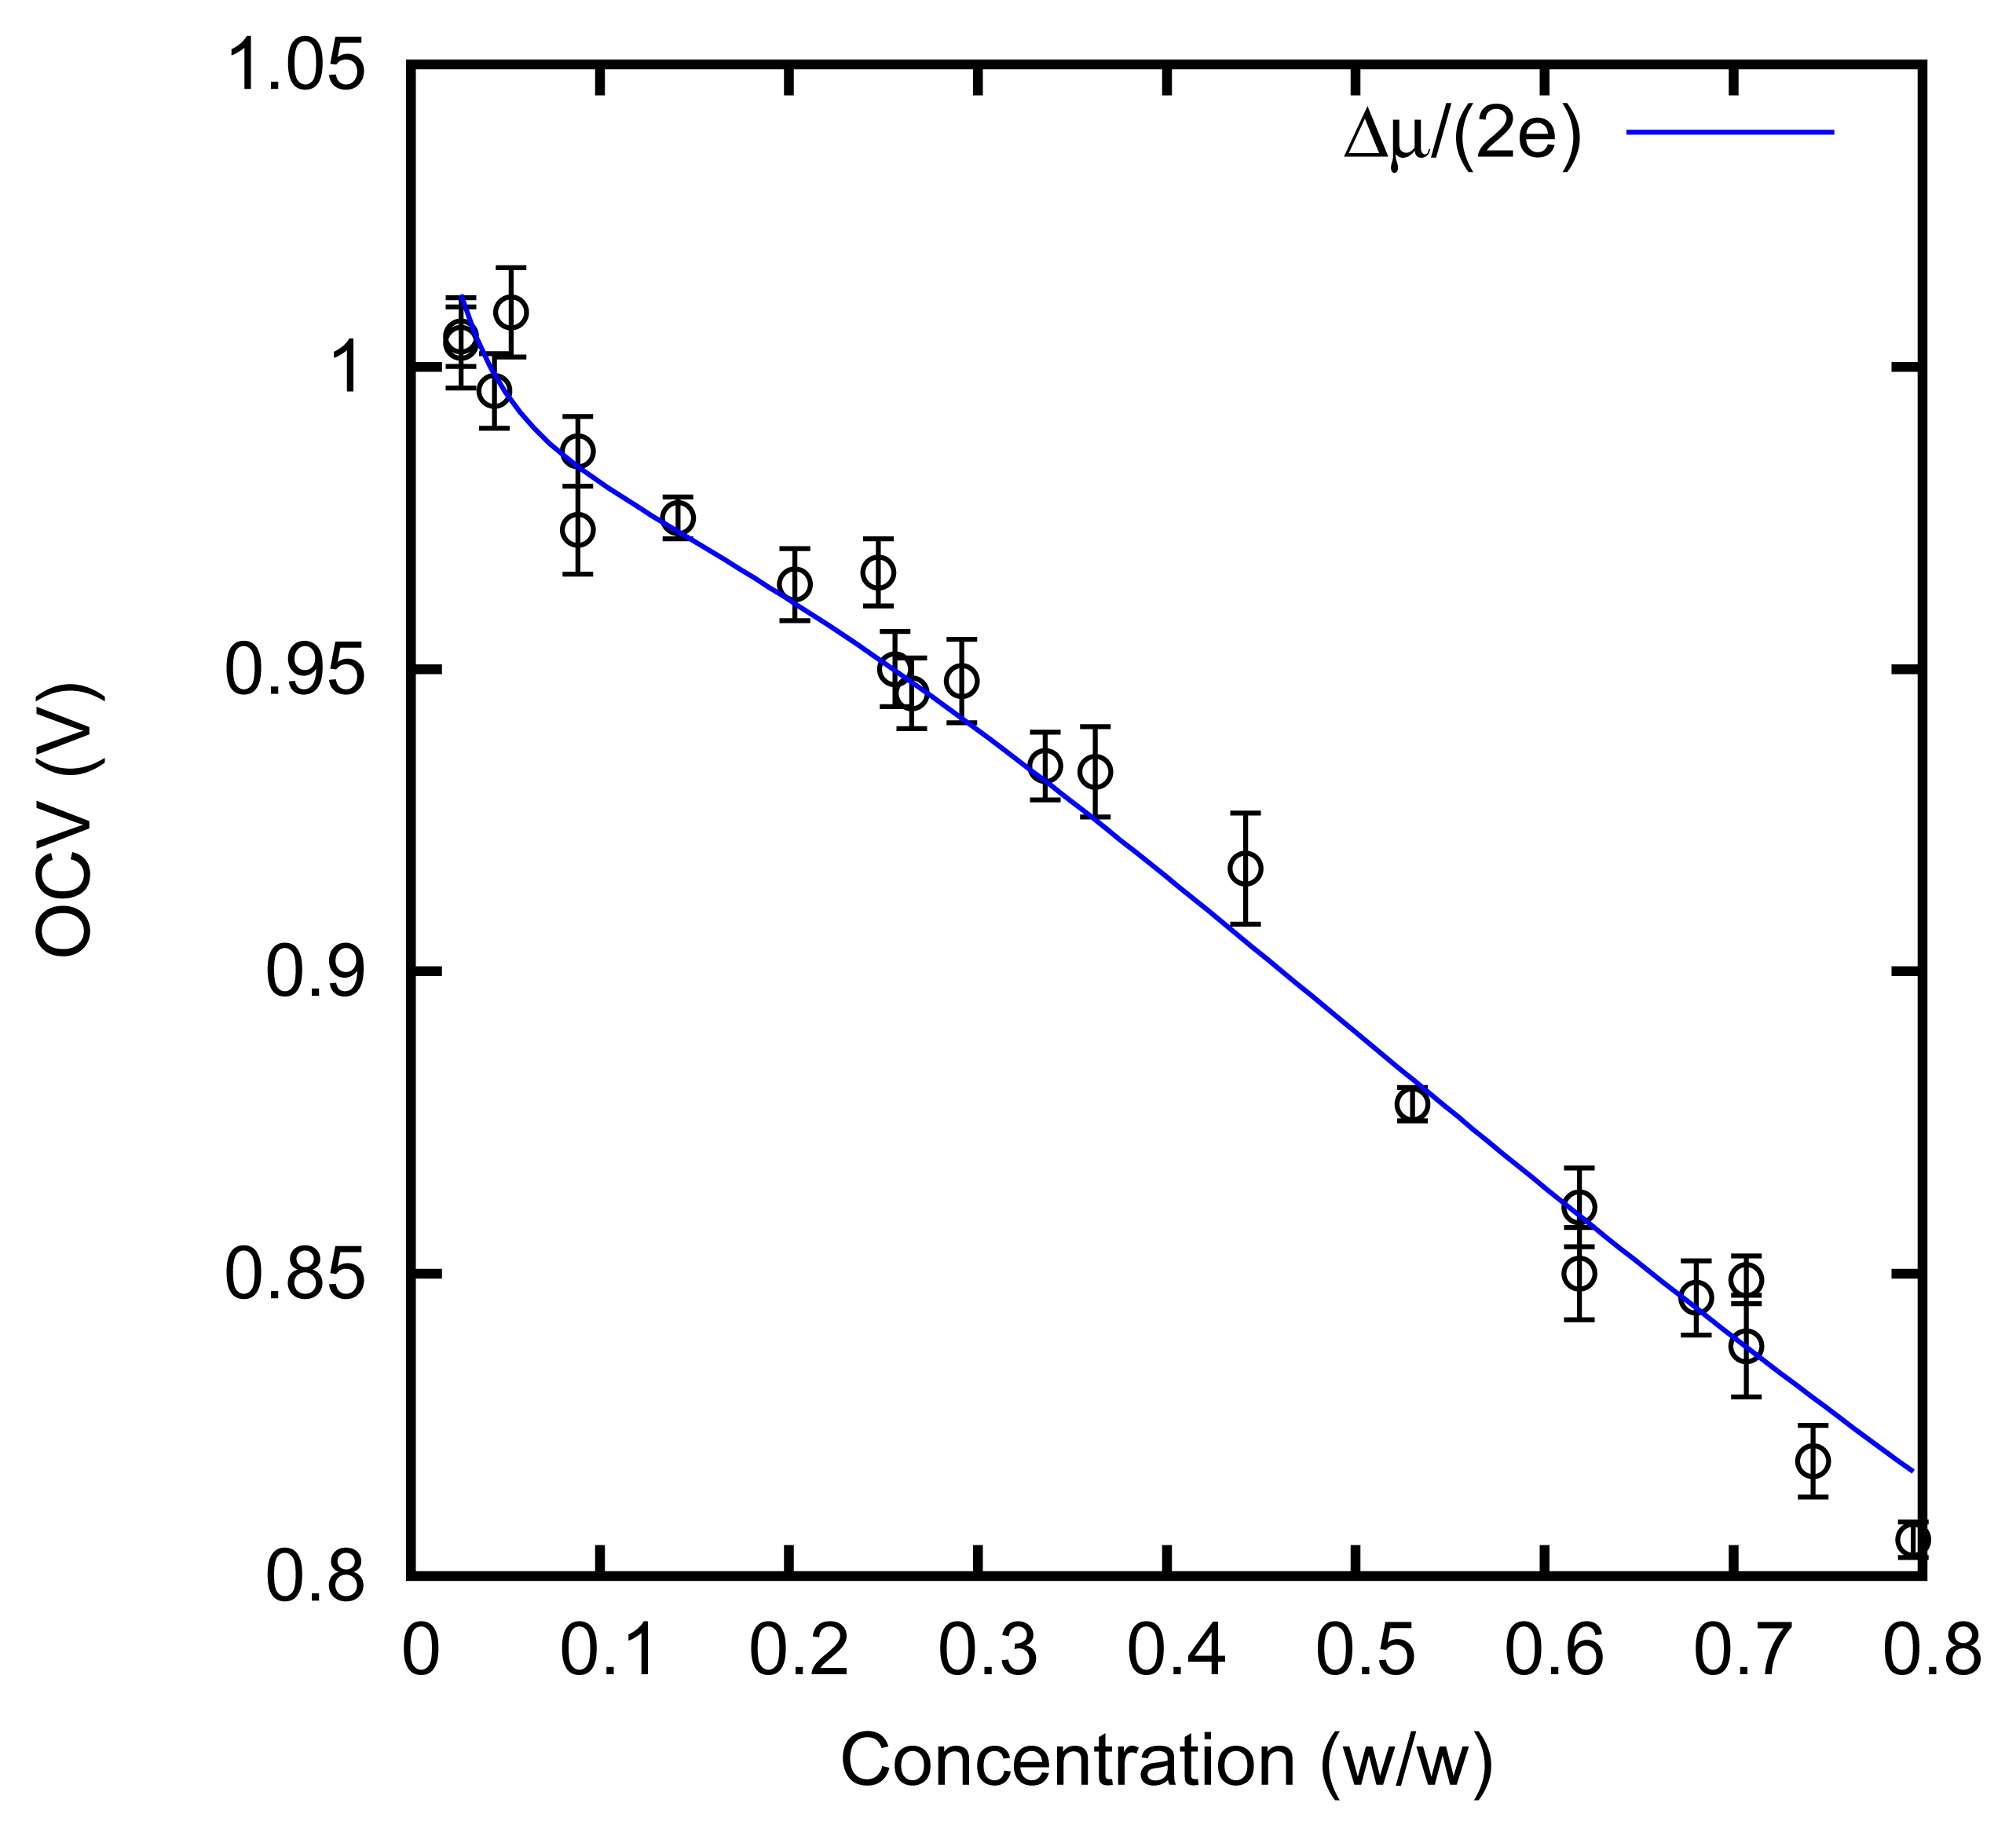
We measured the cell voltage in an open circuit. The result is shown in Figure 6.
The solid line is calculated from the boiling point elevation curve. This curve actually allows us to evaluate the derivative of the Gibbs free energy with respect to the number of units of ZnCl2 that are dissolved in the solution [5]. This quantity represents an “overall” chemical potential μ of the solute; it is defined as an “overall” quantity, because it does not refer to an actual chemical species present in the solution. Indeed, the solute is actually present in various forms: ions Zn++ and Cl−, an undissociated molecule ZnCl2 and various complexes, e.g., . The passage of a pair of electrons through the cell leads to the adsorption or release of a unit of ZnCl2. Assuming that the cell works reversibly, we expect to observe a cell voltage E = Δμ/(2e), where Δμ is the difference between the chemical potential in the solution and that (assumed to be constant) on the electrodes in the solid state. This fact can be rigorously shown in terms of the Nernst equation; indeed, the “overall” chemical potential μ corresponds at equilibrium also to the chemical potential of the undissociated molecule, ZnCl2, and to the sum of the chemical potentials μZn++ + 2μCl− of the dissociated ions, Zn++ and Cl−, also if the dissociation is not complete, or complexes, such as [51], are formed.
It must be noticed that the boiling point elevation allows us to evaluate only the variation of the chemical potential μ with respect to the concentration; the values are thus adjusted with a suitable additive constant.
In Figure 6, it can be noticed that the open circuit cell voltage is indeed very close to Δμ/(2e). This shows that, at least in quasi-stationary conditions with a low current, the AccMix cell can work close to reversibility, i.e., it can in principle extract an energy equal to the overall reduction of the free energy of the solutions. The voltage rise, which is one of the main parameters of the AccMix cell, is the difference between the cell voltages at the concentrations of the feed solutions.
It can be noticed that the cell voltage is nearly linear in the concentration and quite different from the logarithmic dependence that would be expected by approximating the activities with the concentrations. However, this is not surprising: at the highest concentrations that we consider, the solution is mainly composed of zinc chloride, and water is the minor component.
3.3. Electrokinetics Measurements and AccMix Cycles
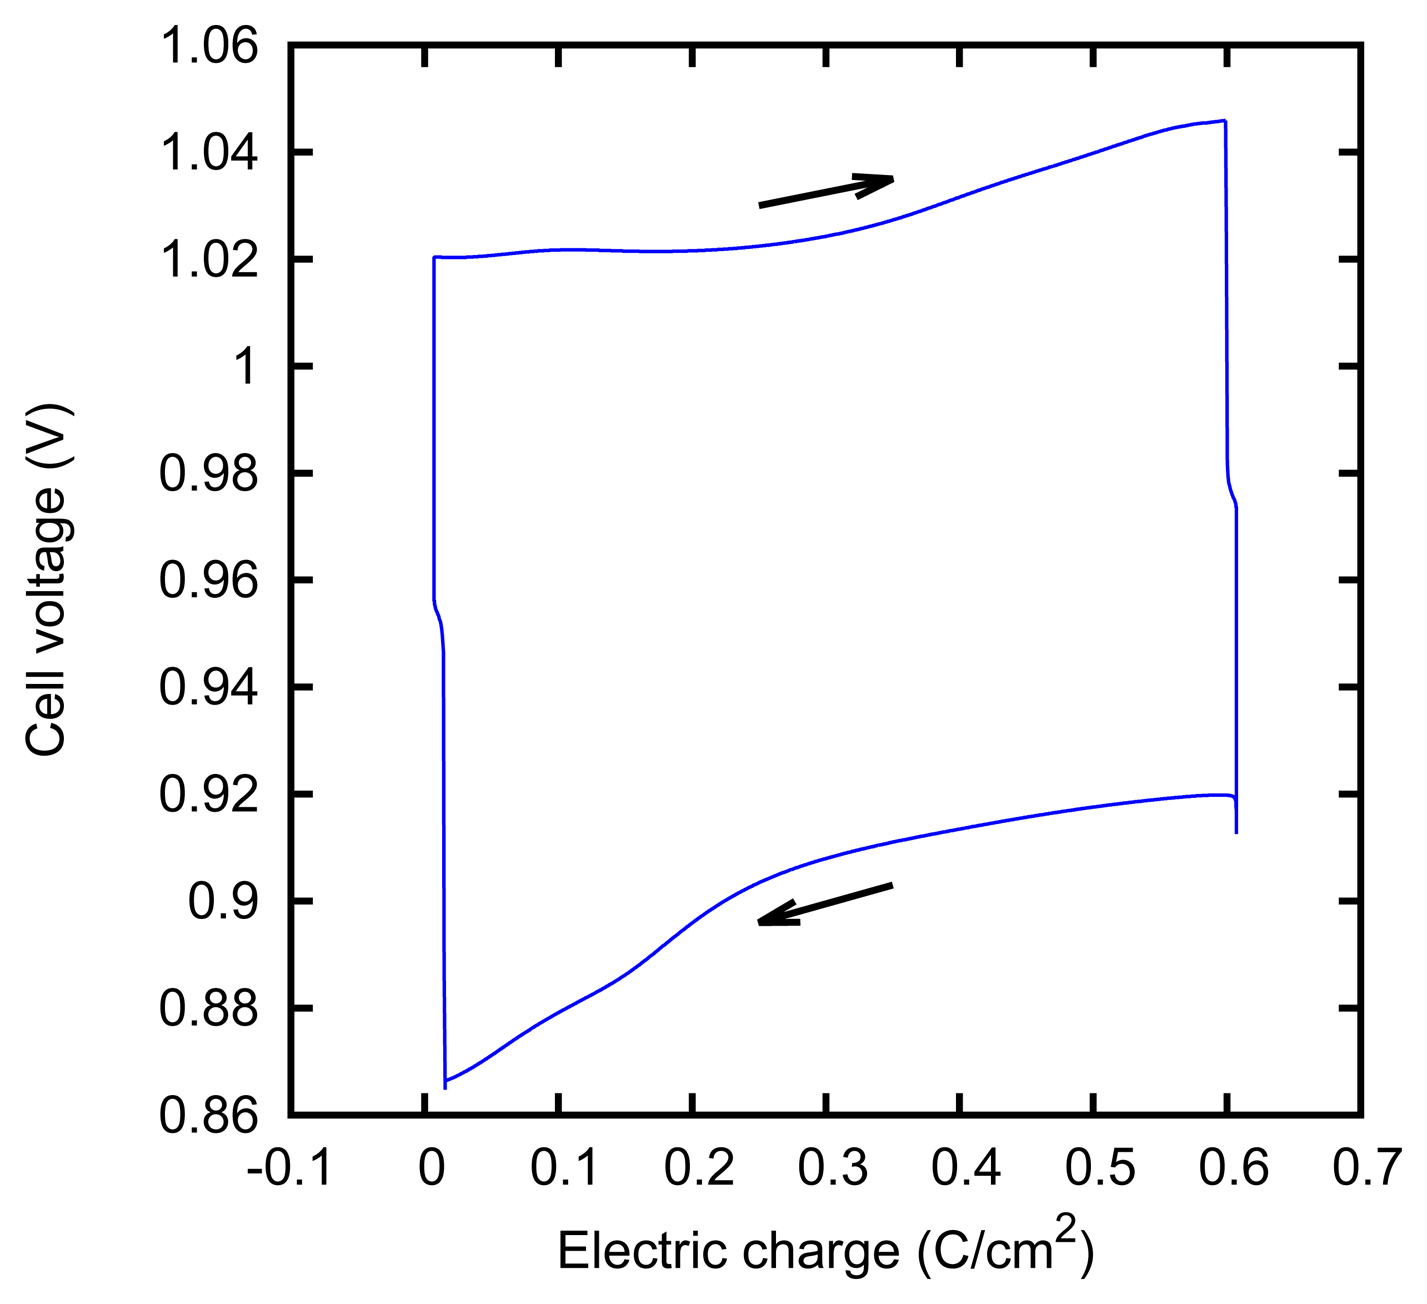
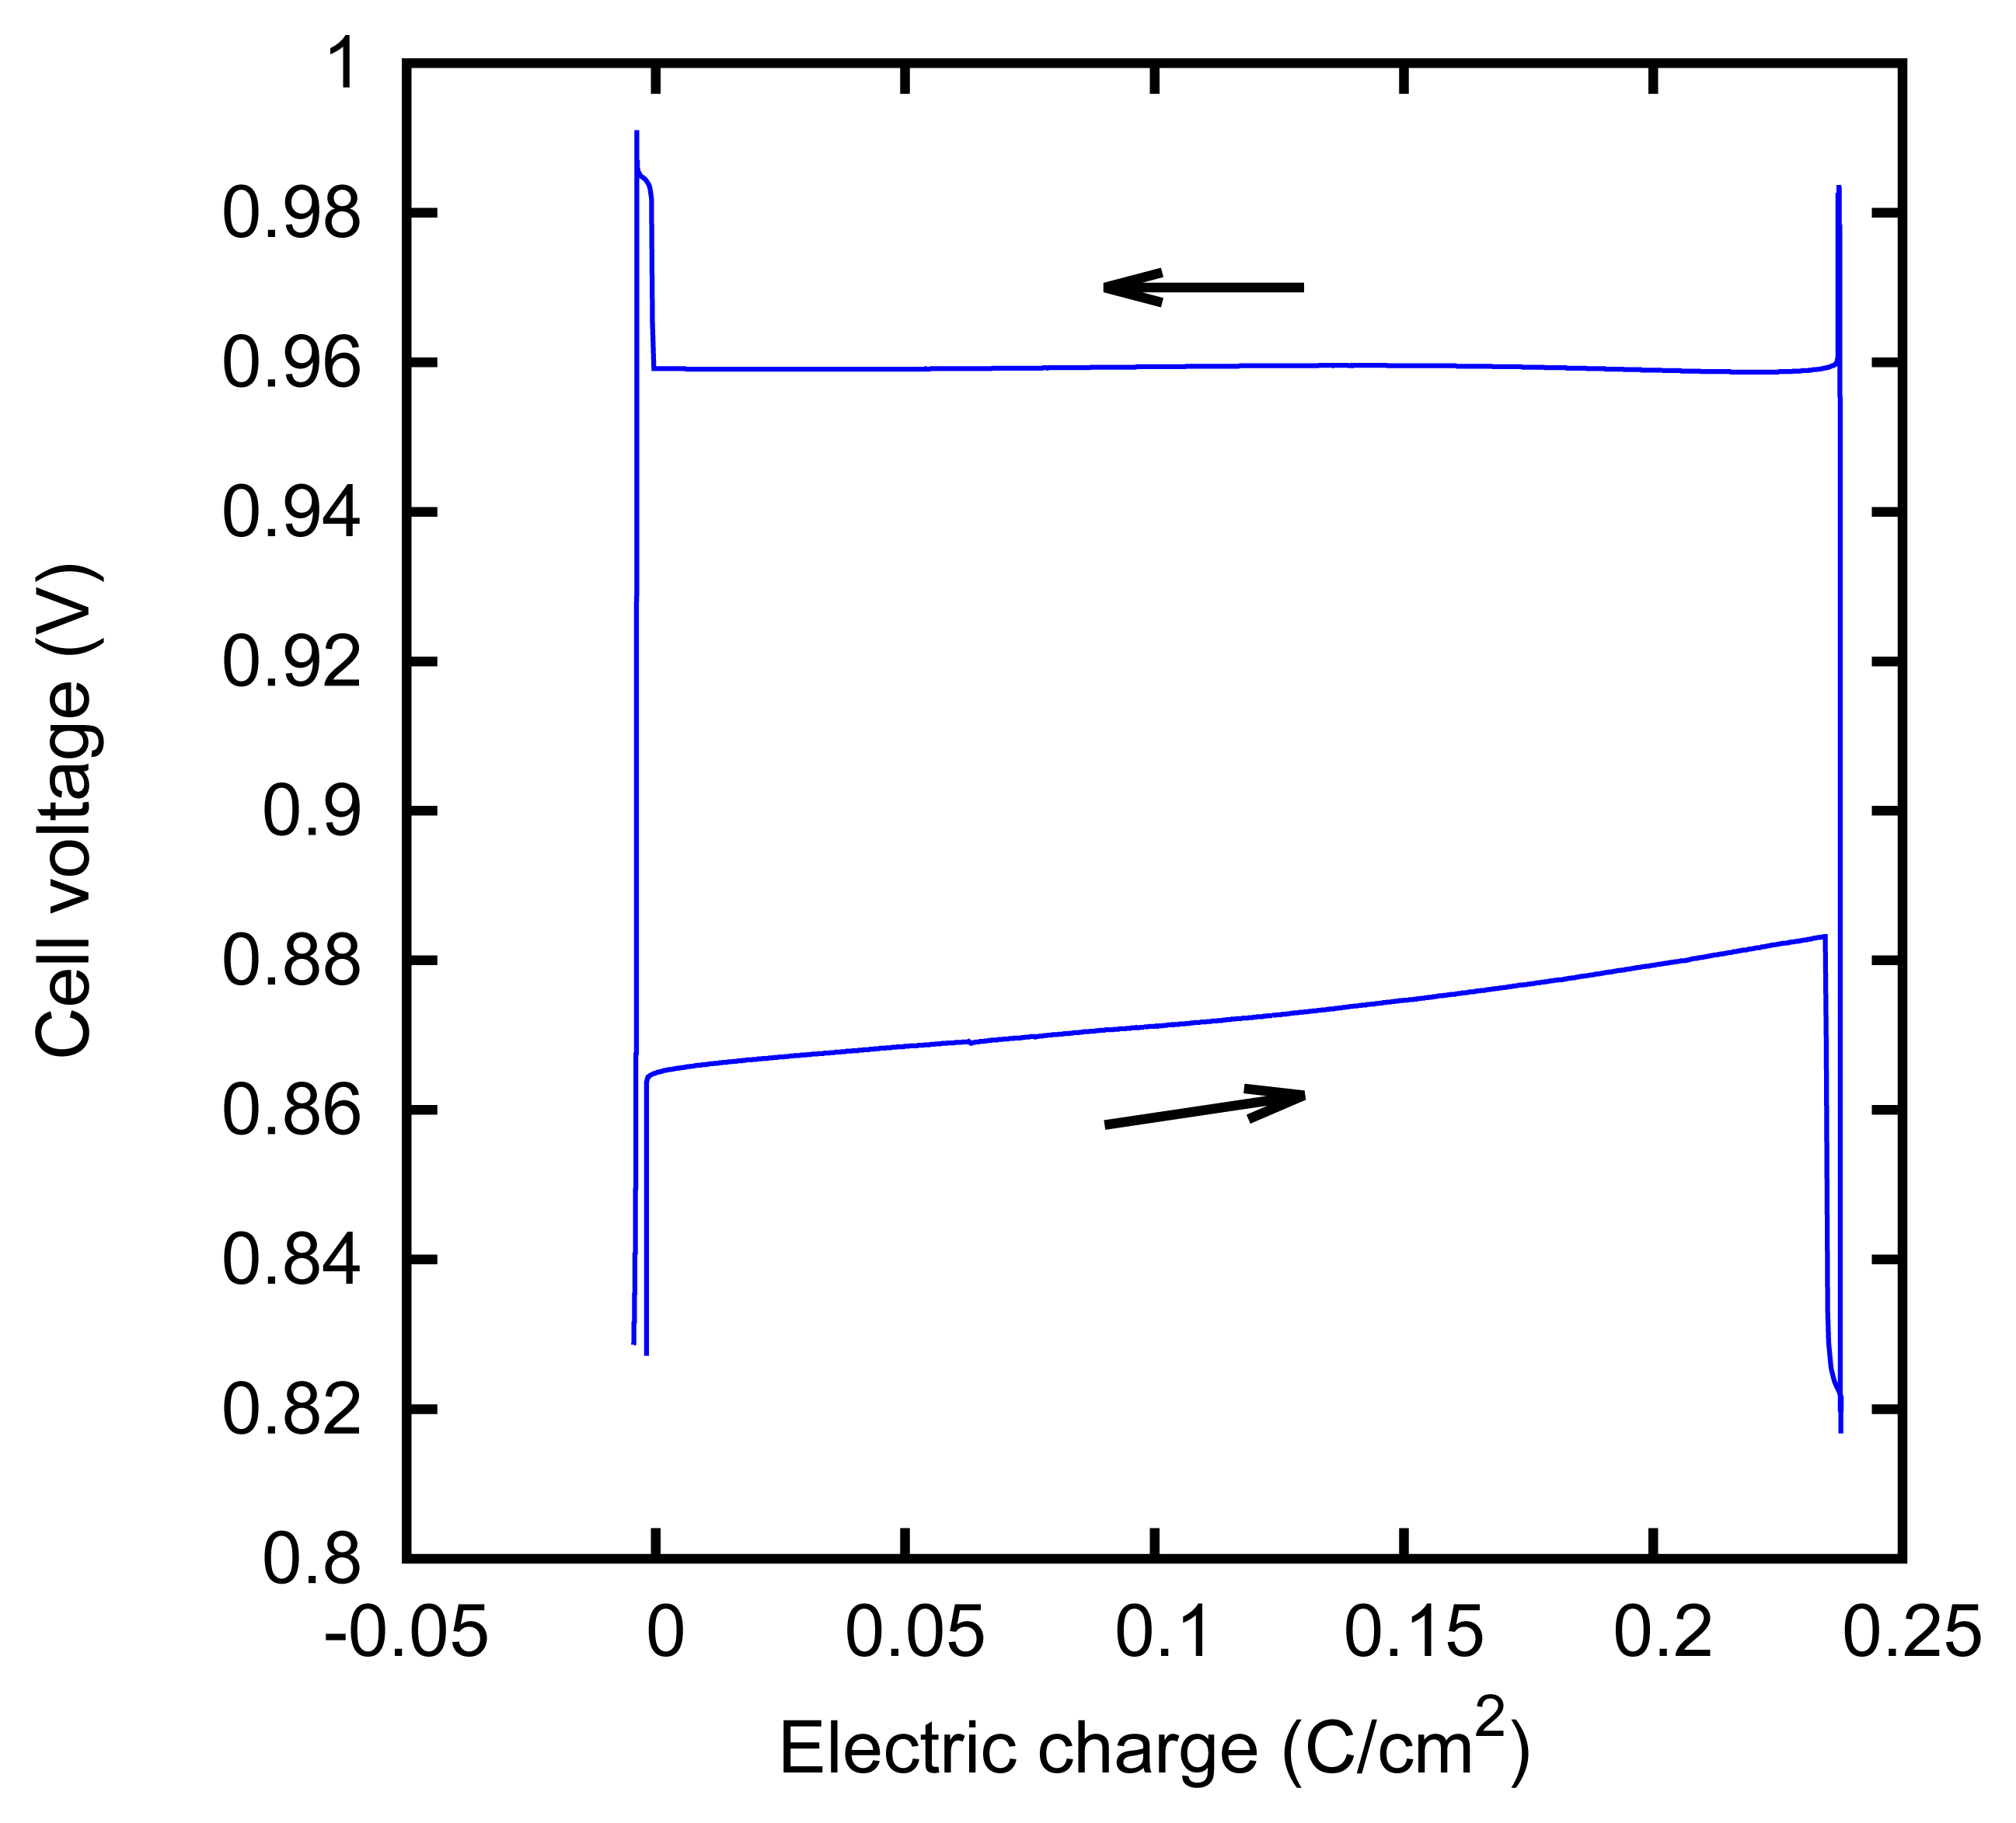
We characterized the kinetic behavior of the cell by means of the charge/discharge cycles performed at a constant concentration, at various values of the current. The cycles were composed of a charge phase at a given positive constant current for 60 s, followed by a discharge phase at the opposite current for 60 s. The cycle duration was chosen in order to mirror the actual duration of the typical AccMix cycles. The dissipated power is evaluated as the average of the product of the current and voltage over five cycles. The cycles can be effectively represented by plotting the cell voltage as a function of the electric charge that has flown through the cell (i.e., the integral of the current with respect to time). An example of such a plot is given in Figure 7. The energy dissipated during a cycle is equal to the area enclosed by the path.
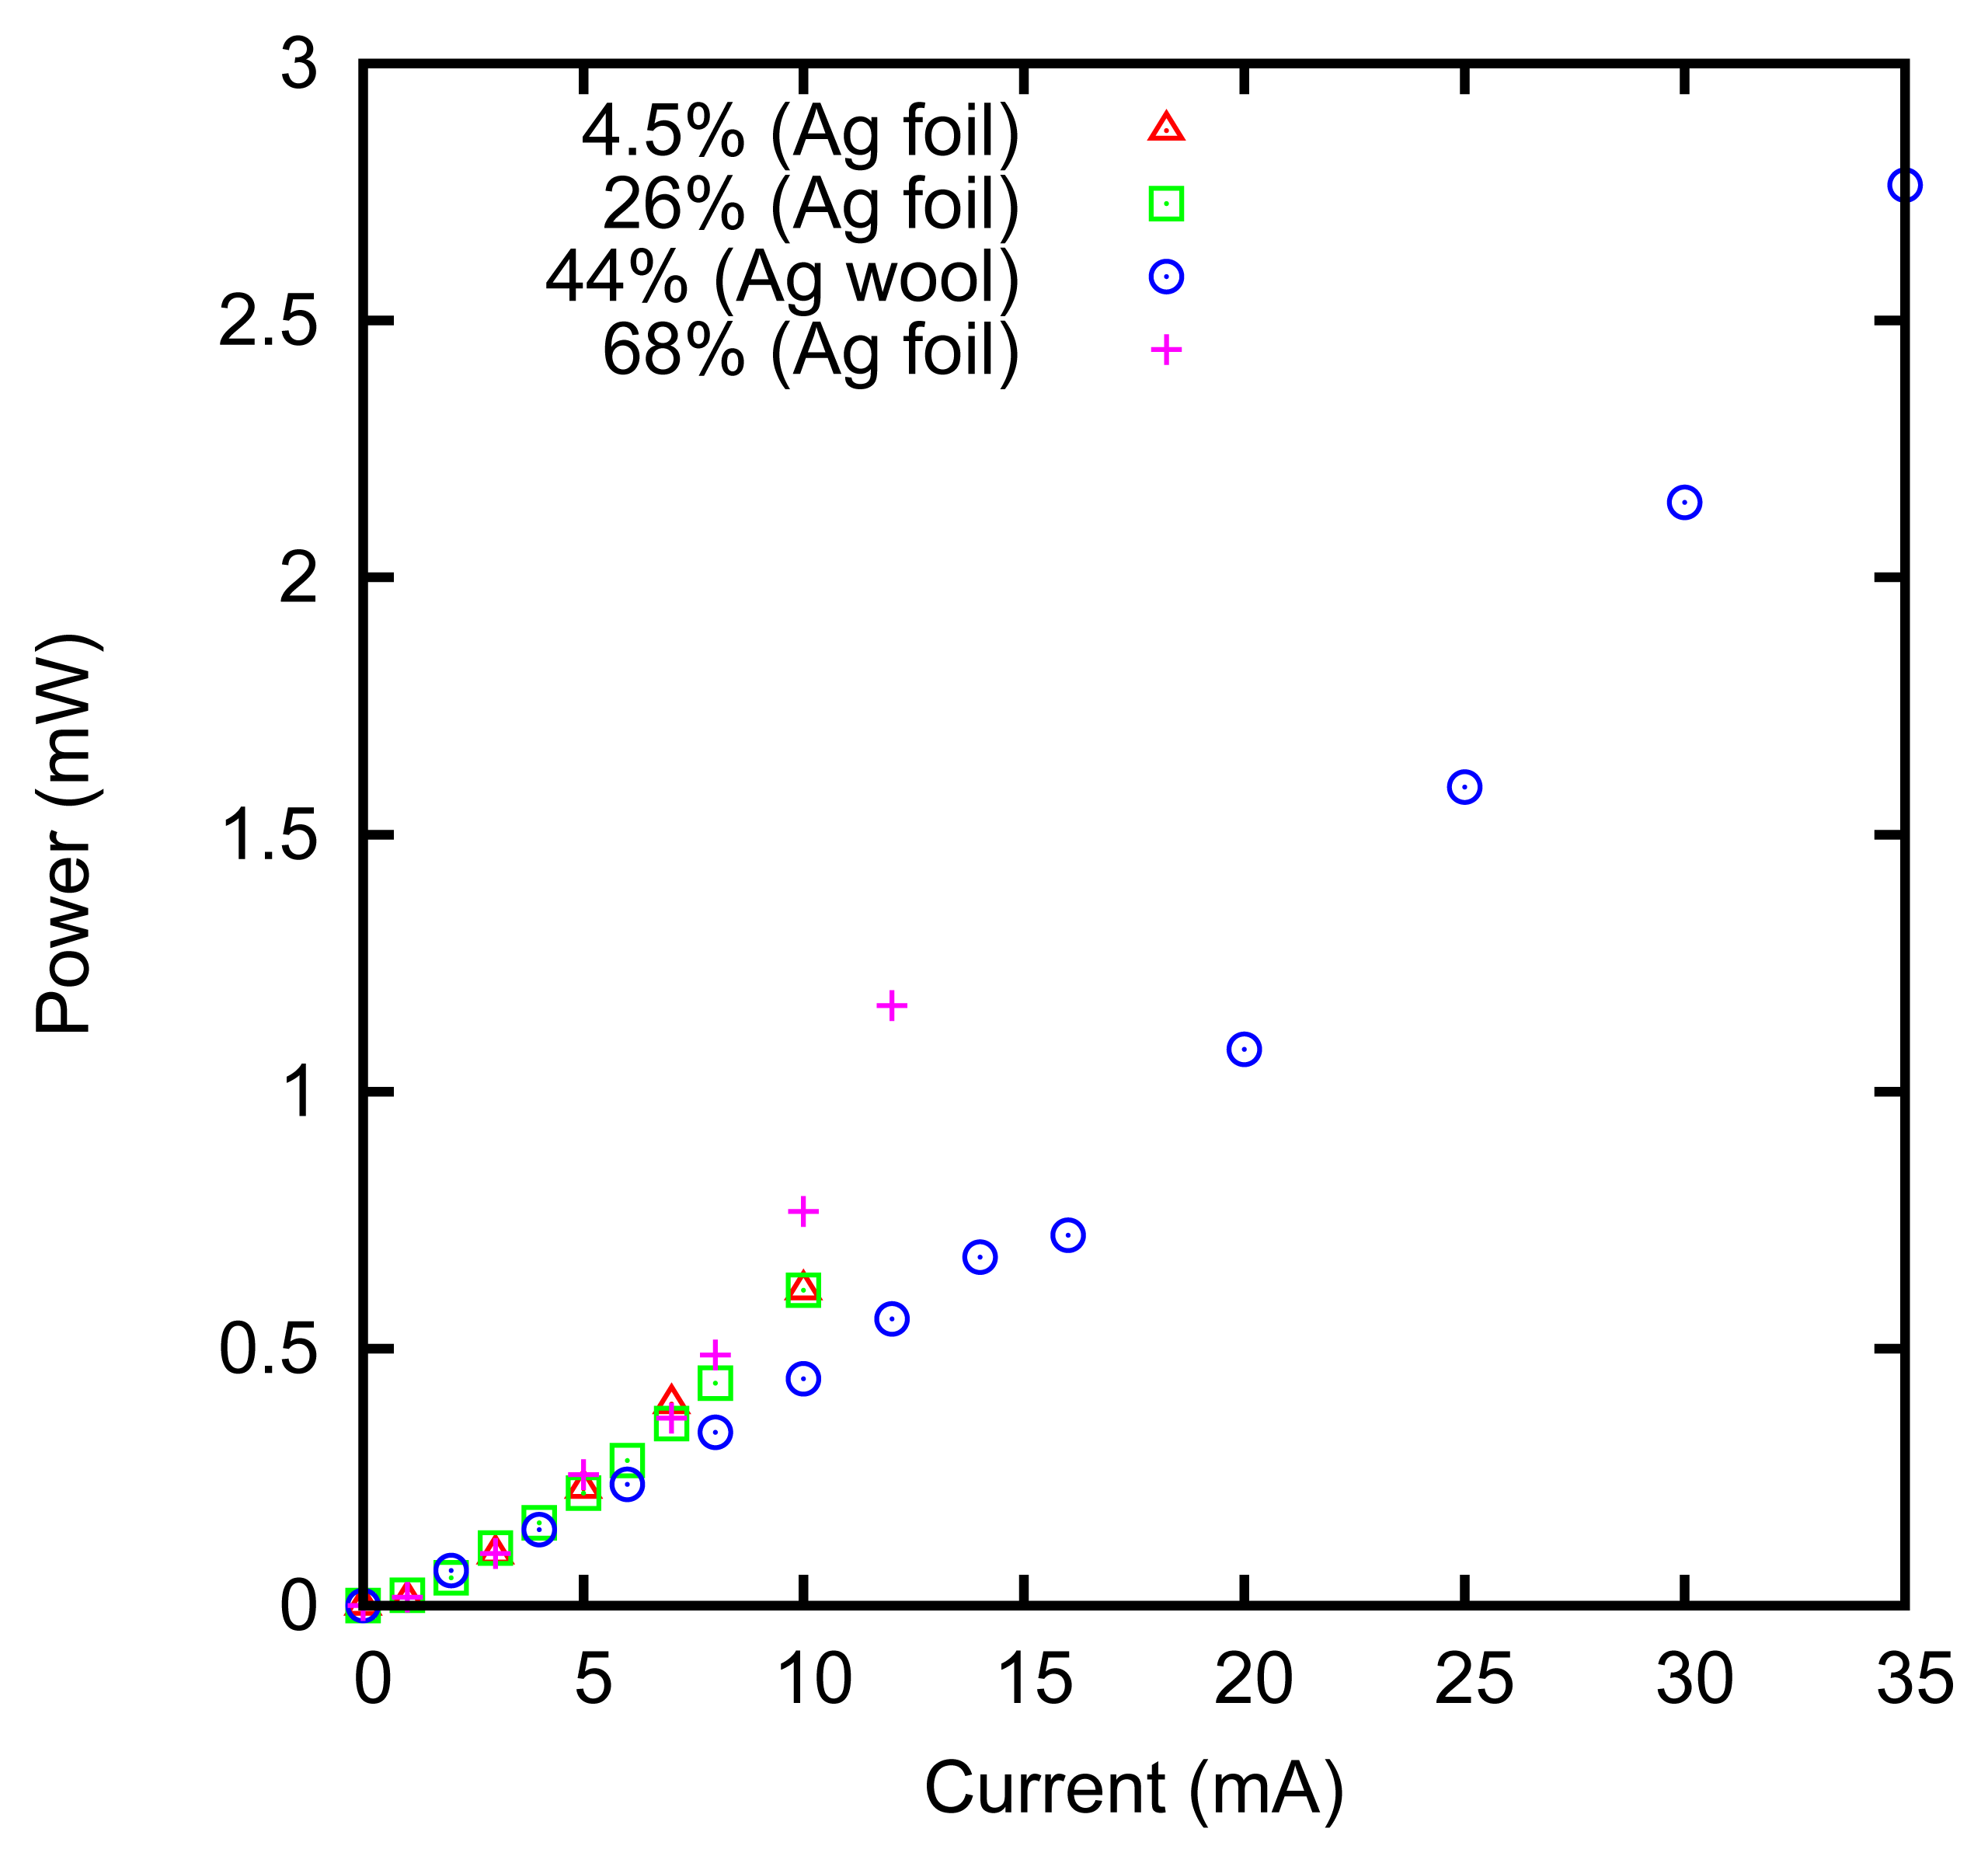
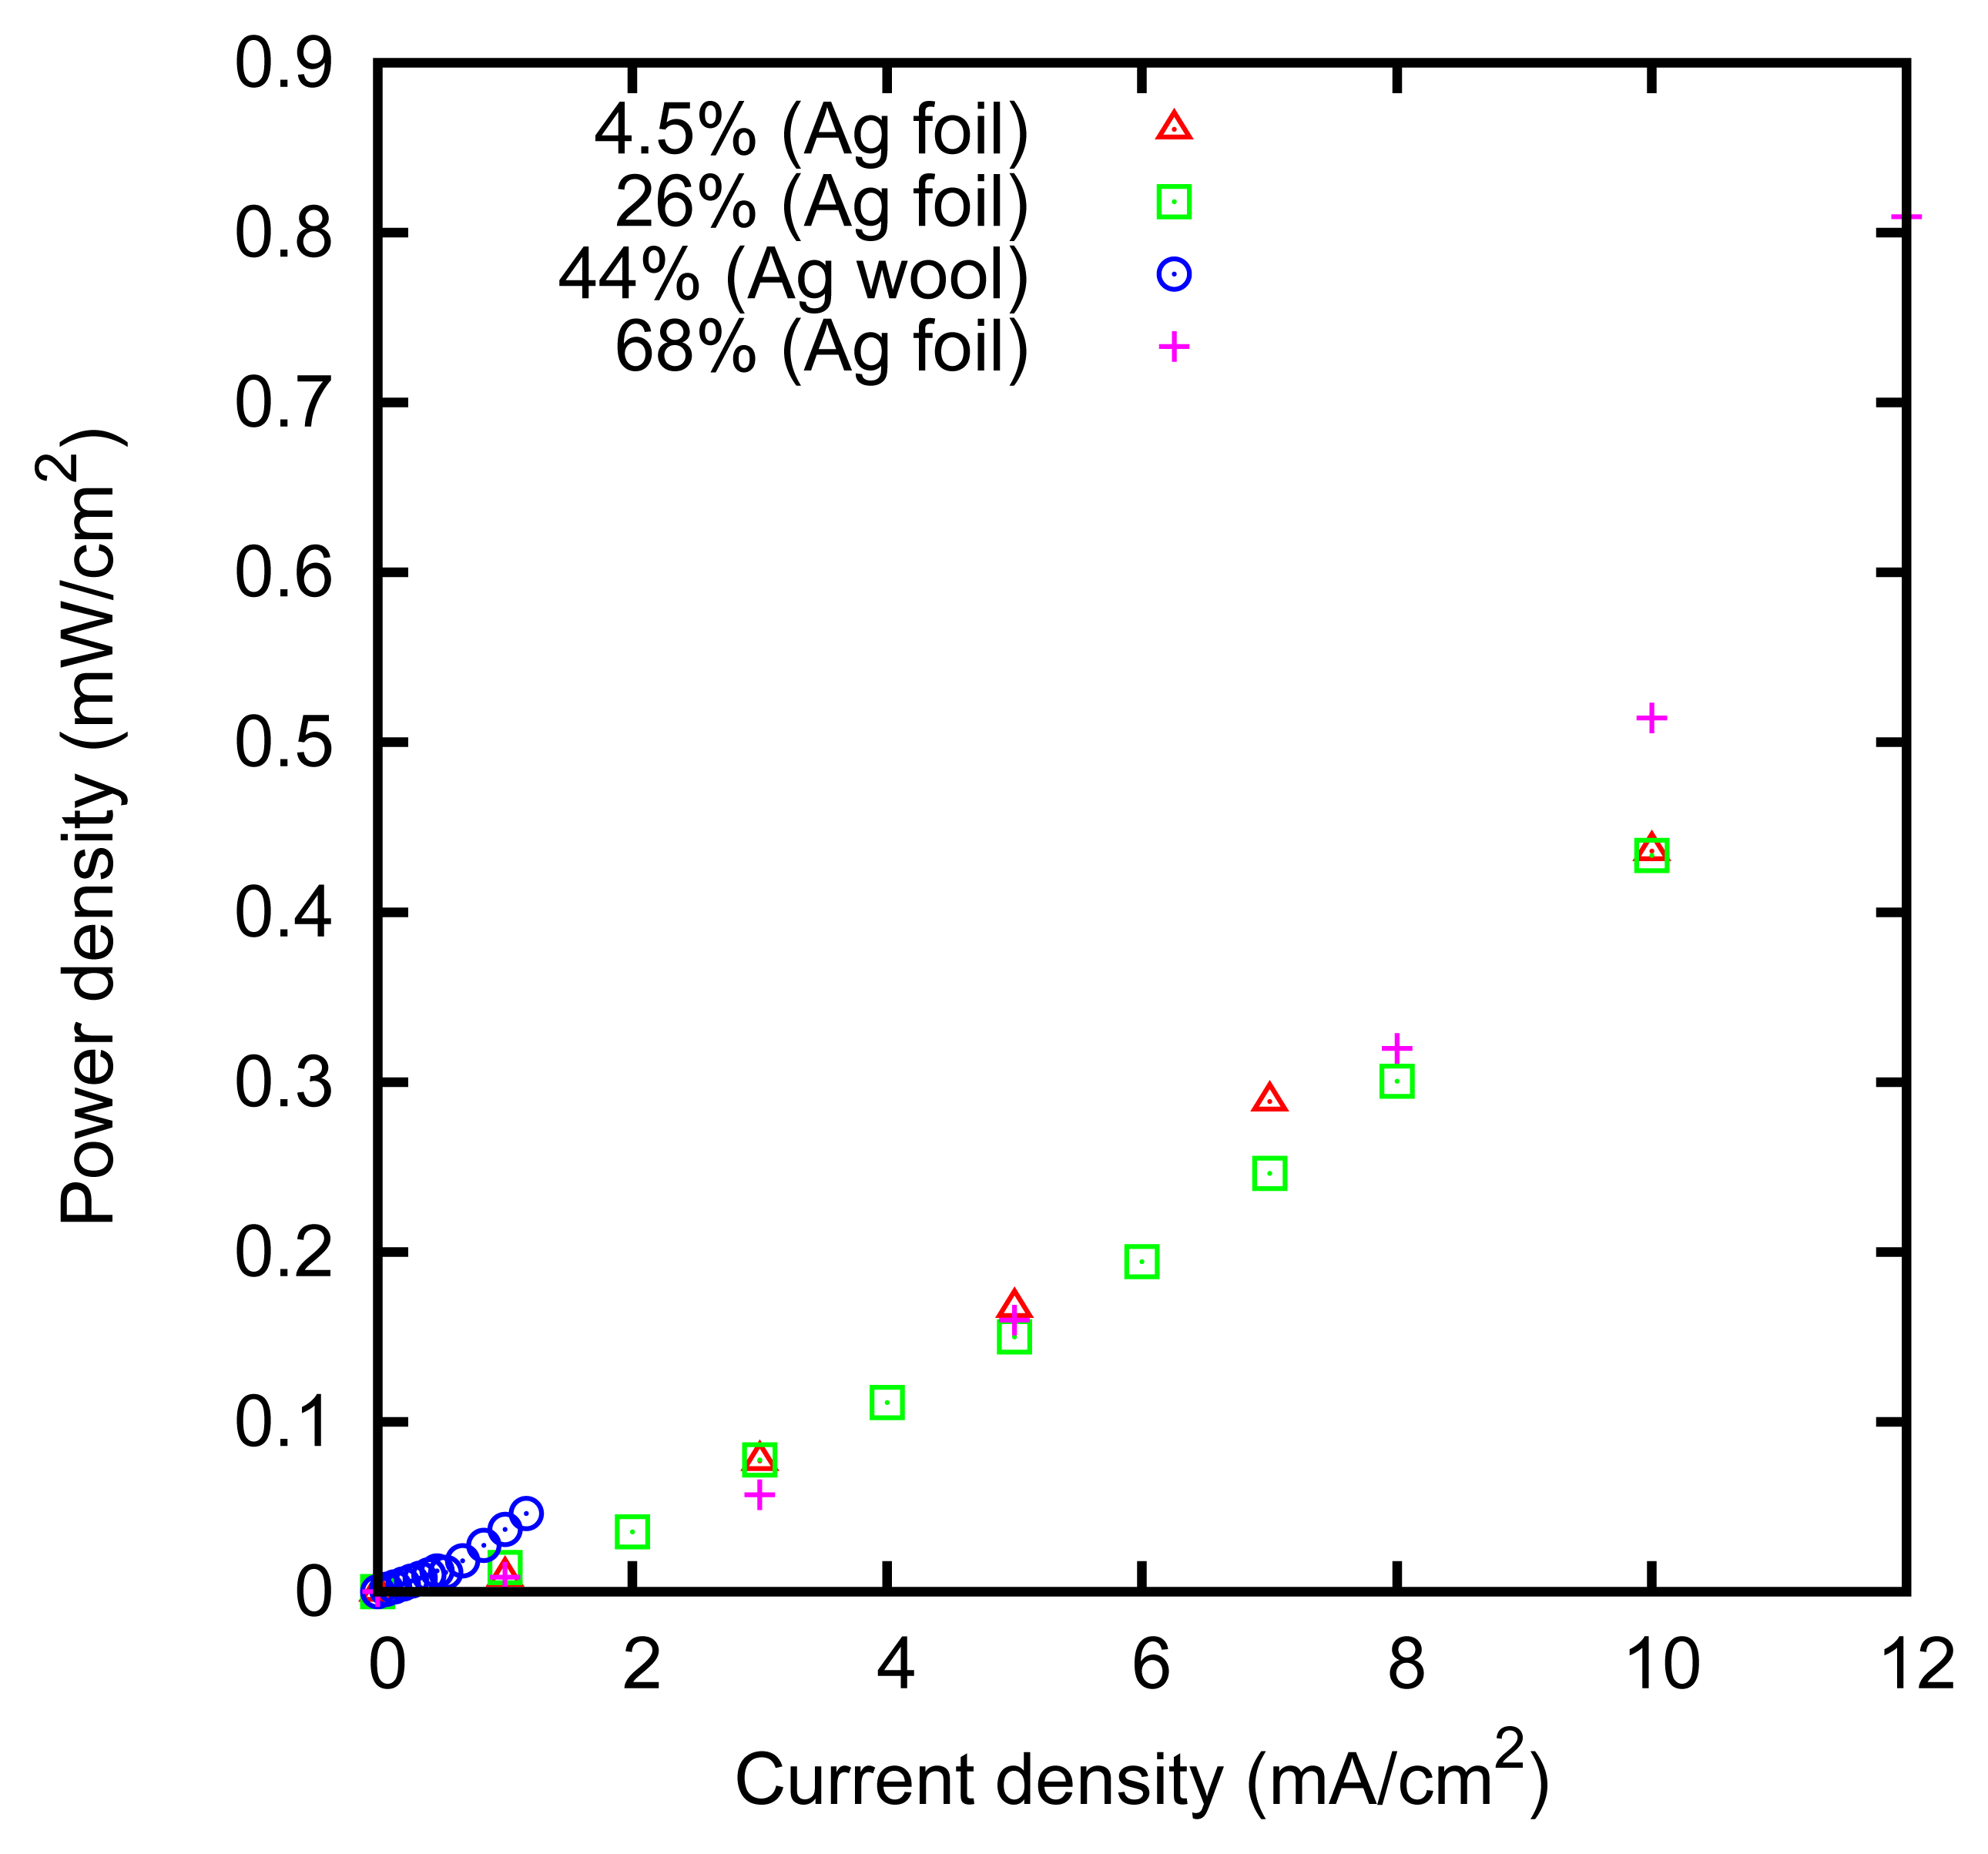
The measured power dissipation is shown in Figure 8. It can be noticed that the power dissipation is slightly higher at 68% concentration. This can be explained by considering that the resistivity of the ZnCl2 solution has a minimum of 0.1 Ω m at 3.7 M concentration [52], and it increases at higher concentrations, e.g., it is 1.3 Ω m at 80%.
The power dissipation is lower in the case of the felt obtained with the silver wool, in agreement with the larger effective surface; that is, approximately 15 cm2 for the 1 × 1 cm felts we used.
By means of a reference electrode, we tried to roughly measure the potentials of the single electrodes of the cell, in order to evaluate their individual contributions to power dissipation (the contribution of the resistance of the solution, although still visible in the case of the 68% solution, is relatively small).
The power dissipation at the Ag/AgCl electrode is reported in Figure 9, expressed in terms of current per unit surface. It can be noticed that the power dissipation in the case of the silver wool is higher; this means that the geometric surface of the wires is not completely available for the reaction. It is possible that the silver chloride film, which forms during the anodization, insulates a part of the microwires forming the silver wool with respect to the others and with respect to the current collector.
The power dissipation at the zinc electrode is reported in Figure 10. It can be noticed that the dissipation on the zinc electrode is less than the dissipation on the silver electrode, which thus represents the current bottleneck of the technique.
With our experimental setup, we performed a series of AccMix cycles, which were composed of a charge phase of 60 s in concentrated solution at a given current and a discharge phase of 60 s in diluted solution at the opposite current. Between any two consecutive phases of this type (the “active” phases of the cycle), there was an interval of 60 s at zero current, during which, we could transfer the electrodes from the container of the concentrated solution to that of the diluted solution or vice versa. A plot of such a series of cycles in the (Q, V) plane is shown in Figure 11. At variance with the charge-discharge cycles of Figure 7, here, the cycles are counterclockwise, and the enclosed area represents an energy that is delivered by the cell to the external circuit. The average produced power was calculated as the ratio between the average produced energy per cycle and the sum of the durations of the two active phases of the cycle (120 s in our case), therefore neglecting the intervals required for the transfer of the electrodes.
We measured the power production at various current intensities. The results are shown in Figure 12. A maximum of approximately 2 W/m2 of electrode is obtained. The maximum is reached at a current of approximately 50 A/m2; at that current, an ideal device with a voltage rise of 160 mV would produce 4 W/m2, leading to an efficiency of ηcell = 50% in the conversion from the mixing free energy of the solutions into the produced electrical energy. Higher efficiencies can be obtained by increasing the electrode surface, thus reducing the current density. An efficiency ηcell = 80% is obtained at a current density of approximately 25 A/m2, with a power output of 1.6 W/m2.
The overall efficiency η of the device, in the conversion from heat into electrical current, is the product of the efficiency ηcell and the efficiency ηdistiller, i.e., the efficiency of the first stage in the conversion of heat into the mixing free energy of the solutions:
The efficiency ηdistiller depends on the boiling point temperatures of the two used solutions; in the case shown in Figure 12, they are TL = 100 °C and TH = 125 °C. Assuming that the first stage reaches its thermodynamic limit [5], ηdistiller = 6%. This leads to an overall efficiency of 5%. Based on the boiling point elevation curves, the efficiency can be increased up to 8% by using a concentrated solution at 80% of zinc chloride. This result is promising, since it can be obtained with a very small temperature difference, of the order of 40 °C.
In our 1 × 1 cm2 cell, at a current of 5 mA, i.e., approximately at the maximum of the power production, the migration of the ZnCl2 from the more to the less concentrated solution is 26 × 10−9 moles/s. In our simplified experimental setup, the concentrations inside the cell are kept constant during the various phases, by continuously flowing the solutions and discarding the output. In a real working device, in which a recirculation takes place, the concentration difference between the two solutions would slowly vanish. In order to keep the solutions at constant concentrations, we should continuously distill a flow of 0.3 cm3/hour of the 4.5% solution and evaporate nearly the same amount of water from the 68% solution. It is worth emphasizing that the small flow of 0.3 cm3/h refers to the fluid that must be regenerated by consuming the incoming heat and should not be compared with the flow of 0.5 cm3/s used in our experiments (which is possibly recirculated) for maintaining a uniform spatial concentration in the cell.
3.4. Silver Chloride Film
The behavior of the electrodes apparently keeps memory of their recent history. This was seen in some particular cases of charge-discharge cycles, as those described in Section 3.3. In Figures 13 and 14, we show two series of such cycles, which were performed under slightly different conditions. In the first case, we see that the potential falls near the end of the discharging (cathodic) phase and that such a decrease occurs closer and closer to the end of the phase, as cycles are repeated. In the second case, we see instead that a potential increase occurs closer and closer to the end of the charging (anodic) phase.
The first phenomenon can be explained as the depletion of the AgCl that was formed on the surface of the silver foil during the anodization. An analogous phenomenon has been described as an increase of the cathodic overpotential [53] or a potential change during the galvanostatic reduction of a dense AgCl deposit layer [54].
Furthermore, the second phenomenon can be related to already observed effects. It has been noticed that the anodic current becomes stronger after a phase in which the current has a cathodic direction [49]; this phenomenon has been described in terms of a nucleation process. Since the anodic current corresponds to the growth of the AgCl film, this effect can be described by saying that, during the charging (anodic) phase, the silver chloride grows more easily when it has just been removed in the preceding phases. At the end of such a phase with a decreased overvoltage, the overvoltage increases again, as can be observed in Figure 14.
It is however difficult to systematically reproduce these phenomena. The best performance is of course obtained when either the potential increase in the charge or the potential fall in the discharge are avoided, and the cycle is represented by a roughly regular parallelogram in the (Q, V) plane. In this case, in fact, the area of the plane enclosed by the cycle, which represents a dissipated power, is minimized.
3.5. Comparison with Other Salinity Gradient Power Techniques
This section reports a comparison between our technique and the other SGP techniques described in the literature, performed in terms of power density, energy conversion efficiency and cost per power. It must be noticed that the various SGP techniques are mainly studied as a means for producing power from NaCl solutions; this limits the salinity to values well below the concentrations of our ZnCl2 solutions. We will consider the ZnCl2 water solutions at 4.5% and 68%.
With such solutions, the maximum power production we achieved is around 2 W/m2 of electrode. By using microporous materials, e.g., sintered powders, we can have a surface of the order of 100 cm2/g; this leads to a cost of the order of ten euros per W.
The reverse electrodialysis (RED) [6,11,13] device is based on stacks of perm-selective membranes, alternatively permeable to anions and cations. The membranes define compartments that are alternatively filled with the high- and low-concentration feed solutions. The Donnan potential develops across the perm-selective membranes that separate the solutions at different concentrations, resulting in a net voltage across the whole stack.
In the case of the cited ZnCl2 solutions, the voltage of the RED device would be 160 mV per couple of membranes. This voltage is quite close to the voltage that is usually obtained working with sea and river water. In this case, a wide literature (see [6] and the references therein) shows that the power production is practically limited to 1–2 W/m2, comparable with the results of our cell. Furthermore, the energy efficiency should be quite similar to our cell. However, the cost of the RED membranes is much higher, i.e., of the order of 100 euros each. Moreover, the performances of the perm-selective membranes with the complex-forming solutions we use should be further investigated.
For solutions with high concentrations, the pressure-retarded osmosis (PRO) [7–9] technique has a higher power density than RED [6]. This can be practically observed in the case of NaCl brines. However, in the case of the ZnCl2 solutions, the osmotic pressure would reach the value of 1400 atm, outside the working conditions of usual PRO devices and membranes. A much lower working pressure can be used, but at the expense of a dramatic decrease of the energy efficiency. It is worth noting that the use of a PRO device, coupled with a distiller, has been indeed proposed for ammonia-carbon dioxide solutions [46], working at less than 200 atm.
Other AccMix techniques, such as CAPMIX, could be used, in principle, for ZnCl2 solutions. In the so-called “capacitive double layer expansion” (CDLE) technique [16,17], the electrodes are made of activated carbon. In that case, the voltage rise is due to the dependence of the voltage across the electric double layer on the ion concentration. According to the Gouy–Chapman–Stern theory [55], the voltage rise, at a given accumulated charge, vanishes as the concentration increases and should be small in the case of our ZnCl2 solutions. In the “capacitive Donnan potential” version of the CAPMIX technique [19–21], perm-selective membranes are added to the activated carbon electrodes. This technique should give the same voltage rise of our cell based on zinc and Ag/AgCl electrodes; however, the cell proposed in the present paper has the advantage of avoiding the use of expensive membranes, as emphasized above.
4. Conclusions
We have shown that our AccMix cell is efficient in converting the free energy of the zinc chloride solution into electrical current. The fact that the open-circuit voltage practically coincides with the value theoretically expected from thermodynamical considerations (Figure 6) means that the efficiency actually approaches unity as the current goes to zero. The maximum power production we achieved is around 2 W per square meter of electrode. By using microporous materials, e.g., sintered powders, we can have a surface of the order of 100 cm2/g; this leads to a cost of the order of ten euros per W. This is a relatively good result: for a comparison, reverse electrodialysis applied to sea and river water gives a power output of the order of 1 W per square meter of a couple of membranes, having a cost of the order of 100 euros each.
As already noticed, the bottleneck of the system is the silver/silver chloride electrode. For this reason, further improvements might be obtained by replacing the silver electrode with other materials interacting with chlorine ions, e.g., conducting polymers, like polypyrrole.
Acknowledgments
We thank Alessandro Atti, Pino Gherardi and Paolo Turroni [56] for the collaboration in the development of the concept of the closed-cycle heat-to-current converter. We thank Carlo Guidi, Francesco Gugole, Paolo Cesana and Duilio Calura (Italschell [50]) for the project on the concentrator/distiller for the zinc chloride. We thank Luigi Galgani and Maarten Biesheuvel for useful discussions and suggestions on the manuscript. The research leading to these results received funding from the European Union Seventh Framework Programme (FP7/2007-2013) under Agreement No.256868, CAPMIX project. Lorenza Misuri acknowledges the support of the Cariplo Foundation Materiali Avanzati, 2011, Project 2011-0336.
Conflicts of Interest
The authors declare no conflict of interest.
References
- Pattle, R.E. Production of electric power by mixing fresh and salt water in the hydroelectric pile. Nature 1954, 174. [Google Scholar] [CrossRef]
- Norman, R.W. Water salination: A source of energy. Science 1974, 186, 350–353. [Google Scholar]
- Logan, B.E.; Elimelech, M. Membrane-based processes for sustainable power generation using water. Nature 2012, 488, 313–319. [Google Scholar]
- La Mantia, F.; Pasta, M.; Deshazer, H.D.; Logan, B.E.; Cui, Y. Batteries for efficient energy extraction from a water salinity difference. Nano Lett. 2011, 11, 1810–1813. [Google Scholar]
- Carati, A.; Marino, M.; Brogioli, D. Theoretical Thermodynamic Analysis of A Closed-Cycle Process for the Conversion of Heat into Electrical Energy by Means of A Distiller and An Electrochemical Cell. Available online: http://arxiv.org/abs/1309.3643 (accessed on 12 June 2014).
- Post, J.W.; Veerman, J.; Hamelers, H.V.M.; Euverink, G.J.W.; Metz, S.J.; Nymeijer, K.; Buisman, C.J.N. Salinity-gradient power: Evaluation of pressure-retarded osmosis and reverse electrodialysis. J. Membr. Sci. 2007, 288, 218–230. [Google Scholar]
- Levenspiel, O.; de Vevers, N. The osmotic pump. Science 1974, 183, 157–160. [Google Scholar]
- Loeb, S. Osmotic Power Plant. Science 1975, 189, 654–655. [Google Scholar]
- Chung, T.S.; Li, X.; Ong, R.C.; Wang, Q.G.H.; Han, G. Emerging forward osmosis (FO) technologies and challenges ahead for clean water and clean energy applications. Curr. Opin. Chem. Eng. 2012, 1, 246–257. [Google Scholar]
- Achilli, A.; Cath, T.Y.; Childress, A.E. Power generation with pressure retarded osmosis: An experimental and theoretical investigation. J. Membr. Sci. 2009, 343, 42–52. [Google Scholar]
- Weinstein, J.N.; Leitz, F.B. Electric power from differences in salinity: The dyalitic battery. Science 1976, 191, 557–559. [Google Scholar]
- Lacey, R.E. Energy by reverse electrodialysis. Ocean Eng. 1980, 7, 1–47. [Google Scholar]
- Post, J.W.; Hamelers, H.V.M.; Buisman, C.J.N. Energy recovery from controlled mixing salt and fresh water with a reverse electrodialysis system. Environ. Sci. Technol. 2008, 42, 5785–5790. [Google Scholar]
- Olsson, M.; Wick, G.L.; Isaacs, J.D. Salinity gradient power: Utilizing vapor pressure differences. Science 1979, 206, 452–454. [Google Scholar]
- Bijmans, M.F.M.; Burheim, O.S.; Bryjak, M.; Delgado, A.; Hack, P.; Mantegazza, F.; Tennisson, S.; Hamelers, H.V.M. CAPMIX—Deploying capacitors for salt gradient power extraction. Energy Procedia 2012, 20, 108–115. [Google Scholar]
- Brogioli, D. Extracting renewable energy from a salinity difference using a capacitor. Phys. Rev. Lett. 2009, 103, 058501–058504. [Google Scholar]
- Brogioli, D.; Zhao, R.; Biesheuvel, P.M. A prototype cell for extracting energy from a water salinity difference by means of double layer expansion in nanoporous carbon electrodes. Energ. Environ. Sci. 2011, 4, 772–777. [Google Scholar]
- Rica, R.A.; Ziano, R.; Salerno, D.; Mantegazza, F.; van Roij, R.; Brogioli, D. Capacitive mixing for harvesting the free energy of solutions at different concentrations. Entropy 2013, 15, 1388–1407. [Google Scholar]
- Sales, B.B.; Saakes, M.; Post, J.W.; Buisman, C.J.N.; Biesheuvel, P.M.; Hamelers, H.V.M. Direct power production from a water salinity difference in a membrane-modified supercapacitor flow cell. Environ. Sci. Technol. 2010, 44, 5661–5665. [Google Scholar]
- Burheim, O.; Sales, B.; Schaezle, O.; Liu, F.; Hamelers, H.V.M. Auto generative capacitive mixing of sea and river water by the use of membranes. Proceedings of the ASME 2011 International Mechanical Engineering Congress and Exposition (IMECE2011), Denver, CO, USA, 11–17 November 2011; pp. 483–492.
- Liu, F.; Schaetzle, O.; Sales, B.B.; Saakes, M.; Buisman, C.J.N.; Hamelers, H.V.M. Effect of additional charging and current density on the performance of capacitive energy extraction based on donnan potential. Energ. Environ. Sci. 2012, 5, 8642–8650. [Google Scholar]
- Burheim, O.S.; Liu, F.; Sales, B.B.; Schaetzle, O.; Buisman, C.J.N.; Hamelers, H.M. Faster time response by the use of wire electrodes in capacitive salinity gradient energy systems. J. Phys. Chem. C 2012, 116, 19203–19210. [Google Scholar]
- Sales, B.B.; Burheim, O.S.; Liu, F.; Schaetzle, O.; Buisman, C.J.N.; Hamelers, H.V.M. Impact of wire geometry in energy extraction from salinity differences using capacitive technology. Environ. Sci. Technol. 2012, 46, 12203–12208. [Google Scholar]
- Jia, Z.; Wang, B.; Song, S.; Fan, Y. A membrane-less Na ion battery-based CAPMIX cell for energy extraction using water salinity gradients. RSC Adv. 2013, 3, 26205–26209. [Google Scholar]
- Clampitt, B.H.; Kiviat, F.E. Energy recovery from saline water by means of electrochemical cells. Science 1976, 194, 719–720. [Google Scholar]
- Crompton, T.P.J. Battery Reference Book, 3rd ed.; Newnes: Oxford, MA, USA, 2000. [Google Scholar]
- Karpinski, A.P.; Makovetski, B.; Russell, S.J.; Serenyi, J.R.; Williams, D.C. Silver-zinc: Status of technology and applications. J. Power Sources 1999, 80, 53–60. [Google Scholar]
- Lim, H.S.; Lackner, A.M.; Knechtli, R.C. Zinc-bromine secondary battery. J. Electrochem. Soc. 1977, 124, 1154–1157. [Google Scholar]
- Karpinski, A.P.; Russell, S.J.; Serenyi, J.R.; Murphy, J.P. Silver based batteries for high power applications. J. Power Sources 2000, 91, 77–82. [Google Scholar]
- Tedesco, M.; Cipollina, A.; Tamburini, A.; van Baak, W.; Micale, G. Modelling the reverse electroDialysis process withseawater and concentrated brines. Desalin. Water Treat. 2012, 49, 404–424. [Google Scholar]
- REAPower Project, Under FP7 (FP7/2007-2013). Available online: http://www.reapower.eu/ (accessed on 12 June 2014).
- Hamelers, H.V.M.; Schaetzle, O.; Paz-García, J.M.; Biesheuvel, P.M.; Buisman, C.J.N. Harvesting energy from CO2 emissions. Environ. Sci. Technol. Lett. 2014, 1, 31–35. [Google Scholar]
- Muschaweck, J.; Spirkl, W.; Timinger, A.; Benz, N.; Dorfler, M.; Gut, M.; Kose, E. Optimized reflectors for non-tracking solar collectors with tubular absorbers. Sol. Energy 2000, 68, 151–159. [Google Scholar]
- Spirkl, W.; Ries, H.; Muschaweck, J.; Winston, R. Nontracking solar concentrators. Sol. Energy 1998, 62, 113–120. [Google Scholar]
- Feidt, M.; Costea, M. Energy and exergy analysis and optimization of combined heat and power systems. Comparison of various systems. Energies 2012, 5, 3701–3722. [Google Scholar]
- Ulloa, C.; Miguez, J.L.; Porteiro, J.; Eguia, P.; Cacabelos, A. Development of a transient model of a stirling-based CHP system. Energies 2013, 6, 3115–3133. [Google Scholar]
- Chen, C.L.; Ho, C.; Yau, H.T. Performance analysis and optimization of a solar powered stirling engine with heat transfer considerations. Energies 2012, 5, 3573–3585. [Google Scholar]
- Gao, H.; Liu, C.; He, C.; Xu, X.X.; Wu, S.Y.; Li, Y.R. Performance analysis and working fluid selection of a supercritical organic rankine cycle for low grade waste heat recovery. Energies 2012, 5, 3233–3247. [Google Scholar]
- Snyder, G.J.; Toberer, E.S. Complex thermoelectric materials. Nat. Mater. 2008, 7, 105–114. [Google Scholar]
- Weidenkaff, A.; Robert, R.; Aguirre, A.M.; Bocher, L.; Lippert, T.; Canulescu, S. Development of thermoelectric oxides for renewable energy conversion technologies. Renew. Energ. 2008, 33, 342–347. [Google Scholar]
- Fraisse, G.; Ramousse, J.; Sgorlon, D.; Goupil, C. Comparison of different modeling approaches for thermoelectric elemen ts. Energ. Convers. Manag. 2013, 65, 351–356. [Google Scholar]
- Kim, J.; Shim, K.; Jeon, J. Thermoelectric power generation in a vacuum cell of decomposing liquid potassium-ammonia solutions. Energies 2013, 6, 5960–5972. [Google Scholar]
- Kaushika, N.D.; Reddy, K.S. Performance of a low cost solar paraboloidal dish steam generating system. Energ. Convers. Manag. 2000, 41, 713–726. [Google Scholar]
- Rosato, A.; Sibilio, S. Performance assessment of a micro-cogeneration system under realistic operating conditions. Energ. Convers. Manag. 2013, 70, 149–162. [Google Scholar]
- Pan, T.H.; Xu, D.L.; Li, A.M.; Shieh, S.S.; Jang, S.S. Efficiency improvement of cogeneration system using statistical model. Energ. Convers. Manag. 2013, 68, 169–176. [Google Scholar]
- McGinnis, R.L.; McCutcheon, J.R.; Elimelech, M. A novel ammonia-carbon dioxide osmotic heat engine for power generation. J. Membr. Sci. 2007, 305, 13–19. [Google Scholar]
- Rica, R.A.; Ziano, R.; Salerno, D.; Mantegazza, F.; Brogioli, D. Thermodynamic relation between voltage-concentration dependence and salt adsorption in electrochemical cells. Phys. Rev. Lett. 2012, 109. [Google Scholar] [CrossRef]
- Brogioli, D. others. Exploiting the spontaneous potential of the electrodes used in capacitive mixing technique for extraction of salinity-difference energy. Energ. Environ. Sci. 2012, 5, 9870–9880. [Google Scholar]
- Birss, V.I.; Smith, C.K. The anodic behavior of silver in chloride solutions. 1. The formation and reduction of thin silver-chloride films. Electrochim. Acta 1987, 32, 259–268. [Google Scholar]
- Italschell, Monza, Italy. Available online: http://www.italschell.it/ (accessed on 12 June 2014).
- Jorne, J.; Ho, W.T. Transference numbers of zinc in zinc-chloride battery electrolytes. J. Electrochem. Soc. 1982, 129, 907–912. [Google Scholar]
- Thomas, B.K.; Fray, D.J. The conductivity of aqueous zinc chloride solutions. J. Appl. Electrochem. 1982, 12, 1–5. [Google Scholar]
- Briggs, G.W.D.; Thirsk, H.R. A study of the behaviour of polarized electrodes part 3—The behaviour of the silver/silver chloride system during electrolytic reduction. Trans. Faraday Soc. 1952, 48, 1171–1178. [Google Scholar]
- Jin, X.; Lu, J.; Liu, P.; Tong, H. The electrochemical formation and reduction of a thick AgCl deposition layer on a silver substrate. J. Electroanal. Chem. 2003, 542, 85–96. [Google Scholar]
- Lyklema, J. Fundamentals of Interface and Colloid Science; Academic: New York, NY, USA, 1995; Volume 2. [Google Scholar]
- ET-EcoinnovativeTechnologies S.r.l, spin-off of ENEA (National agency for new technologies, energy and sustainable economic development, Bologna, Italy). Available online: http://utt.enea.it/chi-siamo/proprieta-intellettuale/servizi-imprese/creazione-impresa/descrizione/et/view (accessed on 12 June 2014).


 Concentrated zinc chloride solution;
 dilute zinc chloride solution;
 zinc electrode;
 porous silver chloride;
 silver.
Concentrated zinc chloride solution;
dilute zinc chloride solution;
zinc electrode;
porous silver chloride;
silver.
silver.
Concentrated zinc chloride solution;
dilute zinc chloride solution;
zinc electrode;
porous silver chloride;
silver.


© 2014 by the authors; licensee MDPI, Basel, Switzerland. This article is an open access article distributed under the terms and conditions of the Creative Commons Attribution license ( http://creativecommons.org/licenses/by/3.0/).
Share and Cite
Marino, M.; Misuri, L.; Carati, A.; Brogioli, D. Proof-of-Concept of a Zinc-Silver Battery for the Extraction of Energy from a Concentration Difference. Energies 2014, 7, 3664-3683. https://doi.org/10.3390/en7063664
Marino M, Misuri L, Carati A, Brogioli D. Proof-of-Concept of a Zinc-Silver Battery for the Extraction of Energy from a Concentration Difference. Energies. 2014; 7(6):3664-3683. https://doi.org/10.3390/en7063664
Chicago/Turabian StyleMarino, Massimo, Lorenza Misuri, Andrea Carati, and Doriano Brogioli. 2014. "Proof-of-Concept of a Zinc-Silver Battery for the Extraction of Energy from a Concentration Difference" Energies 7, no. 6: 3664-3683. https://doi.org/10.3390/en7063664